Submitted:
04 June 2024
Posted:
05 June 2024
You are already at the latest version
Abstract
MicroRNAs (miRNAs) play important roles in the control of HIV-1 infection. Here, we performed RNAseq profilings of miRNAs and mRNAs expressed in CD4+ T-lymphocytes upon HIV-1 infection. Our results reveal significant alterations of miRNAs and mRNAs expression profiles in infected relative to uninfected cells. One of the miRNAs markedly downregulated in infected cells is miRNA-26a. Among the putative targets of miRNA-26a are CD59 receptor transcripts, which are significantly upregulated in infected CD4+ T-cells. Addition of miRNA-26a mimics to CD4+ T-cells reduces CD59 at both mRNA and surface protein levels, validating CD59 as a miRNA-26a target. Consistent with the reported inhibitory role of CD59 in complement-mediated lysis (CML), knocking-out CD59 in CD4+ T-cells renders both HIV-1 infected cells and progeny virions more prone to antibody-dependent CML (ADCML). Addition of miRNA-26a mimics to infected cells leads to enhanced sensitivity of progeny virions to ADCML, a condition linked to a reduction of CD59 packaging into released virions. Lastly, HIV-1-mediated downregulation of miRNA-26a expression is shown to be dependent on integrated HIV-1 expression but does not involve viral accessory proteins. Overall, these results highlight a novel mechanism by which HIV-1 limits ADCML by upregulating CD59 expression via miRNA-26a downmodulation.
Keywords:
CD59
; HIV-1
; complement- mediated lysis
; miRNA-26a
; innate immunity
; viral evasion
1. Introduction
The identification of host and viral determinants that govern human immunodeficiency virus type 1 (HIV-1) transmission and infection is critical for the development of effective targeted prevention and therapeutic approaches. Following infection by a transmitter founder (T/F) virus, a humoral response is rapidly established with mostly non-neutralizing antibodies (Abs) being directed against HIV-1 envelope glycoproteins (Env, gp120 and gp41) [1,2,3]. Neutralizing Abs specific for the T/F virus then promptly emerge; however, these autologous neutralizing Abs, which target highly variable regions of the Env, rapidly select virus-escape mutants that in turn induce new Ab specificities [4,5,6]. The ensuing Ab-virus “arms race” leads after years of infection to the induction of broadly neutralizing antibodies (bNAbs) in only 10-25% of chronically-infected individuals, which target highly conserved Env regions and have higher and broader neutralizing potency [7]. While the host humoral response exerts an immune pressure directly on replicating viruses, the binding of Abs to Env epitopes can also lead to activation of the classical complement pathway, a process that results in lysis of infected cells and virions [8].
Complement can be activated by three canonical mechanisms, designated as the classical, alternative and lectin pathways [9]. Ultimately, all three pathways lead to the formation of the membrane attack complex (MAC) as well as the formation of anaphylatoxins, which contribute to inflammation by attracting leukocytes to the site of infection [10]. Among the complement regulatory proteins that are present at the surface of human cells is CD59, a glycosyl-phosphatidylinositol (GPI)-linked cellular receptor, which prevents the polymerization of component 9 (C9) and thus inhibits the formation of MAC [11,12]. Interestingly, HIV-1 has been shown to incorporate CD59 and other complement regulatory proteins, such as CD55, into its viral envelope during the budding process, a condition that confers protection against complement-mediated lysis (CML) [13,14]. While antibody-dependent mediated complement activity directed against HIV-1 virions is detected during acute infection [15,16], it remains unclear whether HIV-1 has evolved to limit this host antiviral response.
MicroRNAs (miRNAs) are small single-stranded non-coding RNA molecules (containing about 22 nucleotides) encoded by plants, mammals, and even viruses. They are involved in post-transcriptional regulation of gene expression and RNA silencing [17]. MiRNAs work by base pairing with complementary sequences in the target mRNA, primarily in the 3′ untranslated region (UTR). As a result, the targeted mRNA is silenced by one or more mechanisms, including mRNA cleavage and mRNA translation blockage by ribosomes [18]. Host miRNAs have been shown to play a key role during HIV-1 infection by regulating cellular factors that govern the susceptibility or the resistance of target cells to viral infection [19]. For instance, upregulation of miRNAs-221/222 inhibits HIV-1 infection by downregulating the virus primary CD4 receptor in lymphocytes as well as in monocyte-derived macrophages (MDMs) [20,21]. More recently, we provided evidence that the p53-regulated miRNA-103 participates in the downmodulation of CCR5 in macrophages [22] as well as during different stages of CD4+ T-cell differentiation [23], thus regulating the process of HIV-1 entry into these cells. MiRNAs can also regulate HIV-1 infection at post-entry steps as shown for miRNA-181, which targets the restriction factor SAMHD1 in monocytes [24]. This is also the case of miRNA-155, which promotes HIV-1 latency by targeting the E3 ubiquitin ligase TRIM32 that activates NF-κB [25].
In the context of HIV-1 infection, a large number of host factor-targeting miRNAs identified so far are upregulated and modulate the permissiveness of target cells to productive infection by downregulating the expression of HIV-1-dependency or restriction factors. In this study, we performed a global transcriptomic analysis of HIV-1 infected primary CD4+ T-cells and compared their miRNA and mRNA profiles with uninfected cells. Our results reveal a significant differential expression of both miRNAs and mRNAs in infected relative to uninfected cells. Among the miRNAs analyzed, we show that miRNA-26a is downregulated in infected cells and further identity the MAC regulatory CD59 receptor as a target of this miRNA, which indeed is found upregulated. Accordingly, we document that enhancing miRNA-26a in HIV-1 infected cells reduces CD59 expression and packaging into virions, a condition that impacts their susceptibility to antibody-dependent complement-mediated lysis (ADCML). These results underscore the role of miRNA-26a in regulating CD59 expression levels in CD4+ T-cells and highlight how the modulation of miRNA-26a may affect HIV-1 susceptibility to ADCML by regulating the extent of CD59 packaging into HIV-1 virions.
2. Methods
2.1. Human Subjects, Informed Consent Statement and Institutional Review Board Statement
Peripheral blood samples and leukaphereses were obtained from HIV-1 and HCV seronegative adults (of either sex). All participants had given written informed consent in accordance with the Declaration of Helsinki under research protocols approved by the research ethics review board of the Institut de recherches cliniques de Montréal (IRCM).
2.2. Cells
Human embryonic kidney (HEK)-293T cells were obtained from ATCC and were maintained in Dulbecco’s modified Eagle’s medium (DMEM) (Wisent) supplemented with 10% heat inactivated fetal bovine serum (FBS).
CEM.NKR-CCR5 were obtained from the NIH AIDS reagent program (designated as CEM-CCR5 throughout the text) and were maintained in Roswell Park Memorial Institute (RPMI) 1640 medium (Wisent) supplemented with 10% FBS.
CD4+ T-cells were isolated from PBMCs by negative depletion using the human CD4+ Isolation Kit II (Miltenyi, #130-096-533) according to manufacturer’s instructions. Cells were cultured in RPMI-1640 medium containing 10% FBS. Activated CD4+ T-cells were generated by co-stimulation with 10μg/ml of anti-CD3 (Biolegend, #300438) and 2μg/ml of anti-CD28 (Biolegend, #302934) Abs and cultured in the presence of 100U/ml of IL-2 (Peprotech, #200-02-100UG) for 4 days.
2.3. Proviral DNA Constructs
The CCR5-tropic NL4.3-ADA-GFP-IRES-NEF proviral construct (named NL4.3-ADA-GFP throughout the text), which encodes all accessory proteins, and its isogenic derivatives: Vpr-deficient (ΔVpr), Vpu-deficient (ΔVpu), Nef-deficient (ΔNef), Nef- and Vpu-deficient (ΔNefΔVpu) were previously described [38,39,40]. The Vif-deficient (ΔVif) isogenic derivative was generated by inserting a SpeI (NEB, #R3133L) to SalI (NEB, #R3138L) fragment encompassing a vif deletion from the NL–PIvif- construct [59] into NL4.3-ADA-GFP.
The E2-Crimson-EF1alpha-ZsGreen DNA insert was amplified from the Hi.Fate latency plasmid [37] using primers OligoA and OligoB (see Table S1) by PCR, and inserted into the R5-tropic ‘HIV-GFP’ proviral vector [60] using unique restriction enzyme sites XmaI (NEB, #R0180S) and MluI (NEB, #R0198S). The P2A sequence from Porcine Teschovirus-1 [61] was generated using custom oligonucleotides and inserted into the MluI site between the Nef and E2-Crimson gene locus. The resulting plasmid, termed ‘HIV Nef-2A-CRIMZs’, was sequenced on both strands before transfection into HEK293T cells.
2.4. Virus Production and Infection
NL4.3-ADA-GFP-derived viruses were generated by co-transfecting the corresponding proviral constructs with pSVCMV-VSV-G [62] (except in the case of viruses used in RNAseq profiling studies) in 5x10⁶ HEK-293T cells using lipofectamine 3000 according to manufacturer’s instructions. Virus-containing supernatants were recovered 48h post-transfection, cleared of cells by centrifugation at low speed, filtered and virus pellets recovered following an ultracentrifugation (35000 rpm for 3h) on a 20% sucrose cushion. Viruses were resuspended in DMEM, and aliquots were kept at -80°C. The multiplicity of infection (MOI) was determined using the CEM-CCR5 cell line.
Activated primary CD4+ T-cells were infected with NL4.3-ADA-GFP at a MOI of 2 in the case of the RNAseq profiling studies or pseudotyped with VSV-G and infected at a MOI of 1 in all other cases (WT or mutant NL4.3-ADA-GFP infection). Infections were performed by spinoculation (centrifugation at 1200g at 22°C for 2h). Cells were washed 6h after viral adsorption with PBS and the infection efficiency was determined 48h post-infection by measurement of the frequency of GFP-positive (GFP-pos) cells by flow cytometry. In some cases, primary CD4+ T-cells were pre-treated with efavirenz (EFV – 10μM, Sigma-Aldrich, #SML0536) or raltegravir (RAL - 20μM, Santa Cruz Biotechnology, #sc-364600) overnight and replenished in new media accordingly during the infection.
2.5. Antibodies and Flow Cytometry
The following Abs were used in flow cytometry assays: BV421 anti-human CCR5 (Biolegend, #359118), PE/Cyanine7 anti-human CD4 (Biolegend, #317414), PE anti-human CD59 (Miltenyi, #130-120-048) as well as its isotype control (Miltenyi, #130-113-438). For surface staining, fluorochrome-labeled Abs were added directly to the CD4+ T-cells at a final dilution 1:50 (Miltenyi) or 1:150 (Biolegend), incubated 45min on ice, washed twice in FACS buffer (PBS, 1% of FBS) and fixed with 4% paraformaldehyde in PBS. Total CD59 (surface + intracellular proteins) was measured by fixing and permeabilizing cells using the Cytofix/Cytoperm kit (BD Biosciences, #554714) as per manufacturer’s instructions and staining with anti-CD59 Abs. Cells were resuspended in PBS-EDTA for for flow cytometry analyses. Flow cytometry and cell sorting were performed on a FACSAria III (BD), or CyAn (Beckman) equipped with appropriate lasers. Acquired data were analyzed with FlowJo 10.9 software (TreeStar).
2.6. Transfection of Primary CD4+ T-Cells
Primary CD4+ T-cells were transfected with either negative control RNA (Qiagen, #YM00479902-ADB), mimics of miRNA-21 (Qiagen, #YM00473093-ADB), mimics of miRNA-26a (Qiagen, #YM00471417-ADB) or mimics of miRNA-29a (Qiagen, #YM00472650-ADB) by nucleofection (Lonza) according to the manufacturer’s instructions and cultured for 48h in 48-well plates in basal medium (RPMI-1640) supplemented with IL-2 (100U/mL). The negative control and all the miRCURY locked nucleic acid (LNA) mimics were fluorescein amidites (FAM)-labeled (see Table S1).
2.7. RNA Extraction, Reverse-Transcription, and Real-Time qPCR Analyses
CD4+ T-cells infected with the different viruses described above were sorted using an Influx cell sorter (BD Biosciences) and recovered in RLT buffer. Total cellular RNAs were extracted using RNeasy RNA extraction columns (Qiagen) according to the manufacturer’s instructions. Total RNAs (100ng) were reversed transcribed using SuperScript IV reverse transcriptase (Invitrogen) with poly(dT) and specific loop primers (see Table S1) for the appropriate miRNAs using the two-tailed real-time qPCR method [63]. For real-time qPCR, cDNA and appropriate primers (see Table S1) were added to SYBR green select master mix (Applied Biosystems) in 96-well plates and run on a ViiA96 thermocycler (Thermo Fisher Scientific) with the following cycling conditions: 50°C for 2min, 95°C for 5min, and 40 cycles at 95°C for 20sec and at 60°C for 40sec. Glyceraldehyde 3-phosphate dehydrogenase (GAPDH) or small nuclear RNA (snRNA) U6 were used as endogenous controls (see primers in Table S1) and ΔΔCT variations were calculated.
2.8. CD59 3′UTR Validation Assay
To generate pMIR-REPORT-CD59-Luc, a PCR was performed on the cDNA of primary CD4+ T-cells using pfu DNA polymerase (see primers in Table S1), and different fragments of the 3′ UTR of CD59 were inserted into the SpeI and MluI sites of pMIR-REPORT-Luc. Site-directed mutagenesis of the 3′ UTR of CD59 was performed by PCR to generate mutations (see Mut (mutation) primers in Table S1) and cloned into pMIR-REPORT-Luc using the same strategy described above. Fragment A corresponds to nucleotides 449-657 of the 3′ UTR of CD59 (based on accession number #NM_000611.6) while fragment B corresponds to nucleotides 666-878. Finally, the AB fragment corresponds to nucleotides 449-878 of the 3′ UTR of CD59 and was generated using primers indicated in Table S1.
For the MIR-REPORT assay, HEK-293T cells were co-transfected with pGL4.70Actin1.2(8) [64] and either one of the plasmids derived from pMIR-REPORT-CD59-Luc. Cells were further treated with either control or mimics of miRNA-26a at 24h post-transfection, and lysed after another 24h. Luciferase activity was measured using the Dual-Glo Luciferase Assay System (Promega) on a GloMax luminometer (Promega).
2.9. Generation of the CEM-CCR5 CD59 Knock-Out Cell Line
To generate a CD59KO CEM-CCR5 cell lines, a guide sequence (see Table S1) previously described as targeting CD59 [65] was inserted into the lentiCRISPR v2 vector [66]. Lentiviruses were produced by transfection of this vector in combination with pSVCMV-VSV-G in HEK 293T cells. Control lentiviruses were also produced using the lentiCRISPR v2 without the single guide RNA (sgRNA). CEM-CCR5 cells were transduced with either the control or sgRNA-expressing lentiviruses and transduced cells selected with puromycin (2μg/ml). Individual clones (CEM-CD59_KO) were obtained by single-cell sorting.
2.10. Purification of Antibodies
Abs from sera of viremic individuals were purified using protein G Dynabeads (Life Technologies; #10003D), according to the manufacturer’s instructions. The quantity of Abs obtained was evaluated by a protein assay (Bio-Rad).
2.11. Antibody-Dependent Complement-Mediated Lysis Assay
A mix of sera from three to five healthy donors was used as a source of complement.
The virion ADCML assay was performed as previously described [15] with some modifications. HIV-1 virions were produced from primary T-lymphocytes, CEM-CD59-control or CEM-CD59_KO cells infected with NL4.3-ADA-GFP. Equal amounts of viruses (as determined by ELISA p24) were then incubated with 1mg/ml of RNase A (Invitrogen, #12091021), the bNAb PGT121 (10μg/ml, obtained from the NIH AIDS reagent program) or the purified Abs from patient sera (final dilution 1:5) and with either NHS or HIHS (dilution 1:2) in RPMI 1640 for a total volume of 140µL. The mixture was then incubated for 3h at 37°C prior to freezing at -20°C. Following thawing, the samples were treated with RNase A (1mg/ml) and DNase I (1mg/ml) (Sigma-Aldrich, #11284932001) for 1 h at 37°C and subsequently treated with proteinase K (1mg/ml) (Invitrogen, #25530049) to remove RNase and DNase activity. Residual viral RNA in intact virions was extracted using QIAamp Viral RNA Mini Kit (Qiagen) according to manufacturer’s instructions, reverse-transcribed, and quantified by real-time PCR. Total HIV-1 RNA were quantified by a modified nested real-time PCR assay using Taq DNA polymerase (BioLabs) in a first PCR and the TaqMax Fast Advanced Master Mix (Applied Bio-systems) in a second PCR as previously described [67] (see HIV-TOT primers in Table S1). The resulting HIV-1 copy numbers were determined using a standard curve. This standard curve was generated by extracting and amplifying DNA from serially diluted ACH-2 cells, which contain a single integrated copy of HIV-1 (NIH AIDS Reagent Program). In each assay, samples were tested in triplicate.
For ADCML of cells, CEM-CD59-control or CEM-CD59_KO were infected with NL4.3-ADA-GFP at comparable infection rates and incubated in the presence of 50% NHS or HIHS, either with or without PGT121 (10μM) overnight. To measure ADCML, cells were treated with the Zombie NIR Fixable Viability marker (1:150 in PBS; Biolegend, #423105) and analyzed by flow cytometry.
2.12. Virion Capture Assay
Virus capture assays were performed as previously described [68] with some modifications. Immunomagnetic bead-based virion capture was performed with 20μL of protein G Dynabeads (Life Technologies; #10003D), which were incubated with 2μL of mouse anti-CD59 (Biolegend, #304702) for 20min at room temperature (RT) and then washed with PBS to remove unbound Ab. At the start of capture assays, virus input was normalized across all viruses tested, with inputs corresponding to equal virus volumes (100μL) and same infection rates. Virus samples were incubated with Ab-armed beads for 1h at RT to allow virus capture. Beads were then washed five times with PBS to extensively remove unbound virus particles. The bead-associated virus was then lysed with lysis buffer and quantified by p24 ELISA following the manufacturer’s instructions (XpressBio, Cat#XB-1000). Background levels of virion capture were assessed by using an isotype control Ab (Biolegend, #401501). The level of background virus capture was subtracted from each data point.
2.13. RNA-Seq of Sorted HIV-1-Infected CD4+ T-cells for mRNA/miRNA Profiling and Analyses of Their Expression
Productively infected (GFP-positive), and uninfected (mock) CD4+ T-cell populations were sorted using an Influx cell sorter (BD Biosciences), and directly recovered in RLT lysis buffer. The same samples were used for miRNAseq and mRNAseq using the Illumina TruSeq mRNA or Small RNA system (Illumina Technologies) at the IRCM Molecular Biology and Functional Genomics Core Facility. Specific tagging was used to identify RNA from each blood donor. The resulting library was sequenced using a NovaSeq 6000 system (Illumina Technologies). Reads were trimmed with Cutadapt v2.5, aligned to reference genome GRCh38 using STAR version 2.5.1b, extracted using FeatureCounts v1.6.0 and specifically, miRs quantified using mirdeep2 v2.0.1.1. Differential expression of miRNAs and mRNAs was assessed using adjusted p values computed using DESeq2 v1.24.0. Volcano plots were generated using GraphPad Prism9 (GraphPad Software, LLC). The online search for miRNA and mRNA pairing was performed using mirDIP (http://ophid.utoronto.ca/mirDIP/). Gene ontology analyses were performed using g:Profiler (https://biit.cs.ut.ee/gprofiler/gost).
2.14. Quantification and Statistical Analyses
Statistical analyses were performed using GraphPad Prism (Version 8). Non-parametric Mann-Whitney’s U-tests (two-tailed) were used to compare ranks between two groups or more. The non-parametric Kruskal Wallis test was used when indicated. A P value of less than 0.05 was considered statistically significant. *, **, *** signify <0.05, <0.01, <0.001, respectively, ns, not significant.
3. Results
3.1. HIV-1 Alters the miRNA and mRNA Expression Profiles during Infection of CD4+ T-Cells
In order to identify miRNAs and mRNAs that are modulated upon HIV-1 infection, CD4+ T-lymphocytes were isolated from peripheral blood mononuclear cells (PBMCs) of 3 blood donors and infected for 48h with green fluorescent protein (GFP)-marked HIV-1 (CCR5-tropic NL4.3-ADA-GFP). Infected cells (GFP-positive) were then enriched by flow cytometry sorting (Figure S1) and total RNAs extracted. RNAs from mock-infected CD4+ T-cells (uninfected) were used as control. MiRNA and mRNA expression profiles in uninfected and GFP-positive CD4+ T-lymphocytes were then assessed by next-generation RNAseq (Figure 1). MiRNAs or mRNAs with a log2 fold change (Fc) of >0.585 (Fc= ~1.5) and a computed (using DeSeq2) base mean >100 were deemed upregulated whereas those with a log2Fc <-0.585 were considered downregulated. GFP-positive infected cells displayed a distinct profile of cellular mRNAs as compared to uninfected cells, with 188 upregulated and 34 downregulated genes (Figures 1A and S2). Gene ontology analyses (using g:Profiler, https://biit.cs.ut.ee/gprofiler/gost) of the most differentially-expressed genes (both upregulated and downregulated) revealed a predominance of genes involved in signal transduction, immune system process, immune and defense response, inflammatory response, programmed cell death as well as response to stress and virus (Figure 1B). Interestingly, comparative analyses of the miRNAseq profiles of GFP-positive cells with that of uninfected cells identified 17 upregulated and 20 downregulated miRNAs (Figure 1C), indicating that productive infection of CD4+ T-cells impacted also the cellular miRNA expression profile. Our analyses identified several miRNAs whose expression was previously reported to be modulated upon HIV-1 infection (Figure 1D). For instance, miRNA-181, a miRNA which is known to target the restriction factor SAMHD1, is upregulated in infected cells [24]. Similarly, miRNA-25, a miRNA that we recently found to target peroxisomes components [26] as well as the E3 ubiquitin ligase MARCH1 [27] is similarly increased in infected CD4+ T-cells. In contrast, we found that some miRNAs, such as miRNA-16, were downregulated in GFP-positive CD4+ T-cells (Figure 1D). MiRNA-16 was previously reported to target Pur-⍺, a DNA and RNA binding protein that promotes Tat-induced transactivation [28].
3.2. Analyses of mRNA and miRNA Profiles in Infected CD4+ T-Cells Link CD59 Upregulation to a Decrease of Putative Targeting miRNAs
Among the 34 genes whose mRNA levels were downregulated in GFP-positive compared to uninfected cells, we identified several genes potentially relevant to HIV-1 infection based on the reported literature (Figure 2A). For example, Transactive Response DNA-binding protein (TARDBP/TDP-43) encodes a protein that regulates cell permissivity to HIV-1 infection by acting as a transcriptional repressor of HIV-1 gene expression through histone deacetylase 6 (HDAC6) [29], which is also a negative regulator of the APOBEC3G restriction factor [30] (log2fc = -0.58). NOL12 encodes for a RNA binding protein that plays an important role in repairing DNA damage pathways and maintaining genome integrity, although its effect on HIV-1 infection remains unclear [31] (log2fc = -0.59). On the other hand, among the 188 genes which mRNA levels were upregulated, we also identified cellular genes relevant to HIV-1 infection. For instance, BCL2L11 (or BIM), which encodes for Bcl2, a regulator of pro-apoptotic signaling in HIV-1 infection [32] (log2fc = 0.63); PLD1, which encodes for Phospholipase D1, an enzyme that links T-cell activation signals to increased cell permissivity to HIV-1 infection [33] (log2fc = 0.64), and FOXP3, which encodes for a marker of regulatory CD4+ T-cells [34] (log2fc = 0.85) all displayed an upregulated expression in GFP-positive cells (Figure 2A). Noticeably, CD59, which encodes for a GPI-linked membrane protein receptor that has a key inhibitory role in regulating complement activation [11,12], was also found to show a significant upregulation of its expression in GFP-positive cells (log2fc = 0.88) (Figure 2A). Indeed, CD59 was also found to be among the genes in 9 of the upregulated ontology pathways that we identified (Figures 1B, left panel, and 2B). To assess whether the upregulation of CD59 mRNA was linked to the downregulation of specific miRNAs, we first identified the miRNAs that were the most downregulated in GFP-positive cells (Figure 2C). Online databases-directed analyses (mirDIP, http://ophid.utoronto.ca/mirDIP/), singled-out three potential miRNAs that could target CD59 mRNA (Figure 2C and D): miRNA-21 (log2fc = -1.62), miRNA-26a (log2fc = -1.11) and miRNA-29a (log2fc = -1.84). Further validation of the miRNA-seq data using real-time qPCR revealed that miRNAs-21, -26a and -29a are indeed decreased in HIV-1-infected primary CD4+ T-cells as compared to uninfected cells (~ 6-, 2- and 4-fold less, p=0.0003, p=0,0484, p=0.0020, respectively) (Figure 3A). We also validated the mRNA-seq data and found that CD59 mRNA levels are indeed increased in GFP-positive relative to uninfected primary CD4+ T-cells (FC=2.1-fold, p value = 0.0022) (Figure 3B). Furthermore, flow cytometry analyses indicated that HIV-1 infected CD4+ T-lymphocytes expressed 1.5-2.0 times more CD59 protein at their cell surface as compared to uninfected cells (Figure 3C). Taken together, these results indicate that HIV-1 infection of CD4+ T-cells induces an upregulation of CD59 receptor at the mRNA and cell-surface protein levels and this condition appears to be linked to a downregulation of miRNAs, namely miRNA-21, -26a and 29a, predicted to target CD59.
3.3. CD59 Is a Target of miRNA-26a
To evaluate the impact of these miRNAs on the levels of CD59 mRNA and surface protein expression levels, we nucleofected either miRNA-21, -26a and -29a mimics into primary CD4+ T-cells. Transfection of miRNA-26a mimics significantly decreased CD59 mRNA levels after 48h (~ 2-fold less, p = 0.0065) and CD59 protein surface expression 96h post-nucleofection (approximately 50%, p = 0.0285) when compared to controls (Figure 4A and B). Neither miRNA-21 nor miRNA-29a mimics had a significant effect on CD59 mRNA expression levels. Consistently, we confirmed that miRNA-21 mimics had no effect on CD59 surface expression levels (Figure 4A and B). These results suggest that CD59 expression can be downregulated by miRNA-26a but not by miRNA-21 or -29a in CD4+ T-cells.
An online database (TargetScanHuman, www.targetscan.org) analysis predicted that the 3′UTR of CD59 mRNA could be targeted by miRNA-26a at two potential sites (Figure 4C). To validate whether these sites were targeted by miRNA-26a, we transiently expressed a construct encoding the Firefly Luciferase (F-Luc) gene fused to a 429 base pair fragment of the 3′UTR encompassing the two potential target sites (A+B-WT) in HEK293T cells. These cells were also co-transfected with miRNA-26a or control mimics. F-Luc activity in the cell lysates was significantly reduced in cells transfected with miRNA-26a mimics (~ 2-fold less, p=0.0338) when compared to control (Figure 4D). Furthermore, mutations in the CD59 3′UTR sequences predicted to be targeted by miRNA-26a (Figure 4C, A+B-Mut) prevented the silencing effect on F-Luc (Figure 4D). We also tested in this system two different CD59 3′UTR fragments (A and B) (Figure 4C), each containing one of the two single individual sites targeted by miRNA-26a and found that both sites are functional and independent (Figure 4D). Altogether, these data further validate that miRNA-26a can regulate CD59 expression levels by targeting two specific sites complementary to the miRNA-26a seed sequence located in the 3′UTR of CD59 mRNA.
3.4. CD59 affects the Susceptibility of HIV-1 to Antibody-Dependent Complement-Mediated Lysis
Given the critical inhibitory regulatory function of CD59 in CML and the fact that its expression is upregulated during HIV-1 infection of CD4+ T-lymphocytes, we examined the impact of CD59 expression on the susceptibility of HIV-1-infected cells and released virions to ADCML. To this end, we took advantage of a T lymphoblast CEM-CCR5 cell line [35] as a model for the regulation of CD59 by miRNA-26a. Indeed, upon HIV-1 infection of this cell line, we observed a downregulation of miRNA-26a expression (~ 2-fold less, p=0.0286) and a concomitant upregulation of CD59 mRNA (3.5-fold, p=0.0079) and surface protein levels (Figure S3A). We thus generated two CD59_knock-out (KO) clones of the CEM-CCR5 cell line (CEM-CD59_KO_clone 1 and CEM-CD59_KO_clone 2) using the clustered regularly interspaced short palindromic repeat (CRISPR)/Cas9 technology as described in Methods. A CEM-CD59_control cell line in which the CRISPR/Cas9 guide sequence was absent was also generated. As shown in Figure S3B, both CEM-CD59_KO clones exhibited a marked reduction of total as well as cell-surface CD59 expression levels as compared to the control cell line. Neither cell proliferation, nor CD4/CCR5 HIV-1 receptor levels, were affected by knocking-out CD59 in the CEM-CCR5 cell line (Figure S3C).
We next assessed the susceptibility of these cell lines to ADCML using PGT121, a bNAb that targets a V3-glycan-dependent epitope on HIV-1 gp120 [36], as a model Ab in this system. Control or CEM-CD59_KO cells infected at comparable infection frequencies were exposed to PGT121 in the presence of normal human serum (NHS), as a source of active complement, or in the presence of heat-inactivated human serum (HIHS) as control. The percentage of dead cells in the GFP-positive cells (based on Zombie NIR fluorescence) was measured by flow cytometry. In the presence of NHS, infected CEM-CD59_KO cells were more susceptible to ADCML as compared to the CEM-CD59_control cells (Figure 5A, upper panels). This increased susceptibility of CEM-CD59_KO cells to ADCML was abolished in conditions using HIHS (Figure 5A, lower panels).
Knowing that CD59 is packaged into HIV-1 virions likely as a mean to protect viral particles from ADCML [13], we characterized the impact of CD59 packaging into released virions on their susceptibility to lysis. Using a virion capture-assay allowing for the detection of CD59-containing virions, we confirmed that infected CEM-CD59_KO cell lines produced virions with significantly reduced CD59 levels, as compared to viral particles produced from their control cell line counterpart (~6.5-fold less, p=0.285 for clone 1; ~5-fold less, p=0.0482 for clone 2) (Figure 5B). These results are consistent with the marked reduction of CD59 expression observed at the cell surface of the CEM-CD59_KO cell lines compared to the CEM-CD59_control (Figure S3B). HIV-1 virions released from CEM-CD59_KO and CEM-CD59_control cells were treated with PGT121 and either NHS or HIHS. RNA released from lysed virions was then digested by RNase treatment, and viral RNA from the remaining complement-mediated lysis-resistant intact virions was extracted and quantified by real-time PCR. As shown in Figure 5C, viruses produced from the CEM-CD59_KO cell lines were much more sensitive to ADCML (NHS conditions) than those produced from the control cell line (5.5-fold for clone 1 and 6.6-fold for clone 2, p=0.0022), confirming that packaging of CD59 into HIV-1 virions protects viruses from ADCML.
3.5. Enhanced Levels of miRNA-26a Promote ADCML of HIV-1 by Reducing CD59 Packaging into Released Virions
To specifically examine the impact of augmenting miRNA-26a levels during HIV-1 infection, we nucleofected primary CD4+ T-cells with miRNA-26a or control mimics and infected them with HIV-1. Figure 6A shows that transfection of miRNA-26a mimics does not interfere with viral replication as virus production was comparable between miRNA-26a and control mimics-treated cells. Using the virion capture-assay described above, we also confirmed that cells treated with miRNA-26a mimics produced approximately 50% less CD59-containing virions than their control-treated counterparts (~2-fold less, p=0.0079), suggesting that downregulation of CD59 expression by miRNA-26a leads to a reduced packaging of the protein into released virions (Figure 6B). Importantly, viruses produced from miRNA-26a mimic-treated cells displayed an enhanced susceptibility to PGT-121-dependent CML (NHS conditions) as compared to the control (3.1-fold, p=0.0022) (Figure 6C). These results suggest that a 50% modulation in CD59 expression and incorporation levels into released virus particles is sufficient to effectively affect their sensitivity to ADCML (Figures 4A-B and 6B). To further validate the result obtained with PGT121, we repeated these experiments using purified Abs from sera of viremic individuals (#163 and #497). We first confirmed that exposure of virus to purified Abs alone did not induce lysis of virions (Figure S4A). Viruses produced by cells treated with miRNA-26a mimics displayed an enhanced susceptibility to ADCML in the presence of Abs from sera #163 (2.1-fold, p=0.0260) or #497 (1.6-fold, p=0.0649) as compared to controls (Figure 6D). The results obtained with Abs from serum #163 were further validated using virus produced during infection of CEM-CD59 KO_clone 1 (Figure S4B); in this context, virus produced displayed a 4.4-fold increased susceptibility to ADCML as compared to control (Figure S4B). Taken together, these results show that CD59 expression and packaging into virions during infection of CD4+ T-cells can be downregulated by miRNA-26a, a condition that affects the susceptibility of released virions to ADCML. Based on these results, we infer that downregulation of miRNA-26a by HIV-1 is likely a mean to render infected cells and released virions more resistant to ADCML through optimal CD59 expression and packaging into virions.
3.6. The Downregulation of miRNA-26a during HIV-1 Infection of CD4+ T-lymphocytes Is Contingent on viral DNA Integration and Expression
We next analyzed the viral determinants that contribute to the downregulation of miRNA-26a expression in CD4+ T-lymphocytes during HIV-1 infection. To define the step of the infection cycle that is important for miRNA-26a expression downregulation, we treated cells with either the HIV-1 reverse transcriptase inhibitor, efavirenz (EFV), or the HIV-1 integrase inhibitor, raltegravir (RAL), prior to their infection with HIV-1. As shown in Figure 7A, we observed a downregulation of miRNA-26a in untreated infected GFP-positive sorted cells. However, treatment of cells with EFV or RAL abolished the downregulation, suggesting that integration of proviral DNA into the genome of target cells is a necessary step for miRNA-26a downregulation. In order to further validate these results, we used a fully replicative dual reporter virus system, which is very similar to a single-cycle dual reporter virus system that we previously described and characterized [23,37]. This fully infectious and replicative reporter virus system (HIV Nef-2A-CRIMZs) enables to distinguish cells harboring transcriptionally-inactive proviruses (ZsGreen positive, this reporter gene being under the control of an Elongation factor 1-alpha promoter) from cells that contain specifically transcriptionally-active integrated proviruses (both ZsGreen positive and E2-Crimson positive, the later reporter gene being under the control of the HIV-1 LTR). Indeed, we show that following treatment of infected cells with TNF-alpha as a virus latency reversing agent, the frequency of infected cells harboring a transcriptionally-inactive provirus (only ZsGreen positive; latent) was reduced and a concomitant increase in the frequency of infected cells with transcriptionally-active integrated provirus (both E2-Crimson/ZsGreen positive; productive) was detected (Figure S5A). Additionally, productively infected cells, which are predicted to express Nef and Vpu, were found to display, as expected, a downregulation of the CD4 receptor, a condition not observed in bystander cells or latently-infected cells (Figure S5B).
Analyses of miRNA expression in the different isolated populations of infected lymphocytes revealed that miRNA-26a expression levels were decreased in productively infected cells (~1.7-fold less, p=0.0015) but not in latently infected cells (Figure 7B). These results suggest that HIV-1 gene expression is necessary for the downregulation of miRNA-26a during infection. Given that HIV-1 accessory proteins, such as Vpu, have been reported to modulate the expression of miRNAs [26,27], we tested if their expression could impact miRNA-26a levels. To this end, CD4+ T- lymphocytes were infected with well-established and -characterized GFP-marked HIV-1 that are isogenic except for the expression of Nef, Vpu, Nef and Vpu, or Vpr [38,39,40]. As shown in Figure 7C, expression levels of miRNA-26 were downregulated in cells infected with the different mutant HIV-1 viruses to comparable extent than in cells infected with WT HIV-1, suggesting that reduction of miRNA-26a expression during HIV-1 infection appears independent of Vpr, Vpu or/and Nef expression. Given the important role of the Vif accessory protein in counteracting the potent restriction mediated by APOBEC3F/G on HIV-1 reverse transcription [41], we evaluated the effect of Vif on miRNA-26a expression in the CEM-SS cell line, which does not express APOBEC3F/G and is permissive to infection by Vif-defective viruses [42]. MiRNA-26a expression was found to be downregulated to the same extent in CEM-SS cells infected with WT virus (~1.8-fold less, p=0.0500) or Vif-deficient virus (~1.8-fold less, p=0.0500), suggesting that the reduction of miRNA-26a expression in HIV-1-infected cells is independent from Vif expression (Figure 7D). Taken together, our results indicate that while downregulation of miRNA26a during HIV-1 infection requires viral gene expression, this regulation does not appear to be dependent on HIV-1 accessory gene expression.
4. Discussion
In this study, we performed RNA-seq of miRNAs and mRNAs in HIV-1 infected CD4+ T-cells and further analyzed their expression profiles relative to uninfected cells (Figure 1). Since the miRNA and mRNA profiling was conducted simultaneously on the same sorted infected (GFP-positive) and mock-infected cells as a baseline reference allowed us to establish potential links between the degree of expression of specific candidate cellular genes and putative targeting miRNAs. We found that the infected cell population displayed important changes in the cellular transcriptomes and miRNA expression profiles in relation to the mock-infected population. Among the 222 cellular genes whose expression was either upregulated (188) or downregulated (34) (Figure S2), we identified through a systematic literature search several candidates that could have either positive or negative effects on HIV-1 replication or persistence (Figure 2A). To assess whether differentially-expressed genes in the infected population could be regulated by miRNAs, we cross-analyzed the most differentially expressed miRNAs and found that three of the most downregulated miRNAs, namely miRNA-29a, -21 and 26a, were predicted to target CD59 transcripts, which indeed were upregulated in infected cells (Figures 2, 3 and S2). CD59 is a cell-surface protein receptor that plays a negative regulatory role in the complement pathway and is incorporated in budding viruses, a condition that protects HIV-1 particles from ADCML [13]. These findings raised the possibility that HIV-1 is downmodulating the expression of these miRNAs to optimize the expression and packaging of CD59 as a mean to limit the activity of the host complement lysis pathway.
MiRNAs have been shown to play a key role not only in regulating target cell susceptibility to HIV-1 infection but also in promoting viral persistence [19]. Of the three miRNAs that were predicted to target CD59, further validation revealed that miRNA-26a was the only one that could target and regulate CD59 expression in CD4+ T-cells (Figure 4). MiRNA-26a is a member of the miRNA-26 family, which includes miRNA-26a and miRNA-26b. This family has previously been described to be involved in the regulation of muscle development [43] and glucose metabolism [44], but surprisingly little is known about its role in immune cell functions or innate immunity. Recently, a study showed that the miRNA-26 family plays a role in the early development and transformation of B lymphocytes, particularly in the differentiation of pre-B cells, although the mechanism behind this phenomenon is not fully elucidated [45].
Our results suggest that miRNA-26a regulates the expression of CD59 in CD4+ T-lymphocytes and its downregulation during HIV-1 infection leads to an upregulation of CD59 mRNA levels and surface protein expression (Figure 3 and Figure 4), conditions that are likely to increase its packaging into released virus particles. Knowing that CD59 incorporation into viral particles protects HIV-1 from CML activity, our results suggest an important role of miRNA-26a in regulating the susceptibility of HIV-1 to CML (Figure 5 and Figure 6). Since packaging of CD59 is not an exclusive property of HIV-1 as it has also been shown in other enveloped viruses [46,47], namely human T lymphotropic virus type 1 (HTLV-1), human cytomegalovirus (HCMV) and hepatitis virus type C (HCV), it would be interesting to assess whether these viruses promote CD59 packaging by downmodulating miRNA-26a during infection.
Our results show that MiRNA-26a expression levels are decreased in CD4+ T- cells upon HIV-1 infection and we provide evidence that this reduction requires the integration of the viral DNA into the genome of target cell as well as the expression of HIV-1 genes (Figure 7). However, expression of accessory proteins Vif, Vpr, Nef and Vpu do not appear to mediate the downregulation of miRNA-26a as viruses deficient for the expression of these viral proteins were still competent for downregulating miRNA-26a expression. These results suggest that other viral proteins such as Tat, Rev, the Env glycoproteins, or the products of the Gag and Gag-pol precursors might potentially be involved. Little is known about the direct regulators of miRNA-26a expression although previous reports have shown a double negative feedback loop between miRNA-26a and the negative transcriptional regulators EZH2 [48] and E2F7 [49].
HIV-1 is protected from CML by the incorporation of several complement regulatory proteins, such as CD46, CD55, and CD59, into viral particles [12]. CD59 controls the formation of the MAC at the terminal stage of the complement activation common to all known activation pathways [11], while CD55 prevents the formation of C3 convertases and C5 [50] and CD46 acts as an inactivator of C3b and C4b [51]. In this study, we provide evidence supporting the notion that HIV-1-mediated enhancement of CD59 cell-surface expression and packaging helps protect virions and infected cells from ADCML. Indeed, we show that knocking-down CD59 by CRISPR-Cas9 in target CD4+ T-cells enhances susceptibility of cells and virions to ADCML. These findings are collectively consistent with results obtained previously using Ab-mediated blockade of CD59 [52,53] as well as evidence that GPl-anchor deficiency, which leads to an absence of CD59 at the cell surface, renders released HIV-1 susceptible to complement attack [54]. Taken together, these results suggest that limiting CD59 expression or targeting its function at the cell surface of infected cells could represent an approach to restore optimal complement activation and increase the efficiency of Ab-mediated responses against HIV-1.
The ability to activate complement in response to HIV-1 infection is Ab-dependent. Indeed, Dufloo et al. showed that polyclonal Abs present in the sera of infected individuals trigger complement activation less effectively than bNAbs [55]. These observations are consistent with our results, which show a much greater ADCML on virions exposed to the bNAb PGT121 as compared to a pool of Abs purified from the sera of viremic individuals, which most likely target diverse epitopes (Figure 6). Furthermore, it is likely that the neutralizing activity of Abs present in the viremic patient sera tested is less significant than that of bNAbs, which development takes place late in the course of infection and only in a limited number of individuals [56]. Given that complement is activated by Ab hexamers assembled on the surface by Fc-Fc interactions [57], it is likely that the orientation of the Fc region as well as Ab density are critical factors for complement activation by a given bNAb. Indeed, Abs targeting the CD4 binding site or the V3 loop can bind up to 3 Fab fragments on an Env trimer, which would promote Fc-Fc interactions [58]. Altogether, these points could explain why a more efficient ADCML of virions was observed using PGT121 as compared to Abs purified from infected individual sera and could also explain the variability detected using Abs from the sera of the two viremic individuals (Figure 6).
In conclusion, our study identifies miRNA-26a as a post-transcriptional negative regulator of CD59 expression in CD4+ T-cells. Our results show that HIV-1 reduces the level of this miRNA during infection likely via the expression of a viral protein whose identity remains to be defined. We also provide evidence that the addition of exogenous miRNA-26a mimics to infected cells reduces the resistance of HIV-1 to ADCML. This miRNA is yet another example of a miRNA of which the modulation of expression allows HIV-1 to escape the host immune response and more specifically ADCML. This mechanism could be targeted to augment the potency of antibody-based preventive or therapeutic strategies against HIV-1.
Supplementary Materials
There are Supplementary figures (Figures S1-S5) and a supplementary Table S1 related to this work: Figure S1. Characterization of the infected cell populations used for the RNA-seq, related to Figure 1. Figure S2. List for genes for which mRNA expression levels are modulated in the GFP-positive population compared to Mock, related to Figure 1. Figure S3. Modulation of miRNA-26a and CD59 expression levels in HIV-1 infected CEM-CCR5 cells and characterization of CEM-CD59_KO cells, related to Figure 5. Figure S4. ADCML assay with antibodies purified from the sera of viremic individuals, related to Figure 6. Figure S5. Characterization of CD4+ T-cell subpopulations following infection with the dual reporter HIV Nef-2A-CRIMZs virus, related to Figure 7. Table S1 – Sequences of miRNAs mimics and oligonucleotides used in this study.
Author Contributions
N.B, R.L and E.A.C designed the study. N.B performed all experiments and C.Y contributed to the generation of plasmid constructs for the MIR-REPORT assays. N.B, R.L and E.A.C analyzed data. T.T.M and O.A provided the replicative dual reporter HIV-1 system. N.B, R.L and E.A.C wrote the manuscript. E.A.C secured funding.
Funding
This study was supported by Canadian Institutes of Health Research (CIHR) grants FDN-154324 and HB2-164064 (Canadian HIV Cure Enterprise-CanCURE 2.0) to E.A.C as well as by the Fonds de Recherche du Québec-Santé (FRQS)-funded Réseau SIDA/Maladies Infectieuses. E.A.C is the recipient of the IRCM-Université de Montréal Chair of Excellence in HIV Research.
Data Availability Statement
The online GEO accession numbers for the reported mRNA-seq and miRNA-seq data are GSE247191 (mRNA-seq) and GSE247194 (miRNA-seq), respectively.
Acknowledgments
The authors wish to thank all the study participants as well as IRCM Clinic staff for coordinating access to blood donors. We also thank Julie Lord and Eric Massicotte for their assistance for flow cytometry analyses, Odile Neyret and the IRCM Molecular Biology and Functional Genomics Core staff for their support with the Illumina technology and cDNA sequencing, and Virginie Calderon for her help with database bioinformatics analyses.The following reagents were obtained through the NIH HIV Reagent Program, Division of AIDS, NIAID, NIH: Monoclonal Anti-HIV-1 gp120 (PGT121) (ARP-12343), contributed by the International AIDS Vaccine Initiative; CEM.NKR CCR5+ cells (ARP-4376) contributed by Dr. Alexandra Trkola; ACH-2 Cells (ARP-349) contributed by Dr. Thomas Folks.
Conflicts of Interest
The authors declare no conflict of interest.
References
- Alter, G.; Moody, M.A. The humoral response to HIV-1: new insights, renewed focus. The Journal of Infectious Diseases 2010, 202 Suppl 2, S315-322. [CrossRef]
- Tomaras, G.D.; Yates, N.L.; Liu, P.; Qin, L.; Fouda, G.G.; Chavez, L.L.; Decamp, A.C.; Parks, R.J.; Ashley, V.C.; Lucas, J.T.; et al. Initial B-cell responses to transmitted human immunodeficiency virus type 1: virion-binding immunoglobulin M (IgM) and IgG antibodies followed by plasma anti-gp41 antibodies with ineffective control of initial viremia. Journal of Virology 2008, 82, 12449-12463. [CrossRef]
- Poignard, P.; Moulard, M.; Golez, E.; Vivona, V.; Franti, M.; Venturini, S.; Wang, M.; Parren, P.W.H.I.; Burton, D.R. Heterogeneity of envelope molecules expressed on primary human immunodeficiency virus type 1 particles as probed by the binding of neutralizing and nonneutralizing antibodies. Journal of Virology 2003, 77, 353-365. [CrossRef]
- Bunnik, E.M.; Pisas, L.; van Nuenen, A.C.; Schuitemaker, H. Autologous neutralizing humoral immunity and evolution of the viral envelope in the course of subtype B human immunodeficiency virus type 1 infection. Journal of Virology 2008, 82, 7932-7941. [CrossRef]
- Gray, E.S.; Moore, P.L.; Choge, I.A.; Decker, J.M.; Bibollet-Ruche, F.; Li, H.; Leseka, N.; Treurnicht, F.; Mlisana, K.; Shaw, G.M.; et al. Neutralizing antibody responses in acute human immunodeficiency virus type 1 subtype C infection. Journal of Virology 2007, 81, 6187-6196. [CrossRef]
- Haynes, B.F.; Shaw, G.M.; Korber, B.; Kelsoe, G.; Sodroski, J.; Hahn, B.H.; Borrow, P.; McMichael, A.J. HIV-Host Interactions: Implications for Vaccine Design. Cell Host & Microbe 2016, 19, 292-303. [CrossRef]
- Liu, Y.; Cao, W.; Sun, M.; Li, T. Broadly neutralizing antibodies for HIV-1: efficacies, challenges and opportunities. Emerging Microbes & Infections 2020, 9, 194-206. [CrossRef]
- Ebenbichler, C.F.; Thielens, N.M.; Vornhagen, R.; Marschang, P.; Arlaud, G.J.; Dierich, M.P. Human immunodeficiency virus type 1 activates the classical pathway of complement by direct C1 binding through specific sites in the transmembrane glycoprotein gp41. The Journal of Experimental Medicine 1991, 174, 1417-1424. [CrossRef]
- Walport, M.J. Complement. First of two parts. The New England Journal of Medicine 2001, 344, 1058-1066. [CrossRef]
- Dunkelberger, J.R.; Song, W.-C. Complement and its role in innate and adaptive immune responses. Cell Research 2010, 20, 34-50. [CrossRef]
- Couves, E.C.; Gardner, S.; Voisin, T.B.; Bickel, J.K.; Stansfeld, P.J.; Tate, E.W.; Bubeck, D. Structural basis for membrane attack complex inhibition by CD59. Nature Communications 2023, 14, 890. [CrossRef]
- Zipfel, P.F.; Skerka, C. Complement regulators and inhibitory proteins. Nature Reviews. Immunology 2009, 9, 729-740. [CrossRef]
- Saifuddin, M.; Hedayati, T.; Atkinson, J.P.; Holguin, M.H.; Parker, C.J.; Spear, G.T. Human immunodeficiency virus type 1 incorporates both glycosyl phosphatidylinositol-anchored CD55 and CD59 and integral membrane CD46 at levels that protect from complement-mediated destruction. The Journal of General Virology 1997, 78 ( Pt 8), 1907-1911. [CrossRef]
- Marschang, P.; Sodroski, J.; Wurzner, R.; Dierich, M.P. Decay-accelerating factor (CD55) protects human immunodeficiency virus type 1 from inactivation by human complement. Eur J Immunol 1995, 25, 285-290. [CrossRef]
- Huber, M.; Fischer, M.; Misselwitz, B.; Manrique, A.; Kuster, H.; Niederöst, B.; Weber, R.; von Wyl, V.; Günthard, H.F.; Trkola, A. Complement lysis activity in autologous plasma is associated with lower viral loads during the acute phase of HIV-1 infection. PLoS medicine 2006, 3, e441. [CrossRef]
- Aasa-Chapman, M.M.I.; Holuigue, S.; Aubin, K.; Wong, M.; Jones, N.A.; Cornforth, D.; Pellegrino, P.; Newton, P.; Williams, I.; Borrow, P.; et al. Detection of antibody-dependent complement-mediated inactivation of both autologous and heterologous virus in primary human immunodeficiency virus type 1 infection. Journal of Virology 2005, 79, 2823-2830. [CrossRef]
- Hammond, S.M. An overview of microRNAs. Advanced Drug Delivery Reviews 2015, 87, 3-14. [CrossRef]
- O’Brien, J.; Hayder, H.; Zayed, Y.; Peng, C. Overview of MicroRNA Biogenesis, Mechanisms of Actions, and Circulation. Frontiers in Endocrinology 2018, 9, 402. [CrossRef]
- Balasubramaniam, M.; Pandhare, J.; Dash, C. Are microRNAs Important Players in HIV-1 Infection? An Update. Viruses 2018, 10, 110. [CrossRef]
- Orecchini, E.; Doria, M.; Michienzi, A.; Giuliani, E.; Vassena, L.; Ciafrè, S.A.; Farace, M.G.; Galardi, S. The HIV-1 Tat protein modulates CD4 expression in human T cells through the induction of miR-222. RNA biology 2014, 11, 334-338. [CrossRef]
- Lodge, R.; Ferreira Barbosa, J.A.; Lombard-Vadnais, F.; Gilmore, J.C.; Deshiere, A.; Gosselin, A.; Wiche Salinas, T.R.; Bego, M.G.; Power, C.; Routy, J.-P.; et al. Host MicroRNAs-221 and -222 Inhibit HIV-1 Entry in Macrophages by Targeting the CD4 Viral Receptor. Cell Reports 2017, 21, 141-153. [CrossRef]
- Lodge, R.; Bellini, N.; Laporte, M.; Salahuddin, S.; Routy, J.-P.; Ancuta, P.; Costiniuk, C.T.; Jenabian, M.-A.; Cohen, É.A. Interleukin-1β Triggers p53-Mediated Downmodulation of CCR5 and HIV-1 Entry in Macrophages through MicroRNAs 103 and 107. mBio 2020, 11, e02314-02320. [CrossRef]
- Bellini, N.; Lodge, R.; Pham, T.N.Q.; Jain, J.; Murooka, T.T.; Herschhorn, A.; Bernard, N.F.; Routy, J.-P.; Tremblay, C.L.; Cohen, É.A. MiRNA-103 downmodulates CCR5 expression reducing human immunodeficiency virus type-1 entry and impacting latency establishment in CD4+ T cells. iScience 2022, 25, 105234. [CrossRef]
- Riess, M.; Fuchs, N.V.; Idica, A.; Hamdorf, M.; Flory, E.; Pedersen, I.M.; König, R. Interferons Induce Expression of SAMHD1 in Monocytes through Down-regulation of miR-181a and miR-30a. The Journal of Biological Chemistry 2017, 292, 264-277. [CrossRef]
- Ruelas, D.S.; Chan, J.K.; Oh, E.; Heidersbach, A.J.; Hebbeler, A.M.; Chavez, L.; Verdin, E.; Rape, M.; Greene, W.C. MicroRNA-155 Reinforces HIV Latency. The Journal of Biological Chemistry 2015, 290, 13736-13748. [CrossRef]
- Xu, Z.; Lodge, R.; Power, C.; Cohen, E.A.; Hobman, T.C. The HIV-1 Accessory Protein Vpu Downregulates Peroxisome Biogenesis. mBio 2020, 11, e03395-03319. [CrossRef]
- Lodge, R.; Xu, Z.; Eklund, M.; Stürzel, C.; Kirchhoff, F.; Tremblay, M.J.; Hobman, T.C.; Cohen, É.A. MicroRNA-25/93 induction by Vpu as a mechanism for counteracting MARCH1-restriction on HIV-1 infectivity in macrophages. mBio 2023, 14, e0195023. [CrossRef]
- Shen, C.-J.; Jia, Y.-H.; Tian, R.-R.; Ding, M.; Zhang, C.; Wang, J.-H. Translation of Pur-α is targeted by cellular miRNAs to modulate the differentiation-dependent susceptibility of monocytes to HIV-1 infection. FASEB journal: official publication of the Federation of American Societies for Experimental Biology 2012, 26, 4755-4764. [CrossRef]
- Ou, S.H.; Wu, F.; Harrich, D.; Garcia-Martinez, L.F.; Gaynor, R.B. Cloning and characterization of a novel cellular protein, TDP-43, that binds to human immunodeficiency virus type 1 TAR DNA sequence motifs. J Virol 1995, 69, 3584-3596. [CrossRef]
- Cabrera-Rodríguez, R.; Pérez-Yanes, S.; Montelongo, R.; Lorenzo-Salazar, J.M.; Estévez-Herrera, J.; García-Luis, J.; Íñigo-Campos, A.; Rubio-Rodríguez, L.A.; Muñoz-Barrera, A.; Trujillo-González, R.; et al. Transactive Response DNA-Binding Protein (TARDBP/TDP-43) Regulates Cell Permissivity to HIV-1 Infection by Acting on HDAC6. International Journal of Molecular Sciences 2022, 23, 6180. [CrossRef]
- Scott, D.D.; Trahan, C.; Zindy, P.J.; Aguilar, L.C.; Delubac, M.Y.; Van Nostrand, E.L.; Adivarahan, S.; Wei, K.E.; Yeo, G.W.; Zenklusen, D.; et al. Nol12 is a multifunctional RNA binding protein at the nexus of RNA and DNA metabolism. Nucleic Acids Research 2017, 45, 12509-12528. [CrossRef]
- Chen, D.; Wang, M.; Zhou, S.; Zhou, Q. HIV-1 Tat targets microtubules to induce apoptosis, a process promoted by the pro-apoptotic Bcl-2 relative Bim. The EMBO journal 2002, 21, 6801-6810. [CrossRef]
- Taylor, H.E.; Simmons, G.E.; Mathews, T.P.; Khatua, A.K.; Popik, W.; Lindsley, C.W.; D’Aquila, R.T.; Brown, H.A. Phospholipase D1 Couples CD4+ T Cell Activation to c-Myc-Dependent Deoxyribonucleotide Pool Expansion and HIV-1 Replication. PLoS pathogens 2015, 11, e1004864. [CrossRef]
- Jiang, Q.; Zhang, L.; Wang, R.; Jeffrey, J.; Washburn, M.L.; Brouwer, D.; Barbour, S.; Kovalev, G.I.; Unutmaz, D.; Su, L. FoxP3+CD4+ regulatory T cells play an important role in acute HIV-1 infection in humanized Rag2-/-gammaC-/- mice in vivo. Blood 2008, 112, 2858-2868. [CrossRef]
- Trkola, A.; Matthews, J.; Gordon, C.; Ketas, T.; Moore, J.P. A cell line-based neutralization assay for primary human immunodeficiency virus type 1 isolates that use either the CCR5 or the CXCR4 coreceptor. Journal of Virology 1999, 73, 8966-8974. [CrossRef]
- Walker, L.M.; Huber, M.; Doores, K.J.; Falkowska, E.; Pejchal, R.; Julien, J.-P.; Wang, S.-K.; Ramos, A.; Chan-Hui, P.-Y.; Moyle, M.; et al. Broad neutralization coverage of HIV by multiple highly potent antibodies. Nature 2011, 477, 466-470. [CrossRef]
- Ratnapriya, S.; Harris, M.; Chov, A.; Herbert, Z.T.; Vrbanac, V.; Deruaz, M.; Achuthan, V.; Engelman, A.N.; Sodroski, J.; Herschhorn, A. Intra- and extra-cellular environments contribute to the fate of HIV-1 infection. Cell Reports 2021, 36, 109622. [CrossRef]
- Dave, V.P.; Hajjar, F.; Dieng, M.M.; Haddad, É.; Cohen, É.A. Efficient BST2 antagonism by Vpu is critical for early HIV-1 dissemination in humanized mice. Retrovirology 2013, 10, 128. [CrossRef]
- Richard, J.; Sindhu, S.; Pham, T.N.Q.; Belzile, J.-P.; Cohen, E.A. HIV-1 Vpr up-regulates expression of ligands for the activating NKG2D receptor and promotes NK cell-mediated killing. Blood 2010, 115, 1354-1363. [CrossRef]
- Pham, T.N.Q.; Lukhele, S.; Hajjar, F.; Routy, J.-P.; Cohen, É.A. HIV Nef and Vpu protect HIV-infected CD4+ T cells from antibody-mediated cell lysis through down-modulation of CD4 and BST2. Retrovirology 2014, 11, 15. [CrossRef]
- Stopak, K.; de Noronha, C.; Yonemoto, W.; Greene, W.C. HIV-1 Vif blocks the antiviral activity of APOBEC3G by impairing both its translation and intracellular stability. Molecular Cell 2003, 12, 591-601. [CrossRef]
- Han, Y.; Wang, X.; Dang, Y.; Zheng, Y.-H. APOBEC3G and APOBEC3F require an endogenous cofactor to block HIV-1 replication. PLoS pathogens 2008, 4, e1000095. [CrossRef]
- Dey, B.K.; Gagan, J.; Yan, Z.; Dutta, A. miR-26a is required for skeletal muscle differentiation and regeneration in mice. Genes & Development 2012, 26, 2180-2191. [CrossRef]
- Fu, X.; Dong, B.; Tian, Y.; Lefebvre, P.; Meng, Z.; Wang, X.; Pattou, F.; Han, W.; Wang, X.; Lou, F.; et al. MicroRNA-26a regulates insulin sensitivity and metabolism of glucose and lipids. The Journal of Clinical Investigation 2015, 125, 2497-2509. [CrossRef]
- Hutter, K.; Lindner, S.E.; Kurschat, C.; Rülicke, T.; Villunger, A.; Herzog, S. The miR-26 family regulates early B cell development and transformation. Life Science Alliance 2022, 5, e202101303. [CrossRef]
- Spear, G.T.; Lurain, N.S.; Parker, C.J.; Ghassemi, M.; Payne, G.H.; Saifuddin, M. Host cell-derived complement control proteins CD55 and CD59 are incorporated into the virions of two unrelated enveloped viruses. Human T cell leukemia/lymphoma virus type I (HTLV-I) and human cytomegalovirus (HCMV). Journal of Immunology (Baltimore, Md.: 1950) 1995, 155, 4376-4381.
- Amet, T.; Ghabril, M.; Chalasani, N.; Byrd, D.; Hu, N.; Grantham, A.; Liu, Z.; Qin, X.; He, J.J.; Yu, Q. CD59 incorporation protects hepatitis C virus against complement-mediated destruction. Hepatology (Baltimore, Md.) 2012, 55, 354-363. [CrossRef]
- Zhuang, C.; Wang, P.; Huang, D.; Xu, L.; Wang, X.; Wang, L.; Hu, L. A double-negative feedback loop between EZH2 and miR-26a regulates tumor cell growth in hepatocellular carcinoma. International Journal of Oncology 2016, 48, 1195-1204. [CrossRef]
- Liu, J.; Li, X.; Wang, M.; Xiao, G.; Yang, G.; Wang, H.; Li, Y.; Sun, X.; Qin, S.; Du, N.; et al. A miR-26a/E2F7 feedback loop contributes to tamoxifen resistance in ER-positive breast cancer. International Journal of Oncology 2018, 53, 1601-1612. [CrossRef]
- Lukacik, P.; Roversi, P.; White, J.; Esser, D.; Smith, G.P.; Billington, J.; Williams, P.A.; Rudd, P.M.; Wormald, M.R.; Harvey, D.J.; et al. Complement regulation at the molecular level: the structure of decay-accelerating factor. Proceedings of the National Academy of Sciences of the United States of America 2004, 101, 1279-1284. [CrossRef]
- Riley-Vargas, R.C.; Gill, D.B.; Kemper, C.; Liszewski, M.K.; Atkinson, J.P. CD46: expanding beyond complement regulation. Trends in Immunology 2004, 25, 496-503. [CrossRef]
- Lan, J.; Yang, K.; Byrd, D.; Hu, N.; Amet, T.; Shepherd, N.; Desai, M.; Gao, J.; Gupta, S.; Sun, Y.; et al. Provirus activation plus CD59 blockage triggers antibody-dependent complement-mediated lysis of latently HIV-1-infected cells. Journal of Immunology (Baltimore, Md.: 1950) 2014, 193, 3577-3589. [CrossRef]
- Yang, K.; Lan, J.; Shepherd, N.; Hu, N.; Xing, Y.; Byrd, D.; Amet, T.; Jewell, C.; Gupta, S.; Kounga, C.; et al. Blockage of CD59 Function Restores Activities of Neutralizing and Nonneutralizing Antibodies in Triggering Antibody-Dependent Complement-Mediated Lysis of HIV-1 Virions and Provirus-Activated Latently Infected Cells. Journal of Virology 2015, 89, 9393-9406. [CrossRef]
- Amet, T.; Lan, J.; Shepherd, N.; Yang, K.; Byrd, D.; Xing, Y.; Yu, Q. Glycosylphosphatidylinositol Anchor Deficiency Attenuates the Production of Infectious HIV-1 and Renders Virions Sensitive to Complement Attack. AIDS research and human retroviruses 2016, 32, 1100-1112. [CrossRef]
- Dufloo, J.; Guivel-Benhassine, F.; Buchrieser, J.; Lorin, V.; Grzelak, L.; Dupouy, E.; Mestrallet, G.; Bourdic, K.; Lambotte, O.; Mouquet, H.; et al. Anti-HIV-1 antibodies trigger non-lytic complement deposition on infected cells. EMBO reports 2020, 21, e49351. [CrossRef]
- Sather, D.N.; Armann, J.; Ching, L.K.; Mavrantoni, A.; Sellhorn, G.; Caldwell, Z.; Yu, X.; Wood, B.; Self, S.; Kalams, S.; et al. Factors associated with the development of cross-reactive neutralizing antibodies during human immunodeficiency virus type 1 infection. J Virol 2009, 83, 757-769. [CrossRef]
- Wang, G.; de Jong, R.N.; van den Bremer, E.T.J.; Beurskens, F.J.; Labrijn, A.F.; Ugurlar, D.; Gros, P.; Schuurman, J.; Parren, P.W.H.I.; Heck, A.J.R. Molecular Basis of Assembly and Activation of Complement Component C1 in Complex with Immunoglobulin G1 and Antigen. Molecular Cell 2016, 63, 135-145. [CrossRef]
- Zhou, T.; Georgiev, I.; Wu, X.; Yang, Z.-Y.; Dai, K.; Finzi, A.; Kwon, Y.D.; Scheid, J.F.; Shi, W.; Xu, L.; et al. Structural basis for broad and potent neutralization of HIV-1 by antibody VRC01. Science (New York, N.Y.) 2010, 329, 811-817. [CrossRef]
- Norman, J.M.; Mashiba, M.; McNamara, L.A.; Onafuwa-Nuga, A.; Chiari-Fort, E.; Shen, W.; Collins, K.L. The antiviral factor APOBEC3G enhances the recognition of HIV-infected primary T cells by natural killer cells. Nature Immunology 2011, 12, 975-983. [CrossRef]
- Murooka, T.T.; Deruaz, M.; Marangoni, F.; Vrbanac, V.D.; Seung, E.; von Andrian, U.H.; Tager, A.M.; Luster, A.D.; Mempel, T.R. HIV-infected T cells are migratory vehicles for viral dissemination. Nature 2012, 490, 283-287. [CrossRef]
- Kim, J.H.; Lee, S.-R.; Li, L.-H.; Park, H.-J.; Park, J.-H.; Lee, K.Y.; Kim, M.-K.; Shin, B.A.; Choi, S.-Y. High cleavage efficiency of a 2A peptide derived from porcine teschovirus-1 in human cell lines, zebrafish and mice. PloS One 2011, 6, e18556. [CrossRef]
- Lodge, R.; Lalonde, J.P.; Lemay, G.; Cohen, E.A. The membrane-proximal intracytoplasmic tyrosine residue of HIV-1 envelope glycoprotein is critical for basolateral targeting of viral budding in MDCK cells. The EMBO journal 1997, 16, 695-705. [CrossRef]
- Androvic, P.; Valihrach, L.; Elling, J.; Sjoback, R.; Kubista, M. Two-tailed RT-qPCR: a novel method for highly accurate miRNA quantification. Nucleic Acids Research 2017, 45, e144. [CrossRef]
- Bego, M.G.; Mercier, J.; Cohen, E.A. Virus-activated interferon regulatory factor 7 upregulates expression of the interferon-regulated BST2 gene independently of interferon signaling. Journal of Virology 2012, 86, 3513-3527. [CrossRef]
- Thielen, A.J.F.; van Baarsen, I.M.; Jongsma, M.L.; Zeerleder, S.; Spaapen, R.M.; Wouters, D. CRISPR/Cas9 generated human CD46, CD55 and CD59 knockout cell lines as a tool for complement research. Journal of Immunological Methods 2018, 456, 15-22. [CrossRef]
- Sanjana, N.E.; Shalem, O.; Zhang, F. Improved vectors and genome-wide libraries for CRISPR screening. Nature Methods 2014, 11, 783-784. [CrossRef]
- Vandergeeten, C.; Fromentin, R.; Merlini, E.; Lawani, M.B.; DaFonseca, S.; Bakeman, W.; McNulty, A.; Ramgopal, M.; Michael, N.; Kim, J.H.; et al. Cross-clade ultrasensitive PCR-based assays to measure HIV persistence in large-cohort studies. Journal of Virology 2014, 88, 12385-12396. [CrossRef]
- Burnie, J.; Tang, V.A.; Welsh, J.A.; Persaud, A.T.; Thaya, L.; Jones, J.C.; Guzzo, C. Flow Virometry Quantification of Host Proteins on the Surface of HIV-1 Pseudovirus Particles. Viruses 2020, 12, 1296. [CrossRef]
Figure 1.
RNA-seq mRNA and miRNA profiles in infected CD4+ T-cells compared to uninfected cells. (A) Volcano plot representing the differential expression (fc= fold change) of mRNAs in infected (GFP-positive, GFP-pos) CD4+ T-cells as compared to uninfected cells (Mock). The mRNAs with a log2Fc of >0.585 and a DeSeq2 base mean >100 are in red, while those with a log2Fc <-0.585 are in blue. (B) Graphs representing the upregulated (left panel) or downregulated (right panel) biological processes in infected (GFP-pos) as compared to uninfected cells (Mock) as determined by g:Profiler (https://biit.cs.ut.ee/gprofiler/gost). (C) Volcano plot representing the differential expression of miRNAs in infected (GFP-pos) CD4+ T-cells as compared to uninfected cells (Mock). Dots of upregulated miRNAs with a log2Fc of >0.585 and a DeSeq2 base mean >100 are in red, while those downregulated with a log2Fc <-0.585 are in blue. (D) The heatmap depicts the 37 miRNAs specifically dysregulated in the GFP-pos population detected in this study. The scale bar is in log2(Fc). MiRNAs with forms (1) and (2) are identical miRNAs produced by two distinct loci. See also Figures S1-S2.
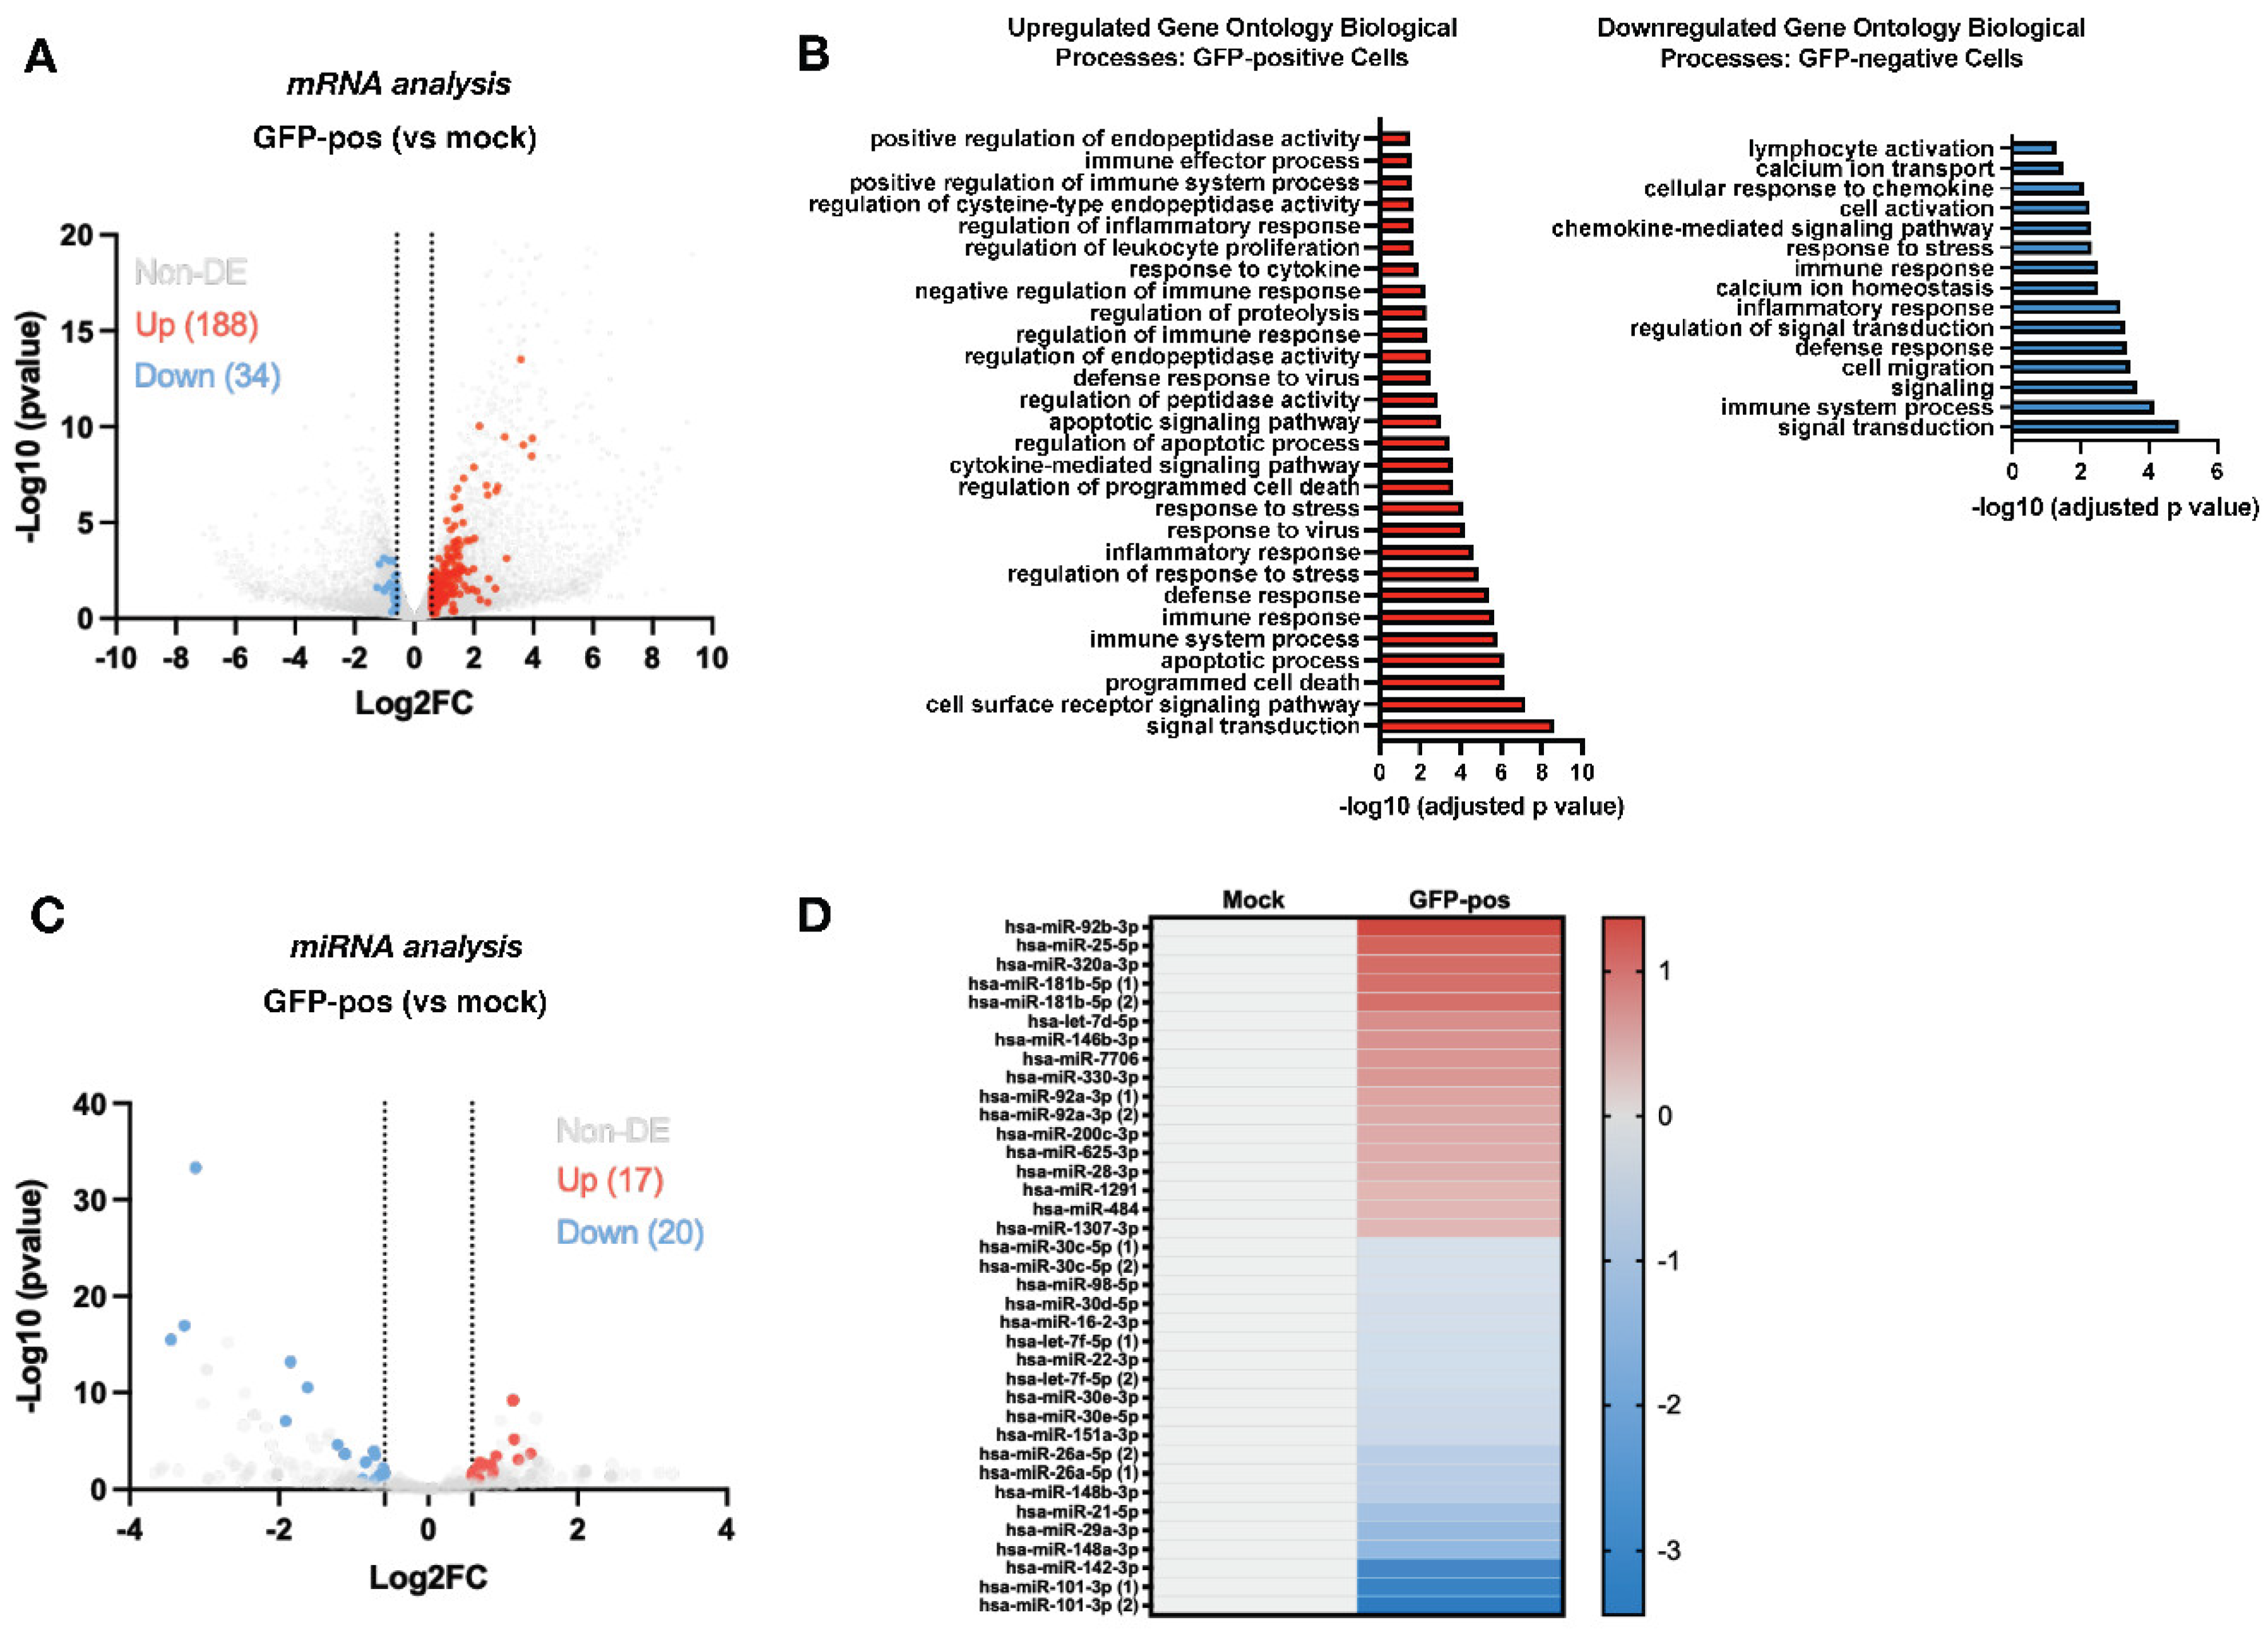
Figure 2.
CD59 is predicted to be regulated in infected cells by three miRNAs. (A) Example of genes whose expression is dysregulated in infected cells (GFP-pos) compared to uninfected cells (Mock) and that are relevant in the context of HIV-1 infection based on the current literature. The Fc values indicated correspond to the values obtained based on the RNA-seq analysis. (B) Graph representing the upregulated gene ontology pathways (from Figure 1B, left panel) which include CD59. (C) Shown are the 10 most downregulated miRNAs in GFP-pos cells compared to Mock, ranked from most to least decreased. The Fc values indicated correspond to the values based on the RNA-seq analysis. (D) MiRNAs-21, -26a and 29a potentially target many dysregulated genes in GFP-pos cells, including CD59. Cross-referencing of miRNA and transcriptomic RNA data was performed using online databases (mirDIP, http://ophid.utoronto.ca/mirDIP/).
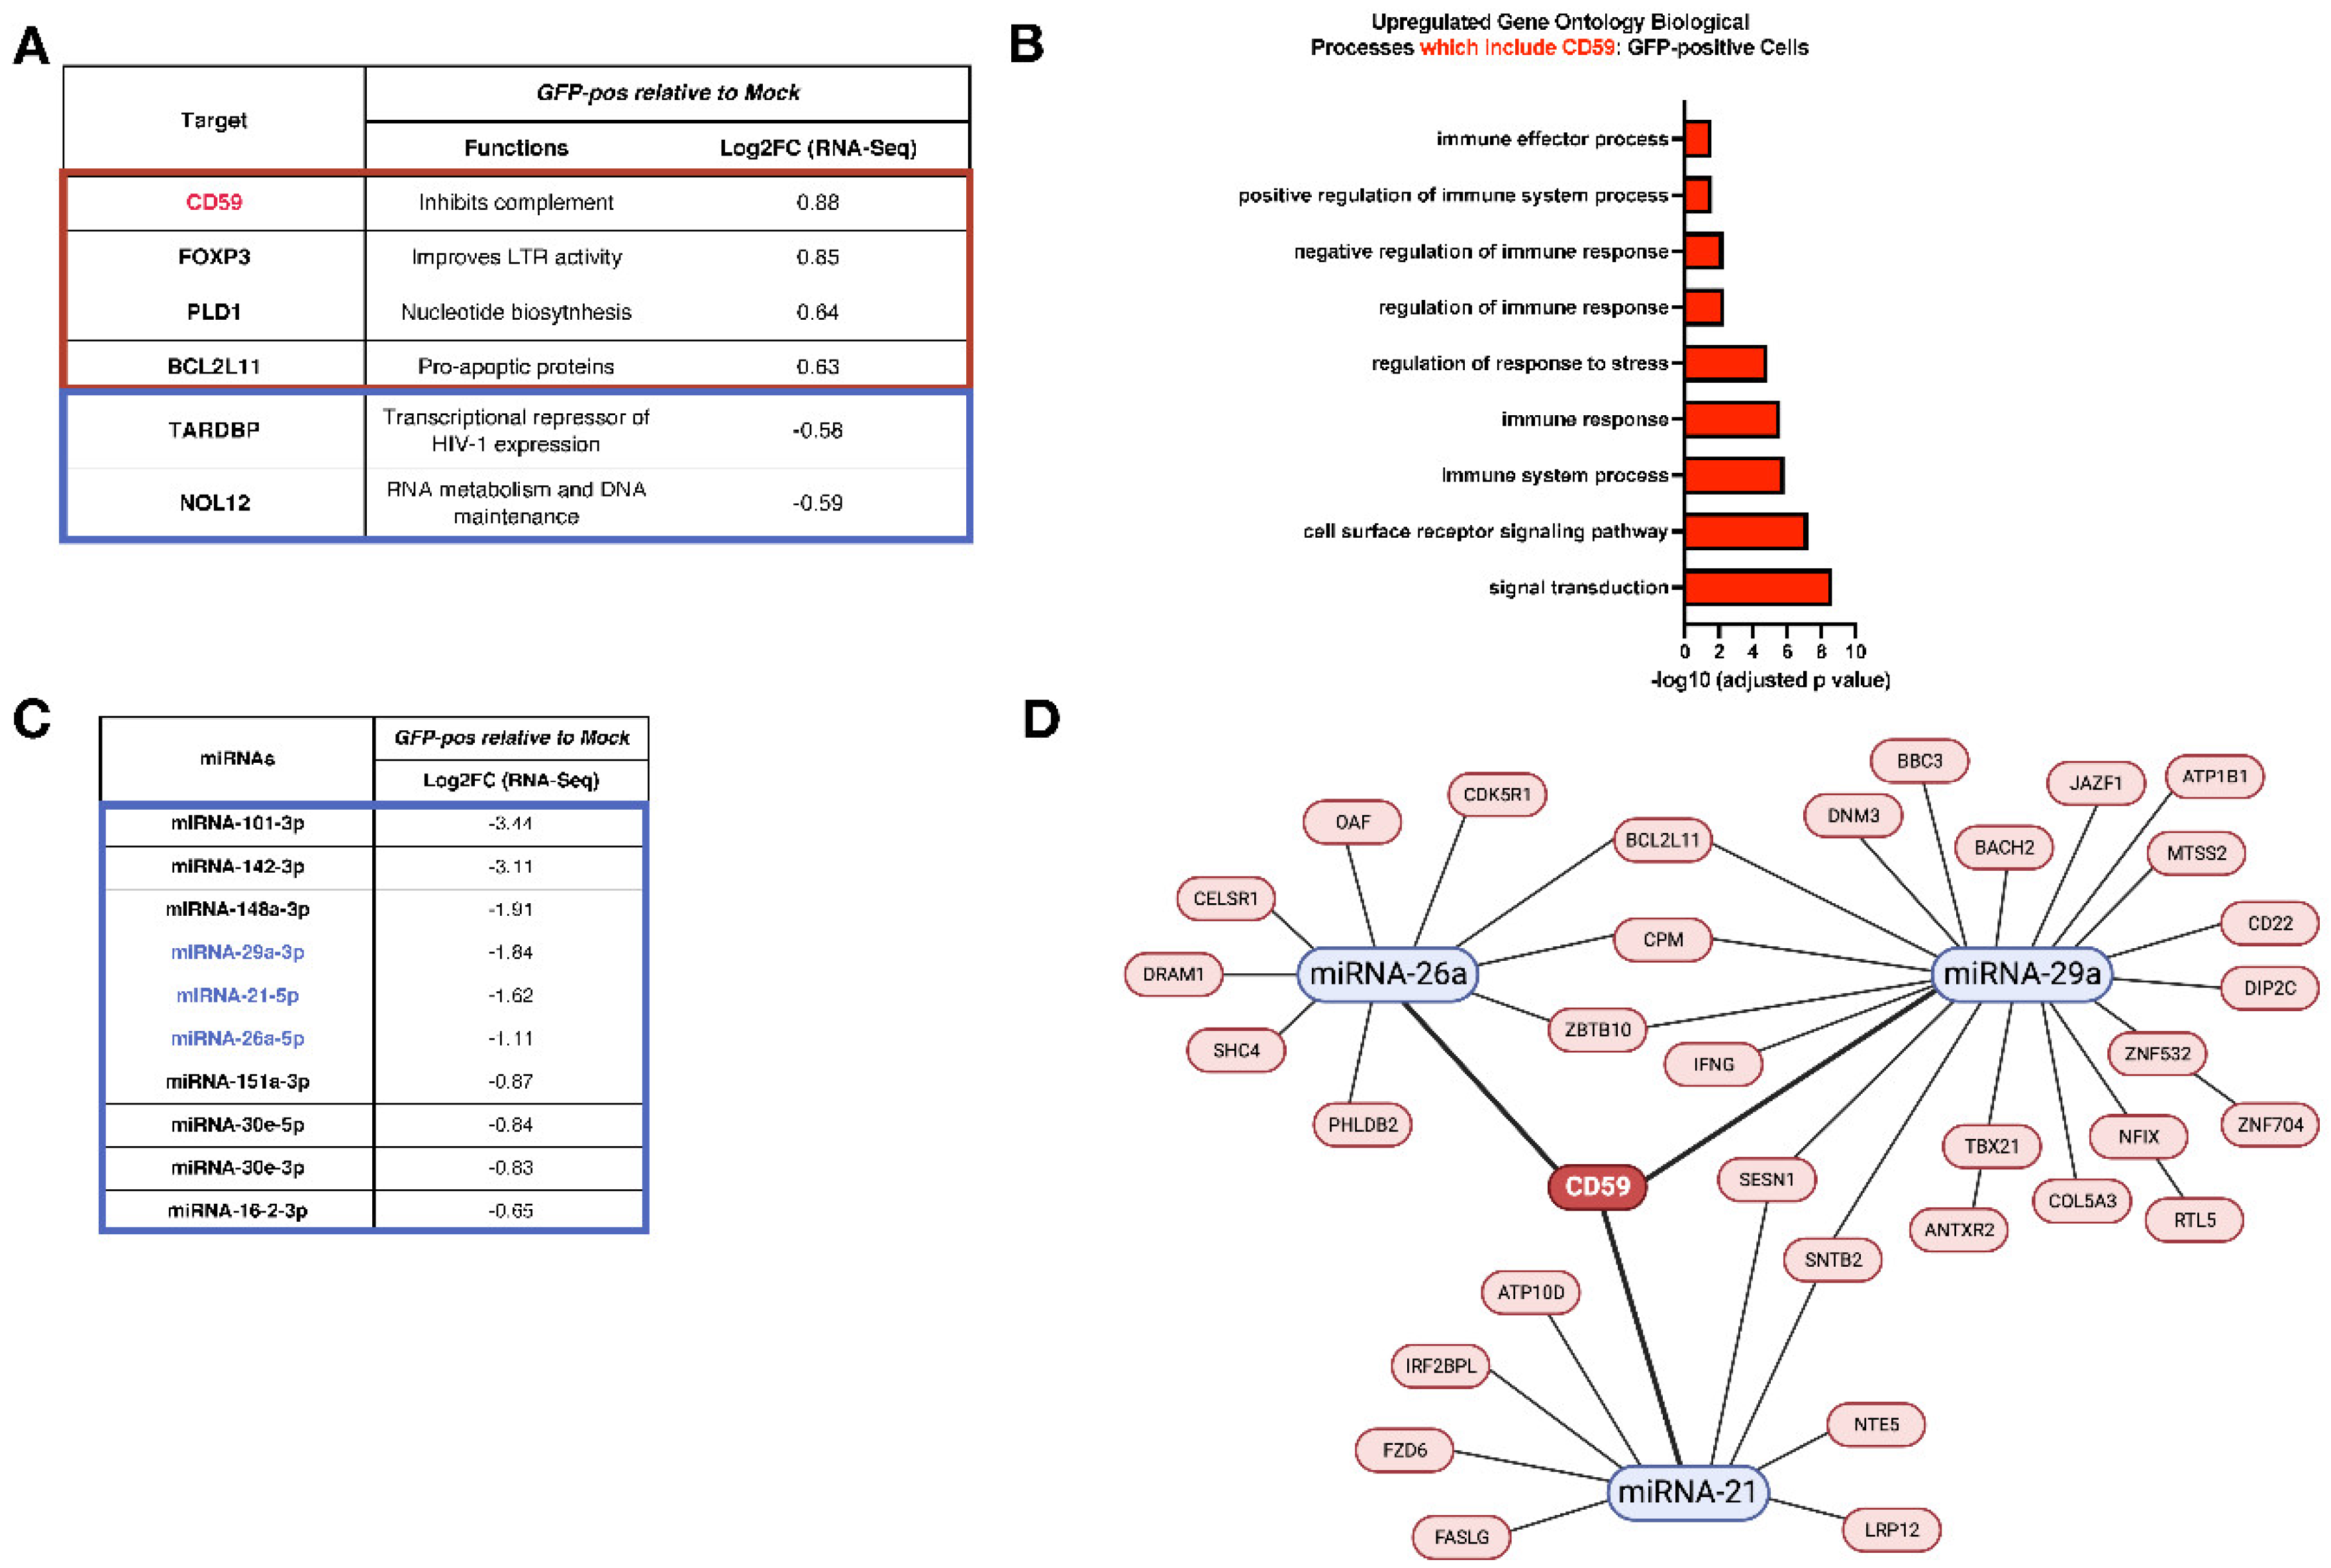
Figure 3.
Validation of the differential expression of predicted CD59-targeting miRNAs (miRNA-21, miRNA-26a and miRNA-29a) and CD59 upon HIV-1 infection. Expression levels of MiRNA-21, -26a and -29a (A) and CD59 mRNA (B) in uninfected (Mock) and productively infected (GFP-pos) CD4+ T-cells (n = 6) were measured by real-time qPCR. Shown are the mean fold changes compared to uninfected cells (in gray, which is set at 1). Error bars represent standard error of the mean (SEM). Statistical significance was determined by the nonparametric Mann-Whitney’s test, values: **p < 0.01. (C) CD59 cell-surface expression was evaluated by flow cytometry and the mean fluorescent intensity (MFI) was compared between uninfected (Mock) and infected CD4+ T-cells (GFP-positive) obtained from healthy blood donors. Error bars represent SEM (n=3).
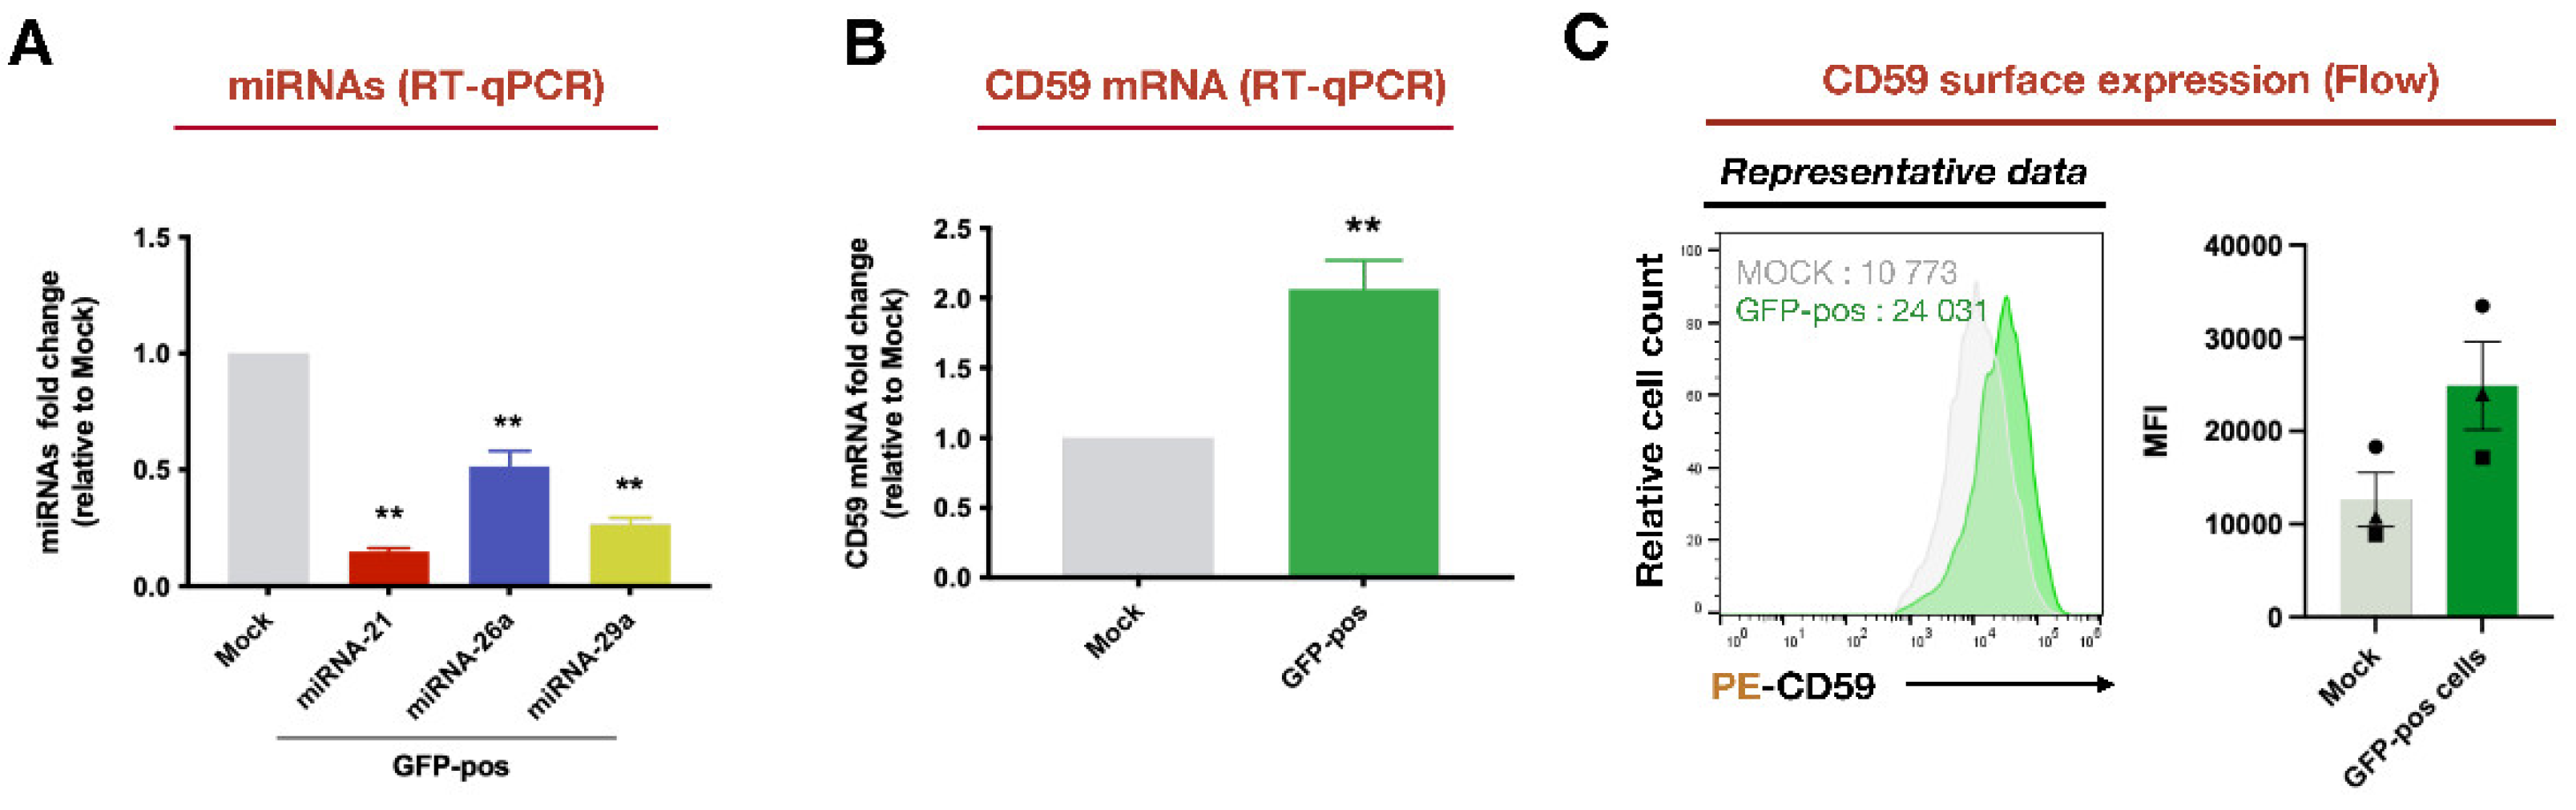
Figure 4.
– CD59 mRNA is a target of miRNA-26a. (A) CD59 mRNA levels were measured in miRNA-21, -26a and -29a mimics or control-nucleofected primary CD4+ T-cells by real-time qPCR. Shown is the mean fold change compared to control transfected cells (in gray, which is set at 1) (n = 4). Error bars represent SEM. Statistical significance was determined by the nonparametric Kruskal Wallis test, values: **p < 0.01. (B) CD59 surface expression was evaluated in miRNA-21, -26a mimics or control-nucleofected primary CD4+ T-cells by flow cytometry. Shown is the cell surface expression of CD59 from CD4+ T-cells of four blood donors (normalized to CTRL which was set at 100%) with a representative result on the left (MFI are shown). Error bars represent SEM. Statistical significance was determined by the nonparametric Kruskal Wallis test, values: *p < 0.05. (C) The MIR-Report system was used to validate whether the CD59 3′UTR was a target of miRNA-26a. MiRNA blue nucleotides represent those predicted to interact with the CD59 3′UTR. WT or mutated (substituted nucleotides in green) fragments of the 3′UTR encompassing the predicted sequences recognized by miRNA-26a were fused to the F-Luciferase (F-Luc) gene. (D) HEK293T cells were transfected with miRNA-26 mimics, the reporter plasmids with the indicated fragment of the WT (in yellow) or mutated (in black) 3′ UTR, and a Renilla-Luciferase (R-Luc) normalizing control. Following cell lysis, relative light units (RLUs) were measured and F-Luc normalized to negative control (in grey, which is set at 1). Error bars represent SEM. Statistical significance was determined by the nonparametric Kruskal Wallis test, values: *p < 0.05.
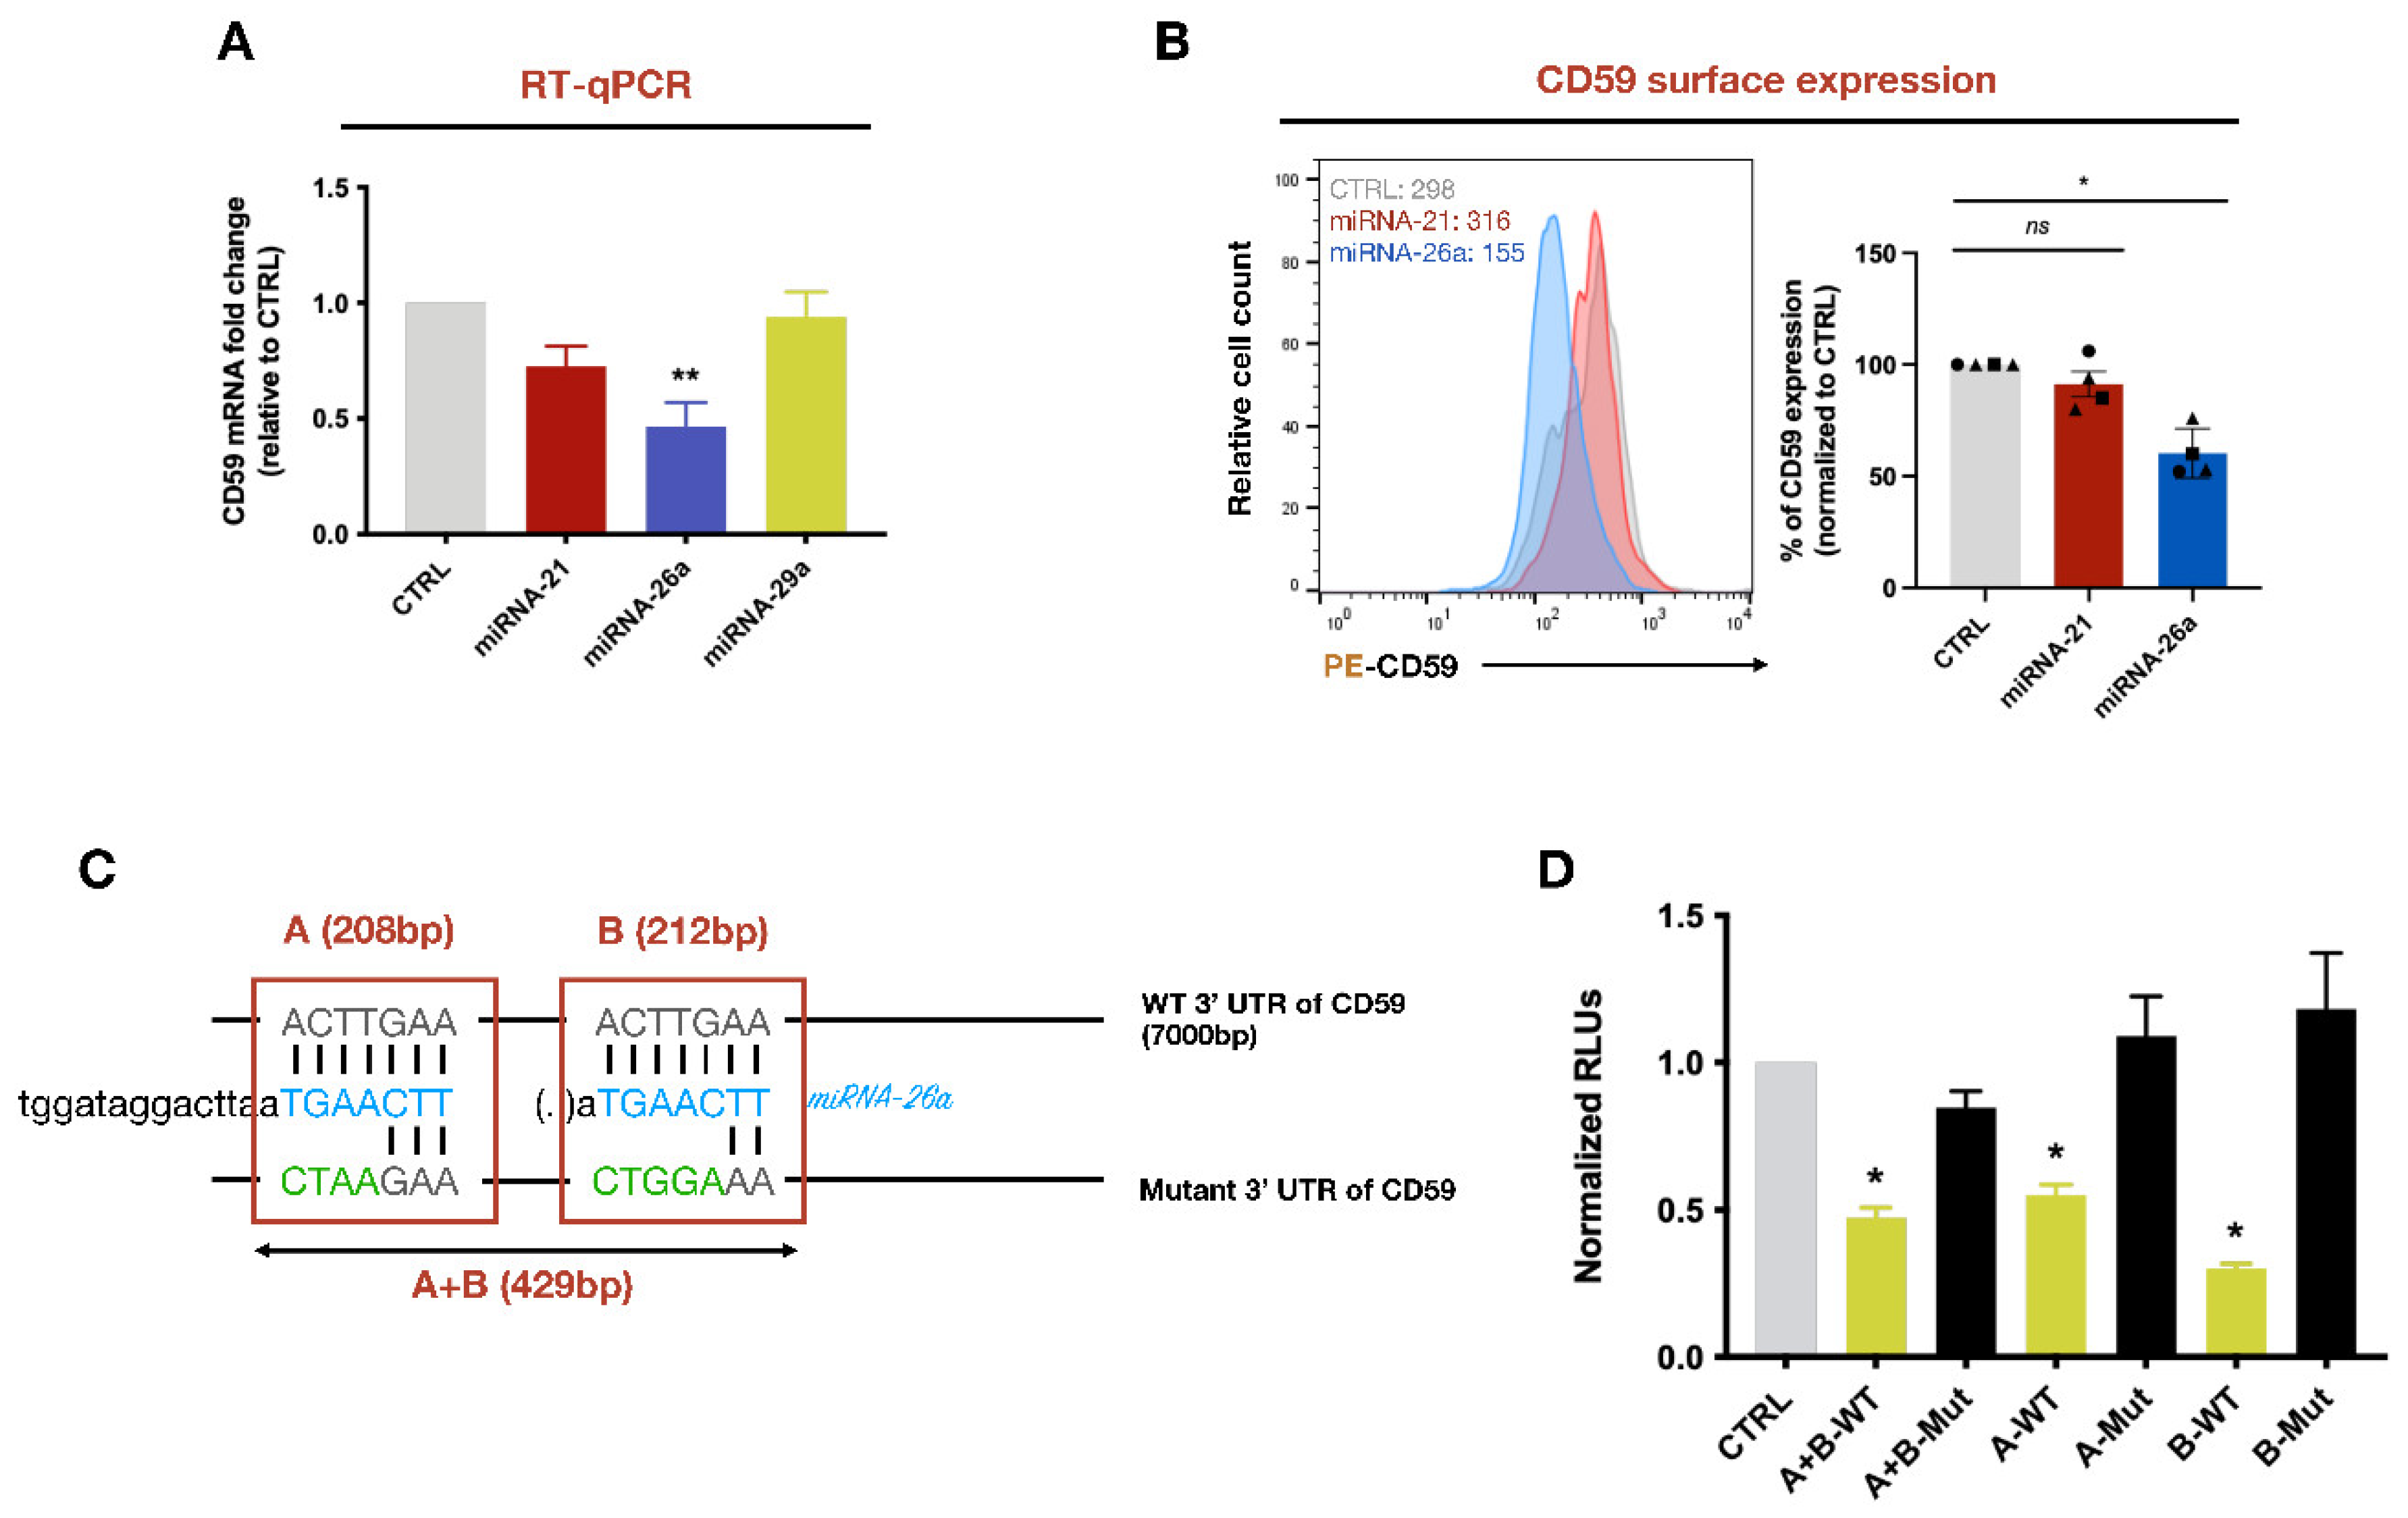
Figure 5.
Reduction of CD59 expression in HIV-1 infected cells and decreased packaging of CD59 in released virions enhance their susceptibility to ADCML. (A) The level of dead cells in GFP-positive populations was measured by flow cytometry and compared between CEM-CD59_Control or CEM-CD59_KO cells exposed to the indicated conditions (PGT121 + normal human serum (NHS) and PGT121 + heat-inactivated human serum (HIHS)). Shown are data for one representative experiment (n=2). (B) Detection of CD59 incorporation in virions produced from HIV-1-infected CEM-CD59_control or CEM-CD59_KO cells by Ab capture assay. Equal amounts of virus released from each cell line was analyzed. Data shown indicate the mean levels of CD59-containing virus as measured by ELISA for p24 (pg/ml) following lysis of anti-CD59 bead-associated virus (background capture with the isotypic control was subtracted). Error bars represent SEM. Statistical significance was determined by the nonparametric Mann-Whitney’s test, values: *p < 0.05. (C) Shown are the normalized total HIV-1 copies of PGT121-treated viruses (with either NHS or HIHS) from CEM-CD59_control or CEM-CD59_KO infected cells as measured by real-time qPCR, following reverse transcription of viral RNA. Values are normalized relative to the mean HIHS condition, which is set at 100%. Error bars represent SEM. Statistical significance was determined by the nonparametric Mann-Whitney’s test, values: **p < 0.01. In all conditions, equal amounts of virus released from each cell line was analyzed. See also Figure S3.
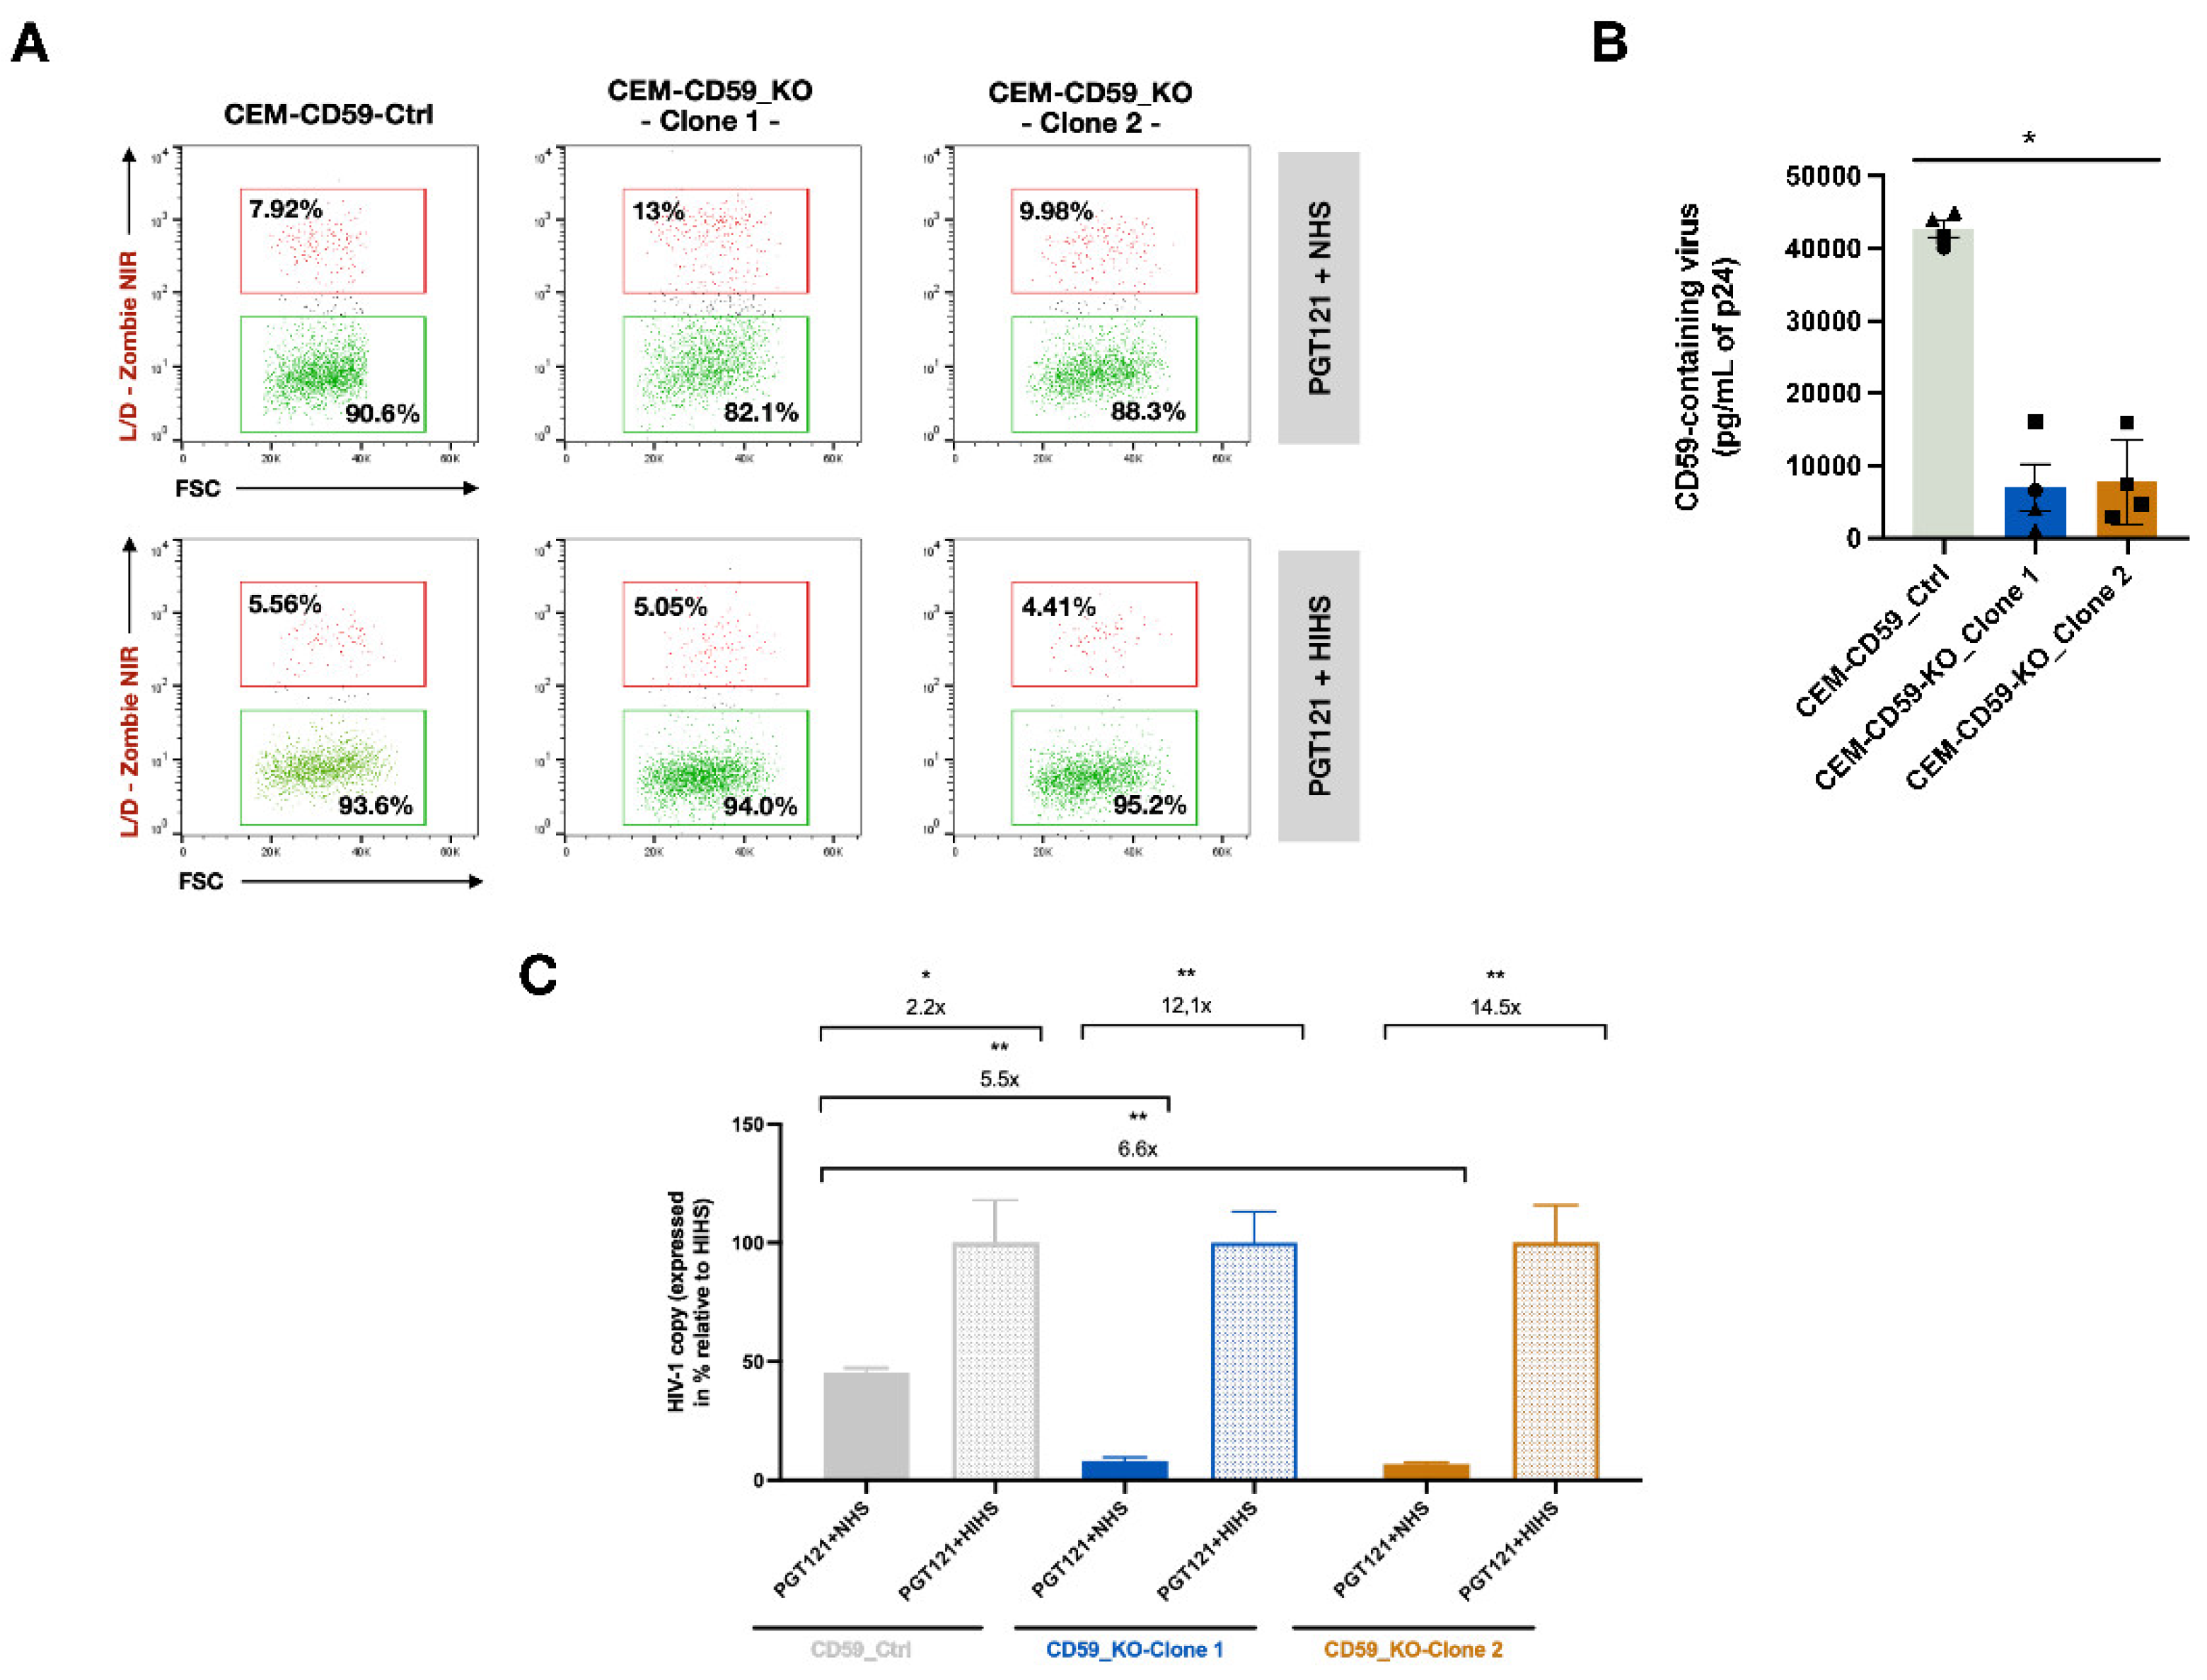
Figure 6.
Enhanced expression of miRNA-26a during HIV-1 infection renders released virions more susceptible to ADCML. (A) Primary CD4+ T-cells were nucleofected with miRNA-26a or a miRNA-control mimics for 72h and infected with HIV-1 for 48h (n=3). Data shown indicate the total HIV-1 produced (as RNA copy numbers of HIV-1) from infected cells as measured by real-time qPCR, following reverse transcription of viral RNA. Error bars represent SEM. (B) Detection and quantification of CD59-containing virus particles by Ab-capture assay of virions produced by infected cells transfected with miRNA-26a or negative control mimics. The left panel indicates the mean level of CD59-containing virus as determined by p24 ELISA (pg/ml) after lysis of virus captured with CD59-antibody-conjugated beads (the capture assay background obtained with the isotypic Ab control was subtracted). The right panel indicates the mean level of CD59-containing virus normalized to the value obtained with the control mimic condition (set at 100%). In all conditions, equal amounts of virus were analyzed. Error bars represent SEM. Statistical significance was determined by the nonparametric Mann-Whitney’s test, values: **p < 0.01. (C) Shown are the normalized total HIV-1 copy numbers of PGT-121-treated viruses from infected cells transfected with either miRNA-26a or negative control mimics, as measured by real-time qPCR, following reverse transcription of viral RNA. Values are normalized relative to the mean of those obtained with HIHS-treated viruses, which were set at 100%. Error bars represent SEM. Statistical significance was determined by the nonparametric Mann-Whitney’s test, values: **p < 0.01. (D) Shown are the normalized total HIV-1 copy numbers of Ab-treated viruses from infected cells transfected with miRNA-26a or negative control mimics as measured by real-time qPCR, following reverse transcription of viral RNA. Values are normalized relative to the mean of those obtained with HIHS-treated viruses, which were set at 100%. Abs were purified from sera of viremic individuals #163 (left panel) or #497 (right panel). Error bars represent SEM. Statistical significance was determined by the nonparametric Mann-Whitney’s test, values: *p < 0.05, ** p < 0.01. In all conditions, equal amounts of virus were analyzed. See also Figure S4.
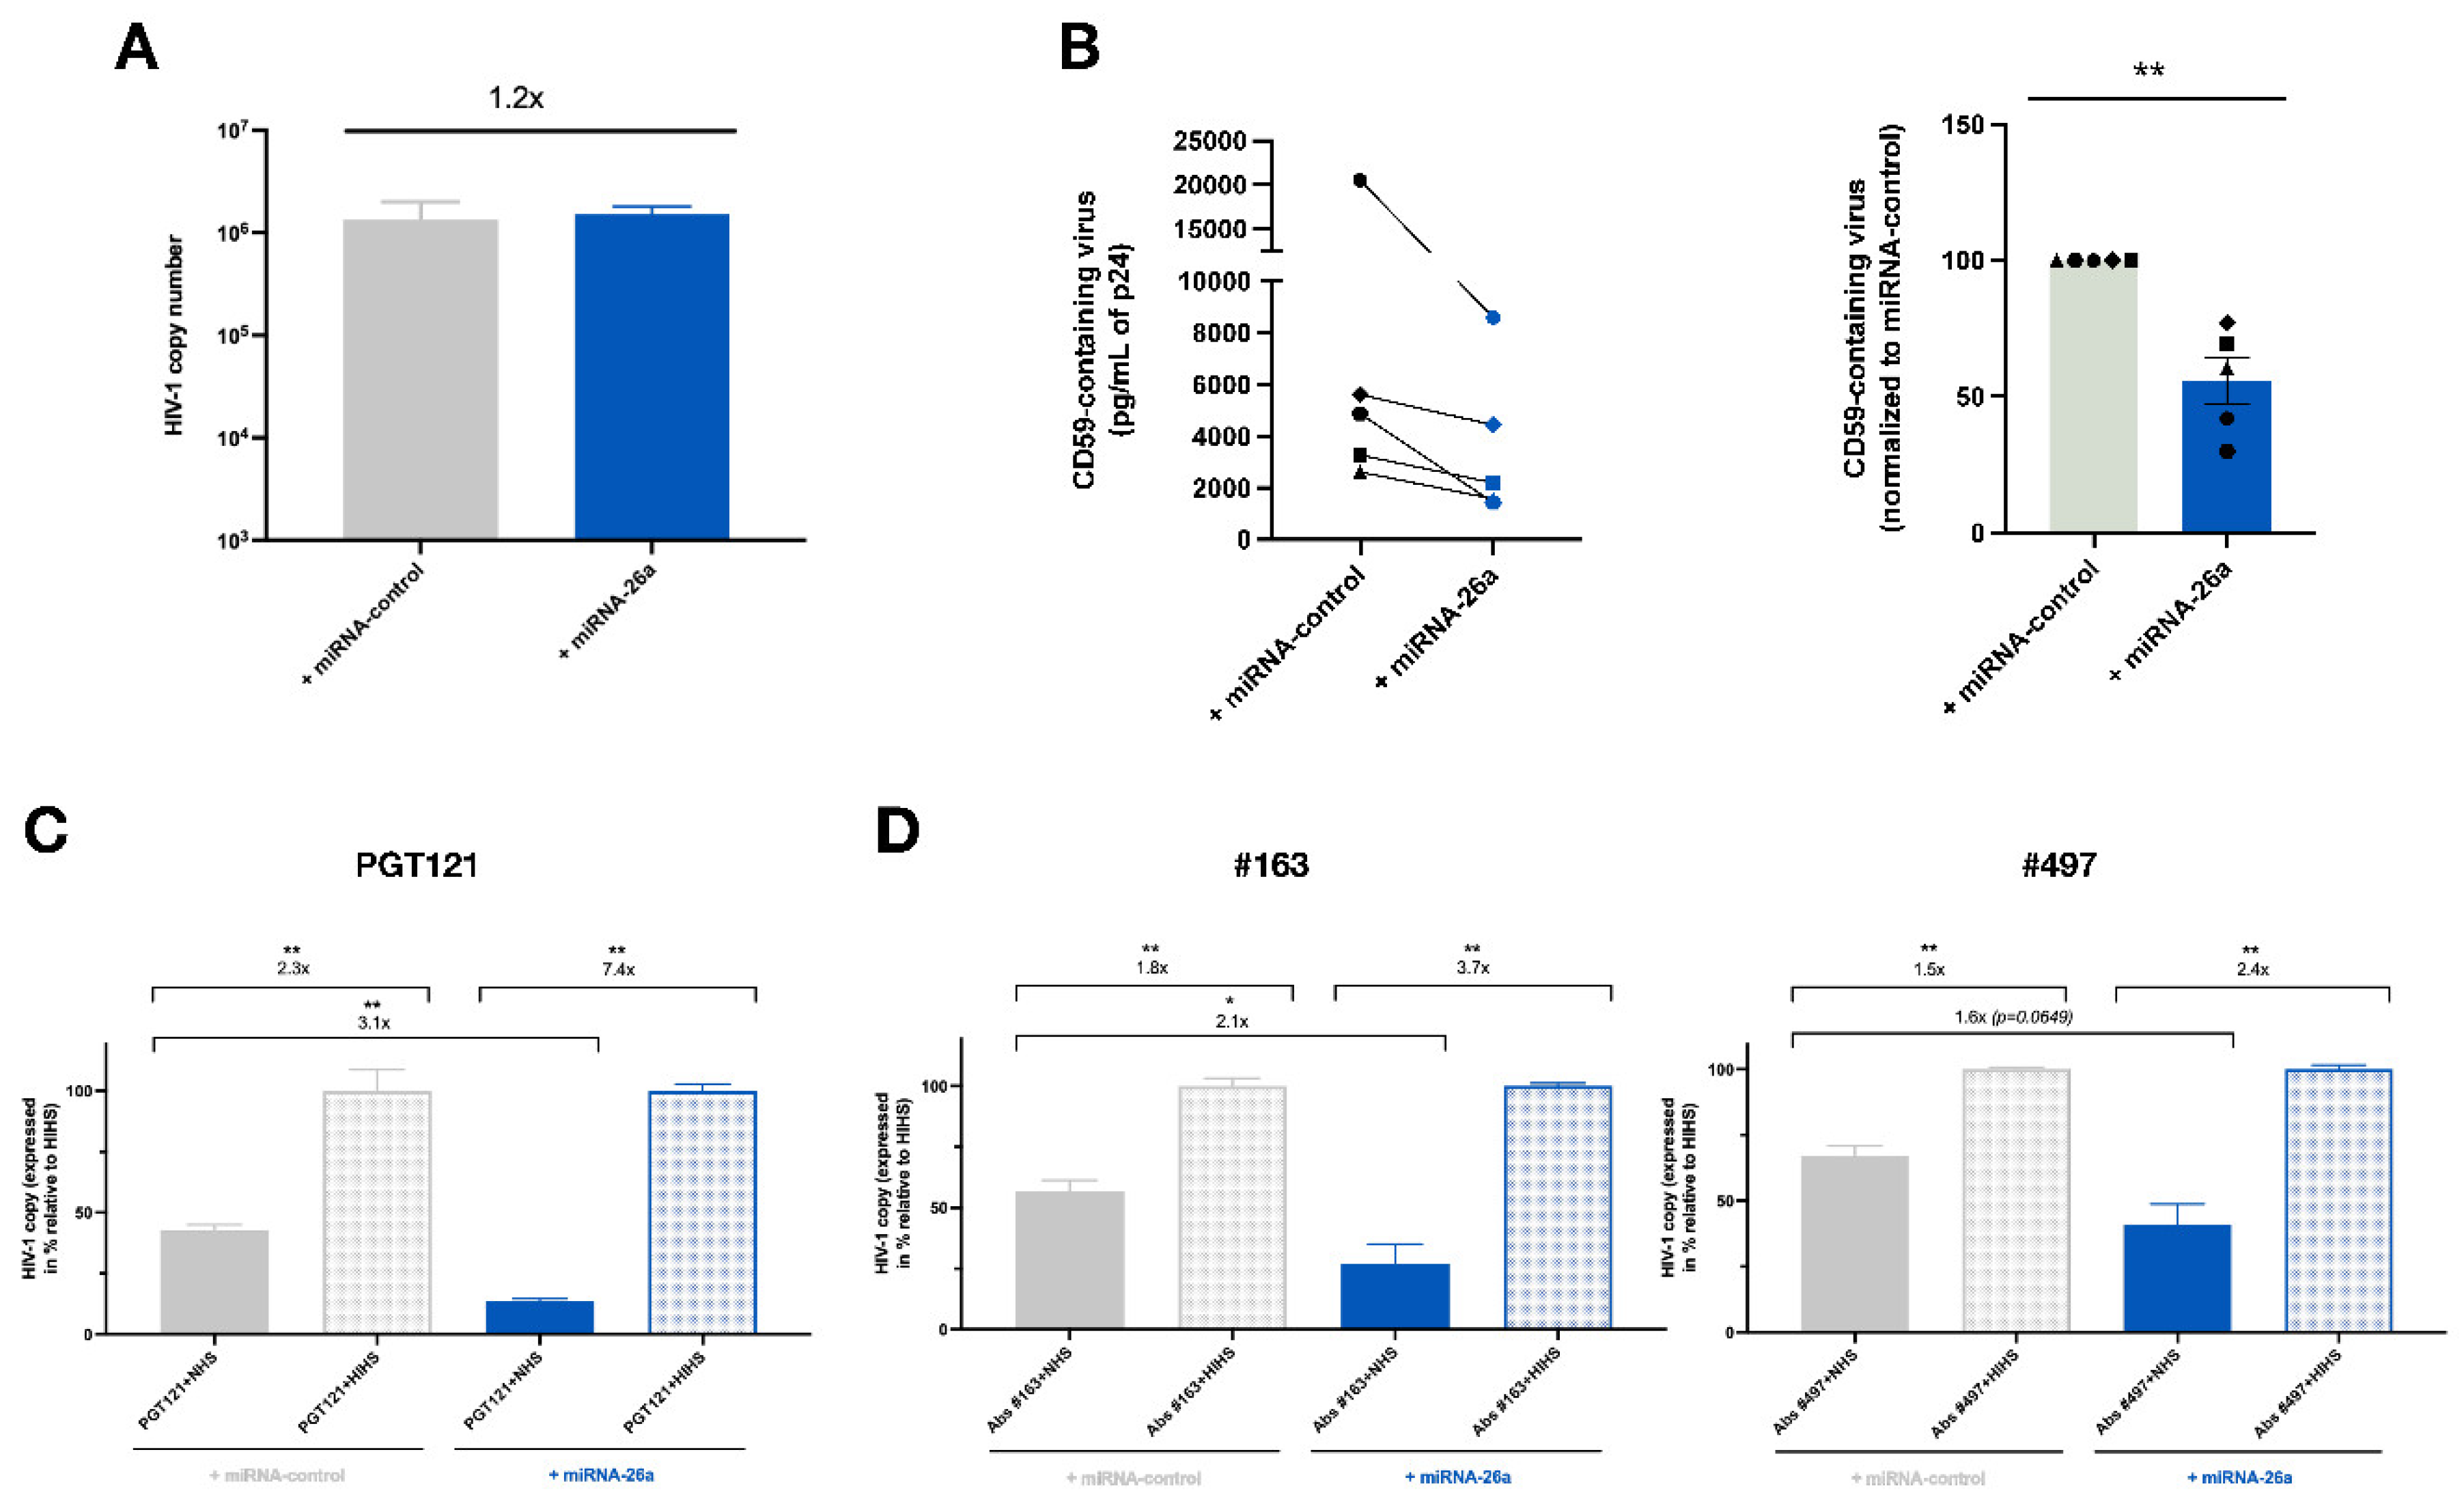
Figure 7.
Analyses of HIV-1 determinants regulating miRNA-26a expression during infection. (A) Primary CD4+ T-cells were pretreated with efavirenz (EFV – 10μM) or raltegravir (RAL - 20μM), infected with NL4.3-ADA-GFP (WT) and their total RNA was extracted. MiRNA-26a levels in uninfected, infected GFP-positive and EFV- or RAL-treated cells were measured by real-time qPCR (n = 5). Shown are the mean fold changes compared to uninfected cells (gray histogram, which is set at 1). Error bars represent SEM. Statistical significance was determined by the nonparametric Mann-Whitney’s test, values: **p < 0.01. (B) Primary CD4+ T-cells were infected with the dual reporter HIV Nef-2A-CRIMZs viruses, which allows the distinction between cells harboring LTR-directed active transcription (E2-Crimson-positive/ZsGreen-positive) from cells harboring LTR-directed inactive transcription (E2-Crimson-negative and ZsGreen-positive cells). The different cell populations were sorted, and their total RNA was extracted. MiRNA-26a expression levels in uninfected (mock), productively, and latently infected CD4+ T-cells were measured by real-time qPCR (n = 6). Shown are the mean fold changes compared to uninfected cells (in gray, which is set at 1). Error bars represent SEM. Statistical significance was determined by the nonparametric Kruskal Wallis test, values: **p < 0.01. (C) Primary CD4+ T-cells were infected with the indicated mutant NL4.3-ADA-GFP viruses and their RNA was extracted 48h post-infection. MiRNA-26a expression in uninfected (mock) and infected GFP-positive cells were measured by real-time qPCR (n = 5). Shown are the mean fold changes compared to mock (gray histogram, which is set at 1). Error bars represent SEM. (D) CEM-SS cells were infected with NL4.3-ADA-GFP (WT) or NL4.3-ADA-GFP (ΔVif) and their RNA extracted 48h post-infection. MiRNA-26a expression levels in uninfected (mock) and infected cells were measured by real-time qPCR (n = 3). Shown are the mean fold change compared to mock (in gray, which is set at 1). Error bars represent SEM. Statistical significance was determined by the nonparametric Mann Whitney’s test, values: *p < 0.05. See also Figure S5.
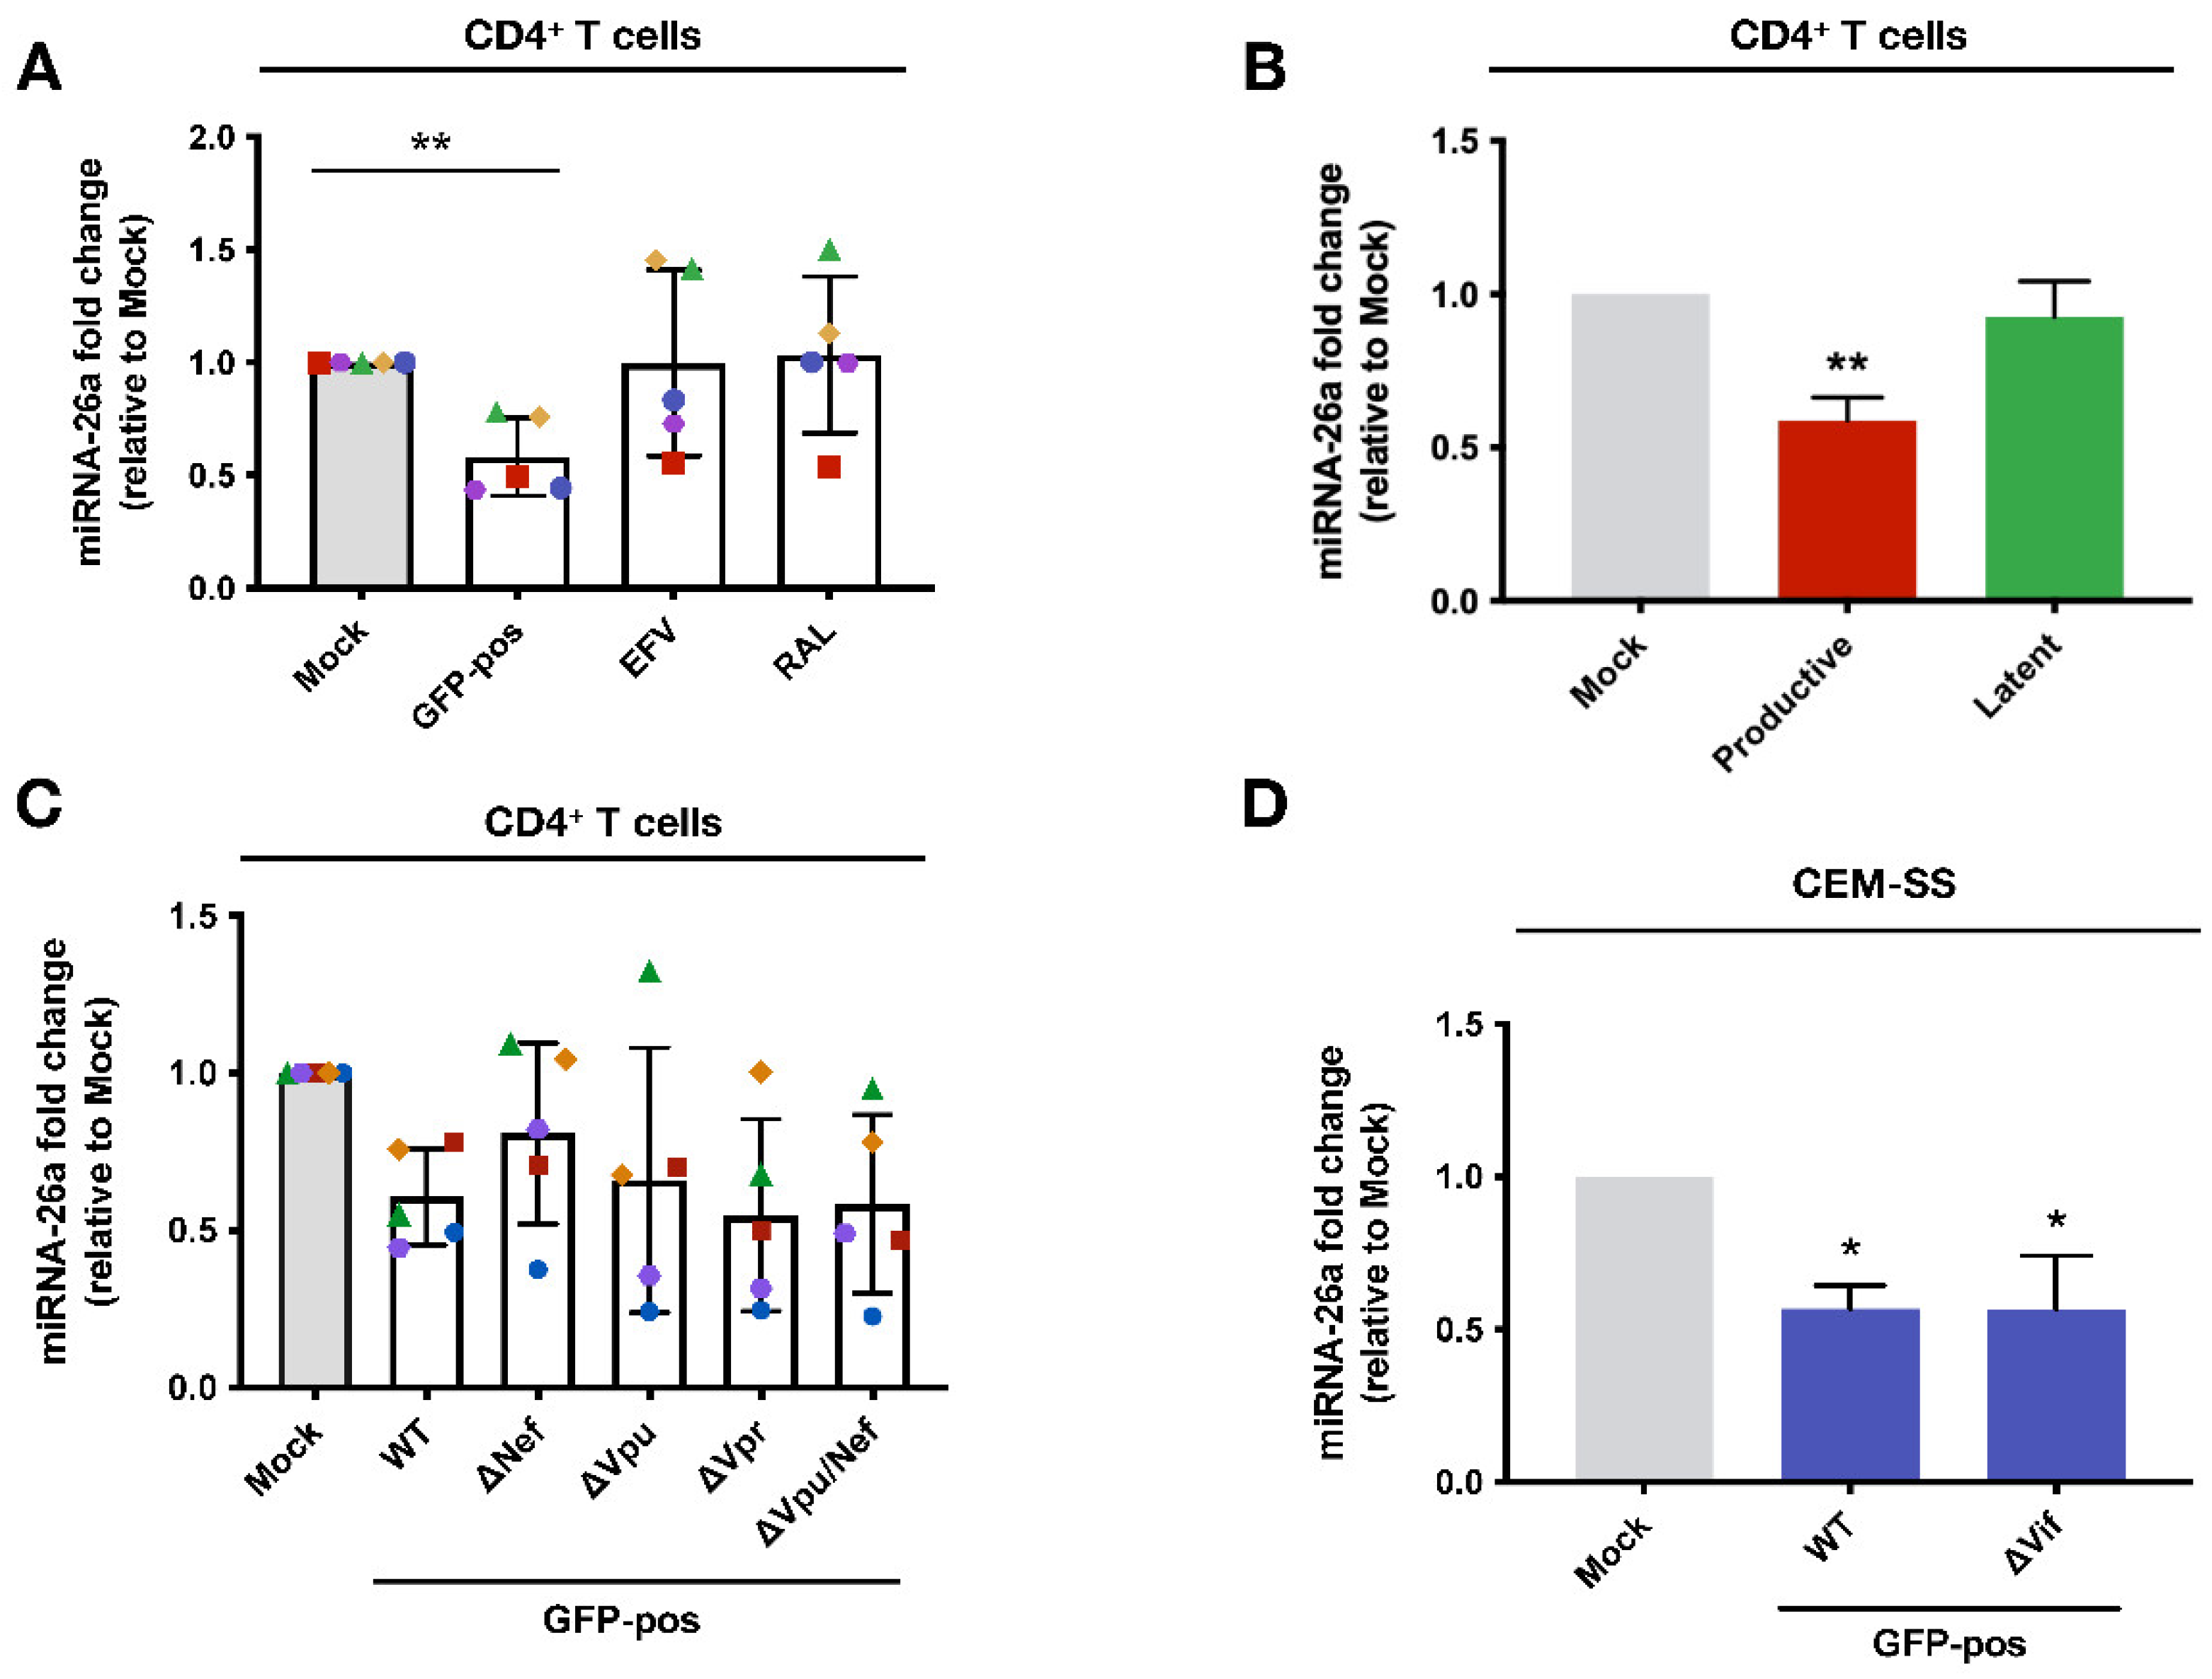
Disclaimer/Publisher’s Note: The statements, opinions and data contained in all publications are solely those of the individual author(s) and contributor(s) and not of MDPI and/or the editor(s). MDPI and/or the editor(s) disclaim responsibility for any injury to people or property resulting from any ideas, methods, instructions or products referred to in the content. |
© 2024 by the authors. Licensee MDPI, Basel, Switzerland. This article is an open access article distributed under the terms and conditions of the Creative Commons Attribution (CC BY) license (http://creativecommons.org/licenses/by/4.0/).
Copyright: This open access article is published under a Creative Commons CC BY 4.0 license, which permit the free download, distribution, and reuse, provided that the author and preprint are cited in any reuse.


