
Submitted:
03 June 2024
Posted:
05 June 2024
You are already at the latest version
Abstract
This research aims to elucidate the organizational patterns of interregional economic interdependence to enhance our comprehension of the national economy's structure at a regional scale. Employing a multilayer network model, this study represents economic interdependence among Indonesian regions, utilizing the InterRegional Input-Output (IRIO) table. Through the application of various metrics, such as degree and strength distribution, assortativity coefficient, and global and local rich club coefficient, to the multilayer IRIO network, we uncover the organizational patterns of economic exchanges between provinces and economic sectors within Indonesia. Our findings demonstrate that a multilayer network approach reveals the heterogeneous and complex structure of the national economy at the regional level. By analyzing the assortativity pattern and global rich-club coefficient, we illustrate that the IRIO network exhibits a hierarchical organization, where significant provincial-sector nodes are interconnected and form dense rich clubs, extending from a few structural cores to peripheral regions. Additionally, we identify distinct connectivity patterns of non-rich nodes based on their incoming and outgoing relations. The insights gained from this study have implications for the macro-control of regional development.
Keywords:
multilayer network
; spatial network
; interregional input-output table
; rich-club phenomenon
; hierarchical organization
1. Intro
Given the expansion of interregional trade and the long-term unbalanced development of the regional economy, understanding the spatial structure of the national economy at the regional level is critical for economic development and resiliency [1,2]. Economic structure refers to the pattern of interactions between the components that make up an economic system [3]. Interactions between economic sectors that implicitly have a location dimension give rise to interregional spatial structures, namely the organization of geographic regions based on underlying interactions, whether caused by the movement of people, goods/services, or information [4]. The organizational pattern of these spatial economic structures strongly influences national economic growth and the resilience of the economic system to the propagation of economic shocks [5,6].
Empirical studies on economic interdependence between regions tend to be carried out in the context of the global economy [7]. Currently, open access to data on interactions between economic sectors across regions on a national scale, ie. sub-national Multi/Inter-Regional Input Output [8] provides an opportunity to conduct scientific exploration of statistical and spatial patterns of interregional economic structure.
This study uses a multilayer network model to represent economic interdependence between regions in Indonesia based on the InterRegional Input-Output (IRIO) table. We then apply several measurements, i.e. degree and strength distribution, assortativity coefficient, and global and local rich club coefficient, to the multilayer IRIO network to reveal the organizational pattern of economic exchange between provinces and economic sectors in Indonesia.
2. Data & Method
2.1. Data
This study analyzes the intermediate flow matrix of the 2016 Indonesian IRIO table published by the Indonesian Central Bureau of Statistics. The intermediate flow matrix records the economic exchanges among 17 sectors and 34 provinces in Indonesia, reflecting their intricate economic relationships (e.g., supply and demand) as well as their interdependence and mutual constraints.

Table 1.
List of sectors in the 2016 Indonesian IRIO table.
| ID | Sectors | ID | Sectors |
| 1 | Agriculture, Forestry & Fisheries | 10 | Information & Communication |
| 2 | Mining & excavation | 11 | Financial Services & Insurance |
| 3 | Processing industry | 12 | Real Estate |
| 4 | Proc. of Electricity & Gas | 13 | Company Services |
| 5 | Water Supply, Waste Management, Waste & Recycling | 14 | Gov. Adm., Defense & Mandatory Social Security |
| 6 | Construction | 15 | Education Services |
| 7 | Wholesale & Retail Trade; Car & Motorcycle Repair | 16 | Health Services & Social Activities |
| 8 | Transportation & Warehousing | 17 | Other Services |
| 9 | Prov. of accommodation, food & drink |
Table 2.
List of provinces in the 2016 Indonesian IRIO table.
| ID | Provinces | ID | Provinces | ID | Provinces |
| 1 | Aceh | 13 | Central Java | 25 | North Sulawesi |
| 2 | North Sumatra | 14 | Yogyakarta | 26 | Central Sulawesi |
| 3 | West Sumatra | 15 | East Java | 27 | South Sulawesi |
| 4 | Riau | 16 | Banten | 28 | Southeast Sulawesi |
| 5 | Jambi | 17 | Bali | 29 | Gorontalo |
| 6 | South Sumatra | 18 | West Nusa Tenggara | 30 | West Sulawesi |
| 7 | Bengkulu | 19 | East Nusa Tenggara | 31 | Maluku |
| 8 | Lampung | 20 | West Kalimantan | 32 | North Maluku |
| 9 | Bangka Belitung Island | 21 | Central Kalimantan | 33 | West Papua |
| 10 | Riau Island | 22 | South Kalimantan | 34 | Papua |
| 11 | Jakarta | 23 | East Kalimantan | ||
| 12 | West Java | 24 | North Kalimantan |
2.2. Method
- a.
- Multilayer model
We obtain from the intermediate matrix of the IRIO table set of interlayer and intralayer flow of goods and services to build the multilayer input-output network. Interlayer flows are between pairs of the same or different provinces in different sectors, and intralayer flows are between pairs of nodes of different provinces within the same sector. A multilayer network is defined as [9,10,11]. is a set of weighted directed graphs representing each economic sector layer, . For layer , consists of (i) , a set of nodes representing provinces, ; (ii) , a set of directed edges , , between pair of nodes within same layer (intralayer), which indicates the existence of economic exchange between the two provinces. is a set of directed edges between pairs of nodes from different layers (interlayer), .
Each edge in the interlayer and intralayer network has a weight that indicates the amount of economic exchange that occurs between two provinces within the same sector or across sectors. We use the intermediate matrix Z of IRIO to identify and assign weights to the network edges by constructing the supra-adjacency matrix as follows,
where is the intralayer adjacency matrix and is the intralayer weight between nodes and . The elements of the interlayer adjacency matrix corresponding to the set of couplings are defined as
where is the intralayer weight between nodes and . The supra-adjacency matrix for the multilayer network is then equal to .
- b.
- Degree and strength distribution
In the directed weighted network M, a certain node has the outgoing and incoming degrees, as follows,
The outgoing strength denotes the sum of the weight of edges pointing from node to other nodes, and the incoming strength denotes the number of edges pointing from other nodes to node , as follow,
- c.
- Assortativity
Assortativity is a fundamental property of complex networks that describes the tendency of nodes to connect with other nodes that have the same (assortative) or different (disassortative) connectivity features [12]. In this study, we use the formula proposed by Yuan et al. [13] to measure the degree of assortativeness in a multilayer IRIO network which is a weighted directed graph. There are 4 types of assortativity coefficients based on the combination of in- and out-strength of pairs of nodes. The In/Out-strength assortativity coefficient is defined as follows [13],
where is is the total weight, is the in-strength of source vertex , is the out-strength of target vertex ,
Are, respectively, the weighted mean of the in-strength of source vertices and the out-strength of target vertices, and
are the associated weighted standard deviations. A positive (negative) suggests assortative-mixing (disassortative mixing), and zero assortativity indicates no obvious pattern of assortative- or disassortative-mixing.
- d.
- Rich-club coefficient
The rich-club phenomenon describes the tendency of prominent elements to engage in stronger interactions among themselves than would be randomly expected [14]. In this study, by using node in/out strength as a richness parameter, we calculate weighted directed rich clubs coefficient as follows [15]:
where is the richness parameter, describes the sum of the weights on these edges, and , rank is the lth ranked weights on the edges of the network. Overall, the coefficient measures the fraction of weights shared by the rich nodes compared with the total amount they could share if they were connected through the strongest links available in the network [16]. Indeed, the evaluation of the weighted connectedness of a rich club requires normalization through comparison to randomized controls with the same richness sequence. Then, the rich-club effect is measured as follows:
where a larger than 1 indicates the existence of the rich-club characteristic.
The global rich-club coefficient is a critical measure of the interconnection among rich nodes and it identifies the rich-club phenomenon of the entire network. However, the relationship between the individual node and the rich nodes cannot be identified. Here, we apply two metrics based on Opsahl et al. [18] to examine how each node is related to the rich nodes
where is the set of rich nodes . If is defined as the richness parameter, represents the sum of the edge weights pointing from to . denotes the number of edges pointing from to . is used to evaluate the preference of the rich node pointing to . Meanwhile, denotes the sum of edge weights pointing from to when is defined as the richness parameter. denotes the number of edges pointing from to rich node . Correspondingly, is used to evaluate the preference of node pointing to rich node . If node is not connected to rich-club nodes, the value of is set to 1. When > 1, it can be inferred that a node concentrates more attention on the rich nodes. Conversely, < 1 indicates that the node is preferentially connected to the non-rich nodes. In particular, equals 1 when the node is only attached to the rich nodes or non-rich nodes.
3. Analysis
We apply several indicators, namely degree, strength, assortativity coefficient, and global and local rich club coefficient, to reveal the interregional spatial structure that emerges from economic exchange between provinces and economic sectors in Indonesia.
- a.
- Basic network properties
Table 3 shows the basic properties of the multilayer IRIO network. This network has a high density where the ratio of the total number of actual edges to the total number of possible edges is ~0.9. This is not surprising because each economic sector requires input supplies from various other economic sectors. On average, given that the total nodes are 578, each node receives and supplies goods/services from and to 89 percent of other nodes, with a median in-degree/out-degree of 520.5 and 577. The intralayer and interlayer structures have the same characteristics, showing that economic interactions occur intensively across sectors and regions.
In contrast, the node in/out-strength provides non-trivial information about the intensity of connectivity of the multilayer IRIO network and demonstrates the importance of accounting for the intensity of economic exchange across sectors and locations. The order of magnitude between minimum, maximum, and median values of in/out-strengths are very large, with coefficient of variation of ~2.8 dan ~2.6. To further investigate the overall heterogeneity level of trading intensity between locations within and across sectors, we compute the entropy of in- or out-strength [9]. In particular, entropy is equal to zero in the limiting case where the entire value traded in the system is concentrated on one strength. Therefore, the higher the value of entropy, the more uniformly the total value traded in the system is distributed across the various in- and out-strengths.
As shown in Table 3, the entropy of single layer representation of IRIO table has a larger value than multilayer network, suggesting that the flow intensity between locations becomes more uniformly distributed at a global level when transactions are aggregated within a location. In other words, as we move to a complex structure of multilayer representation, we would find that a small set of provinces tends to attract or distribute a disproportionally large amount of the total value traded in the system. The comparison between the entropy of intralayer and interlayer structure suggests that there is much more diversity in the way value is distributed across locations within sectors than transactions between locations among different industries. These findings indicate that multilayer connectivity among locations is an important feature of the IRIO network where simplifying the way we represent the structure would result in a substantial loss of information.
The heterogeneity of strength connectivity among nodes is clearly shown in Figure 1. The histogram of in- and out-strength in multilayer, intra, and interlayer structures seems to be characterized by heavy tail patterns, suggesting the network might be more vulnerable to perturbations than expected for a random network. Indeed, as shown in Table 4, we find that the empirical in- and out-strength ccdf in all structures are characterized by a log-normal distribution, which is a heavy tail distribution. The log-normal provides an adequate fit to all in- and out-strength where the log-likelihood ratio test between log-normal versus other distributions has a large positive value (p<0.01) [17]. This indicates that large economic exchanges between locations within and/or across sectors are frequent but not as frequent as would be implied by a power law or scale-free distribution.
- b.
- Assortativity
Table 5 presents a collection of assortativity coefficients for all strength and structural types. Our first observation is that most of the coefficients have positive values, except for the in-out strength type in multilayer and interlayer structures and the in-in type in interlayer structures. This means that the multilayer IRIO network has an assortative structure, indicating the preference of provincial sector nodes to connect with other nodes of similar strength.
However, if seen from the magnitude of the coefficient, the multilayer structure has weak disassortativity, while the intralayer structure for all types of strength has moderate strong assortativity. Take the out-in assortativity as an example. The positive coefficient suggests that provincial-sector nodes with large inputs are likely to take high transaction volumes from other nodes that have high output in the network. This assortative pattern is more obvious in the intralayer structure, indicating that economic transactions among provincial nodes from the same sector are very closely connected based on similarity of transaction strength. On the other hand, the high volume of transactions between provincial-sector nodes within the province supports the tendency for regional fragmentation [1], resulting in a negligible assortativity pattern in interlayer and multilayer structures.
- c.
- Rich Club
The assortativity coefficient can describe the global characteristics of the nodes in the network. However, it lacks a detailed description of the prominent subgroup, which can be complemented by the rich-club coefficient. As shown previously, uneven economic exchange means that some provincial-sector nodes play a key role in the IRIO network. Those prominent nodes form an oligarchic rich group when they preferentially interact with one another while preserving their connections to not-rich nodes [14].
In Figure 2, shows general upward trends, which are mainly greater than 1. A clear rich-club characteristic in the IRIO network is confirmed, and with the improvement of the in- and out-strength level, is more prominent. Considering the assortativity pattern and the global rich-club coefficient together, these findings show that the IRIO network has a hierarchical organization in which prominent provincial-sector nodes are not only interconnected but also form dense rich clubs, extending from the few structural cores into peripheral regions. The aggregation of prominent province-sector nodes into a rich club suggests that these nodes act as strong collective entities that might provide a certain level of resilience to the interregional economic system, in the event of malfunction of one of its key nodes.
To reveal the connection between the non-rich and the richclub provinces we calculated the local rich-club coefficient of the non-rich nodes on multi-rich scales. We selected two maximum in and out-strength values, i.e. 0.9 and 0.99 strength percentile, as the demarcation indicators for the selection of the rich-club nodes. Then we calculate the local rich-club coefficients of non-rich provincial-sectors nodes and divide the non-rich nodes into two categories: (i) , the first type of non-rich nodes tends to interact with rich-club nodes; (ii) , the second type of non-rich nodes tends to connect with other non-rich nodes.
Table 7 shows the specific quantity and proportion of the two types of non-rich nodes on the multi-rich scales. For out-strength richness parameter, Table 7 shows that most of the non-rich nodes are of the first type, indicating that a majority of the non-rich nodes are greatly affected by the rich-club nodes. This means that majority of provincial-sector nodes that are not rich intensively supply their production output to the rich provincial-sector nodes. Things are different for local rich clubs based on in-strength richness parameters. As shown in Table 7, the proportion of the two types of non-rich nodes is almost equal. This pattern shows that the non-rich provincial-sector nodes meet their production input needs from the non-rich and rich provincial-sector nodes.
Table 6.
Local rich-club coefficients on multi-rich scales.
| Richness parameter | Out-strength percentile | In-strength percentile | ||
| 0.9 | 0.99 | 0.9 | 0.99 | |
| Rich Club Node | 57 | 5 | 57 | 5 |
| ϕlocal >1 | 514 | 562 | 315 | 351 |
| ϕlocal < 1 | 7 | 11 | 206 | 222 |
Figure 3 shows the spatial position of rich and non-rich provincial-sector nodes. For out-strength richness parameter, Figure 3 shows that the Real Estate sector and Proc. The Electricity & Gas sector dominates the second type of non-rich provincial sector node, while its spatial position does not have a clear pattern. Meanwhile, for the out-strength richness parameter, Figure 3 also shows that the second type of non-rich provincial-sector nodes is dominated by sectors such as Proc. of Electricity & Gas, Water Supply, Waste Management, Waste & Recycling, Construction, Real Estate, Company Services, Gov. Adm., Defense & Mandatory Social Security, Education Services, Health Services & Social Activities, and Other Services. Different from before, the locations of the second type of non-rich provincial sector nodes are spread across provinces outside Java.
From the previous analysis, it can be inferred that there are a small number of provincial-sector nodes in the multilayer IRIO network which constitute the core of national production structure and are the hubs for the interregional supply chain. As shown in Figure 3 and Table 8, based on in- and out-strength richness parameters, Jakarta, West Java, Central Java, East Java, and Riau become the core structure of the IRIO network. The two most dominant sectors are Agriculture, Forestry & Fisheries sector, and Processing industry. The rich club members are dominated by provinces located on the island of Java, showing the importance of the position of the Java region, as the most populous region in Indonesia, in the national production structure, and also indicating the unbalanced regional economic development in Indonesia. The number of core nodes increases as the richness parameter decreases. For strength percentile 0.9, rich club members are spread across four of the six largest islands in Indonesia, namely Java, Sumatra, Kalimantan, and Sulawesi.
Table 7.
The rich-club nodes in the multilayer IRIO network.
| Threshold | Type | Province | Sector |
| 0.99 | Out-strength | Jakarta; West Java; Central Java; East Java | Wholesale&Retail Trade, Car&Motorcycle Repair; Corporate Services; Processing ind. |
| In-strength | Riau; Jakarta; West Java; Central Java; East Java | Processing industry; Construction | |
| 0.9 | Out-strength | North Sumatra; Riau; South Sumatra; Lampung; Jakarta; West Java; Central Java; East Java; Banten; Central Kalimantan; East Kalimantan; South Sulawesi | Agriculture, Forestry & Fisheries; Mining & Quarrying; Processing Industry; Electricity & Gas Proc.; Construction; Wholesale & Retail Trade; Car & Motorcycle Repair; Transportation & Warehousing; Information & Communication; Financial Services & Insurance; Real Estate; Company Services |
| In-strength | North Sumatra; Riau; Jambi; South Sumatra; Lampung; Kep. Riau; Jakarta; West Java; Central Java; East Java; Banten; Bali; Central Kalimantan; South Kalimantan; East Kalimantan; South Sulawesi | Agriculture, Forestry & Fisheries; Mining & excavation; Processing industry; Proc. of Electricity & Gas; Water Supply, Waste Management, Waste & Recycling; Construction; Wholesale & Retail Trade; Car & Motorbike Repair; Transportation & Warehousing; Prov. of Accommodation, Food & Drink; Information & Communication; Financial & Insurance Services; Real Estate; Corporate Services; Gov. Adm., Defense & Mandatory Social Security; Education Services; Health Services & Social Activities; Other Services |
4. Concluding Remarks
In this study, we build and analyze the multilayer network of intranational supply chains based on the 2016 Indonesia interregional input-output table (IRIO). We show that implementing a multilayer network could uncover the heterogeneous and complex structure of the national economy at the regional level. The entropy of single layer representation of IRIO table has a larger value than multilayer network, suggesting that the trade intensity between provinces becomes more uniformly distributed at an aggregate level.
The comparison between the entropy of intralayer and interlayer structure suggests that there is much more diversity in the way value is distributed across provinces within sectors than transactions between provinces among different industries. The distribution of in- and out-strength in multilayer, intra, and interlayer structures is characterized by a log-normal distribution, which is a heavy tail distribution. These findings indicate that multilayer connectivity is an important feature of the IRIO network where simplifying the way we represent the structure would result in substantial loss of information.
We analyze the global network configuration using macroscopic characteristics based on the assortativity coefficient, and global rich-club coefficient and demonstrate the existence of assortativity pattern and the rich-club characteristic in the multilayer IRIO network. These findings indicate that the IRIO network has a hierarchical organization in which prominent provincial-sector nodes are not only interconnected but also form dense rich clubs, extending from the few structural cores into peripheral regions.
To better understand the connection between the non-rich and the richclub nodes we calculated the local rich-club coefficient of the non-rich nodes on multi-rich scales. We reveal different connectivity patterns of non-rich nodes based on their incoming and outgoing relations. Based on out-strength richness parameter, majority of the non-rich nodes are greatly affected by the rich-club nodes. Meanwhile, based on in-strength richness parameters, the non-rich provincial-sector nodes meet their production input needs from the non-rich and rich provincial-sector nodes.
Exploration of interregional spatial structures has important theoretical and practical significance in regional planning and development. Overall, our analysis of the spatial structure of interregional input-output networks using a multilayer network framework improves our understanding of the complex organization of national economies at the regional level. All the findings in this study produce insights and implications for macro control of regional development.
Referencess
References
- T Wang, S Xiao, J Yan, P Zhang. Regional and sectoral structures of the Chinese economy: A network perspective from multi-regional input–output tables. Physica A: Statistical Mechanics and its Applications.,581():126196, 2021. [CrossRef]
- M Gomez, S Garcia, and S Rajtmajer, S. Fragility of a multilayer network of intranational supply chains. Applied Network Science., 5():,2020. [CrossRef]
- S Thakur. Fundamental economic structure and structural change in regional economies: A methodological approach. Region et Development., 33(): 9–38,2011.
- J P Rodrigue, C Comtois and B Slack. The geography of transport systems. Routledge, London, 2006.
- V Carvalho. From micro to macro via production networks. J.Econ.Perspect.,28(4): 23–48,2014. [CrossRef]
- F Blöchl, F Theis, F Vega-Redondo and E Fisher. Vertex centralities in input–output networks reveal the structure of modern economies. Phys. Rev.E., 83(4), 2011. [CrossRef]
- J S Lee. Trade and Spatial Economic Interdependence: U.S. Interregional Trade and Regional Economic Structure. PhD Thesis, University of Illinois, Urbana-Champaign, 2011.
- F Faturay, M Lenzen and K Nugraha. A new subnational multi-region input–output database for Indonesia. Economic Systems Research., 29(2): 234–251,2017. [CrossRef]
- L Alves, G Mangioni, F Rodrigues, P Panzarasa and Y Moreno. Unfolding the Complexity of the Global Value Chain: Strength and Entropy in the SingleLayer, Multiplex, and Multi-Layer International Trade Networks. Entropy., 20(12):, 2018. [CrossRef]
- S Garcia, M Gomez, R Rushforth, B L Ruddell and Mejia, A. Multilayer Network Clarifies Prevailing Water Consumption Telecouplings in the United States. Water Resource Research., 57(7):,2021. [CrossRef]
- P Bartesaghi, R Grassi, G P Clemente and D T Luu. The multilayer architecture of the global input-output network and its properties. Journal of Economic Behavior & Organization., 204(): 304–341, 2022. [CrossRef]
- M E J Newman. Assortative mixing in networks. Phys. Rev. Lett., 89 (20):, 2002. [CrossRef]
- Y Yuan, J Yan, P Zhang. Assortativity coefficients for weighted and directed networks, J. Complex Netw., 9 (2):, 2021.
- S Zhou and R J Mondragon,. The rich-club phenomenon in the internet topology. IEEE Communications Letters., 8(3): 180–182. 2003. [CrossRef]
- J Alstott, P Panzarasa, M Rubinov, E T Bullmore and P E Vértes. A unifying framework for measuring weighted rich clubs. Sci Rep., 4():7258,2014. [CrossRef]
- V Colizza, A Flammini, M A Serrano A Vespignani. Detecting rich-club ordering in complex networks. Nature Physics., 2(2): 110, 2006. [CrossRef]
- J Alstott, E Bullmore and D Plenz. Powerlaw: A Python package for analysis of heavy-tailed distributions. PloS One., 9(1):, 2014. [CrossRef]
- T Opsahl. Structure and evolution of weighted networks. PhD Thesis, Queen Mary College University of London, 2009.
Figure 1.
Histogram of in- and out-strength distribution in three types of structures: a. multilayer; b. Intralayer; c.Interlayer.
Figure 1.
Histogram of in- and out-strength distribution in three types of structures: a. multilayer; b. Intralayer; c.Interlayer.
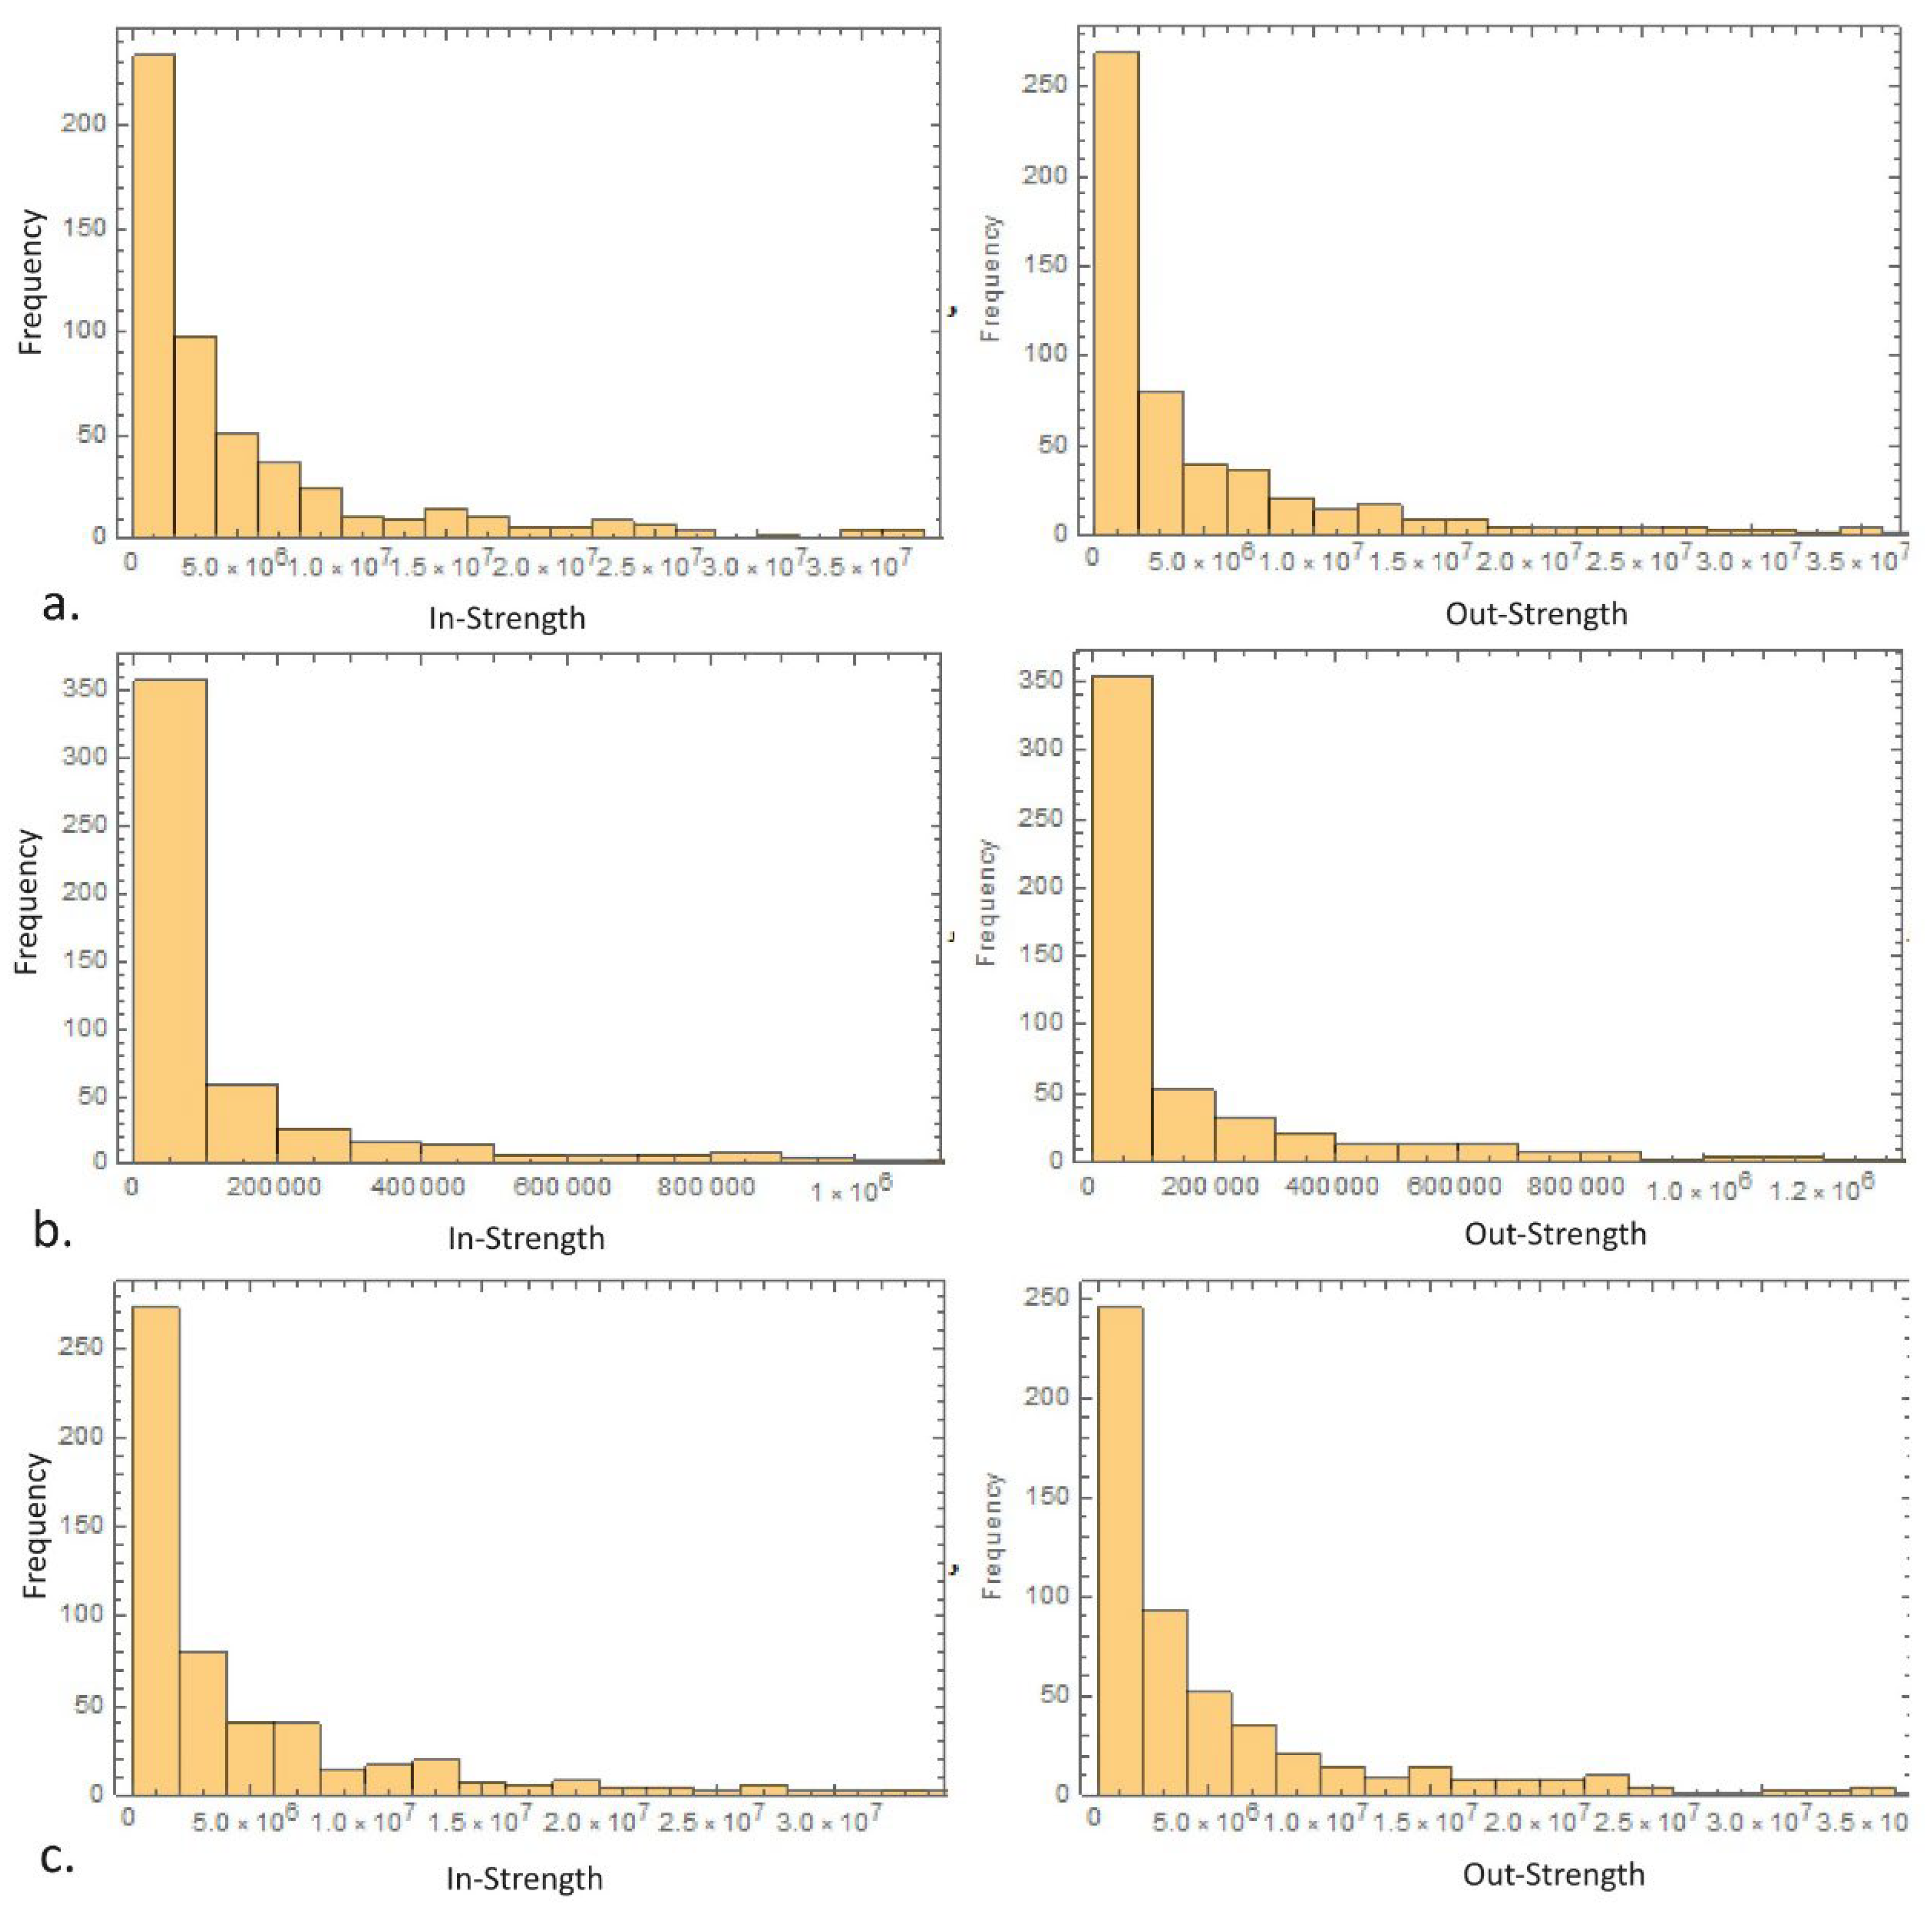
Figure 2.
Global rich-club coefficients in the multilayer IRIO network: (a) In Strength; (b) Out-Strength.
Figure 2.
Global rich-club coefficients in the multilayer IRIO network: (a) In Strength; (b) Out-Strength.
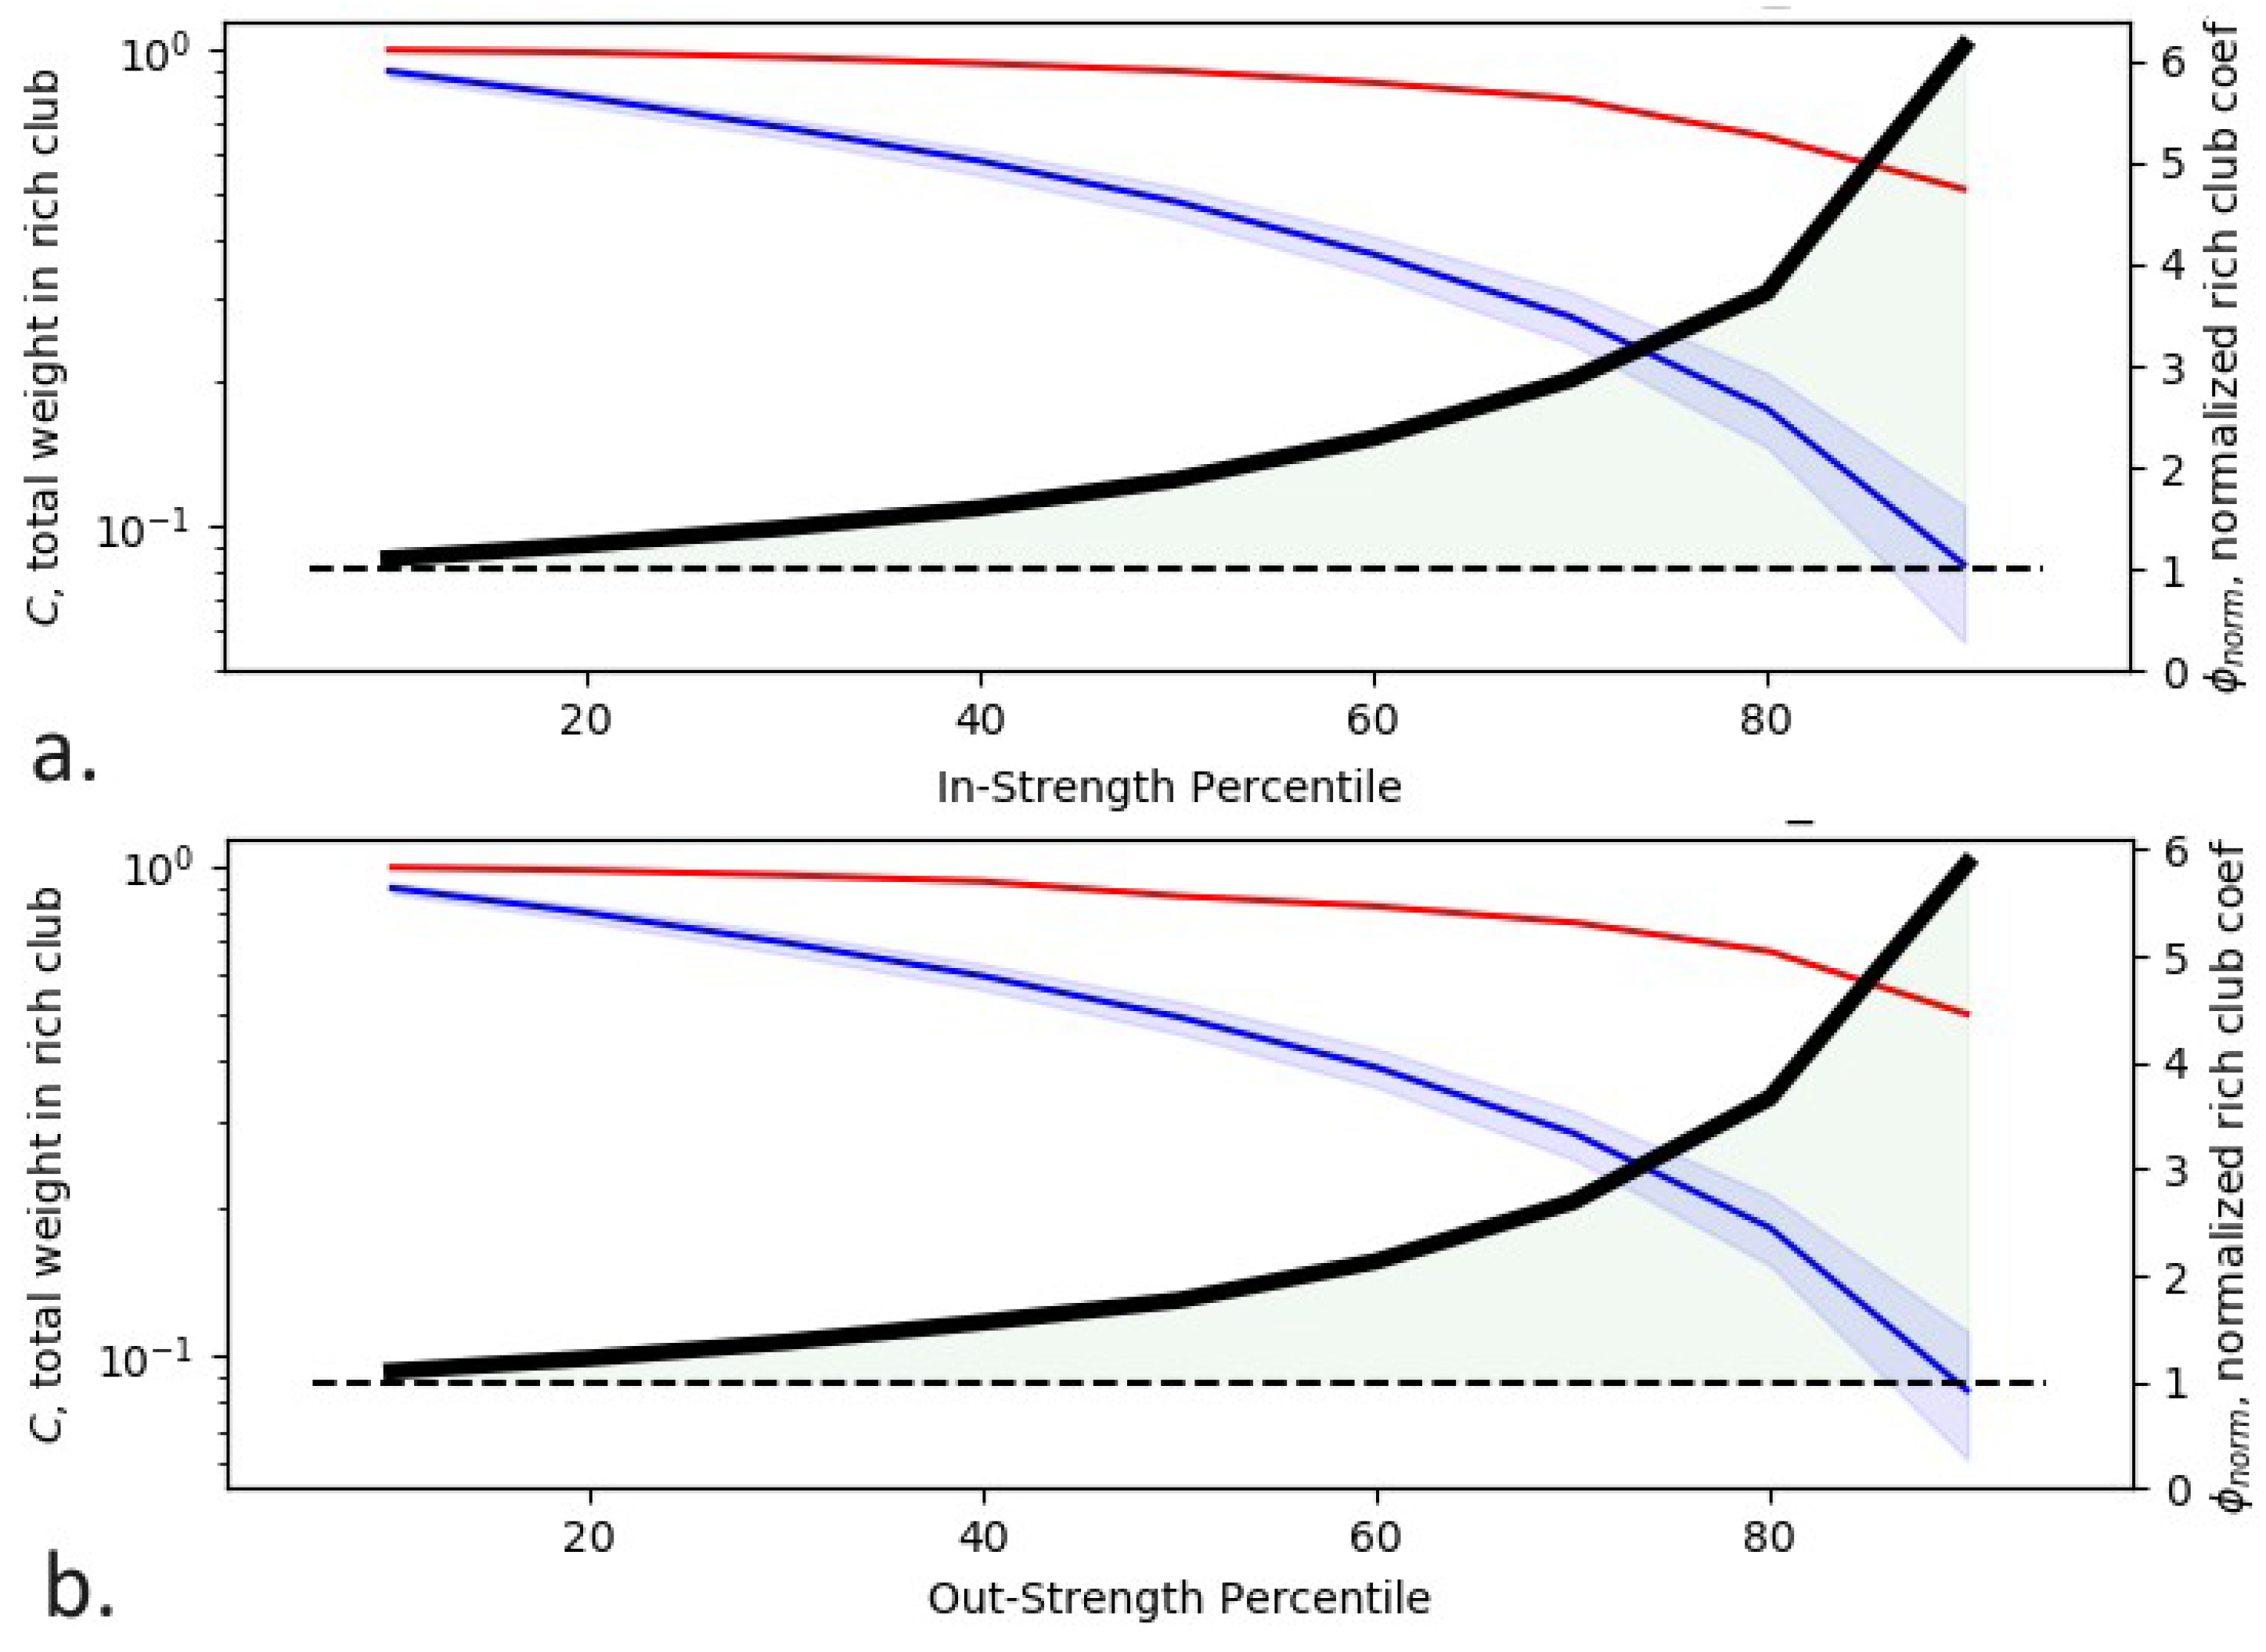
Figure 3.
Local rich-club coefficients of rich and non-rich nodes for: a. 0.99 in/out-strength percentile; b. 0.90 in/out-strength percentile.
Figure 3.
Local rich-club coefficients of rich and non-rich nodes for: a. 0.99 in/out-strength percentile; b. 0.90 in/out-strength percentile.
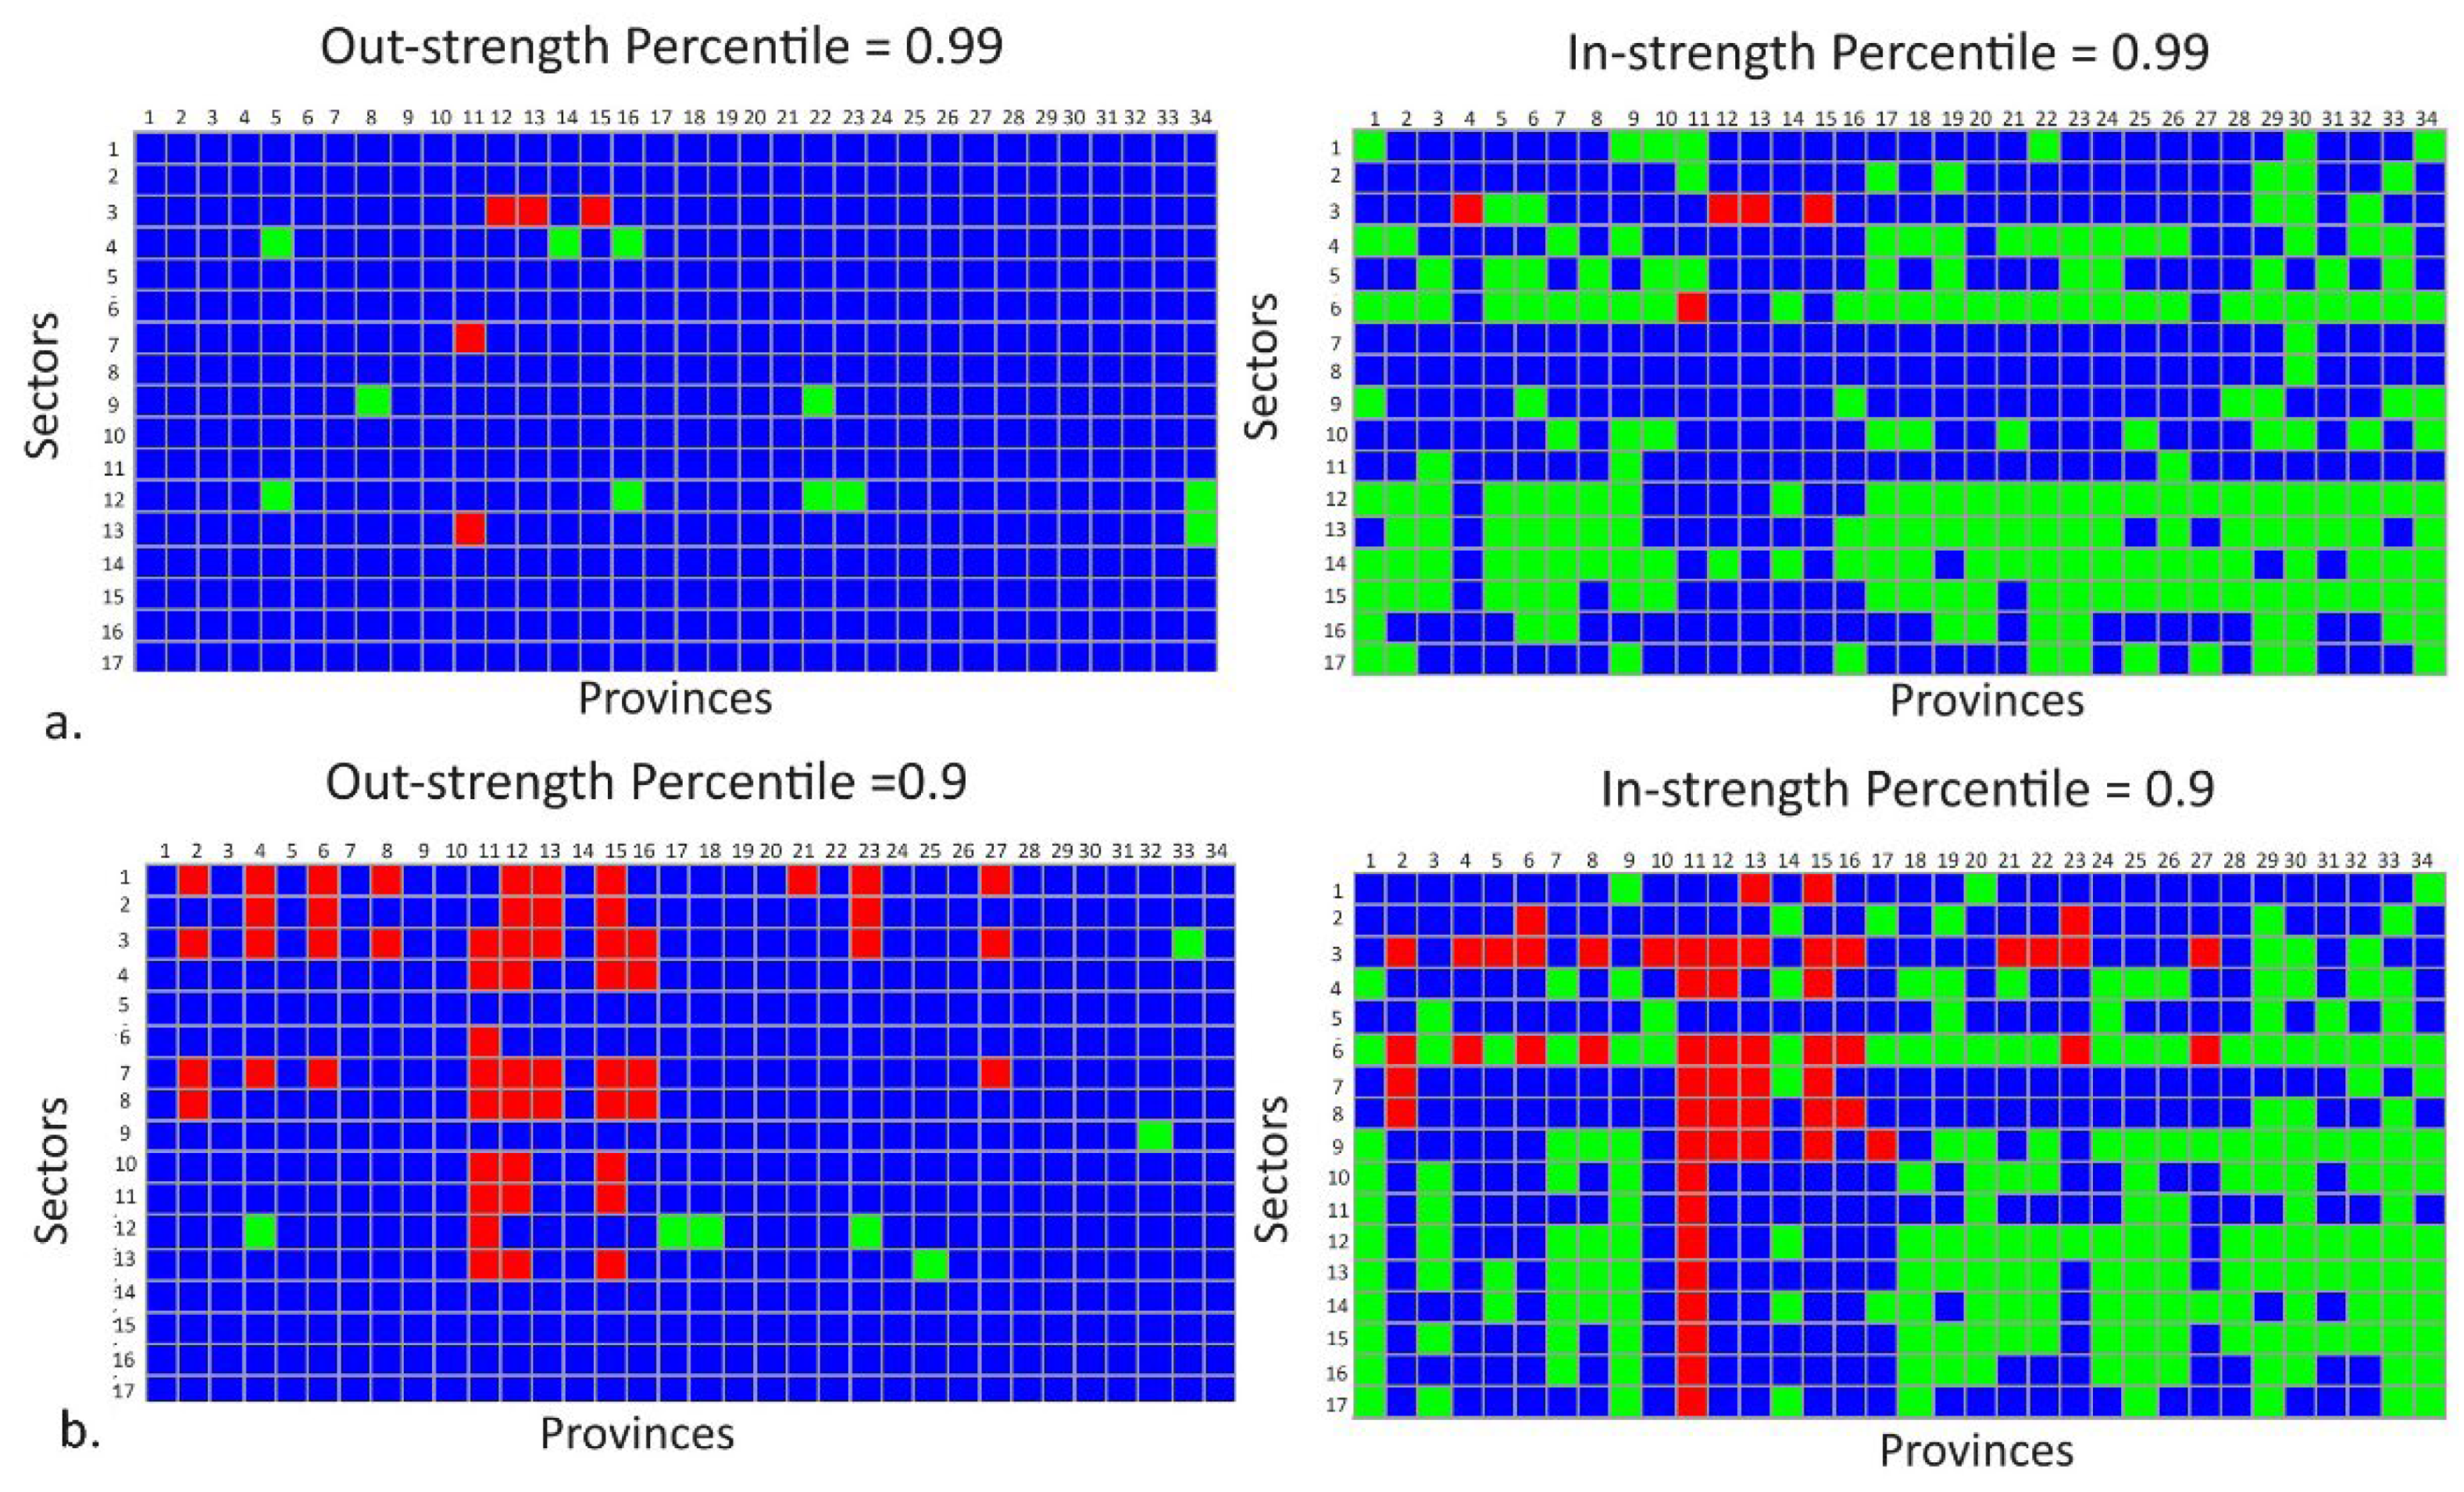
Table 3.
Summary of the basic network properties.
| Properties | Multilayer | Single Layer | |||||||
| Multilayer | Intralayer*) | InterLayer | |||||||
| In | Out | In | Out | In | Out | In | Out | ||
| Basic | Node | 578 | 578 | 578 | 578 | 578 | 578 | 34 | 34 |
| Edge | 299495 | 299495 | 17532 | 17532 | 281963 | 281963 | 1122 | 1122 | |
| Density | 0.898 | 0.898 | 0.92*) | 0.92*) | 0.846 | 0.846 | 1 | 1 | |
| Degree | Min | 425 | 7 | 0 | 0 | 413 | 6 | 33 | 33 |
| Max | 553 | 577 | 33 | 33 | 525 | 544 | 33 | 33 | |
| median | 520.5 | 577 | 30.3322 | 30.3322 | 489 | 544 | 33 | 33 | |
| Strength | Min | 29817.1 | 8708.21 | 0.014 | 0.001 | 29419.7 | 8696.79 | 5.8E+06 | 5.8E+06 |
| Max | 4.2E+08 | 3.2E+08 | 6.2E+07 | 4.8E+07 | 3.7E+08 | 2.8E+08 | 2.8E+08 | 2.8E+08 | |
| median | 3E+06 | 2.4E+06 | 38736.1 | 25425.8 | 2.80E+06 | 2.3E+06 | 3.6E+07 | 3.6E+07 | |
| Entropy | 0.78 | 0.77 | 0.63 | 0.61 | 0.79 | 0.78 | 0.85 | 0.81 | |
*average over all layers.
Table 4.
Comparison of different distribution fits for the complementary cumulative distribution function of the node in- and out-strength.
Table 4.
Comparison of different distribution fits for the complementary cumulative distribution function of the node in- and out-strength.
| Type | Distributions Candidate | In-strength | Out-strength | ||
| Log-likelihood | p-value | Log-likelihood | p-value | ||
| Multilayer | lognormal vs exponential | 280.759 | 0.000 | 368.702 | 0.000 |
| lognormal vs stretched exp. | 52.566 | 0.000 | 32.002 | 0.000 | |
| lognormal vs powerlaw | 1021.972 | 0.000 | 909.715 | 0.000 | |
| lognormal vs trunc.power law | 604.966 | 0.000 | 505.340 | 0.000 | |
| Interlayer | lognormal vs exponential | 280.217 | 0.000 | 356.917 | 0.000 |
| lognormal vs stretched exp. | 51.650 | 0.000 | 31.566 | 0.000 | |
| lognormal vs powerlaw | 1016.020 | 0.000 | 912.764 | 0.000 | |
| lognormal vs trunc. power law | 599.630 | 0.000 | 507.800 | 0.000 | |
| Interlayer | lognormal vs exponential | 992.874 | 0.000 | 1118.447 | 0.000 |
| lognormal vs stretched exp. | -1.913 | 0.801 | -5.234 | 0.451 | |
| lognormal vs powerlaw | 457.364 | 0.000 | 380.337 | 0.000 | |
| lognormal vs trunc. power law | 164.428 | 0.000 | 120.459 | 0.000 | |
Table 5.
Assortativity coefficients of the multilayer, intra-layer, and inter-layer IRIO network.
| Type | Multilayer | Intra layer | Interlayer |
| Out-Out | 0.09 | 0.42 | 0.1 |
| Out-In | 0.17 | 0.42 | 0.19 |
| In-Out | -0.05 | 0.35 | -0.09 |
| In-In | 0.02 | 0.34 | -0.01 |
Disclaimer/Publisher’s Note: The statements, opinions and data contained in all publications are solely those of the individual author(s) and contributor(s) and not of MDPI and/or the editor(s). MDPI and/or the editor(s) disclaim responsibility for any injury to people or property resulting from any ideas, methods, instructions or products referred to in the content. |
© 2024 by the authors. Licensee MDPI, Basel, Switzerland. This article is an open access article distributed under the terms and conditions of the Creative Commons Attribution (CC BY) license (http://creativecommons.org/licenses/by/4.0/).
Copyright: This open access article is published under a Creative Commons CC BY 4.0 license, which permit the free download, distribution, and reuse, provided that the author and preprint are cited in any reuse.


