
Submitted:
31 May 2024
Posted:
06 June 2024
You are already at the latest version
Abstract
In this paper, we present the characteristics of photoluminescent YBO3 successfully synthesized through a solid-state reaction and microwave-assisted method. We used yttrium oxide and boric acid in excess as starting reagents. The synthesis conditions are reflected in fluorescent characteristics and the structure. Excess boric acid causes structural changes, as observed by the FTIR spectroscopy analysis. The FTIR spectra analysis of the structure provided valuable insights into the phase composition and modifications induced by varying amounts of boric acid and synthesis methods. The identified structural features contribute to the understanding of the synthesized samples' characteristics and their potential applications in various fields such as illumination and displays and narrow-band fluorescent smartphone readable markers.
Keywords:
yttrium borate
; orthoborates
; photoluminescence
1. Introduction
Rare earth (RE) borates are perspective materials for many fields of research and technology due to their specific properties such as catalytic, thermosensitivity, luminescence, etc. Their properties change depending on RE ions, following possibilities for modeling excellent materials with individual characteristics suitable for different applications. RE borates have a general formula REBO3 known as orthoborates [1]. Several polymorph modifications, including calcite, aragonite, and vaterite similar to calcium carbonate can crystallize. A structure known as π-LnBO3, which is a pseudovaterite structure of rare earth borates, is formed from hexagonal and monoclinic structures. The crystal structure of REBO3 changes depending on the size of the RE cation in borates. Larger cations like La and Nd form an orthorhombic crystal system with a bipyramidal crystal lattice known as aragonite. Medium-sized cations like Sm to Yb and Y form a hexagonal crystal system with a dihexagonal bipyramidal lattice known as vaterite. The smallest cation, Lu, forms a hexagonal scalenohedral structure known as calcite type at low temperatures, and a vaterite-like structure above 1310 oC [2]. Adding boric acid in excess can cause changes in the crystal structure: The stoichiometric amounts of Y2O3 and boric acid are believed to result in the formulation of YBO3, which is reported to have a hexagonal structure (P63/mnc) or a crystalline monoclinic cell (C2/c). Typically, the trivalent yttrium ion is coordinated by oxygen and the structure comprises a YO8 polyhedron, which is somewhat distorted from the ideal S6 point symmetry. On the other hand, boron atoms can be either three or four-fold coordinated by oxygen, resulting in the observation of polymorphic YBO3 modifications in which either isolated trigonal [BO3]3–-groups or tetrahedral [BO4]3–-groups condensed to [B3O9]9–- rings occur [1,2].
There are two theories describe the decomposition of boric acid and their influence on crystal structure forming. Sevim et. al. [3] evaluated the kinetics of the boric acid dehydration reaction, assuming a two-step reaction (1) and (2). The orthoboric acid (H3BO3) at heating exudes water to produce metabolic acid (HBO2) in the first (1) reaction. The heating leads to the production of boron oxide (B2O3).
2H3BO3 → 2HBO2 + 2H2O↑ (1)
2HBO2 → B2O3 + H2O↑ (2)
The orthoboric acid content basic structural units BO33- which are connected by hydrogen bonds in two-dimensional layers (Figure 1).
While examining different crystalline structures of boric acid, Harabor et al [4], however, observed three different thermal- induced reaction steps (3)-(5).
H3BO3 → HBO2 + H2O↑ (3)
HBO2 → H2B4O7 + H2O↑ (4)
H2B4O7 → B2O3 + H2O↑ (5)
It was noted back in 1978 that a new intermediate, H2B4O7, was formed during the decomposition of boric acid. Huber C. conducted kinetic analyses of the reaction steps and found that the decomposition of boric acid is more likely to occur in three steps rather than two. The stoichiometric-related mass loss during the decomposition reaction is not accounted for in the often-proposed two-step reaction, thus a three-step reaction is a more suitable description [5].
The decomposition of boric acid we can summarized by reactions given at Figure 2. The orthoboric acid at heating partly evaporates water and it is transformed into methaboric acid HBO2. At duration heating it forms the boric oxide. The orthoboric acid content of structural units BO33- is connected with hydrogen bonds into the boroxol ring. In metabolic acid, there are long polymeric chains and ring structures, which share oxygen atoms [4].
The solid-state method is the most widely used method for obtaining polycrystalline solids from starting components in a solid aggregate state. Factors that influence the course and rate of the process include reaction conditions, structural properties of the reactants, surface area of the solids, their reactivity, and the thermodynamic free energy change associated with the reaction. The main advantages of this method are high efficiency and selectivity, uniform particle size distribution, and less environmental pollution.
Yttrium borate can be produced using various techniques, with the solid-state reaction method being the most commonly employed. This method offers high efficiency, selectivity, uniform particle size distribution, and minimal environmental pollution. Another method, the microwave-assisted technique, is a relatively newer approach known for faster, simpler, and cost-effective processes. It utilizes microwave radiation to interact directly with reaction components, reducing the need for external energy sources [6]. Microwave radiation interacts directly with the reaction components, which means that only the sample heats up, and there is no need for energy to be expended in heating furnaces, containment materials, or the sample environment. With increasing trends in the production of new materials or materials whose properties need to be optimized is the use of a microwave-assisted method when conventional synthetic methods cannot be used [7,8].
Considering the other synthesis methods, such as sol-gel method, ignition method and combined method, we can make a comparison focusing on obtaining a product with higher purity and easy post-processing.
The sol-gel method involves the synthesis of materials through the hydrolysis of precursor salts followed by the polymerization of the resulting gel. This method ensures high purity of the products and control over the structure of the materials. However, its use requires special precursor salts and involves a lengthy process of gel drying and processing [9,10].
The combustion method is an effective way to synthesize ceramic materials under low-temperature conditions, involving the evaporation of precursors and subsequent thermal treatment. Despite its advantages, this method may require controlled oxidation and can lead to the formation of unwanted phases and defects. The combined method utilizes various techniques, including combustion and subsequent solid-phase processing, to achieve specific material properties. It offers a compromise between synthesis speed and control over material structure but can be more complex and involve multiple steps, leading to decreased reproducibility and yield. The choice of approach depends on the specific requirements of the application and the desired properties of the materials. Each methodology has its advantages and limitations that should be considered when determining the most suitable method for a particular application [11].
2. Materials and Methods
For the synthesis of photoluminescence yttrium borate YBO3 doped with europium, the following reagents of analytical grade purity were used: Y2O3 (Yttrium (III) oxide, 99.99 % (trace metal basis), CAS: 1314-36-9); H3BO3 (Boric acid, 99%, Index # 005-007022-2); Europium sulfate octahydrate Eu(SO4)2.8H2O (99.9%) purchased from Alfa Aesar.
2.1. Samples Preparation
The reagents were weighed, mixed, and homogenized, and then the prepared mixtures were placed in alumina crucibles for the solid-state synthesis and for the microwave-assisted method the samples were placed in teflon sleeves and heated up. The samples content is present in Table 1.
The solid-state synthesis was performed in a muffle furnace at 1160 oC for 4 hours with a heating rate of 15 oC/min. After 4 hours, the samples were kept in the furnace when they cooled slowly for 16 hours. The sample S20 SS was prepared by mixing stoichiometric amounts of Y2O3 and H3BO3 with 2 mol% Eu2(SO4)3.8H2O as a doping agent. The samples from S21 SS to S212 SS content rising of H3BO3 excess from 5 mass% to 60 mass % with step 5 mass %. The samples from series S20-S212 MW were synthesized by microwave-assisted method used the same amounts of the starting substances obtained in a stoichiometric, adding 5 ml of distilled water. The synthesis temperature of the samples is 260 oC, the required time to reach the set temperature is 15 min., hold - 10 min and cooling time 20 min. The power of the microwave is 1500 watts. After cooling, the samples were removed dry.
2.2. Sample Analysis
2.2.1. FT-IR Analysis
The FT-IR spectra of the samples were recorded at band sensitivity in the MIR 4000-400 cm-1 region at a resolution of 2 cm-1 in 25 scans using FT-IR Bruker Vertex 70 Spectrometer. The samples are made in KBr tablets on the tablets press.
2.2.2. Photoluminescent Analysis
The photoluminescence spectra were measured at room temperature using an Ocean Optics fiber optic QEB1104 spectrometer in the range 200–990 nm and a combination of an Energetic Laser driven white light source (190 nm – 2500 nm) and a fiber-optic monochromator (MonoScan 2000, Ocean Optics) as illustrated in Figure 3. Large core (1 mm) quartz polymer fibers were used in the setup. The receiving fiber was placed at 45° with respect to the vertical excitation fiber both of which were. The main advantage of this scheme is that it minimizes reflection from the samples and maximizes the intensity of the luminescence spectra. The excitation wavelength was scanned from 220 nm to 550 nm at increments of 2 nm for each of which we measured the fluorescence spectrum.
3. Results
3.1. Structural Characterization
The prepared samples appeared as white fine powders. The transmission Infrared (FTIR) spectra of the starting reagents and selected samples were analyzed, and the observations are discussed below. An FTIR spectrum of boric acid (Figure 4) shows typical signals belonging to orthoboric acid [12]. The bands at 547, 647, 884, 1195, and 1470 cm–1 belong to boric acid H3BO3. The band at 547 cm-1 — the basic band in the 600 – 418 cm-1 region — belongs to H3BO3. The band at 647 cm-1 [13] is due to deformation vibrations of the atoms in the B – O bond. The slight broadening indicates the presence of no molecular water in the form of structure-forming OH groups. The band at 676 cm-1 is assigned to vibrations 4 of [BO3]3- structural group, B–O–B bridge, or to vibrations of the atoms that form [B(O, OH)4] tetrahedrons [14,15]. The band at 1194 cm-1 was probably caused by vibrations of atoms in the –O–B< bond in the structure of orthoboric acid. The bands at 2000, 2031, 2100, 2261, and 2361 cm–1 could be caused by stretching vibrations of atoms in the C – O bond of gaseous CO2 sorbed in the powder analyzed. The weak band at 2518 cm-1 is indicated molecular water impurity adsorbed on particles of the acid from the atmosphere. The next bands, including the band at 3222 cm-1 with the highest peak height, belong to the water of similar structural type but different from the preceding type. Medvedev et. all [12] is found there are two forms of water.
The infrared spectra of all samples of series SS showed structural modification with an increase in excess boric acid. The stoichiometric sample S20 (Figure 5) shows bands at 1300 cm-1 which are typical for isolated [BO3]3- and for BO groups at about 1200 cm-1, which is an indicator of the formation of a high-temperature YBO3 phase with 3-coordinated boron atoms. Examining the spectra of the starting materials and the S20 sample, we observe an overlap of low-frequency bands corresponding to yttrium oxide located at 561 cm-1 and 646 cm-1, which are not present in the spectra of samples S21-S212 (Figure 6).
The infrared spectra of samples S21 SS to S212 SS overlap (Figure 6) and do not show bands around 1300 cm-1, which means that the YBO3 phase includes only fused borate groups linked together in the form of a boroxol ring [B3O9]-. The phase transition from low temperature (LT) to high temperature (HT) phase is accompanied by rupture of the boroxol ring to HT phase, in which isolated borate groups [BO3] and [B-O] are located. Therefore, in the reversible process (HT - LT), isolated [BO3] groups condense to a boroxol ring [B3O9].
For the samples synthesis by the microwave assisted method, the IR spectrum of YBO3: Eu has two well defined band groups with doublet character (Figure 7), the first group with bands at 874 cm-1 and 920 cm-1, and the second group with bands at 1032 cm-1 and 1075 cm-1 similar to the bands reported in [13,14] and there are same as series S2 SS. The spectrum with strong bands between around 862 and 1078 cm-1 is clearly indicative of [B3O9]9- groups in YBO3. The bands at 874 and 920 cm-1 are due to ring stretching modes, whereas the peak at 1078 cm-1 is due to terminal B-O stretching. The bending vibrations of the B–O–B bond in the borate network is located at ≈ 710 cm-1. The strong band at ≈ 570 cm-1 is attributed to Y-O in Y2O3 [16]. A broad peak at around 3217 cm-1 originated from O–H stretching in hydroxyl groups [17].
3.2. Photoluminescent Properties
The fluorescence analysis measured with the setup from Figure 3 for the SS and MW samples revealed that for all samples the highest fluorescence was observed at 260 nm and 396 nm excitation wavelengths, the latter being the most efficient. For both the 260 nm and the 396 nm excitations, the emission spectra exhibited several peaks in the range from 590 nm to 800 nm as shown in Figure 8. a) (for SS) and Figure 8b) (for MW). These peaks were attributed to the transition of europium ions from the 5D₀ state to various 7FJ (J = 0, 1, 2, 3, 4) levels.
The following specific observations regarding the emission peaks can be outlined:
- Orange emission (5D₀→7F₁): A peak at 591 nm was identified, corresponding to the 5D₀→7F₁ transition, resulting in orange emission.
- Red emission (5D₀→7F₂): Peaks at 612 nm and 620 nm were observed, corresponding to the 5D₀→7F₂ transition, resulting in red emission.
-
Transition intensity and matrix influence:
- When Eu³⁺ ions occupy inversion center sites, the 5D₀→7F₁ transitions were expected to be relatively strong, while the 5D₀→7F₂ transitions were relatively weak.
- The transition 5D₀→7F₁ due to magnetic-dipole is independent of the host matrix, whereas the electric-dipole allowed 5D₀→7F₂ transition is strongly influenced by the local structure.
-
Emission intensity ratio (R/O Ratio):
- The emission intensity ratio between red and orange color transitions, denoted as R/O (I(5D₀→7F₂)/I(5D₀→7F₁)), was calculated by considering the sum of integral intensity of red emission peak observed at 612 nm for contribution of 5D0/7F2 transition. The intensities of the different 5D0 - 7FJ transitions and the splitting of these emission peaks depend on the local symmetry of the crystal field of the Eu3+ ion. If the Eu3+ ion occupies a centrosymmetric site in the crystal lattice, the magnetic dipole transition 5D0 − 7F 1 (orange) is the dominant transition; otherwise, the electric dipole transition 5D0 − 7F2 (red) becomes dominant.
- This ratio, also known as the asymmetric ratio, color purity, or red-to-orange emission ratio, provides insights into the relative strengths of the red and orange emissions. YBO3:Eu3+ has a hexagonal structure of the vaterite type, with Eu 3+ ions occupying the Y3+ site, which has point symmetry S 6. As a result, the orange emission at 592 nm from the 5 D0 − 7F1 transition is dominant, leading to a lower value of the intensity ratio (R/O) between red and orange emission. Good color purity requires a high R/O value, and thus many studies aim to improve this ratio.
- Emission at 696 nm whose intensity is comparable to that of the 612 nm peak for 396 nm excitation and considerably lower for 260 nm excitation.
In Figure 8 c) and d) we show the dependence of the peak values at these specific wavelengths on the percentage of the excess boric acid for the SS and MW samples correspondingly for 260 nm excitation.
4. Discussion
The FTIR spectra of samples in the solid-state series showed structural modifications with increasing excess boric acid. The stoichiometric sample S20 SS exhibited bands, indicating the formation of a high-temperature YBO₃ phase. S21 SS to S212 SS samples did not show bands around 1300 cm⁻¹, suggesting that the YBO₃ phase included only fused borate groups linked in a boroxol ring [B₃O₉]⁻. An increase in boric acid, even in small excess, led to a compaction of the structure and the formation of a low-temperature phase (LT) where boron is 4-coordinated.
All of the samples synthesized using the microwave-assisted method show the formation of boroxol rings regardless of the excess amount of boric acid. The strong band observed at approximately 570 cm⁻¹ is attributed to Y-O in Y₂O₃. Additionally, a broad peak at around 3217 cm⁻¹ is observed, which is due to the O–H stretching of hydroxyl groups resulting from residual amounts of absorbed water. This issue can be resolved by implementing additional drying after the synthesis process.
The fluorescence analysis highlighted the excitation wavelength and emission transitions of europium ions in the synthesized samples. The observed orange and red emissions, along with the calculated R/O ratio, contribute to understanding the luminescent properties of the materials. These properties are crucial for potential applications in areas such as optoelectronics, displays, and luminescent devices [18].
As seen from Figure 8, the main difference between the two types of samples was in the strength of the 696 nm emission which was comparable to the orange emission at 612 nm for the MW samples and considerably lower for the SS samples. The second difference is that fluorescence intensity of the MW series was higher compared to that of SS series. The dependencies for 396 nm excitation were similar.
Figure 8 e) and Figure 8 f) show the dependence of the O/R ratio on the percentage of excess boric acid for 260 nm and 396 nm UV excitation. From these figures it is evident that for the SS samples the O/R ratio increases with the excess boric acid reaching a saturation level of about 1.5 above 35%, while for the MW samples it remains practically constant at 1.7-1.75 levels and is slightly higher for 396 nm excitation. For all samples the fluorescence strongly diminishes above 60% excess boric acid. As we see, unlike the fluorescence intensity and spectral distributions (Figure 8 a) and b)), the O/R ratios are weakly affected by the excitation wavelength. They, however, depend on the type of samples i.e. on the technology - solid state vs microwave assisted. The latter one is characterized by a stronger fluorescence and a higher O/R ratio. In view of the above observations the second group of MW samples fabricated by the microwave assisted method are better fitted for smartphone readable markers [19].
Author Contributions
The following statements should be used “Conceptualization, I.K. and T.E.; methodology, S.N., A.P and K.H.; software, T. E. and S.T.; validation, S.N., S.T. and A.P.; formal analysis, K.H.; investigation, I.K.; resources, I.K. and T.E.; data curation, T.E.; writing—original draft preparation, I.K. and T.E.; writing—review and editing, K.H.; visualization, K.H.; supervision, I.K.; project administration, T.E.; funding acquisition, I.K. All authors have read and agreed to the published version of the manuscript.” Please turn to the for the term explanation. Authorship must be limited to those who have contributed substantially to the work reported.
Funding
This research was funded by the Natural Sciences and Engineering Council (NSERC), Canada under Discovery grant.
Conflicts of Interest
The authors declare no conflicts of interest.
References
- Plewa, J.; Jüstel, T. ; Phase transition of YBO3. Journal of Thermal Analysis and Calorimetry 2007, 88, 531–535. [Google Scholar] [CrossRef]
- Fuchs, B.; Schröder, F.; Heymann, G.; Siegel, R.; Senker, J.; Jüstel, T.; and Huppertz, H. ; Crystal structure re-determination, spectroscopy, and photoluminescence of π-YBO3:Eu3+. Z. anorg. allg. Chem. 2021, 647, 2035–2046. [Google Scholar] [CrossRef]
- Sevim, F.; Demir, F.; Bilen, M.; Okur, H. Kinetic analysis of thermal decomposition of boric acid from thermogravimetric data. Korean J Chem Eng. 2006, 23, 736–740. [Google Scholar] [CrossRef]
- Harabor, A.; Rotaru, P.; Scorei, R.I.; Harabor, N.A. Non-conventional hexagonal structure for boric acid. J Therm Anal Calorim. 2014, 118, 1375–1384. [Google Scholar] [CrossRef]
- Huber, C.; Jahromy, S.S.; Birkelbach, F.; et al. The multistep decomposition of boric acid. Energy Sci Eng. 2020, 8, 1650–1666. [Google Scholar] [CrossRef]
- Ben Smida, Y.; Marzouki, R.; Kaya, S.; Erkan, S.; Faouzi Zid, M.; Hichem Hamzaoui, A. Synthesis Methods in Solid-State Chemistry. Synthesis Methods and Crystallization, Editor Riadh Marzouki, InTech Open, 2020, 1-13. [CrossRef]
- Kitchen, H.J.; Vallance, S.R.; Kennedy, J.L.; Tapia-Ruiz, N.; Carassiti, L.; Harrison, A.; Gregory, D.H. Modern Microwave Methods in Solid-State Inorganic Materials Chemistry: From Fundamentals to Manufacturing. Chemical Reviews 2023, 114, 1170–1206. [Google Scholar] [CrossRef]
- Liu, F.W.; Hsu, C.H.; Chen, F.S.; Lu, C.H. Microwave-assisted solvothermal preparation and photoluminescence properties of Y2O3:Eu3+ phosphors. Ceramics International 2012, 38, 1577–1584. [Google Scholar] [CrossRef]
- Boyer, D.; Bertrand-Chadeyron, G.; Mahiou, R.; Brioude, A.; Mugnier, J. Synthesis and characterization of sol–gel derived Y3BO6:Eu3+ powders and films. Optical Materials 2003, 24, 35–41. [Google Scholar] [CrossRef]
- Maia, L.J.Q.; Mastelaro, V.R.; Pairis, S.; Hernandes, A.C.; Ibanez, A. A sol–gel route for the development of rare-earth aluminum borate nanopowders and transparent thin films. Journal of Solid State Chemistry 2007, 180, 611–618. [Google Scholar] [CrossRef]
- Gangwar, A.K.; Nagpal, K.; Kumar, P.; Singh, N.; Gupta, B.K. New insight into printable europium-doped yttrium borate luminescent pigment for security ink applications. Journal of Applied Physics 2019, 125, 074903. [Google Scholar] [CrossRef]
- Medvedev, E.F.; Komarevskaya, A.S. IR spectroscopic study of the phase composition of boric acid as a component of glass batch. Glass and Ceramics 2007, 64, 42–46. [Google Scholar] [CrossRef]
- Vlasov, A. G. and Florinskaya, V. A. (eds.), Structure and Physicochemical Properties of Inorganic Glasses [in Russian], Khimiya, Leningrad 1974.
- Kazuo N., Infrared and Raman Spectra of Inorganic and Coordination Compounds: Theory and Applications in Inorganic Chemistry, 6th ed., Wiley, New York 1997.
- Stefanovskii, S.V.; Ivanov, I.A.; Gulin, A.N. IR and EPR spectra of aluminoborosilicate and aluminophosphate glasses simulating vitrified radioactive wastes. Fiz. Khim. Stekla 1991, 17, 120–125. [Google Scholar]
- Beregi, E.; Watterich, A.; Kovács, L.; Madarász, J. Solid-state reactions in Y2O3:3Al2O3:4B2O3 system studied by FTIR spectroscopy and X-ray diffraction. Vibrational Spectroscopy 2000, 22, 169–173. [Google Scholar] [CrossRef]
- Onani, M.O.; Okil, J.O.; Dejene, F.B. Solution–combustion synthesis and photoluminescence properties of YBO3:Tb3+ phosphor powders. Physica B: Condensed Matter 2014, 439, 133–136. [Google Scholar] [CrossRef]
- Zhang, F.; Bian, G.; Ding, H.; Tang, J.; Li, X.; Zhang, C.; Li, S.; Jia, G. Controllable synthesis and tunable luminescence of yttrium orthoborate microcrystals with multiform morphologies and dimensions. J. of Luminescence 2020, 219, 116890. [Google Scholar] [CrossRef]
- Hristova, K.; Kostova, I.P.; Eftimov, T.A.; Brabant, D.; Fouzar, S. Rare-Earth-Ion (RE3+)-Doped Aluminum and Lanthanum Borates for Mobile-Phone-Interrogated Luminescent Markers. Photonics 2024, 11, 434. [Google Scholar] [CrossRef]
Figure 1.
A structure of orthoboric acid.
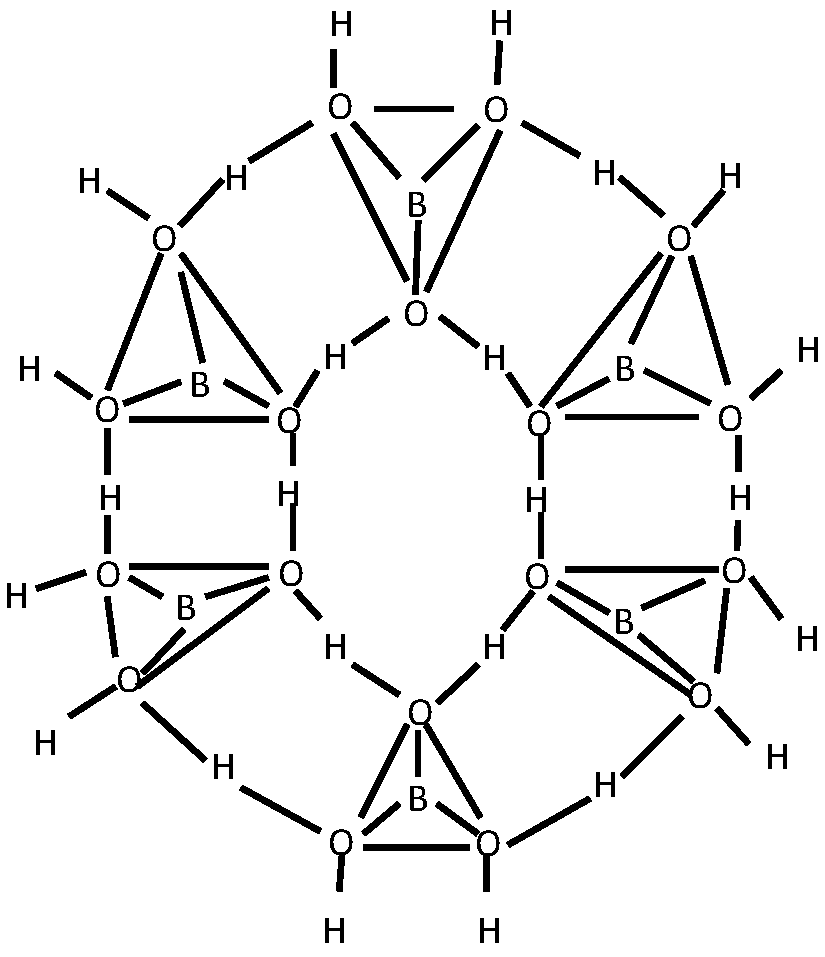
Figure 2.
Steps of the boric acid decomposition.
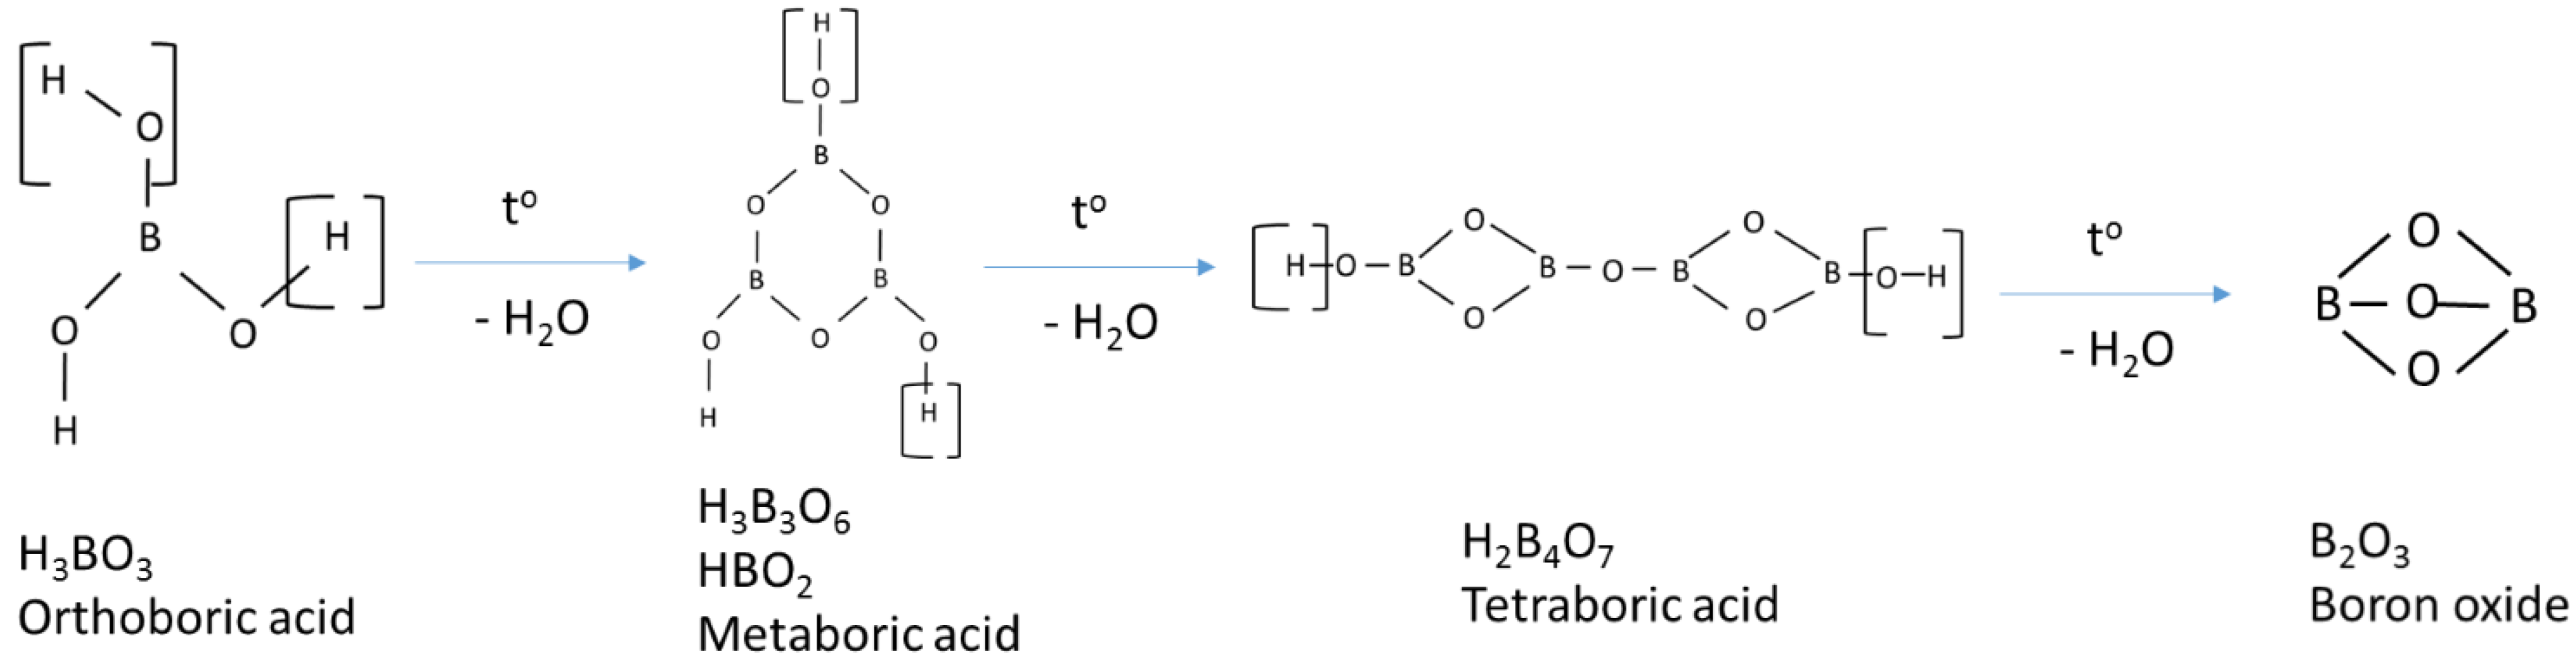
Figure 3.
Scheme of the photoluminescent setup.
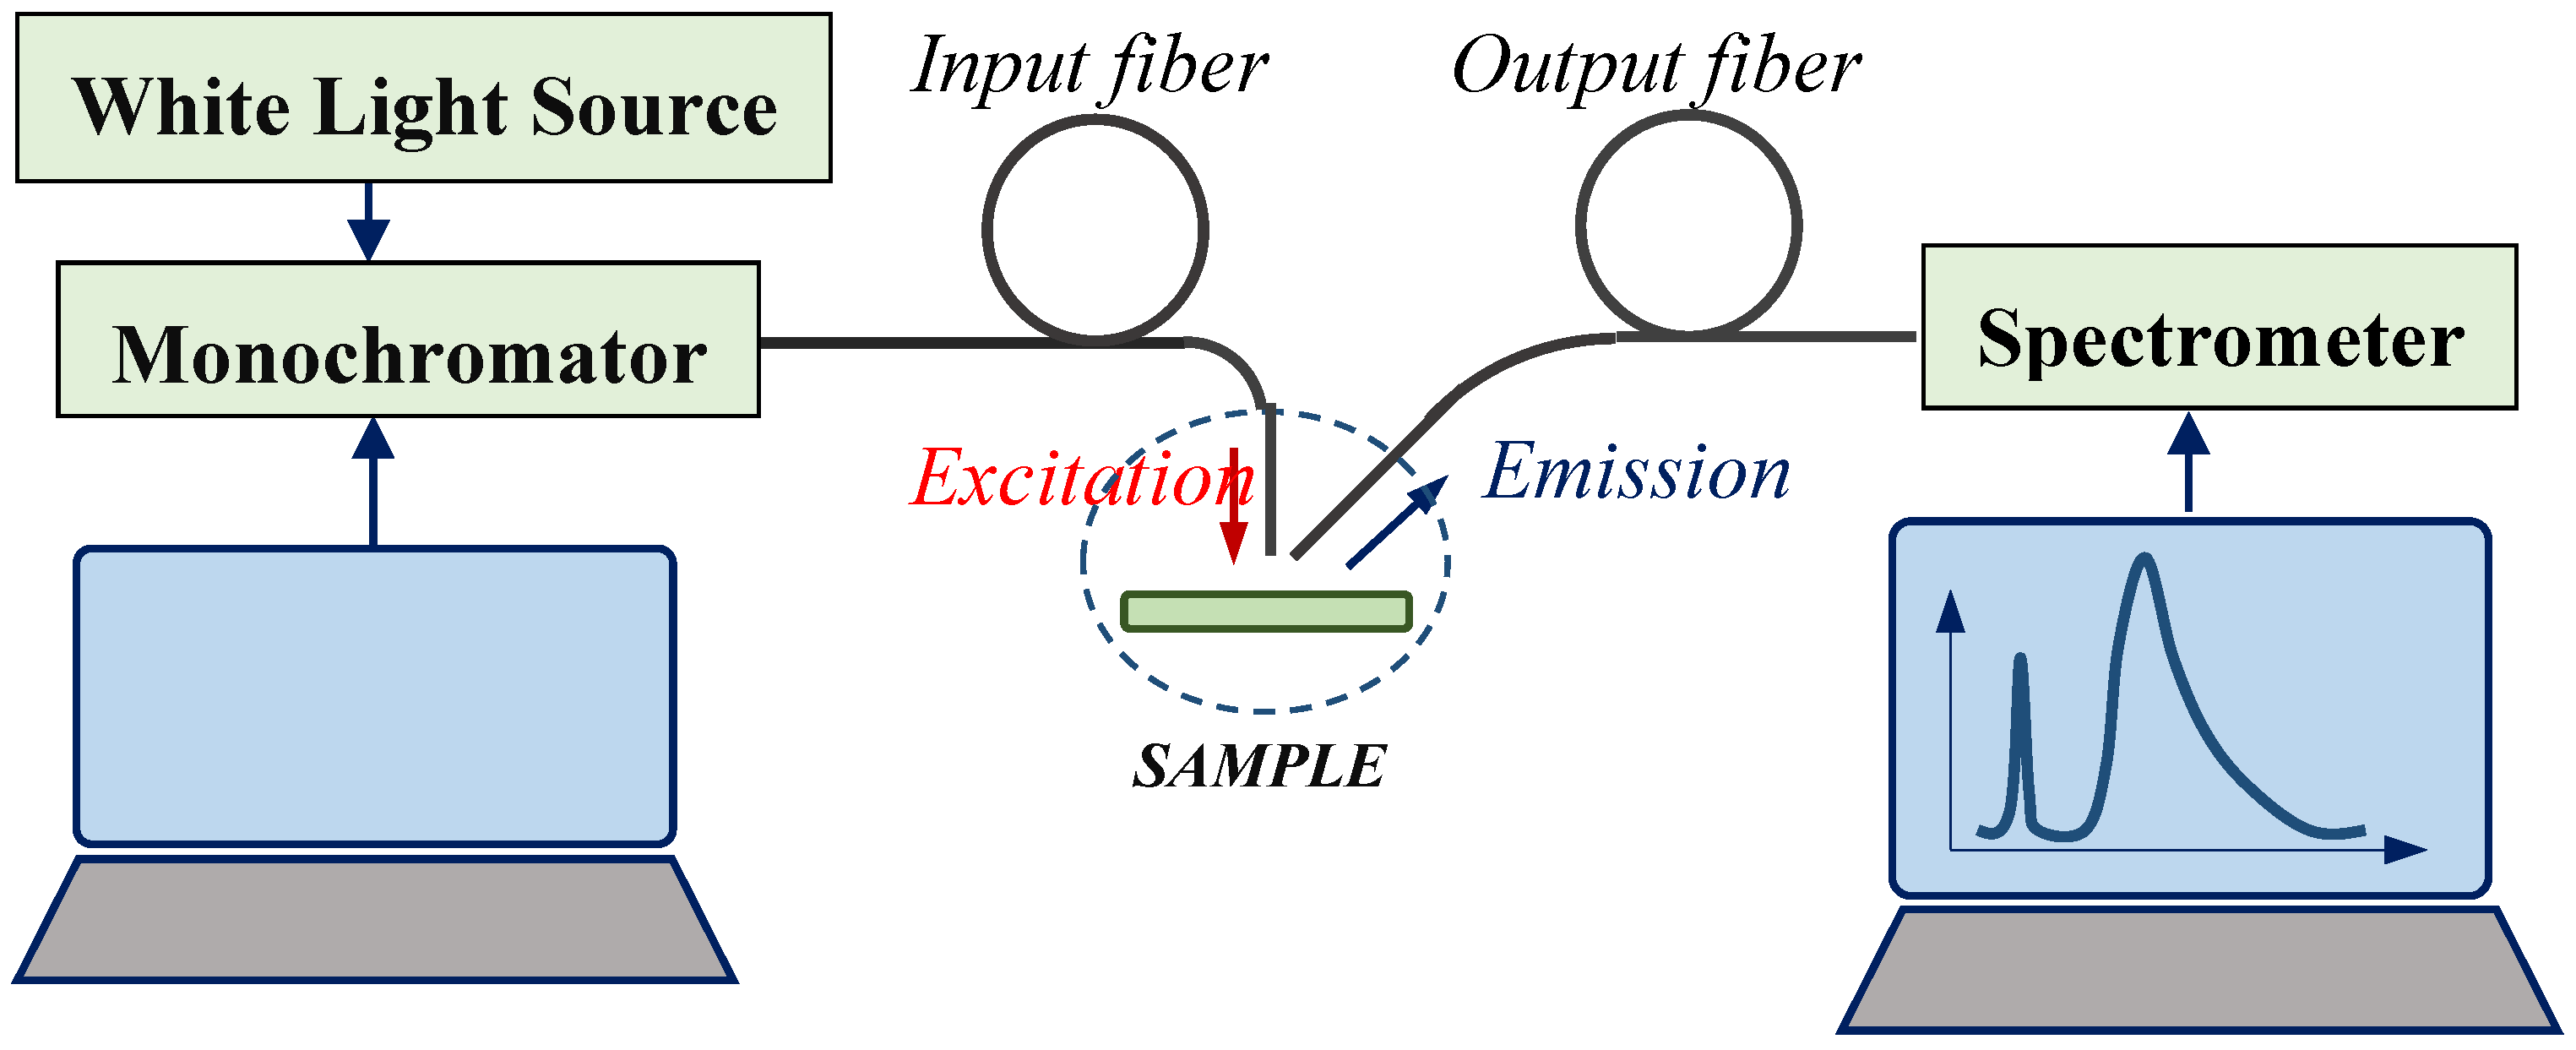
Figure 4.
An IR spectrum of boric acid used for starting raw material.
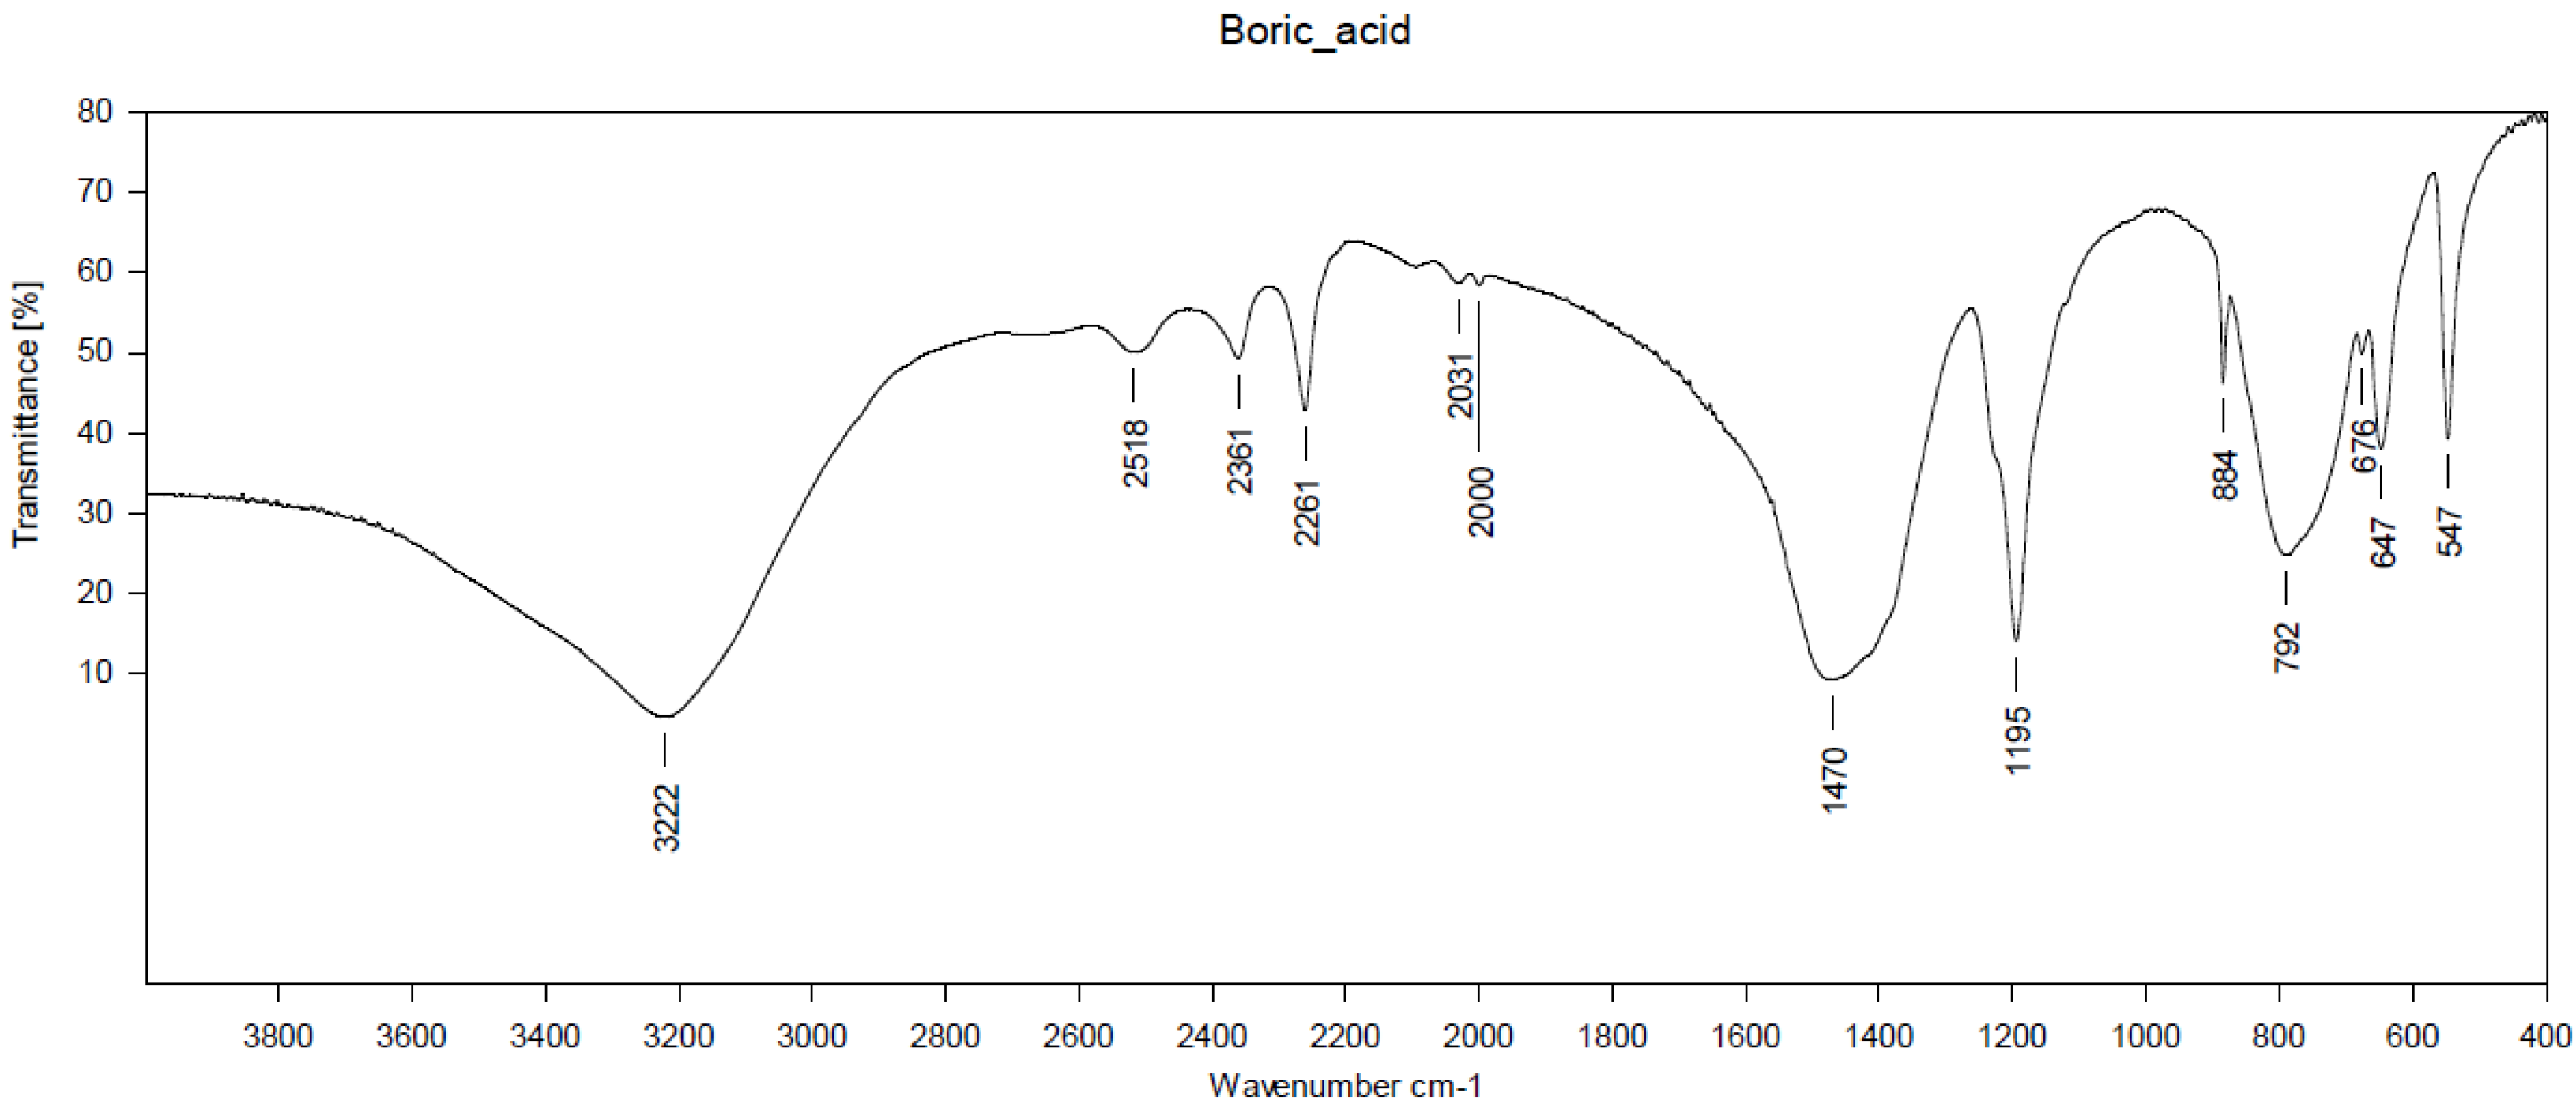
Figure 5.
IR spectra of yttrium oxide and stoichiometric sample S20SS.
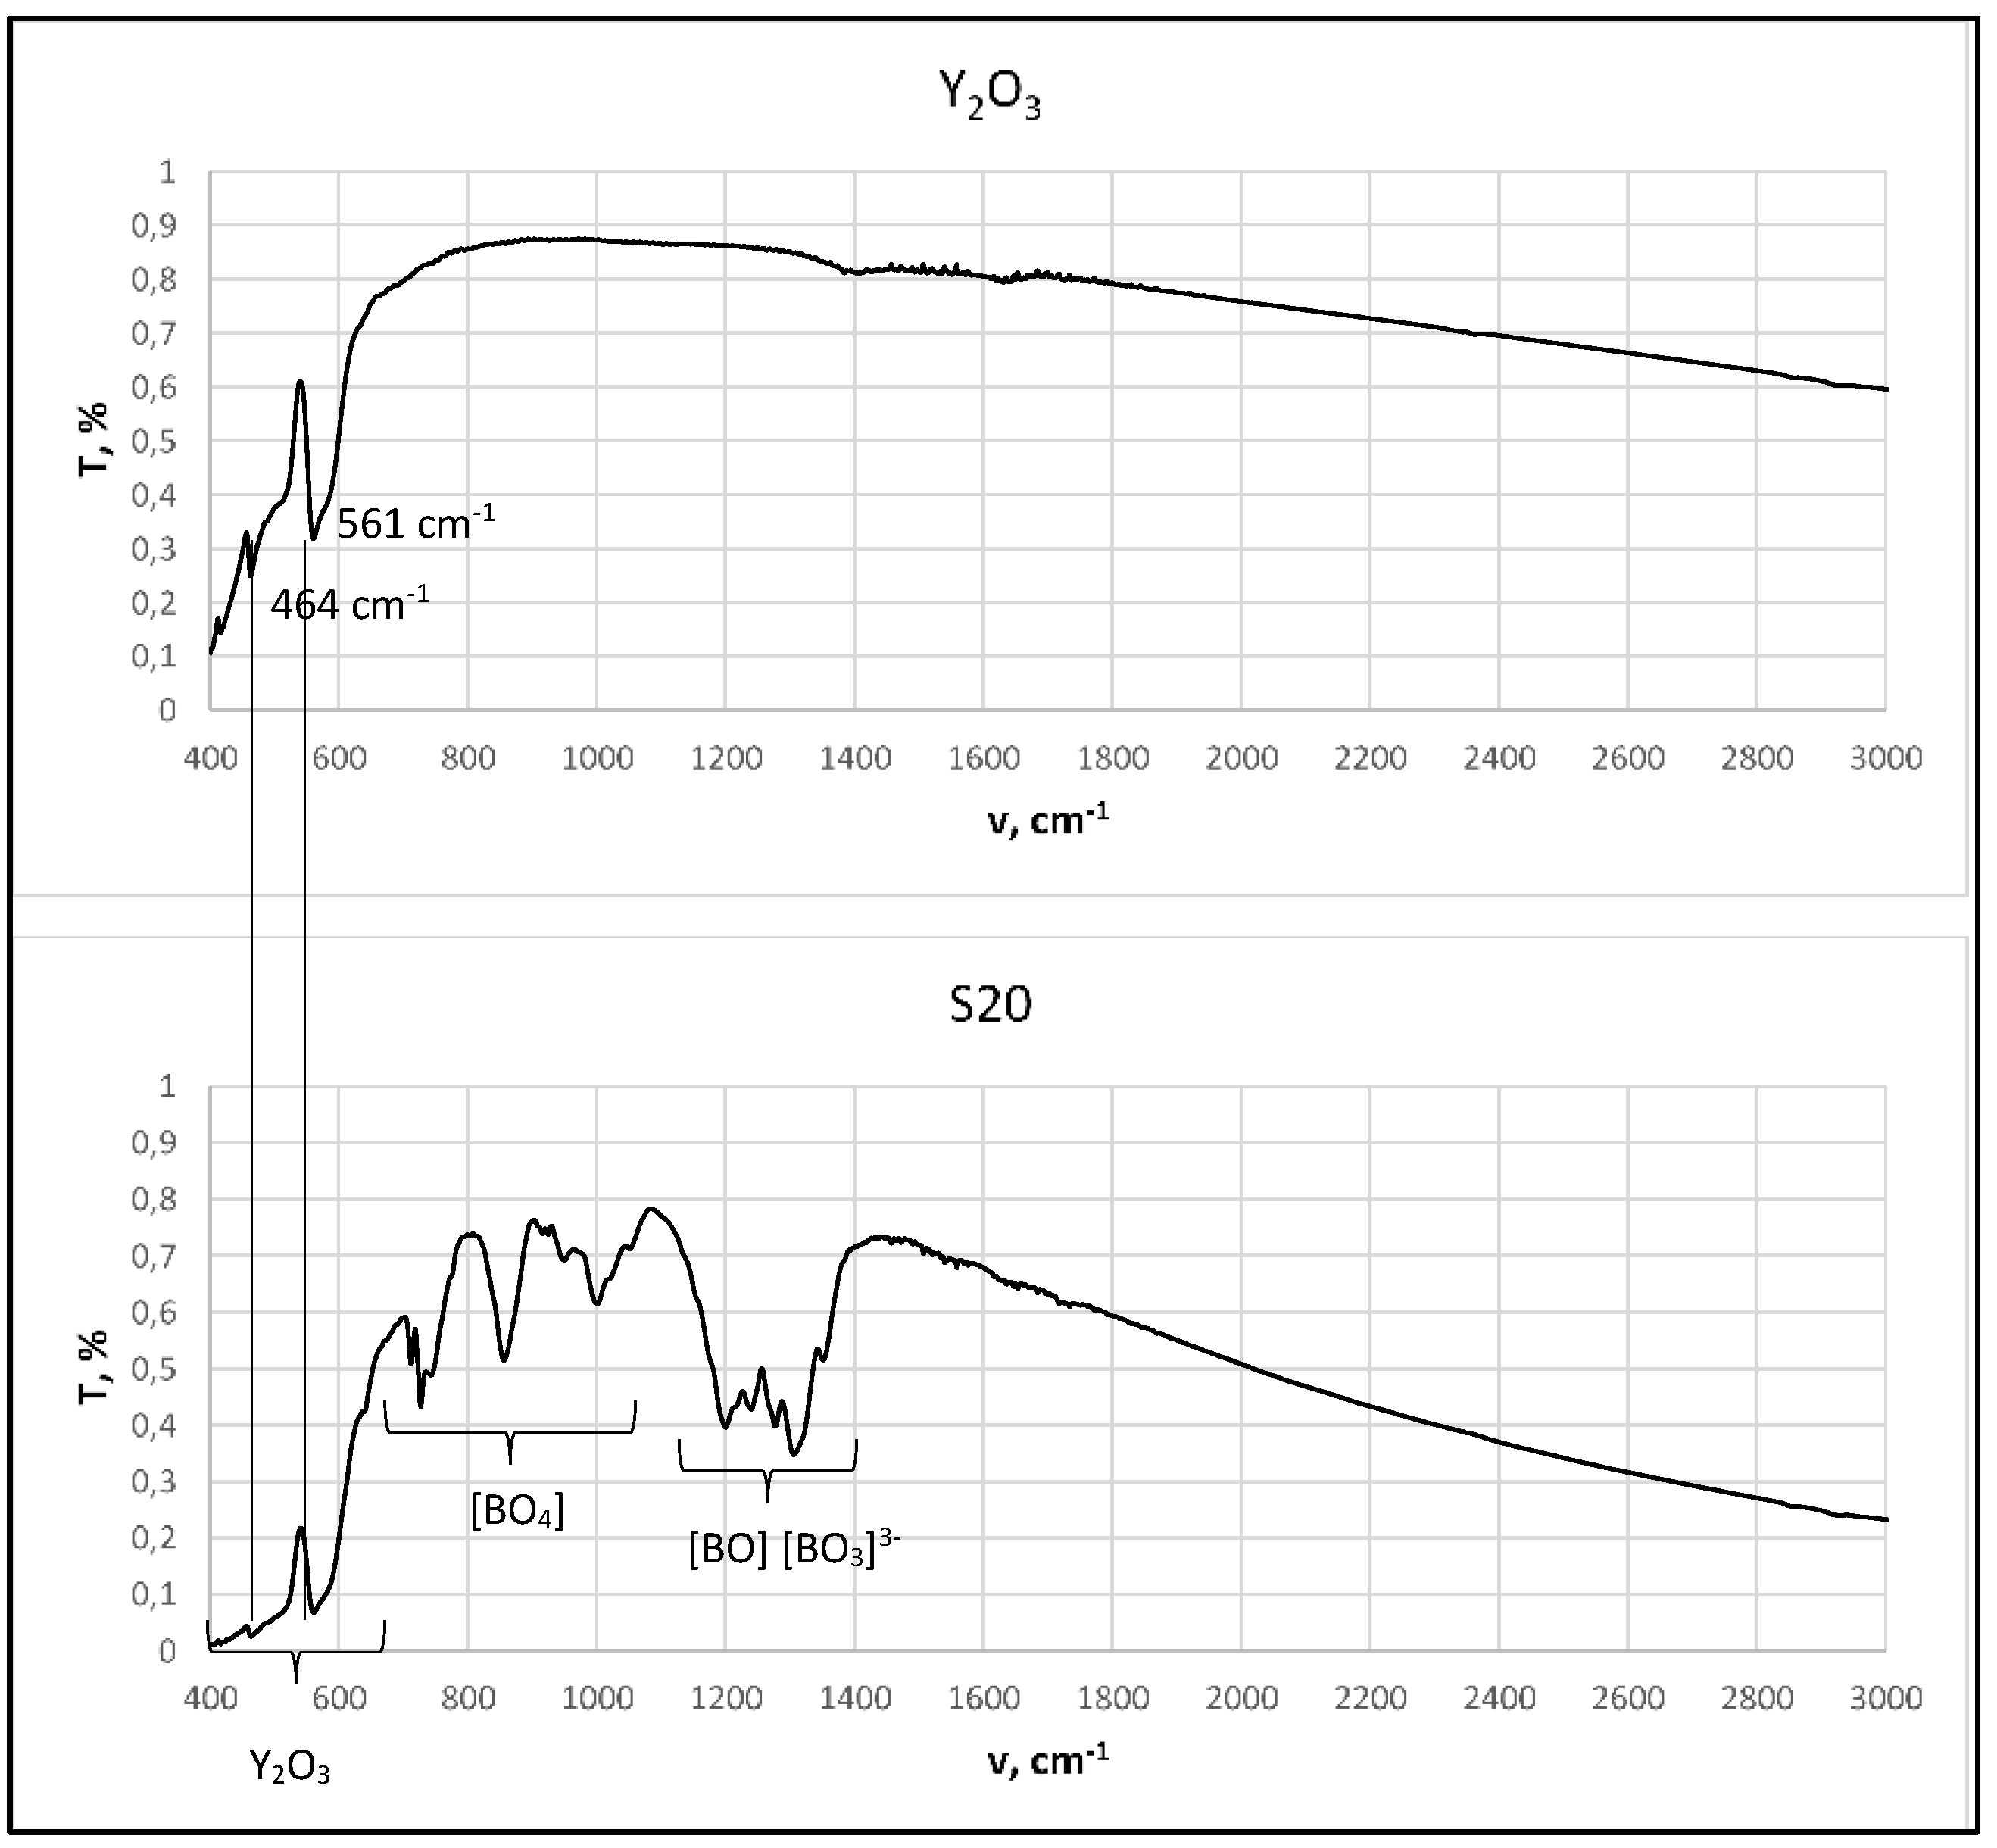
Figure 6.
An IR spectra of samples S21 – S212 SS.
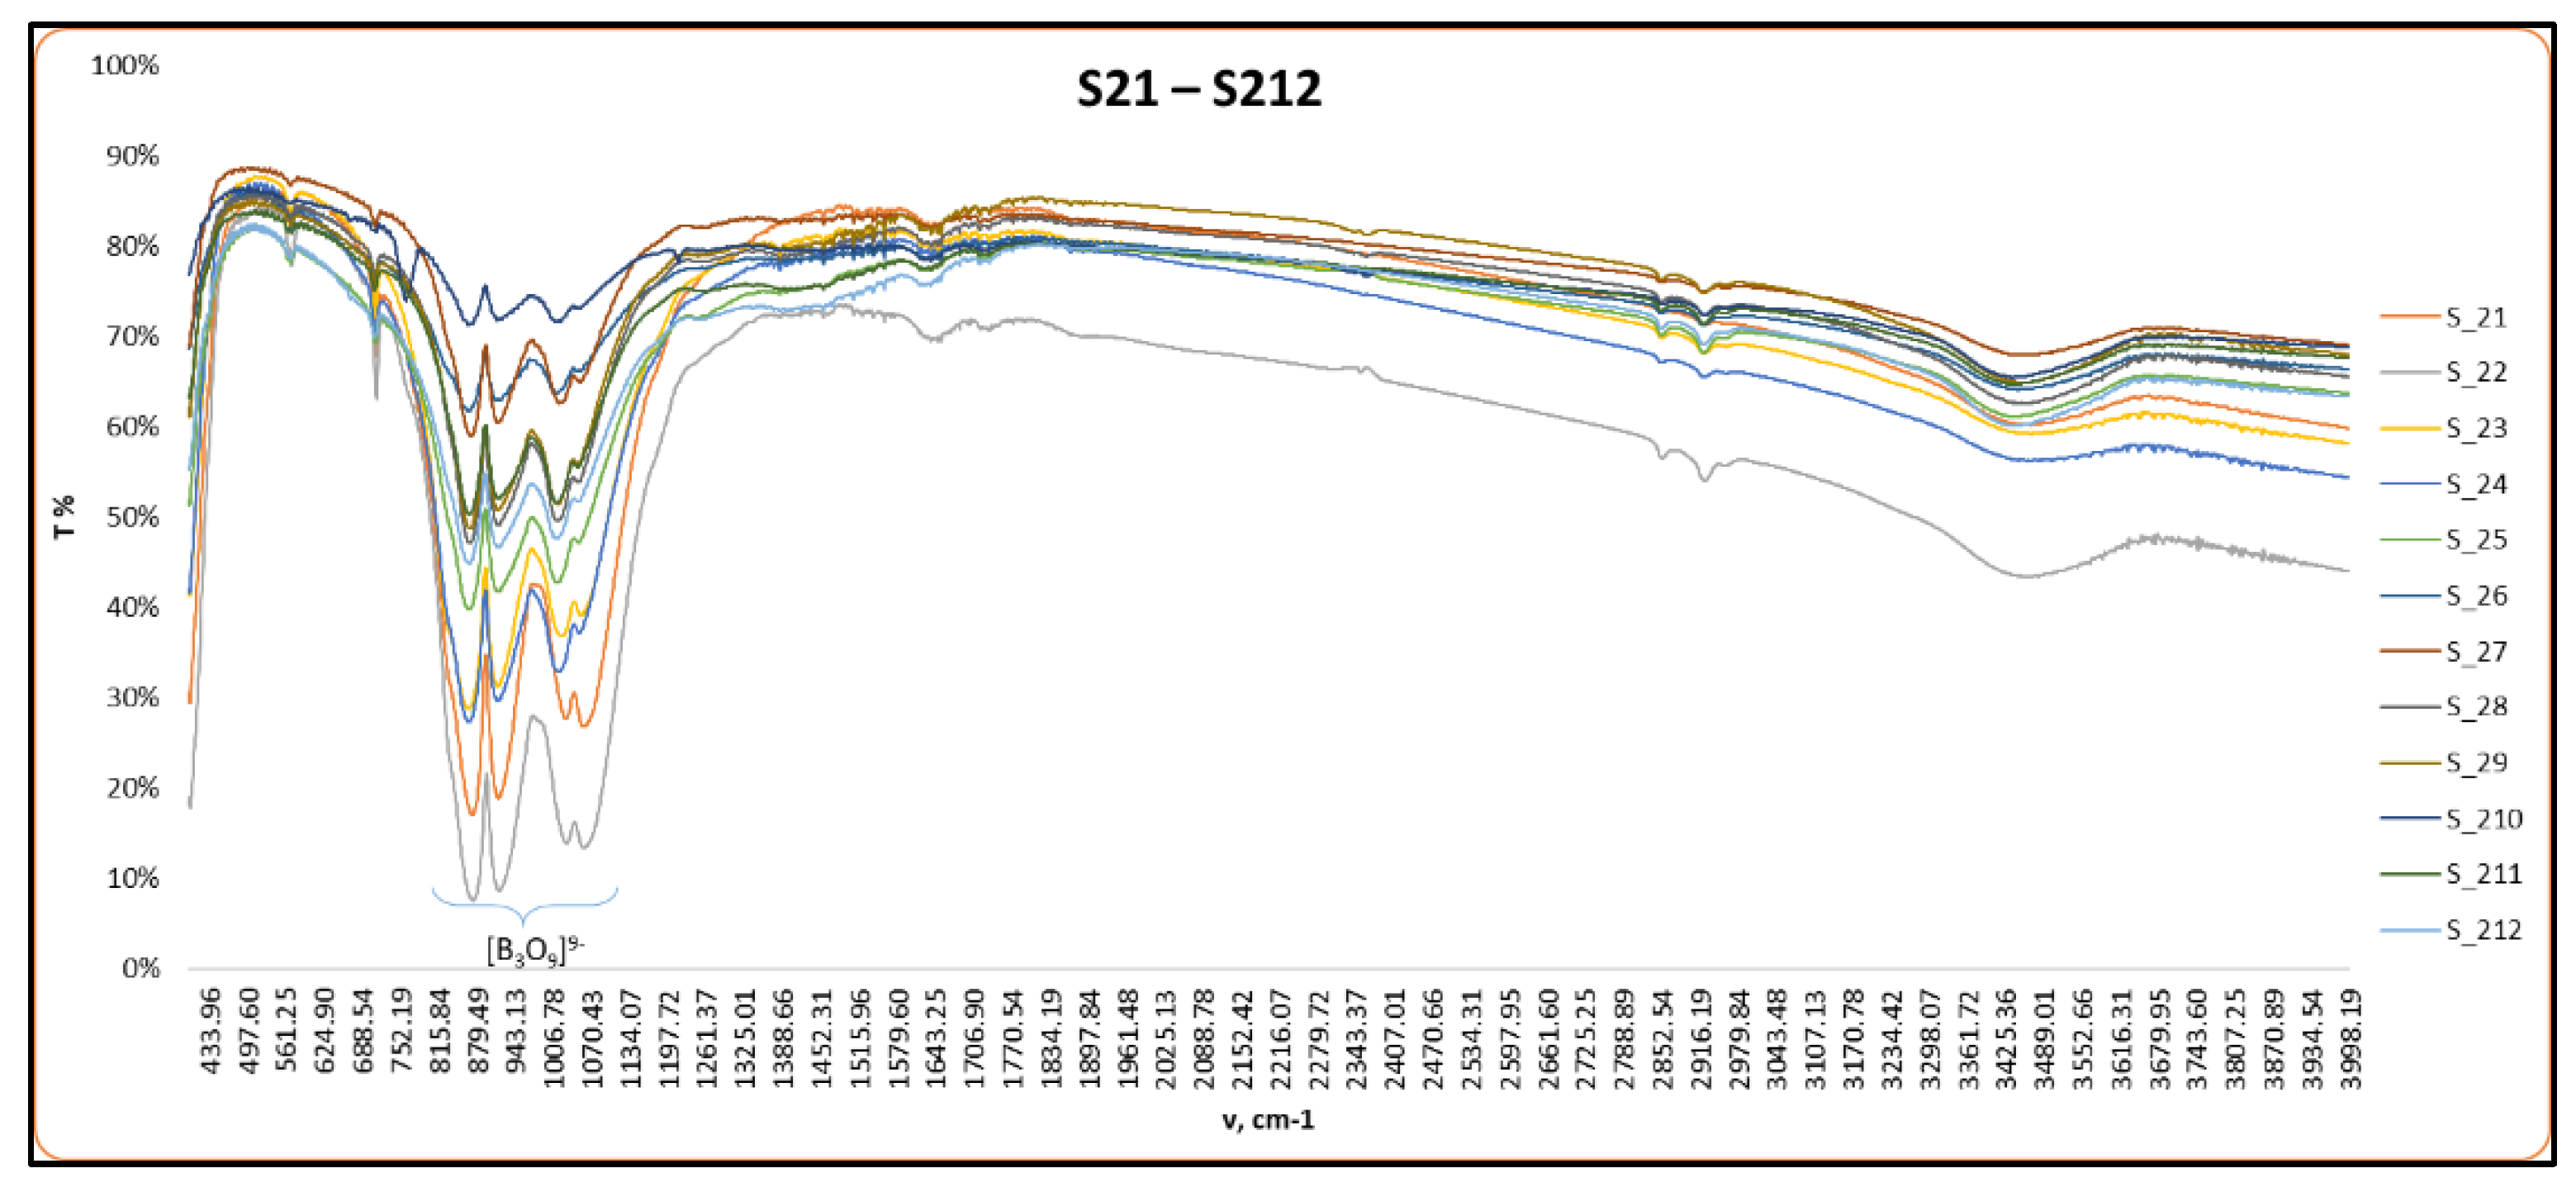
Figure 7.
FTIR spectra of samples S20-212 MW with variety excess of boric acid.
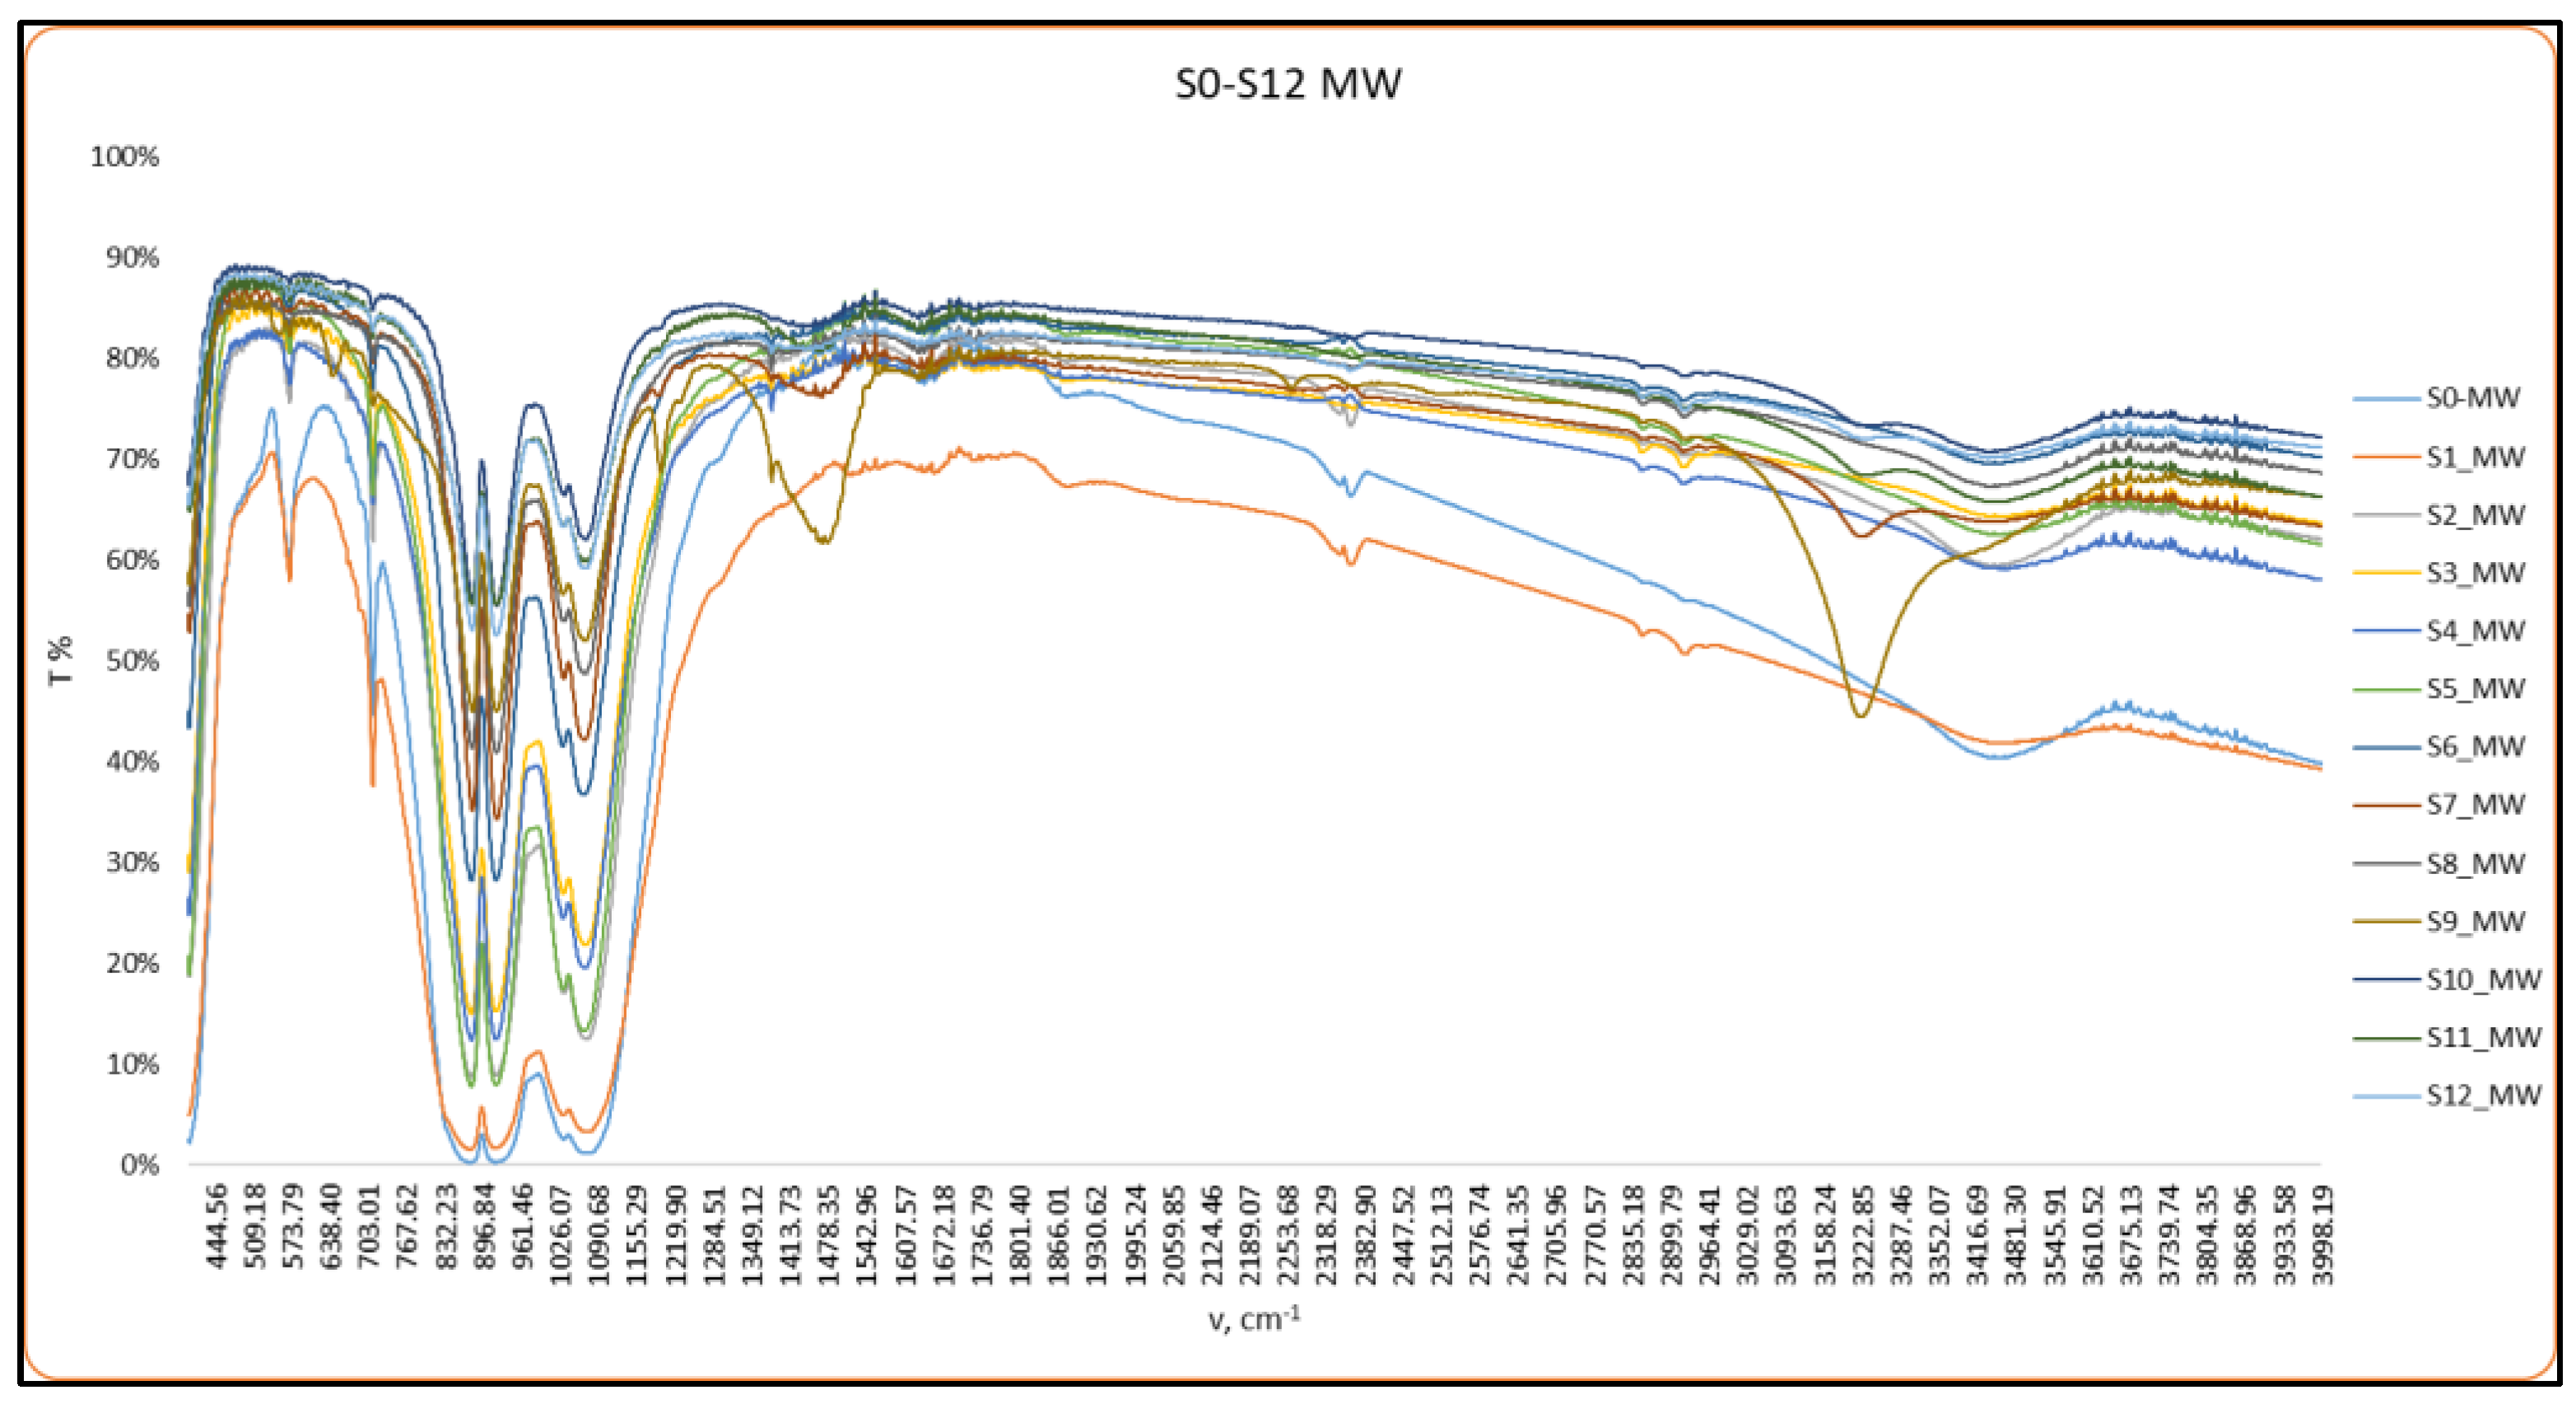
Figure 8.
Comparison between SS and MW samples: a) and b) fluorescence spectra for different excess boric acid percentages; c) and d) intensities at four peak wavelengths for 260 nm excitation vs. percentage of excess boric acid; e) and f) dependences of the O/R ratios on the excess boric acid percentage for 260 and 396 nm excitations.
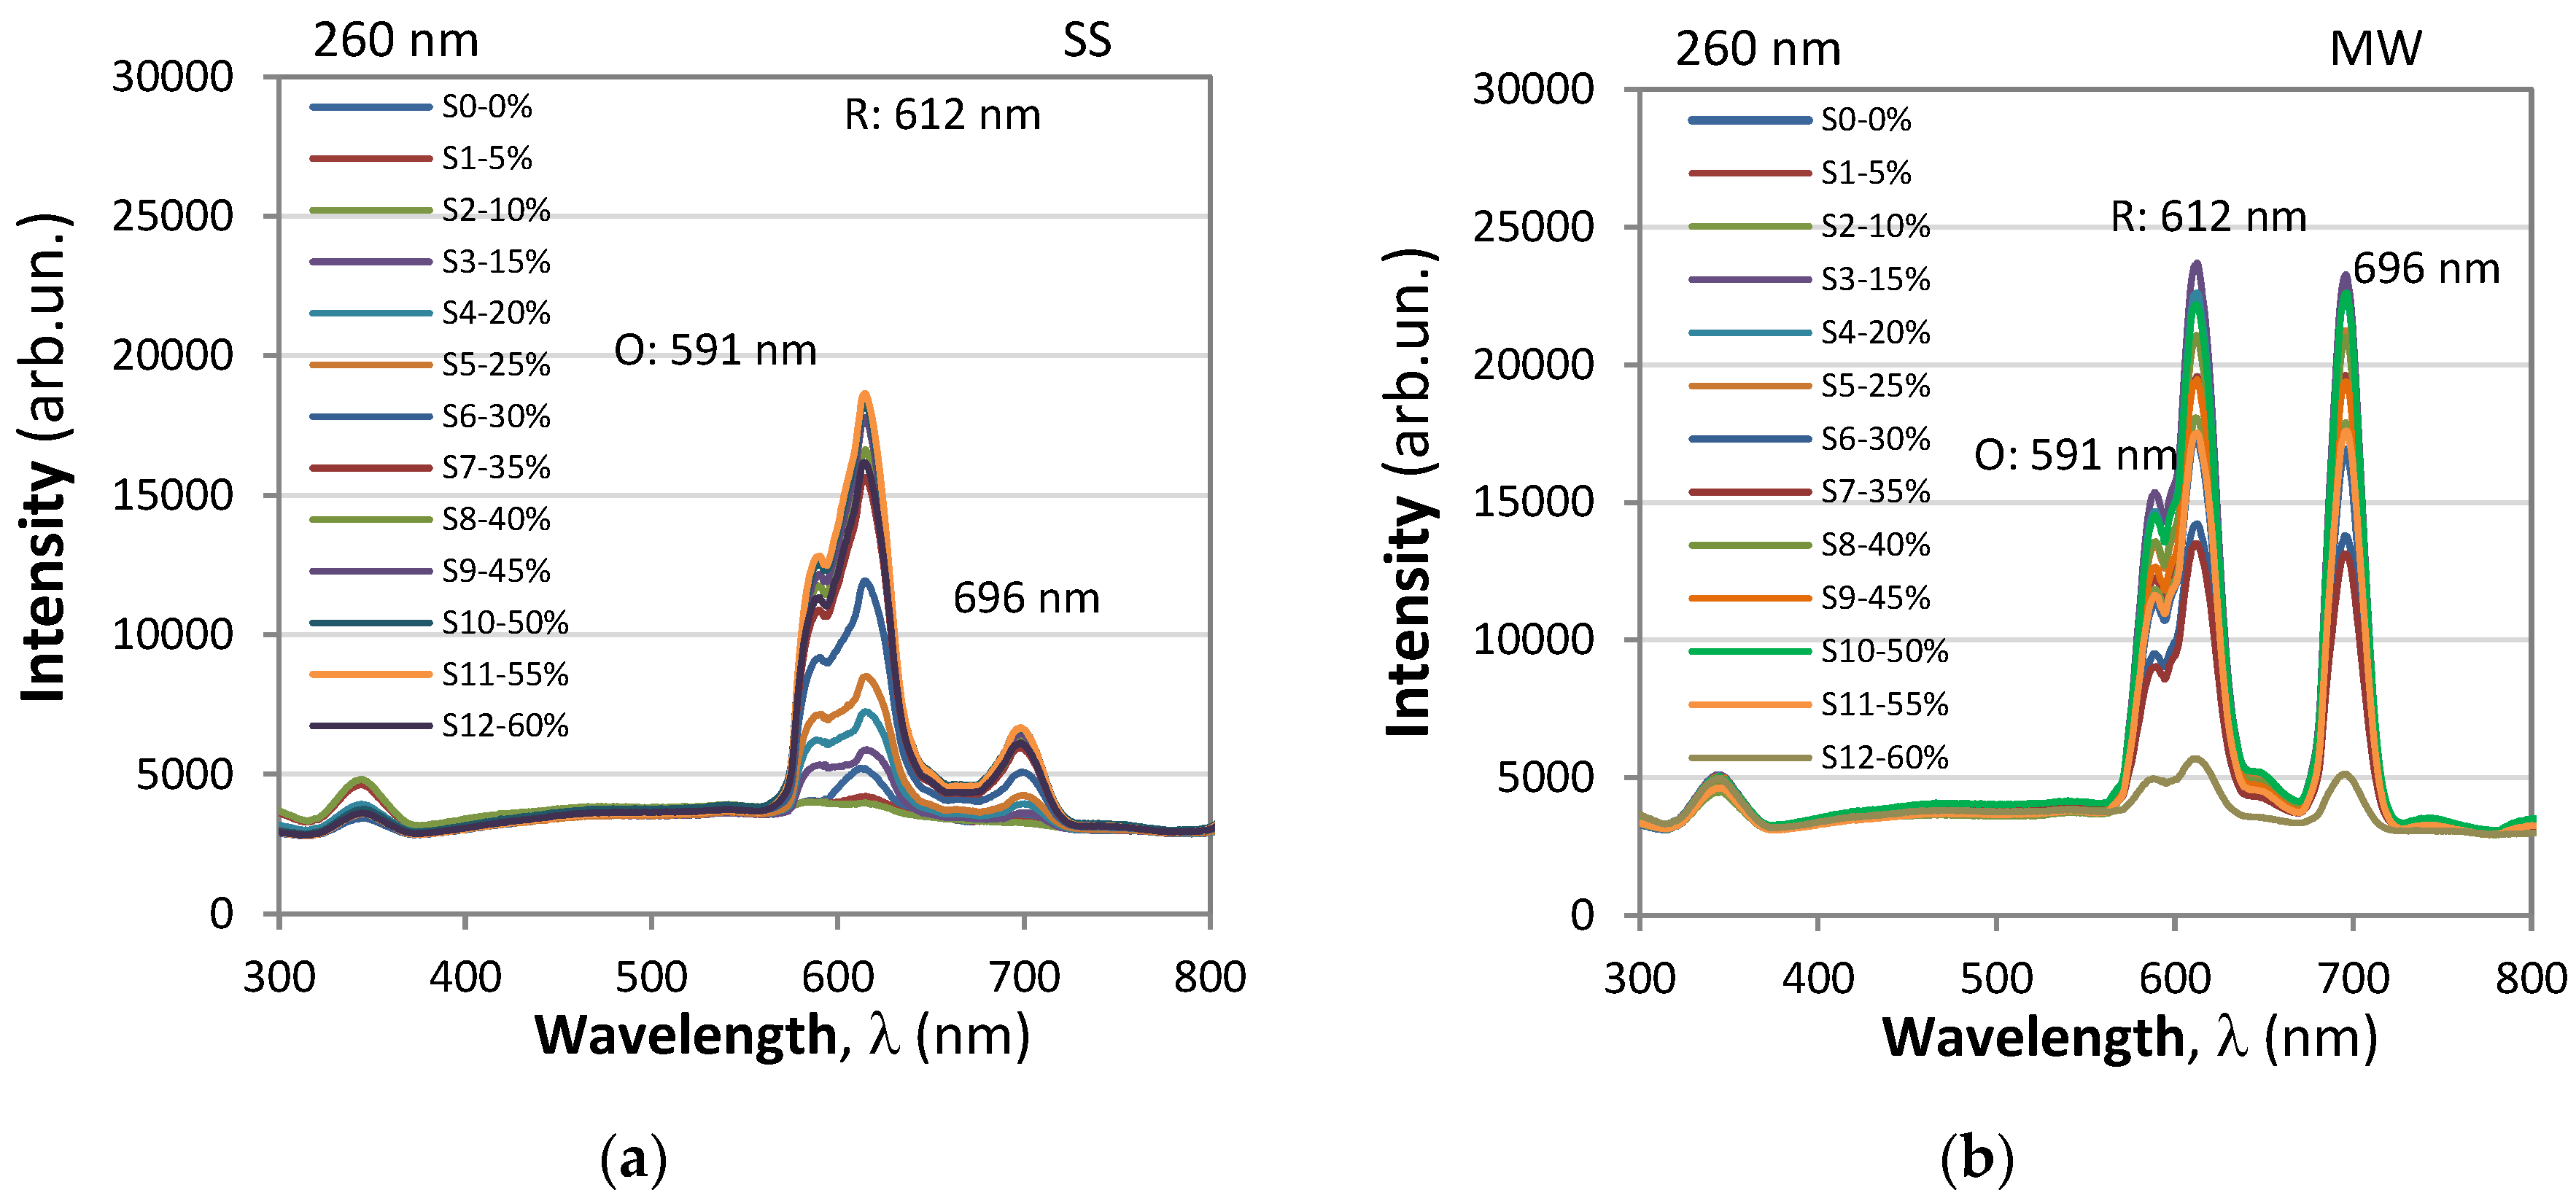
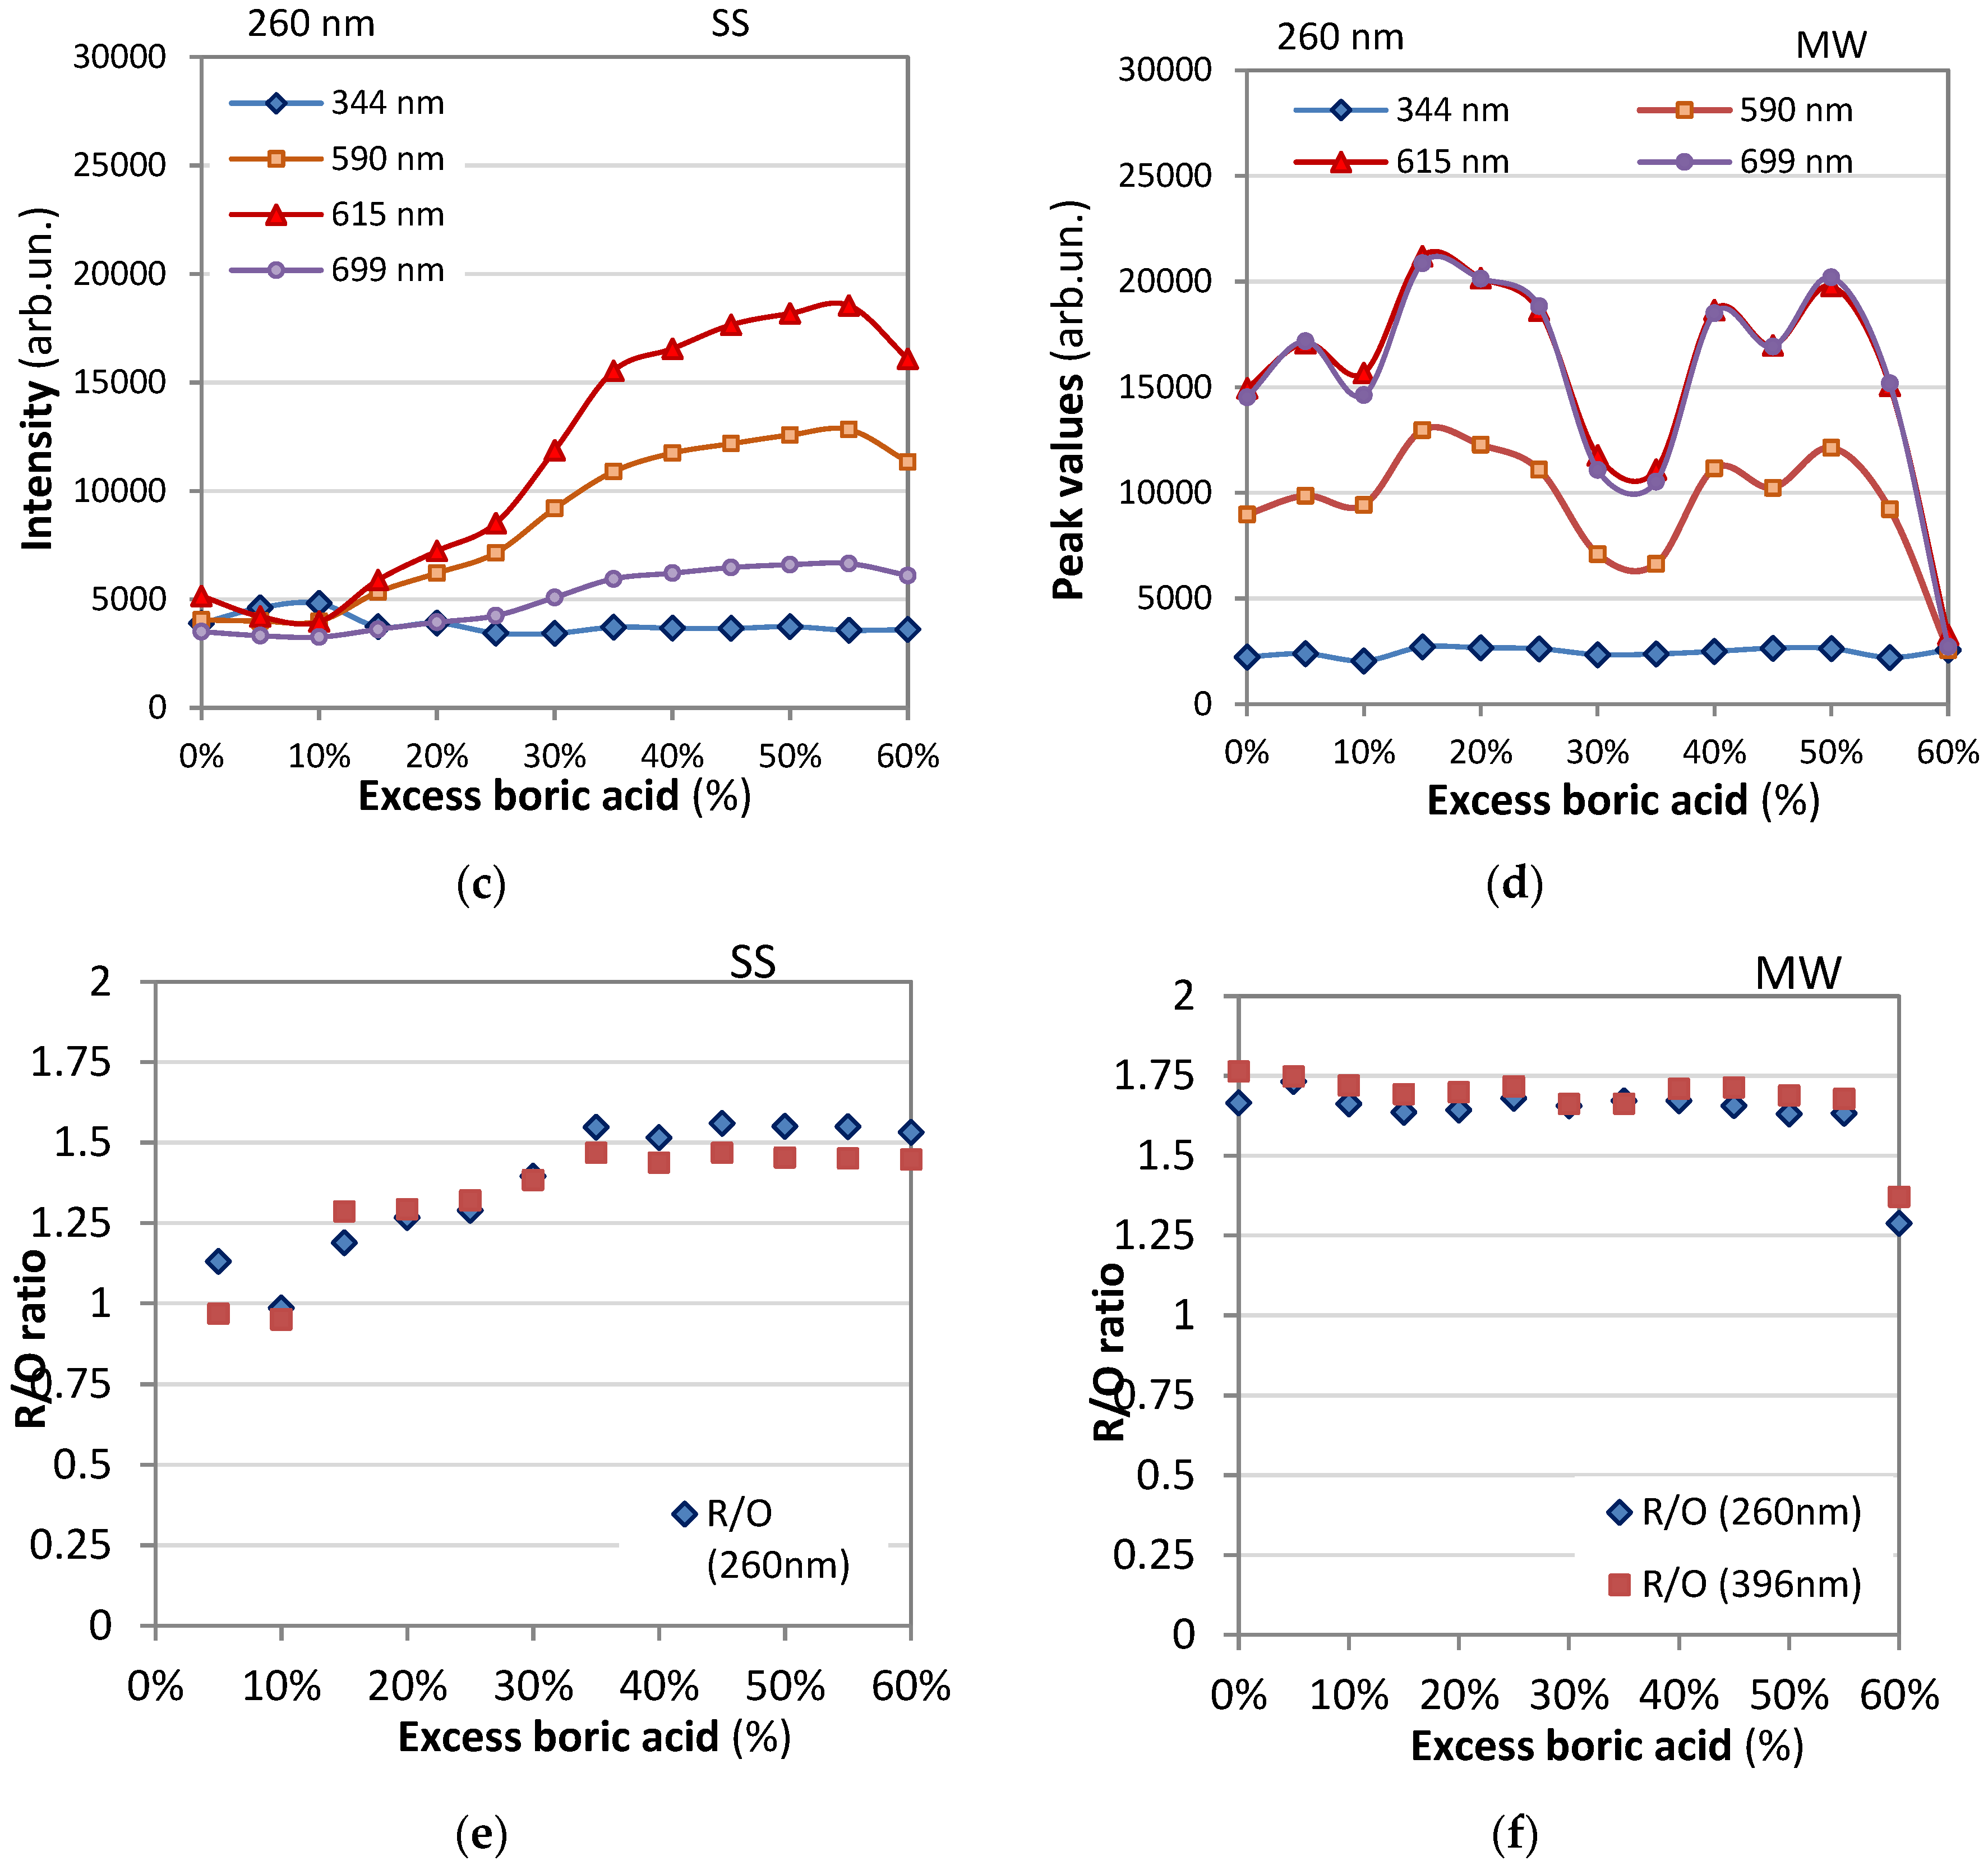

Table 1.
Description of samples.
| Sample code, series SS | Sample code, series MW | H3BO3, g (% excess) |
|---|---|---|
| S20 SS | S20 MW | 0.3537 (0 %) |
| S21 SS | S21 MW | 0.3713 (5%) |
| S22 SS | S22 MW | 0.3891 (10 %) |
| S23 SS | S23 MW | 0.4067 (15 %) |
| S24 SS | S24 MW | 0.4244 (20%) |
| S25 SS | S25 MW | 0.4421 (25 %) |
| S26 SS | S26 MW | 0.4598 (30 %) |
| S27 SS | S27 MW | 0.4772 (35 %) |
| S28 SS | S28 MW | 0.4949 (40 %) |
| S29 SS | S29 MW | 0.5126 (45 %) |
| S210 SS | S210 MW | 0.5303 (50 %) |
| S211 SS | S211 MW | 0.5479 (55 %) |
| S212 SS | S212 MW | 0.5656 (60 %) |
Disclaimer/Publisher’s Note: The statements, opinions and data contained in all publications are solely those of the individual author(s) and contributor(s) and not of MDPI and/or the editor(s). MDPI and/or the editor(s) disclaim responsibility for any injury to people or property resulting from any ideas, methods, instructions or products referred to in the content. |
© 2024 by the authors. Licensee MDPI, Basel, Switzerland. This article is an open access article distributed under the terms and conditions of the Creative Commons Attribution (CC BY) license (http://creativecommons.org/licenses/by/4.0/).
Copyright: This open access article is published under a Creative Commons CC BY 4.0 license, which permit the free download, distribution, and reuse, provided that the author and preprint are cited in any reuse.


