Submitted:
30 May 2024
Posted:
30 May 2024
You are already at the latest version
Abstract
This study examines the causal relationships between interest rates in the Korean financial market using a vector error correction model (VECM) and a Bayesian network. The Bayesian network, a novel approach in this context, identifies two distinct transmission channels: one led by call rates (reflecting monetary policy) and another by 10-year Treasury bond yields (reflecting fiscal policy). While the call rate channel aligns with traditional views, affecting bank lending rates, corporate bond spreads, and commercial paper rates, the 10-year Treasury yield channel highlights a separate fiscal policy transmission mechanism, influencing commercial paper rates indirectly through 30-year Treasury yields and directly impacting merchant bank lending rates. This finding suggests that fiscal intervention could potentially interfere with monetary policy, emphasizing the need for coordinated macroeconomic policy measures. The study also emphasizes the role of 10-year Treasury bonds as a benchmark in the Korean bond market, reflecting medium- to long-term economic outlooks and serving as the underlying asset for various derivatives.
Keywords:
interest rate transmission path
; Bayesian network
; Korean financial markets
; directed acyclic graph
; monetary policy
; fiscal policy
1. Introduction
Interest rates interact in a network in financial markets, and the nature of these interactions depends on the maturity and fungibility of the underlying debt instruments. Innovations introduced in one asset market can transmit to the entire interest rate network through causal interactions. Causal interaction between these interest rates has attracted the attention of numerous researchers.
Many studies have examined the interactions between different interest rates in the context of the transmission channel of monetary policy. Traditionally, Keynesians have viewed the interest rate as a key element in the transmission path for monetary policy, and they believe that changing the interest rate can affect the liquidity demand of households and businesses (Shin [1]). A monetary authority's intervention in the market affects short-term interest rates, which subsequently cascade through the term structure, sequentially impacting long-term rates.
The fiscal authorities also affect the short- and long-term interest rates by issuing government bonds. Fiscal policy to change the supply of government bond affects the short- and long-term interest rates of government bonds, but also impacts the supply and demand in the private debt instruments, resulting in the changes in their interest rates. Instead of selling government bonds, the fiscal authority may borrow money from banking institutions, including the central bank, although this is rare in the Korean economy. This can affect the interest rates similarly to how the monetary authority does it.
The linkage between multiple interest rates is affected by various factors, such as the degree of substitution on the market,1 the supply and demand situation on the financial markets, the macroeconomic scenario, and the interventions by the monetary and fiscal authorities. These factors, or the combination of them, change over time. Thus, the pattern of interest rate interactions can vary according to the economic situation at a particular time. A structural change in both the economic and financial markets can have a significant impact on how interest rates interact.
A comprehensive study on the impact of the 1997 foreign exchange crisis on interest rate interactions in the Korean financial market demonstrates this point. According to Shin [1], the causality between call and bank lending interest rates is mixed, depending on the period, when analyzing the relationship between call and bank lending interest rates.
Shin [1] analyzed the period after 1996, which included the period before the foreign exchange crisis in Korea, and found a unidirectional Granger causality between the call interest rate and the bank's loan interest rate. However, after 1999, a period exclusively after the foreign exchange crisis, a bi-directional Granger causality was observed, and after 2004, the bank's loan interest rate gradually changed to a unidirectional Granger causality affecting the call interest rate. Shin [1] further shows that a similar relationship exists between call interest rates and household loan interest rates, and concludes that Bank of Korea's call interest rate policy has gradually changed to follow market interest rate changes instead of leading them.
A similar study preceding Shin [1] also reported a relationship quite different from the traditional interest rate relationship. Park and Oh [2] examined the causal relationship between call interest rates, interest rates on certificates of deposits (CD), yields of the Monetary Stabilization Bond (MSB) with 2-year maturity, and 3-year Treasury bond (TB-3) yields. Contrary to conventional views, they found that call interest rates did not affect MSB and TB-3 yields, but CD interest rates unidirectionally affected call interest rates. These results are in line with Shin [1]’s argument that monetary policy is endogenously determined by macroeconomic conditions or market funding conditions. It appears the causal relationship between interest rates and Korean financial markets may be less clear than it is in traditional interest rate transmission mechanisms, according to Shin [1] and Park and Oh [2]. This motivates our study to seek a more nuanced understanding of interest rate linkages in Korean financial markets.
Some studies have suggested that the interconnectedness of interest rates is influenced by the degree of integration between financial markets. Hartman [3] examined the correlation between the 3-month CD rate and the Eurodollar deposit rate in the United States using data from 1971 to 1978. The findings revealed a unidirectional causality from the CD rate to the Eurodollar deposit rate during the period from 1971 to 1974, while a bi-directional causality was observed between 1975 and 1978. These results suggest that the interconnectedness of interest rates intensified as financial market integration deepened. These findings suggest that the integration of capital markets between the two countries has increased, leading to greater interconnectedness between the two markets. Lin and Swanson [4] also examined the causal relationship between interest rates in the United States, the United Kingdom, Germany, Switzerland, and Japan and eurozone interest rates, finding strong bidirectional causality between the two. This suggests that the interconnectedness of interest rates can be affected by the degree of financial market integration and the substitutability of financial assets. These findings imply that the degree of financial market integration can be assessed through an analysis of the interconnectedness of interest rates.
Building upon prior research, this study examines the interaction between various interest rates within the financial system from a new perspective. Specifically, we try to characterize the causal paths by identifying causality relationship between interest rates in the Korean financial market. To this end, we will identify and characterize the leading, dominant influencers which take lead in transmitting the information of innovations arrived in the Korean financial markets.
The study confirms the traditional view that short-term interest rates are an effective monetary policy transmission mechanism by identifying a statistically significant call interest rate path connecting call interest rate, bank interest rate, corporate bond spread, and commercial paper interest rate. This study shows that short-term interest rates are not the only pathway through which interest rates interact, and 10-year Treasury Bond (TB10) yields create a separate causal chain. This implies that fiscal policy has a separate mechanism to transmit interest rates, independent of the call rate route in the financial market.
This study is structured as follows. Section II introduces research methodology and data. Section III presents the empirical results. Section IV provides the discussion on the main results with summary and conclusion.
2. Materials and Methods
2.1. Data
In this study, we expand the scope of analysis by including various types of assets with diverse maturities, both in indirect and direct financial markets. It includes call interest rates, CP interest rates (90-day maturity), which represent the money market, the lending rates of merchant banks, bank loan interest rates, and trust account loan interest rates, which encompass the loan market. In the long-term debt market, the 3-year, 10-year, and 30-year Treasury bond (TB-3, TB-10, TB-30, respectively) yields as well as the AA-rated 3-year maturity corporate bond interest rate (or spread) were included. The study uses time series data on nine interest rates from January 2015 to February 2024.2 Summary statistics of these interest rates are presented in Table 1.3
2.2. Methodology
Two quantitative analysis techniques are applied to derive causal interactions between interest rates. This study employs a VECM to examine the interconnectedness between various interest rates and a Bayesian network model to characterize a causal interaction among these interest rates.
A Bayesian network is a probabilistic graphical model that expresses the joint distribution of n random variables through a directed acyclic graph (DAG) (Beretta et al. [5]). Due to its ability to capture conditional dependencies and causal relationships, the Bayesian network has been widely employed for data-driven causal inference in various fields, including economics and business, medicine, bioinformatics, physics, and earth sciences (Runge et al. [6]; Camps-Valls et al. [7]) In economics, Bayesian networks have been utilized to analyze the interactions in grain markets, energy markets such as electricity and natural gas, and to investigate the interdependencies between international stock markets (Park et al. [8], [9]; Park and Choi [10]).
Building upon the findings and methodologies of previous studies, this study aims to analyze the interactions between interest rates and the flow of value information. A distinctive feature of this methodology is the absence of any pre-imposed constraints on causality. This adherence to a constraint-free approach is to ensure the objectivity of the causal relationships derived from the data.
Granger causality is a widely used methodology in economic analysis to assess the causal relationship between time series variables (Granger [11]). Granger causality tests time-lagged causality and are most effective when the temporal precedence of the relevant variables is established. However, financial market participants exchange information in real time through various channels, making it difficult to identify a specific lag between macroeconomic information that influences interest rates and information on the supply and demand of financial assets. In particular, when the time lag between variables is shorter or longer than the experimental time lag, there is a high risk of obtaining spurious results (Runge et al. [6]).
Furthermore, Granger causality has limitations in inferring causal relationships among multiple variables. In particular, as the number of variables increases, the number of analytical targets grows exponentially, making it difficult to infer clear causal relationships. When inferring causal relationships among multiple variables by sequentially determining causal relationships through pairwise comparisons of 2-3 variables, there is a risk of ending up in circular loops. For instance, in the case of A→B→C→D→B, a cyclical loop is formed involving B, C, and D mediated by D. The risk of falling into such cyclical loops increases with the number of variables considered. However, Bayesian network models provide a theoretical framework for deriving acyclic causal relationships by precluding cyclical relationships. This study aims to derive contemporaneous causality without assuming time lags using the Bayesian network DAG methodology (Park et al. [8,9])
2.2.1. VECM
VECM is the first analytical framework to identify interactions between interest rates. Since econometric techniques for cointegration analysis and error correction modeling are well-documented in many previous studies (Johansen [12]; Johansen and Juselius [13,14,15]; Johansen [16]), we will just provide the essence of the model here.
Let denote a vector which includes p nonstationary variables (p=9 in this study). Assuming existence of cointegration, the data generating process of can be appropriately modeled in an error correction model (ECM) with k-1 lags (which is equivalent to a VAR with k lags):
where is the difference operator, is a (9 ⅹ 1) vector of variables, is a (9 ⅹ 9) coefficient matrix and , is a (9 ⅹ 9) matrix of short run dynamics coefficients, and is a (9 ⅹ 1) vector of innovations. The parameters on the above ECM can be partitioned to provide information on the long-run, short-run, and contemporaneous structure. The long-run structure can be identified through testing hypothesis on the , and the short-run structure can be identified through testing hypothesis on and (Bessler and Yang [17]). The contemporaneous structure on the innovations can be identified through a structural modeling of the observed innovations. In this study, we explore the contemporaneous structure of on the innovations through the analysis of their correlation matrix through DAG under a Bayesian network.
2.2.2. Causal Inference using Bayesian Networks
A Bayesian network is a type of probabilistic graphical model that utilizes DAGs. A Bayesian network B for a set of variables, is a pair , where represent DAG (Chickering [18]). Within a DAG, nodes V in one to-one correspondence with the variables M, and directed edges E that connect the nodes. The edges in E capture all statistical dependencies between the variables. The absence of an edge between two variables signifies their statistical independence.
In a DAG, the set of variables that have edges pointing to a specific node X ∈ V is called the "parents" of X, denoted as . The parent is also called Markovian parent, and is defined as follows. Let be the joint distribution of variables. A set of variables is a set to be the Markovian parents of if is a minimal set of predecessors of that renders independent of all its other predecessors. is any subset of M that satisfies the following (Pearl [20]
Formally a Bayesian network is defined as a pair over the variables M with edges and real-valued parameter . When the structure of a Bayesian network is known, it is possible to calculate the joint distribution of all the variables as the product of the conditional distributions on each variable given its parents.
where is a probability density function, given its parent. The structure of a Bayesian network imposes a set of independence constraints that must hold in any distribution that can be represented by a network with that structure. This is called causal Markovian condition, which imposes the constraint that each node is independent of its non-descendants given its parents. This means that once the values of a variable's parent (the variables that cause it directly) are known, then knowing the values of any variables that are not its descendants (future effects) will not provide any additional information about X. Thus, a causal Markov condition facilitates reasoning about causal relationships in a Bayesian network. In other words, we can calculate a variable's probability distribution by focusing on the direct causal influences (values of observed variables), which simplifies calculations and makes probabilistic inferences in complex causal systems easier (Bessler and Yang [17]; Hasan et al. [21]).
Multiple DAGs satisfy the causal Markovian conditions. These graphs are said to be Markovian equivalent to each other and constitute a Markovian equivalent class. DAGs with true causal relationships in the Markov Equivalent Class (MEC) are selected using the PC algorithm and Greedy Equivalent Search (GES). By sequentially testing all edges for conditional independence, the PC algorithm finds the optimal DAG. All undirected edges are tested for simple independence, and independent nodes are excluded first. Next, conditional independence tests are performed sequentially on the given parent nodes to remove conditionally independent edges. In this way, the optimal DAG can only be determined by the final remaining acyclic node.
The GES algorithm uses a score-based causal discovery method to identify the optimal DAG. The likelihood of data D is calculated as the product of each observation's probability. For model G, the likelihood of observed data is defined as follows (Beretta et al. [5]).
Every time an edge is added to the most likely graph, the likelihood value of the data increases. As a result, the data may be overfitted. To address this limitation, the likelihood score is regularized to reduce model complexity. Bayesian Information Criterion is the most commonly used function in the GES algorithm.
D represents data, m represents samples, and dim(G) represents parameters in the model. GES finds the optimal value by iteratively applying feed-forward and backward pruning until the likelihood no longer improves. The resulting edges form a DAG representing the optimal causal relationship.
GES also utilizes conditional information entropy4 as a score function (Warren and Setubal [22]; Wieczorek and Roth [23]; Cai et al. [24]). Conditional information entropy indicates the extent to which the uncertainty (or amount of information) of other variables reduces when the value of a specific variable is known.5 Conditional information entropy is defined as follows for variables X, Y, and Z.
where is a joint probability of X, Y, Z, is the conditional probability distribution, given Z. The GES algorithm calculates conditional information entropies between the candidate parent node and each node using the partial correlation coefficients in order to select the parent node that minimizes the amount of information of the node selected from the candidate parent node set. Optimal DAGs are derived by repeating this process.
In a few previous studies, Bayesian networks have been used in conjunction with multivariate models. Swanson and Granger [25] estimated a VAR model using four variables, derived conditional correlation coefficients from these residual correlation coefficient matrices, and derived a cyclic causal relationship between variables. Following the methodology of Haigh and Bessler [26], Park [8,9], and Park and Oh [27], we derive the residual correlation coefficient matrix between all variables using VECM. This matrix is then used to construct the DAG.
3. Results
3.1. Estimation of VECM
The Augmented Dickey-Fuller (ADF) test indicates that all nine interest rate series are non-stationary, each containing a unit root. However, the first-order differences of these series are stationary (Table 2).
Based on the Schwarz information criterion, the optimal lag order is determined to be 1. Subsequently, the cointegration test results presented in Table 3 confirm the presence of three cointegration vectors at the 0.05 significance level. Given the confirmed cointegration relationships, a VECM is estimated for the nine interest rate variables. Table 4 presents the correlation coefficient matrix of the residuals obtained from this model's estimation. Table 5 and Table 6 report the t-statistics of correlation coefficients and their p-values at the 0.05 level.
The residual correlation coefficient matrix offers insights into the contemporaneous interrelationships among the nine interest rate variables, although not all coefficients are statistically significant (Table 6). Table 4 reveals a high positive correlation between call rates and both bank lending rates and merchant bank lending rates. Call rates also demonstrate a strong linkage with the CP market, the corporate bond market, and the TB-3 market. Treasury yields exhibit high correlations with each other, suggesting that a shock to Treasury bonds of a specific maturity can influence interest rates on Treasury bonds of other maturities. The magnitude of these correlations decreases as the maturity difference between Treasury bonds widens, reflecting the term structure's characteristics.
Commercial paper markets and corporate bond markets show a close relationship as well. These two markets are used by creditworthy corporations as short-term and long-term borrowing markets. Apart from TB30 yields, these markets exhibit an inverse correlation with the Treasury markets. This means that the data set we adopted confirms the conventional notion that fiscal funding competes with private funding in the debt capital markets.
While the correlation coefficient analysis of the VECM residual term is a useful guidance to how various interest rates on the financial market relate to each other, the correlation matrix does not provide information on the causal relationships between these interest rates. To characterize causal relationships, a DAG analysis is conducted under a Bayesian network.
3.2. Identifying Causal Relationship Between Interest Rates Under a Bayesian Network
The GES algorithm6 is used to construct optimal DAGs from the residual term correlation coefficient matrix of Table 4. In this study, we first examine the DAG structure before applying statistical significance tests. We then proceed to examine the refined DAG structure after conducting statistical significance tests at the 0.05 level. The GES algorithm does not directly provide the information needed for statistical significance testing of DAGs. Therefore, we estimate the conditional and unconditional correlation coefficients of all edges comprising the DAG. By identifying the parent node for each edge in the DAG structure, we estimate the conditional correlation coefficient of each edge using the residual correlation coefficient information. The conditional correlation coefficients are estimated using the following equation:
where denote the two nodes that make an edge, and represents the conditional correlation coefficient of an edge that links nodes , given the parent node . denotes the unconditional correlation coefficient of .
Figure 1 shows the DAG structure derived from GES algorithm, before the significance test. Table 7 shows conditional correlation coefficients of the edges that were estimated by using the residual correlation coefficient matrix and the DAG structure in Figure 1. The numbers on the edges in Figure 1 denote the conditional/unconditional correlation coefficients of the corresponding edges, given their parent nodes. Figure 1 illustrates all potential causal chains among interest rates in the financial markets, given the dataset.
Figure 1 identifies that two dominant interest rates that lead the causal chains. i.e., call interest rates and the TB-10 yields. These two rates serve as parent nodes in the overall DAG structure. This indicates that these two interest rates are the primary drivers of value within the interest rate network. TB-10 yields are the most influential, with an out-degree of 5, directly affecting interest rates for bank loans, trust account loans, merchant bank loans, spreads, and TB-30 yields.
The transmission path led by call rates also indicates their influence, directly affecting spread and CP interest rates. Call rates indirectly influence CP rates through both bank loan interest rates and TB-30 yields.
Treasuries form their own causal chain, with TB-10 yields directly influencing five other interest rates. TB-10 yields influence corporate bond spreads and commercial paper interest rates through bank interest rates. Through TB-30 yields, they also influence interest rates on trust account loans, commercial paper, and merchant bank loans.
However, Figure 1 reveals no causal relationships between TB-3 yields and other interest rates. This lack of connection likely stems from insufficient interaction between TB-3 yields and other interest rates to establish causality, thus TB-3 yields do not meet the causal Markovian condition.
Now, let's examine how the statistical significance test modifies the DAG structure in Figure 1. Table 6 and Table 8 present the results of significance tests conducted on the correlation coefficients in Table 4 and the conditional correlation coefficients in Table 7, respectively. Figure 2 illustrates the DAG consisting of edges that are statistically significant at the 0.05 level, obtained by pruning statistically insignificant edges from Figure 1.
In Figure 2, two edges—Call rates → Spread and Call rates → TB-30 yields—are pruned due to their failure to reach statistical significance at the 0.05 level. The statistically significant path led by call rates is only one set of edges sequentially connecting the Call rate to the bank loan interest rate, then to the spread, and finally to the CP rate:
Call rates → Bank interest rates → Spread → CP rates.
This implies that call rates directly affect bank credit markets. However, call rates only indirectly affect the money market and corporate bond markets, as they lose a direct causal connection to money markets and bond markets. Based on this result, it is evident that the impact of monetary policy on the call rate is transmitted to both the money and private debt markets, as well as the credit market. As the edge that links the call rate and TB30 yields is found insignificant, the call rates lost the causal linkage with public debt markets. This implies that monetary intervention via call rates may have only limited impact on the long-term interest rates, including Treasury bond yields.
The significance test also refines the causal paths led by TB-10 yields. The direct impact of TB-10 yields on bank lending rates, trust account lending rates, and corporate bond spread is lost with significance test at the 0.05 level. Thus, the TB-10 yields route is simplified into two statistically significant interest transmission paths: one, TB-10 yields constitute a causal chain through TB-30 yields to CP rates and, two, TB-10 yields directly connect to merchant bank loans interest rates:
TB-10 yields → TB-30 yields → CP rates.
TB-10 yields → Merchant Bank lending rates.
TB-10 yields → Merchant Bank lending rates.
While the significance test results in a sparser causal impact of TB-10 yields, it is clear that TB-10 yields lead a strong causal impact on both merchant banking sector and the money markets. One interesting observation is that the causal linkage between TB-10 yields and corporate bond spreads is lost, as it cannot survive the significance test. This means that the impact of Treasuries on the corporate bond markets may not be stronger than the conventional views at least in the Korean markets. Further, the significance test clearly separates the causal paths of call rates and TB-10 yields. This implies that fiscal policy has a separate mechanism to affect interest rates, without incurring disruptions on the interest rates led by the call rates.
IV. Discussion
This study identifies two distinct causal chains that transmit innovations within the Korean financial market's interest rate network: one led by call interest rates and the other by 10-year Treasury bond (TB-10) yields. Comparing the DAG structures before and after statistical significance tests illustrates how these tests refine the initial DAG structure produced by the GES algorithm.
The call interest rate path, linking the call rate, bank interest rate, corporate bond spread, and commercial paper interest rate, is statistically significant. This finding aligns with the traditional view that short-term interest rates serve as an effective transmission mechanism for monetary policy. However, this result also suggests that the impact of monetary policy might be limited to the corporate bond market, as call rates only influence corporate bonds with three-year maturities, not Treasury bonds with ten- or thirty-year maturities. This further implies that monetary intervention through call rates may not effectively reach long-term interest rates, including those of Treasury bonds.
This study reveals that Treasury bonds form their own causal chain, with TB-10 yields leading two statistically significant interest transmission paths: (1) TB-10 yields indirectly influence CP rates through TB-30 yields, and (2) TB-10 yields directly affect merchant bank lending rates. The results of this study align with market practitioners' views that TB-10 yields play a crucial role in Korean financial markets. Indeed, TB-10 yields occupy a prominent position in the interest rate network due to several factors. Firstly, TB-10 has emerged as the benchmark in the Korean bond market due to its stability and liquidity. TB-10 boasts the highest issuance and trading volume among all Treasury bond maturities, establishing it as the most stable and liquid bond in the market. This characteristic makes it an ideal benchmark for pricing other bonds and financial products. Secondly, TB-10 yields reflect the medium- to long-term economic outlook of market participants. They are a crucial indicator of market expectations regarding key macroeconomic variables such as economic growth and inflation. Thirdly, TB-10 serves as the underlying asset for various derivatives, such as Treasury bond futures, and as a benchmark for determining the yields of other Treasury bond maturities and the interest rates of various financial products.
This study proposes a new interpretation of the crowding-out effect. Figure 2 suggests that the potential crowding-out effect of fiscal policy may be more pronounced in short-term markets than in long-term private debt markets. This is because TB-10 yields significantly impact CP interest rates and merchant bank interest rates, while the link between Treasury yields and bonds has been refined due to its lack of statistical significance. Therefore, the crowding-out effect of increased Treasury issuance is transmitted more acutely to the money market, a phenomenon not previously addressed.
Fiscal policy operates through a distinct interest rate transmission mechanism, independent of the call rate route, as the TB-10 yield transmission path does not overlap with the call interest rate transmission path. The existence of a separate causal path for Treasuries raises the possibility that fiscal intervention may interfere with monetary intervention. Addressing macroeconomic imbalances through interest rate transmission mechanisms necessitates a well-coordinated blend of fiscal and monetary policy measures.
This study demonstrates that the GES algorithm derives an optimal DAG by selecting edges that maximize the likelihood function derived from the data. This DAG represents all potential causal chains implied by the data between variables, although not all edges are statistically significant. Furthermore, we show that statistical significance tests refine the DAG structure by eliminating insignificant edges. However, to better understand the causal relationships between variables, it is crucial to analyze both the initial and refined DAG structures, before and after statistical significance tests, respectively. The initial DAG structure reveals all potential causal relationships between interest rates. As the economic environment evolves, these potential causal relationships can transform into significant causal chains.
As Shin [1] demonstrates, extreme structural changes within a country can alter the causal relationships between interest rates, potentially impacting their strength and statistical significance. Consequently, DAG structures derived from data in a specific period may not be static; they can exhibit variations depending on structural shifts in the economic environment. The analytical tools employed in this study enable us to track the evolution of causal chain structures and the strength of causal relationships between interest rates in response to changes in economic structures.
This study focused on analyzing the interest rates of financial assets within the financial market. However, stocks and real estate serve as the closest substitutes for financial assets within the broader economic system. Changes in the returns on these assets are expected to affect the interactions between interest rates. This study can be extended to examine the impact of these asset returns on the interest rate causal chain.
In addition, the Korean financial market is open, permitting free capital inflows and outflows through its short- and long-term capital markets, which integrate the Korean financial market with the international financial market. International markets might result in causal interactions between domestic and international markets, leading to new causal relationships between interest rates. By studying the effect of international markets of international markets on local interest rate transmission paths, we can gain deeper insights into the causal relationships between interest rates.
References
- Shin, Y.S. The Call Rate and Channels of Monetary Transition Financial Research Report 2008. 2. Korea Institute of Finance.
- Park, H.; Oh, W. A Test for Exogeneity of Monetary Policy in Korea: An Application of DAG. Applied Economics 2007, Vol 9, 3. 93-118.
- Hartman, D.G. The international financial market and US interest rate. Journal International Money and Finance 2003, Vol. 3, 77. 107-113.
- Lin, A.; Swanson, P. E. Measuring Global Money Market Inter-relationships: An Investigation of Five Major World Currencies. Journal of Banking and Finance 1993, 17, 609–628. [Google Scholar] [CrossRef]
- Beretta, S.; Castelli, M; Gonçalves, I; Henriques, R; Ramazzotti, D. Learning the Structure of Bayesian Networks: A Quantitative Assessment of the Effect of Different Algorithmic Schemes. D. Koller and N. Friedman, Probabilistic Graphical Models: Principles and Techniques, MIT Press. 2009.
- Runge, J.; Bathiany, S.; Bollt, E; Camps-Valls, G.; Coumou, D.; Deyle, E.; Glymour, C.; Kretschmer, M.; Mahecha, M. D.; Muñoz-Marí, J.; van Nes, E. H.; Peters, J.; Quax, R.; Reichstein, M.; Scheffer, M.; Schölkopf, B.; Spirtes, P.; Sugihara, G.; Sun, J.; Zhang, K.; Zscheischler, J. Inferring causation from time series in Earth system sciences. Nature Communications 2019, 1-13.
- Camps-Valls, G.; Gerhardus, A.; Ninad, U.; Varando, G.; Martius, G.; Balaguer-Ballester, E.; Vinuesa, R.; Diaz, E.; Zanna, L.; Runge, J. Discovering causal relations and equations from data. Physics Reports 2023, 1044, 1–68. [Google Scholar] [CrossRef]
- Park, H.; Mjelde, J. W.; Bessler, D. A. Price Dynamics Among U. S. Electricity Spot Markets. Energy Economics 2006, 28(1), 81–101. [Google Scholar] [CrossRef]
- Park, H.; Mjelde, J. W.; Bessler, D. A. Price Interactions and Discovery Among Natural Gas Spot Markets in North America. Energy Policy 2008, 36(1), 290–302. [Google Scholar] [CrossRef]
- Park, H.; Choi, B. A Study on Interdependency in East Asian Stock Markets, Journal of Trade Credit Insurance Research 2018, Vol 19, 1.99-121.
- Granger, C. W. J. Testing causality: a personal viewpoint. Journal of Economic Dynamics and Control 1980, 2, 329–352. [Google Scholar] [CrossRef]
- Johansen, S. Determination of Cointegration Rank in the Presence of a Linear Trend. Oxford Bulletin of Economics and Statistics 1992, 54(3), 383–397. [Google Scholar] [CrossRef]
- Johansen, S.; Juselius, K. Maximum Likelihood Estimation and Inference on Cointegration with Applications to the Demand for Money. Oxford Bulletin of Economics and Statistics 1990, 52(2), 169–210. [Google Scholar] [CrossRef]
- Johansen, S.; Juselius, K. Testing structural hypotheses in a multivariate cointegration analysis of the PPP and the UIP for UK. Journal of Econometrics 1992, 53, 211–244. [Google Scholar] [CrossRef]
- Johansen, S. , Juselius, K. Identification of the long-run and the short-run structure: an application to the ISLM model. Journal of Econometrics 1994, 63, 7–36. [Google Scholar]
- Johansen, S. Identifying restrictions of linear equations with applications to simultaneous equations and cointegration. Journal of Econometrics 1995, 69, 111–132. [Google Scholar] [CrossRef]
- Bessler, D. A.; Yang, J. The Structure of Interdependence in International Stock Markets. Journal of International Money and Finance 2003, 22(2), 261–287. [Google Scholar] [CrossRef]
- Chickering, D.M. Learning Equivalence Classes of Bayesian-Network Structures. Journal of Machine Learning Research 2002, 2, 445–498. [Google Scholar]
- Chickering, D.M.; Meek, C. Selective Greedy Equivalence Search: Finding Optimal Bayesian Networks Using a Polynomial Number of Score Evaluations. 2015, arXiv:1506.02113v1 [cs.LG].
- Pearl, J. Causality: Models, Reasoning, and Inference. Cambridge Press. 2000.
- Hasan, U.; Gani, M.O. KGS: Causal Discovery Using Knowledge-guided Greedy Equivalence Search. 2023. arXiv:2304.05493v1 [cs.AI].
- Warren, A.; Setubal, J. Using Entropy Estimates for DAG-Based Ontologies. 19 Jun 2017. arXiv:1403.4887v2 [cs.CL].
- Wieczorek, A.; Roth, V. Information Theoretic Causal Effect Quantification. Published: 5 October 2019. MDPI (http://creativecommons.org/licenses/by/4.0/).
- Cai, R.; Chen, W.; Qiao, J.; Hao, Z. On the Role of Entropy-Based Loss for Learning Causal Structure with Continuous Optimization. IEEE Transactions on Neural Networks and Learning Systems. 2021.
- Swanson, N. R.; Granger, C. W. J. Impulse Response Functions Based on a Causal Approach to Residual Orthogonalization in Vector Autoregressions. Journal of the American Statistical Associations 1997, 92(437), 357–367. [Google Scholar] [CrossRef]
- Haigh, M.; Bessler, D. Causality and Price Discovery: An Application of Directed Acyclic Graphs. Journal of Business 2003, 77(4), 1099–1121. [Google Scholar] [CrossRef]
- Park, H.; Oh, W. Contemporaneous Causal Relationship Among LIBORs using Graph Theory. Kukje Kyungje Yongu 2009, Volume 15 Number 2. August 2.
- Shannon, C. Mathematical Theory of Communication. The Bell System Technical Journal 1948, Vol. 27, pp. 379–423, 623–656, July, October.
- Chickering, D. M. Optimal Structure Identification with Greedy Search. Journal of Machine Learning Research 2002, 3, 507–554. [Google Scholar]
- Granger, C. W. J. Some Recent Developments in a Concept of Causality. Journal of Econometrics 1988, 39(1-2), 199-211.
- Hamilton, J. D. Time Series Analysis, Princeton: Princeton University Press. 1994.
- Masih, A.M.M., Masih, R. 1995. Temporal causality and the dynamic interactions among macroeconomic activity within a multivariate cointegrated system: Evidence from Singapore and Korea. Weltwirtschaftliches Archiv 131, 265–285.
- McKinnon, James. 1991. Critical Values for Cointegration Tests, in R. F. Engle and C. W. J. Granger, eds., Long-Run Economic Relationships: Readings in Cointegration, New York: Oxford University Press, 267-276.
- MacKinnon, J.G., Haug, A.A.; Michelis, L. Numerical Distribution Functions of Likelihood Ratio Tests for Cointegration. Journal of Applied Econometrics 1999, 14, 563–577. [CrossRef]
- Meek, C. 1997. Graphical Models: Selecting Causal and Statistical Models. Unpublished Ph. D. Dissertation, Carnegie Mellon University.
- Phillips, P. C. B.; Perron, P. Testing for a unit root in time series regression. Biometrika 1988, 75(2), 335–346. [Google Scholar] [CrossRef]
- Ramsey, J.; Glymour, M.; Sanchez-Romero, R.; Glymour, C. A million variables and more: the Fast Greedy Equivalence Search algorithm for learning high-dimensional graphical causal models, with an application to functional magnetic resonance images. Int J Data Sci Anal 2017 March; 3(2): 121–129. [CrossRef]
- Spirtes, P.; Glymour, C.; Schines, R. Causation, Prediction and Search, Cambridge, MA: MIT Press. 2000.
- Teague, H.; Gates, K. Causal search procedures for fMRI: review and suggestions. The Behaviormetric Society, 2016. 1 December.
- Yang, J.; Shin, J.; Khan, M. Causal linkages between US and Eurodollar interest rates: Further evidence. Applied Economics 2007, 39(2), 135–144. [Google Scholar] [CrossRef]
- Swanson, P. E. Capital Market Integration over the Past Decade: The Case of US Dollar. Journal of International Money and Finance 1987, Vol.6 215-225.
Figure 1.
Interest Rates DAG. Each edge is represented by a correlation coefficient or conditional correlation coefficient, as shown in Table 4 and Table 7.
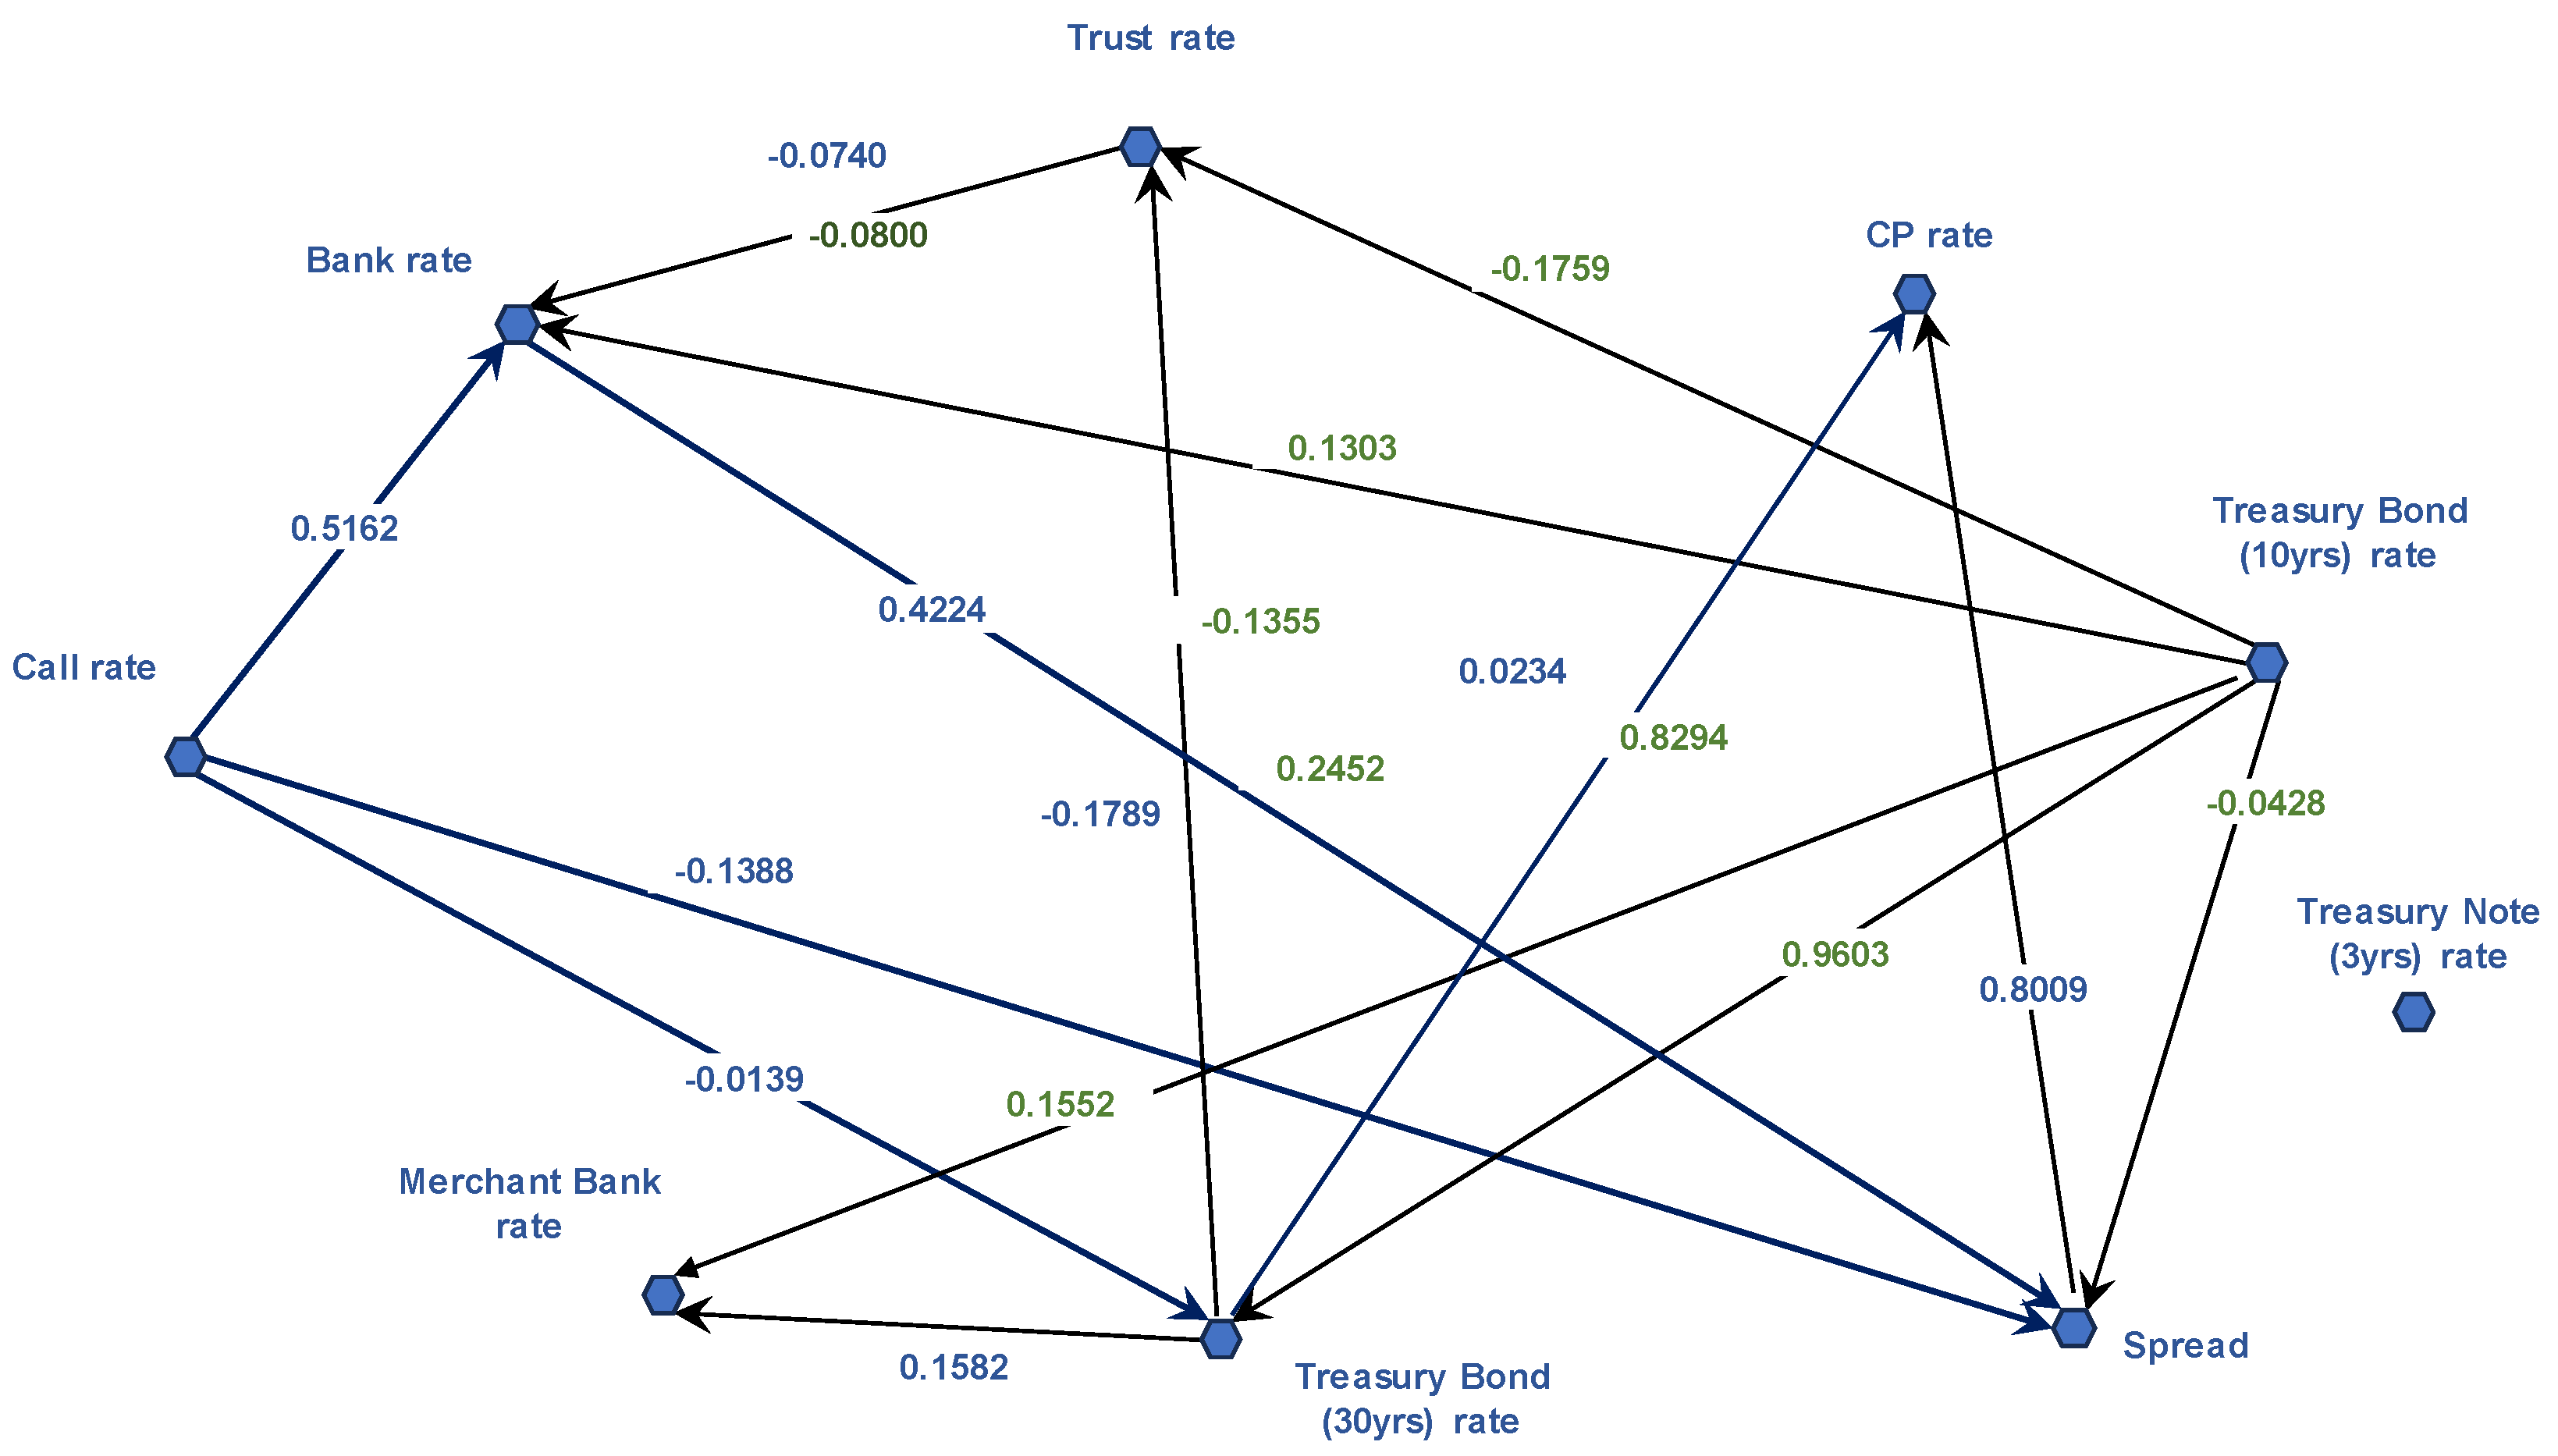
Figure 2.
Statistically Significant DAG Structure. DAG is significant at the level of 5%.
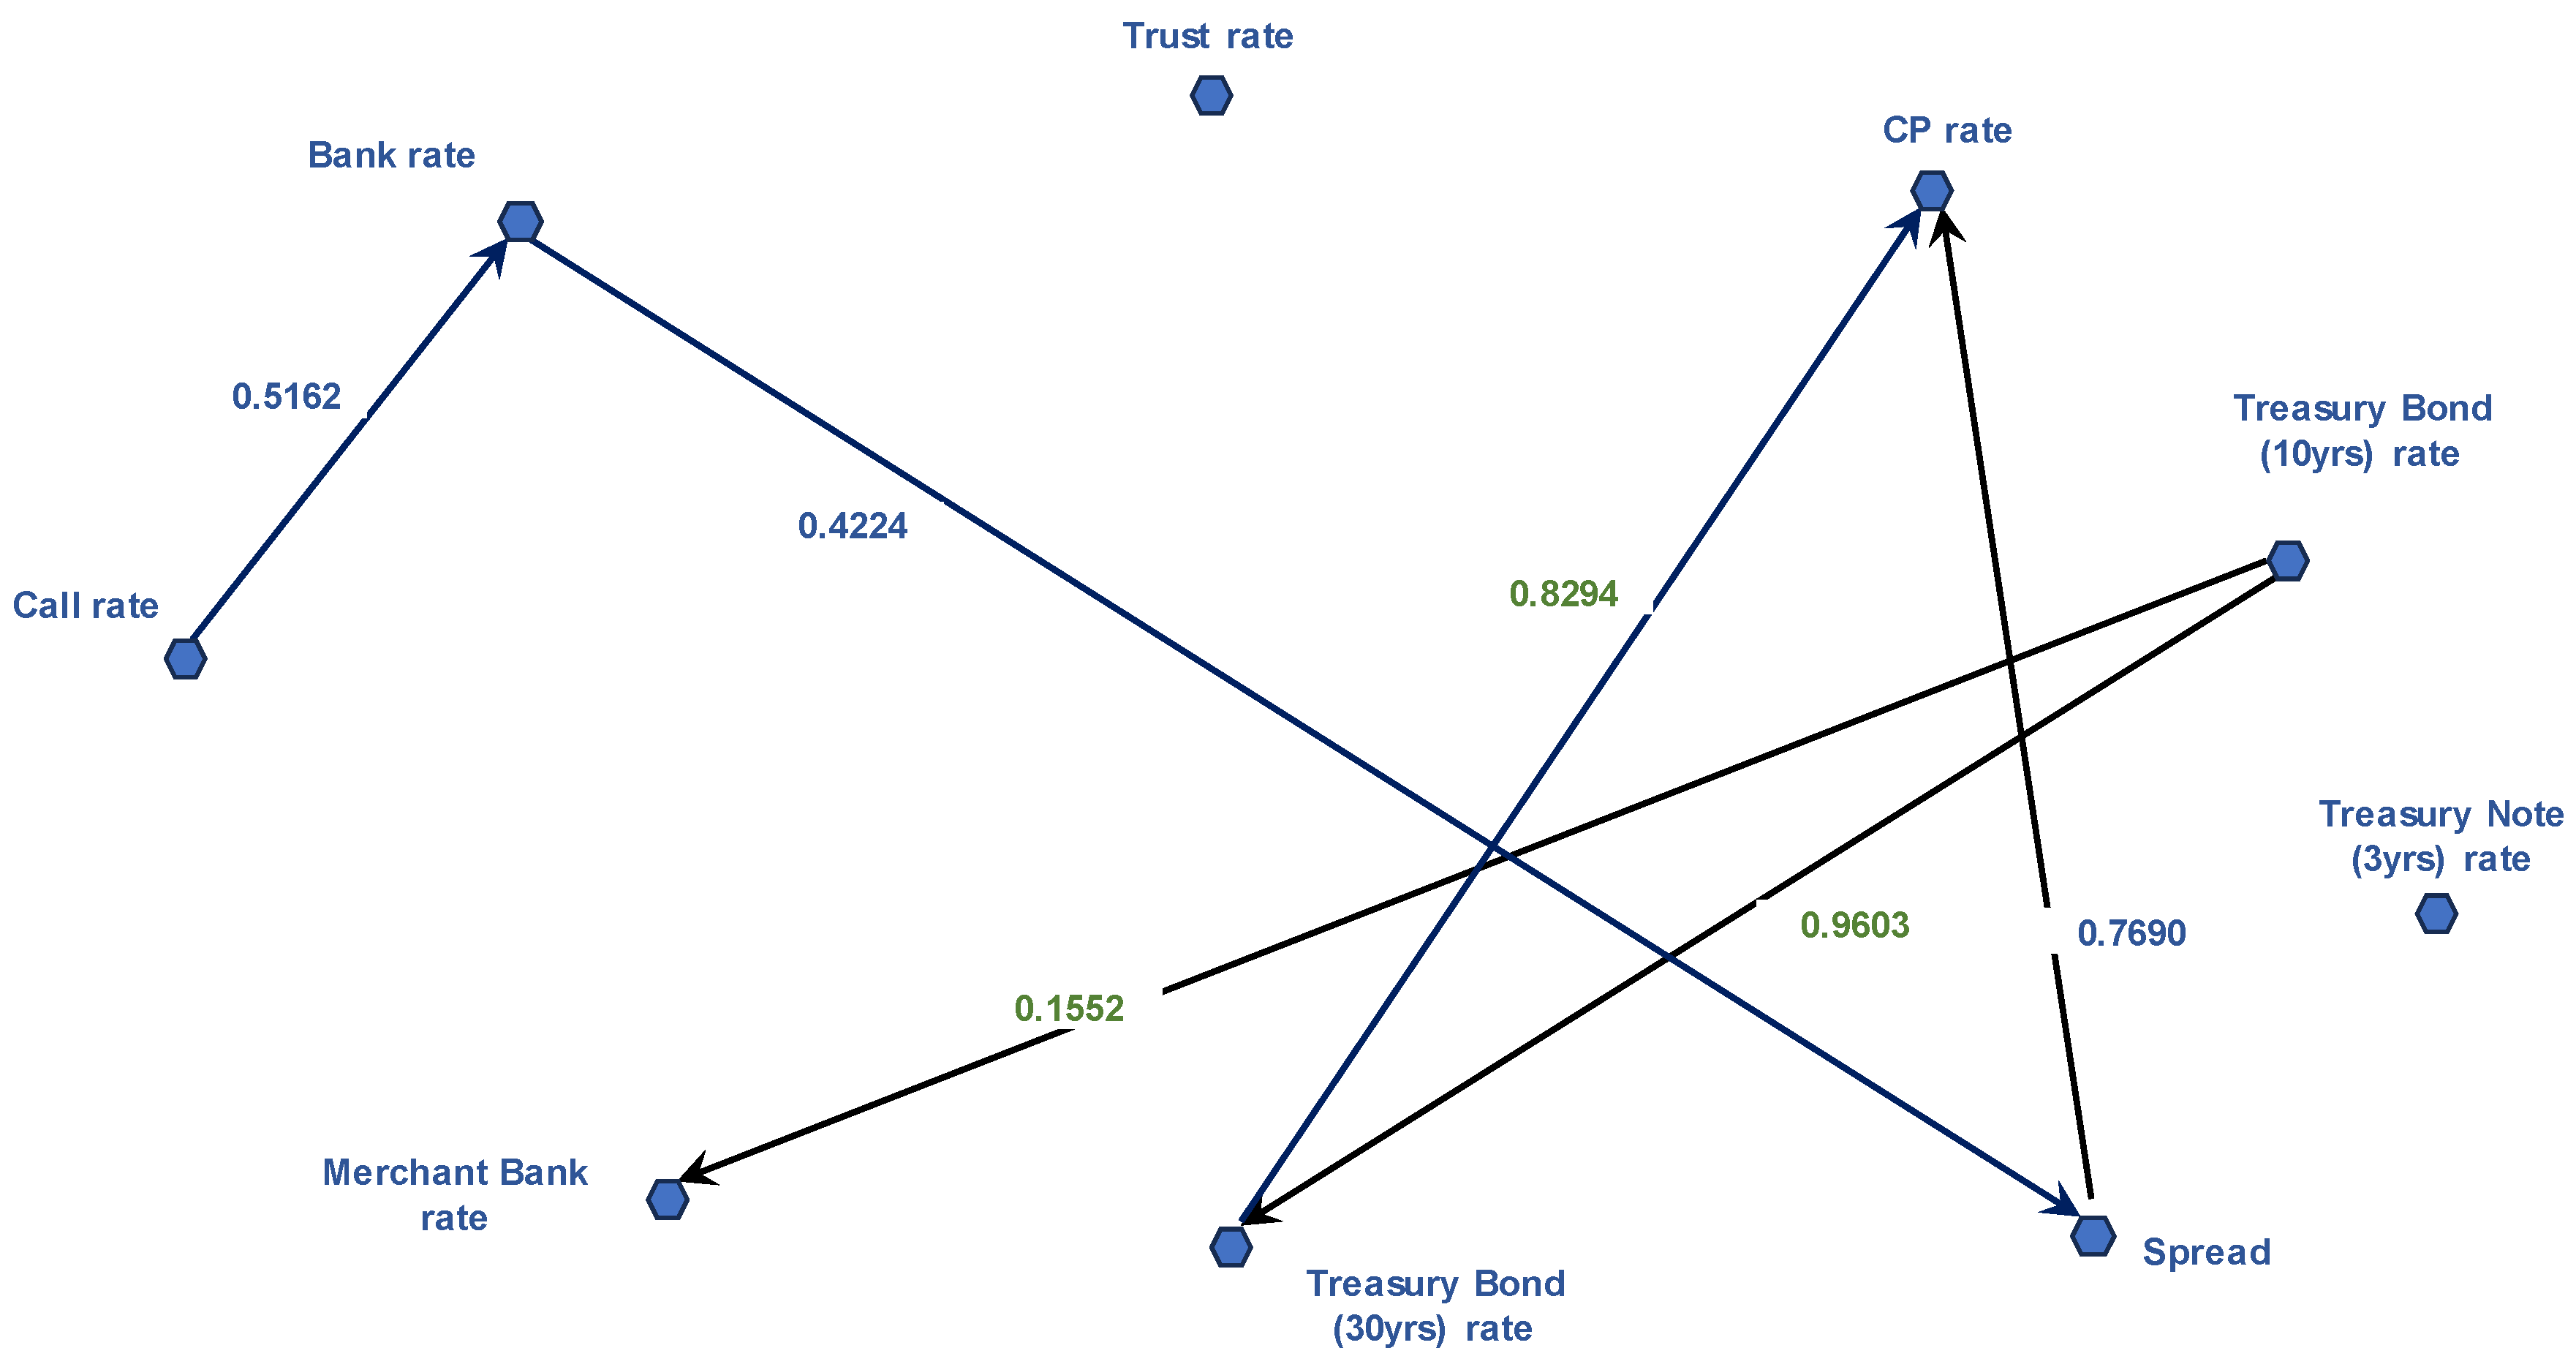

Table 1.
Summary Statistics of Variables.
| BANK | CALL | MERCHANT | TRUST | CP | SPREAD | TB-10 | TB-30 | TB-3 | |
| Mean | 3.85 | 1.69 | 2.33 | 3.56 | 2.14 | 0.52 | 2.45 | 2.50 | 2.06 |
| Median | 3.70 | 1.49 | 1.99 | 3.46 | 1.80 | 0.44 | 2.28 | 2.35 | 1.80 |
| Maximum | 5.31 | 3.64 | 4.93 | 4.64 | 5.52 | 1.65 | 4.27 | 4.16 | 4.23 |
| Minimum | 2.79 | 0.48 | 1.07 | 2.60 | 0.97 | 0.25 | 1.25 | 1.25 | 0.83 |
| Std. Dev. | 0.73 | 0.88 | 0.96 | 0.53 | 0.99 | 0.24 | 0.76 | 0.74 | 0.85 |
Table 2.
Augmented Dicky Fuller test.
| Level | 1st difference | |||
|---|---|---|---|---|
| test statistics | p-value | test statistics | p-value | |
| Call | -1.49 | 0.54 | -2.92 | 0.00 |
| Bank | -2.05 | 0.27 | -3.06 | 0.03 |
| Trust | -2.05 | 0.26 | -15.49 | 0.00 |
| Merchant | -1.22 | 0.66 | -3.71 | 0.00 |
| CP | -1.08 | 0.72 | -4.89 | 0.00 |
| TB-3 | -1.00 | 0.75 | -8.24 | 0.00 |
| TB-10 | -1.62 | 0.47 | -8.44 | 0.00 |
| TB-30 | -1.86 | 0.35 | -8.44 | 0.00 |
| Spread | -1.90 | 0.33 | -9.81- | 0.00 |
Table 3.
Cointegration Test.
| Hypothesized No. of CE(s) |
Trace | 0.05 | ||
| Eigenvalue | Statistic | Critical Value | Prob.** | |
| None * | 0.582061 | 283.2001 | 197.3709 | 0.0000 |
| At most 1 * | 0.344630 | 178.5095 | 159.5297 | 0.0030 |
| At most 2 * | 0.288391 | 127.8029 | 125.6154 | 0.0366 |
| At most 3 | 0.226561 | 86.97578 | 95.75366 | 0.1723 |
| At most 4 | 0.173772 | 56.14672 | 69.81889 | 0.3721 |
| At most 5 | 0.112282 | 33.24051 | 47.85613 | 0.5436 |
| At most 6 | 0.080594 | 18.94839 | 29.79707 | 0.4966 |
| At most 7 | 0.064234 | 8.865128 | 15.49471 | 0.3780 |
| At most 8 | 0.007458 | 0.898320 | 3.841466 | 0.3432 |
**MacKinnon-Haug-Michelis (1999) p-values.
Table 4.
Correlation Matrix of Residuals.
| BANK | CALL | MERCHANT | TRUST | CP | SPREAD | TB-10 | TB-30 | TB-3 | |
| BANK | 1.00 | ||||||||
| CALL | 0.51 | 1.00 | |||||||
| MERCHANT | 0.46 | 0.52 | 1.00 | ||||||
| TRUST | -0.09 | 0.11 | -0.01 | 1.00 | |||||
| CP | 0.46 | 0.16 | 0.43 | -0.35 | 1.00 | ||||
| SPREAD | 0.23 | -0.13 | 0.12 | -0.25 | 0.75 | 1.00 | |||
| TB-10 | 0.13 | 0.01 | 0.15 | -0.17 | -0.04 | -0.04 | 1.00 | ||
| TB-30 | 0.16 | -0.01 | 0.12 | -0.17 | 0.02 | 0.03 | 0.96 | 1.00 | |
| TB-3 | 0.21 | 0.08 | 0.22 | -0.19 | -0.08 | -0.13 | 0.89 | 0.80 | 1.00 |
Table 5.
T-Statistics of Correlation Coefficients.
| BANK | CALL | MERCHANT | TRUST | CP | SPREAD | TB10 | TB30 | |
| CALL | 6.6029 | |||||||
| MERCHANT | 5.6756 | 6.6999 | ||||||
| TRUST | -1.0988 | 1.2743 | -0.0808 | |||||
| CP | 5.8314 | 1.8347 | 5.2363 | -4.1569 | ||||
| SPREAD | 2.6507 | -1.5349 | 1.3630 | -2.9187 | 12.4897 | |||
| TB10 | 1.4400 | 0.0790 | 1.7213 | -1.9574 | -0.4995 | -0.4697 | ||
| TB30 | 1.7995 | -0.1526 | 1.4100 | -1.9965 | 0.2276 | 0.3962 | 37.6971 | |
| TB3 | 2.4133 | 0.9317 | 2.4759 | -2.2184 | -0.9278 | -1.4827 | 22.0198 | 12.2108 |
Table 6.
P-Values of Test Statistics of Table 5.
Table 6.
P-Values of Test Statistics of Table 5.
| BANK | CALL | MERCHANT | TRUST | CP | SPREAD | TB10 | TB30 | |
| CALL | 0.0000* | |||||||
| MERCHANT | 0.0000* | 0.0000* | ||||||
| TRUST | 0.8630 | 0.1025 | 0.5321 | |||||
| CP | 0.0000* | 0.0345 | 0.0000* | 1.0000 | ||||
| SPREAD | 0.0046* | 0.9363 | 0.0877 | 0.9979 | 0.0000* | |||
| TB10 | 0.0762 | 0.4686 | 0.0439 | 0.9737 | 0.6908 | 0.6803 | ||
| TB30 | 0.0372* | 0.5605 | 0.0806 | 0.9759 | 0.4102 | 0.3463 | 0.0000* | |
| TB3 | 0.0087 | 0.1767 | 0.0073* | 0.9858 | 0.8223 | 0.9296 | 0.0000* | 0.0000* |
Note: *denotes the statistical significance at the 0.05 level.
Table 7.
Posterior Conditional Correlations Coefficients in Figure 1.
Table 7.
Posterior Conditional Correlations Coefficients in Figure 1.
| call | bank | spread | 0.5162 | -0.1388 | 0.2352 | 0.4224 |
| bank | spread | cp | 0.2352 | 0.4699 | 0.7518 | 0.7690 |
| call | spread | cp | -0.1388 | 0.1652 | 0.7518 | 0.8009 |
| call | TB-30 | trust | -0.0139 | 0.1156 | -0.1793 | -0.1789 |
| call | TB-30 | cp | -0.0139 | 0.1652 | 0.0208 | 0.0234 |
| call | TB-30 | merchant | -0.0139 | 0.5218 | 0.1277 | 0.1582 |
| TB-30 | Trust | Bank | -0.1793 | 0.1621 | -0.0998 | -0.0741 |
| TB-10 | bank | spread | 0.1303 | -0.0428 | 0.2352 | 0.2452 |
| bank | spread | cp | -0.1388 | 0.1652 | 0.7518 | 0.8009 |
| TB-10 | spread | cp | -0.0428 | -0.0456 | 0.7518 | 0.7520 |
| TB-10 | trust | bank | -0.1759 | 0.1303 | -0.0998 | -0.0800 |
| TB-10 | TB-30 | trust | 0.9603 | -0.1759 | -0.1793 | -0.1355 |
| TB-10 | TB-30 | cp | 0.9603 | -0.0456 | 0.0208 | 0.8294 |
| TB-10 | TB-30 | merchant | 0.9603 | 0.1552 | 0.1277 | -0.2781 |
| TB-30 | trust | bank | -0.1793 | 0.1621 | -0.0998 | -0.0741 |
Table 8.
T-Statistics and P-Values of Conditional Correlations of the Edges in Figure 1.
Table 8.
T-Statistics and P-Values of Conditional Correlations of the Edges in Figure 1.
| t-statistics | p-value | |||
| call | bank | spread | 5.06 | *0.00 |
| bank | spread | cp | 13.07 | *0.00 |
| call | spread | cp | 14.53 | *0.00 |
| call | TB-30 | trust | -1.98 | 0.97 |
| call | TB-30 | cp | 0.25 | 0.40 |
| call | TB-30 | merchant | 1.74 | *0.04 |
| TB-30 | Trust | Bank | -0.81 | 0.79 |
| TB-10 | bank | spread | 2.75 | *0.00 |
| TB-10 | spread | cp | 12.39 | *0.00 |
| TB-10 | trust | bank | -0.87 | 0.81 |
| TB-10 | TB-30 | trust | -1.49 | 0.93 |
| TB-10 | TB-30 | cp | 16.13 | *0.00 |
| TB-10 | TB-30 | merchant | -3.15 | 0.99 |
| TB-30 | trust | bank | -0.81 | 0.79 |
Note: * denote the significance at 5%.
Table 9.
Annual Trading Volume Trends of Korean Treasury Bonds. (Unit: KRW 100 million).
| Year | TB-10 | TB-3 | TB-30 |
|---|---|---|---|
| 2021 | 5,714,496 | 2,673,460 | 1,124,315 |
| 2022 | 7,135,824 | 3,267,108 | 1,432,987 |
| 2023 | 8,542,156 | 3,985,423 | 1,754,622 |
Source: the Korea Exchange Bond Information Portal.
| [1] | Shin [1] noted that short-term bonds are readily substitutable with cash, long-term bonds with real assets, but short-term bonds are not readily substitutable with long-term bonds. |
| [2] | The data were all extracted from the Bank of Korea's Economic Statistics System (http://ecos.bok.or.kr). |
| [3] | In Table 1, BANK, CALL, MERCHANT, TRUST, CP, TB-3, TB-10, TB-30, and SPREAD denote the bank loan interest rate, the interest rate of trust account loan, the discount rate of merchant banks, the commercial paper interest rate (CP, 90-day maturity), the 3-year, 10-year, 30-year-Treasury bond interest rates, and the spread on corporate bond interest rate (AA- rating, 3-year maturity) relative to the 3-year Treasury bond yield, respectively. These abbreviations are used in the Tables and Figures below. |
| [4] | Here entropy refers to Shannon [28]'s entropy. |
| [5] | The information entropy is a measure of uncertainty between two variables, and the higher the correlation, the lower the information entropy. If X and Y are perfectly linearly related, that is, if the correlation coefficient is 1, then the information entropy is 0. The entropy is maximum if X and Y are independent. |
| [6] | The software Tetrad, developed at Carnegie Mellon University, was used to derive the DAG through the GES algorithm. Tetrad is a software suite that simulates, estimates, and searches for graphical causal models of statistical data. https://www.cmu.edu/dietrich/philosophy/tetrad/
|
Disclaimer/Publisher’s Note: The statements, opinions and data contained in all publications are solely those of the individual author(s) and contributor(s) and not of MDPI and/or the editor(s). MDPI and/or the editor(s) disclaim responsibility for any injury to people or property resulting from any ideas, methods, instructions or products referred to in the content. |
© 2024 by the authors. Licensee MDPI, Basel, Switzerland. This article is an open access article distributed under the terms and conditions of the Creative Commons Attribution (CC BY) license (http://creativecommons.org/licenses/by/4.0/).
Copyright: This open access article is published under a Creative Commons CC BY 4.0 license, which permit the free download, distribution, and reuse, provided that the author and preprint are cited in any reuse.


