
Submitted:
29 May 2024
Posted:
30 May 2024
Read the latest preprint version here
Abstract
Based on the composite perspective of environment-building-resource(EBR), influencing factors of the greenness of rural buildings were sorted out by brainstorming and expert consultation, an innovative comprehensive evaluation system was constructed and the weight ofthe impact factors were calculated by fuzzy analytic network process(FANP). The EBR greenness comprehensive scoring standards of each influence factor were established by means of questionnaire, field measurement and numerical simulation. As a typical representative of human populated areas in southwest China, 13 villages in the second circle of Chengdu were selected as case study areas by means of the regional average distribution theory and minimum sampling criteria. Innovative combination of obstacle degree model and spatial interpolation analysis, the key factors affecting the greening of rural buildings were diagnosed. The results showed that, indoor thermal environment(E21), indoor light environment(E22), popularity of biogas facilities (R12), green building material usage(R13) have a significant impact on the EBR greenness score. The EBR score of study area shows a spatial distribution pattern of high in the west and low in the east, with extremely uneven scores in various dimensions. According to the key factors obtained from the systematic evaluation, the refined exploration of promotion strategies and measures was carried out, the greenness improvement suggestion was put forward.
Keywords:
Rural residential building
; Building greenness score
; Fuzzy analytic network process (FANP)
; Obstacle degree analysis
1. Introduction
In 2022, the rural residential area in China exceeded 26 billion square meters [1], and the per capita residential construction area was 4.8 times that of 1978 (Han et al., 2022) [2]. Compared with the rapidly growing residential area, the comfort of rural housing has not been effectively improved. Rural housing causes a huge environmental burden throughout its entire lifecycle, but fails to provide comfortable living conditions (Aisikaer et al., 2023; Han et al., 2022) [3,4]. Solving the problems of high energy consumption and low comfort has become a major challenge for the green development of rural housing (Li et al., 2020; Wang et al., 2022) [5,6].
In this context, the low energy consumption and high comfort characteristics of green buildings are in line with the concept of sustainable development (Zi et al., 2018; Cai and Guo, 2023) [7,8], and have become a necessary support for building green living environments in rural areas and a guiding paradigm for improving rural living conditions under carbon reduction and carbon neutrality goals (Ding et al., 2018; Zhu et al., 2023; Gan et al.,2023) [9,10,11].
Researchers have conducted a series of evaluation studies on the two important characteristics of green buildings, energy efficiency and comfort. Among them, in research focused on energy efficiency, more attention is paid to the energy-saving renovation of existing buildings, and the performance improvement of building envelope structures such as roofs(Hu et al., 2021) [12] and exterior walls(Deng et al., 2023) [13] is explored in depth, but most of them ignore the differences in energy structure in rural areas; However, research focused on comfort focuses more on thermal comfort(Yue and Chen, 2023; Zhang et al., 2023) [14,15] and light environment [3], and there is a lack of discussion on other indoor physical environments such as acoustic and air environments.
The exploration of local building components and indoor single physical environment in the above studies has gradually become sufficient, but comprehensive evaluation research is slightly insufficient, mainly manifested in the failure to fully consider the openness of rural residential environment, the diversity of construction, and the complexity of energy structure. There is still a certain research gap in the sorting and improvement path of rural green building factors under the comprehensive framework.
Based on the above issues, this study integrates the boundary environment, structural characteristics, and energy structure of rural buildings, establishes a comprehensive evaluation system for rural green buildings, and selects the second circle of rural areas in Chengdu as a representative research object to reveal the differences in green degree factor scores and influencing mechanisms, explore the spatial differentiation characteristics of green degree in rural buildings, diagnose green degree obstacle factors, and finally propose targeted measures to improve the green degree of rural buildings, providing relevant basis for the development of green buildings in rural areas.
2. Research Technical Routes and Methods
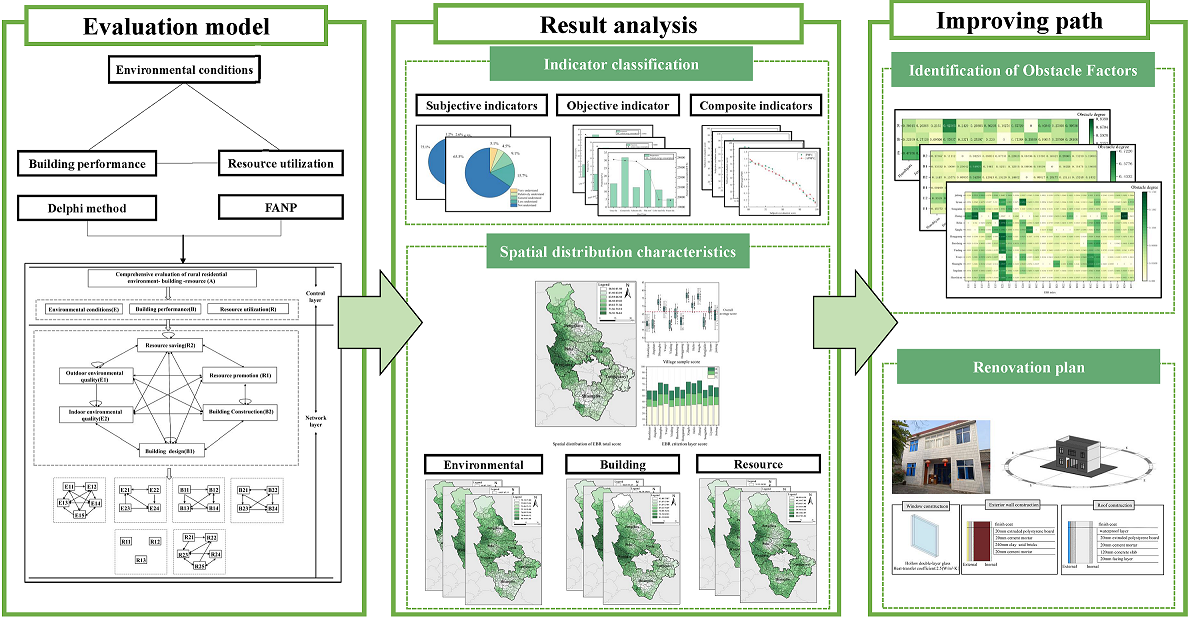
The research framework mainly consists of the following three stages: in the construction stage of the evaluation system, literature mining and brainstorming methods are used to determine the preliminary influencing factors of rural green buildings, and then the final evaluation indicators are determined through the Delphi method. The weights of each indicator are calculated using the fuzzy analytic network process (FANP), and the indicator scoring standards are determined through numerical simulation combined with fuzzy mathematics theory; Collect data in the form of interviews and actual measurements during the implementation phase; In the result analysis stage, spatial interpolation method is used to reveal the spatial distribution differences of green degree in rural buildings. Then, based on the obstacle degree model, the green degree obstacle factors are diagnosed and identified. Finally, targeted improvement strategies are proposed based on the obstacle degree diagnosis results, as shown in Figure 1.
2.2. Construction of Evaluation Models
2.2.1. Construction of Indicator System
When constructing the indicator system, full consideration was given to the building boundary environment and the unique energy structure of southwestern rural areas. An environment-building-resource (EBR) model was established, and these three dimensions were used as criterion layers to sort and decompose, preliminarily determine and refine evaluation indicators. According to the requirements of the Delphi method, 12 experts in relevant fields were invited to conduct two rounds of questionnaire surveys. Finally, 6 sub criterion layer indicators and 25 factor layer indicators were determined. The specific evaluation indicators are shown in Table 1 criterion layer column, sub criterion layer column, and factor column.
2.2.2. Method for Calculating Indicator Weights
Considering the numerous quantitative difficulties in the rural building system and the tendency towards complex network structures in the interrelationships between indicators, FANP is chosen to calculate indicator weights to ensure the objective and accurate evaluation results(Chai et al., 2024; Alkabaa et al., 2024;Erfan et al., 2019; Pereira A.F.C. and Sousa J, 2023; Feyzi et al., 2019; He et al., 2021) [16,21].
The FANP process mainly includes four parts: (1) modeling the indicator network relationship through expert consultation, as shown in Figure 2; (2) determining the local weights of factors using paired comparison judgment matrices. (3) Using fuzzy scaling to determine the degree of internal correlation between each factor and other factors, a dependency matrix is constructed. (4) The final weight is obtained by combining local weights and dependent weights. The organized results are shown in the weight column of Table 1.
2.2.3. Indicator Scoring Rules
Divide indicator types into three categories: subjective indicators, objective indicators, and subjective objective composite indicators. The subjective indicator grading is mainly based on existing literature and normative standards, and the scoring method is based on the fuzzy hierarchy theory, as shown in Table 2.
The classification of objective indicators is mainly based on reference standards, numerical simulation results, and statistical yearbooks. The scoring method is linear interpolation, as shown in Table 3.
The composite indicator combines the grading criteria and scoring methods of the above two indicators, and assigns a weight of 1/2 to each indicator before adding them up to obtain the rating of this type of indicator, as shown in Table 4.
The numerical simulation part establishes a typical rural building standard model in Chengdu area through BIM software, inputs external environmental parameters and sets various building material information to visualize building energy consumption and lighting information. The specific process is shown in Figure 3.
2.2.4. Calculation of EBR Comprehensive Score
The weighted sum method is used to obtain the comprehensive score (EBR) of rural building green degree, and the specific calculation formula is as follows:
Where, Xij represents the specific score value of a sub indicator, and Wij represents the corresponding weight value.
2.2.5. Obstacle Degree Model
The obstacle model is a mathematical statistical method based on relevant comprehensive evaluation, which effectively identifies the main obstacles that hinder the development of things and goals. It has been widely used in key factor analysis and research in various disciplinary fields(Cui et al., 2023 ; Lv et al., 2024; Li et al., 2024) [22,24]. The specific steps are as follows:
Firstly, standardize the indicators using Formulas (2) and (3) respectively.
When Xij is a positive indicator:
When Xij is a negative indicator:
Where, Zij is the standardized value of a single indicator
Obstacle degree formula:
Where, Pij is the obstacle degree of a single indicator to the EBR of rural housing, Zij is the standardized value of a single indicator, Wij is the global weight of a single indicator, and n is the total number of indicators.
2.3. Study Area and Data Sources
Chengdu is located on the western edge of the Sichuan Basin, as one of the economic centers in southwestern China, it has certain representativeness in natural climate, rural architectural form, and resource structure. Therefore, Chengdu is chosen as the research area.
Empirical research will be conducted using on-site investigation of receipt data. Considering that the main urban area of Chengdu has been highly urbanized and there are relatively few traditional rural areas, in order to meet the needs of the research sample, five suburban areas in the second circle with a large number of villages, including Xindu, Pidu, Wenjiang, Shuangliu, and Longquanyi, as well as Pengzhou City in the third circle, were selected as the research area. This has formed a comprehensive coverage effect around Chengdu in terms of geographical location. Using Chengdu’s annual “Rural Revitalization” demonstration villages and “Sichuan’s Most Beautiful Villages” as the overall sample range, 13 villages were randomly selected as research villages at a 10% sampling ratio, including 6 new rural resettlement communities and 7 traditional villages. The sampling quantity meets the requirements, and the distribution of sample villages is shown in Figure 4.
In order to obtain indoor environmental measurement values, subjective feelings of residents, and energy consumption under the most unfavorable conditions, the research group conducted four field investigations in the hottest and coldest months of Chengdu. The subjective indicators were collected through questionnaire interviews, as shown in Figure 5a. The objective indicators were collected through on-site measurements, as shown in Figure 5b–d. The comprehensive indicators were collected through both interviews and on-site measurements. The measuring instrument used is shown in Figure 5f. 391 questionnaires were ultimately collected, and after sorting and screening out invalid questionnaires, 386 valid questionnaires were obtained, with an effective questionnaire rate of 98.72%.
3. Results
3.1. Analysis of Subjective Indicators
Subjective indicators are distributed in all three dimensions of EBR, among which the three indicators in the resource utilization dimension, solar energy utilization (R11), Popularity of biogas facilities (R12), and green building material usage (R13), have relatively high weights of 0.03, 0.06, and 0.06, respectively. The score of R11 ranges from 20.11 to 40.25, the score of R12 ranges from 21.54 to 51.64, and the score of R13 ranges from 20.48 to 59.64. The average score is relatively low.
The impact of R12 and R13 on the total EBR score is more significant. For example, Jiulong Village in Xindu District has a score rate of over 75% in both environmental conditions and building performance dimensions, which is higher than the first ranked Zhanqi Village and the second ranked Xingfu Village. However, due to the scores of only 30.21 and 32.55 for the two indicators R12 and R13, the total EBR score is 64.46, which is lower than the average of 66.17.
The main reason for the generally low levels of these three subjective indicators is the biased lifestyle habits of residents. Rural residents are more inclined to choose low-cost and easily accessible building materials, and lack attention to the green performance of building materials. The survey results show that 65.47% of residents have no understanding of the concept of green building materials, as shown in Figure 6a. The proportion of using green building materials is only 24.9%, as shown in Figure 6b.
In terms of energy utilization, residents place greater emphasis on comfort, convenience, and hygiene when choosing energy, and therefore tend to prefer the use of convenient commodity energy. 43.78% of rural households only use commodity energy, and only 4.93% of households have renewable energy facilities and use them normally.
3.2. Analysis of Objective Indicators
The objective indicators are mainly composed of indicators from the dimension of building performance, with the factors with significant differences mainly coming from the two indicators of the sub criterion level building structure, namely roof structure (B21), exterior wall structure (B22), and window structure (B23). The weights of the three indicators are 0.039, 0.04, and 0.04 respectively, with small differences. The evaluation results range from 40.63 to 87.19, 38.12 to 89.47, and 41.27 to 92.22, with a wide distribution range. Zhanqi Village in Pidu District has the highest B21 score at 89.67, while Xingfu Village in Wenjiang District has the highest B22 and B23 scores at 90.25 and 92.22, respectively. The B21 and B22 scores of Jingshan Village in Shuangliu District are both the lowest, with 47.75 and 49.76 respectively. The B23 score of Hongguang Village in Longquanyi District is the lowest, at 41.27.
Figure 7 shows the annual energy consumption of various types of roofs, exterior walls, and windows in the study area, as well as their proportion to the total sample. The high energy consumption roof types are mainly small green tile roofs, cement tile roofs, and asbestos tile roofs, with heat transfer coefficients of 1.85 W/(m²·K), 1.71 W/(m²·K), 1.52 W/(m²·K). The main types of high-energy consumption walls are clay solid brick walls and sintered shale brick walls, with heat transfer coefficients of 1.89 W/(m²·K), 1.26 W/(m²·K). The main types of windows with high energy consumption are single glass aluminum windows and single glass plastic steel windows, with heat transfer coefficients of 5.75 W/(m²·K), 4.7 W/(m²·K).
Due to the fact that most of the heat loss in buildings is dissipated through the outer surface of the enclosure structure facing the surrounding environment, the thermal performance of these enclosure structures with high heat transfer coefficients is poor, resulting in high energy consumption that reduces the green performance of the building.To further explore the impact of the difference in scores between B21 and B22 indicators on the total EBR score, two residential properties in Liyuan Village, Xindu District were selected for comparison. The difference in scores for other indicators between the two residential areas in Figure 8a,b is relatively small. The B21 score for residential area a is 89.21, the B22 score is 92.14, and the total EBR score is 70.24; The B21 score for residential B is 40.21, the B22 score is 45.17, and the total EBR score is only 64.59.
3.3. Analysis of Composite Indicators
The Composite indicators (Indicators have both subjective and objective attributes) consist of four indicators: indoor thermal environment (E21), indoor light environment (E22), indoor sound environment (E23), and indoor air quality (E24). The trend of the subjective and objective evaluation results of the four indicators is shown in Figure 9.
Among the four indicators, the scores of E23 and E24 are between 57.66-81.01 and 65.33-81.07, with a small range of distribution and consistent subjective and objective evaluation results. As the most weighted indicator in the evaluation system, the indoor thermal environment E21 has an overall score between 69.87 and 81.1, with an average score of 74.94, providing a significant contribution to the total EBR score. This is mainly reflected in the fact that the scores of indoor thermal environment in the top 5 villages in the total score are all greater than 74.
Compared with the evaluation results of the other three comprehensive factors, there is a significant discrepancy between the subjective and objective results of indoor light environment E22. From Figure 9b, it can be seen that the trend of subjective satisfaction with the change of lighting coefficient is not significant. The lighting coefficient of residential buildings in the research area ranges from 1.2 to 4.8, with 85.49% of the total sample being below 4.8. The subjective satisfaction score ranges from 77.02 to 90.17, with satisfaction and relative satisfaction accounting for 70.21%. The higher subjective satisfaction balanced the disadvantage of lower objective evaluation results, and the comprehensive evaluation results of indoor lighting environment ranged from 65.41 to 80.83, with a moderate impact on EBR.
3.4. Overall Characteristics of EBR
The overall and sub scores of EBR for rural residential buildings around Chengdu are shown in Figure 10. Among them, the overall EBR score of rural buildings ranges from 76.65 to 58.86, with an average of 66.17, slightly higher than the median value of 65.21.
From the perspective of spatial distribution, the EBR spatial distribution of rural buildings around Chengdu shows a spatial gradient pattern with two high value centers, Pidu District and Wenjiang District, decreasing towards the edge. The green level of rural buildings in the surrounding areas of Chengdu varies greatly, with significant spatial differentiation.
3.5. Local Spatial Features of EBR
To further reveal the local spatial characteristics of the EBR of rural buildings in Chengdu, spatial interpolation analysis was conducted on the scores of the EBR criterion layer and sub criterion layer. The results indicate that there are certain differences in the spatial distribution of scores in each dimension, as shown in Figure 11.
3.5.1. Spatial Distribution of Environmental Conditions
The spatial distribution pattern of the environmental dimension shows a pattern of high in the north and low in the south, especially in the indoor environment of the subcriteria layer. The analysis results of the previous indicators indicate that indoor thermal environment (E21) is a key influencing factor of indoor environment. Due to the openness of rural residential environments, indoor thermal environment is not only related to the structural performance of buildings, but also influenced by the outdoor environment of residential areas. The Chengdu region has a unique traditional settlement village form - the forest panel. The forest panel system consists of four units: forest, house, water, and field. Vegetation and water system elements help reduce solar radiation and greenhouse effect, thereby regulating indoor thermal environment. The specific path is shown in Figure 12.
The data in Figure 13a shows that traditional villages in the forest system have a better indoor thermal environment compared to new rural resettlement communities, mainly manifested by the fact that the absolute value range of APMV in traditional villages is more concentrated within the comfortable range of 0.5. The subjective statistical comparison results of indoor thermal comfort also assist in proving this phenomenon, as shown in Figure 13b. In the subjective feelings of traditional village residents, the proportion of comfortable and more comfortable is larger, while the evaluation of new rural resettlement communities residents is more inclined towards general. From the perspective of forest distribution location, the forest distribution in the northern areas of Pengzhou, Pidu, and Xindu is more dense, while the villages in Shuangliu and Longquanyi districts in the south are concentrated in hills and mountains, with fewer forest clusters. The indoor thermal environment score is lower than that of Pidu and Xindu, resulting in a spatial differentiation of high temperature scores in the north and low in the south in the living environment.
3.5.2. Spatial Distribution of Building Performance
The score difference in the dimension of building performance is significant, and the spatial differentiation effect is significant. Among them, the highest score for building performance is 88.33 (Xingfu Village, Wenjiang District), and the lowest score is 45.78 (Jingshan Village, Shuangliu District). Due to the systematic planning and design of the architectural layout and structure of the new rural resettlement communities, the performance dimension of the building is better than that of traditional villages mainly relying on self built houses. Therefore, each district presents a distribution pattern of gradually decreasing from the high value center of the new rural resettlement communities to the low value area of traditional villages. From the analysis results in 3.2, it can be seen that the two indicators of roof structure B21 and exterior wall structure B22 are important factors affecting the spatial differentiation of building performance dimensions. The comparison of specific indicator scores further proves this point, as shown in Figure 14.
3.5.3. Spatial Distribution of Resource Utilization
The score of resource utilization dimension is generally low, and the spatial differentiation shows a distribution pattern of low center and high edge. In the sub criterion layer, the R2 weight for resource conservation is relatively high, but the score range of the R2 indicator layer is small, so the R2 score is relatively uniform in spatial distribution. The previous analysis results indicate that the acceptance rate of biogas facilities in resource promotion R1 is R12, and the usage rate of green building materials is R13, which are key indicators affecting the sub criterion layer R1 and the total EBR score.
From a spatial perspective, villages near the centers of each district are affected by urbanization, with more complete energy infrastructure construction and a predominantly commodity energy structure. High power electrical appliances are used more frequently, resulting in a greater demand for energy. Among them, the most obvious is Songjialin Village in Pidu District. Songjialin Village is located in the center of Pidu District and belongs to the urban-rural integration type village. The residents mainly use electricity and natural gas for energy, and the utilization of renewable energy is relatively weak. The R12 score is 24.07, and the R13 score is 25.88, both of which are in a relatively low value.
4. Discussion
4.1. Analysis of Obstacle Factors
In order to further identify the key obstacle factors that affect the overall EBR, an obstacle degree model was used to comprehensively diagnose and analyze EBR, and targeted improvement strategies were proposed based on the analysis results.
4.1.1. Spatial Distribution of Environmental Conditions
The diagnostic results in Figure 15a show significant differences in the degree of obstacles in the three dimensions of the criterion layer. When there is only one criterion layer with an obstacle degree greater than 30%, it is designated as a single dominant obstacle type, and when there are two criterion layers with an obstacle degree greater than 30%, it is designated as a double dominant obstacle type. The villages in the sample that belong to the single dominant obstacle type include Jingshan Village, Shuangba Village, Yinding Village, Baosheng Village, Xingfu Village, and Liyuan Village. Among them, the obstacle degree of environmental conditions exceeds 40% in single dominant obstacle type villages. Villages belonging to the dual dominant obstacle type include Huoshiyan Village, Youyi Village, Hongguang Village, Helin Village, Zhanqi Village, Songjialin Village, and Jiulong Village. Among them, 71.4% of villages are dominated by environmental conditions and resource utilization as obstacles, indicating that. The environmental situation is a crucial obstacle dimension.
The obstacle diagnosis results of the subcriteria layer are shown in Figure 15b. In the sub criterion layer, the obstacle level of indoor environment (E2) is the most significant, with 69.23% of villages having an obstacle level exceeding 30%, indicating that the obstacle level of environmental situation E is mainly contributed by E2.
4.1.2. Obstacle Analysis of Indicator Layer
The diagnostic results of obstacle degree in Figure 15c indicate that the top four indicators of overall obstacle degree are E21, E22, R13, and R12, which are basically consistent with the analysis results of the previous indicators.
The score range of indoor thermal environment (E21) is relatively small, and its obstacle degree mainly comes from the high weight of the indicator itself. The obstacle level of indoor light environment (E22) is due to the significant difference between subjective and objective evaluations, resulting in a low overall score and a more significant obstacle level.
Overall, the obstacles in the dimension of building performance are relatively average, and there is no obvious clustering. The weight distribution of indicators in this dimension is relatively uniform. The difference in scores between the two indicators of roof construction (B21) and exterior wall construction (B21) is significant, but it has not become a significant obstacle factor. The main reason is that B21 and B21 have relatively small weights and are weaker in obstacle priority compared to high weight indicators such as E21 and R12..
In the dimension of resource utilization, there are significant obstacles in the popularity of biogas facilities (R12) and green building material usage (R13). The weight and score range of R12 and R13 is significant, with 69.23% of villages having low scores in R12 and R13, showing significant clustering on the obstacle heatmap.
4.2. Strategies for Enhancing Rural Green Residential Buildings
The diagnostic results of EBR obstacle factors in rural buildings around Chengdu indicate that indoor thermal environment (E21), indoor light environment E22, popularity of biogas facilities (R12), and green building material usage (R13) are key obstacle factors. Based on the characteristics of the above four factors, balancing the relationship between energy efficiency, comfort, and economy, targeted improvement strategies are summarized as follows:
(1) Improve indoor thermal environment
The indoor thermal environment, as the most significant obstacle factor, needs to be given priority consideration when improving the EBR of residential buildings. Taking Wenjiang District and Lin Village as an example, the indoor thermal environment of the village reached 15.19%. Field research has found that the thermal performance of residential buildings in Helin Village is poor and cannot meet the thermal comfort requirements of residents. Passive energy-saving technology can be used to transform the enclosure structure of existing residential buildings.
Taking a residential building in Helin Village as an example, the original enclosure structure of the building was wooden doors, single glass plastic steel windows, and the roof and exterior walls were not insulated, resulting in significant heat loss. Considering economic and regional feasibility, a numerical simulation was conducted to determine the renovation plan, as shown in Figure 16. The renovation results show that by replacing the windows with double-layer hollow plastic steel windows and changing the method of roof exterior walls, the indoor thermal environment score has been increased from 64.39 to 72.45, and the unit energy consumption has been reduced by 25.34% compared to the original. At the same time, it meets the requirements of comfort and energy efficiency.
(2) Optimize indoor lighting paths
The obstacle level of indoor lighting environment is second only to indoor thermal environment. Taking Huoshiyan Village in Shuangliu District as an example, the obstacle level of indoor lighting environment in the village is 10.52%, with an average lighting coefficient of 1.8%. From the numerical simulation results in Figure 17, it can be seen that when the window to ground ratio is 0.4, the annual energy consumption is the lowest and good lighting effects can be achieved. The indoor lighting environment evaluation score can be increased from 52.37 to 65.25. In addition to increasing the window area, setting up lighting wells and roofs can increase the average lighting coefficient to 2.9% and 2.6% respectively, and the indoor lighting environment evaluation score can be increased from 52.37 to 64.15.
(3) Strengthen the utilization of green resource
The R12 and R13 scores of Zhanqi Village in Pidu District are the highest, and Songjialin Village in the same area can learn from Zhanqi Village’s green ecological development model in terms of resource utilization. In terms of energy utilization structure, promote renewable energy facilities according to local conditions, comprehensively prohibit straw incineration in resource utilization, and promote the energy utilization of crop straw through methods such as biogas gasification, vaporization, and solidification; In the use of building materials, reducing the use of traditional clay building materials can replace traditional solid clay bricks with sintered porous bricks. By following the above path to optimize the energy structure and building material selection, the resource utilization dimension score of Songjialin Village can be increased from 40.79 to 68.14, and the total score of EBR can be increased from 60.07 to 68.88.
5. Conclusions
A greenness evaluation system for rural residential buildings was constructed based on three dimensions of environment, building, and energy consumption. The main indicators affecting EBR were analyzed, and spatial interpolation analysis was used to explore the spatial distribution pattern of rural building EBR. Based on the obstacle degree model, obstacle factors were identified and diagnosed, filling the gap in rural green building evaluation research in Southwest China and providing a foundation for the development of green buildings in similar regions. The main conclusions are as follows:
(1) An innovative comprehensive evaluation system was constructed based on the composite perspective of EBR, and the weight ofthe impact factors were calculated by FANP. The results show that the system has a certain universality in rural settlements in southwest China, which will lay a foundation for the study of similar areas, and form a basic research framework and preliminary data support.
(2) The EBR greenness comprehensive scoring standards of each influence factor were established by means of questionnaire, field measurement and numerical simulation. In particular, the numerical simulation work based on BIM technology has been successfully adopted in the greenness scoring standard and case analysis, which provides new means to try and path exploration for the development of work in this direction.
(3) By innovative combination of obstacle degree model and spatial interpolation analysis, the key factors affecting the greening of rural buildings were diagnosed. It provides the basis for the leap from qualitative recognition to quantitative accurate evaluation, and realizes the further analysis of scientific problems, which has great social value.
Author Contributions
All authors have accepted responsibility for the entire content of this manuscript and approved its submission.
Date Availability Statement
Data will be made available on request.
Acknowledgements
The authors would like to thank the project team members for their help. This study was funded by the Philosophy and Social Science Research Fund Project of Chengdu University of Technology (YJ2021-ZD002), Project of Western Ecological Civilization Research Center (XBST2021-YB002), Development Funding Program for Young and Middle-aged Key Teachers of Chengdu University of Technology(10912-JXGG2021-01003). These supports are greatly appreciated.
Conflicts of Interest
The authors declare that they have no known competing financial interests or personal relationships that could have appeared to influence the work reported in this paper.
References
- Ministry of Housing and Urban-Rural Development of the People’s Republic of China. 2022 Statistical Yearbook of Urban and Rural Construction(2022). https://www.mohurd.gov.cn/gongkai/fdzdgknr/sjfb/index.html.
- Han Tongze,Liu Ping,Niu Changlin & Li Qiangnian.(2022).Evaluation of energy-saving retrofit projects of existing rural residential envelope structures from the perspective of rural residents: the Chinese case..Environment, development and sustainability(8),21-28. [CrossRef]
- Aisikaer Molake,Rui Zhang & Yihuan Zhou.(2023).Multi-Objective Optimization of Daylight Performance and Thermal Comfort of Enclosed-Courtyard Rural Residence in a Cold Climate Zone, China.Sustainability(10). [CrossRef]
- Gan Xiaolong,Liu Lanchi,Wen Tao & Webber Ronald.(2022).Modelling interrelationships between barriers to adopting green building technologies in China’s rural housing via grey-DEMATEL.Technology in Society. [CrossRef]
- Li B, You L, Zheng M, et al.Energy consumption pattern and indoor thermal environment of residential building in rural China[J].Energy and Built Environment,2020,1(3):327-336. [CrossRef]
- Wang Jiebing,You Kairui,Qi Lingling & Ren Hong.(2022).Gravity center change of carbon emissions in Chinese residential building sector: Differences between urban and rural area.Energy Reports10644-10656. [CrossRef]
- Zi Cao,Qian Meng & Baozhong Gao.(2021).The consumption patterns and determining factors of rural household energy: A case study of Henan Province in China.Renewable and Sustainable Energy Reviews . [CrossRef]
- Cai Senhong & Gou Zhonghua.(2023).Are Green Spaces More Available and Accessible to Green Building Users? A Comparative Study in Texas.Land(1),226-226. [CrossRef]
- Zhikun Ding,Ze Fan,Vivian W.Y. Tam,Yu Bian,Shenghan Li,I.M. Chethana S. Illankoon & Sungkon Moon.(2018).Green building evaluation system implementation.Building and Environment32-40. [CrossRef]
- Zhu Wenxi,Zhang Jing,Wang Da,Ma Chongsen,Zhang Jinfan & Chen Pei.(2023).Study on the Critical Factors Influencing High-Quality Development of Green Buildings for Carbon Peaking and Carbon Neutrality Goals of China.Sustainability(6),5035-5035. [CrossRef]
- Gan Xiaolong,Yan Kangkang & Wen Tao.(2023).Using fuzzy cognitive maps to develop policy strategies for the development of green rural housing: A case study in China.Technological Forecasting Social Change. [CrossRef]
- Hu Xinyi,Xiang Yiming,Zhang Hong,Lin Qi,Wang Wei & Wang Haining.(2021).Active–passive combined energy-efficient retrofit of rural residence with non-benchmarked construction: A case study in Shandong province, China.Energy Reports1360-1373. [CrossRef]
- Qinqin Deng,Shengnan Zhang,Ming Shan & Ji Li.(2023).Research on Envelope Thermal Performance of Ultra-Low Energy Rural Residential Buildings in China.Sustainability(8). [CrossRef]
- Yue Lyu & Zhongqing Chen.(2023).Seasonal thermal comfort and adaptive behaviours for the occupants of residential buildings: Shaoxing as a case study.Energy Buildings. [CrossRef]
- Zhang Jinhao,Lu Jun,Deng Wu,Beccarelli Paolo & Lun Isaac Yu Fat.(2023).Thermal comfort investigation of rural houses in China: A review.Building and Environment. [CrossRef]
- Chai Naijie,Zhou Wenliang,Chen Ziyu,Lodewijks Gabriel & Zhao Yingying.(2024).Multi-attribute fire safety evaluation of subway stations based on FANP – FGRA – Cloud model.Tunnelling and Underground Space Technology incorporating Trenchless Technology Research105526-. [CrossRef]
- Alkabaa Abdulaziz S.,Taylan Osman,Guloglu Bulent,Baik Shefaa,Sharma Viven,Mishra Rajesh... & Upreti Girish.(2024).A fuzzy ANP-based criticality analyses approach of reliability-centered maintenance for CNC lathe machine components.Journal of Radiation Research and Applied Sciences(1). [CrossRef]
- Erfan Babaee Tirkolaee,Abbas Mardani,Zahra Dashtian,Mehdi Soltani & Gerhard-Wilhelm Weber.(2019).A novel hybrid method using fuzzy decision making and multi-objective programming for sustainable-reliable supplier selection in two-echelon supply chain design.Journal of Cleaner Production(C),119517-119517. [CrossRef]
- Pereira, A.F.C. & Sousa J.M.M..(2023).Assisted site-dependent selection of the most suitable Airborne Wind Energy system via Fuzzy Analytic Network Process.Energy Reports2881-2899. [CrossRef]
- Feyzi S, Khanmohammadi M, Abedinzadeh N, et al.Multi- criteria decision analysis FANP based on GIS for siting municipal solid waste incineration power plant in the north of Iran[J].Sustainable Cities and Society,2019,47101513-101513. Hossein H, Hesam K S. Drought risk assessment: The importance of vulnerability factors interdependencies in regional drought risk management[J].International Journal of Disaster Risk Reduction,2024,100104152-. [CrossRef]
- He Xiaorong,Cai Chaoyue,Tang Jianxiong,Shi Jizhi & Yang Rubin.(2023).Analysis of coupling coordination and obstacle factors between tourism development and ecosystem services value: A case study of the Yellow River Basin, China.Ecological Indicators. [CrossRef]
- Cui Yi,Zhou Yuliang,Jin Juliang,Jiang Shangming,Wu Chengguo & Ning Shaowei.(2023).Spatiotemporal characteristics and obstacle factors identification of agricultural drought disaster risk: A case study across Anhui Province, China.Agricultural Water Management. [CrossRef]
- Yangxi Lv,Yue Li,Zixuan Zhang,Shimiao Luo,Xue Feng & Xudong Chen.(2024).Spatio-temporal evolution pattern and obstacle factors of water-energy-food nexus coupling coordination in the Yangtze river economic belt.Journal of Cleaner Production141229-. [CrossRef]
- Shiji Li,Chunli Liu,Changzi Ge,Jing Yang,Zhenlin Liang,Xue Li & Xinyu Cao.(2024).Ecosystem health assessment using PSR model and obstacle factor diagnosis for Haizhou Bay, China.Ocean and Coastal Management107024-. [CrossRef]
Figure 1.
Research framework.
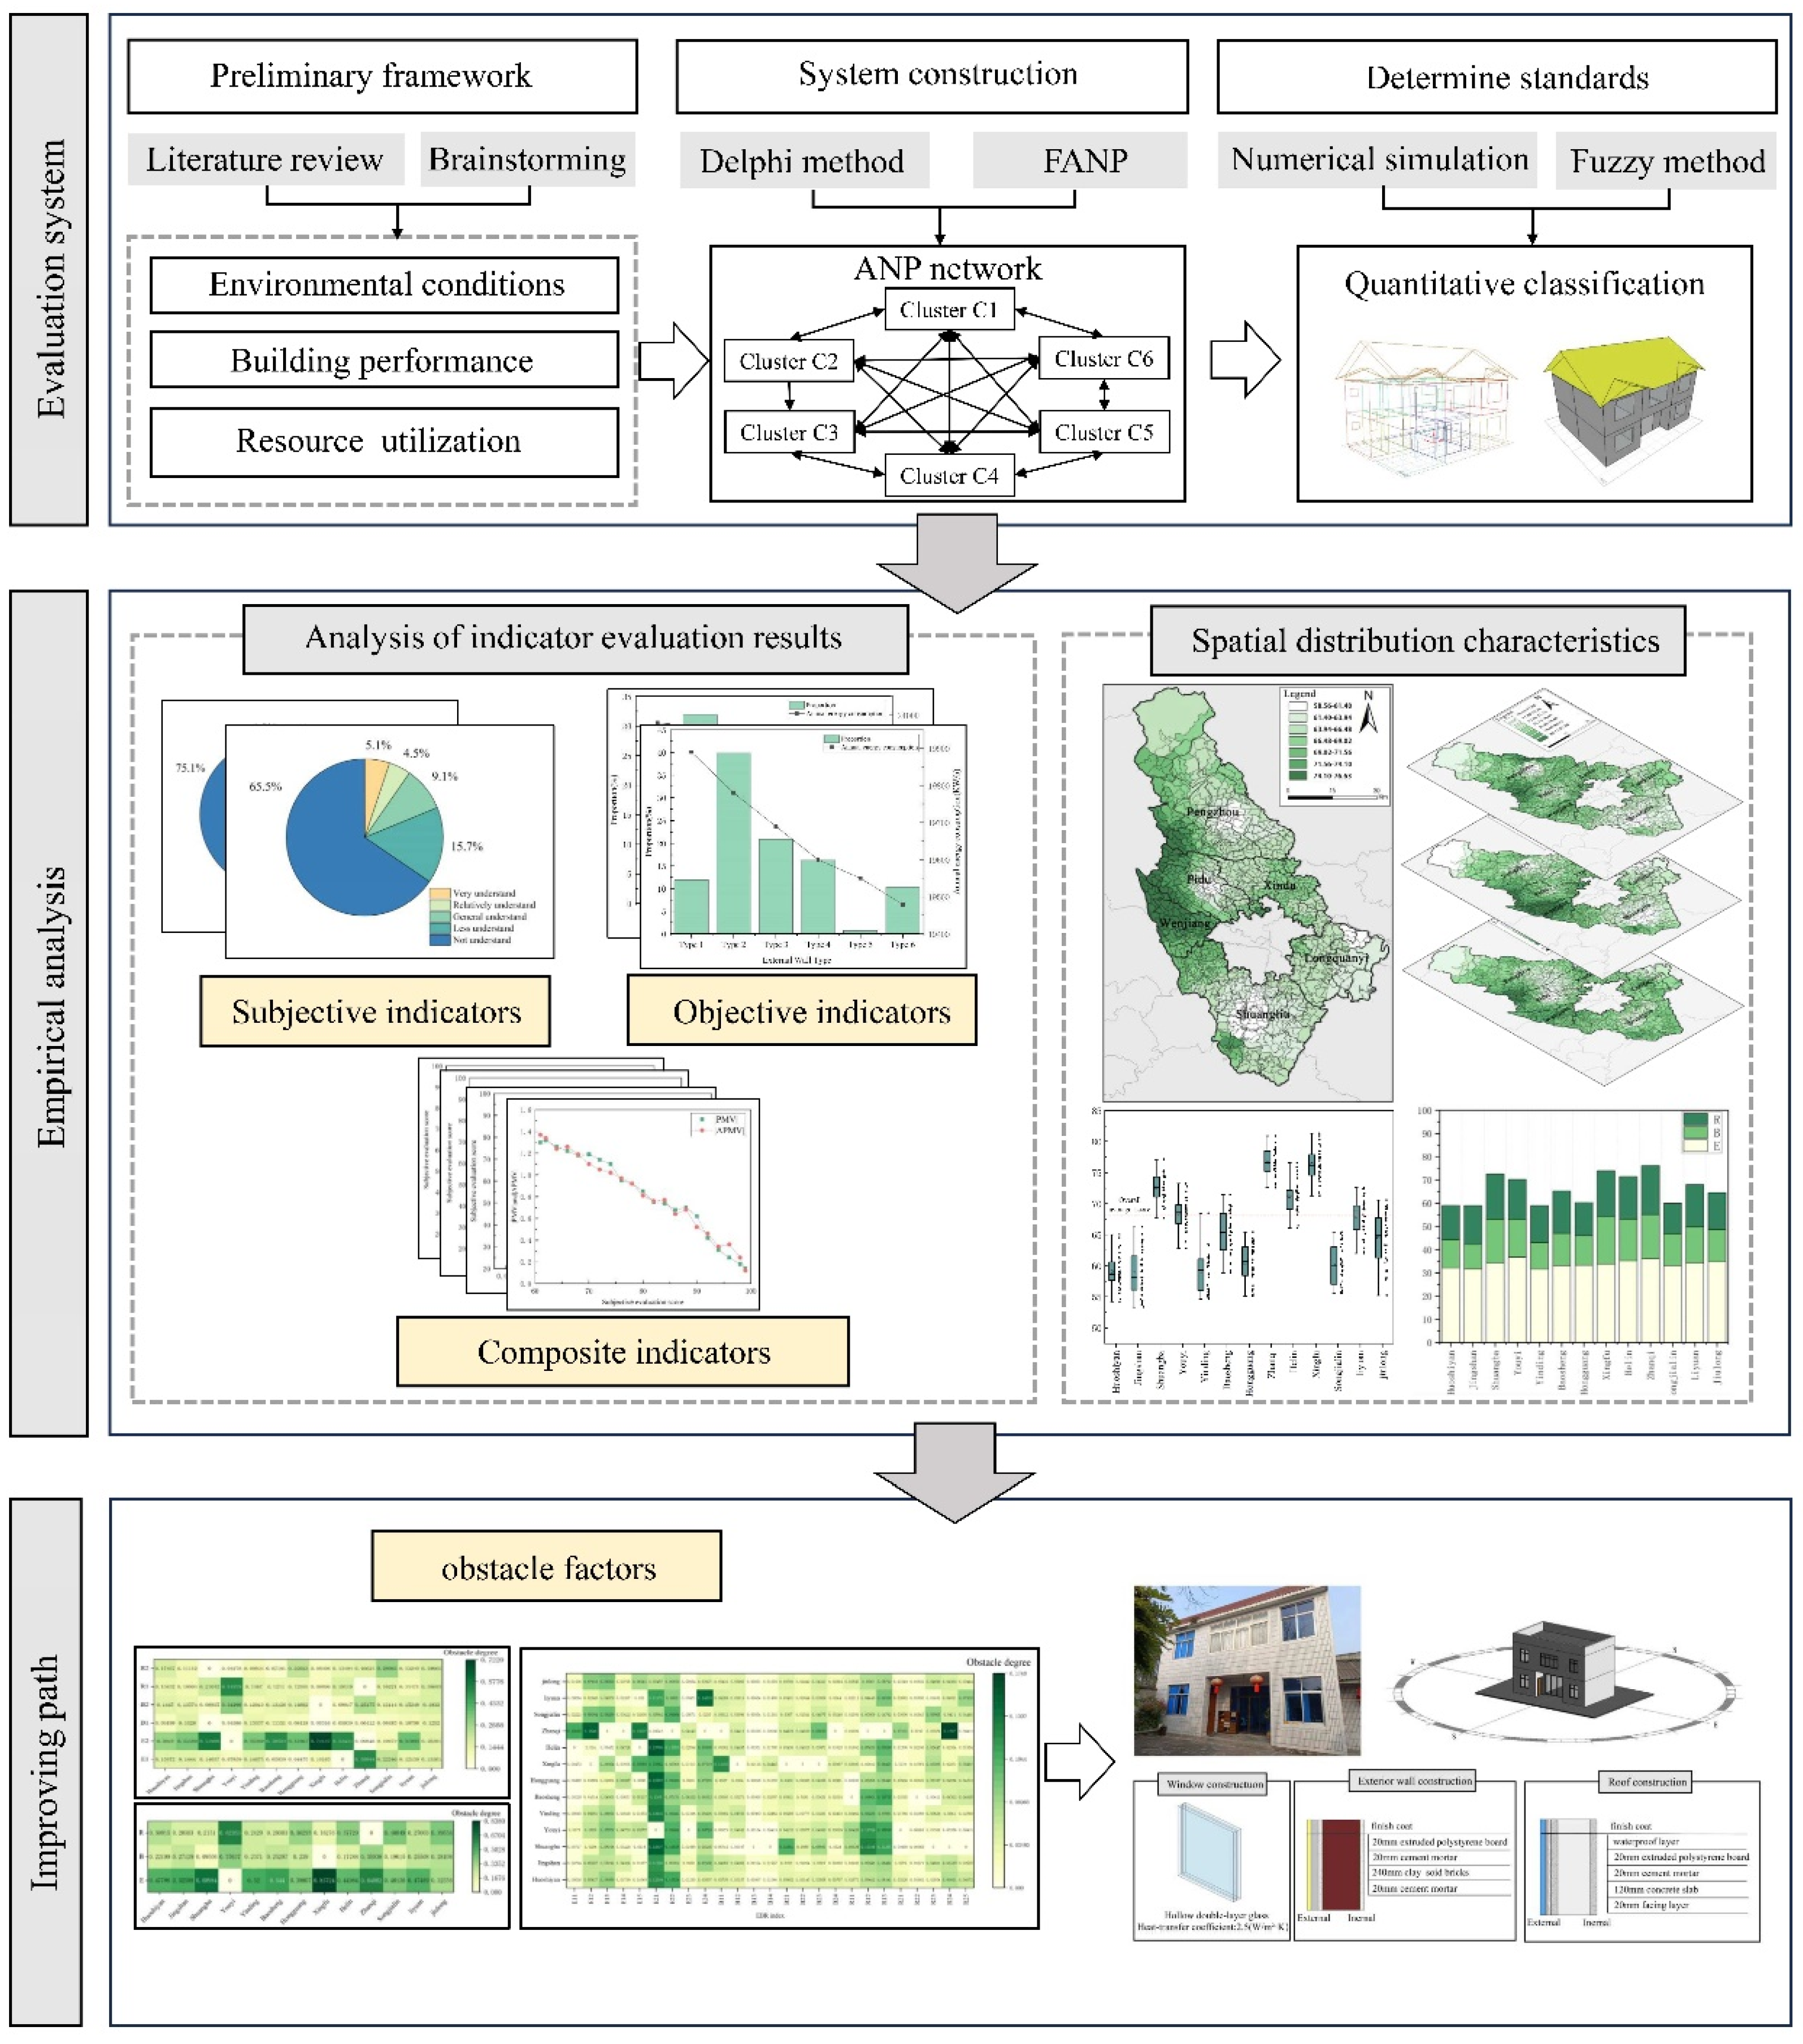
Figure 2.
Network hierarchical database model hiagram of comprehensive evaluation indicators for rural green residential buildings.
Figure 2.
Network hierarchical database model hiagram of comprehensive evaluation indicators for rural green residential buildings.
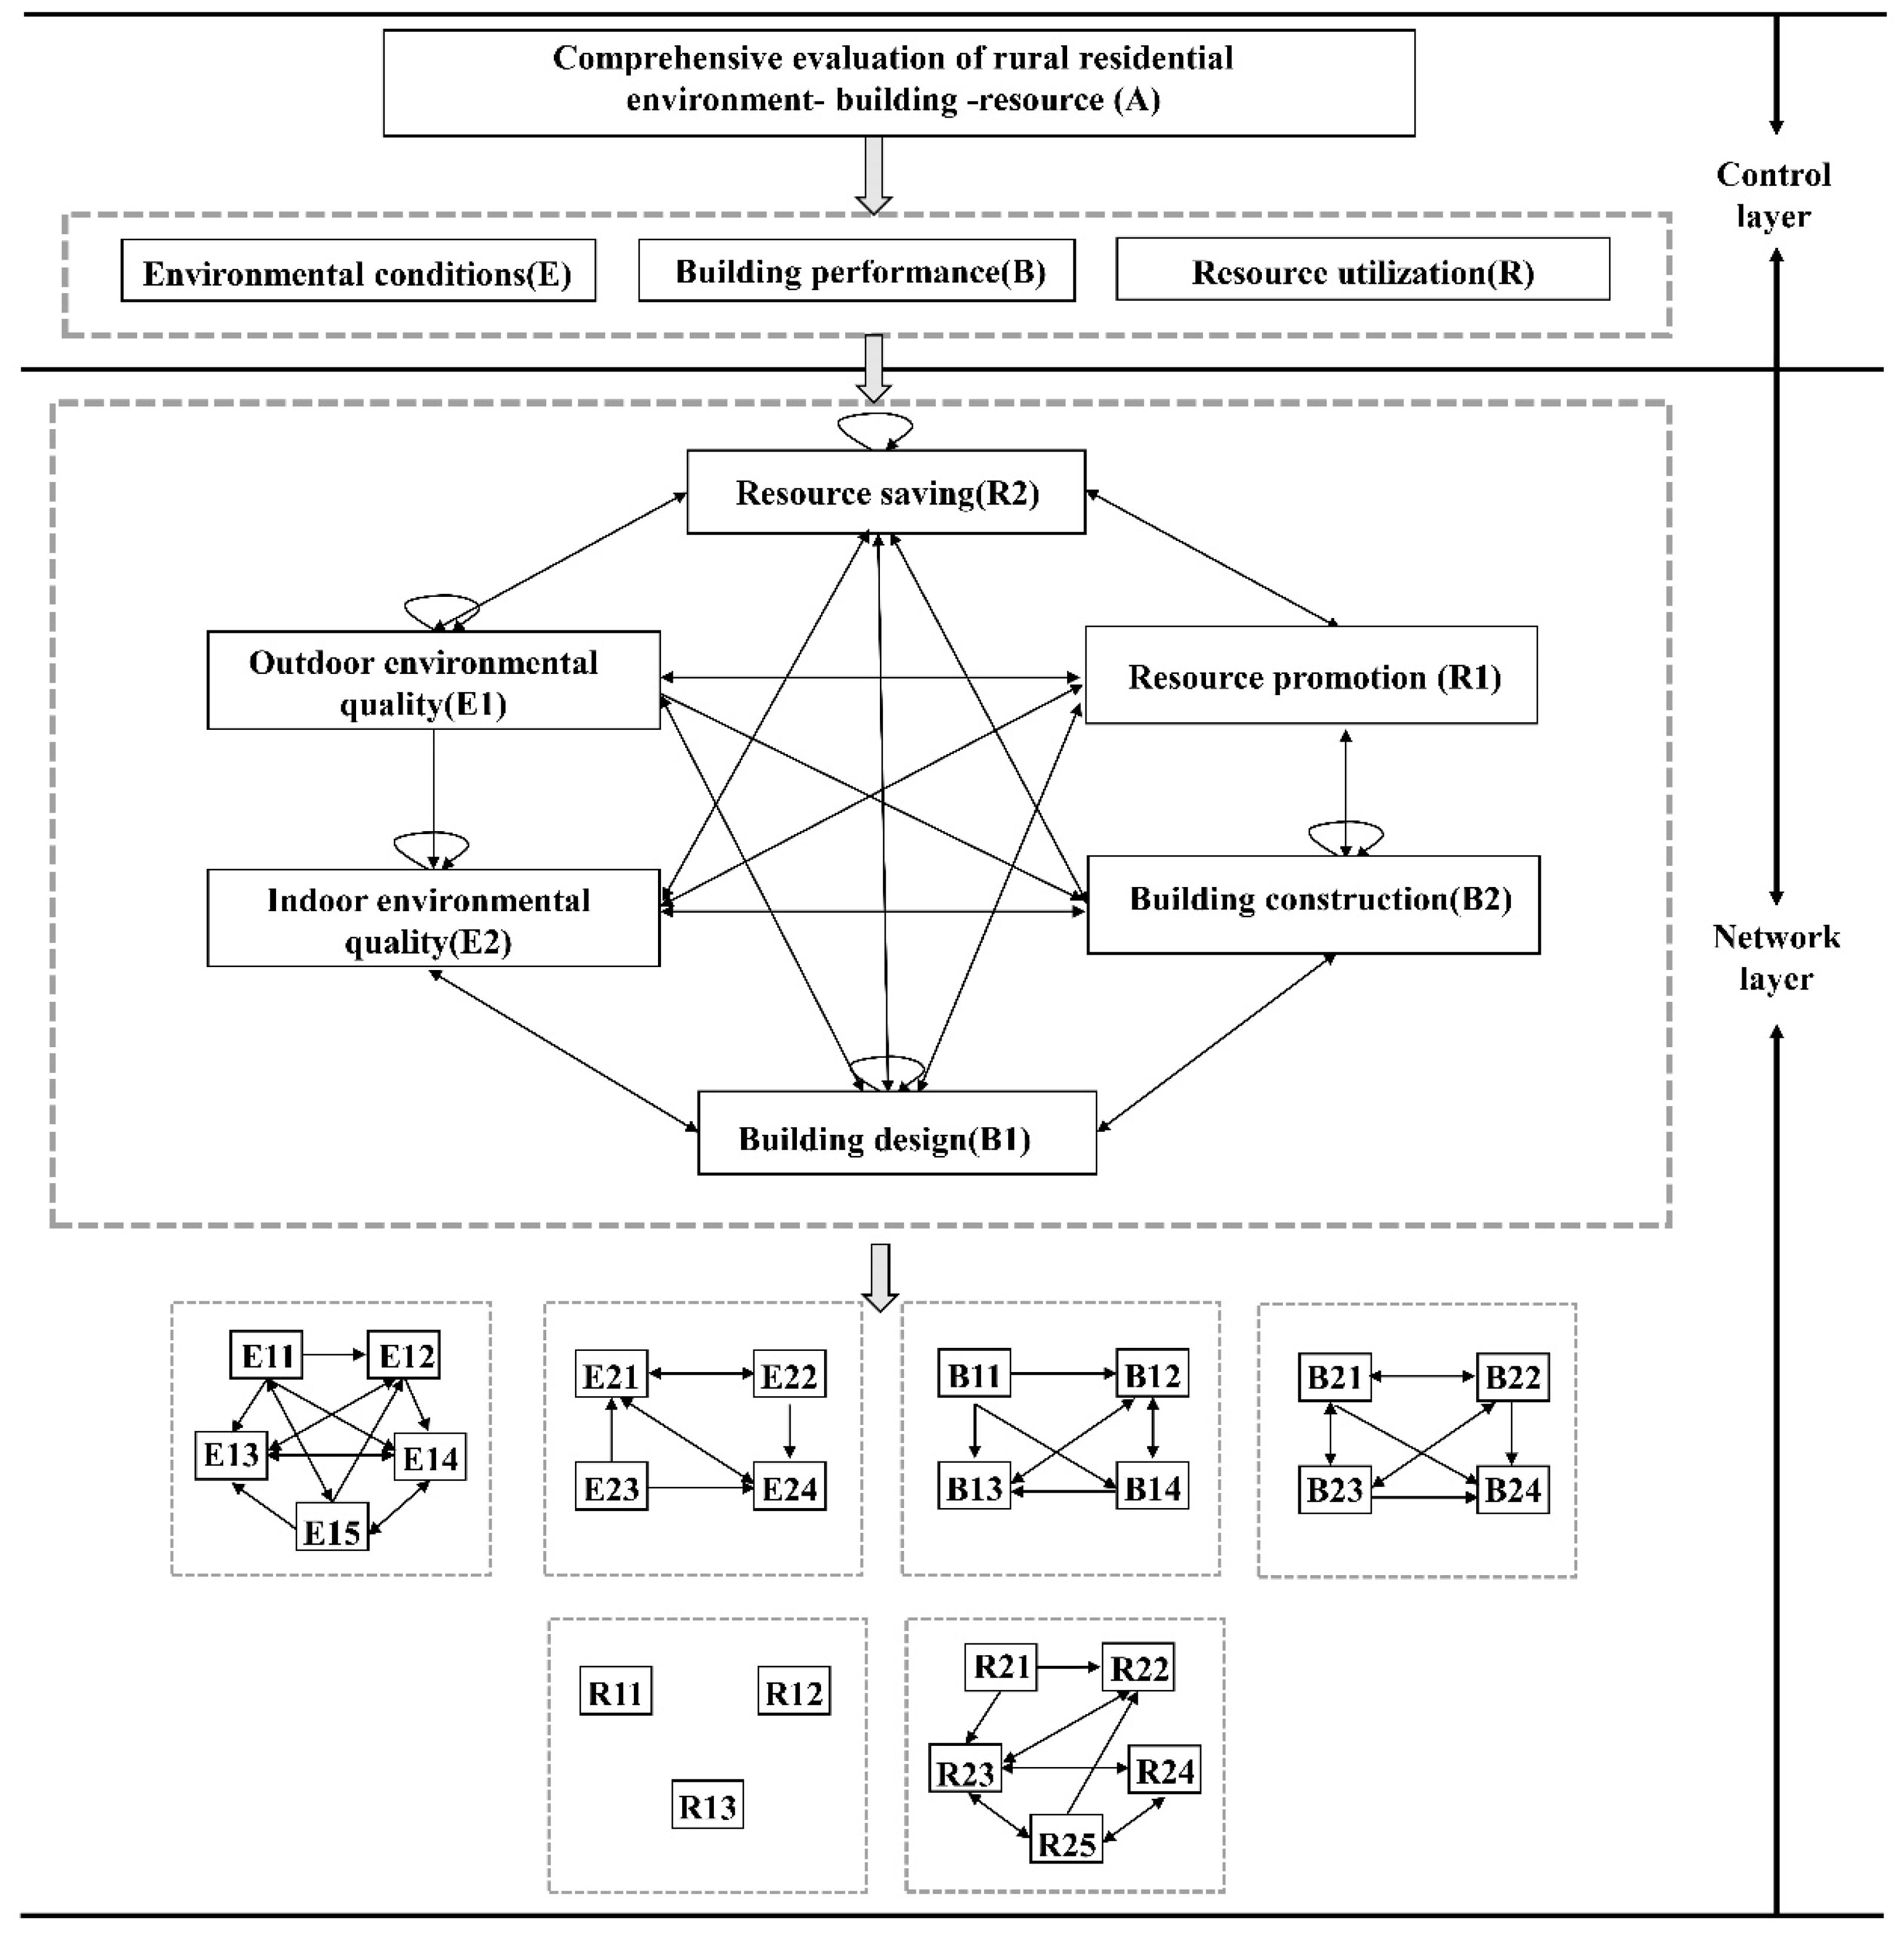
Figure 3.
Numerical simulation process.
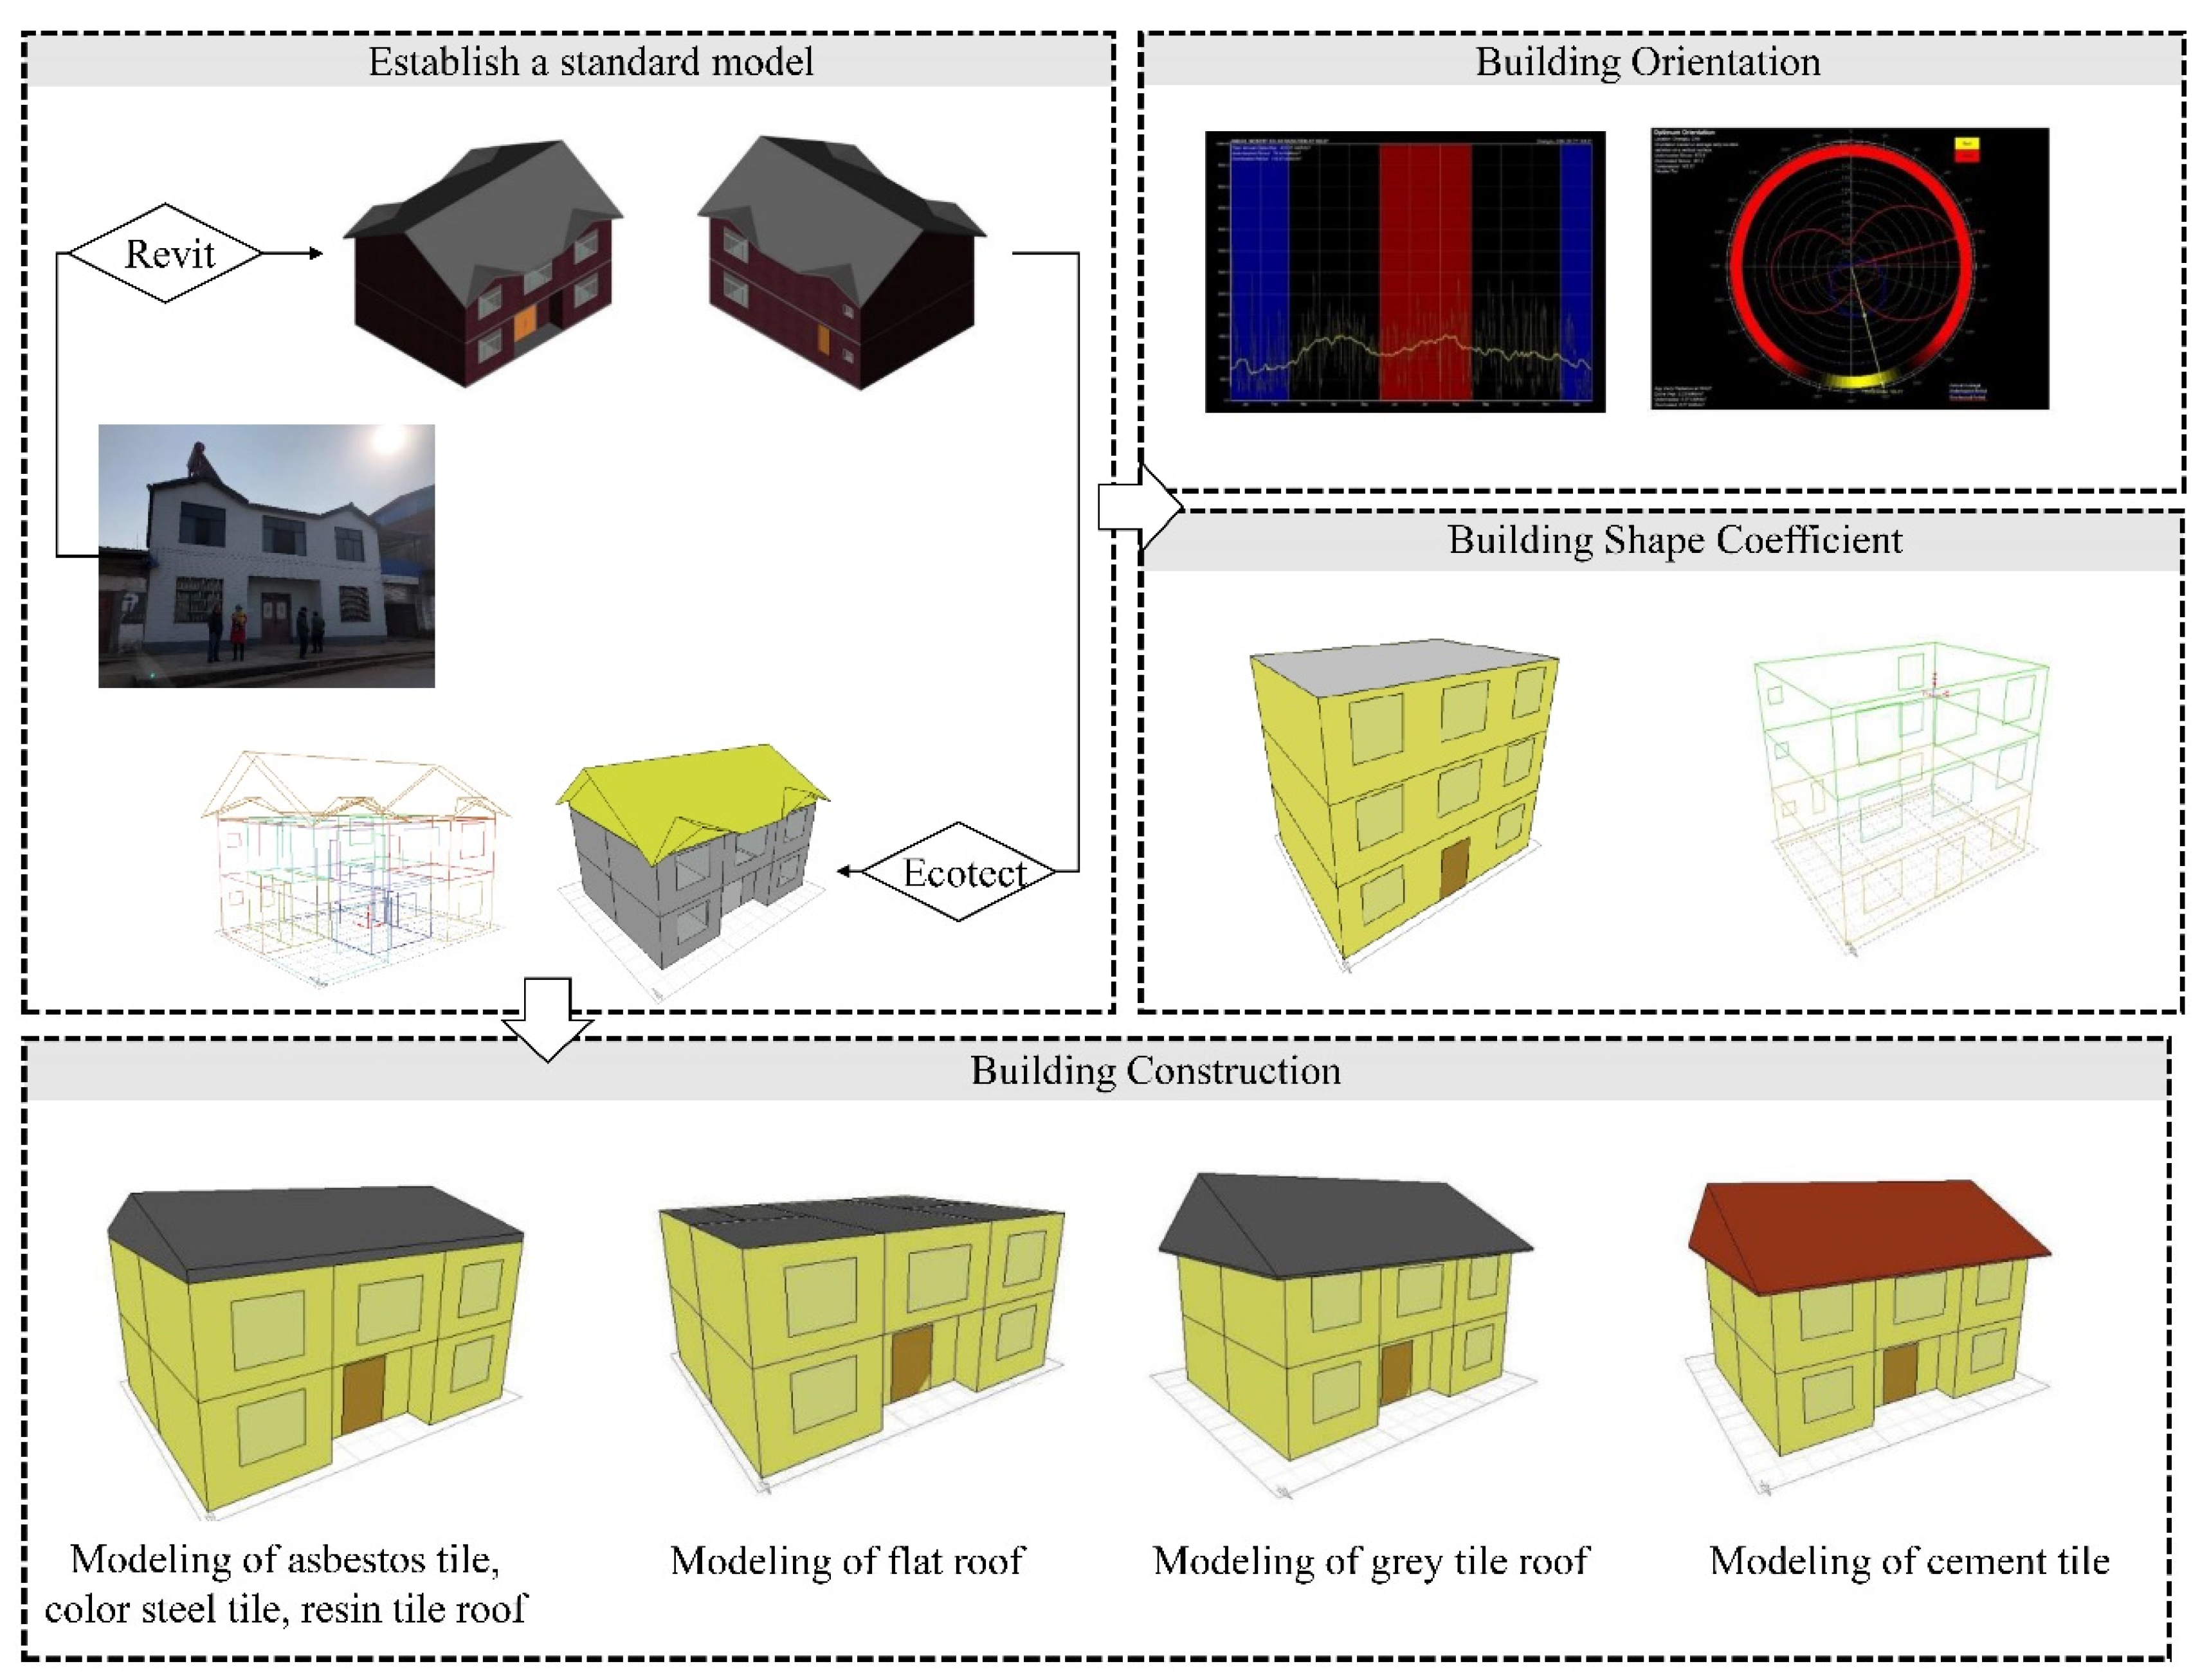
Figure 4.
Location of the case selection area and survey sites.
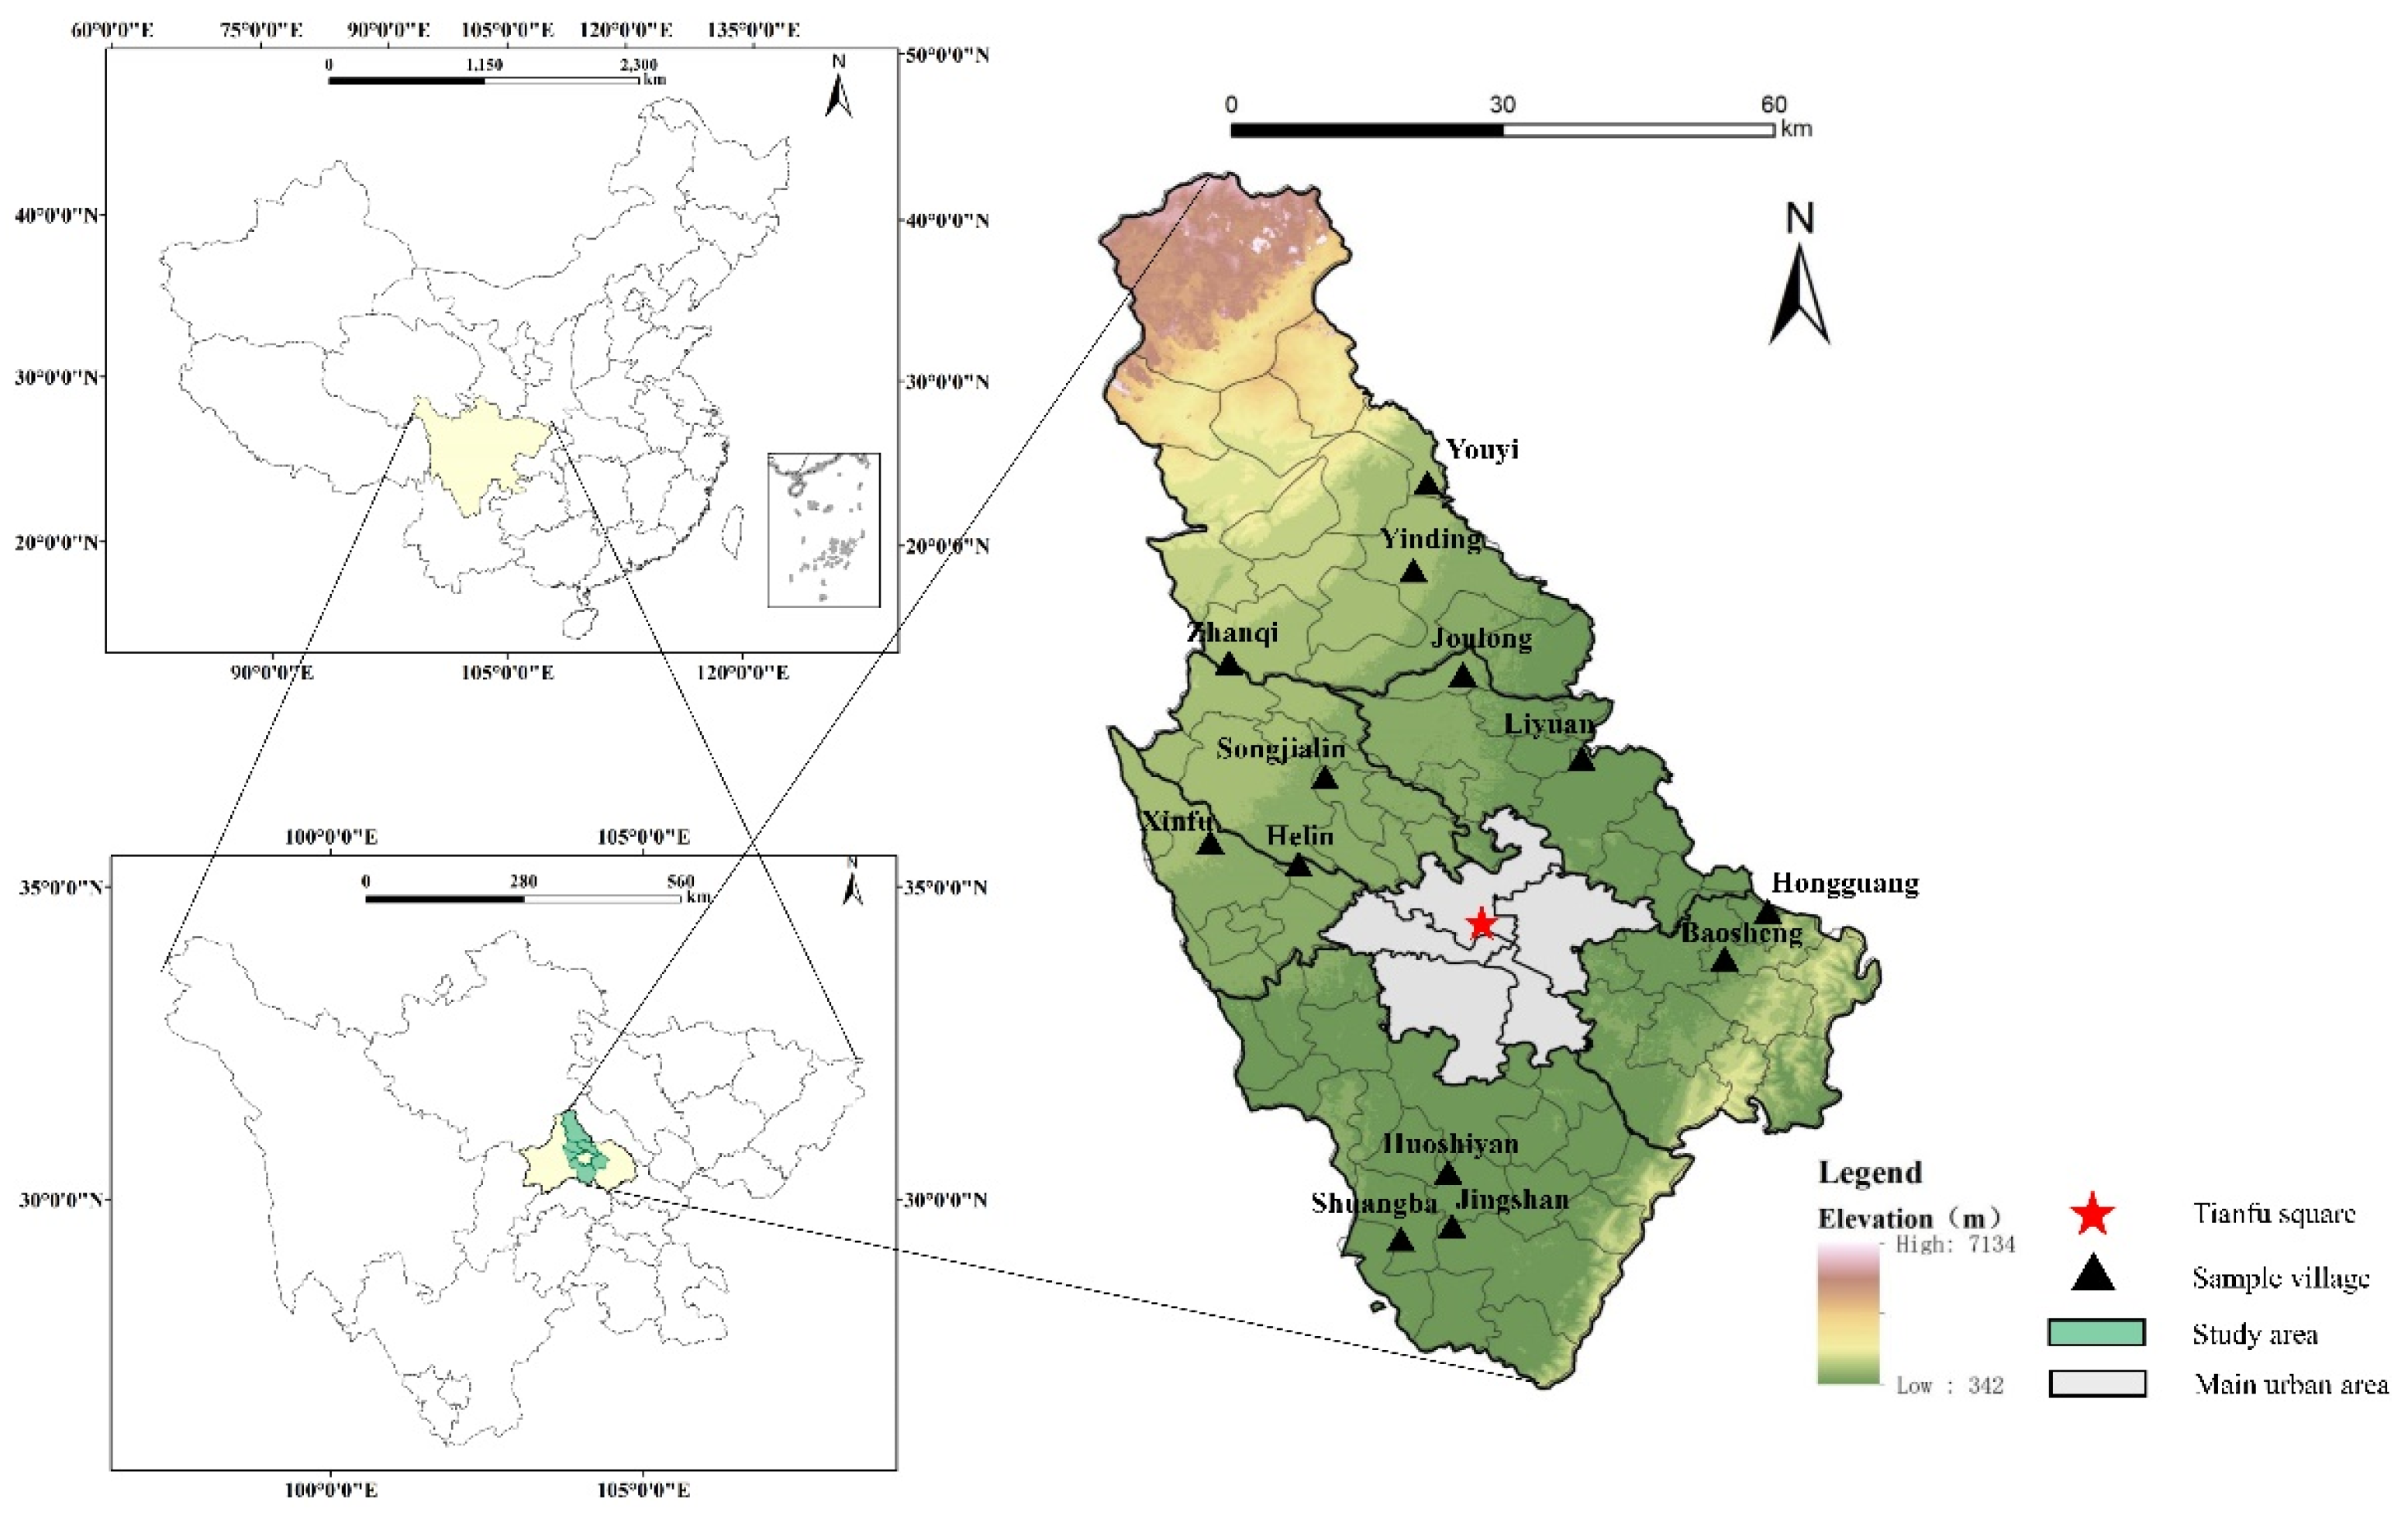
Figure 5.
On site research and data measurement.
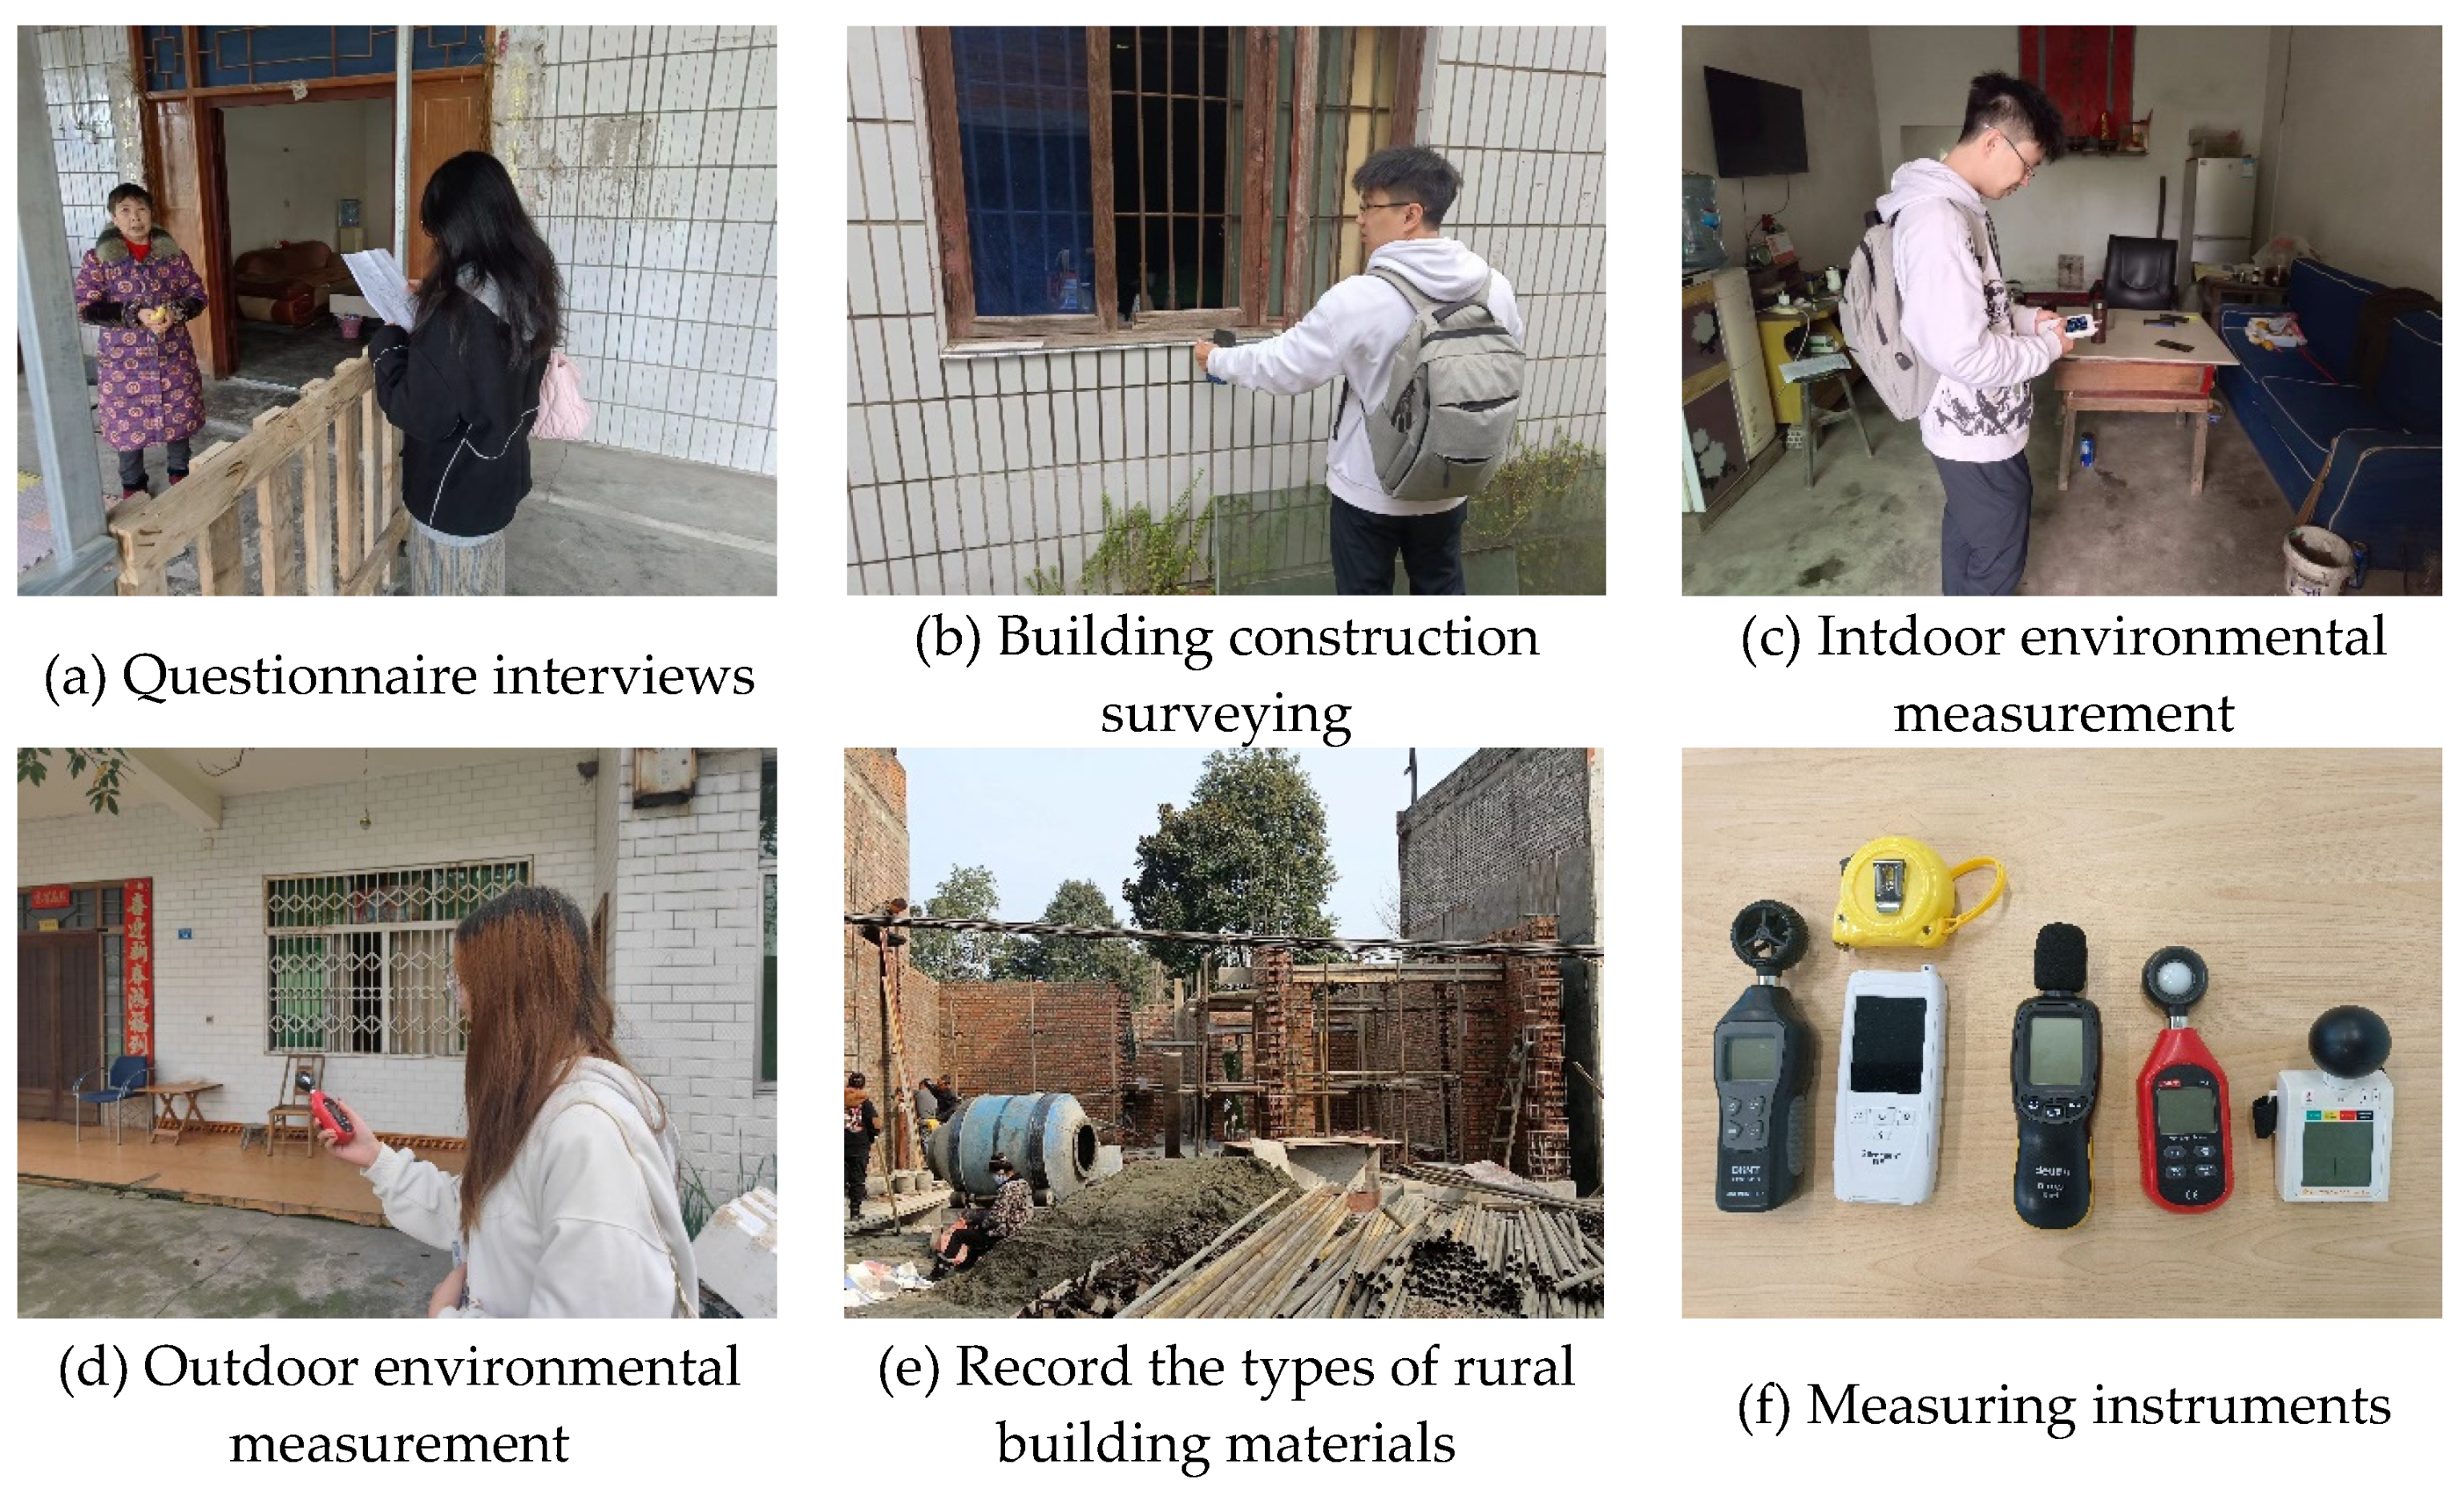
Figure 6.
Understanding and Using Green Building Materials.
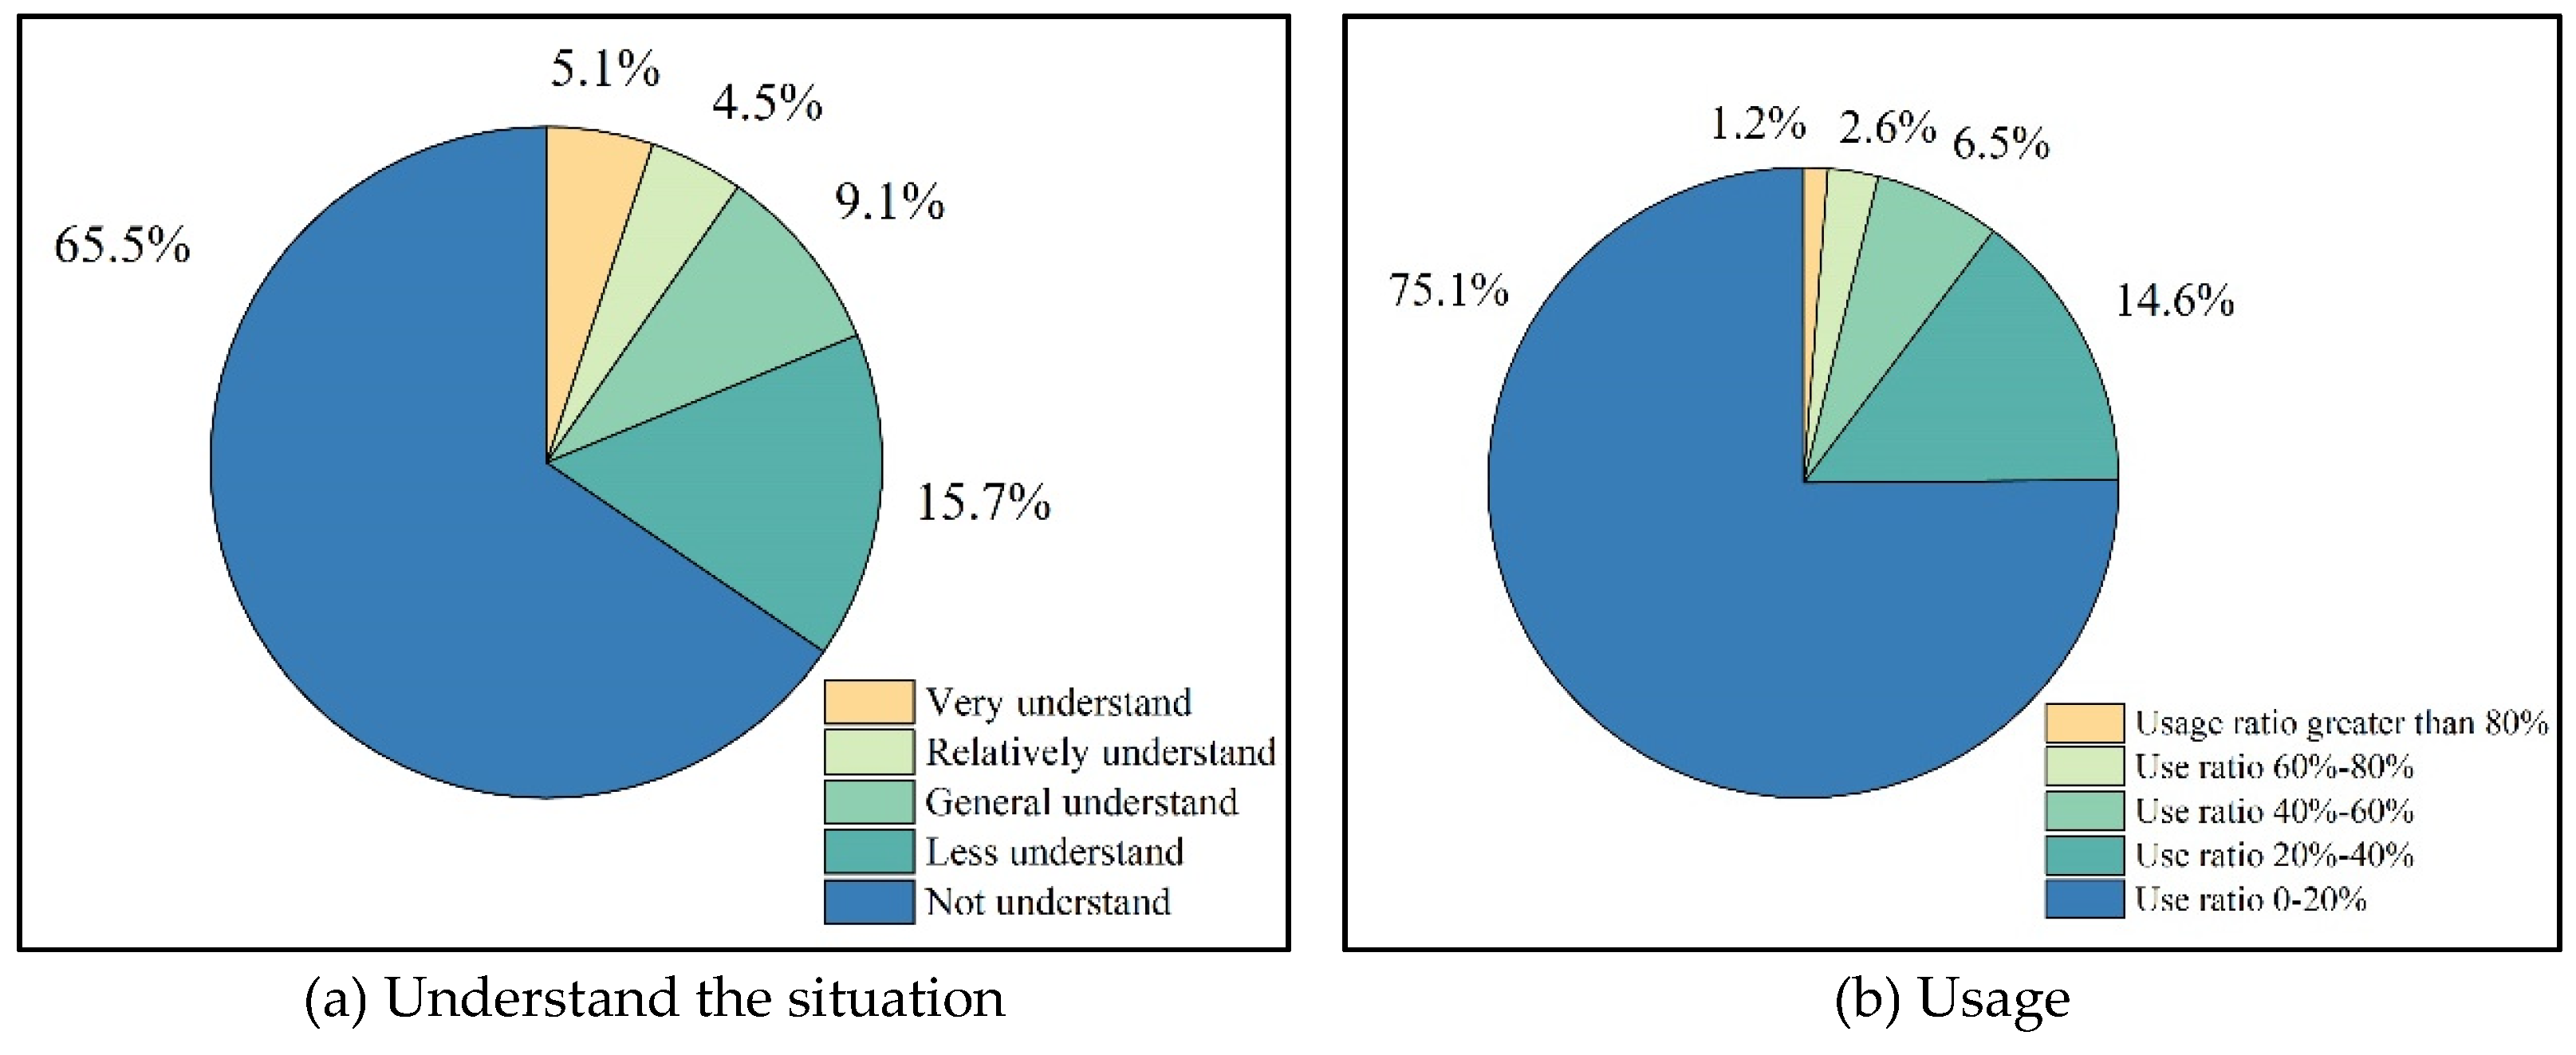
Figure 7.
Annual energy consumption and proportion of roof, exterior wall and window.
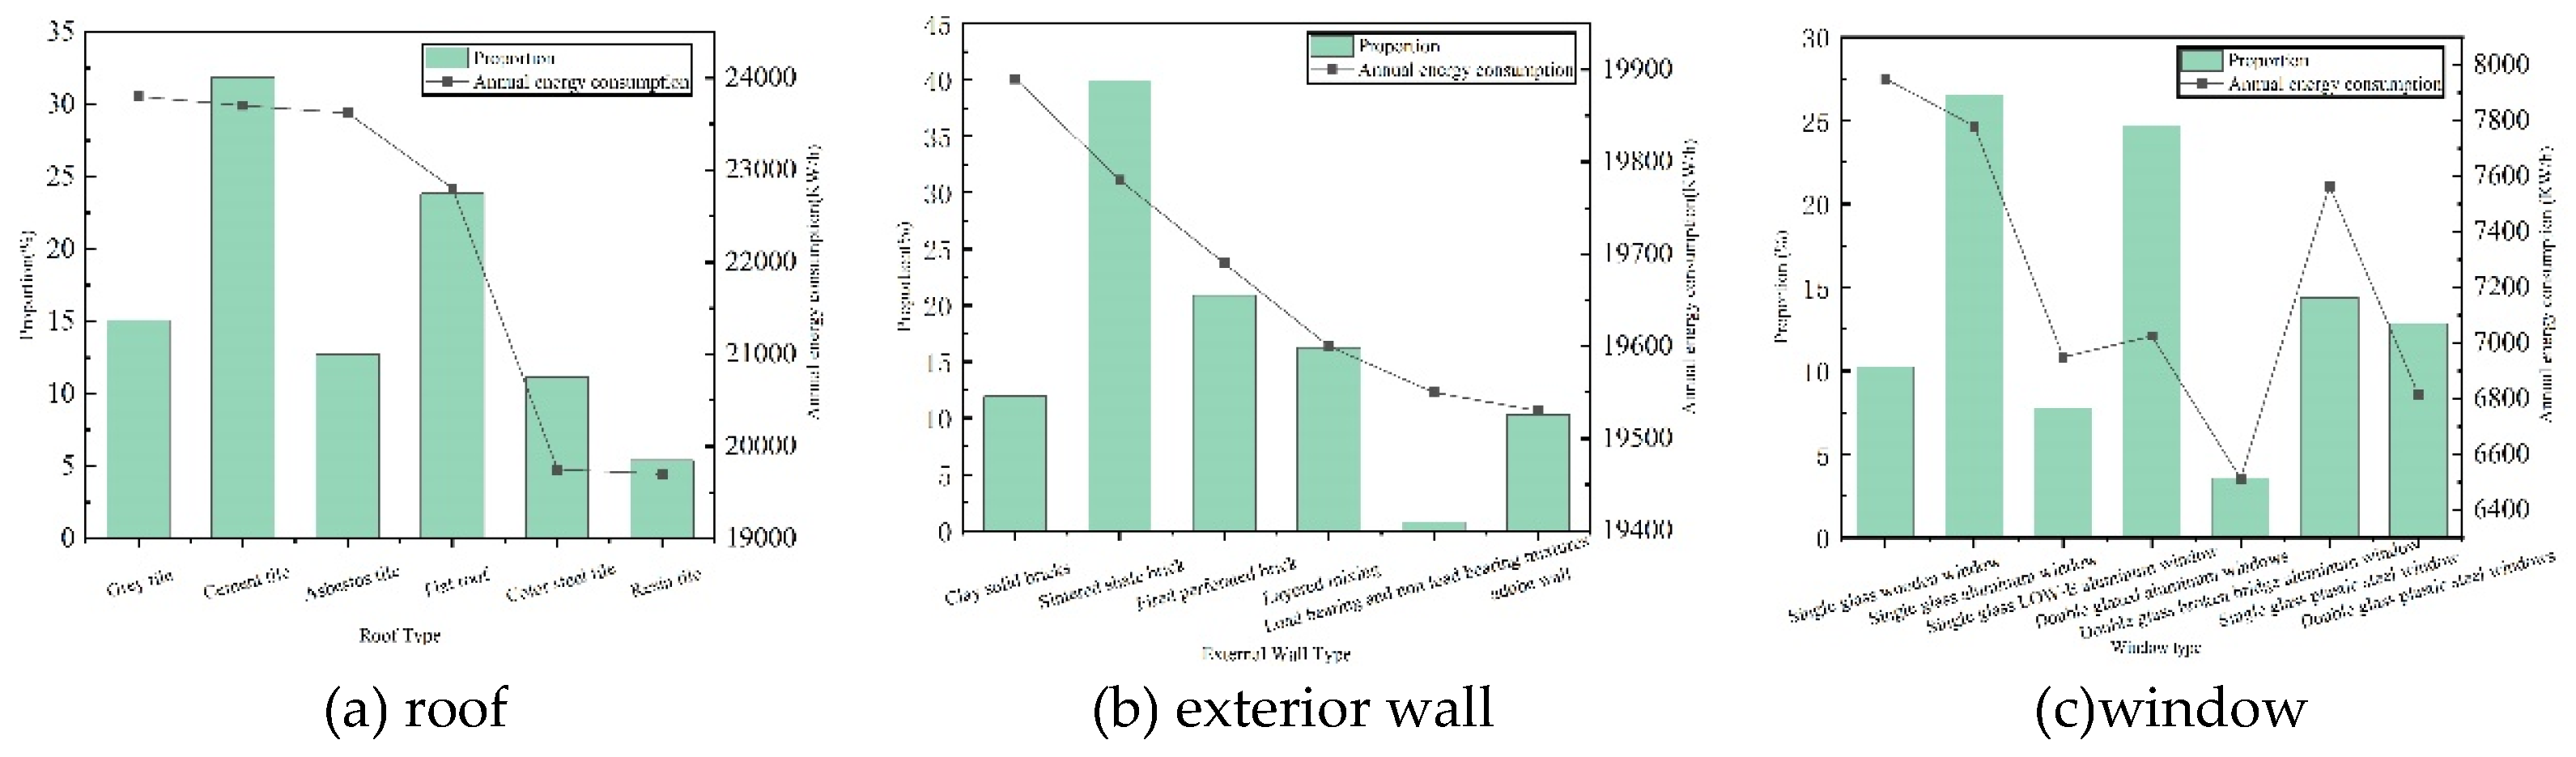
Figure 8.
Photos of Two Rural Residential Buildings in Pidu District.
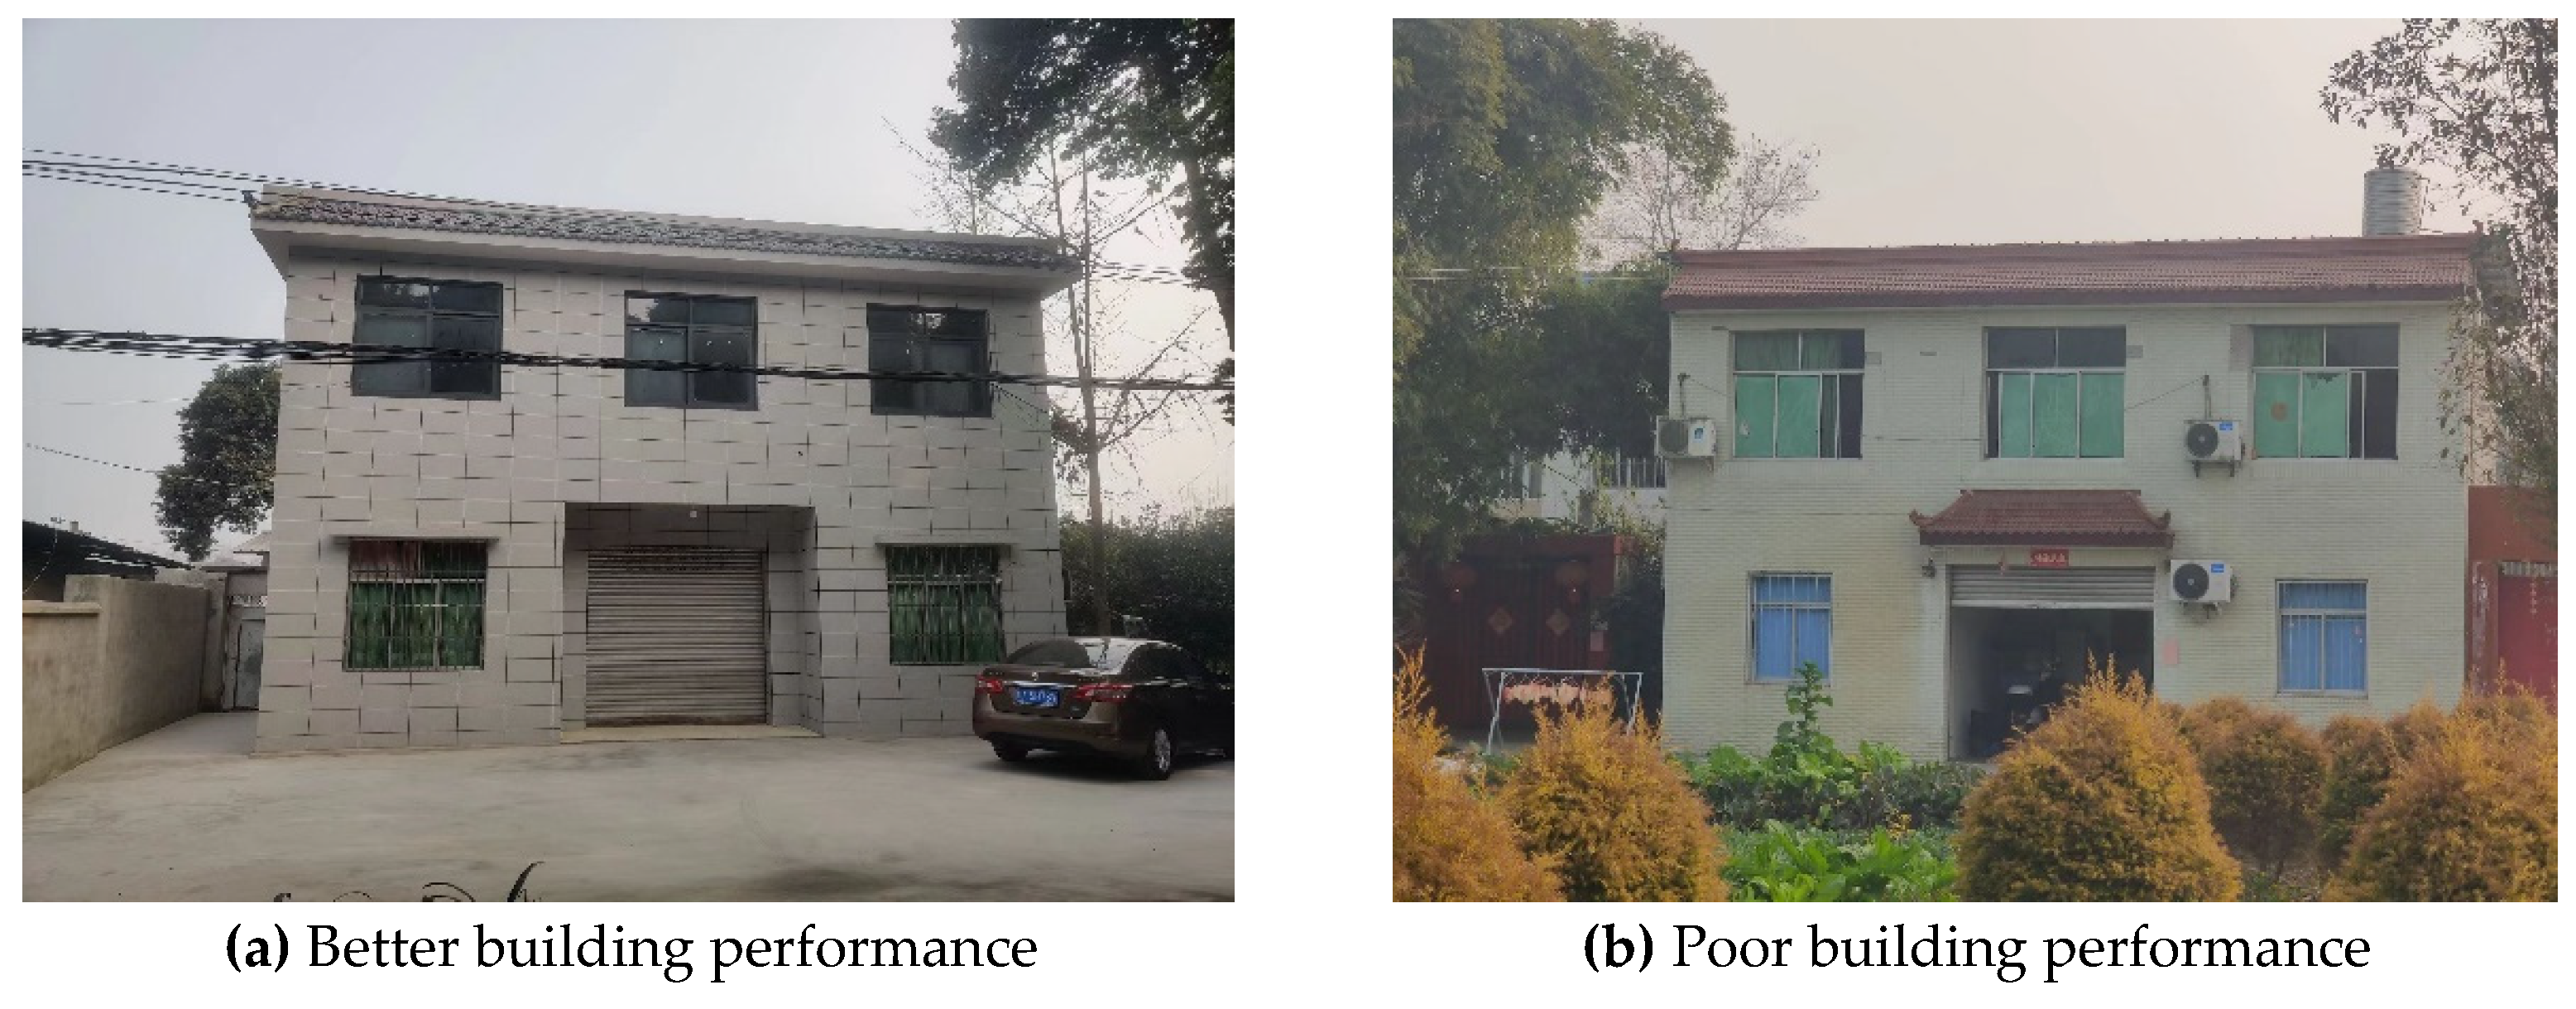
Figure 9.
Comparison between subjective evaluation and objective evaluation.
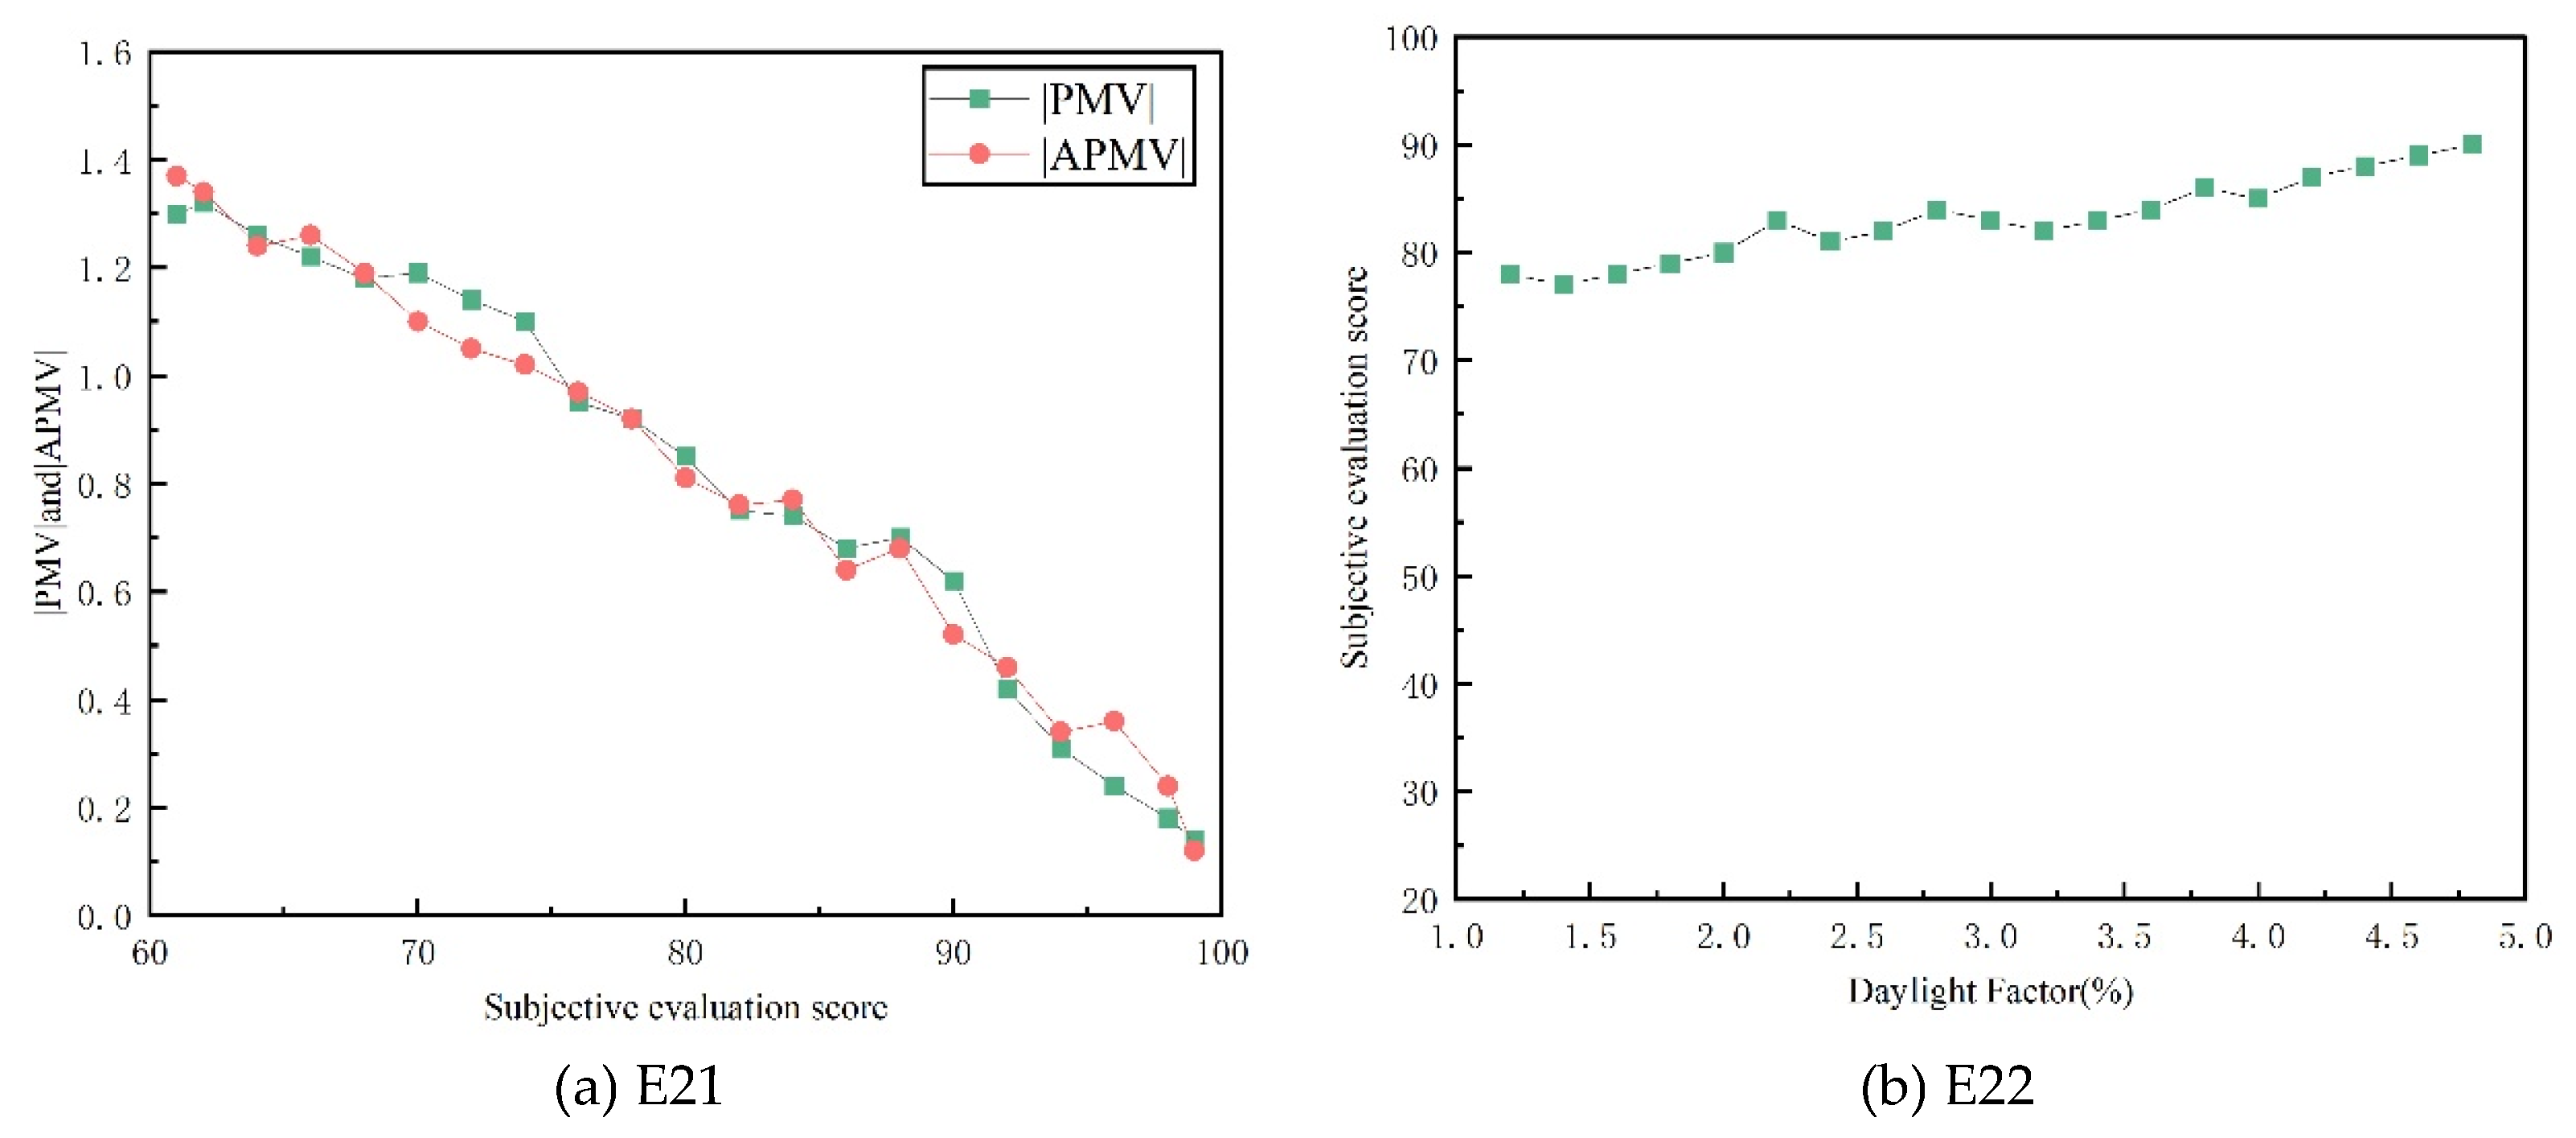
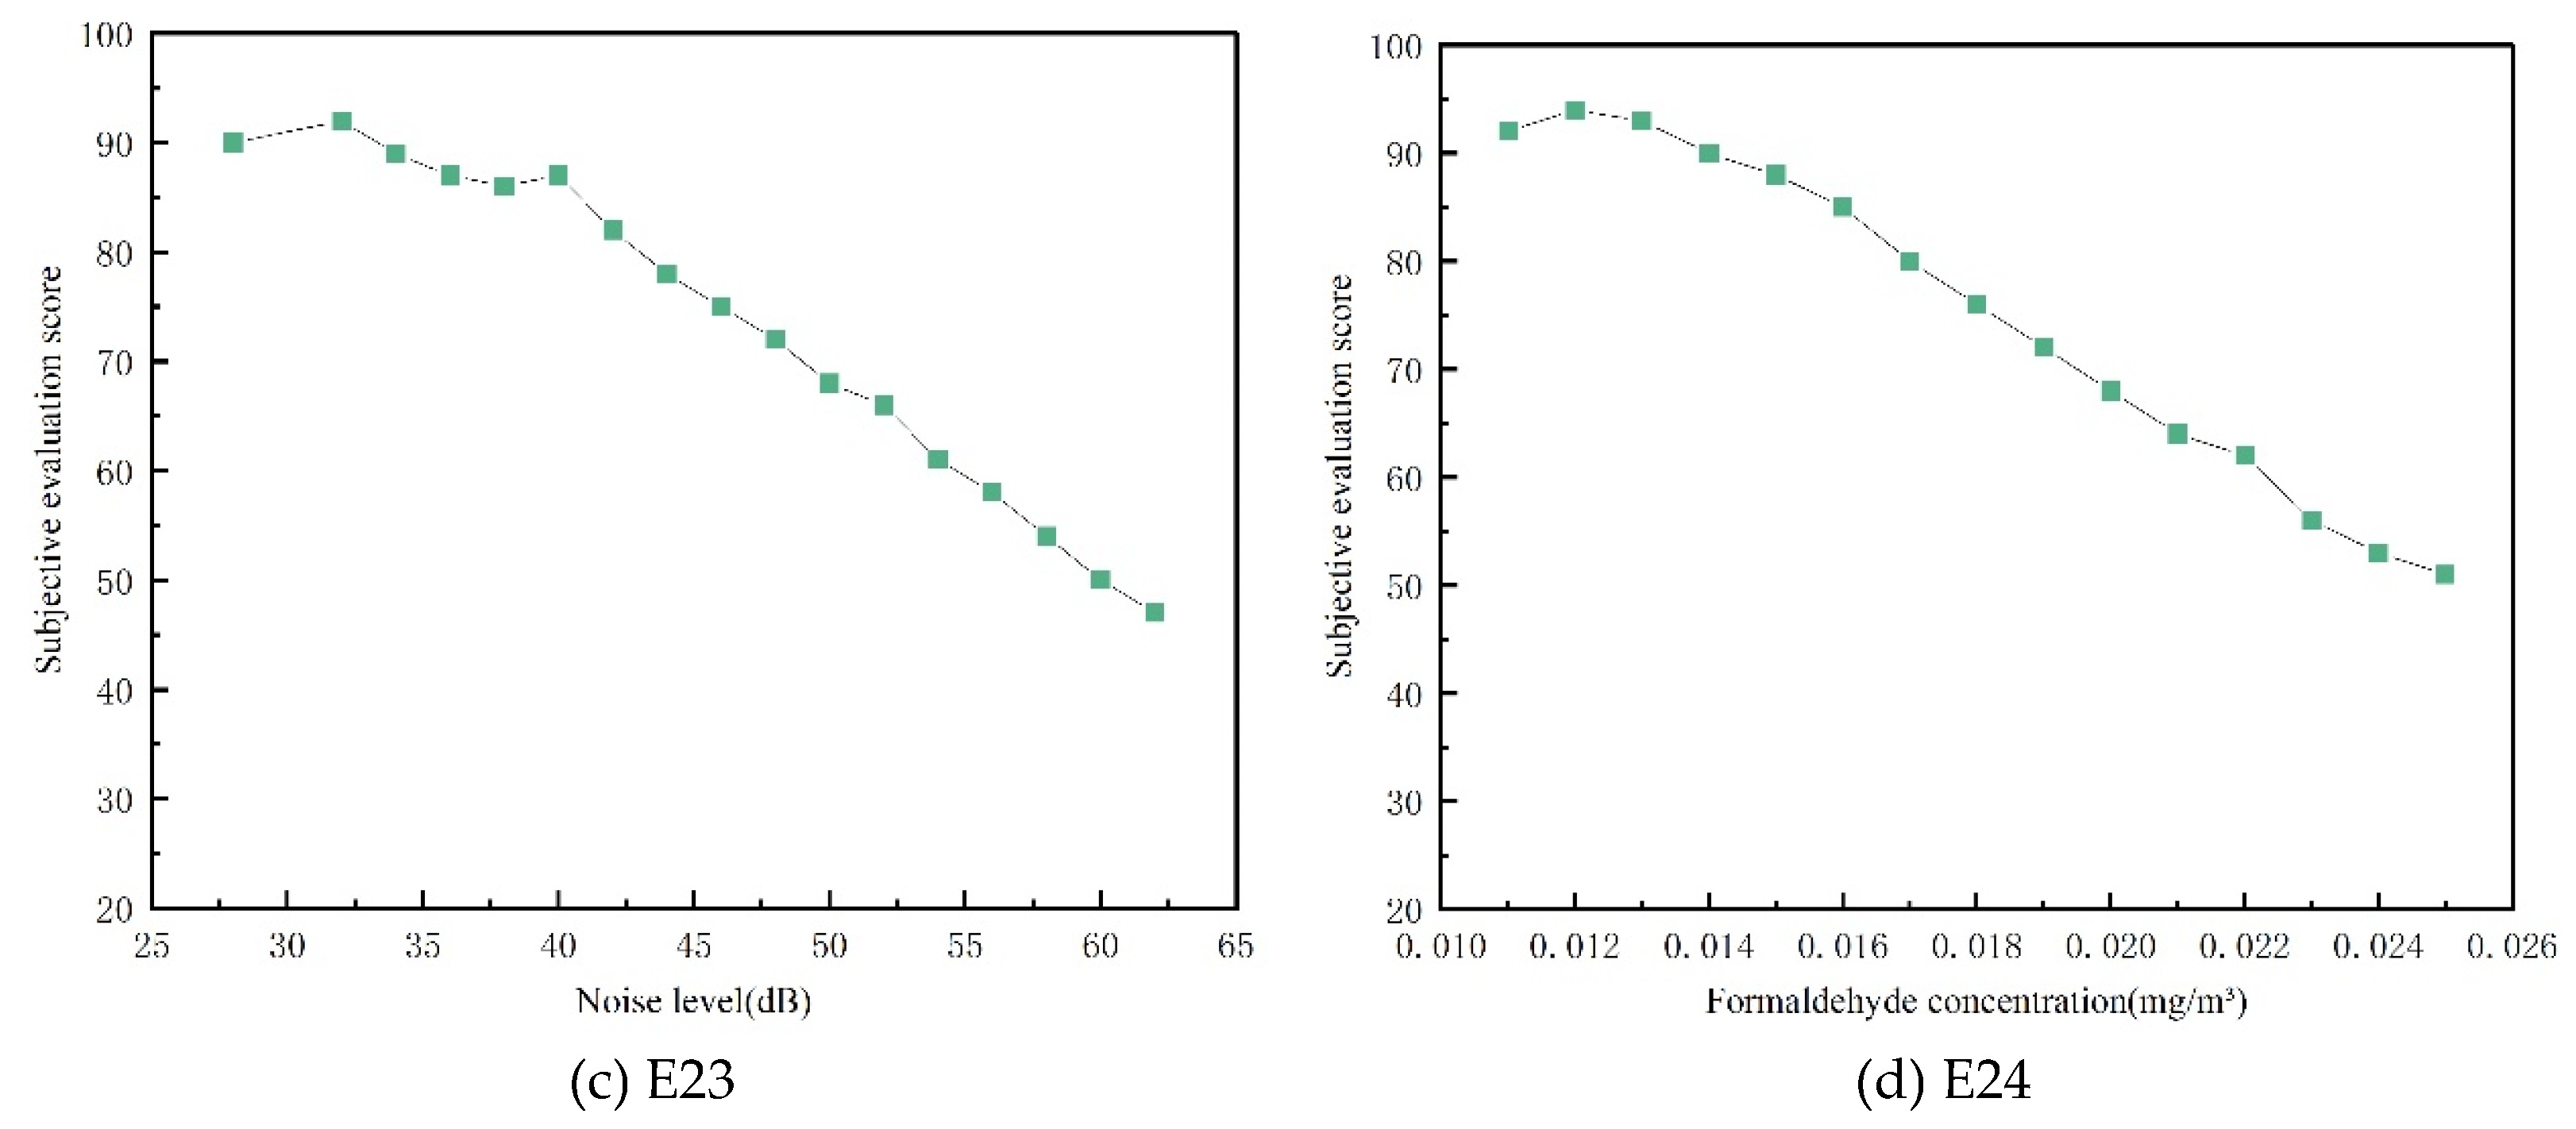
Figure 10.
Overall score of the sample village.
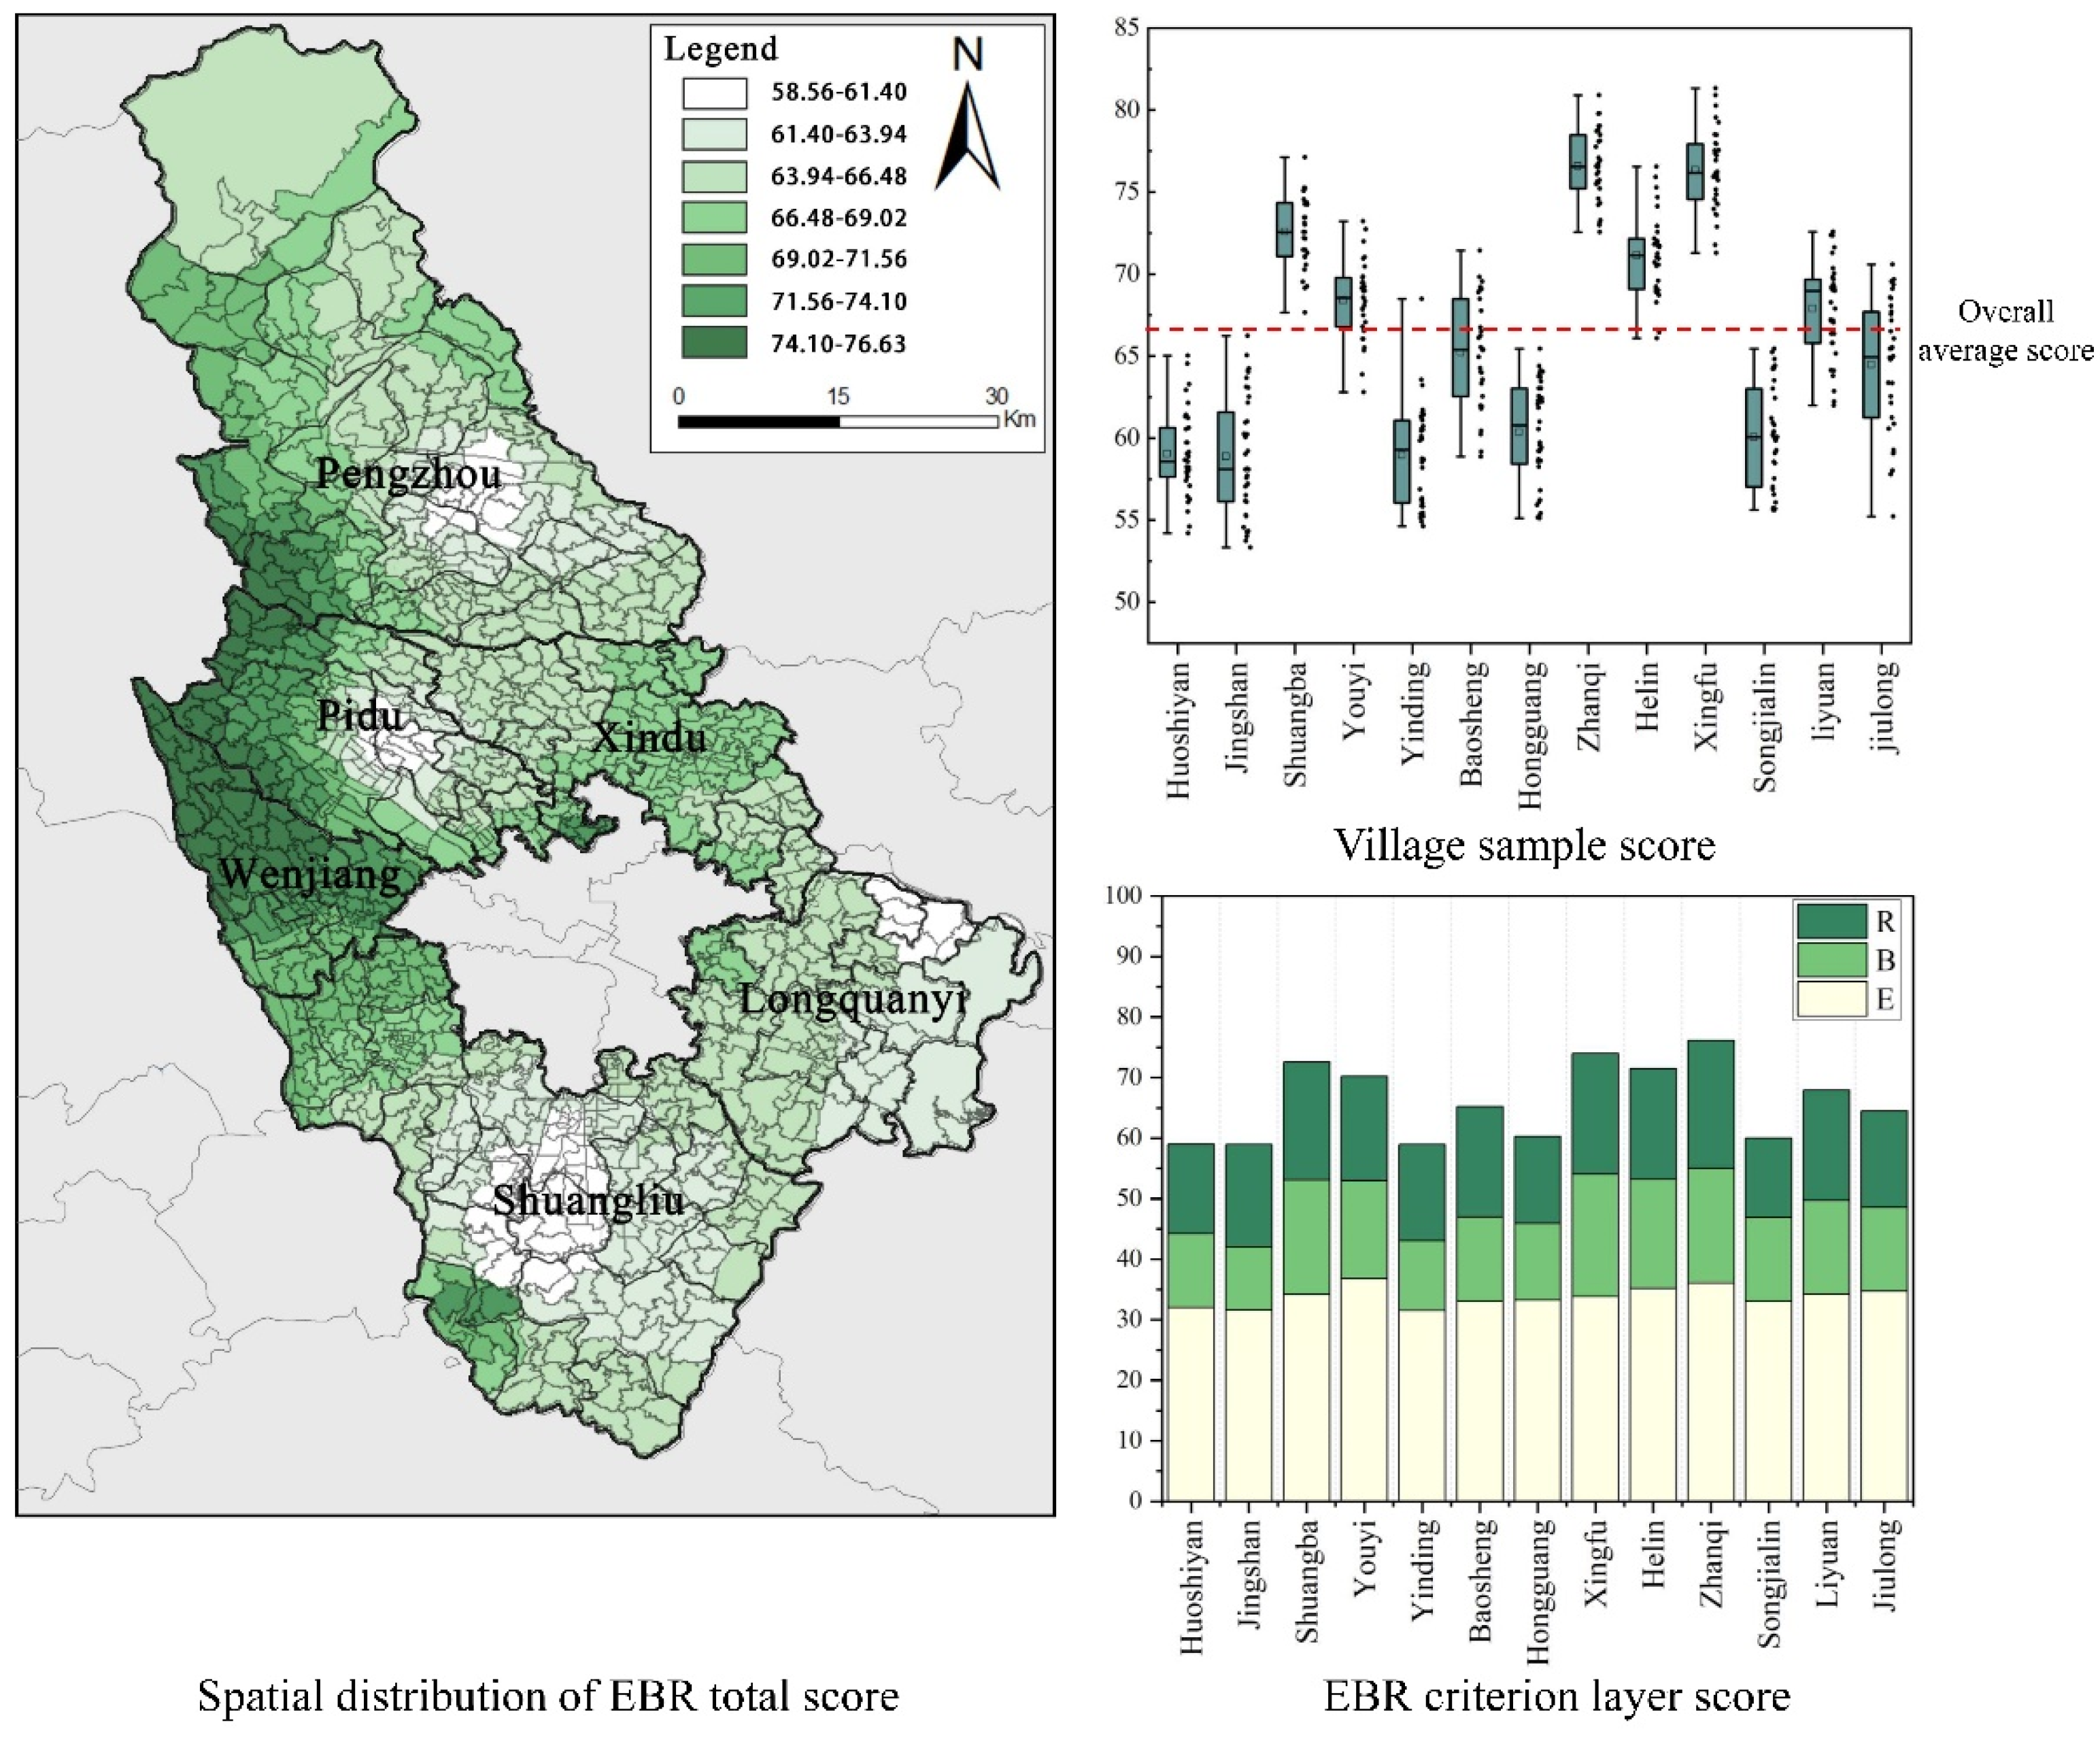
Figure 11.
Spatial distribution of criterion layer and Subcriteria layer.
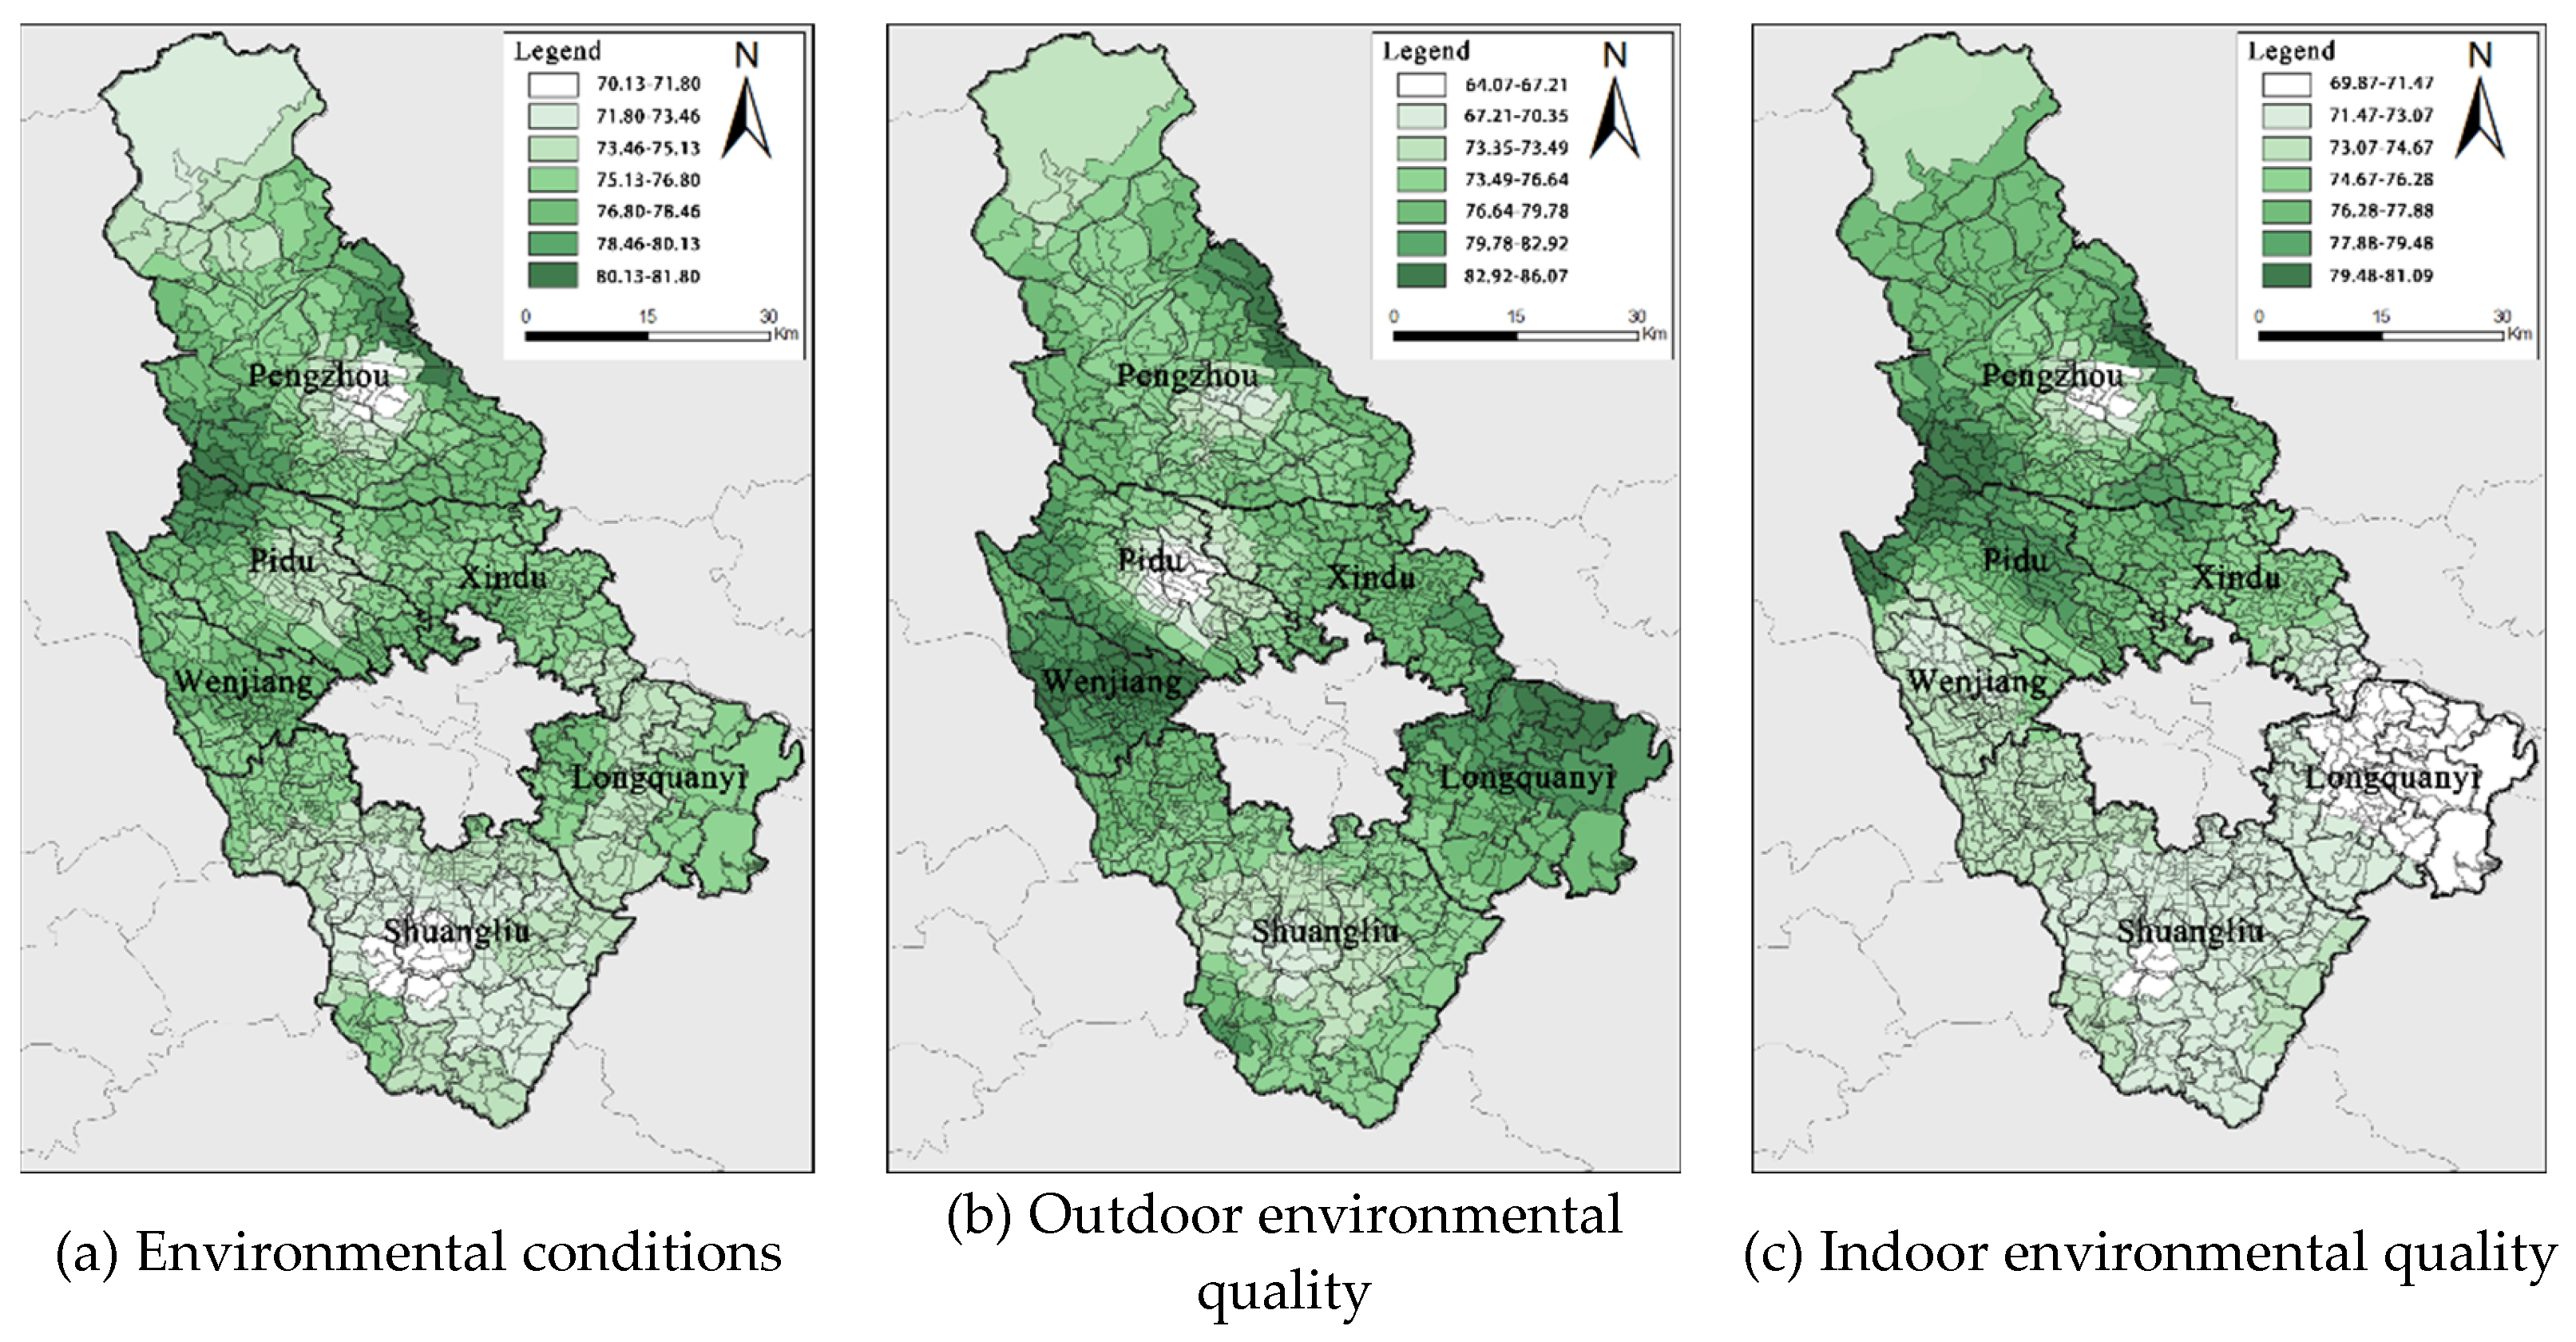
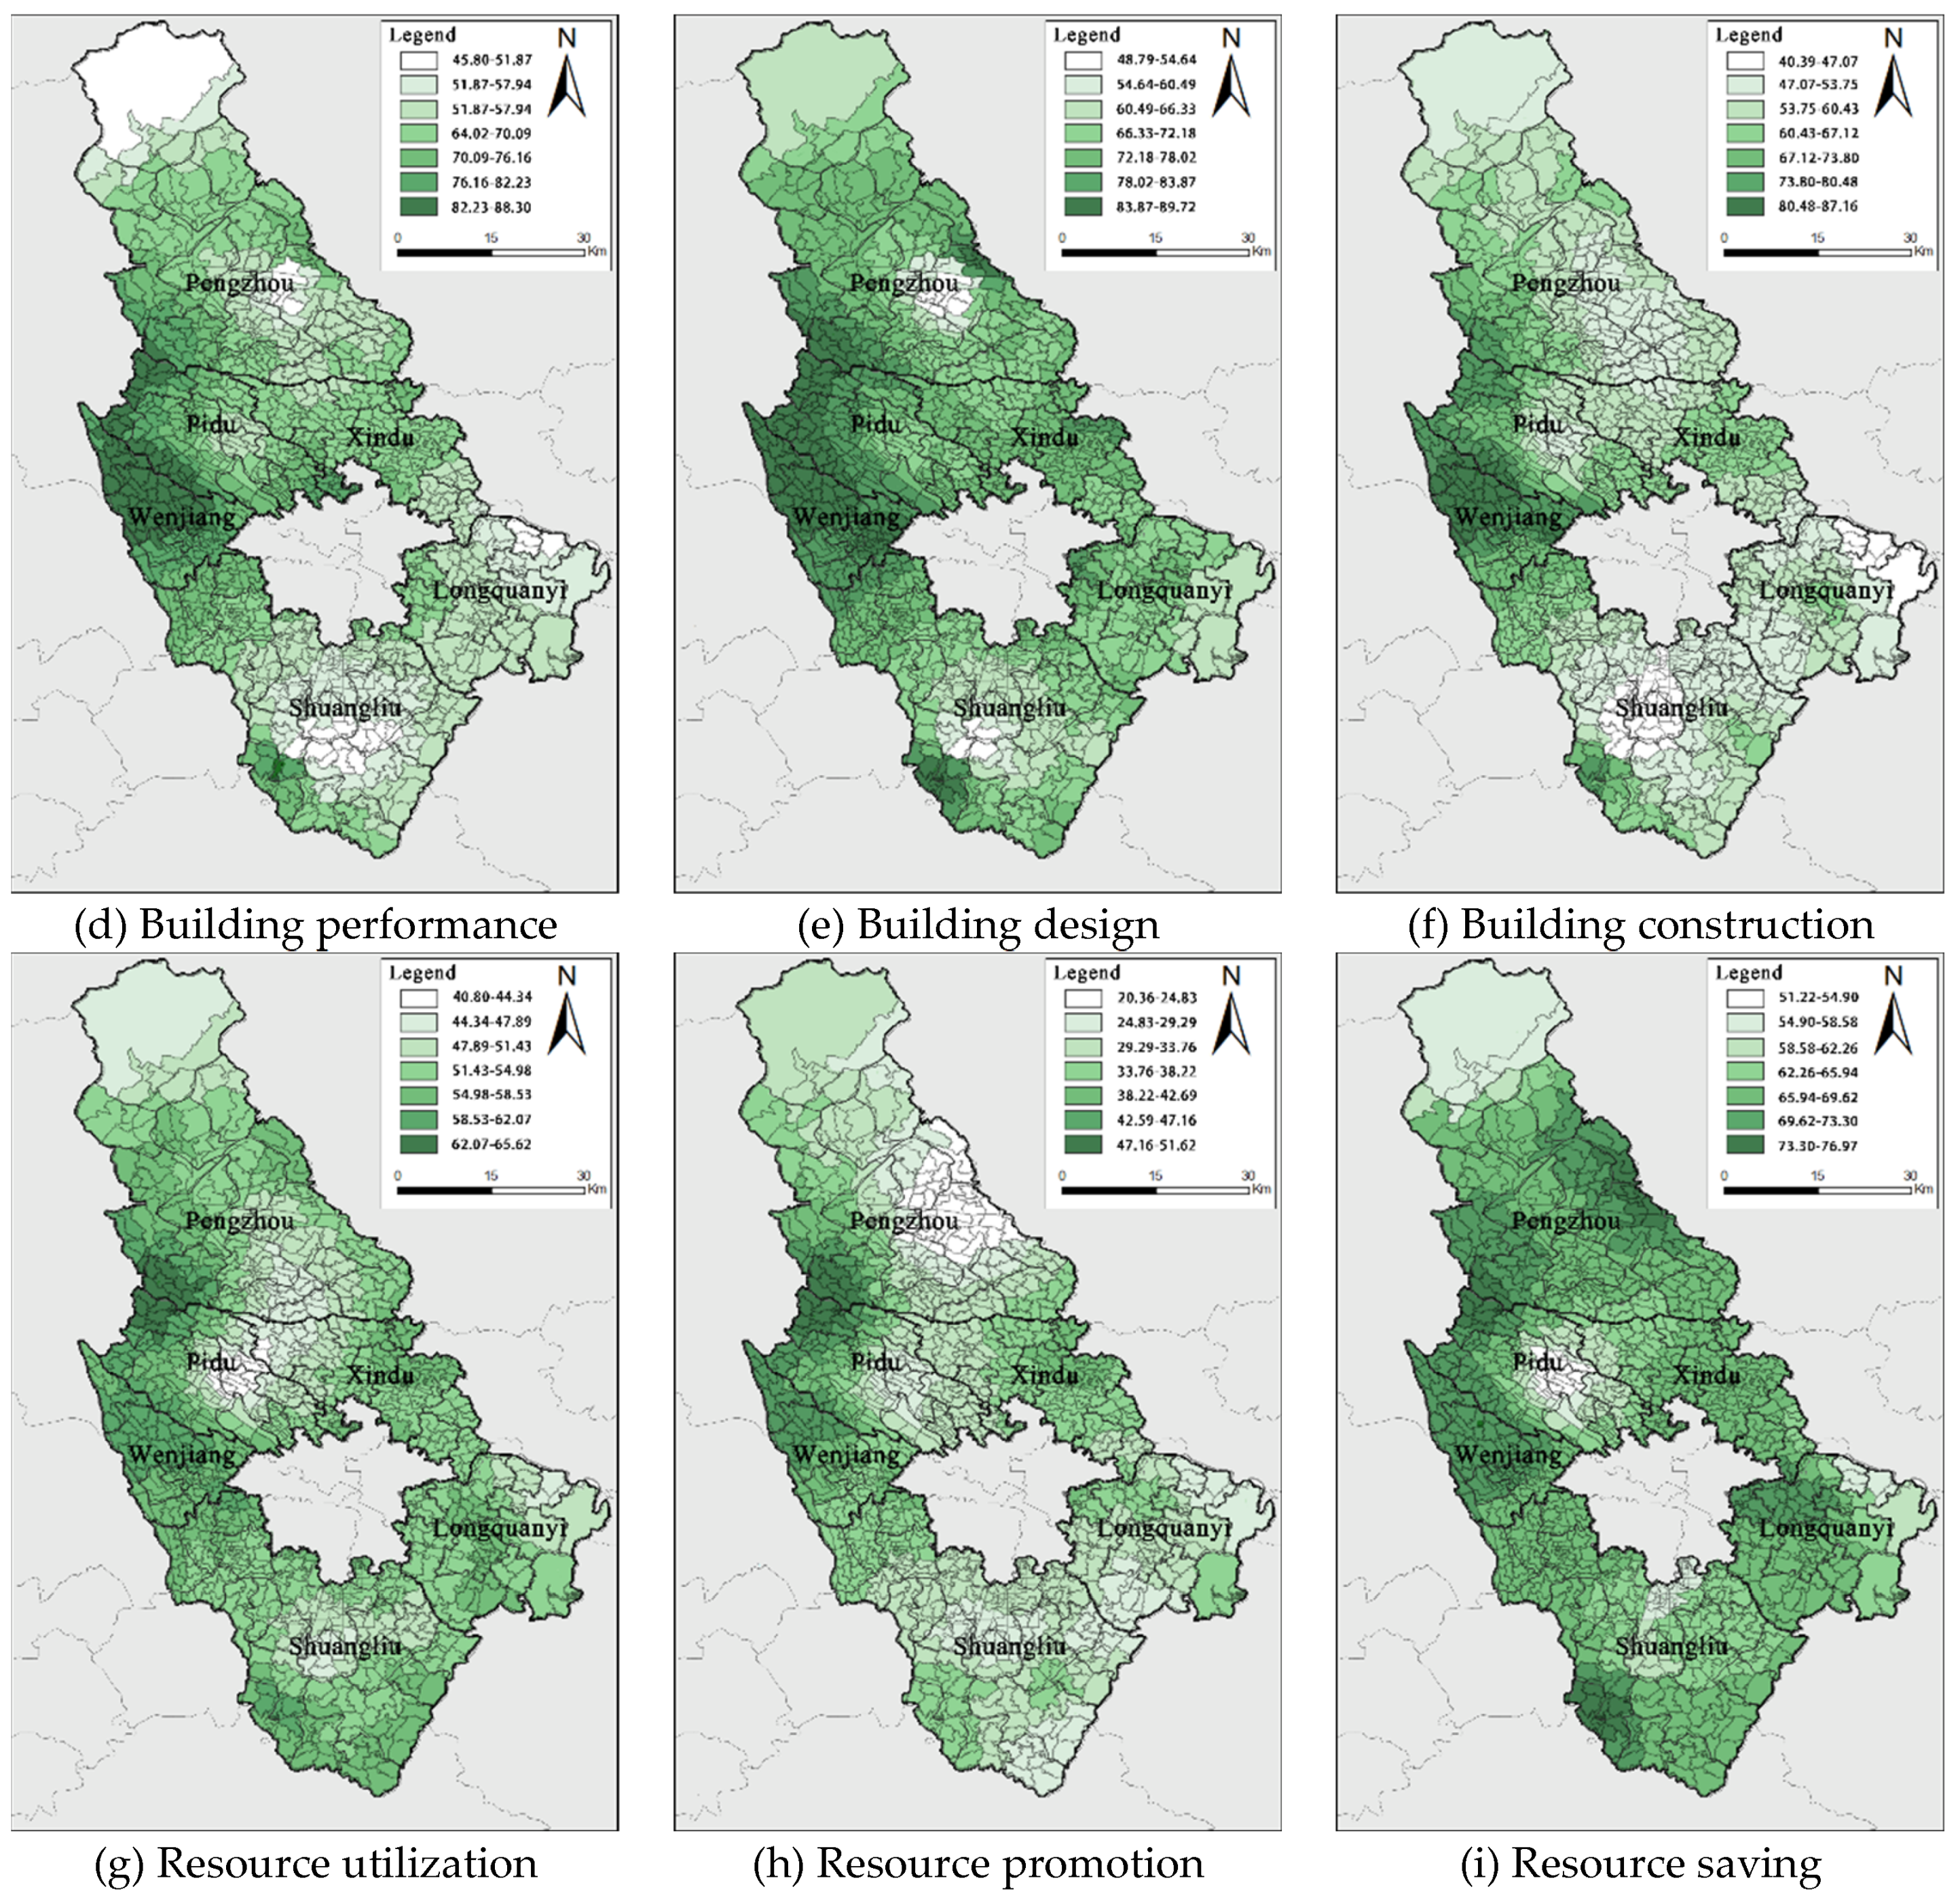
Figure 12.
The Elements of Linpan and the Path of Microclimate regulation.
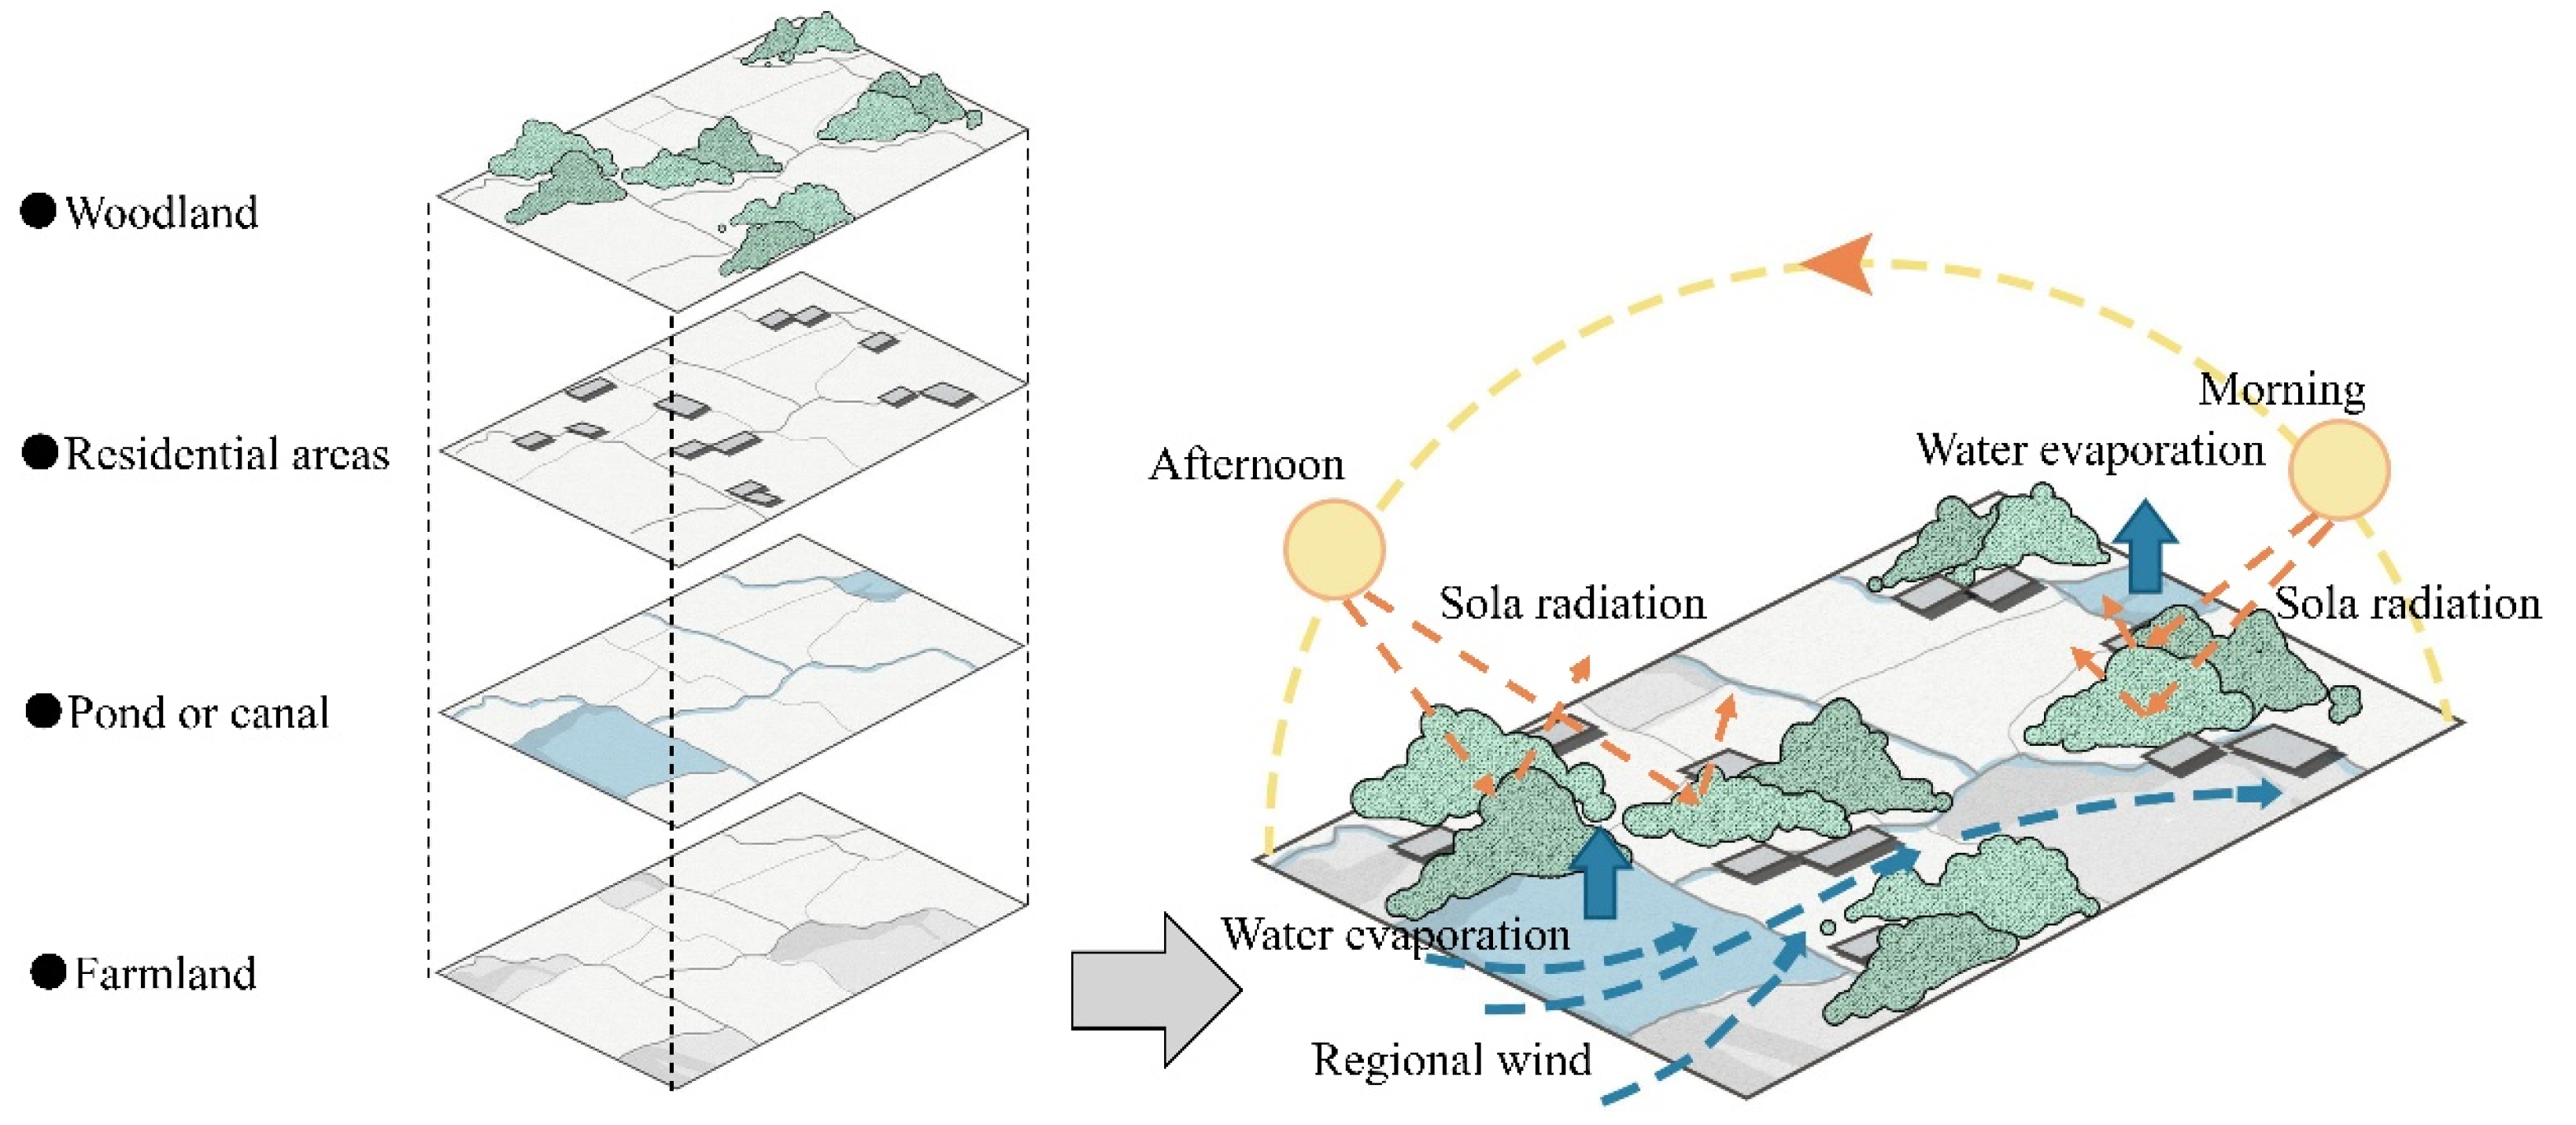
Figure 13.
Statistical situation of two types of villages.
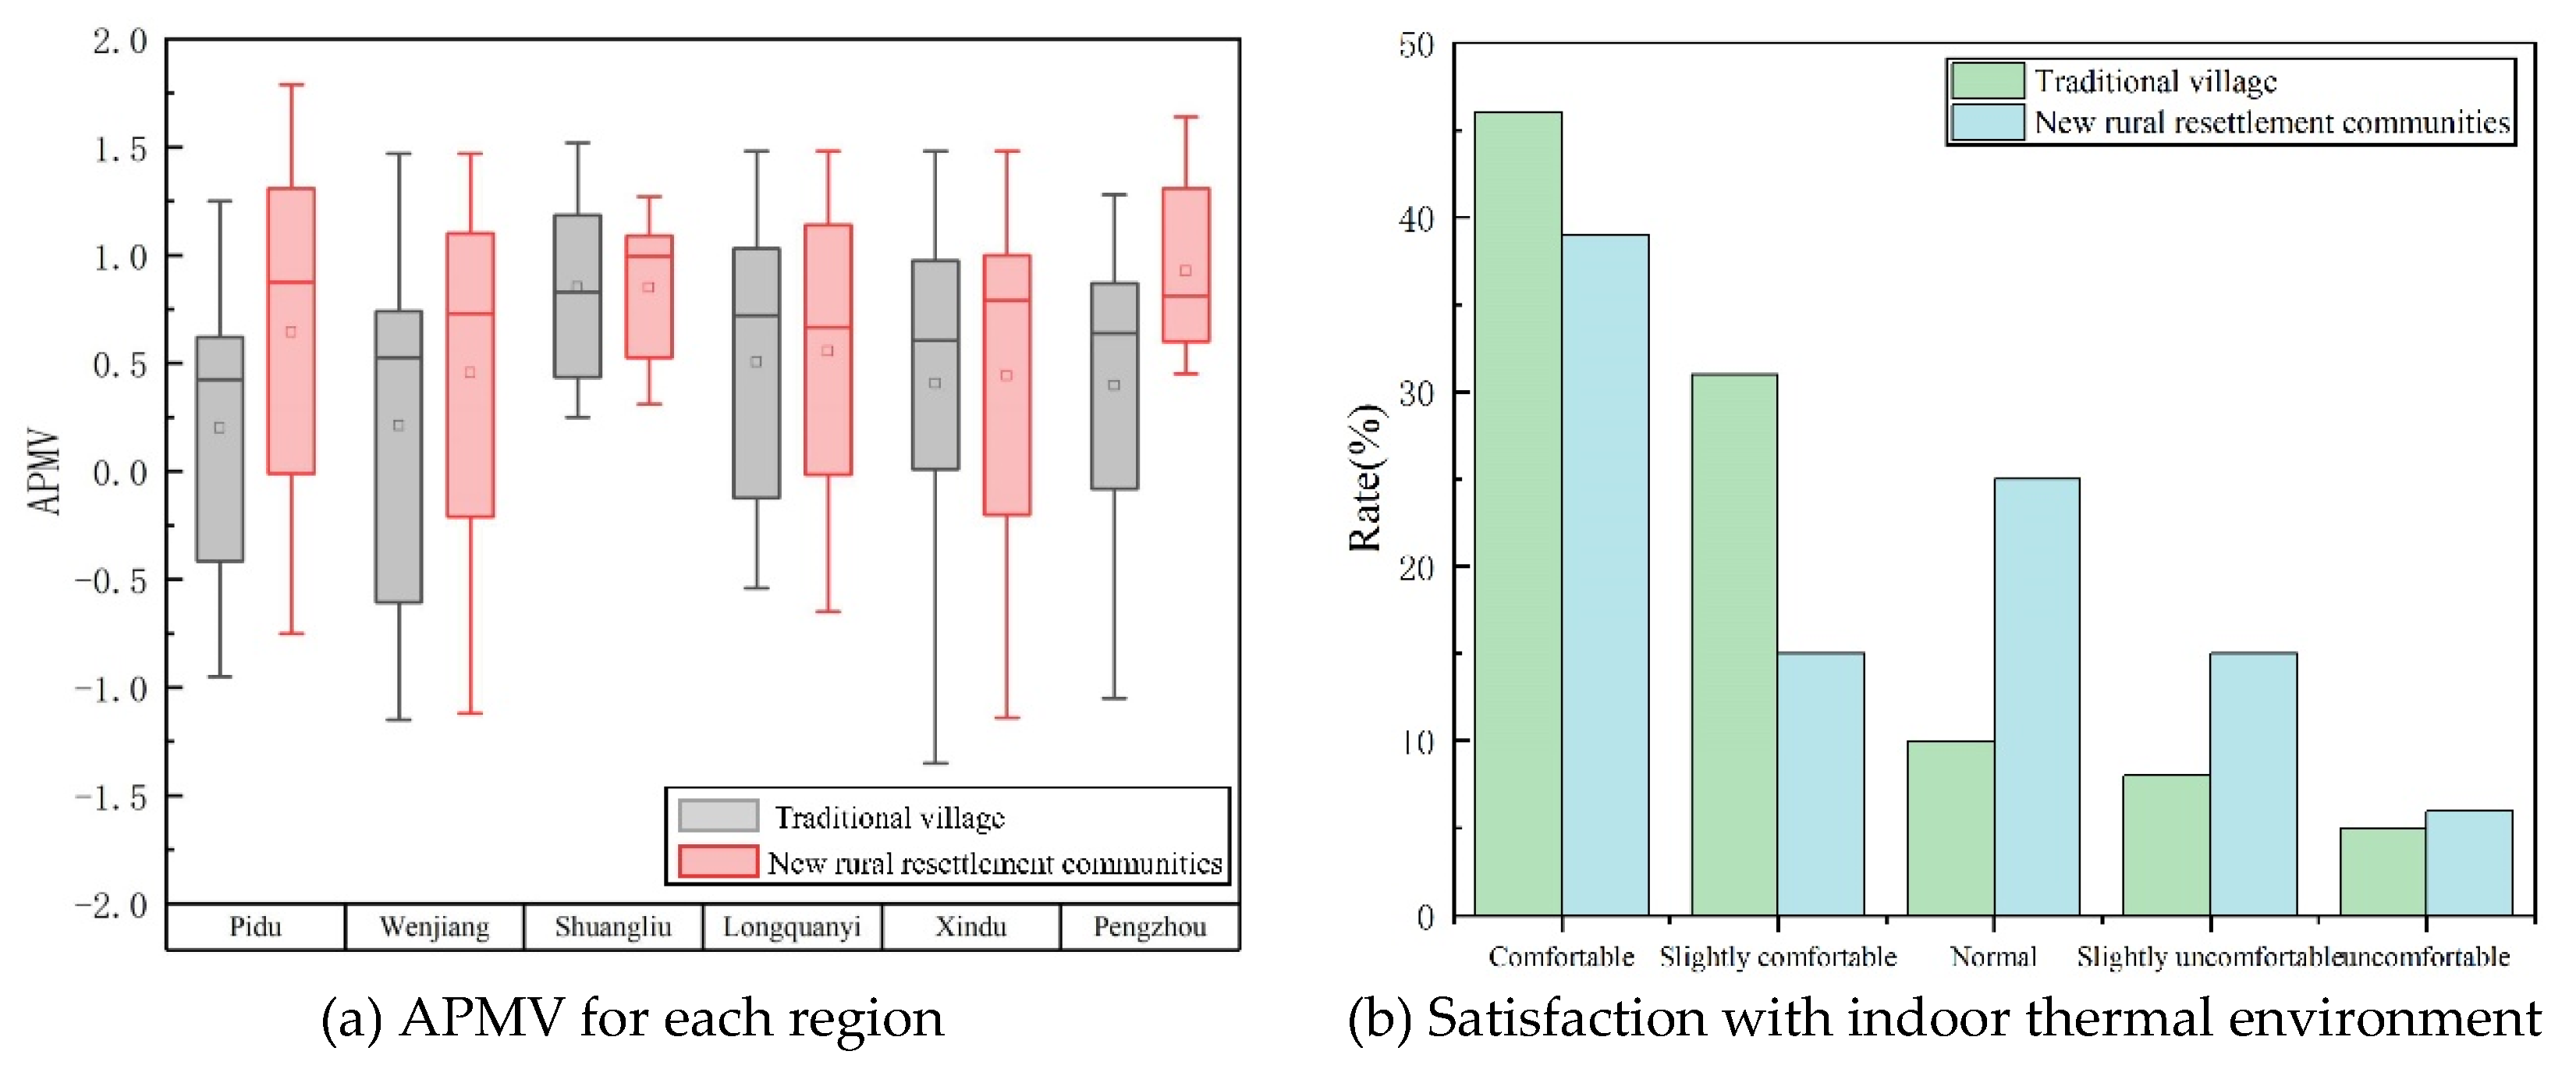
Figure 14.
Comparison of Building Performance Index Layer Scores.
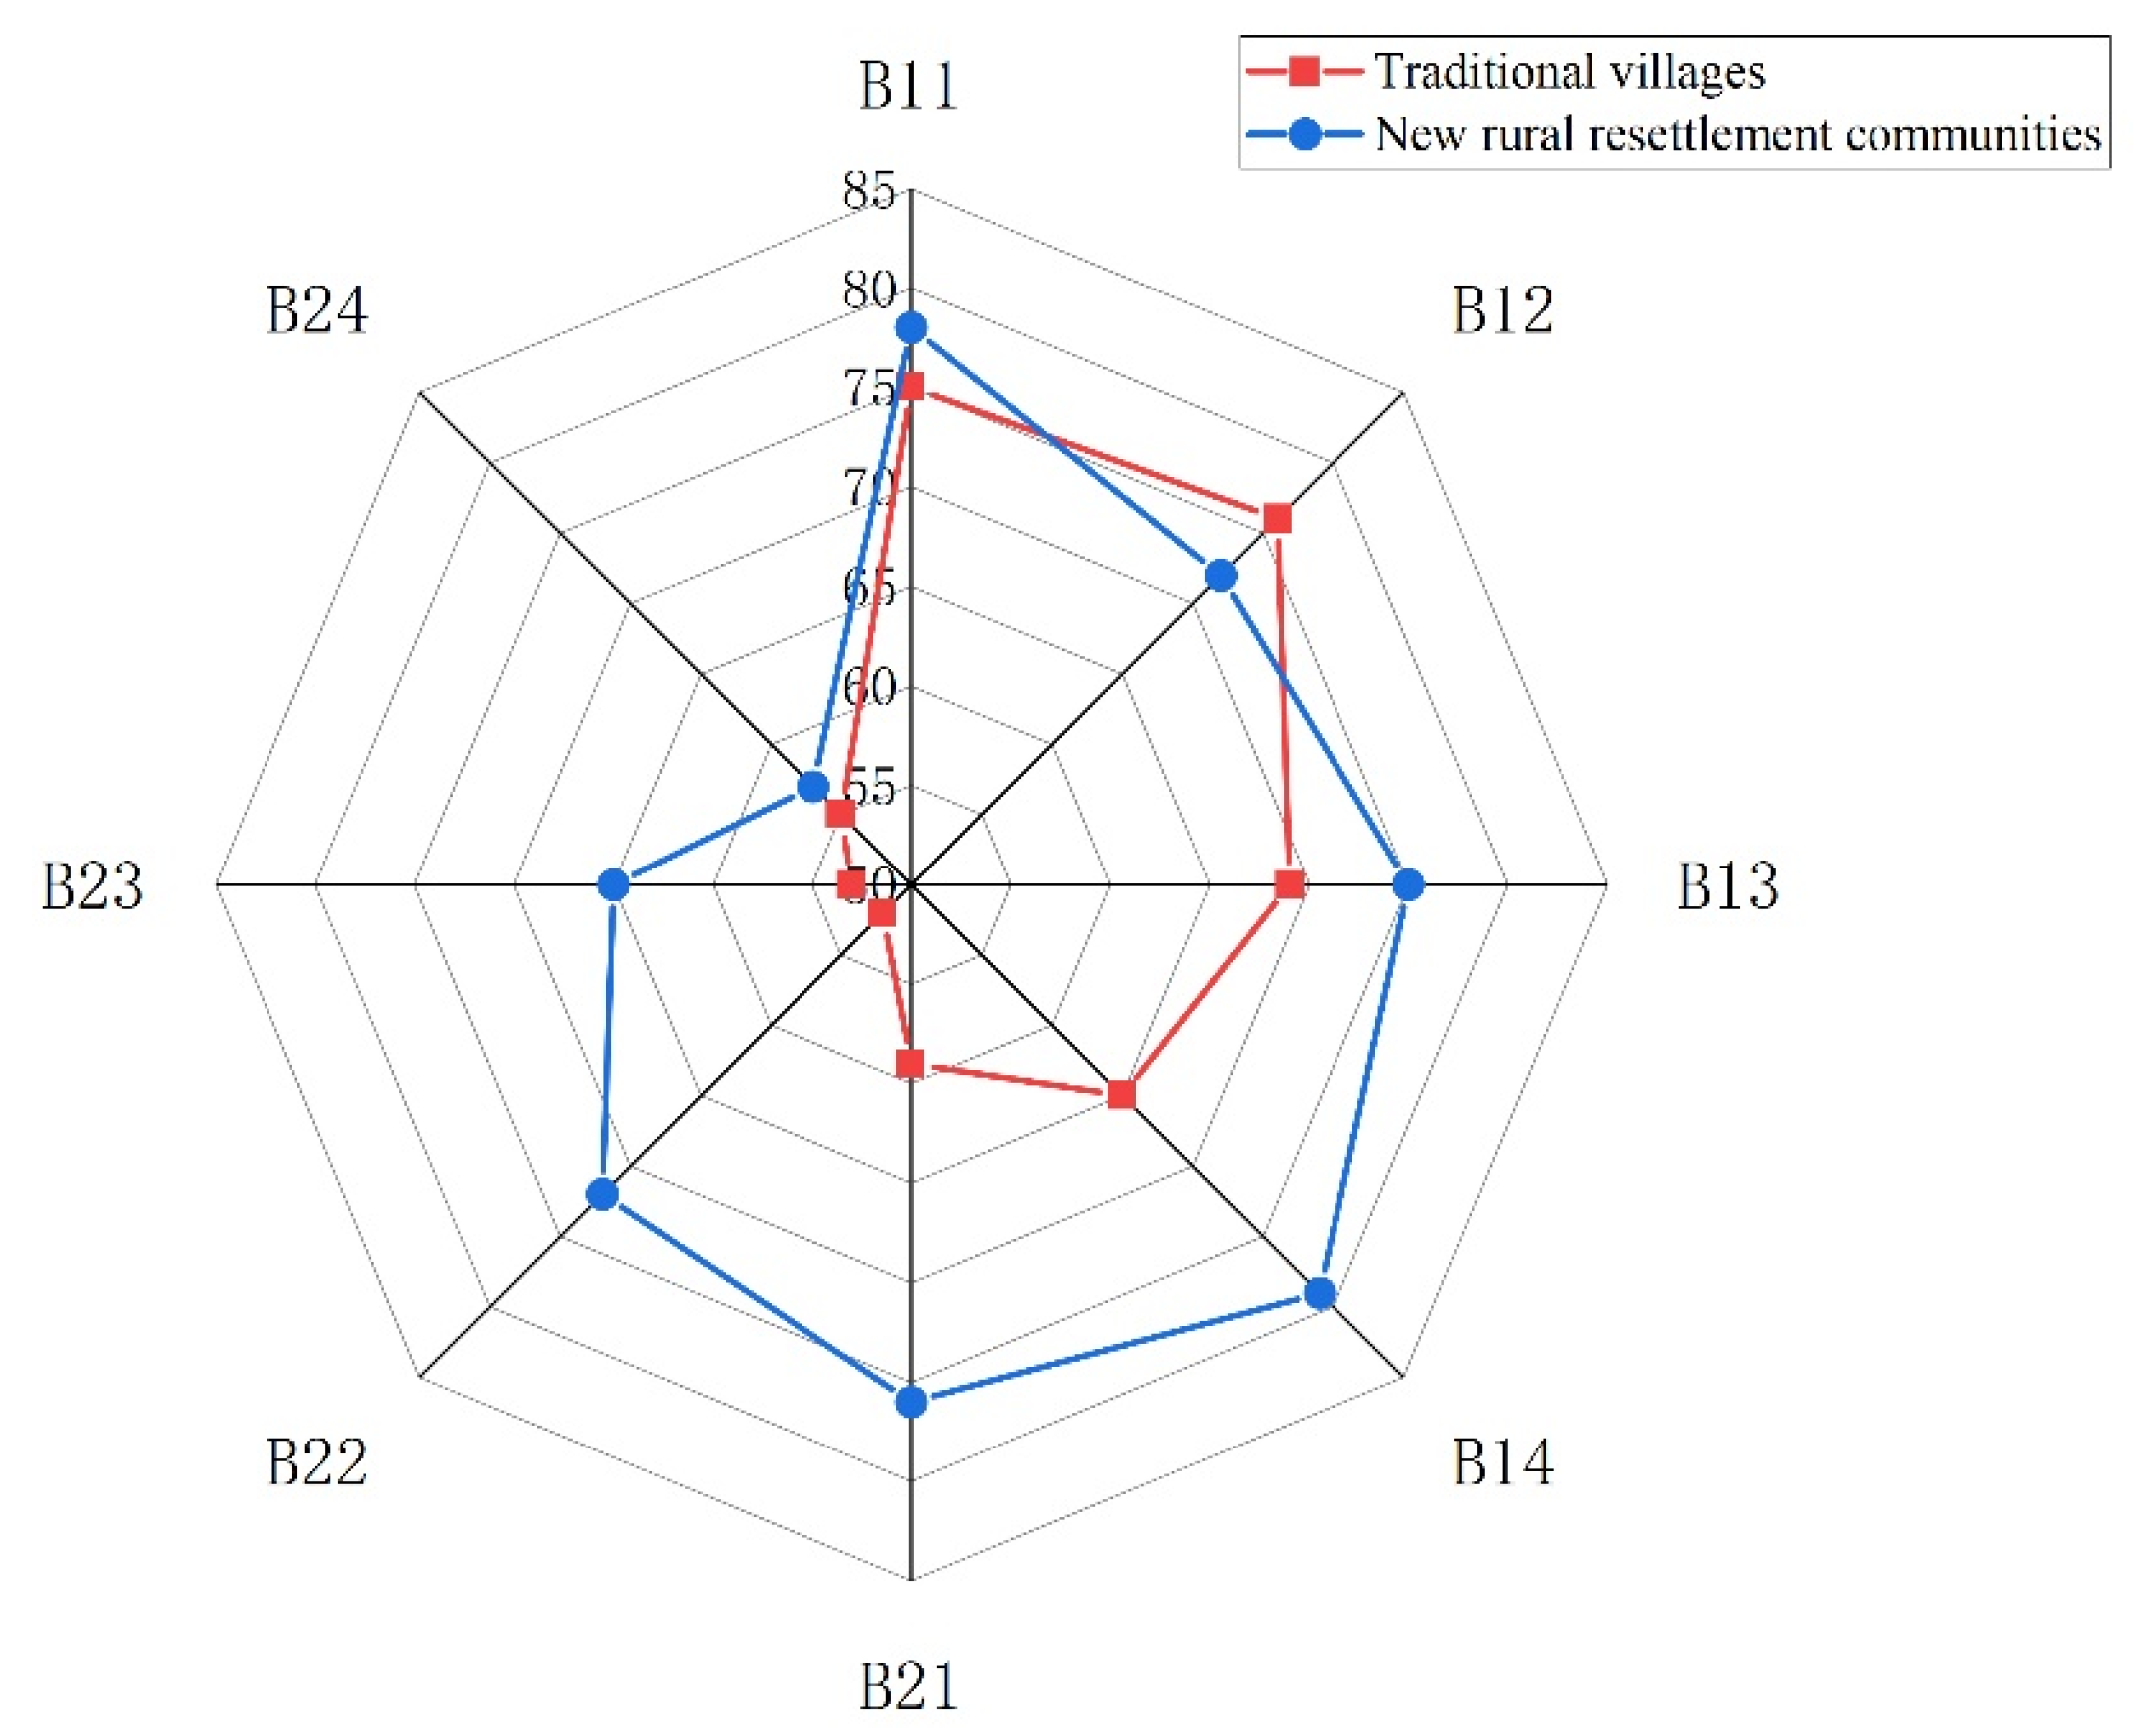
Figure 15.
Obstacle analysis.
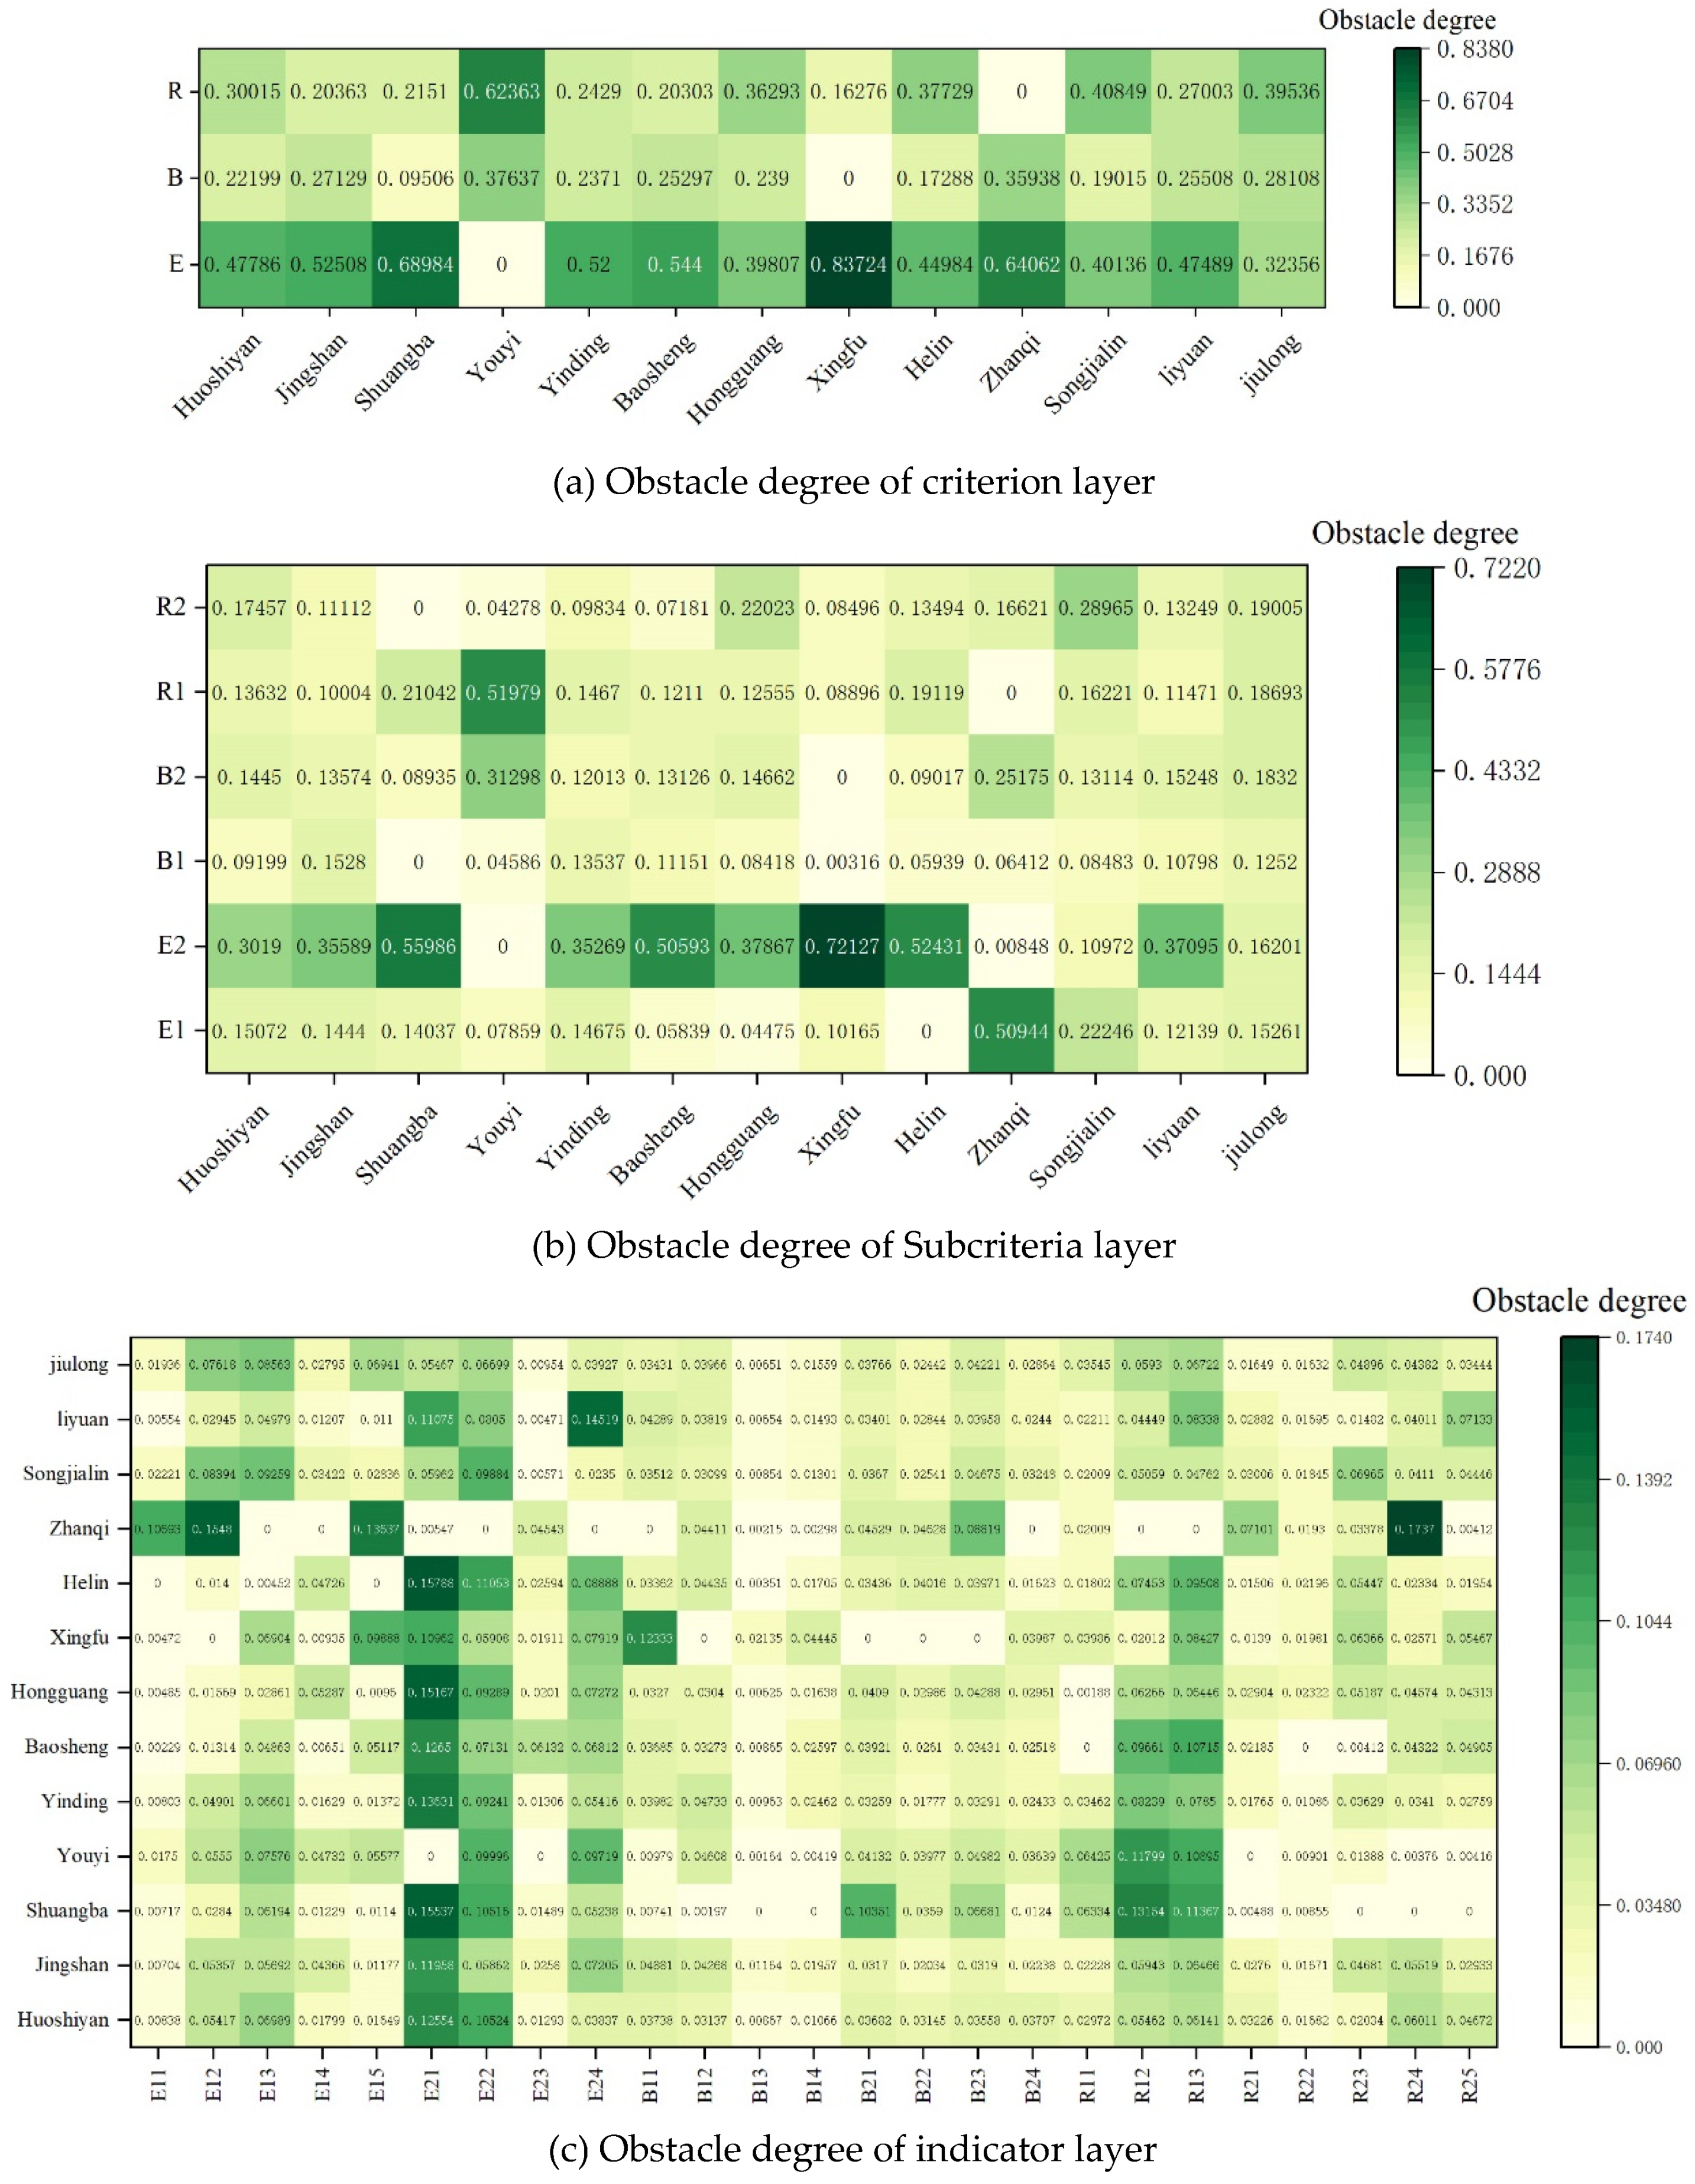
Figure 16.
Residential structural renovation plan.
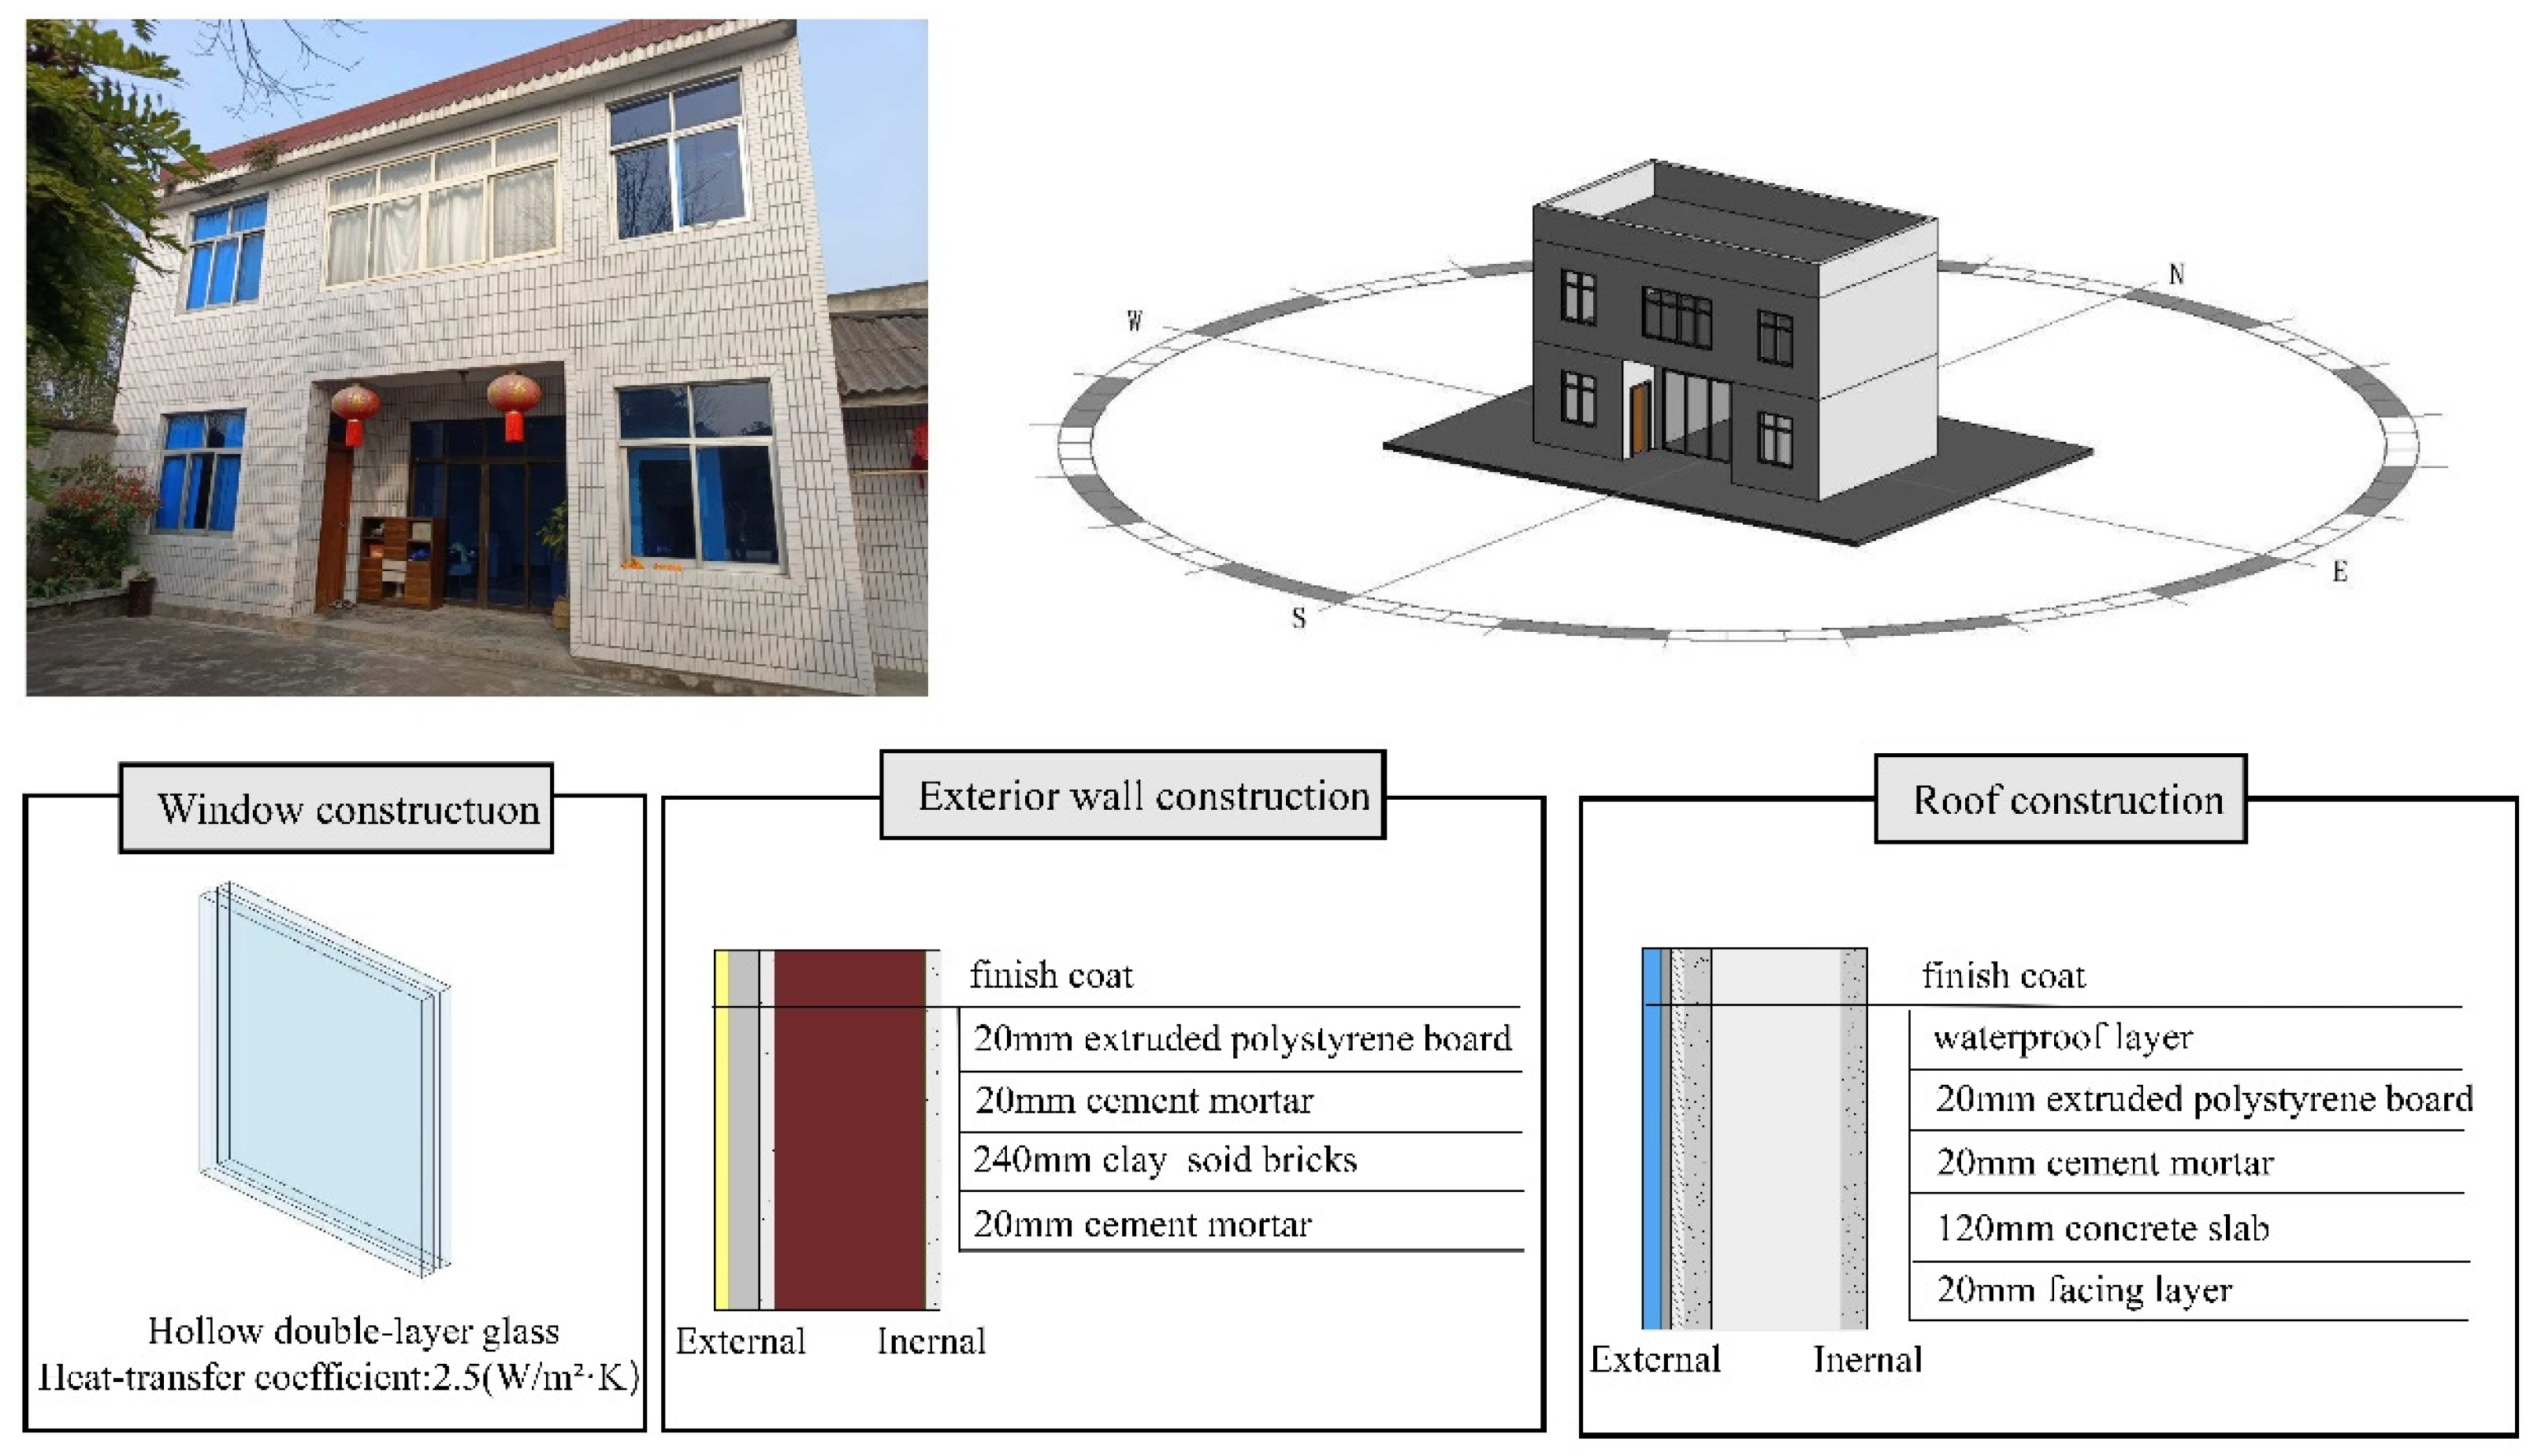
Figure 17.
The relationship between indoor lighting environment parameters and energy consumption.
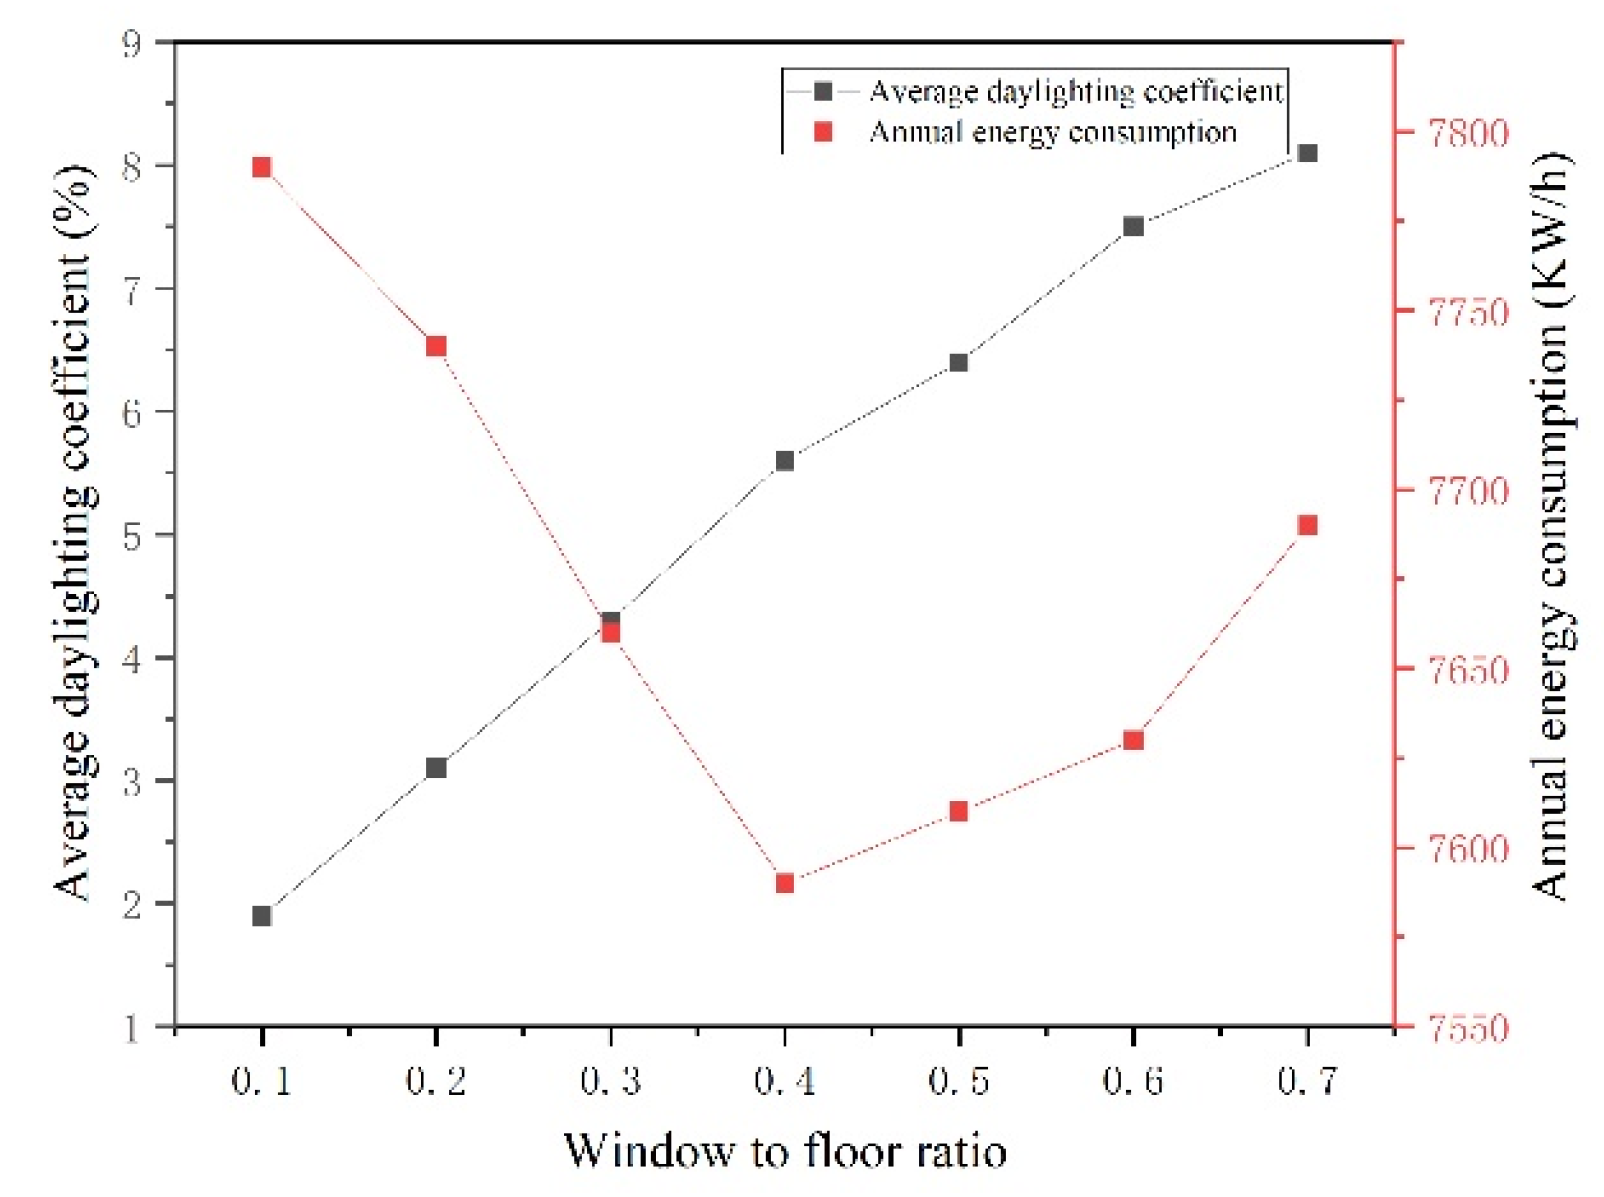

Table 1.
Comprehensive evaluation index system of rural green residential buildings.
| Criterion layer | Subcriteria layer | Indicator layer | Indicator Description | Weight |
| Environmental conditions (E) | Outdoor environmental (E1) | Village terrain (E11) | The terrain where the village is located is plain, hilly, or mountainous | 0.007 |
| Village water environment level(E12) | Water quality level of villages, ponds, rivers, and lakes | 0.039 | ||
| Village green coverage rate(E13) | Forest and grass coverage by the water, houses, roads, and villages | 0.042 | ||
| Degree of rural farmland construction(E14) | The degree of improvement in the construction of high standard farmland in villages | 0.015 | ||
| Convenience of village roads(E15) | Village road hardening rate, road density and flatness | 0.011 | ||
| Indoor environmental (E2) | indoor thermal environment (E21) | PMV (Predicted Mean Vote), APMV (adaptive predicted mean vote), and thermal comfort | 0.093 | |
| Indoor light environment (E22) | Daylighting coefficient and satisfaction with lighting environment | 0.063 | ||
| Indoor acoustic environment (E23) | Noise level and satisfaction with acoustic environment | 0.082 | ||
| Indoor air quality (E24) | Formaldehyde content and air quality satisfaction | 0.052 | ||
| Building performance (B) |
Building design (B1) | Building orientation (B11) | Influence of building orientation on indoor environment and building energy consumption | 0.052 |
| building shape coefficient (B12) | The influence of building shape coefficient on building energy consumption | 0.046 | ||
| Building Graphic Design (B13) | Rationality of room space layout and its impact on indoor environment and building energy consumption | 0.012 | ||
| Building Style Design (B14) | Satisfaction with the exterior and cultural heritage design of buildings | 0.024 | ||
| Building Construction (B2) |
Roof construction (B21) | Influence of roof material, thickness and color on indoor environment and building energy consumption | 0.039 | |
| Exterior wall construction (B22) | Influence of material, thickness and color of exterior wall on indoor environment and building energy consumption | 0.030 | ||
| Window construction (B23) | Influence of window frame material and window floor area ratio on indoor environment and building energy consumption | 0.040 | ||
| Affiliated parts (B24) | Mainly consider the impact of building shading on indoor environment and building energy consumption | 0.035 | ||
| Resource utilization (R) | Resource promotion (R1) | Solar energy utilization (R11) | The ownership and usage level of solar facilities (solar water heaters, photovoltaic panels, passive solar houses, etc.) | 0.033 |
| Popularity of biogas facilities (R12) | The construction and usage level of biogas facilities (traditional biogas digesters, modern biogas treatment facilities, etc.) | 0.060 | ||
| Green building material usage (R13) | Degree of use of green building materials in rural residential buildings | 0.060 | ||
| Resource saving (R2) | Land resource utilization (R21) | Per capita residential land level of rural households | 0.033 | |
| water resources utilization (R22) | Types of domestic water use and per capita water consumption level in rural households | 0.021 | ||
| Power consumption (R23) | Per capita living electricity consumption level of rural households in the hottest or coldest month | 0.075 | ||
| Gas electricity consumption (R24) | Per capita gas consumption level of rural households | 0.052 | ||
| Fuel wood usage frequency (R25) | The frequency of using firewood for cooking per household in rural households | 0.048 |
Table 2.
Scoring rules for subjective indicators.
| Indicator layer | Evaluation criteria and score allocation | ||||
| 100 | 80 | 60 | 40 | 20 | |
| Degree of rural farmland construction(E14) | Excellent | Good | Average | Poor | very poor |
| Convenience of village roads(E15) | Very convenient | Convenient | Average | Less convenient | Inconvenient |
| Building Graphic Design (B13) | Excellent | Good | Average | Poor | very poor |
| Building Style Design (B14) | Excellent | Good | Average | Poor | very poor |
| Solar energy utilization (R11) | Excellent | Good | Average | Poor | very poor |
| Popularity of biogas facilities (R12) | Excellent | Good | Average | Poor | very poor |
| Green building material usage (R13) | Excellent | Good | Average | Poor | very poor |
| Fuel wood usage frequency (R25) | Not using firewood | Low frequency of using firewood | The frequency of using firewood is average | Frequent use of firewood | The frequency of using firewood is very high |
Table 3.
Scoring rules for objective indicators.
| Indicator layer (D) | Evaluation criteria and score allocation | ||||
| 100 | 80 | 60 | 40 | 20 | |
| Village terrain (E11) | Plain/Basin | Small undulating mountains | hills | mountainous region | plateau |
| Village water Environment level(E12) | Class Ⅰ | Class Ⅱ | Class Ⅲ | Class Ⅳ | Class Ⅴ |
| Village green coverage rate(E13) | X13=285.71Rg-11.43 Rg is the green coverage rate | ||||
| Building orientation (B11) | [85 °, 115 °), [265 °, 285 °) | [55 °, 85 °), [115 °, 135 °), [165 °, 175 °), [245 °, 265 °), [285 °,295 °) | [135 °,165 °), [175 °,195 °), [225 °,245 °), [295 °,315 °), [355 °,25 °) | [25 °,65 °), [195 °,225 °), [315 °,325 °), [345 °,355 °) | [205 °,215 °), [325 °,345 °) |
| Building shape coefficient (B12) | X12=-63.4S+98.34 S is the building shape coefficient | ||||
| Roof construction (B21) | Resin tile | Color steel tile | Asbestos tile /Flat roof | Cement tile | Grey tile |
| Exterior wall construction (B22) | Sintered porous bricks | Adobe wall | Clay solid bricks and sintered porous bricks | Sintered shale brick | Clay solid bricks |
| Window construction (B23) | X23=400Ac/Ad-24 Ac/Ad is the window to ground ratio | ||||
| Affiliated parts (B24) | (1.5,2] | (1.2,1.5] | (0.9.1.2] | (0.6,0.9] | (0,0.6] |
| Land resource utilization (R21) | (20,30] | (30,50] | (50.70] | (70,90] | (90,∞] |
| water resources utilization (R22) | Monthly per capita water consumption L < 2t | Monthly per capita water consumption 2t ≤ L < 5t | Monthly per capita water consumption 5 t ≤ L < 10 t | Monthly per capita water consumption L ≥ 10t | Mainly using well water, or only using well water without tap water |
| Power consumption (R23) | Monthly per capita electricity consumption Q < 30KWh | Monthly per capita electricity consumption 30KWh ≤ Q < 55KWh | Monthly per capita electricity consumption 55 KWh ≤ Q < 75KWh | Monthly per capita electricity consumption 75KWh ≤ Q < 95KWh | Monthly per capita electricity consumption Q ≥ 95 KWh |
| Gas electricity consumption (R24) | Monthly per capita gas consumption N < 2Nm3 | Monthly per capita gas consumption 2 Nm3 ≤ N < 5.5Nm3 | Monthly per capita gas consumption 5.5 Nm3 ≤ N < 9Nm3 | Monthly per capita gas consumption 9 Nm3 ≤ N < 12.5Nm3 | Monthly per capita gas consumption N ≥ 12.5Nm3 |
Table 4.
Scoring rules for Composite indicators.
| Indicator layer (D) | Evaluation criteria and score allocation (Subjective/objective) | ||||
| 100 | 80 | 60 | 40 | 20 | |
| indoor thermal environment (E21) | Comfortable /|PMV|≤0.5, |APMV|≤0.5 | Slight comfortable /0.5<|PMV|≤1, 0.5<|APMV|≤1 | Normal /1<|PMV|≤1.5, 1<|APMV|≤1 | Slight uncomfortable / 0.5<|PMV|≤1, 0.5<|APMV|≤1 | Uncomfortable 0.5<|PMV|≤1, 0.5<|APMV|≤1 |
| Indoor light environment (E22) | Comfortable /C=6 | Slight comfortable /C=4.8 | Normal /C=3.6 | Slight uncomfortable /C=2.4 | Uncomfortable /C=1.2 |
| Indoor acoustic environment (E23) | Satisfied/ LAeq (0,40] | Slight satisfied /(40,45] | Normal /(45,55] | Slight unsatisfied /(55,70] | Unsatisfied /(70,∞] |
| Indoor air quality (E24) | Satisfied / Formaldehyde concentration (0,0.02] | Slight satisfied / Formaldehyde concentration (0.02,0.035] | Normal / Formaldehyde concentration (0.035,0.05] | Slight unsatisfied / Formaldehyde concentration (0.05,0.065] | Unsatisfied / Formaldehyde concentration (0.065,0.08] |
Disclaimer/Publisher’s Note: The statements, opinions and data contained in all publications are solely those of the individual author(s) and contributor(s) and not of MDPI and/or the editor(s). MDPI and/or the editor(s) disclaim responsibility for any injury to people or property resulting from any ideas, methods, instructions or products referred to in the content. |
© 2024 by the authors. Licensee MDPI, Basel, Switzerland. This article is an open access article distributed under the terms and conditions of the Creative Commons Attribution (CC BY) license (http://creativecommons.org/licenses/by/4.0/).
Copyright: This open access article is published under a Creative Commons CC BY 4.0 license, which permit the free download, distribution, and reuse, provided that the author and preprint are cited in any reuse.


