
Submitted:
29 May 2024
Posted:
29 May 2024
You are already at the latest version
Abstract
The performance of tax administrations (TAs) is usually described as their capacity to complete activities with the minimum of resources engaged. Accordingly, tax administration performance is a multifaceted phenomenon, and measuring and benchmarking its performance against other countries or regions remains a puzzle for researchers and practitioners. This paper introduces a new approach for measuring tax administration performance using the Composite I-Distance Indicator based on 11 individual performance measures from 35 European tax administrations over two consecutive years (2018-2019). The findings highlight Denmark and the Netherlands as exemplary models for tax administration, with “Revenue Collection” being identified as a crucial driver of excellence and “Operational Performance” (such as “e-filing” and “on-time filing”) forming critical aspects of TA efficiency. This approach can be valuable for policymakers, public administration analysts, and other stakeholders interested in assessing tax administration efficiency across countries or similar problem areas requiring integrated performance indicators.
Keywords:
tax administration
; performance measurement
; composite indicators
; Europe
1. Introduction
The performance of tax administrations (TAs) is usually described as their capacity to complete activities with the minimum of resources engaged (Savić et al. 2015). As inferred by OECD (2011), tax administration performance depends on its internal organizational structures, allocated budgeted funds to meet new or changed priorities, utilization of novel ICT initiatives to reduce costs, and the capacity of its staff.
Accordingly, tax administration performance is a multifaceted phenomenon, and measuring and benchmarking its performance against other countries or regions remains a puzzle for researchers and practitioners (Arltová and Kot 2023; Belmonte-Martin et al. 2021). Many attempts have been made to measure the performance of tax administrations (Cordero et al. 2021; Crandall 2010; Efecan Aktaş 2023; Nguyen et al. 2020). Moreover, in the last few decades, an enormous amount of research has been carried out to explain, examine, and measure the performance of Tas (Gerritsen 2023). However, scant attention has been paid to creating any comprehensive, multiple performance measures of tax administration that could be used to measure the relative performance of tax administrations between and among countries.
Previous attempts to measure the performance of tax administrations have been either idiosyncratic or overly biased in subjective judgments, making them highly judicious and speculative. We aim to fill the lacuna in the present body of knowledge by creating a comprehensive and unbiased score for tax administration performance. The framework we proposed is rooted in the concept algorithmic governance. Algorithmic governance allows for human-free decision-making, or in our case – human-free country rankings. Our approach is based on a neutral, data-driven aggregation of individual measures into a comprehensive performance index based on a Composite I-Distance Indicator (CIDI) methodology.
The specific goals of our study are to:
- Compare the performance of TAs across the dataset of selected European tax jurisdictions and isolate the one that can serve as a role model,
- Examine the most critical driver of tax administration and where the most energy, planning, and resources should be invested.
To our knowledge, a study of this kind has never been conducted. The same class of problem has already been approached in a recent survey by Milosavljević et al. (2023). However, rankings obtained from this study are based on the machine learning algorithm as described in Milosavljevic et al. (2021). It is noteworthy to mention that the CIDI methodology has been vastly used in recent studies related to the efficiency of public administration (Maricic et al. 2019; Milosavljević et al. 2019). However, it has never been applied to the analysis of tax administration performance.
Our paper contributes to the extant body of knowledge in several ways. First, we isolated ‘the polar star’, a tax administration that can serve as a benchmark in further studies on the efficiency, effectiveness or other way performance of tax administrations, a goal that has been highly valued by policymakers and scholars (Vazquez-Caro and Bird 2011). Our results show that the role model tax administration is Denmark (with SKAT as the central tax authority of Denmark). The ‘first runner-up’ in our analysis was the tax administration of the Netherlands. The results are the same for both observed years. Accordingly, the main contribution of our study is data-driven neutral ranking. Second, we show that Value Revenue Collected is the most important group of performance drivers for efficient tax administration.
Additionally, the results show that over the two observed years, e-taxation has become more important. In contrast, human resources have become a less important determinant of the overall performance of tax administrations. Third, this study provides a novel approach to measuring the performance of tax administrations and accordingly allows for ex-post analyses of public policies related to taxation.
The remainder of this paper is organized as follows. The next section presents a brief literature review of the tax administration. Section 3 explains the methodology of this study, outlining the analytical framework and the data sources. Section 4 shows the study results based on the CIDI methodology. Section 5 contextualizes the study findings, elaborating on key findings, contributions, and implications. Section 6 is reserved for the concluding remarks – originality, limitations, and further recommendations.
2. Literature Review
In this section, we first provide the literature review on the concept and importance of tax administration performance. Afterwards, we provide the explanation of the background concept for the analytical framework – algorithmic governance.
2.1. Tax Administration Performance
Taxation plays a pivotal role in economic development (Chairassamee et al. 2023). For a few decades, tax reforms in many countries have been focused primarily on changing the tax rates, developing new forms of taxation, or specifying the economic efficiency of the tax system (Klun 2004). Such approaches have been advocated to create stability in revenue generation (Cabra-Acela 2022; Gnangnon 2022), decrease potential tax gaps (Durán-Cabré et al. 2019), and increase or optimize total public revenues (Gross and Klein 2022). This paper postulates that the efficiency of taxation can be achieved with improvements in the efficiency of tax administration rather than increasing tax rates, introducing new taxes, elucidating the effects of taxation, or improving tax compliance. Simply put, this paper posits that there is a trade-off between the improvements in tax administration performance on one side and the introduction of new taxes on the other.
Efficient tax administration is crucial for economic growth and development as it ensures that taxes are collected effectively, funds are appropriately allocated, and public services are adequately provided (Evans 2001). Even when the tax rates are high and tax perception leans towards viewing taxation as a burden, efficient tax administrations can lead towards the optimal collection of public funds (Mohammed and Tangl 2023). Accordingly, efficient tax administrations may play a pivotal role for general economic and societal purposes.
The definition of efficient tax administration is still vague, and no unanimous and standardized definition of such efficiency exists. Efficiency in tax administration can be understood as the ability to collect taxes effectively, allocate funds efficiently, and provide public services adequately. This critical role of tax administration in economic and societal development has prompted the focus on measuring and improving its efficiency. However, a universally accepted definition of efficiency in tax administration is yet to be established.
Despite the lack of a standardized definition, the significance of efficient tax administration cannot be overstated. Studies have highlighted its role in stabilizing revenue generation, minimizing tax gaps, and optimizing public revenues. Traditionally, tax reforms have often centered on altering tax rates, introducing new tax types, or evaluating the economic efficiency of the tax system. These approaches, while important, may not fully address the potential for enhancing taxation efficiency through improvements in tax administration performance (Taufik 2018).
In the European context, there has been a vivid debate on which tax administration has been the best-performing one. Factors such as the use of technology, organizational capacity, administrative efficiency, and the ability to reduce tax evasion have been identified as key drivers for the performance of European tax administrations (Okunogbe and Santoro 2021). Some countries have been marked as highly efficient in tax administration, such as Estonia, which has a fully digitalized tax system and efficient online services for taxpayers. Also, Nordic countries were categorized as efficient due to their effective use of technology, high administrative capacity levels, and low tax evasion rates (Basri et al. 2019). Conversely, some European countries, particularly new EU member states, have been criticized for their inefficient tax administration, characterized by bureaucratic processes, limited use of technology, and high levels of tax evasion. This is mainly attributed to the lack of political will, inadequate resources, perceived corruption, and ineffective governance structures (Ponomariov, Balabushko and Kisunko 2017).
2.2. The Background Concept of Algorithmic Governance
The idea and the concept of algorithmic governance are only a decade old, although the roots and the idea have been present for much longer (D’Agostino and Durante 2018). The concept refers to the use of algorithms, computational models, and automated decision-making processes in the management and regulation of various aspects of society. At this point, it should be noted that we do not advise absolute automation in decision-making processes, as they can lead to a number of pitfalls (Sanchez-Graells 2024).
This concept is particularly relevant in the context of modern digital technologies and the increasing reliance on algorithms to inform or automate decision-making in areas such as government, business, and social institutions. Algorithmic governance involves the use of algorithms to make decisions that were traditionally made by humans. These decisions can range from simple tasks, such as sorting and filtering data, to more complex decisions like resource allocation, policy enforcement, and risk assessment (Janssen and Kuk 2016). The system critically depends on data analysis to drive decision-making. Extensive datasets are systematically analyzed to identify underlying patterns, trends, and correlations, which can subsequently inform predictive modeling or process optimization.
For the purpose of our study, value-neutral weighting of policy choices is a particularly relevant feature of algorithmic governance. From a philosophical point of view, value-neutral strategy is restricted to data and decision outcomes, thereby omitting internal value-laden design choice points (Katzenbach and Ulbricht 2019). Traditional systems (such as the World Bank Ease of Doing Index, for instance) rely heavily on the subjective weighting of idiosyncratic performance measures. The algorithmic approach, however, allows for very efficient and expert-free, neutral decision-making.
When such a concept is applied to tax administration performance measurement, it allows for the expert-neutral ranking of countries in terms of the efficiency of their tax administrations. The use of algorithms in governance has several potential benefits, including increased efficiency, objectivity, and consistency in decision-making processes (Gritsenko and Wood 2020).
3. Materials and Methods
This section explains the data sources used for the analysis, the analytical framework based on the CIDI methodology, and data preparation, emphasizing normalization.
3.1. Data Sources
The main source of data comes from the OECD “The International Survey on Revenue Administration” (ISORA) database (OECD 2019) - a specialized database that covers many indicators related to tax administration outcomes. Crandell et al. (2021) infer that this database’s main purpose is to provide reliable and comparable indicators for tax administration efficiency. The OECD’s statistical products, in general, are thought to be of excellent quality and reliability, and the ISORA data is no different. The survey uses defined procedures and stringent quality controls to ensure accuracy and consistency. One of the strengths of the ISORA is its comprehensive coverage of tax administration practices across tax jurisdictions, including both OECD member countries and non-member countries. This allows for comparisons and benchmarking of tax administration performance across various jurisdictions.
We retrieved the data from the ISORA database and filtered for the missing values. Accordingly, we used only data for two consecutive years (2018–2019) since most of the tax administrations had complete data included for these two years. Following the recommendations given in Milosavljević et al. (2023), some data were retrieved as original (when the indicators were presented as relative measures), while some were transformed into ratios to provide a sound basis for cross-tax-administration comparison. A detailed explanation for the retrieved and computed (calculated) indicators is given in Table 1.
3.2. Analytical Framework for the Composite I-Distance Indicator (CIDI)
To create a single indicator adequate to rank the economies for which we measure the tax administration performance, we propose the Composite I-Distance Indicator (CIDI) methodology. The CIDI approach is a methodology that creates a synthesized indicator from a list of separate indicators (given in Table 1).
The specific feature of the CIDI is its independence from any expert opinions and viewpoints. It rather relies on the given data itself. Many global composite indicators are criticized, particularly for using the sub-indicator weights created by experts in the field. Those weights may suffer from shortcomings such as bias or prejudice of the artists behind the methodologies. Moreover, indicators are often not even examined by experts but instead simply given equal weights.
The CIDI creates an aggregated index using weights that are data-driven rather than expert-driven (Dobrota et al. 2016). It extracts the weights from the derived data (Dobrota et al. 2015). The CIDI is accordingly widely applicable to any ranking methodology where one wants to overpower the impact of bias.
The CIDI weights are obtained using the I-distance methodology (Ivanovic 1973; Ivanovic 1977), presented with the following formula (Ivanovic and Fanchette 1973):
I-distance methodology calculates the distances between the observed entities in research concerning the single one chosen as the reference entity (Išljamović et al. 2015; Jeremic et al. 2011). Here, represents the distance between the values of the individual indicator Xi, one of the k indicators, i = 1…k, for entities and ; is the variance of individual indicator Xi; rji.12…j-1 is a partial correlation coefficient between the individual indicators Xi and Xj, where j < i (Dobrota et al. 2012; Jeremić et al. 2013).
When the I-distance is calculated, we can calculate correlation coefficients between the I-distance values and each individual indicator in the methodology (Milosavljević et al. 2019). These correlation coefficients are mainly positive analogously to the I-distance methodology. If, in rare cases, the correlation coefficient fabricates as negative, they are then scaled from 0 to their maximum value.
CIDI weights of any given composite indicator are constructed by weighing the above empirical correlations. Specifically, the values of correlations are divided by the sum of correlations, thus creating a CIDI weighting system. The idea behind the principle comes from the particular feature of the I-distance method, which is that it can determine the relevance of individual indicators (Jeremic and Jovanovic-Milenkovic 2014). As a result, CIDI weights are obtained as follows:
Here, ri, i = 1…k, represents a Pearson correlation between the individual indicator Xi and the I-distance value. In the described methodology, instead of predefining the values of weights in a biased manner, CIDI is based on a methodological and statistical concept defined by the I-distance method (Milosavljević et al. 2019).
3.3. Data Preparation
To calculate the total score of the observed economies for which we measure the tax administration performance, we needed to prepare the data in terms of normalization. To do so, we have used the min-max normalization, where we rescaled the range of all individual indicators, given in Table 1, to scale the range in [0, 100]. In addition, the CIDI methodology proposes the additive data aggregation model, which was applied to normalized individual indicators.
4. Results
This section explains pre-analysis – how we obtained weights for individual performance measures using the CIDI methodology and the main analysis – the ranking of the tax jurisdictions.
4.1. Pre-Analysis
We first created a set of weights for the distinctive set of measures based on the CIDI methodology. The novel weighting scheme, calculated according to formula 2 (Section 3.2), is given in Table 2. Since the method is cross-sectional, the weights were obtained for two consecutive years. The largest weight for FY2018 is given to the three indicators related to the Value of Revenue Collected (REV1 = 11.5%, REV2 = 14.1%, and REV3 = 14.7) and to one indicator from the group of Resources and Staff Indicators (RES1 = 13.8%). They maintained the same level of relevance in 2019, but their importance shrunk over the observed period. When we observe the change, the results show that Operational Efficiency (particularly OE2 with a positive change of 70.97%) has risen in importance.
4.2. Main Analysis
After defining the weights for two consecutive years, we analyzed the performance of 35 tax administrations for two consecutive years. The results are given in Table 3. The results in the table display the obtained value for each tax administration, the rank for a specific year, and the relative change in the difference of ranks.
Table 3 shows that the Danish tax authority held the first place in both observations. The Netherlands held second place. The difference to the second place is relatively high (Relative Efficiency Score calculated as a relation between the first and the second place was 1.254 and 1.169, respectively). This finding implies that Denmark’s tax authority was 25.4 and 16.9% more efficient than its counterpart, holding the second position. The ‘second runner-up’ was changed – Norway replaced Slovenia in this position. The most significant decline in rank was attributed to Russia (from 10th to 22nd position), whilst the tax administration of Greece made the largest incline on the scale (from 20th to 11th position). The last place was reserved for Switzerland in both years.
When grouped into the quantiles (groups of five), we see that the ‘Old Continent’ was divided into the efficient North and the inefficient South (see Figure 1). As for Tier 1, six tax jurisdictions remained in this stratum in both years: Denmark, the Netherlands, Slovenia, Finland, Norway, and the United Kingdom, whereas Latvia was replaced by Portugal in 2019.
5. Discussion
This section contextualizes our findings by explaining the key findings, delineating the main contributions, and providing implications for scholars and practitioners.
5.1. Key Findings
This study offers a fresh approach to the objective ranking of the effectiveness of selected European tax administrations. This study assesses the overall performance of tax administrations over two years, 2018 and 2019. In both years, Denmark served as a “role model” for the tax administrations. Several explanations can be found for this finding. First, The Danish tax authority (SKAT) has invested significantly in cutting-edge technologies, such as data analytics, to enable effective and efficient tax collection and compliance procedures. The digitalization process is ongoing, with some aspects (i.e., the legality and transparency) still being questioned (Fjord and Schmidt 2023). Considering the total tax burden of the Danish taxpayers, we were surprised by this finding. Other studies indicate that ‘Danish taxpayers generally appear to be content with the situation’, particularly when knowing that these funds are used to finance the Danish welfare system.
The ‘first runner-up’ in our analysis is the Dutch tax administration. Contrary to the central system in Denmark, the Dutch tax administration (Belastingdienst) is decentralized and complex. The system is highly digitalized, with even some reports on mismanaging algorithms for fraud detection in processing and storing personal information in a “blacklist” used to detect fraud (EDPB 2022).
The first tier is reserved for North and West European countries. Surprisingly, one tax jurisdiction from the ‘New EU’, Slovenia, has been ranked first-tier. Although some studies point out that Slovenian tax administration requires a myriad of IT and procedurally related measures for further improvements (Ravšelj et al. 2019), the tax administration of Slovenia can be a ‘small role model’ for the countries that are behind the ‘iron curtain’.
In both observed years, Switzerland served as the worst-ranked tax jurisdiction. The explanation for this phenomenon is that the Swiss tax system is highly complex, with 26 cantons having their own tax laws. Swiss fiscality offers profound diversity but comes with a price of complexity (Soguel 2019). It should be noted, however, that some tax jurisdictions were out of the scope of our analysis. Some studies find that the Swiss tax compliance burden (at least for the business) is far lower than those of Germany or the USA (Braunerhjelm et al. 2021).
5.2. Contributions
This study adds to the developing body of knowledge on tax administration performance measurement in several ways.
First, different European tax jurisdictions have been pointed out as ‘good examples’ of tax administration performance. Our study finds that Denmark can be viewed as a role model for policymakers and researchers interested in tax administration performance analyses. Denmark was even anecdotally known for having a highly efficient tax administration prioritizing taxpayer service and compliance. This finding is aligned with the findings of Milosavljević et al. (2023), who found that the Nordic countries generally outperform other European regions regarding tax authority efficiency. Contrary to this, some analyses, such as the one conducted by Athanasios et al. (2022), find that ‘tax administrations of Germany, Ireland, the Netherlands, Spain and the United Kingdom are the most decisive efficient units, forming the efficiency frontier’. In our analysis, Spain can serve as a ‘bad example’ rather than an efficient frontier. An explanation for the difference in results is the weight given to the indicators reflecting the efficiency of human resources in tax administration. By comparing Denmark to Spain, we can see that the SKAT (Danish tax authority) has a smaller workforce than the AEAT (Agencia Tributaria – Spanish tax authority) but has a decentralized organizational structure. However, this explanation is only judicious speculation requiring further in-depth examination.
Second, our findings prioritize Value Revenue Collected as the main group of drivers for the overall performance of TAs. Usual ‘suspects’ investigated in other studies are digitalization and the use of novel technologies (Faúndez-Ugalde et al. 2020; Martínez et al. 2022) and human resources and culture of taxation (Chuenjit 2014; Radonić and Milosavljević 2019). Contrary to the findings of previous studies, we identified the variables in the operational excellence group (on-time filling and e-filling) as indicators that will drive excellence in the years to come. Consequently, investments in a modern and reliable IT infrastructure will be crucial for efficient tax administration. Simply put, automated systems will speed up processing times and reduce the risk of errors.
Third, our approach allows changes in weighting and overall ranking. Thus, it mitigates the potential risk of policy implementers’ fast adherence to a previously defined output, as with stable-weight indexes (such as the Ease of Doing Business Index).
Fourth, we also emphasize that the CIDI methodology used in this research is data-driven rather than biased. Although some authors would prefer that a weighting scheme of composite indicators should reflect the intuitive and biased importance of the individual sub-indicators, our research is predominantly guided by the methods that advocate data-driven results, such as Data Envelopment Analysis (DEA) (Charnes et al. 1978; Milanović et al. 2022) or Distance Based Analysis (DBA) (Dobrota et al. 2015a). Additionally, through the CIDI methodology, we provide a transparent composite indicator that is easily interpretable and comprehensive.
5.3. Implications
This study provides several valuable implications for both practitioners and scholars. As for the practitioners, the findings are significant for policymakers and implementors, regulators and public administration analysts. The analytical framework described in this study allows for ex-ante analysis of tax administration-related policy. The most important implication is that this approach enables changes in the weights for individual factors without any expert-based bias. The more the policymakers work on individual performance measures, the less it becomes vital for the overall score. Accordingly, a tax system will never become atrophied in any sphere of performance. Policymakers in the tax administration realm should always consider clear tax policies and regulations, adequate staffing and training, efficient and streamlined processes, adequate IT support, and effective electronic services for taxpayers.
This study might be useful for scholars, as well. The field of tax administration performance measurement is a developing field with several approaches used so far (Dabla-Norris et al. 2020; Doiar et al. 2022; Pîrvu et al. 2021). Our approach, however, utilizes neutral aggregation based on empirical data to obtain a single performance measure. Thus, this approach can evaluate many other multi-criteria problems in public economics.
6. Conclusions, Limitations, and Further Recommendations
In this study, we analyzed the performance of 35 European tax administrations and created a unique and comprehensive performance measurement score for each tax administration. Rooting our analytical framework in the broad area of algorithmic governance, the score for each tax administration was obtained in a data-driven manner. By applying the CIDI methodology to rank the ‘Old Continent tax administrations’, we demonstrated that Denmark and the Netherlands as exemplary models for tax administration, with revenue collection being identified as a crucial driver of excellence and operational performances such as e-filing and on-time filing forming critical aspects of future efficiency. Such methodology can benefit policymakers, public administration analysts, and other stakeholders interested in the efficiency of tax administrations.
The study has several restrictions that can jeopardize the generalizability of the findings. First, it only employs a limited number of performance indicators for tax administration. A more comprehensive range of indicators should be considered in follow-up studies, particularly those pertaining to the effectiveness of internal processes, taxpayer expectations, segmentations, corruption, and other factors. Additionally, this study uses information from 35 nations in two consecutive years. The analysis of time series and the use of larger samples might be advantageous for future investigations. Due to the incomplete datasets utilized as input data, only a few performance metrics and observation units (tax administrations) are used.
Second, the nature of this research is quantitative. Any profound discussion on the performance of tax administrations would require an in-depth analysis of every tax jurisdiction and its tax system. Some studies even find that different tax systems in Europe react in the same manner to any efficiency changes (Ottone et al. 2018), which could imply that our study extensively emphasizes slight differences between and among European tax administrations (somewhat similar to the Freud’s explanation of the narcissism of minor differences).
Author Contributions
Conceptualization M.M.; methodology M.D. and A.D.; software M.D. and A.D.; writing—original draft preparation M.M., N.M. and Z.S.
Funding
This research received no external funding.
Data Availability Statement
Original dataset was retrieved from the ISORA database https://data.rafit.org/?sk=ba91013d-3261-42f8-a931-a829a78cb1ec.
Acknowledgments
We are truly thankful to the editors and anonymous reviewers for their support throughout the publication process.
Conflicts of Interest
The authors declare no conflicts of interest.
References
- (Arltová and Kot 2023) Arltová, M., Kot, J. 2023. Do Environmental Taxes Improve Environmental Quality? Evidence from OECD Countries. Prague Economic Papers 32(1): 26–44. [CrossRef]
- (Athanasios et al. 2022) Athanasios, A., Charalampos, K., Eleni, K. 2022. Assessing the effectiveness of tax administration in macroeconomic stability: Evidence from 26 European Countries. Economic Change and Restructuring 55(4): 2237–2261. [CrossRef]
- (Basri et al. 2019) Basri, M. C., Felix, M., Hanna, R., Olken, B. 2019. Tax Administration vs. Tax Rates: Evidence from Corporate Taxation in Indonesia. National Bureau of Economic Research. [CrossRef]
- (Belmonte-Martin et al. 2021) Belmonte-Martin, I., Ortiz, L., Polo, C. 2021. Local tax management in Spain: A study of the conditional efficiency of provincial tax agencies. Socio-Economic Planning Sciences 78: 101057. [CrossRef]
- (Braunerhjelm et al. 2021) Braunerhjelm, P., Eklund, J. E., Thulin, P. 2021. Taxes, the tax administrative burden and the entrepreneurial life cycle. Small Business Economics 56(2): 681–694. [CrossRef]
- (Cabra-Acela 2022) Cabra-Acela, P. A. 2022. Rewarding good taxpayers: An effective mechanism? International Tax and Public Finance. [CrossRef]
- (Chairassamee et al. 2023) Chairassamee, N., Hean, O., Jabas, P. 2023. The Financial Impact of State Tax Regimes on Local Economies in the U.S. Journal of Risk and Financial Management 16(10): 419. [CrossRef]
- (Charnes et al. 1978) Charnes, A., Cooper, W. W., Rhodes, E. 1978. Measuring the efficiency of decision making units. European Journal of Operational Research 2(6): 429–444. [CrossRef]
- (Chuenjit 2014) Chuenjit, P. 2014. The Culture of Taxation: Definition and Conceptual Approaches for Tax Administration. Journal of Population and Social Studies 22(1): 14–34. [CrossRef]
- (Cordero et al. 2021) Cordero, J. M., Díaz-Caro, C., Pedraja-Chaparro, F., Tzeremes, N. G. 2021. A conditional directional distance function approach for measuring tax collection efficiency: Evidence from Spanish regional offices. International Transactions in Operational Research 28(2): 1046–1073. [CrossRef]
- (Crandall 2010) Crandall, W. J. 2010. Revenue Administration: Performance Measurement in Tax Administration. Technical Notes and Manuals, 2010(11): 1. [CrossRef]
- (Dabla-Norris et al. 2020) Dabla-Norris, E., Misch, F., Cleary, D., Khwaja, M. 2020. The quality of tax administration and firm performance: Evidence from developing countries. International Tax and Public Finance 27(3): 514–551. [CrossRef]
- (D’Agostino and Durante 2018) D’Agostino, M., Durante, M. 2018. Introduction: The Governance of Algorithms. Philosophy & Technology 31(4): 499–505. [CrossRef]
- (Dobrota et al. 2016) Dobrota, M., Bulajic, M., Bornmann, L., Jeremic, V. 2016. A new approach to the QS university ranking using the composite I-distance indicator: Uncertainty and sensitivity analyses. Journal of the Association for Information Science and Technology 67(1): 200–211. [CrossRef]
- (Dobrota et al. 2012) Dobrota, M., Jeremic, V., Markovic, A. 2012. A new perspective on the ICT Development Index. Information Development 28(4): 271–280. [CrossRef]
- (Dobrota et al. 2015) Dobrota, M., Martic, M., Bulajic, M., Jeremic, V. 2015. Two-phased composite I-distance indicator approach for evaluation of countries’ information development. Telecommunications Policy 39(5): 406–420. [CrossRef]
- (Dobrota et al. 2015a) Dobrota, M., Jeremic, V., Bulajic, M., Radojicic, Z. 2015. Uncertainty and Sensitivity Analyses of PISA Efficiency: Distance Based Analysis Approach. Acta Polytechnica Hungarica, 12(3): 41–58. [CrossRef]
- (Doiar et al. 2022) Doiar, Y., Liutikov, P., Skvirskyi, I., Garmash, Y., Kuvakin, S. 2022. Tax administration in the context of effective public administration: The case Eastern European Countries. Cuestiones Políticas 40(72): 410–422. [CrossRef]
- (Durán-Cabré et al. 2019) Durán-Cabré, J. M., Esteller Moré, A., Mas-Montserrat, M., Salvadori, L. 2019. The tax gap as a public management instrument: Application to wealth taxes. Applied Economic Analysis 27(81): 207–225. [CrossRef]
- (EDPB 2022) EDPB. 2022. Tax Administration fined for fraud’ black list’. Available online: https://edpb.europa.eu/news/national-news/2022/tax-administration-fined-fraud-black-list_en (accessed on 5 July 2023).
- (Efecan Aktaş 2023) Efecan Aktaş, E. 2023. How Tax Wedge of Low and Upper-income Households Affects Income Distribution: Findings from OECD Countries. Prague Economic Papers 32(3): 246–272. [CrossRef]
- (Evans 2001) Evans, C. 2001. The operating costs of taxation: A review of the research. Economic Affairs 21(2): 5–9. [CrossRef]
- (Faúndez-Ugalde et al. 2020) Faúndez-Ugalde, A., Mellado-Silva, R., Aldunate-Lizana, E. 2020. Use of artificial intelligence by tax administrations: An analysis regarding taxpayers’ rights in Latin American countries. Computer Law & Security Review 38: 105441. [CrossRef]
- (Fjord and Schmidt 2023) Fjord, L. B., Schmidt, P. K. 2023. The Digital Transformation of Tax Systems Progress, Pitfalls, and Protection in a Danish Context. Indiana Journal of Global Legal Studies 30(1): 227–272. [CrossRef]
- (Gerritsen 2023) Gerritsen, A. 2023. Optimal nonlinear taxation: A simpler approach. International Tax and Public Finance 31(2): 486–510. [CrossRef]
- (Gnangnon 2022) Gnangnon, S. K. 2022. Tax revenue instability and tax revenue in developed and developing countries. Applied Economic Analysis 30(88): 18–37. [CrossRef]
- (Gritsenko and Wood 2020) Gritsenko, D., Wood, M. 2020. Algorithmic governance: A modes of governance approach. Regulation & Governance 16(1): 45–62. Portico. [CrossRef]
- (Gross and Klein 2022) Gross, T., Klein, P. 2022. Optimal tax policy and endogenous growth through innovation. Journal of Public Economics 209: 104645. [CrossRef]
- (Išljamović et al. 2015) Išljamović, S., Jeremić, V., Petrović, N., Radojičić, Z. 2015. Colouring the socio-economic development into green: I-distance framework for countries’ welfare evaluation. Quality & Quantity 49(2): 617–629. [CrossRef]
- (Ivanovic 1973) Ivanovic, B. (1973). A method of establishing a list of development indicators. Paris: United Nations Educational, Scientific and Cultural Organization.
- (Ivanovic 1977) Ivanovic, B. 1977. Classification theory. Belgrade: Institute for Industrial Economic.
- (Ivanovic and Fanchette 1973) Ivanovic, B., Fanchette, S. 1973. Grouping and ranking of 30 countries of Sub-Saharan Africa, two distance-based methods compared. Paris: United Nations Educational, Scientific and Cultural Organization.
- (Janssen and Kuk 2016) Janssen, M., Kuk, G. 2016. The challenges and limits of big data algorithms in technocratic governance. Government Information Quarterly 33(3): 371–377. [CrossRef]
- (Jeremic et al. 2011) Jeremic, V., Bulajic, M., Martic, M., Radojicic, Z. 2011. A fresh approach to evaluating the academic ranking of world universities. Scientometrics 87(3): 587–596. [CrossRef]
- (Jeremic and Jovanovic-Milenkovic 2014) Jeremic, V., Jovanovic-Milenkovic, M. 2014. Evaluation of Asian university rankings: Position and perspective of leading Indian higher education institutions. Current Science 106(12): 1647–1653.
- (Katzenbach and Ulbricht 2019) Katzenbach, C., Ulbricht, L. 2019. Algorithmic governance. Internet Policy Review 8(4). [CrossRef]
- (Klun 2004) Klun, M. 2004. Performance Measurement for Tax Administrations: The Case of Slovenia. International Review of Administrative Sciences 70(3): 567–574. [CrossRef]
- (Maricic et al. 2019) Maricic, M., Egea, J. A., Jeremic, V. 2019. A Hybrid Enhanced Scatter Search—Composite I-Distance Indicator (eSS-CIDI) Optimization Approach for Determining Weights Within Composite Indicators. Social Indicators Research 144(2): 497–537. [CrossRef]
- (Martínez et al. 2022) Martínez, Y. U., Arzoz, P. P., Arregui, I. Z. 2022. Tax collection efficiency in OECD countries improves via decentralization, simplification, digitalization and education. Journal of Policy Modeling 44(2): 298–318. [CrossRef]
- (Milanović et al. 2022) Milanović, T., Savić, G., Martić, M., Milanović, M., Petrović, N. 2022. Development of the Waste Management Composite Index Using DEA Method as Circular Economy Indicator: The Case of European Union Countries. Polish Journal of Environmental Studies 31(1): 771–784. [CrossRef]
- (Milosavljevic et al. 2021) Milosavljevic, M., Radovanovic, S., Delibasic, B. 2021. Evaluation of Public Procurement Efficiency of the EU Countries Using Preference Learning TOPSIS Method. Economic Computation and Economic Cybernetics Studies and Research 55(3): 187–202. [CrossRef]
- (Milosavljević et al. 2019) Milosavljević, M., Dobrota, M., Milanović, N. 2019. A New Approach to the Evaluation of Public Procurement Efficiency among European Countries. European Review 27(02): 246–259. [CrossRef]
- (Milosavljević et al. 2023) Milosavljević, M., Radovanović, S., Delibašić, B. 2023. What drives the performance of tax administrations? Evidence from selected European countries. Economic Modelling 121: 106217. [CrossRef]
- (Mohammed and Tangl 2023) Mohammed, H., Tangl, A. 2023. Taxation Perspectives: Analyzing the Factors behind Viewing Taxes as Punishment—A Comprehensive Study of Taxes as Service or Strain. Journal of Risk and Financial Management 17(1): 5. [CrossRef]
- (Nguyen et al. 2020) Nguyen, T. T. T., Prior, D., Van Hemmen, S. 2020. Stochastic semi-nonparametric frontier approach for tax administration efficiency measure: Evidence from a cross-country study. Economic Analysis and Policy 66: 137–153. [CrossRef]
- (OECD 2011) OECD. 2011. Efficiency of tax administrations. In Government at a Glance 2011. OECD Publishing, Paris.
- (OECD 2019) OECD. 2019. Data tables. In Tax Administration 2019: Comparative Information on OECD and other Advanced and Emerging Economies (pp. 1–490). Paris: OECD Publishing. [CrossRef]
- (Okunogbe and Santoro 2021) Okunogbe, O., Santoro, F. 2022. The Promise and Limitations of Information Technology for Tax Mobilization. Published by Oxford University Press on behalf of the World Bank. [CrossRef]
- (Ottone et al. 2018) Ottone, S., Ponzano, F., Andrighetto, G. 2018. Tax compliance under different institutional settings in Italy and Sweden: An experimental analysis. Economia Politica 35(2): 367–402. [CrossRef]
- (Pîrvu et al. 2021) Pîrvu, D., Duţu, A., Mogoiu, C. M. 2021. Clustering tax administrations in European Union member states. Transylvanian Review of Administrative Sciences 63 E: 110–127. [CrossRef]
- (Ponomariov, Balabushko and Kisunko 2017) Ponomariov, B., Balabushko, O., Kisunko, G. 2017. The decisive impact of tax administration practices on firms’ corruption Experience and Perceptions: Evidence from Europe and Central Asia. International Journal of Public Administration 41(15): 1314–1323. [CrossRef]
- (Radonić and Milosavljević 2019) Radonić, M., Milosavljević, M. 2019. Human Resource Practices, Failure Management Approaches and Innovations in Serbian Public Administration. Transylvanian Review of Administrative Sciences, SI2019: 77–93. [CrossRef]
- (Ravšelj et al. 2019) Ravšelj, D., Kovač, P., Aristovnik, A. 2019. Tax-related burden on SMEs in the European Union: The case of Slovenia. Mediterranean Journal of Social Sciences 10(2): 69–79. [CrossRef]
- (Sanchez-Graells 2024) Sanchez-Graells, A. 2024. Resh(AI)ping Good Administration: Addressing the Mass Effects of Public Sector Digitalisation. Laws 13(1): 9. [CrossRef]
- (Savić et al. 2015) Savić, G., Dragojlović, A., Vujošević, M., Arsić, M., Martić, M. 2015. Impact of the efficiency of the tax administration on tax evasion. Economic Research-Ekonomska Istraživanja 28(1): 1138–1148. [CrossRef]
- (Soguel 2019) Soguel, N. 2019. Tax Power and Tax Competition. In A. Ladner, N. Soguel, Y. Emery, S. Weerts, S. Nahrath (Eds.), Swiss Public Administration. Governance and Public Management. (pp. 273–290). Palgrave Macmillan, Cham. [CrossRef]
- (Taufik 2018) Taufik, K. 2018. Modernization of the tax administration system: A theoretical review of improving tax capacity. E3S Web of Conferences 73: 10022. [CrossRef]
- (Vazquez-Caro and Bird 2011) Vazquez-Caro, J., Bird, R. M. 2011. Benchmarking tax administrations in developing countries: A systemic approach. ICEPP Working Papers 9(5). Available online: https://scholarworks.gsu.edu/cgi/viewcontent.cgi?article=1085&context=icepp.
Figure 1.
Heatmap for tax administration performance in 2018 and 2019.
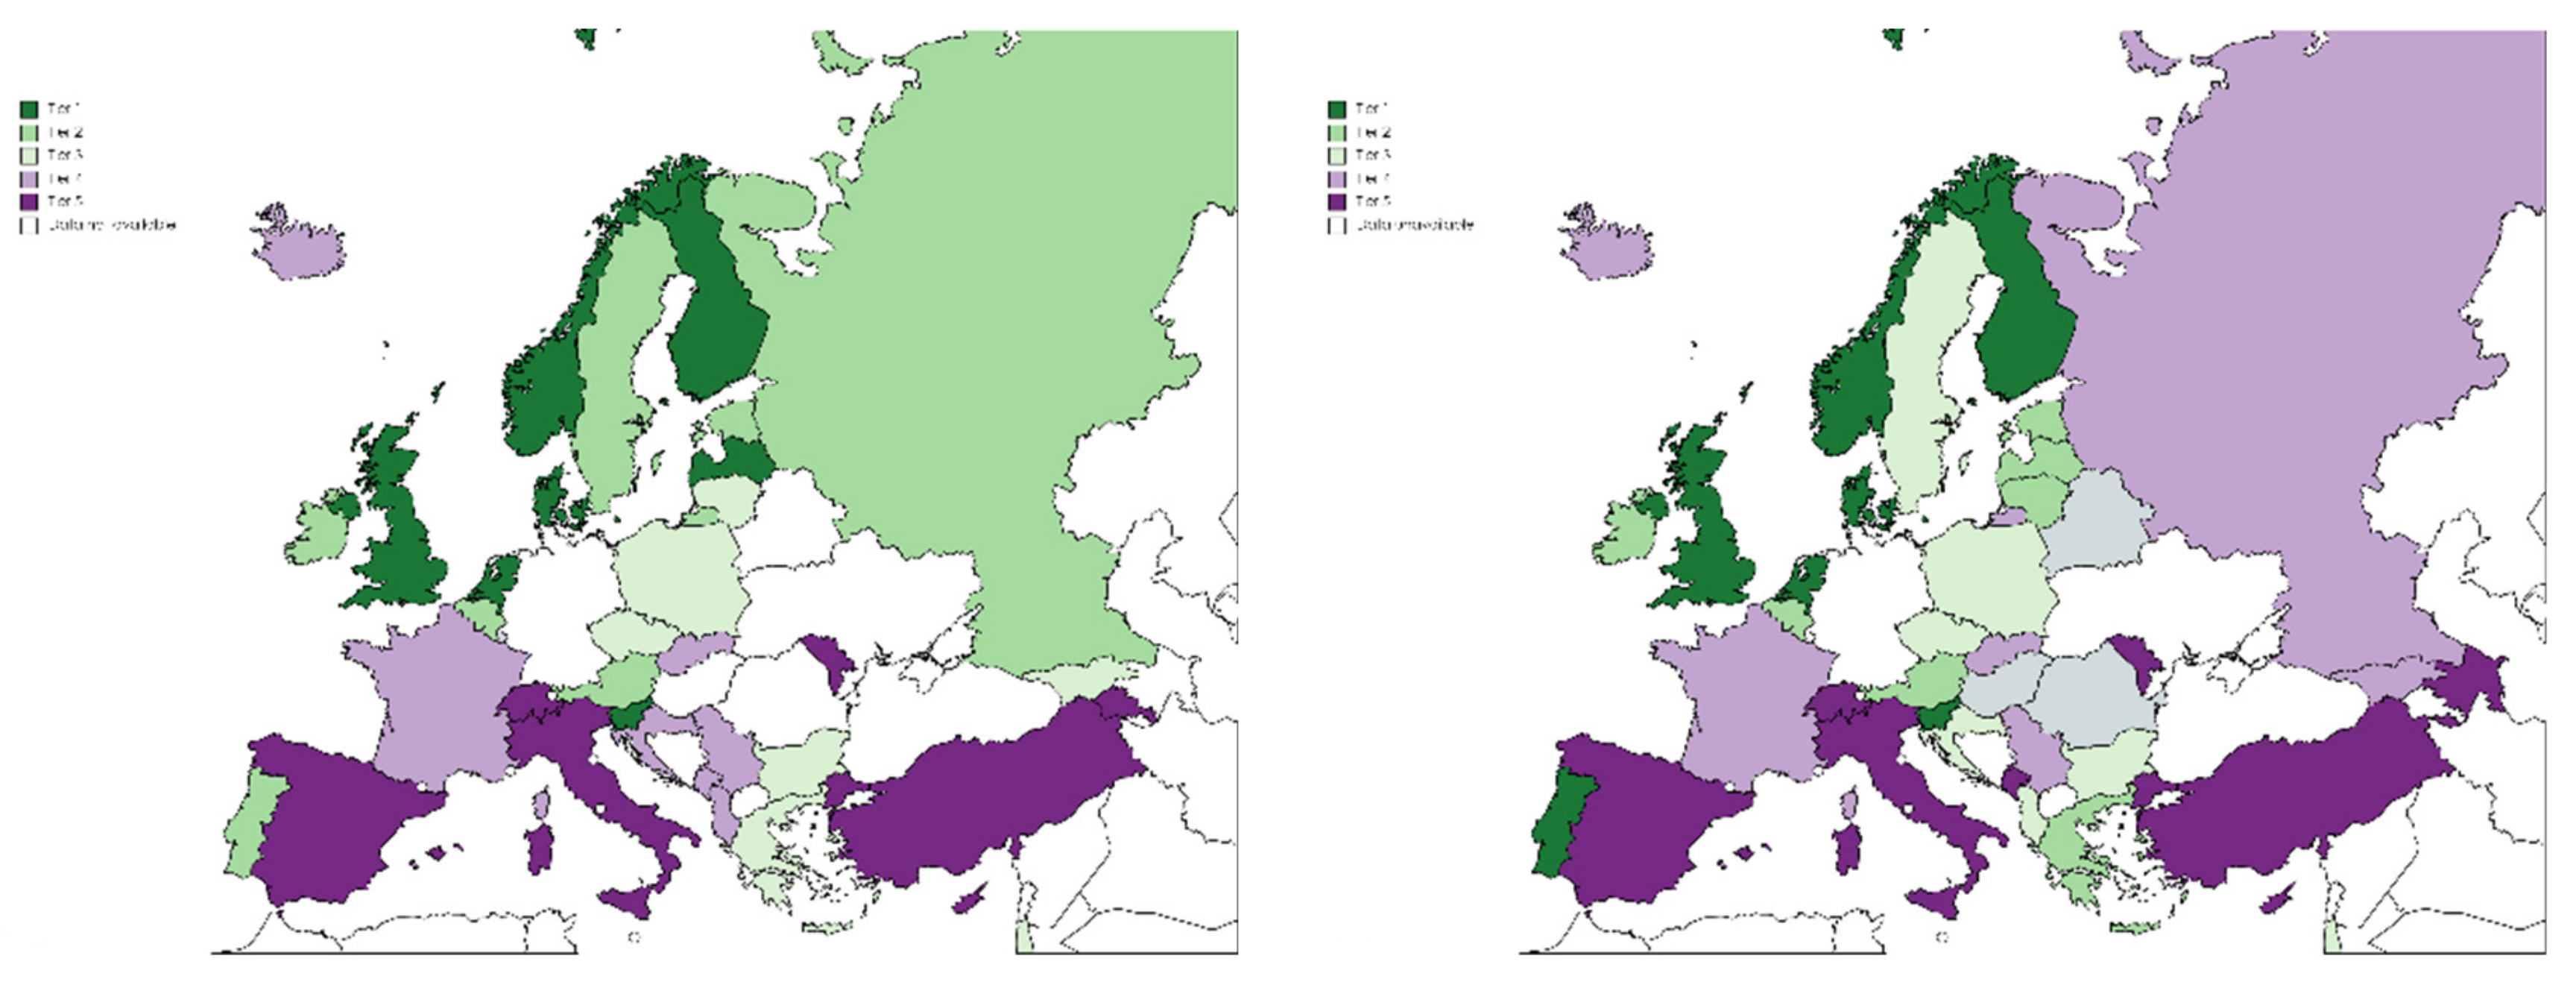

Table 1.
Tax administration performance indicators.
| Group | Indicators | Abbrev. | Type | Explanation |
|---|---|---|---|---|
| Value of revenue collected | Revenue collected to total government revenue | REV1 | Original | (Total net revenue collected - VAT gross import) / Total government revenue |
| Revenue collected to GDP | REV2 | Original | (Total net revenue collected - VAT gross import) × 100 / GDP | |
| Tax collected excluding SSC to GDP | REV3 | Original | (Total net revenue collected - VAT gross import - Nontax revenue - Social security) × 100 / GDP | |
| FTE per 10,000 citizens | RES1 | Calculated | Total staff measured as Full-Time -Equivalent over 10.000 citizens within the tax jurisdiction | |
| Resources and staff indicators | ICT Intensity Index | RES2 | Calculated | ICT operating costs divided by Staff cost of tax administration |
| Hiring to attrition index | STAFF1 | Calculated | Hiring rate [recruitments] / Attrition rate [departures] by FY | |
| Staff Experience Index | STAFF2 | Calculated | Experience of staff measured by weighted number of years spent at tax administration | |
| Staff Education Index | STAFF3 | Calculated | Previous education of staff working for tax administration | |
| Operating performance, arrears, and auditing | Average on-time filling rate | OE1 | Original | Average percentage of on-time filling for CIT, PIT, PAYE & VAT |
| Average e-filling | OE2 | Calculated | Average percentage of e-fillings for CIT, PIT, PAYE & VAT | |
| Average on-time payment rate | AA1 | Calculated | Average percentage of the on-time payment for CIT, PIT, PAYE & VAT |
Note: VAT: Value added tax, CIT: Corporate income tax, PIT: Personal income tax, SSC: Social security collection, PAYE: Pay as you earn, FTE: Full-time equivalent.
Table 2.
CIDI indicators’ weights.
| VarCode | Variable | Weight 2018 | Weight 2019 | Year-on-Year Difference | % Change | ||
|---|---|---|---|---|---|---|---|
| REV1 | Revenue collected to total government revenue | 0.115 | 0.101 | ↓ | −0.014 | ↓ | −12.17% |
| REV2 | Revenue collected to GDP | 0.141 | 0.134 | ↓ | −0.007 | ↓ | −4.96% |
| REV3 | Tax collected excluding SSC to GDP | 0.147 | 0.144 | −0.003 | ↓ | −2.04% | |
| RES1 | FTE per 10,000 citizens | 0.138 | 0.137 | −0.001 | −0.72% | ||
| RES2 | ICT Intensity Index | 0.094 | 0.102 | +0.008 | +8.51% | ||
| STAFF1 | Hiring to attrition index | 0.110 | 0.078 | ↓ | −0.032 | ↓ | −29.09% |
| STAFF2 | Staff Experience Index | 0.002 | 0.003 | +0.001 | ↑ | +50% | |
| STAFF3 | Staff Education Index | 0.027 | 0.017 | ↓ | −0.01 | ↓ | −37.04% |
| OE1 | On-time filling rate | 0.068 | 0.087 | ↑ | +0.019 | +27.94% | |
| OE2 | Average e-filling | 0.062 | 0.106 | ↑ | +0.044 | ↑ | +70.97% |
| AA1 | Average on-time payment rate | 0.095 | 0.091 | −0.004 | ↓ | −4.21% | |
Table 3.
CIDI scores and CIDI ranks of the tax administration performance of selected European countries.
Table 3.
CIDI scores and CIDI ranks of the tax administration performance of selected European countries.
| 2018 | 2019 | |||||
|---|---|---|---|---|---|---|
| Tax jurisdiction | Total | Rank | Total | Rank | Difference in rank | |
| Denmark | 80.693 | 1 | 80.587 | 1 | 0 | |
| Netherlands | 64.346 | 2 | 68.943 | 2 | 0 | |
| Slovenia | 61.424 | 3 | 62.588 | 4 | −1 | |
| Finland | 60.268 | 4 | 62.485 | 5 | −1 | |
| Norway | 58.977 | 5 | 63.591 | 3 | +2 | |
| Latvia | 53.741 | 6 | 56.290 | 10 | −4 | |
| United Kingdom | 53.675 | 7 | 57.121 | 6 | +1 | |
| Portugal | 53.601 | 8 | 56.861 | 7 | +1 | |
| Belgium | 53.462 | 9 | 56.383 | 8 | +1 | |
| Russia | 53.156 | 10 | 49.965 | 22 | ↓ | −12 |
| Ireland | 53.041 | 11 | 56.306 | 9 | +2 | |
| Austria | 53.029 | 12 | 55.062 | 13 | −1 | |
| Estonia | 52.212 | 13 | 54.378 | 14 | −1 | |
| Sweden | 51.860 | 14 | 50.069 | 21 | ↓ | −7 |
| Poland | 51.807 | 15 | 51.579 | 18 | −3 | |
| Israel | 51.659 | 16 | 53.367 | 16 | 0 | |
| Czechia | 49.829 | 17 | 51.073 | 19 | −2 | |
| Georgia | 49.715 | 18 | 48.597 | 24 | ↓ | −6 |
| Lithuania | 49.584 | 19 | 55.140 | 12 | ↑ | +7 |
| Greece | 49.457 | 20 | 55.695 | 11 | ↑ | +9 |
| Bulgaria | 49.341 | 21 | 53.555 | 15 | ↑ | +6 |
| Croatia | 47.420 | 22 | 50.658 | 20 | +2 | |
| Serbia | 46.690 | 23 | 49.763 | 23 | 0 | |
| Albania | 46.096 | 24 | 52.438 | 17 | ↑ | +7 |
| Slovakia | 43.871 | 25 | 45.036 | 26 | −1 | |
| France | 41.725 | 26 | 44.315 | 27 | −1 | |
| Iceland | 40.889 | 27 | 48.355 | 25 | +2 | |
| Montenegro | 38.455 | 28 | 32.073 | 33 | −5 | |
| Armenia | 37.068 | 29 | 39.106 | 28 | +1 | |
| Spain | 35.313 | 30 | 37.634 | 30 | 0 | |
| Moldova | 33.244 | 31 | 21.874 | 34 | −3 | |
| Italy | 32.888 | 32 | 35.654 | 32 | 0 | |
| Cyprus | 32.881 | 33 | 38.489 | 29 | ↑ | +4 |
| Turkey | 32.684 | 34 | 35.915 | 31 | ↑ | +3 |
| Switzerland | 21.848 | 35 | 19.466 | 35 | 0 | |
Disclaimer/Publisher’s Note: The statements, opinions and data contained in all publications are solely those of the individual author(s) and contributor(s) and not of MDPI and/or the editor(s). MDPI and/or the editor(s) disclaim responsibility for any injury to people or property resulting from any ideas, methods, instructions or products referred to in the content. |
© 2024 by the authors. Licensee MDPI, Basel, Switzerland. This article is an open access article distributed under the terms and conditions of the Creative Commons Attribution (CC BY) license (http://creativecommons.org/licenses/by/4.0/).
Copyright: This open access article is published under a Creative Commons CC BY 4.0 license, which permit the free download, distribution, and reuse, provided that the author and preprint are cited in any reuse.


