Submitted:
28 May 2024
Posted:
28 May 2024
Read the latest preprint version here
Abstract
The crosstalk between tumor progression and ferroptosis is largely unknown. Here, we identify malate dehydrogenase 2 (MDH2) as a key regulator of ferroptosis. MDH2 de-ficiency inhibits hepatocellular carcinoma (HCC) cell growth and promotes sensitivity of HCC cells to RSL3-induced ferroptosis. MDH2 knockdown enhances RSL3-induced intracellular reactive oxygen species (ROS), free iron ions and lipid peroxides levels, leading to HCC ferroptotic cell death which is rescued by Ferrostatin-1 and iron chelator Deferiprone. Importantly, inhibition of HCC cell growth caused by MDH2 deficiency is partially rescued by ferroptosis blockade. Mechanistically, MDH2 resists RSL3-induced ferroptosis sensitivity by dependence on GPX4, which is stabilized by MDH2 in HCC. The protein expression of MDH2 and GPX4 is positively correlated with each other in HCC cell lines. Furthermore, The Cancer Genome Atlas (TCGA) database shows that MDH2 and GPX4 are highly expressed in HCC samples, their expression is positively correlated with HCC stages, and GPX4 expression is associated with poor prognosis of HCC patients. These findings reveal a critical mechanism by which HCC evades fer-roptosis via MDH2-mediated stabilization of GPX4 to promote tumor progression and underscore the potential of MDH2 inhibition in combination with ferroptosis inducers for the treatment of HCC.
Keywords:
Tumor progression
; ferroptosis
; MDH2
; HCC
1. Introduction
Hepatocellular carcinoma (HCC) represents a significant global burden as one of the most prevalent malignant tumors, with increasing incidence and mortality rates, thereby presenting a major challenge to public health and clinical management [1]. Despite advancements in HCC treatment over the past few decades, the prognosis, particularly for patients in advanced stages, remains discouraging [1]. Therefore, a comprehensive understanding of HCC pathogenesis and the identification of novel therapeutic targets are of utmost importance.
In recent years, ferroptosis has attracted widespread attention as a new type of cell death. Compared with other common cell death modes (such as apoptosis, necrosis and autophagy), ferroptosis is a cell death characterized by iron-dependent lipid peroxidation [2,3]. Excess iron leads to the generation of reactive oxygen species (ROS) through the Fenton reaction (the reaction of iron with hydrogen peroxide, converting ferrous iron into highly reactive hydroxyl radicals) [4]. Excessive ROS can induce lipid peroxidation on the cell membrane, thereby triggering ferroptosis. Ferroportin (FPN) is responsible for exporting excess Fe2+ out of the cell, while auxiliary proteins such as ceruloplasmin and hephaestin assist in the oxidation of Fe2+ to Fe3+ for utilization by other tissues or cells [5]. Cells with elevated iron levels are more susceptible to ferroptosis, which can be blocked by iron chelators such as Deferiprone (DFP) [6]. Cellular redox homeostasis is maintained by glutathione (GSH) and glutathione peroxidase 4 (GPX4). GPX4 is the only enzyme that can utilize reduced glutathione to eliminate lipid peroxides [4]. Therefore, ferroptosis can be inhibited by reducing the accumulation of lipid peroxides through various methods, such as inhibiting lipoxygenase (such as NDGA and Zileuton), depleting GSH levels (such as Erastin), or inhibiting GPX4 activity (such as RSL3). For tumor cells, ferroptosis is of great significance because tumor cells rely on high levels of iron to promote invasive growth, making them more sensitive to ferroptosis [4]. Therefore, induction of ferroptosis has been considered a promising strategy against drug-resistant tumors, especially HCC [7]. However, further studies are needed to elucidate the regulatory mechanisms of ferroptosis in HCC.
MDH2 is a crucial enzyme in cellular metabolism as it serves as the terminal enzyme of the mitochondrial tricarboxylic acid (TCA) cycle. It utilizes nicotinamide adenine dinucleotide (NAD) as a cofactor to catalyze the conversion of L-malate to oxaloacetate, generating reducing equivalents [8]. Due to its significant role in the TCA cycle, MDH2 has attracted widespread attention, and researchers have found that it plays a pivotal role in tumor growth, metastasis, and chemotherapy resistance [9]. As a mitochondrial enzyme, MDH2 is involved in redox reactions and energy metabolism within mitochondria. Mitochondria play a crucial role in intracellular iron storage and metabolism [10]. Therefore, dysregulation of MDH2 may disrupt intracellular iron balance, potentially impacting the occurrence of ferroptosis. Recent investigations have suggested that reduced MDH2 expression in sarcopenia may promote muscle ferroptosis [11]. Metabolic enzymes can regulate various cellular activities depending on different stresses [12,13,14]. However, the specific role of MDH2 in HCC and its relationship with HCC ferroptosis remain largely unexplored.
In this study, we demonstrate that MDH2 promotes HCC ferroptosis evasion by inhibiting ubiquitination and degradation of GPX4. Furthermore, MDH2 deficiency sensitizes HCC cells to ferroptosis, which inhibits HCC tumor growth.
2. Materials and Methods
2.1. Cell Lines and Cell Culture
Liver cancer cell lines (Huh7, Hep3B, SNU398, PLC/PRF5, HLE, HCCLM3 and HepG2), human normal hepatocytes (L02) and human embryonic kidney cells (HEK-293T) were purchased from the Cell Bank of the Type Culture Collection Committee of the Chinese Academy of Sciences. All cells were cultured in Dulbecco's modified eagle medium (DMEM, Solarbio, Cat# 11965) containing 10% fetal bovine serum (FBS, Gbico, Cat# 10100147C) at 37 °C and 5% CO2. The cells were replaced with culture medium every 1-2 days, and after growing to the logarithmic phase (cells grow to about 80%), follow-up experiments or subcultures could be performed.
2.2. Regents and Antibodies
Regents used in this study including: RSL3 (CSNpharm, Cat# CSN17581); N-acetyl-L-cysteine (NAC, MCE, Cat# HY-B0215); Ferrostatin-1 (Fer-1, Abmole, Cat# M2698); Deferiprone (DFP, Abmole, Cat# M2617); protease inhibitor PMSF (Wuhan Dingguo Biotechnology, Cat# 329-98-6); polybrene (MCE, Cat# HY-112735); puromycin (Solarbio, Cat# P8230); transfection reagent (Pufei Biotech, Cat# 2102-100); paraformaldehyde (Solarbio, Cat # P1110); TRIzol reagent (Invitrogen, Cat# 15596-026); M5 Super plus qPCR RT kit with gDNA remover (Mei5bio, Cat# MF166-plus-T); M5 HiPer One-step RT-PCR Kit (Mei5bio, Cat# MF051-01); ABI QuantStudio 7 Flex with SYBR kit (TransGen, Cat# AQ601-02); MG132 (Biovision, Cat# 1791-5); dodecyl sulfate Sodium (SDS, Solarbio, Cat# S8010); N-Ethylmaleimide (NEM, Solarbio, Cat# N8760); DCFH-DA (MCE, Cat# HY-D0940), PGSK (MCE, Cat# HY-126823); C11-BODIPY581/591 (MCE, Cat# HY-D1691).
The antibodies were as follows: Flag (Sigma, Cat# 66008-3Ig, used at 1:5000); MDH2 (Proteintech, Cat# 15462-1-AP, used at 1:4000); Vinculin (santa cruz , Cat# sc-73614, used at 1:8000); GPX4 (Proteintech, Cat# 67763-1-Ig, used at 1:1000); SLC7A11 (Proteintech, Cat# 18790-1-AP, used at 1:4000); HA (santa cruz, Cat# sc-7392, used at 1:5000); MYC (Proteintech, Cat# 60003-2-Ig, used at1:5000); HRP conjugated goat-anti-mouse or rabbit antibody (santa cruz, used at 1:5000).
2.3. Western Blot (WB)
Cells were lysed with RIPA cell lysis buffer (Solarbio, Cat# R0100) containing 1% protease inhibitor PMSF (Wuhan Dingguo Biotechnology, Cat# 329-98-6) for 30 minutes at 4°C, and then the lysates were transferred into 1.5 ml EP tube to centrifuge at 12000rpm/min for 20 minutes at 4°C. Transfer the supernatant to a new EP tube followed by adding 2× loading buffer at a ratio of 1:1 and mix well to boil it for 10 minutes. Samples were then subjected to SDS-PAGE, after proteins were transferred to a PVDF membrane (Millipore, Cat# 03010040001), the PVDF membrane was blocked in 5% skimmed milk powder (Solarbio, Cat# D8340) for 1 hour at room temperature and then incubated with antibodies. After washing with TBST, ECL chemiluminescence solution kit (Meilunbio, Cat# MA0186) was used for color development, and finally imaging and storage were performed.
2.4. Construction of Stable MDH2 Knockdown Cell Line
The lentivirus was packaged in HEK-293T cells. Briefly, HEK-293T cells were seeded and transfected with the target plasmid (plko.1-puromycin or shMDH2 plasmids) and lentivirus packing plasmids PSPAX2 and PMD2.G. After transfection of 48h, the supernatant was collected and filtered with a 0.45μM filter to remove cell debris to infect HCC cells with addition of 5μg/ml polybrene (MCE, Cat# HY-112735). 48h after infection, 2μg/ml puromycin (Solarbio, Cat# P8230) was added to the culture medium of HCC cells for 2 days to kill the uninfected cells.
2.5. Transient Transfection of Plasmid
Cells were seeded and transfected when the cell density was approximately 80%. The transfection reagent (Pufei Biotech, Cat# 2102-100) were used for transient transfection of plasmid in HCC cells. Briefly, 125μl of serum-deficient DMEM medium (Solarbio, Cat# 11965) was added to tubes A and B respectively, and then 9μl of transfection reagent (Pufei Biotech, Cat# 2102-100) was added to tube B. Add 3μg of plasmids (3.1-SFB or 3.1-MDH2-SFB plasmids) to tube A, carefully add the liquid from tube B to tube A and mix gently. After standing for 15 minutes, the transfection mixture was evenly dispersed into the cells. Shake gently followed by 12-16 hours of culture, then replace with fresh medium and cultured for another 12-24 hours.
2.6. Cell Proliferation Assay
HCCLM3 and HLE cells (3000 cells per well) were seeded into 24-well plates and cultured for 0, 2, 4, and 6 days. Cells were harvested and washed three times with PBS, then fixed with 4% paraformaldehyde (Solarbio, Cat# P1110) for 30 minutes at room temperature, followed by three washes with PBS. Cells were stained with 500μl crystal violet for 2 minutes and washed to remove the free crystal violet. Add 200μl of 10% concentration glacial acetic acid to the stained cells in the wells, shake well, dissolve and elute for 1 hour. Finally, transfer the crystal violet dissolved in glacial acetic acid to a 96-well plate, measure the OD value on a microplate reader at a wavelength of 595 nm, calculate the data and draw a growth curve based on the OD value.
2.7. Colony Formation Assay
Cells were digested and counted, 50,000 cells per well were seeded into a 6-well plate and cultured at 37 °C and 5% CO2 for 10 days. Cells were washed three times with PBS and fixed with 4% paraformaldehyde (Solarbio, Cat# P1110) for 30 minutes at room temperature, then stained with 0.1% crystal violet in 20% methanol for 15 minutes, then washed with PBS and photographed.
2.8. Quantitative Real-Time PCR (RT-qPCR)
Total RNA was extracted from cells using TRIzol reagent (Invitrogen, Cat# 15596-026) according to the manufacturer's instructions. RNA integrity, quantity, and purity were checked using a NanoDrop 2000c spectrophotometer (Thermo Fisher Scientific). Genomic DNA was removed using M5 Super plus qPCR RT kit with gDNA remover (Mei5bio, Cat# MF166-plus-T). Total RNA was then reverse transcribed into cDNA using the M5 HiPer One-step RT-PCR Kit (Mei5bio, Cat# MF051-01). Real-time PCR was performed in triplicate in 20μL reaction mixtures, and real-time qPCR analysis was performed using ABI QuantStudio 7 Flex with SYBR kit (TransGen, Cat# AQ601-02). Each sample was tested in three biological replicates per assay. Relative gene expression levels were analyzed using the comparative Ct method, where Ct is the threshold number of cycles normalized to GAPDH.
2.9. IP and Immunoblotting Analysis
Cells were harvested and lysed with RIPA cell lysis buffer (Solarbio, Cat# R0100) containing 1% protease inhibitor PMSF (Wuhan Dingguo Biotechnology, Cat# 329-98-6) for 30 minutes at 4°C and then cell lysates were transferred into a 1.5 ml EP tube and centrifuged at 12,000 rpm/min for 20 minutes at 4°C. After centrifugation, the supernatant was transferred to a new EP tube, mixed with 50μl of protein G-agarose beads and 1μg of antibody, and incubated for 4 hours at 4°C. After incubation, samples were centrifuged at 3000rpm/min for 2 minutes, the supernatant was discarded, and the immunoprecipitate was washed three times with RIPA cell lysis buffer (Solarbio, Cat# R0100). Finally, the immunoprecipitate was dissolved in SDS buffer and boiled for 10 minutes before performing SDS-PAGE.
2.10. Ubiquitination Assay
HEK-293T cells were seeded and transiently transfected with plasmids (HA-Ub, Myc-MDH2, Flag-GPX4). 48 hours after transfection, cells were treated with 10μM MG132 (Biovision, Cat# 1791-5) for 6 hours, then cells were harvested and lysed with RIPA cell lysis buffer (Solarbio, Cat# R0100) containing 1% PMSF (Wuhan Dingguo Biotech, Cat# 329-98-6), sodium dodecyl sulfate (SDS, Solarbio, Cat# S8010) and N-ethylmaleimide (NEM, Solarbio, Cat# N8760), and immunoprecipitation was performed with anti-Flag antibodies (Sigma, Cat# 66008-3Ig). Immunoprecipitated proteins were analyzed by Western blotting using anti-HA antibodies (santa cruz, Cat# sc-7392).
2.11. Cell Death Analysis
Cell death analysis was determined by propidium iodide (PI) staining. Briefly, cells were collected and washed with PBS and then were stained with 10μg/ml PI for 15 minutes at room temperature in the dark. After staining, cells were centrifuged and washed twice with PBS to remove free PI. Resuspend the stained cells in 500μl PBS and place on ice for flow cytometry analysis. Data were analyzed using Flowjo software.
2.12. Cell Viability Assay
Cell viability was determined by CCK-8 assay. Briefly, cells were digested and counted, 3500 cells in 200μl DMEM were seeded into 96-well plates and cultured. After the culture, add 10μl CCK8 reagent to each well and incubate in the incubator for 1 hour. The OD value of each sample was measured at 450 nm on a microplate reader, and the cell viability rate was calculated.
2.13. Intracellular ROS, Fe2+, and Lipid ROS Levels Detection
Intracellular ROS, Fe2+, and lipid ROS levels were determined using flow cytometry according to the manufacture instructions. Briefly, cells were seeded and cultured in 6-well plates, the culture medium was removed, and the cells were washed three times with PBS. Cells were treated with ROS probe DCFH-DA (MCE, Cat# HY-D0940), Fe2+ probe PGSK (MCE, Cat# HY-126823), lipid ROS probe Cll-BODIPY581/591 (MCE, Cat# HY-D1691) in PBS and cultured in the cell incubator for 30 minutes. After incubation, cells were digested, collected and washed twice with PBS and finally resuspended in 500μl PBS on ice and analyzed with flow cytometry. Data were analyzed by Flowjo software.
2.14. Statistical Analysis
GraphPad Prism 9 was used for all statistical analyses. All statistics are expressed as mean ± SD. All experiments were repeated independently at least three times with similar results. Differences between experimental groups were analyzed using Student's t test. Overall survival was assessed by Kaplan-Meier survival analysis and log-rank test. Correlations of categorical variables were compared using the Pearson test. p < 0.05 was considered statistically significant.
3. Results
3.1. MDH2 Is Highly Expressed in HCC and Promotes HCC Growth
To explore the function of MDH2 in HCC, firstly, we analyzed the expression of MDH2 using The Cancer Genome Atlas (TCGA) database and found that MDH2 is generally up-regulated in HCC tissue samples compared with normal control tissues (Figure 1A). Moreover, the expression of MDH2 is positively correlated with cancer stages of HCC (Figure 1B), suggesting its potential involvement in HCC progression. Furthermore, MDH2 protein levels were significantly higher in a panel of HCC cell lines (Huh7, Hep3B, SNU398, PLC/PRF5, HLE, and HCCLM3) than in human normal hepatocytes (L02) (Figure 1C). These data suggest a potential promoting role of MDH2 in HCC progression. Subsequently, to determine the role of MDH2 in HCC cell growth, we stably knocked down MDH2 in HCCLM3 and HLE cells and analyzed the knockdown efficiency by Western blotting (Figure 1D). Cell proliferation assays show that knockdown of MDH2 significantly inhibited the growth of HCCLM3 and HLE cells (Figure 1E). To corroborate these results, we performed colony formation assays and obtained the same results (Figure 1F). Collectively, these results suggest that MDH2 is overexpressed in HCC and promotes HCC growth.
3.2. Knockdown of MDH2 Increases RSL3-Induced HCC Cell Death
Recent studies have revealed that downregulation of MDH2 may contribute to the promotion of muscle ferroptosis in sarcopenia [11]. However, the relationship between MDH2 and ferroptosis in HCC remains to be explored. To investigate whether MDH2 plays a regulatory role in HCC ferroptosis, we treated HCC cells with different doses of the ferroptosis inducer RSL3, and cell viability assay using CCK8 revealed that knockdown of MDH2 resisted RSL3-induced HCC cell viability (Figure 2A). Moreover, compared with wild-type (WT) HCC cells, MDH2-knockdown HCC cells had reduced cell adhesion and more floating and dead cells were observed by microscopy after RSL3 treatment ( Figure 2B). To further test whether MDH2 plays a pivotal role in RSL3-induced cell death, we next analyzed the proportion of cell death by propidium iodide (PI) staining using flow cytometry. Figure 2C showed that knockdown of MDH2 significantly promoted RSL3-induced HCCLM3 and HLE cell death. Additionally, to validate this finding, we stably overexpressed MDH2 in HCC cells (Figure 2D) and found that MDH2 overexpression impeded RSL3-induced HCC cell death (Figure 2E,F). Taken together, these findings indicate that MDH2 played an inhibitory role in RSL3-induced cell death in HCC and that knockdown of MDH2 increased the sensitivity of HCC to RSL3.
3.3. MDH2 Knockdown Increases RSL3-Induced HCC Cell Death via Upregulating Reactive Oxygen Species
ROS-mediated lipid peroxidation is the central process underlying ferroptosis. During lipid peroxidation, ROS oxidize phospholipids, enzymes, membrane receptors, as well as macromolecules like polyunsaturated fatty acid side chains and nucleic acids within the biological membranes, leading to the formation of lipid peroxides. These alterations disrupt the fluidity and permeability of the cell membrane, ultimately culminating in cell death [15]. Thus, assessing intracellular ROS content serves as an indicator of the extent of ferroptotic cell death. Next, we aimed to elucidate whether knockdown of MDH2 enhances RSL3-induced HCC cell death through the upregulation of ROS, we employed DCFH-DA probe to monitor intracellular ROS levels and found that compared with WT HCC cells, MDH2 knockdown cells significantly increased intracellular ROS levels upon RSL3 treatment (Figure 3A). Furthermore, we wondered whether the upregulated intracellular ROS levels in MDH2-knockdown cells, induced by RSL3, were the key to HCC cell fate determination, we treated HCC cells with the ROS scavenger N-acetyl-L-cysteine (NAC), the results showed that NAC significantly impeded RSL3-induced cell death in MDH2 knockdown HCC cells (Figure 3B,C). These results suggest that knockdown of MDH2 enhanced the susceptibility of HCC cells to RSL3-induced cell death through the upregulation of ROS, underscoring the critical role of MDH2 in preserving redox homeostasis and safeguarding HCC cells against oxidative stress and the cytotoxic effects induced by RSL3.
3.4. MDH2 Knockdown Sensitizes HCC to RSL3-Induced Ferroptosis
The above experimental results indicated that downregulation of MDH2 enhanced the sensitivity of HCC to RSL3-induced cell death by elevating ROS levels. Nevertheless, it is important to note that not all sources of ROS generation contribute equally to the demise of ferroptotic cells, despite ferroptosis being initiated by oxidative damage. Ferroptosis entails distinct molecular mechanisms to initiate and regulate the cell death process, with iron-dependent ROS production and subsequent lipid peroxidation serving as the primary drivers [4]. Therefore, the aforementioned findings raised the question that whether MDH2 directly functions in the ferroptosis pathway. To address this question, we evaluated two direct indicators of ferroptosis: iron ions and lipid peroxides. Firstly, we employed the Fe2+ probe PGSK and the lipid ROS probe C11-BODIPY581/591 to detect intracellular Fe2+ and lipid ROS contents by flow cytometry, the results show that knockdown of MDH2 significantly increased intracellular free Fe2+ and lipid ROS levels under RSL3 treatment (Figure 4A,B). Furthermore, the ferroptosis inhibitor Ferrostatin-1 (Fer-1), a lipophilic radical-trapping antioxidant, and the iron chelator DFP, could rescue MDH2-knockdown HCC cell death induced by RSL3 (Figure 4C,D). These results revealed that MDH2 played an important role in intracellular Fe2+ and lipid ROS homeostasis and further support the notion that MDH2 enhanced RSL3-induced cell death in HCC through the ferroptosis pathway.
3.5. Knockdown of MDH2 Inhibits HCC Cell Growth Partially Dependent on Ferroptosis
Given our results indicated that MDH2 is overexpressed in HCC and promotes HCC tumor growth and ferroptosis evasion. Therefore, we next want to know whether MDH2's role in HCC cell growth is associated with ferroptosis. To figure this out, we performed cell proliferation assays and found that ferroptosis inhibitor Fer-1 could partially rescue cell growth inhibition caused by MDH2 knockdown in HCCLM3 and HLE cells (Figure 5A). Furthermore, MDH2 knockdown significantly inhibited the colony-forming ability of HCCLM3 and HLE cells, and this inhibition was also partially abolished by Fer-1 treatment (Figure 5B). These results suggest that MDH2 knockdown inhibited HCC cell growth, which was partially dependent on ferroptosis pathway, and upregulation of MDH2 expression in HCC may promote ferroptosis evasion, thereby accelerating HCC tumor progression.
3.6. MDH2 Knockdown Sensitizes HCC to Ferroptotic Cell Death via GPX4
Ferroptosis, a form of regulated cell death, can be triggered through both exogenous and endogenous pathways. The exogenous pathway of ferroptosis is initiated by inhibiting cell membrane transporters such as the cystine/glutamate antiporter (System Xc-), or activating iron transporters such as serum transferrin and lactotransferrin. System Xc- is located on the cell membrane surface, with SLC7A11 being its primary functional subunit. SLC7A11 facilitates the transport of extracellular cystine into cells, which is crucial for the synthesis of GSH [16]. This process helps protect cells from damage caused by oxidative stress [17]. On the other hand, the endogenous pathway primarily triggers ferroptosis by inhibiting intracellular antioxidant enzymes such as GPX4 [18]. GPX4 is a core enzyme involved in regulating lipid peroxidation and is located in mitochondria, cytoplasm, and nucleus. It utilizes electrons provided by GSH to convert phospholipid hydroperoxides into non-toxic phospholipid alcohols, thus neutralizing toxic peroxides and combating lipid peroxidation [19].
To investigate the detailed mechanism of MDH2 in regulating ferroptosis in HCC, we analyzed the expression level of GPX4 and SLC7A11 which is ctirtcal for ferroptosis pathway. WB analysis shows that knockdown of MDH2 in HCCLM3 and HLE cells significantly reduced the protein level of GPX4 and had little effect on SLC7A11 protein expression (Figure 6A). In order to elucidate how MDH2 regulates GPX4, we extracted mRNA for quantitative real-time PCR analysis and the data reveals that MDH2 knockdown had no effect on GPX4 and SLC7A11 mRNA levels (Figure 6B), implying that MDH2 regulated GPX4 expression at the post-transcription level.
MDH2 plays a crucial role in catalyzing the dehydrogenation of malate, leading to the production of oxaloacetate and NADH, which subsequently generates NADPH [20]. NADPH serves as an essential cofactor in the reduction process of GPX4, which facilitates the removal of peroxidized lipids from cells. Notably, both MDH2 and GPX4 are localized in mitochondria, which leads us to speculate that there may be a potential relationship between them that could impact ferroptosis in HCC. To verify whether MDH2 affects HCC ferroptosis via GPX4, we overexpressed GPX4 in MDH2-knockdown HCCLM3 and HLE cells, and cell death analysis reveals that GPX4 overexpression significantly rescued MDH2-knockdown HCC cell death induced by RSL3 (Figure 6C,D). These results suggest that MDH2 knockdown sensitized HCC cells to RSL3-induced ferroptotic cell death via downregulating GPX4 protein expression at the post-transcription level in HCC cells, supporting the view that MDH2 affected HCC ferroptosis by regulating GPX4.
3.7. MDH2 Stabilizes GPX4
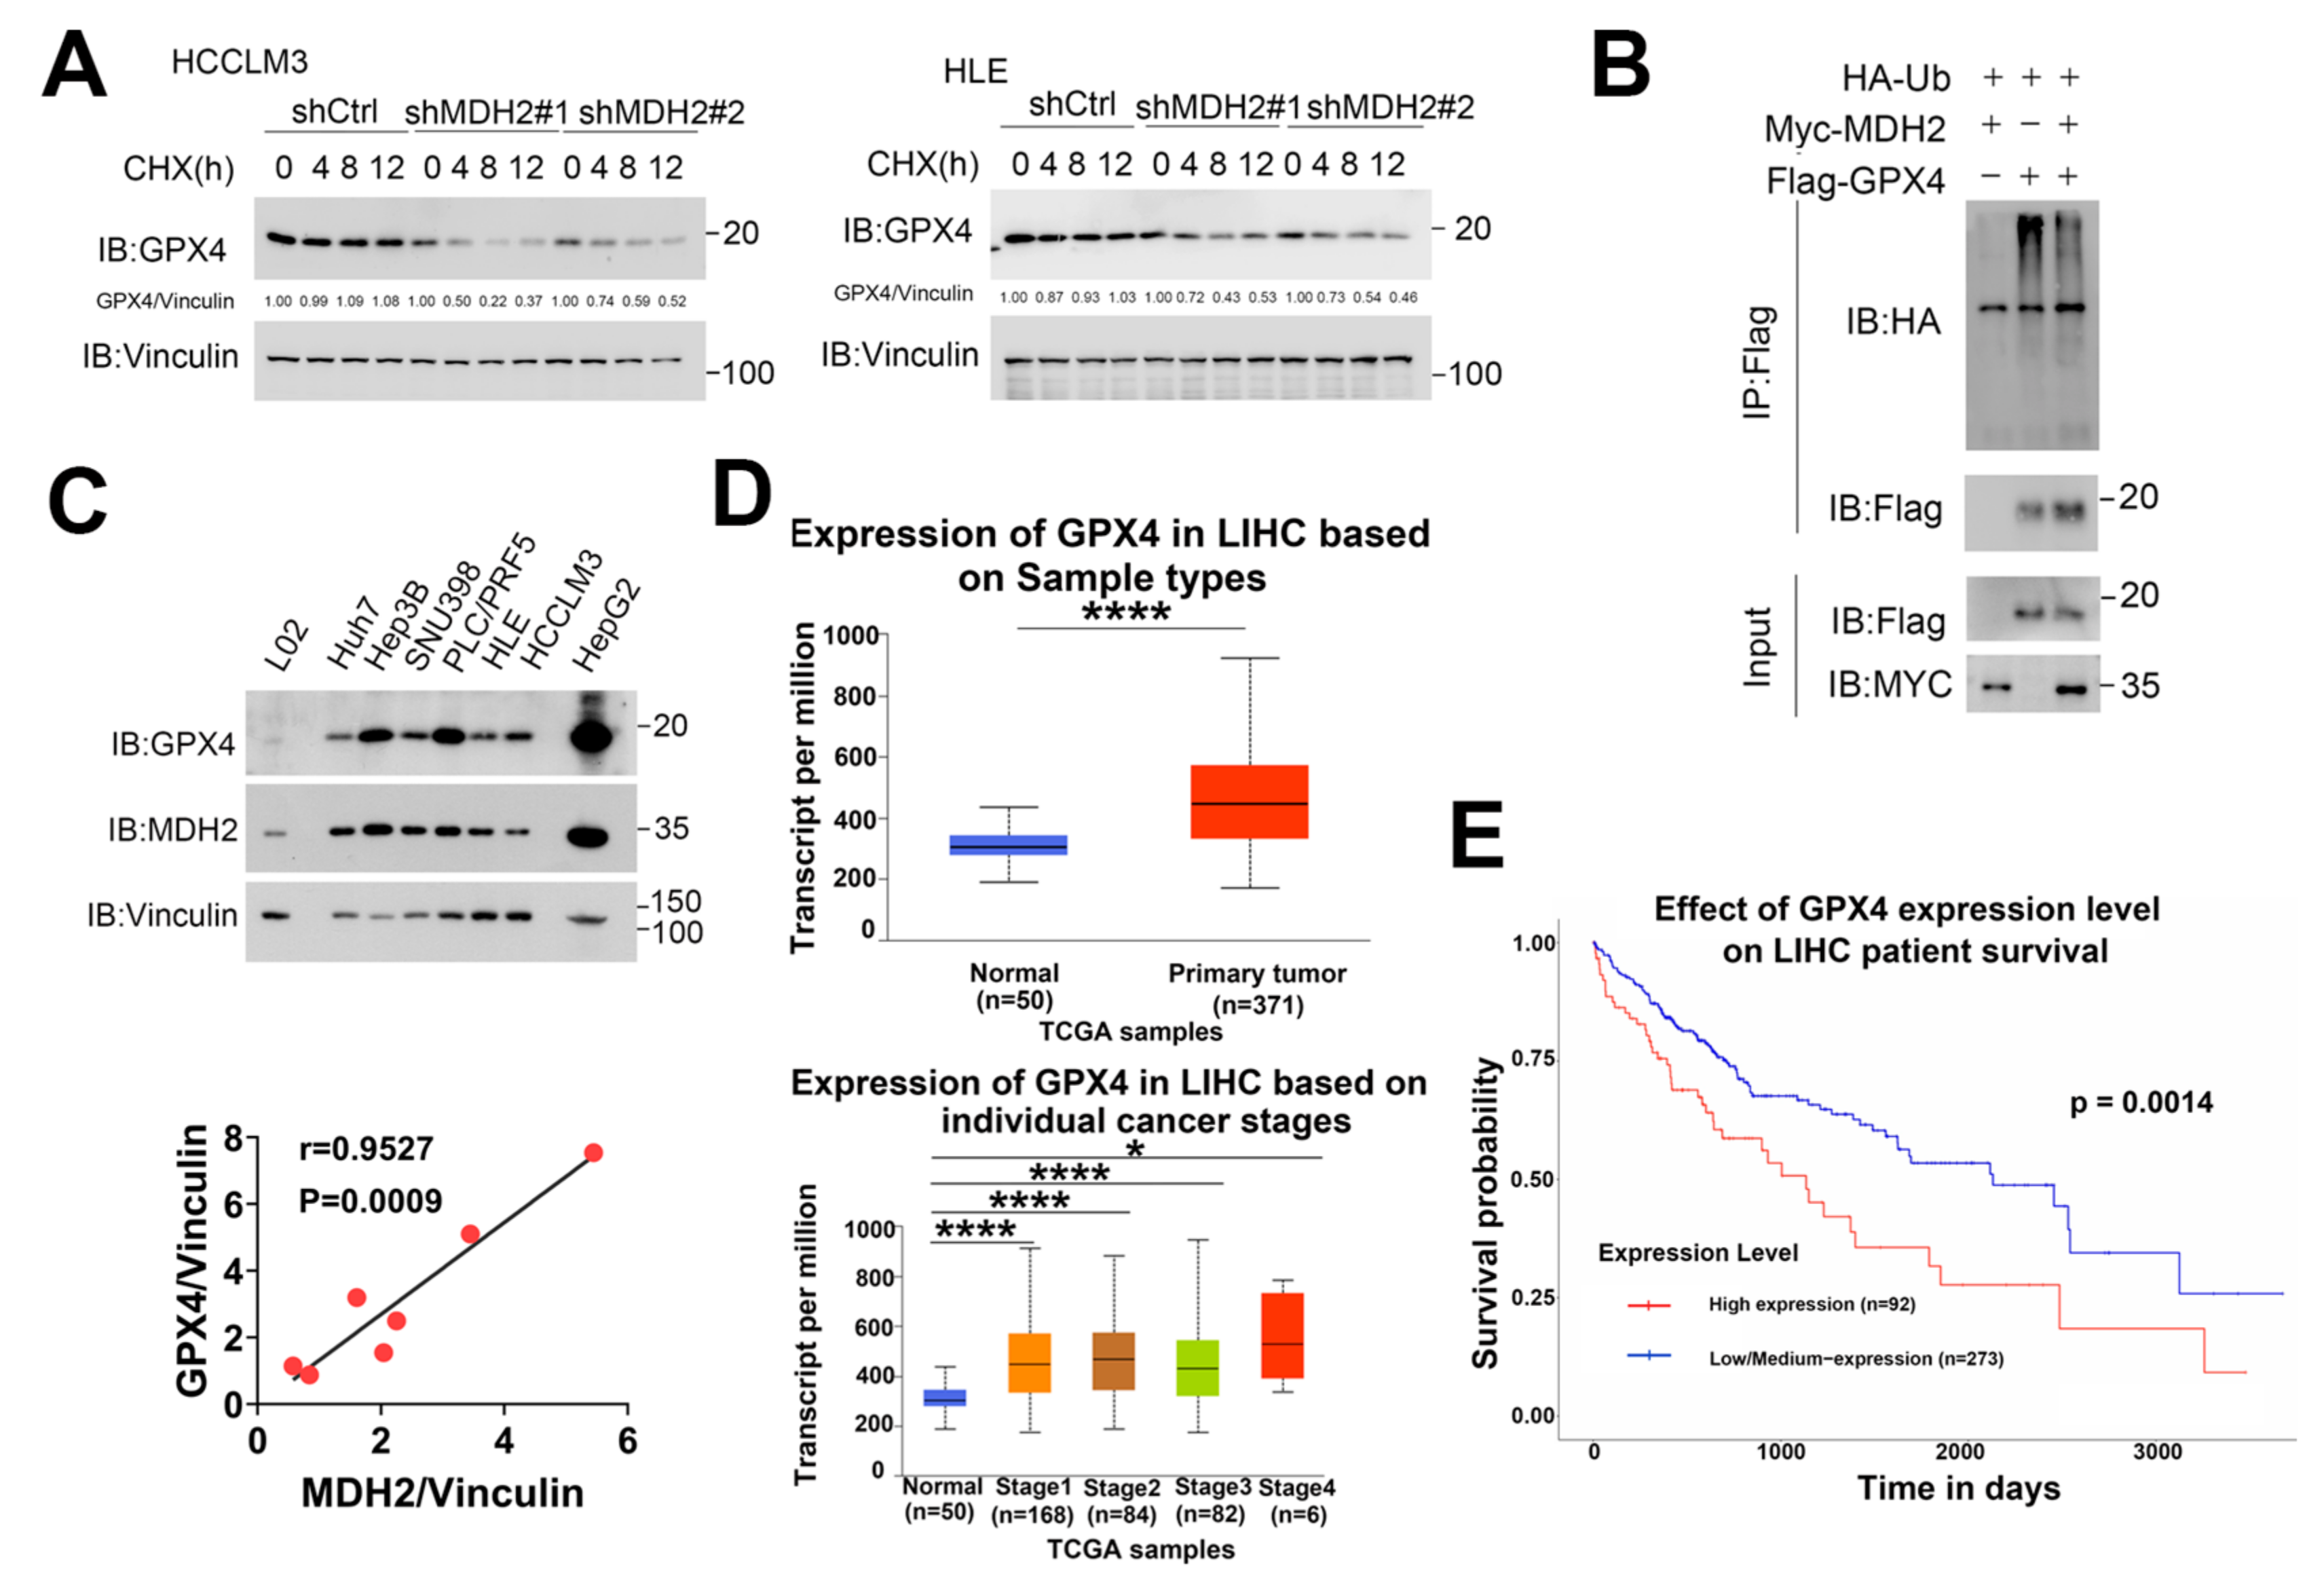
Protein expression can be regulated at post-transcriptional or post-translational levels. To examine the specific molecular mechanism of MDH2 in regulating GPX4 protein level, we treated HCCLM3 and HLE cells with protein synthesis inhibitor cycloheximide (CHX) at different time points, and WB analysis reveals that MDH2 knockdown significantly accelerated GPX4 degradation (Figure 7A), suggesting that MDH2 knockdown may decrease the expression level of GPX4 protein by inhibiting its stability. Protein poly-ubiquitination is the signal to mediate protein degradation, to corroborate these results, we immunoprecipitated exogenously overexpressed GPX4 and found that overexpression of MDH2 inhibited the poly-ubiquitination level of GPX4 (Figure 7B), implying that MDH2 may enhance the stability of GPX4 by inhibiting its ubiquitination-mediated degradation.
Furthermore, GPX4 protein levels are also higher in a panel of HCC cell lines (Huh7, Hep3B, SNU398, PLC/PRF5, HLE, HCCLM3, and HepG2) compared with normal hepatocytes L02 cells (Figure 7C). Of note, Pearson correlation analysis reveals a positive correlation between the expression levels of GPX4 and MDH2 in HCC cells (Figure 7C), indicating a potential functional relationship between these two proteins in HCC. To explore the functional significance of GPX4 in HCC, we analyzed the TCGA database and found that GPX4 expression is generally upregulated in tumor tissue samples from HCC patients compared with normal control tissue (Figure 7D). Moreover, the expression level of GPX4 is positively correlated with cancer stages of HCC (Figure 7D). Importantly, Kaplan-Meier survival analysis demonstrates that HCC patients with high GPX4 expression exhibit shorter survival times (Figure 7E), suggesting the potential clinical relevance of GPX4 as a prognostic marker and therapeutic target in HCC.
In conclusion, this study elucidates the molecular mechanism of MDH2 in regulating GPX4 and its role in inhibiting RSL3-induced ferroptosis in HCC. These findings provides valuable insights into the regulatory mechanism of GPX4 and suggest that targeting the MDH2-GPX4 axis may be a promising strategy for HCC treatment.
4. Discussion
Ferroptosis is a type of programmed cell death that results from iron-mediated membrane lipid peroxidation. Due to activated metabolic activity and higher ROS load in tumor cells, ferroptosis induction is a promising strategy for cancer treatment. MDH2 , the key enzyme in TCA cycle , was ranked first among ferroptosis-related differentially expressed genes in the GSE1428 dataset [11], suggesting it may play a vital role in sarcopenia ferroptosis. However, its role in tumor ferroptosis is elusive. In this study, through analyzing the TCGA database, we found that MDH2 and GPX4 are highly expressed in HCC tissues and its expression are positively correlated with cancer stages of HCC. Knockdown of MDH2 significantly inhibited HCC cell proliferation partially dependent on ferroptosis pathway. Detailed mechanism reveals that knockdown of MDH2 in HCC cells increased RSL3-induced intracellular ROS, Fe2+ and lipid ROS concentrations, thereby sensitizing HCC cells to RSL3-induced ferroptotic cell death. GPX4 and SLC7A11 are two key proteins that mediate ferroptosis evasion. Knockdown of MDH2 decreased GPX4 protein level by impeding its protein stability, and MDH2 knockdown-mediated sensitization of HCC cells to RSL3-induced ferroptosis was rescued by overexpression of GPX4, suggesting that MDH2 regulated HCC ferroptosis pathway mainly via regulation of GPX4. Moreover, the protein levels of MDH2 and GPX4 are positively correlated with each other in HCC cell lines. Taken together, our study reveals a new role of MDH2 in HCC ferroptosis and progression via regulating GPX4, and MDH2, which is highly expressed in HCC, may upregulate GPX4 to mediate ferroptosis evasion, leading to failure of clinical cancer treatment. Therefore, MDH2 inhibition in combination with ferroptosis inducers may provide a promising strategy for HCC treatment.
Despite our results clearly show that MDH2 regulated HCC ferroptosis sensitivity via GPX4, there still remain unanswered scientific questions and potential directions for further exploration. Ferroptosis is a form of programmed cell death characterized by abnormal increases in iron-dependent lipid peroxidation [2]. Within the acidic environment of endosomes, six-transmembrane epithelial antigen of prostate 3 (STEAP3) reduces Fe3+ to Fe2+. Divalent metal transporter 1 (DMT1) facilitates the transport of Fe2+ into the cytoplasm, where it partakes in various physiological functions [21]. Excess iron leads to the generation of ROS through the Fenton reaction [4]. In this study, we observed that knockdown of MDH2 in HCC cells resulted in the accumulation of intracellular Fe2+ levels in HCC cells upon RSL3 treatment. Due to the important role of MDH2 in cellular metabolism, MDH2 deficiency may lead to dysregulated of cellular iron metabolism or iron transport, and further studies should clarify this detailed mechanism.
Furthermore, mitochondria play an important role in ferroptosis, so it is crucial to conduct further investigations to elucidate whether knockdown of the mitochondrial enzyme MDH2 influences the occurrence of ferroptosis by perturbing mitochondrial integrity and function. These studies will contribute to a more comprehensive understanding of the role of MDH2 in regulating ferroptosis and its potential impact on mitochondrial dynamics. In addition, although the findings suggested that MDH2 played a role in ferroptosis resistance by stabilizing GPX4, the precise regulatory mechanism of MDH2 on GPX4 stability requires further study.
Figure 8.
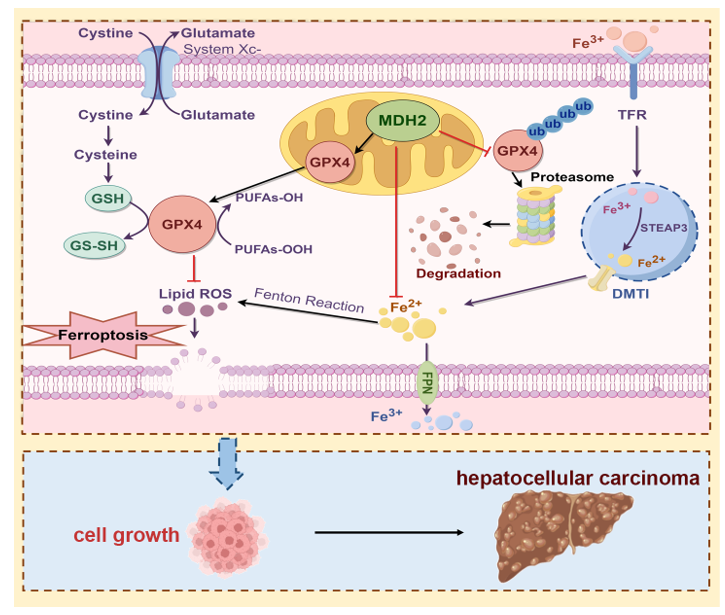
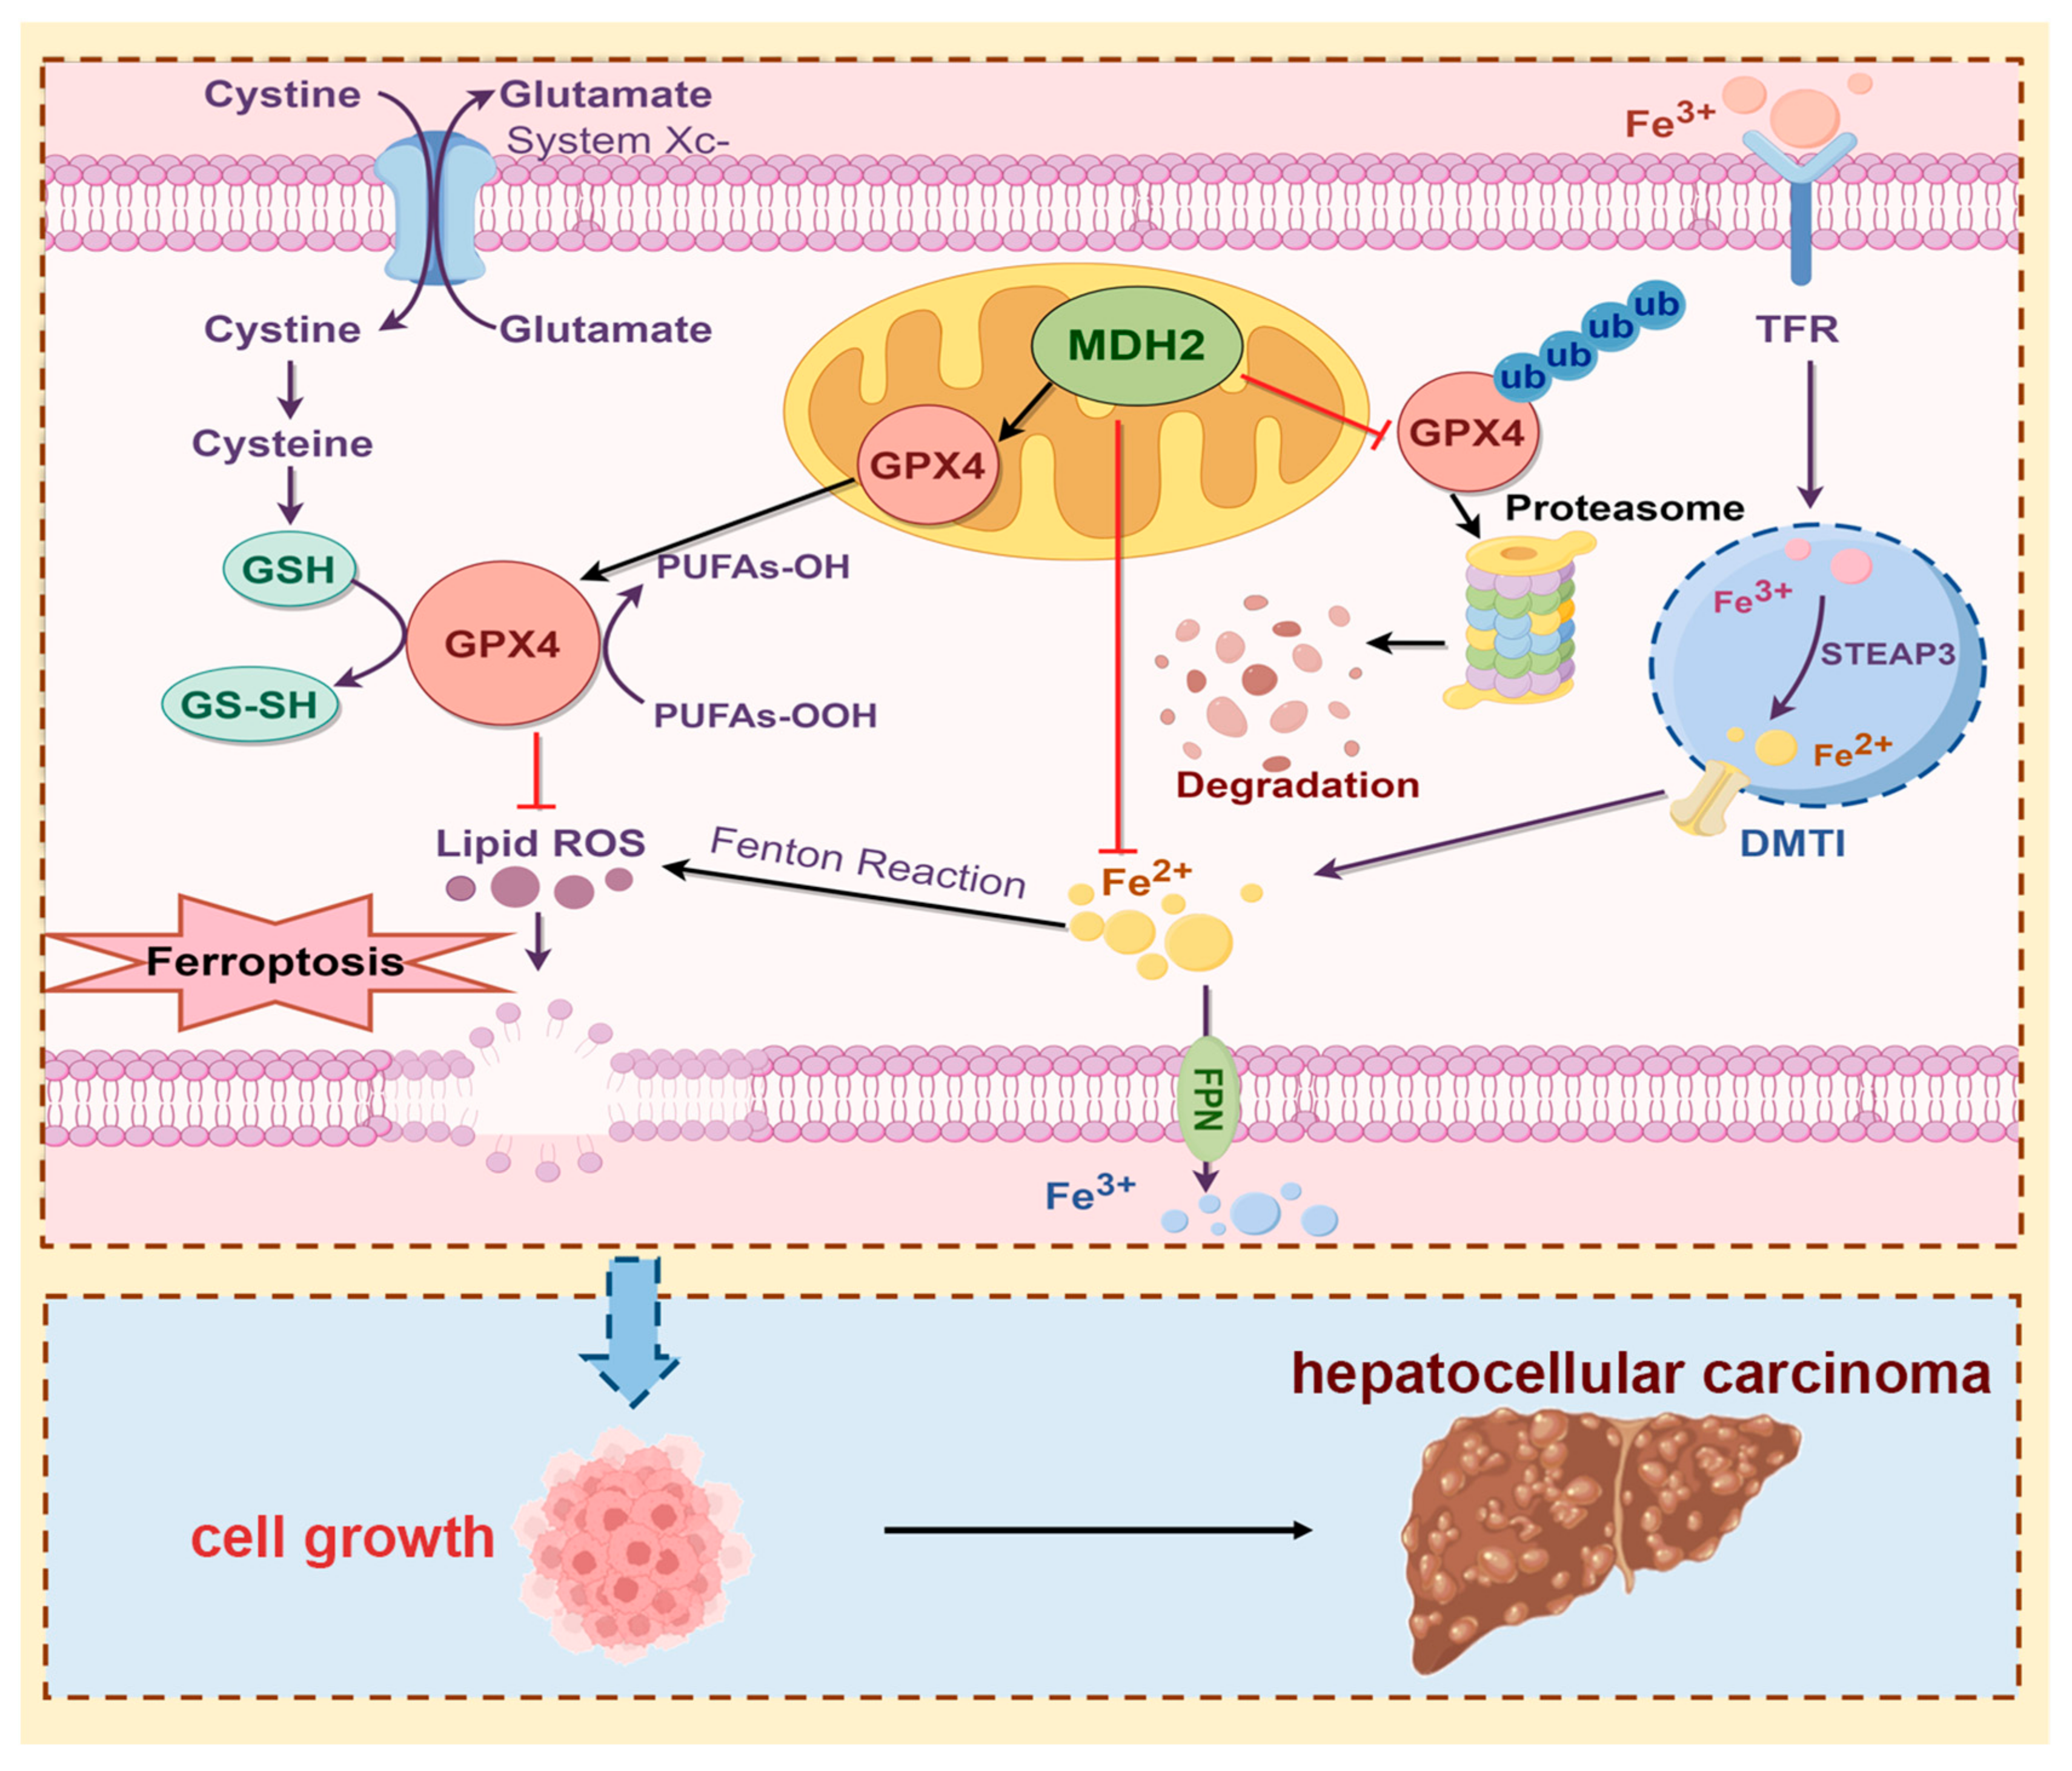
Schematic overview of the proposed mechanism whereby MDH2 promotes HCC progression via mediating ferroptosis evasion. Highly expressed MDH2 in HCC can reduce GPX4 ubiquitination and degradation to eliminate lipid ROS, leading to resistance to ferroptosis. On the other hand, MDH2 also plays a vital role in intracellular iron homeostasis to eradicate lipid ROS production via Fenton reaction inhibition. Overall, the function of ferroptosis evasion mediated MDH2 promotes HCC progression.
Figure 8.
Schematic overview of the proposed mechanism whereby MDH2 promotes HCC progression via mediating ferroptosis evasion. Highly expressed MDH2 in HCC can reduce GPX4 ubiquitination and degradation to eliminate lipid ROS, leading to resistance to ferroptosis. On the other hand, MDH2 also plays a vital role in intracellular iron homeostasis to eradicate lipid ROS production via Fenton reaction inhibition. Overall, the function of ferroptosis evasion mediated MDH2 promotes HCC progression.
5. Conclusions
Our study provides new insights into the role of MDH2 in HCC, demonstrating its function in inhibiting ferroptosis through GPX4 stabilization, thereby promoting HCC cell growth. These findings offer novel targets and strategies for HCC treatment. Further investigation into the regulatory mechanisms of MDH2 in HCC development and exploration of therapeutic approaches targeting MDH2 and ferroptosis are warranted.
Author Contributions
Conceptualization, X.B. and W.Y.; methodology, W.Y. and Y.L.; software, B.D. and W.Y.; validation, H.Y.; formal analysis, L.H.; investigation, C.G.; resources, W.Y.; data curation, W.Y.; writing—original draft preparation, X.B. and W.Y.; writing—review and editing, X.B.; visualization, Y.L.; supervision, X.B.; project administration, X.B.; funding acquisition, X.B. All authors have read and agreed to the published version of the manuscript.
Funding
This research was funded by the Talent Plan of Jiangxi Province of China (jxsq2023101080), National Natural Science Foundation of China (32370829, 82360516) and the Outstanding Youth Fund of Jiangxi Province (20224ACB216010).
Institutional Review Board Statement
Not applicable.
Informed Consent Statement
Not applicable.
Data Availability Statement
The data presented in this study are available on request from the corresponding author.
Conflicts of Interest
The authors declare no conflicts of interest.
References
- Forner, M. Reig, J. Bruix, Hepatocellular carcinoma, Lancet, 391 (2018) 1301-1314. [CrossRef]
- S.J. Dixon, K.M. Lemberg, M.R. Lamprecht, R. Skouta, E.M. Zaitsev, C.E. Gleason, D.N. Patel, A.J. Bauer, A.M. Cantley, W.S. Yang, B. Morrison, 3rd, B.R. Stockwell, Ferroptosis: An iron-dependent form of nonapoptotic cell death, Cell, 149 (2012) 1060-1072. [CrossRef]
- K. Hadian, B.R. Stockwell, SnapShot: Ferroptosis, Cell, 181 (2020) 1188-1188.e1181. [CrossRef]
- Hassannia, P. Vandenabeele, T. Vanden Berghe, Targeting Ferroptosis to Iron Out Cancer, Cancer Cell, 35 (2019) 830-849. [CrossRef]
- F. Wang, H. Lv, B. Zhao, L. Zhou, S. Wang, J. Luo, J. Liu, P. Shang, Iron and leukemia: New insights for future treatments, J Exp Clin Cancer Res, 38 (2019) 406. [CrossRef]
- S. Doll, M. Conrad, Iron and ferroptosis: A still ill-defined liaison, IUBMB Life, 69 (2017) 423-434. [CrossRef]
- J. Nie, B. Lin, M. Zhou, L. Wu, T. Zheng, Role of ferroptosis in hepatocellular carcinoma, J Cancer Res Clin Oncol, 144 (2018) 2329-2337. [CrossRef]
- Dupourque, E. Kun, Malate dehydrogenases of ox kidney. 2. Two substrate kinetic and inhibition analyses, Eur J Biochem, 7 (1969) 247-252. [CrossRef]
- Jochmanová, Z. Zhuang, K. Pacak, Pheochromocytoma: Gasping for Air, Horm Cancer, 6 (2015) 191-205. [CrossRef]
- J. Gao, Q. Zhou, D. Wu, L. Chen, Mitochondrial iron metabolism and its role in diseases, Clin Chim Acta, 513 (2021) 6-12. [CrossRef]
- Y. Chen, Y. Zhang, S. Zhang, H. Ren, Molecular insights into sarcopenia: Ferroptosis-related genes as diagnostic and therapeutic targets, J Biomol Struct Dyn, (2024) 1-19. [CrossRef]
- P.P. Hou, L.J. Luo, H.Z. Chen, Q.T. Chen, X.L. Bian, S.F. Wu, J.X. Zhou, W.X. Zhao, J.M. Liu, X.M. Wang, Z.Y. Zhang, L.M. Yao, Q. Chen, D. Zhou, Q. Wu, Ectosomal PKM2 Promotes HCC by Inducing Macrophage Differentiation and Remodeling the Tumor Microenvironment, Mol Cell, 78 (2020) 1192-1206.e1110. [CrossRef]
- X.L. Bian, H.Z. Chen, P.B. Yang, Y.P. Li, F.N. Zhang, J.Y. Zhang, W.J. Wang, W.X. Zhao, S. Zhang, Q.T. Chen, Y. Zheng, X.Y. Sun, X.M. Wang, K.Y. Chien, Q. Wu, Nur77 suppresses hepatocellular carcinoma via switching glucose metabolism toward gluconeogenesis through attenuating phosphoenolpyruvate carboxykinase sumoylation, Nat Commun, 8 (2017) 14420. [CrossRef]
- Xu, F. Shao, X. Bian, Y. Meng, T. Liang, Z. Lu, The Evolving Landscape of Noncanonical Functions of Metabolic Enzymes in Cancer and Other Pathologies, Cell Metab, 33 (2021) 33-50. [CrossRef]
- X. Jiang, B.R. Stockwell, M. Conrad, Ferroptosis: Mechanisms, biology and role in disease, Nat Rev Mol Cell Biol, 22 (2021) 266-282. [CrossRef]
- M.A. Badgley, D.M. Kremer, H.C. Maurer, K.E. DelGiorno, H.J. Lee, V. Purohit, I.R. Sagalovskiy, A. Ma, J. Kapilian, C.E.M. Firl, A.R. Decker, S.A. Sastra, C.F. Palermo, L.R. Andrade, P. Sajjakulnukit, L. Zhang, Z.P. Tolstyka, T. Hirschhorn, C. Lamb, T. Liu, W. Gu, E.S. Seeley, E. Stone, G. Georgiou, U. Manor, A. Iuga, G.M. Wahl, B.R. Stockwell, C.A. Lyssiotis, K.P. Olive, Cysteine depletion induces pancreatic tumor ferroptosis in mice, Science, 368 (2020) 85-89. [CrossRef]
- P. Koppula, Y. Zhang, L. Zhuang, B. Gan, Amino acid transporter SLC7A11/xCT at the crossroads of regulating redox homeostasis and nutrient dependency of cancer, Cancer Commun (Lond), 38 (2018) 12. [CrossRef]
- Tang, G. Kroemer, Ferroptosis, Curr Biol, 30 (2020) R1292-r1297. [CrossRef]
- G.C. Forcina, S.J. Dixon, GPX4 at the Crossroads of Lipid Homeostasis and Ferroptosis, Proteomics, 19 (2019) e1800311. [CrossRef]
- A.S. Reisch, O. Elpeleg, Biochemical assays for mitochondrial activity: Assays of TCA cycle enzymes and PDHc, Methods Cell Biol, 80 (2007) 199-222. [CrossRef]
- D.L. Abeyawardhane, H.R. Lucas, Iron Redox Chemistry and Implications in the Parkinson's Disease Brain, Oxid Med Cell Longev, 2019 (2019) 4609702. [CrossRef]
Figure 1.
MDH2 promotes HCC cell proliferation. (A,B) Expression of MDH2 in normal liver tissues and primary LIHC (liver hepatocellular carcinoma) tissues (A) or LIHC tissue at different stages obtained from the TCGA database (B). (C,D) MDH2 protein levels was detected by Western blotting, with Vinculin as a loading control. (E) Cell proliferation assays were performed in control (shCtrl) and MDH2 knockdown (shMDH2#1,shMDH2#2) HCC cells (3000 cells/well) on culture plates at days 0, 2, 4, and 6. Cells were stained with crystal violet followed by dissolving with 10% glacial acetic acid, absorbance at 595 nm was measured and calculated. (F) Indicated cells were seeded in a 6-well plate (500 cells/well), cultured for 10 days and then stained with crystal violet and photographed. Data are represented as the mean±SD (n=3); The results were evaluated with Student’s t-test; ns means not significant; *P < 0.05; **P < 0.01; ***P < 0.001; ****P < 0.0001.
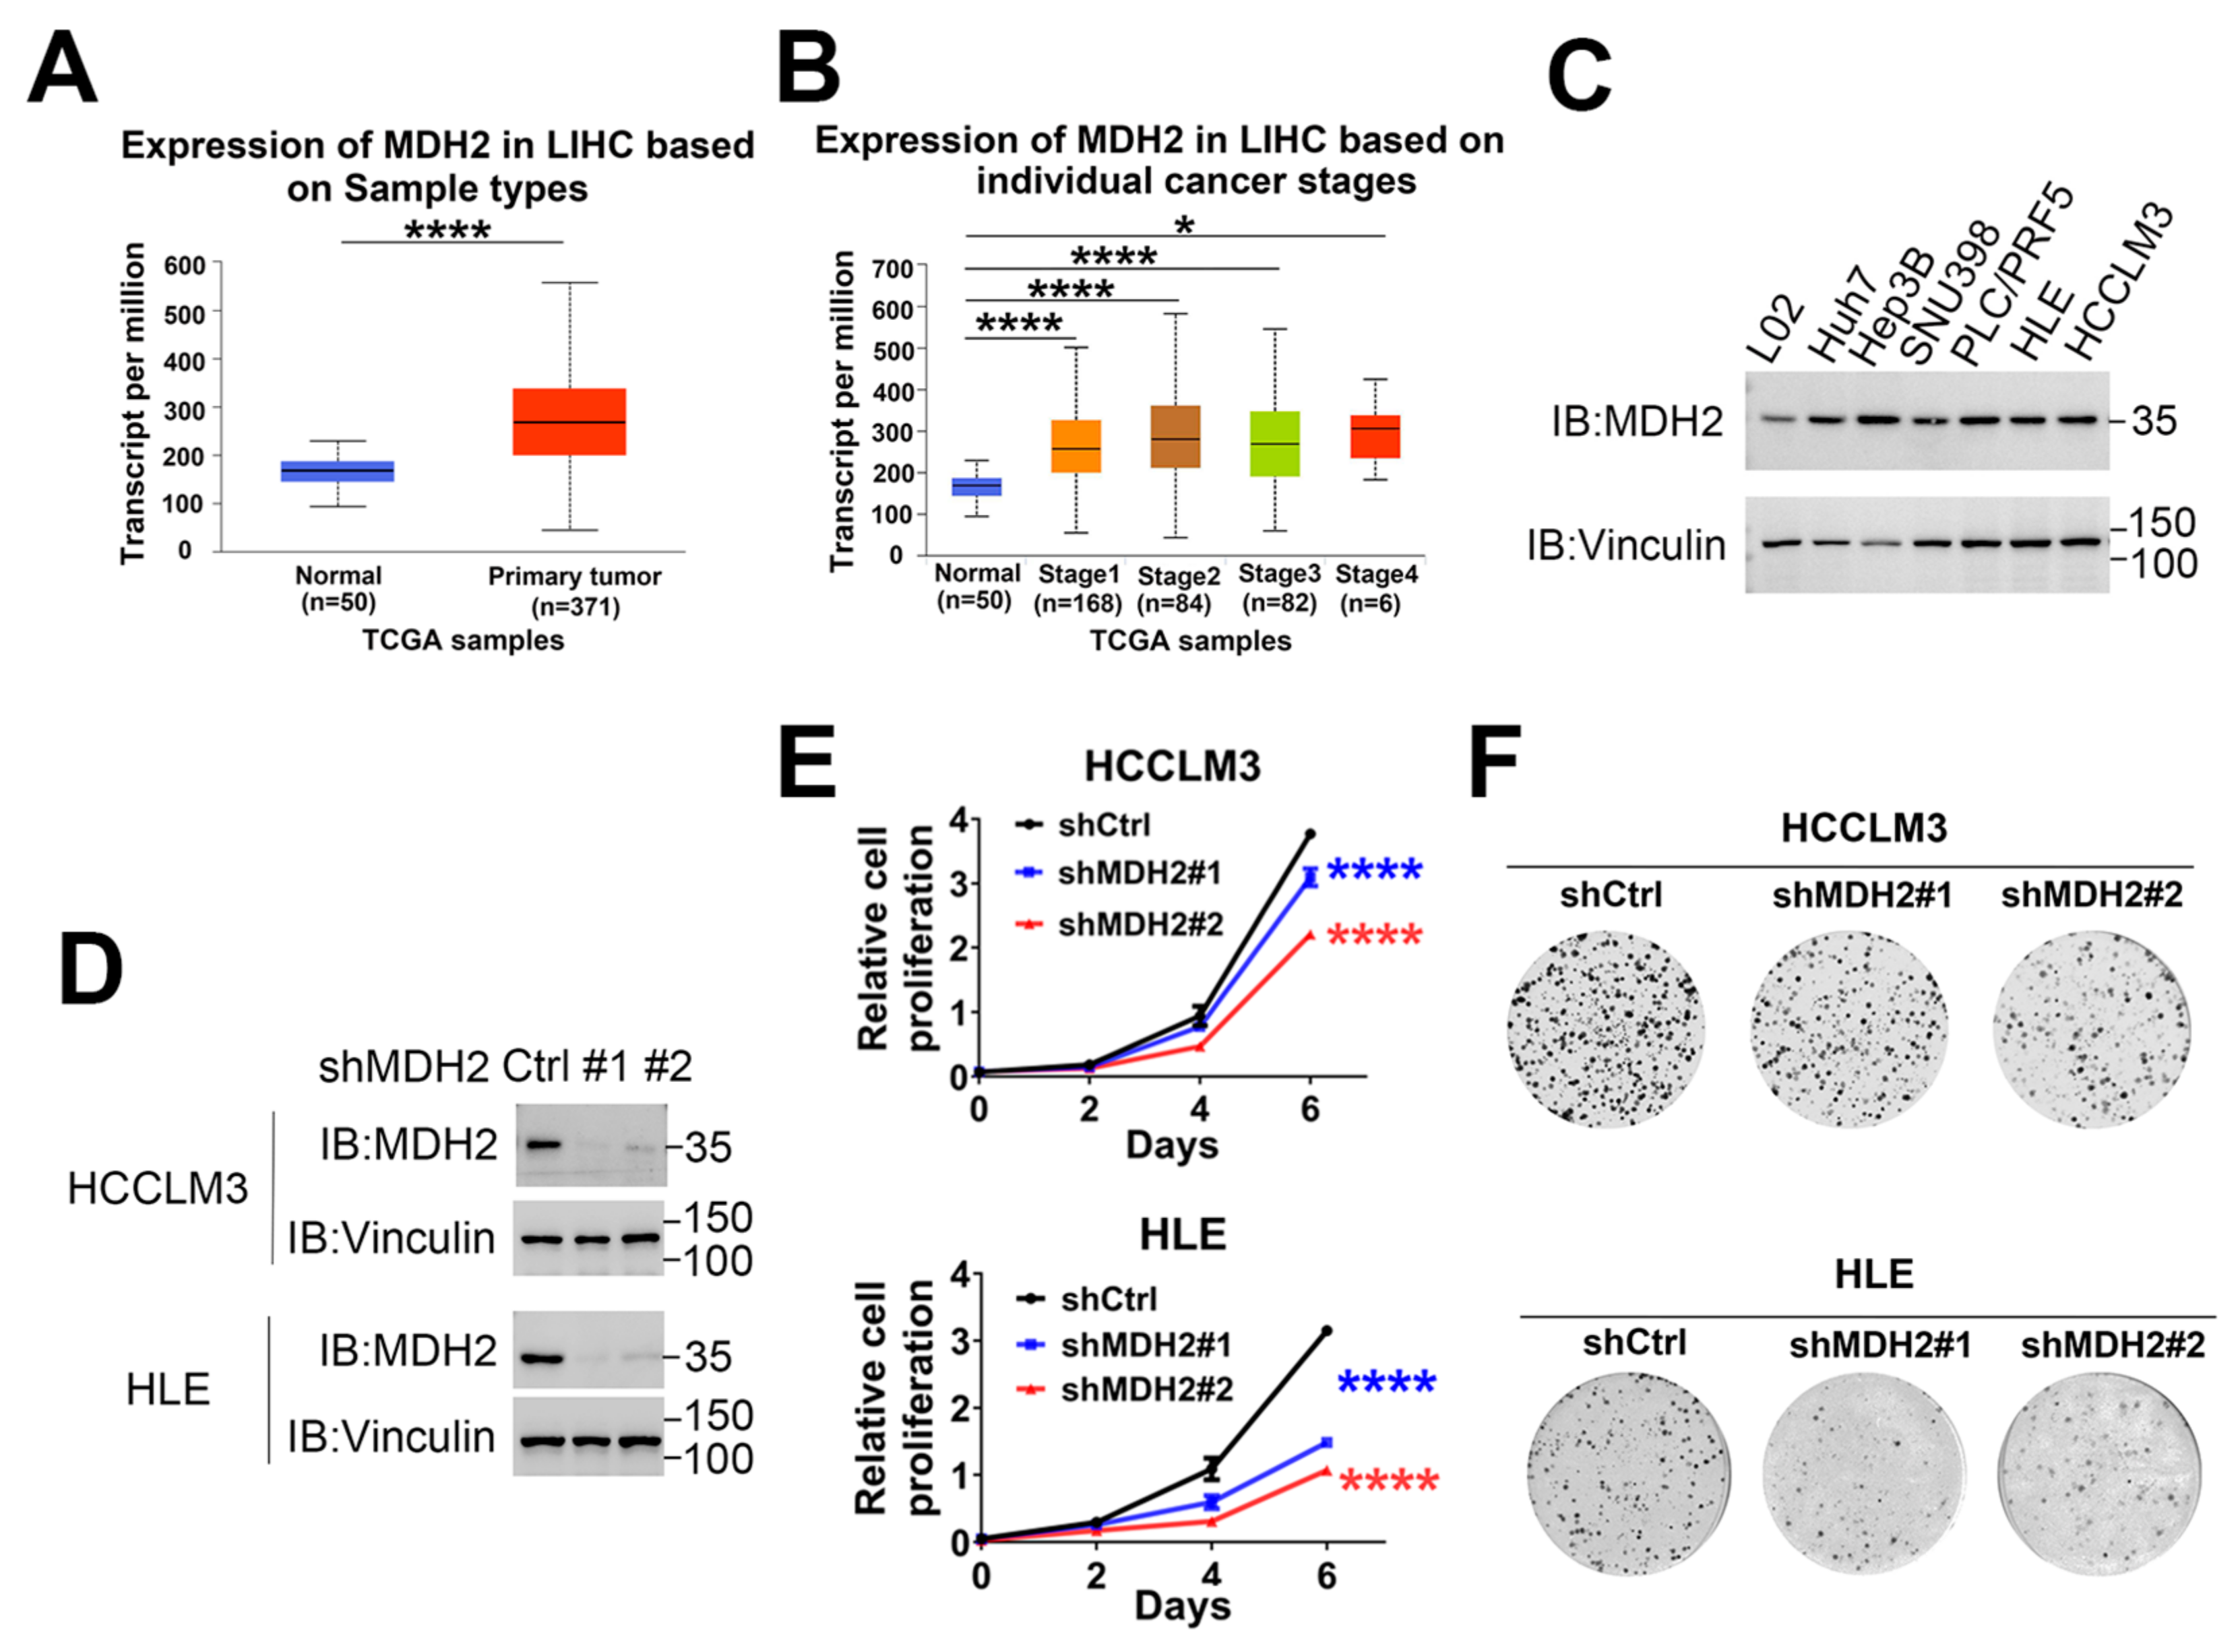
Figure 2.
Knockdown of MDH2 increases RSL3-induced HCC cell death. (A) Control (shCtrl) and MDH2-knockdown (shMDH2#1,shMDH2#2) HCC cells were treated with the indicated RSL3 concentrations for 48 hours, and cell viability was assessed using the CCK-8 assay and IC50 values were calculated. (B) Control (shCtrl) and MDH2-knockdown (shMDH2#1,shMDH2#2) HCC cells treated with or without 5μM RSL3 for 24 hours were photographed and representative images are shown. (C) Control (shCtrl) and MDH2-knockdown (shMDH2#1,shMDH2#2) HCC cells treated with or without 5μM RSL3 for 24 hours were collected for PI staining and assayed by flow cytometry (top). Cell death rates were calculated and shown in bar graph (bottom). (D) MDH2 protein levels in control (NC) and MDH2-overexpression (MDH2-OE) HCC cells were assessed by Western blotting, with Vinculin as a loading control. (E) Representative photographs of control (NC) and MDH2-overexpression (MDH2-OE) HCC cells treated with 5μM RSL3 for 24 hours. (F) Control (NC) and MDH2-overexpression (MDH2-OE) HCC cells were treated with or without 5μM RSL3 for 24 hours were collected for PI staining and assayed by flow cytometry (top). Cell death rates were calculated and shown in bar graph (bottom).
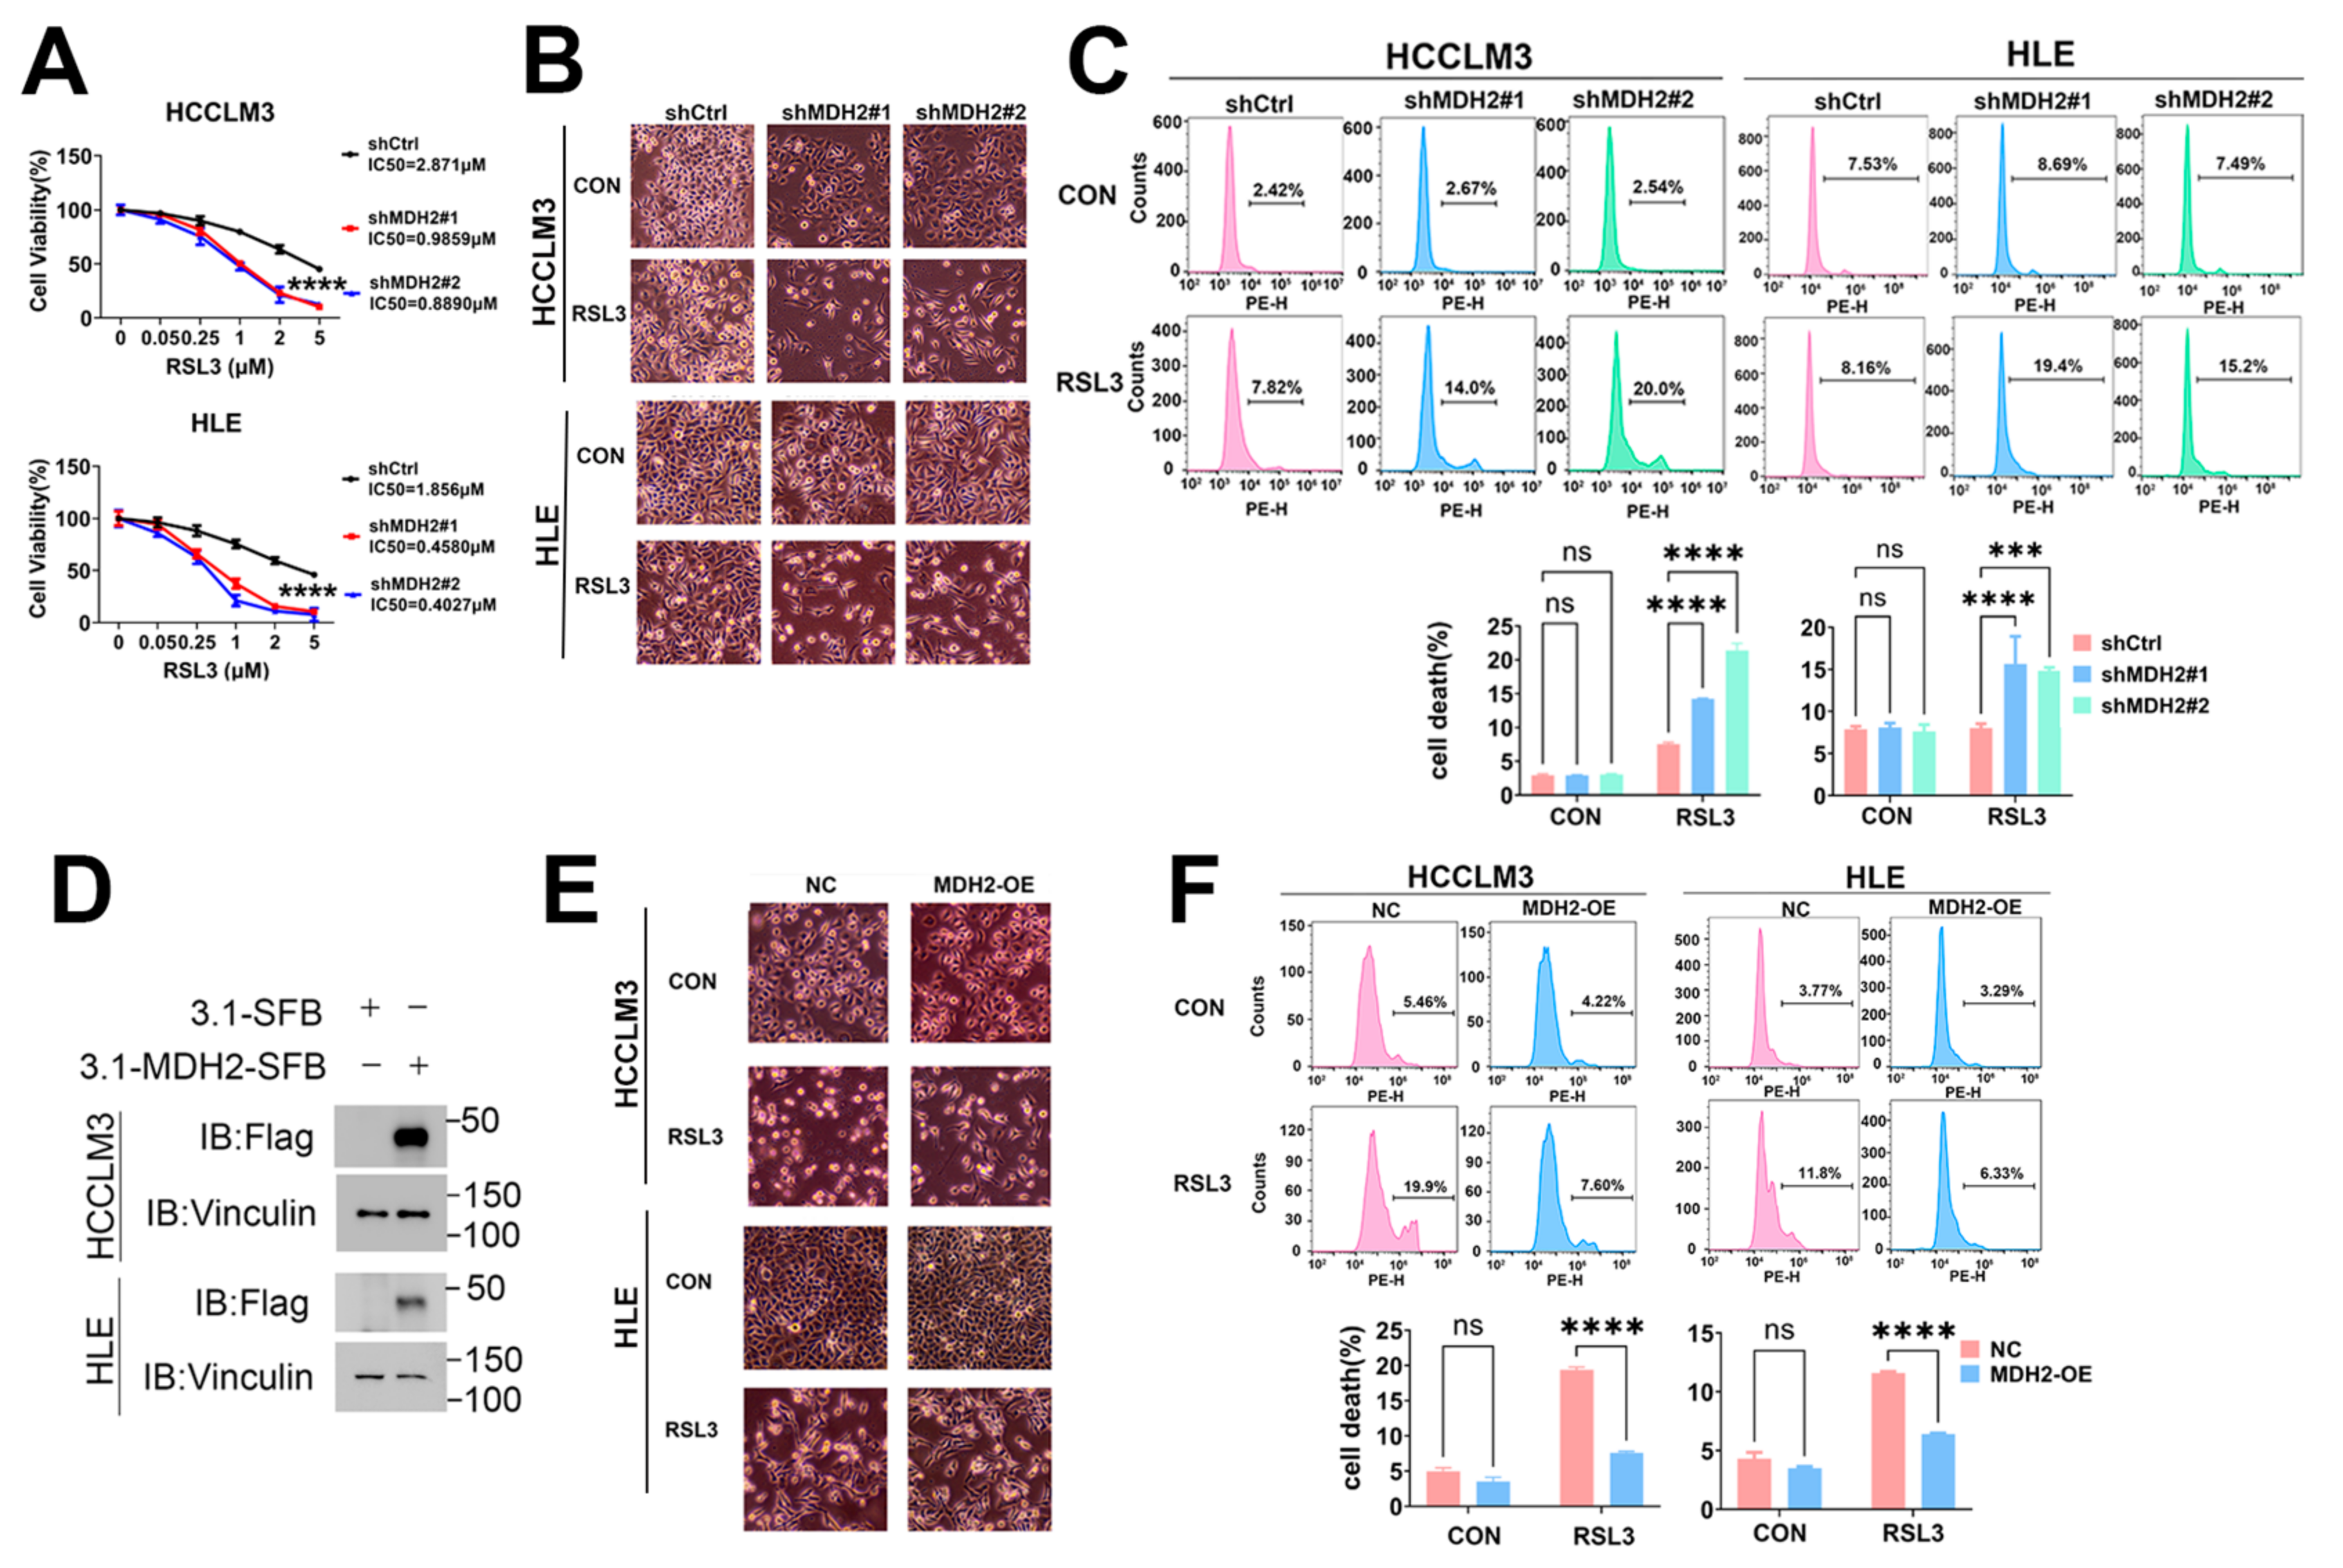
Figure 3.
MDH2 knockdown sensitizes RSL3-induced HCC cell death via upregulated reactive oxygen species. (A) Control (shCtrl) and MDH2-knockdown (shMDH2#1,shMDH2#2) HCC cells treated with or without 5μM RSL3 for 6 hours were stained with 10μM DCFH-DA probe for ROS assay using flow cytometry (top). Normalized ROS levels for the indicated cells are shown in the bar graph (bottom). (B) Control (shCtrl) and MDH2-knockdown (shMDH2#1,shMDH2#2) HCC cells treated with or without 5μM RSL3 or 5μM N-acetyl-L-cysteine (NAC) for 48 hours were photographed and representative images are shown. (C) Control (shCtrl) and MDH2-knockdown (shMDH2#1,shMDH2#2) HCC cells treated with or without 5μM RSL3 or 5μM N-acetyl-L-cysteine (NAC) for 48 hours were collected for PI staining and assayed by flow cytometry (left). Cell death rates were calculated and shown in bar graph (right).
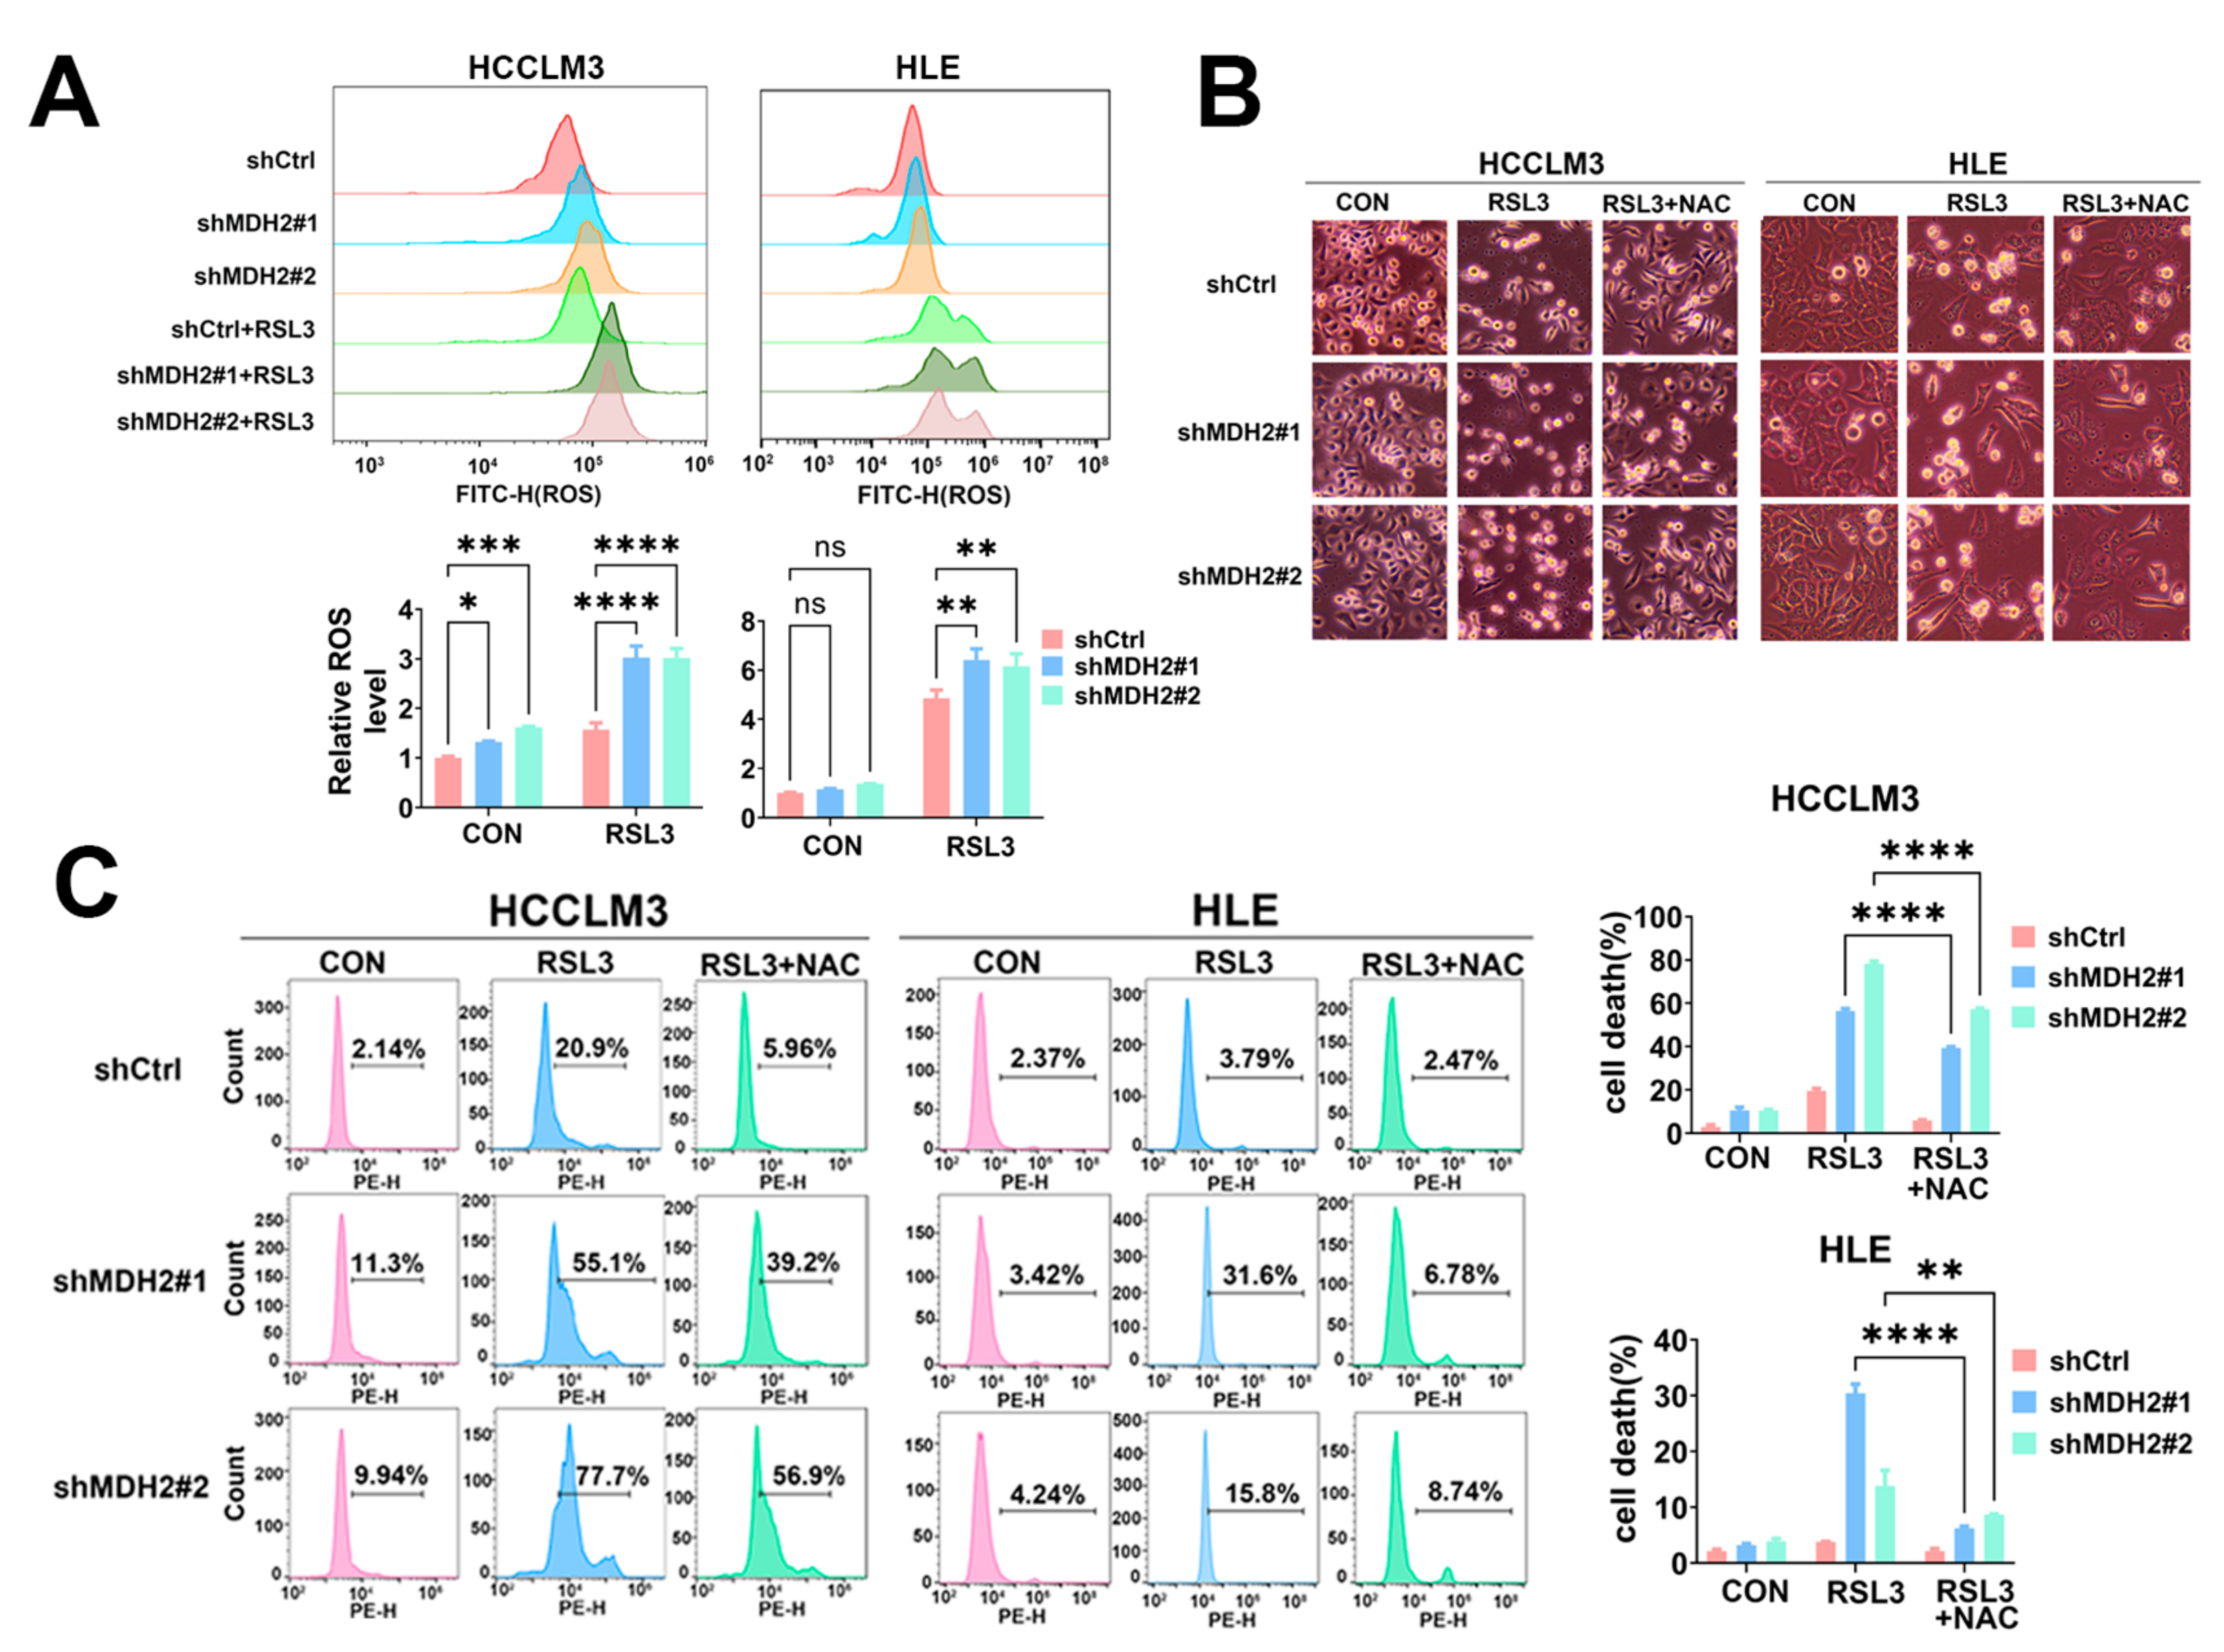
Figure 4.
MDH2 knockdown sensitizes RSL3-induced ferroptosis. (A,B) Control (shCtrl) and MDH2-knockdown (shMDH2#1,shMDH2#2) HCC cells treated with or without 5μM RSL3 for 6 hours were stained with 10μM PGSK probe for Fe2+ assay (A) and stained with 10μM C11-BODIPY581/591 for lipid ROS assay (B) followed by flow cytometry analysis (top). Normalized Fe2+ levels (A) and lipid ROS levels (B) for the indicated cells are shown in the bar graph (bottom). (C) Control (shCtrl) and MDH2-knockdown (shMDH2#1,shMDH2#2) HCC cells treated with or without 5μM RSL3, 2μM Ferrostatin-1 (Fer-1) or 50μM Deferiprone (DFP) for 48 hours were photographed and representative pictures are shown. (D) Control (shCtrl) and MDH2-knockdown (shMDH2#1,shMDH2#2) HCC cells treated with or without 5μM RSL3, 2μM Ferrostatin-1 (Fer-1) or 50μM Deferiprone (DFP) for 48 hours were collected for PI staining and assayed by flow cytometry (left). Cell death rates were calculated and shown in bar graph (right).
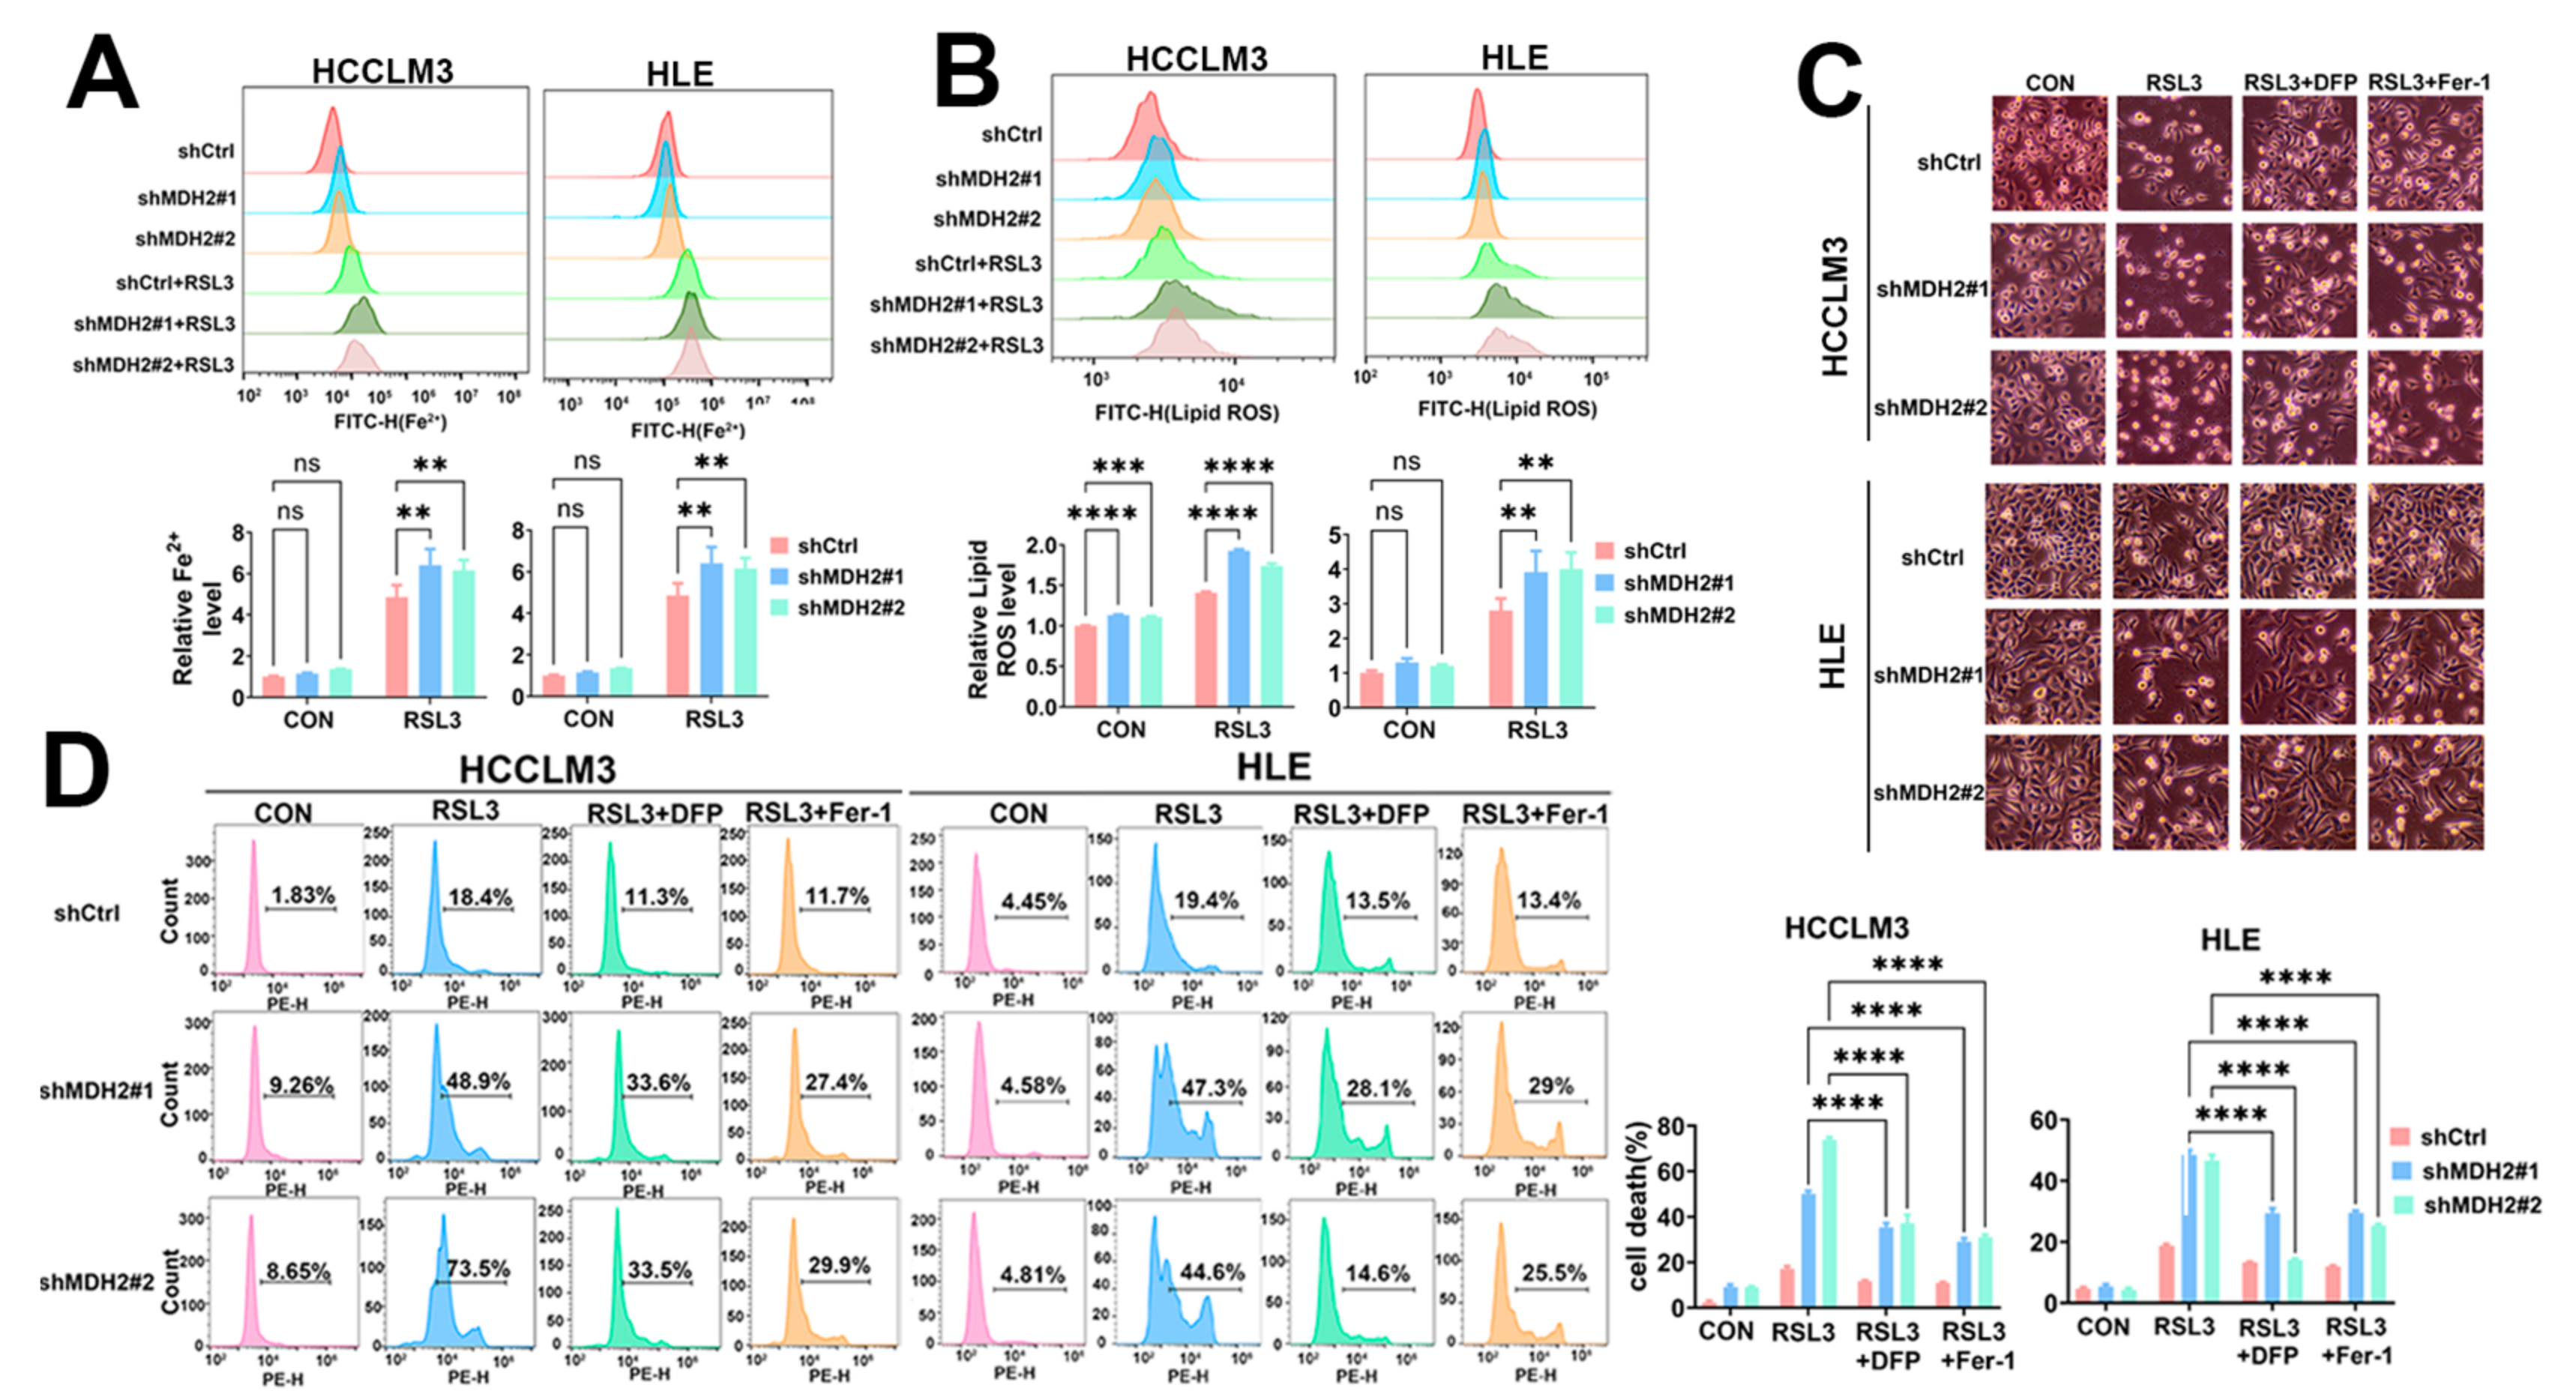
Figure 5.
Knockdown of MDH2 inhibits HCC cell growth partially dependent on ferroptosis induction. (A) Cell proliferation assays were performed on control (shCtrl) and MDH2 knockdown (shMDH2#1,shMDH2#2) HCC cells (3000 cells/well) with or without 0.5μM Ferrostatin-1 (Fer-1) on culture plates at days 0, 2, 4, and 6. Cells were stained with crystal violet followed by dissolving with 10% glacial acetic acid, absorbance at 595 nm was measured and calculated. (B) Control (shCtrl) and MDH2 knockdown (shMDH2#1,shMDH2#2) HCC cells were seeded in a 6-well plate (500 cells/well) and cultured with or without 0.5μM Ferrostatin-1 (Fer-1) treatment for 10 days and then stained with crystal violet and photographed (left), the colony number was calculated and shown (right).
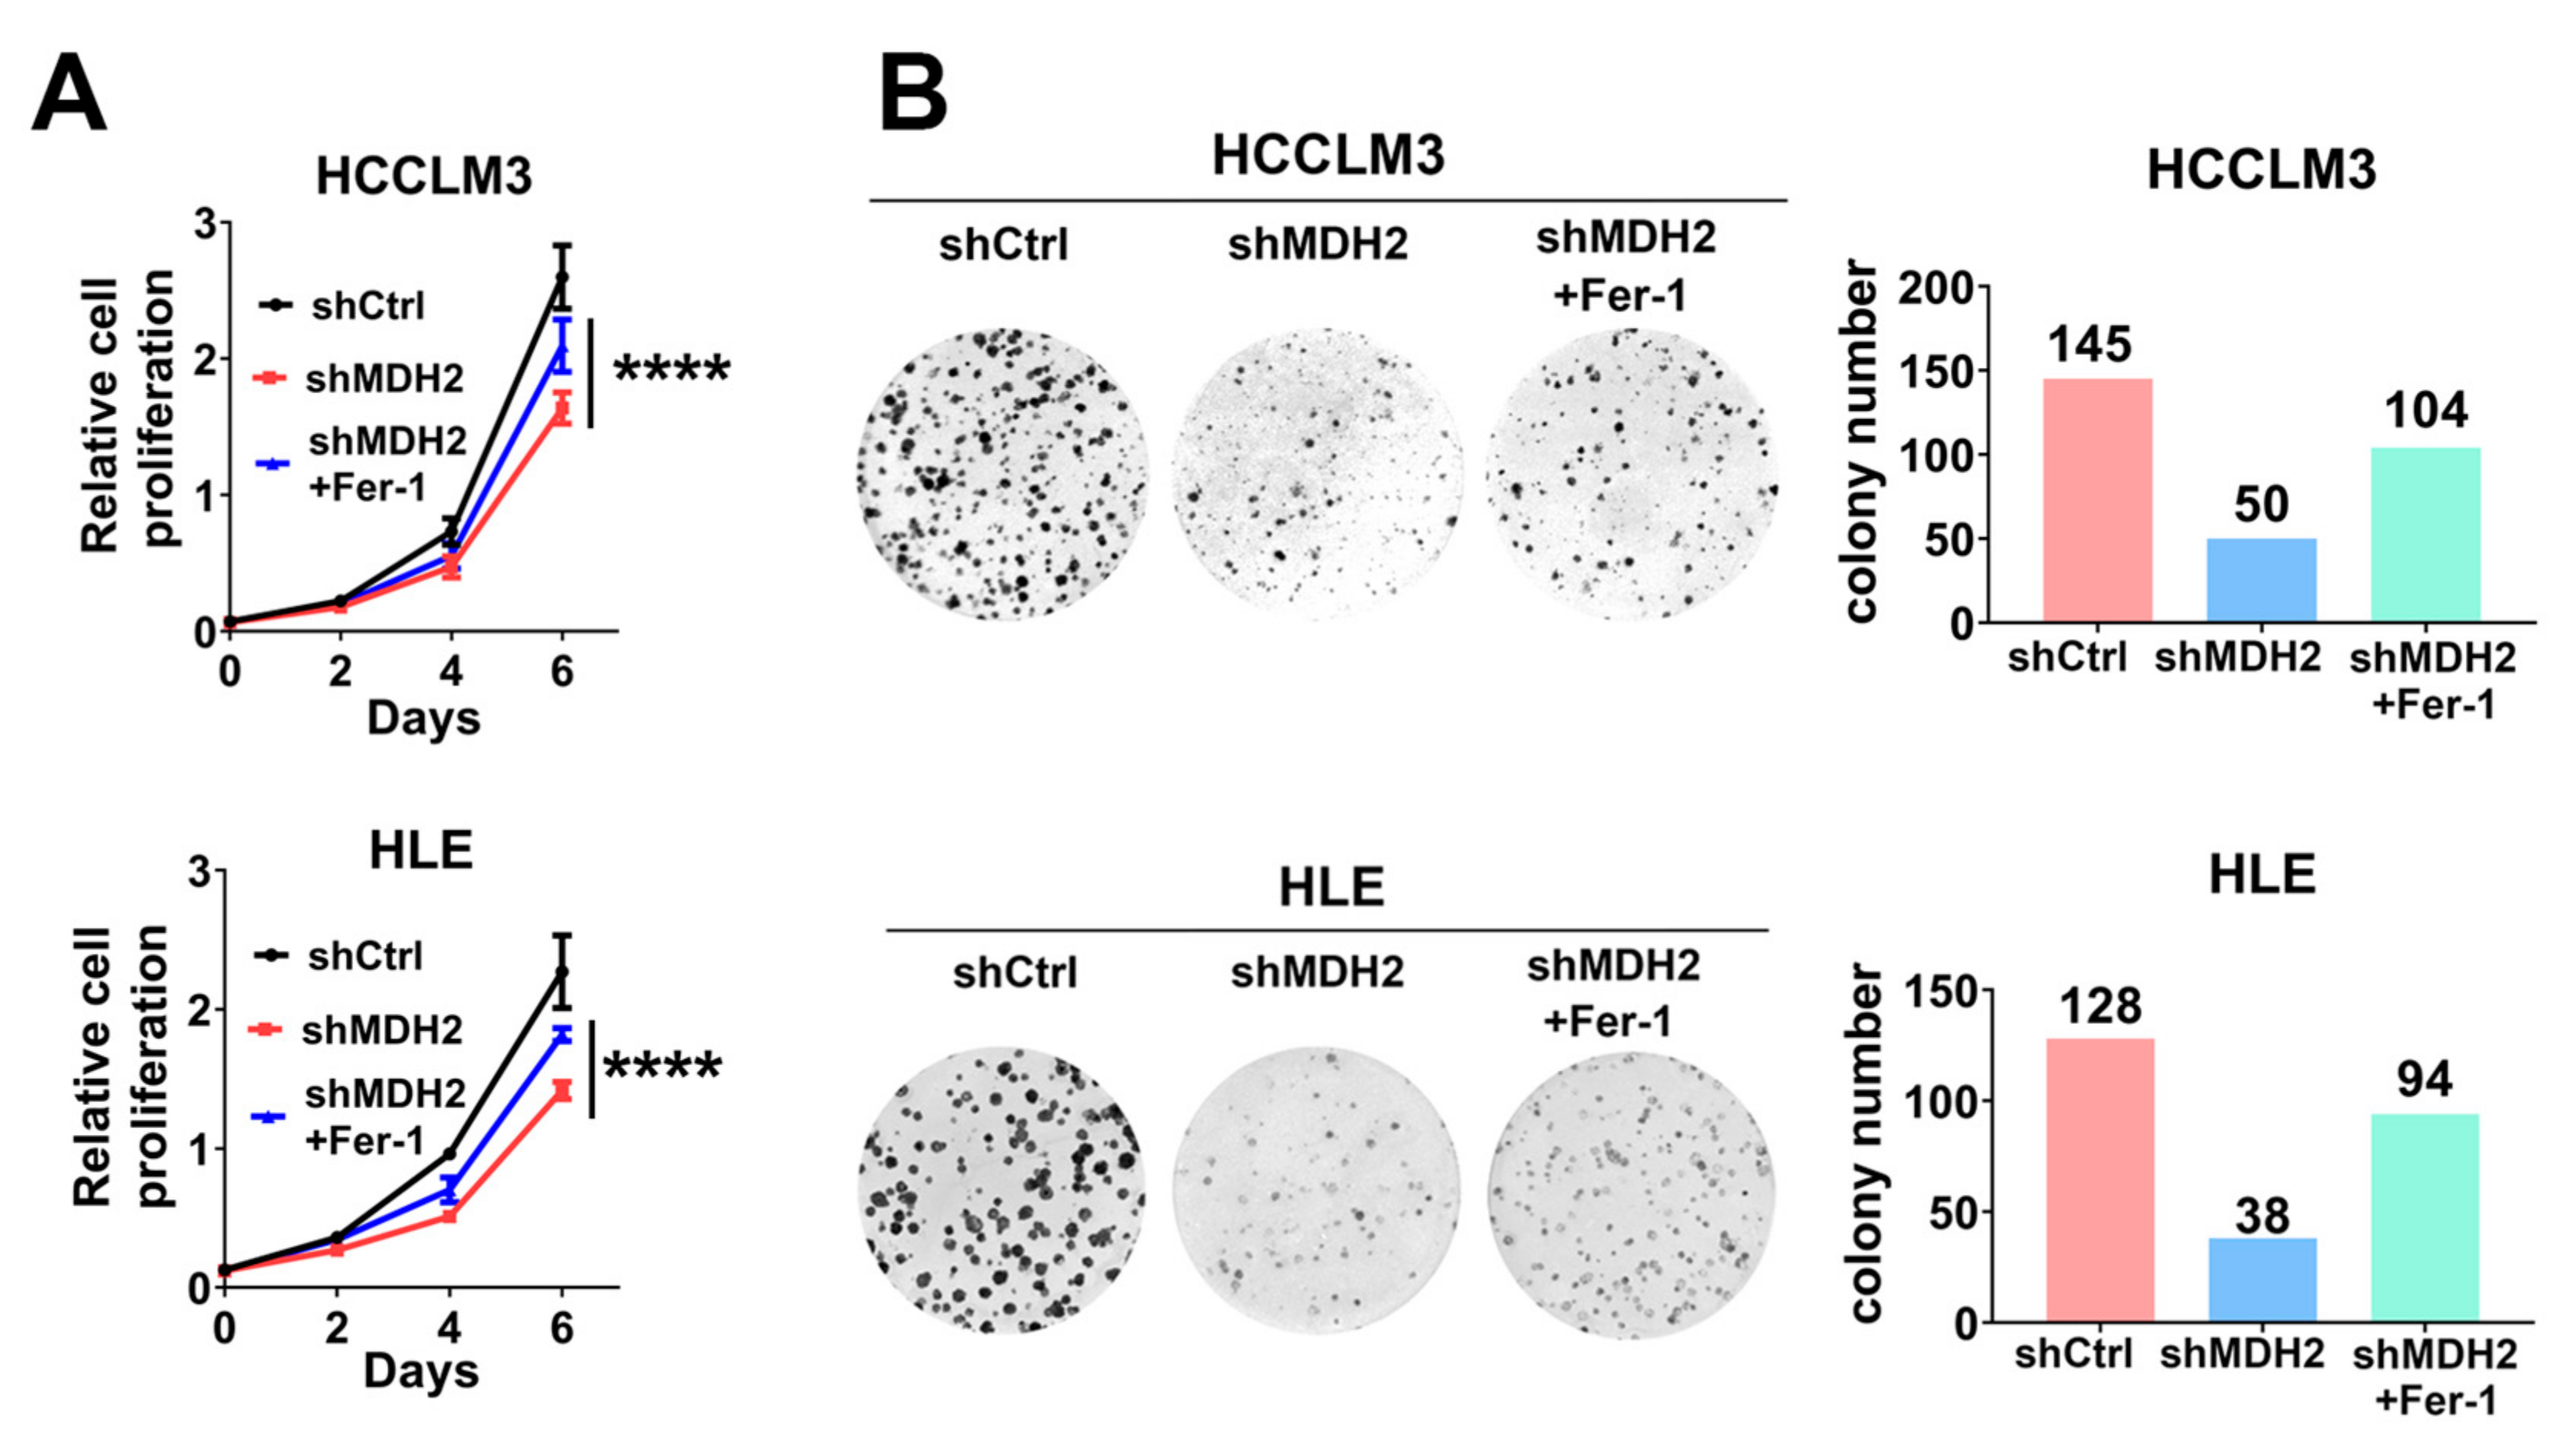
Figure 6.
MDH2 induces ferroptosis via GPX4. (A) GPX4, SLC7A11, MDH2 and Vinculin protein levels in control (Ctrl) and MDH2-knockdown (#1,#2) HCC cells were assessed by Western blotting. (B) MDH2,GPX4 and SLC7A11 mRNA levels in control (shCtrl) and MDH2-knockdown (shMDH2#1,shMDH2#2) HCC cells were determined by RT-qPCR. (C) Control (shCtrl) and MDH2 knockdown (shMDH2) HCC cells with or without GPX4 overexpression were treated with or without 5μM RSL3 for 24 hours and photographed, the representative images are shown. (D) Control (shCtrl) and MDH2 knockdown (shMDH2) HCC cells with or without GPX4 overexpression treated with or without 5μM RSL3 for 24 hours were collected for PI staining and assayed by flow cytometry (top). Cell death rates were calculated and shown in bar graph (bottom).
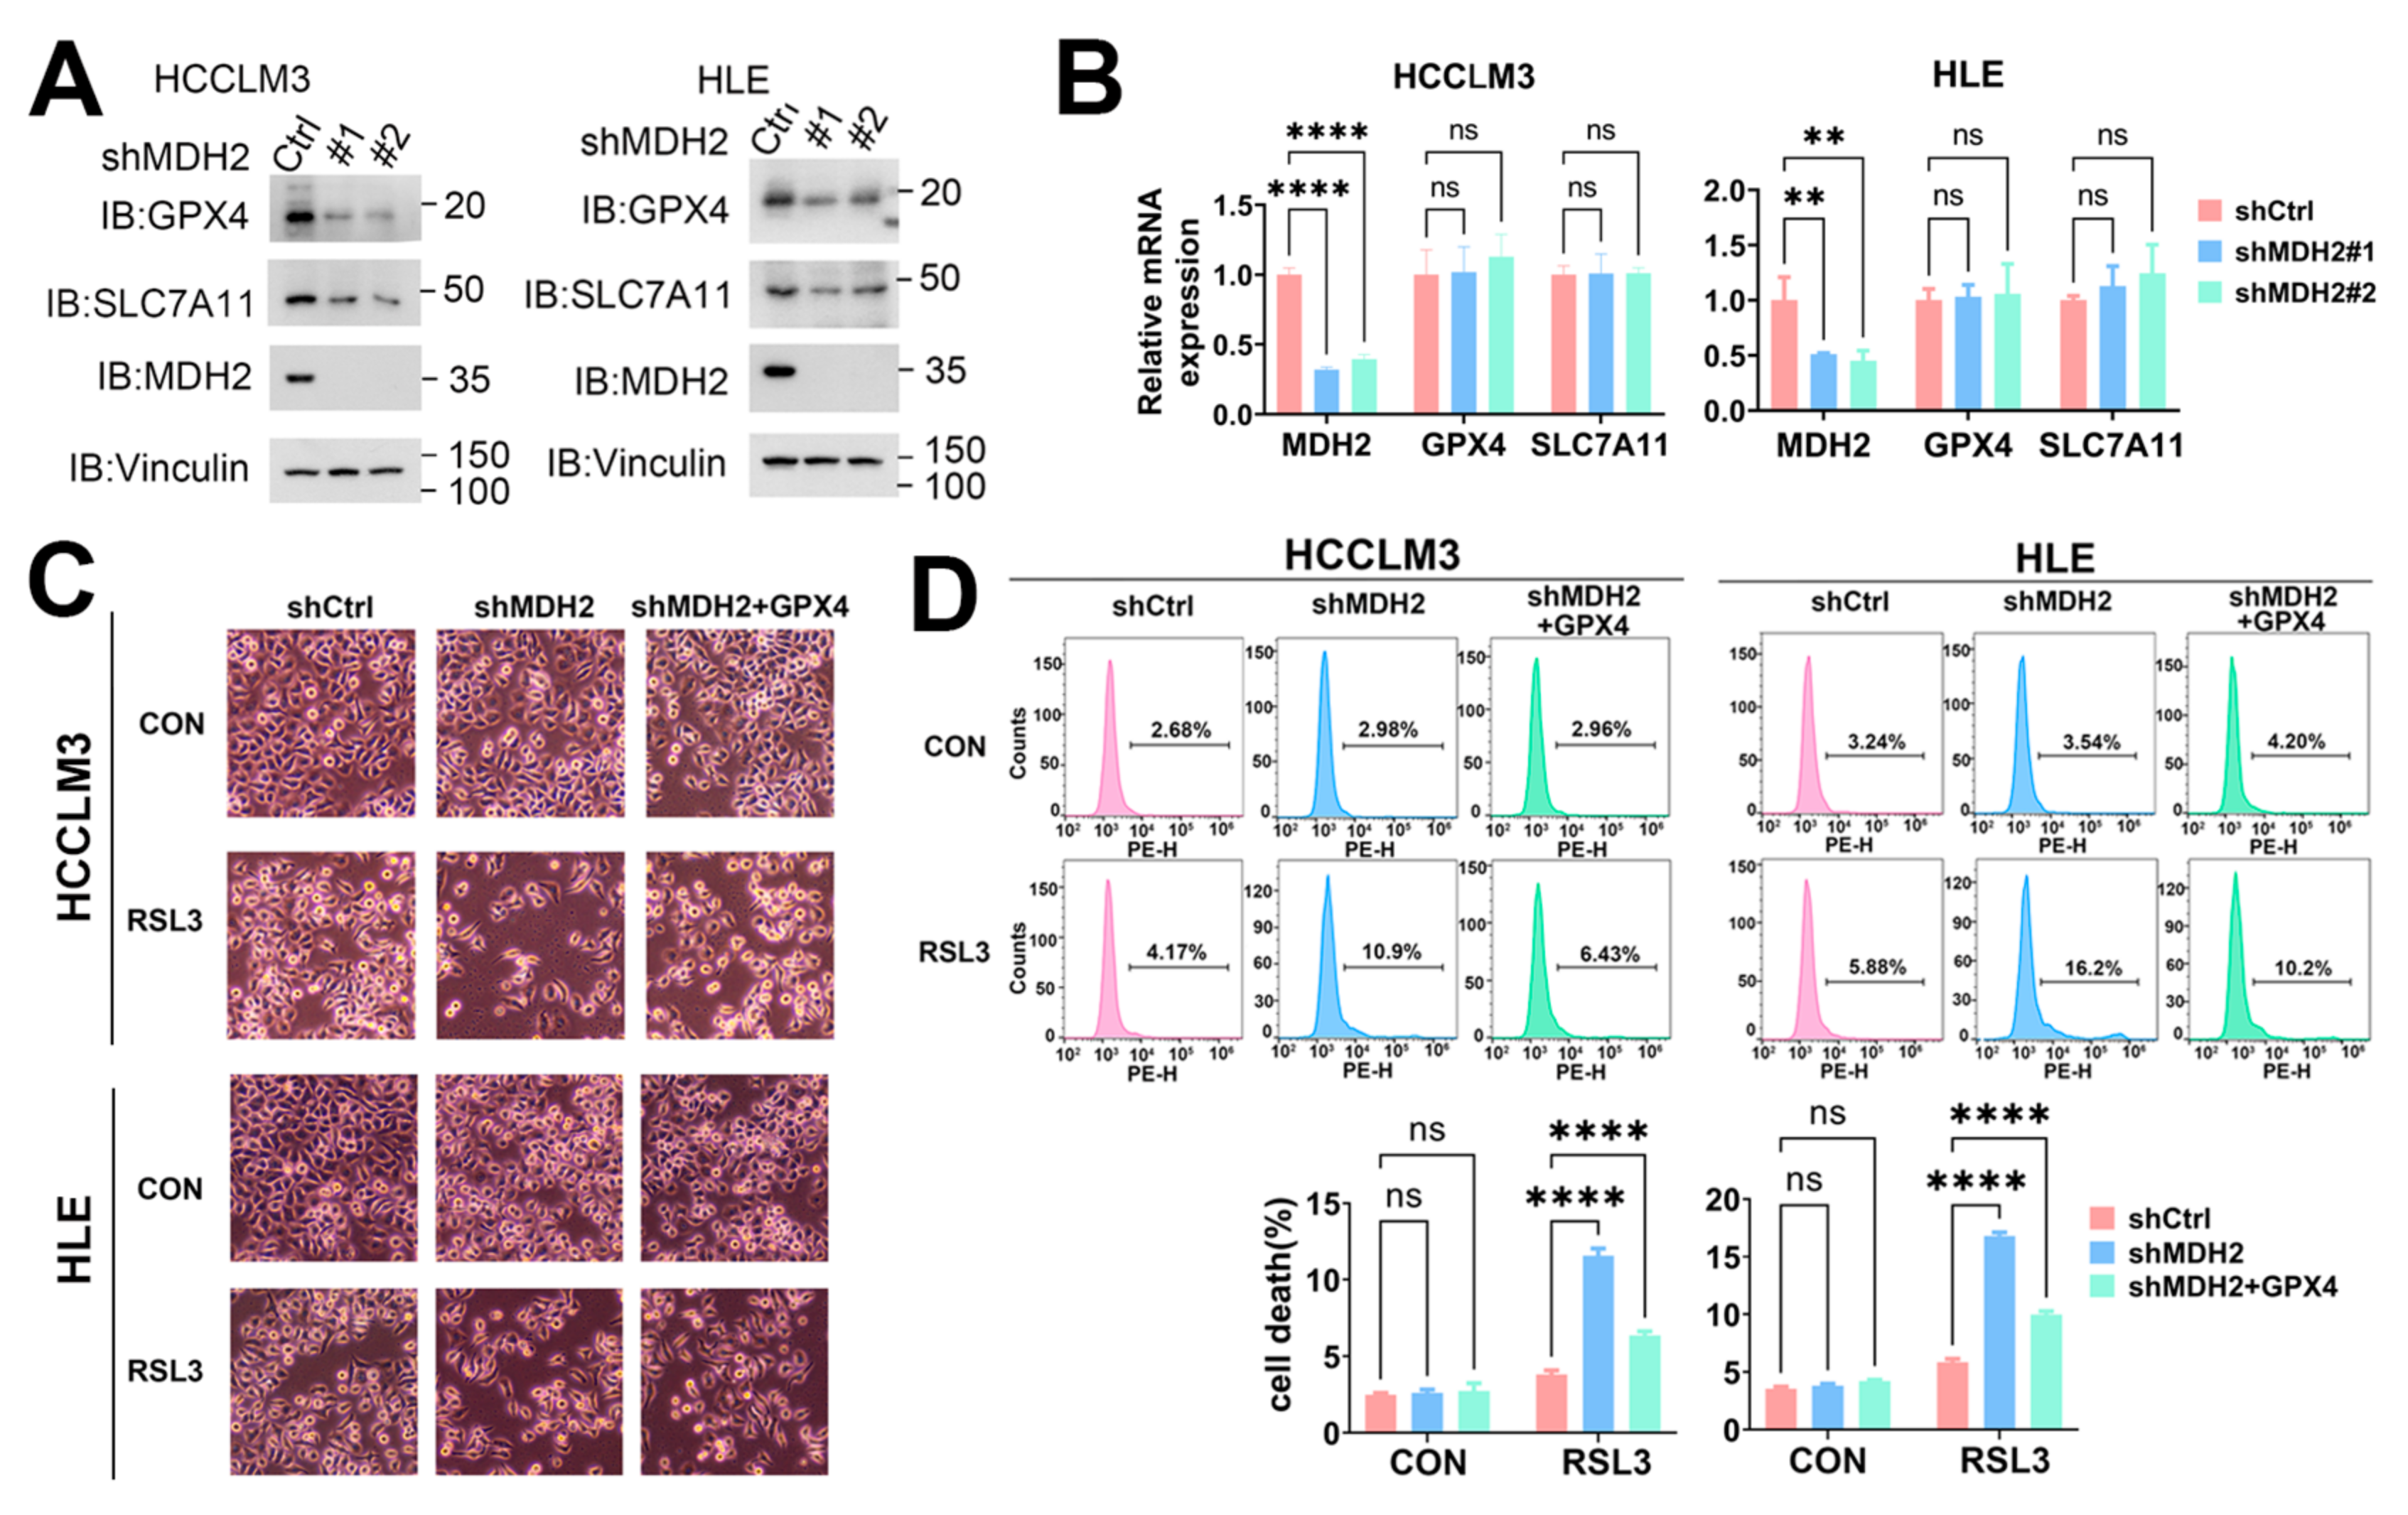
Figure 7.
MDH2 stabilizes GPX4. (A) Control (shCtrl) and MDH2 knockdown (shMDH2#1,shMDH2#2) HCC cells treated with 100μg/ml CHX for the indicated times were harvested and subjected to Western blotting analysis with indicated antibodies. The quantification of normalized protein levels of GPX4/Vinculin ratio are shown. (B) HEK-293T cells transiently transfected with indicated plasmids for 36 hours were lysed and immunoprecipitated with anti-Flag antibodies, and the samples were subjected to Western blotting analysis with indicated antibodies. (C) GPX4 and MDH2 protein levels were evaluated by Western blotting in human normal hepatocytes (L02) and HCC cell lines (Huh7, Hep3B, SNU398, PLC/PRF5, HLE, HCCLM3 and HepG2) cells, with Vinculin as a loading control (top). Pearson correlation analysis of GPX4 and MDH2 protein expression in HCC cell lines is shown (bottom). (D) Expression of GPX4 in normal liver tissues and primary LIHC (liver hepatocellular carcinoma) tissues (top) or LIHC tissue at different stages (bottom) obtained from TCGA database. (E) Kaplan–Meier plot of overall survival probability for LIHC (liver hepatocellular carcinoma) patients grouped according to high (n=92) and low/medium (n=273) expression of GPX4 in the TCGA database.
Disclaimer/Publisher’s Note: The statements, opinions and data contained in all publications are solely those of the individual author(s) and contributor(s) and not of MDPI and/or the editor(s). MDPI and/or the editor(s) disclaim responsibility for any injury to people or property resulting from any ideas, methods, instructions or products referred to in the content. |
© 2024 by the authors. Licensee MDPI, Basel, Switzerland. This article is an open access article distributed under the terms and conditions of the Creative Commons Attribution (CC BY) license (http://creativecommons.org/licenses/by/4.0/).
Copyright: This open access article is published under a Creative Commons CC BY 4.0 license, which permit the free download, distribution, and reuse, provided that the author and preprint are cited in any reuse.


