Submitted:
22 May 2024
Posted:
23 May 2024
You are already at the latest version
Abstract
As cardiovascular diseases continue to be a leading cause of mortality, recent-ly, wearable devices for monitoring cardiac activity have gained much interest among medical community. This paper introduces an innovative ECG monitoring system based on a single – lead ECG machine enhanced with machine learning methods. The system only processes and analyses the ECG data, but also predict potential heart disease at an early stage.
The wearable device was built on the ADS1298 and a microcontroller STM32L151xD. A server module based on REST API architecture style was designed to fa-cilitate interaction with web-based segment of the system. The module is responsible for receiving data in real time from microcontroller and their deliver to web – based segment. Algorithms for analyzing ECG signals have been developed, including band filter artifact removal, K-means clustering for signal segmentation, and PQRST analysis. Machine leaning methods as Isolation Forest have been employed for ECG anomaly detection. Moreover, a comparative analysis with various machine learning methods, including lo-gistic regression, random forest, SVM, XGBoost, decision forest and, CNNs was conducted to predict cardiovascular diseases. Convoluted Neural Networks (CNN) showed an accu-racy of 0.926, proving high effectiveness in ECG data process.
Keywords:
wearable ECG device
; ECG monitoring system
; ECG database
; ECG signal
; PQRST wave detection
; machine learning
1. Introduction
Human heart is a powerful muscular pump. On daily basis, the heart undergoes 100 000 contractions and relaxations, pumping 7600 liters of blood throughout the body. Blood removes carbone dioxide, filters out other wastes, and also supply oxygen and other nutrients to the body’s cells. Abnormalities in natural blood circulation can cause various heart ailments. According to the World Health Organization (WHO), cardiovascular death has long been the leading cause of mortality globally. In case of Kazakhstan, mortality rate from cardiovascular diseases (CVD) is two times higher than European countries. Compared to others, it is more dangerous for people with chronic heart failure (CHF), which develops as a result of coronary heart disease. For the last decade, cardiovascular diseases (CVD) rate has increased in 1.7 times. Based on scientists collected data, there has been a fourfold rise in hospitalization with ischemic heart disease comparted to 20 years ago. Among Kazakhstan’s 13 million adult residents, 350 000 have been diagnosed with chronic ischemic heart disease [1].
Wearable systems for cardiac disease diagnostics play a key role in healthcare, providing a range of benefits. They assist in detecting and diagnosing heart diseases at an early stage, which facilitates to initiate treatment and risk reduction. Ongoing monitoring of the cardiovascular system state in real-time is particularly beneficial for patients with chronical diseases. The wearable systems can be employed to conduct monitoring beyond the hospital conditions, making them more accessible for various patients, including those who live in remote areas. It reduces the need for frequent doctor visits, saving both time and healthcare costs. Thanks to constant monitoring and data collection, doctors can effectively prescribe and tailor treatment according to individual characteristics.
The system includes a wearable device that works in real time and can warn patients early about heart conditions. Any wearable ECG devices functions to register human biopotentials, handle noise – resistant signal processing, and diagnose serious cardiac arrhythmiac.
Prior to outlining the main points, first the researchers review various ECG recording wearable devices, noise reduction approaches, and heart disease detection methods that can be employed for building ongoing health monitoring systems.
Despite the ever-increasing use and commercialization of wearable devices, some constraints hinder the success and usefulness of existing products for health monitoring. Wearable devices as smart watches are put on to a single body location (the wrist), therefore limiting its ability to access various biosignals, that are detected from different parts of the body [2,3,4].
ECG signals obtained from the left arm’s sensors after signal processing, fail to provide sufficient quality of recordings for long-term monitoring. Some cordless devices for ECG recordings and wireless data transmission via Bluetooth and Wi-Fi report only about heart rate, not ECG recordings and none of them provide signal quality assurance data that are directly compared with Holter monitoring [5,6,7,8]. Design of textile – based multichannel ECG systems that measure ECG signals from several parts of patients’ torso were described in papers [9,10,11,12,13]. Smart or electronic textile (e-textiles) is a material that can interact with environment and users. Designing e-textiles became possible thanks to agile textile schemes, that open up the possibility of discreet and versatile wearble clothing – based devices. E-textiles also offer the opportunity of subtle integration of different sensory modes in various parts of the body. Yet, while designing, and choosing textile electrodes for long-term ECG monitoring, it is necessary to consider other factors as methods of integration and preparation, washing and reusability, and electrode’s sensory comfort for skin.
ECG processing for noise reduction in wearable ECG devices is a crucial task for obtaining clear and accurate data. Several approaches have been offered in some researches to reduce the noise in wearable ECG systems. For example, digital filters [14,15] are employed to remove unwanted noise components, including high – frequency interference (electrical interference from household appliances) low – frequency artifacts as patient’s movement or respiratory activity. The paper [16] offered methods for eliminating basic lines to remove slowly changing signals caused by electrodes, signal issues and other sources of artifacts. Moreover, recent machine learning methods were used for detecting and classifying noise components of signals and with their subsequent removal or correction [17]. However, most of existing researches are experiment based, orientating for assessing the efficiency of individual filters. These days, there are lack of papers, which thoroughly examine the various types of filters for noise suppression and extraction of necessary signals.
Using artificial intelligence (AI) methods in predicting cardiovascular diseases has been actively being studied in contemporary researches. The paper [18,19,20] used a support vector method (SVM) and other machine learning classifiers to detect signs of cardivasular diseases from ECG data obtained from patients with heart disease using wearable devices. Results show high effectiveness of SVM classifier compared with other algorithms. An automatic classification system for detecting cardiac arrhythmiac was developed and studied in the paper [21]. The researchers [22] presented an automatic ECG arrhythmia classifier, based on a machine learning method; echo state network (ESN).This classifier needs only one ECG lead and demonstrates a high performance on two ECG databases. The paper [23] proposed a simple and cheap algorithm for processing and analyzing ECG signals, by using linear regression for signal segmentation and detecting important components. Using deep learning, including models for searching QRS and T-waved vectors was studied [24,25].
These models have demonstrated high accuracy on large public datasets of clinical ECG recordings. In [26], algorithms were developed to calculate the R-R interval with high accuracy using data from the MIT-BIH database.
The researchers [27] introduced a wearable ECG monitor, integrated with wireless sensors for obtaining ECG signals and classifying them with machine learning methods. However, accuracy of this system still needs improvements. A new artificial neuron network was offered by [28] for reliable identification of atrial fibrillation in the ECG signals. Moreover, a basic model with repetitive neural network (CT) and a lightweight model with cast CT was presented [29] to accelerate the prediction time. The paper [30] proposed a method based in neuron network for automatic identification of connections between the conditions of elderly patients and various factions calculated from ECG and EEG signals. Although above-mentioned researches prove the potential of implementing AI in cardiovascular diseases, further researches are necessary to check effectiveness of these methods in real time scenarios.
The review demonstrates the necessity of developing a wearable system, capable of providing consistent ECG signal processing and detecting serious cardiac arrhythmias in real time, during the patient’s unrestricted activities. For addressing the research gap, a wearable system with artificial intelligence (AI) is introduced. This article thoroughly describe the system (shown in the Figure 1) including hardware developments stages, pre-processing of ECG signals, methods for detecting severe cardiac arrhythmias and machine learning methods for predicting heart diseases based on data obtained from wearable ECG device.
The cardio diagnostics system includes wearable ECG device, software complex (website) and server, performing a number of important functions. They are constant registration of electrical heart signals, pre-processing signals for noise suppression and providing accurate data, highlighting informative parameters for further detailed analysis, formation of diagnostic features based on the extracted parameters, and a detailed assessment of the heart’s condition, utilizing processed data to detect possible dysfunctions or alternations in cardiac system functioning.
2. Materials and Methods
2.1. Hardware Development of Wearable ECG Device
The ECG records, necessary for the study, was obtained, utilizing a wearable ECG device built by authors, shown in the Figure 2.
Wearable ECG device is one of the crucial elements of cardio diagnostics system. It provides with registering, analog – to – digital conversion and the transmission of ECG signals through radio channels to a smartphone.
The Figure 3 illustrates the detailed functional flow chart of the proposed ECG device.
The wearable ECG ECG device consists of several main components, among which the key is microcontrollers.
ADS1298, connected to microcontroller STM32L151xD through serial data transmission channel, is used to collect ECG data.
Ensuring independent power supply for ADS1298 to minimize the interference is a main aspect of the process. Non – volatile high – speed memory block MRAM is employed to record operative data, while for long – term data storage, an external microCD Flash with 32 GB capacity was used during the data collection. In addition, the ECG device was equipped with MEMS – accelerometer to determine the patient’s heart attack falls and immobility. Power and battery charge is carried out from an external source of power, with charging device, tracking the proper battery charge. This is also a power button controller and residual battery charge detector. A GPRS communication module is used to transfer data to both the medical information system and the ambulance service, while Bluetooth module is employed to send through a mobile phone. Moreover, there is GNSS module for identifying a patient’s location. Visual controlling system includes three-color LEDs to display various operating modes and single – color LEDs for signaling about the connection to the Internet and data exchange on the server.
2.2. Software Complex
The following tasks have been carried out during the development of software component:
- − algorithms for extracting data from microcontroller that executes to take ECG from patients were developed;
- − a web component of system was built to interact with medical workers;
- − a server module, responsible for obtaining data from microcontroller in real time and its transmission to web component, was built;
- − methods of processing initial data on the server were studied and implemented, along with mechanisms for transmitting processed data to the web component.
Java Script framework with open – source, Vue.js was chosen to create the user interface for the client module of the cardiac diagnostics system. Vue.js has a convenient integration with other Java Script libraries and can be employed for building a single – page application. This framework enables to create an user interface based on Model-View-ViewModel architecture template. Vue.js specializes in demonstrating level and easily integrate with other projects and libraries. Websites built with Vue.js are quickly uploaded and has minimal load thanks to its small size (17 Kb).
Free framework Django in Python language was chosen for software part of the service (backend). Django follows the design pattern MVC (Model-View-Controller) and enables to create web applications from separate plug-in applications. Framework adheres the principle DRY (Don't repeat yourself), which prevents from repeating codes. One of the features of Django is an URL handler configuration using regular expressions. ORM (Object-Relational Mapping), enables to describe data model in Python and automatically create data base scheme, is used to work in Django data base. The ECG data was retrieved from a server through a REST API (Representational State Transfer) architecture style. All retrieved data is stored in object-relational database management system PostgreSQL, a flexible and reliable database management system that supports user objects and complex data structure.
Each user has their own unique information, which is sent to the client module in Vue.js with REST API. The web-service collects information every second and it visualized it as graph that moves in sync with the heart rate. When entering login and password, the website sends a request to the server, and enquired information appears on the screen.
JSON Web Token, a token for authentication and user authorization, was used in Python to check user access rights to certain resources. JWT enables to create token access on JSON, which confirms certain privileges of an user. The tokens can be employed to transit identification data between client and server.
2.3. ECG Signal Filter
Three – stage noise removal techniques have been implemented in the proposed ECG cardio monitoring system, including the flowing processes:
At the first stage, filtering is applied on the level of analog – to – digital conversion of module 1298:
- RC-filter at the entrance, its bandwidth is 3 MHz, functions as a filter for electromagnetic interference in all channels.
- Low pass filters that enable frequencies below the specified boundary frequency (cut-off frequency) to pass, thus reducing or eliminating high- frequency noises and interference that distort signals.
- High pass filters that enable frequencies above specified boundary frequency (cut – off frequency) to pass, thus reducing or eliminating low – frequency noises and constant components of signals, such as breath artifacts, or electrical interference.
- Antialiasing filters before sampling signals to prevent antialiasing, caused by excessive high – frequency components of signals by half the sampling rate that can create fake low-passing frequencies after sampling.
- network filters for removing electrical interference from alternating current sources, such as a standard network with a frequency of 50 or 60 MHz, which can create interference to the ECG signals.
At the second stage, the Median filter is applied on the level of hardware, on the controller. This method includes defining the filter window, implementing the median filtering for each signal count in the window, processing boundary conditions and repeating the process to improve the filter efficiency. Median filter is effective in removing impulsive and other noises, keeping the main features of signals.
At the third stage, as a software application using digital signal processing based on filtering algorithms, a bandpass filter is implemented. Bandpass filter is adjusted to a certain frequency range, containing cardiac activity, and blocks frequencies beyond the range. It allows not only skips frequency, that meet electrical activity of heart, but also blocks interference from other sources, such as electromagnetic interference or network noise, as well as low – frequency artefacts, such as body movement or electric motor activity.
Bandpass filter involves system that pass frequency signal (f), that is in a certain range (fc), and suppreses frequencies outside this range. Mathematically, it can be described through transmit function H(f), identified as:
Function H(f) decreases as frequency increases f, reaching half of its maximum value at cut-off frequency fc. Parameter n identifies steepness of the frequency response of the filter: the more n, the shaper is the transition from passing to suppressing the signal around the cutoff frequency.
2.4. ECG Signals Clustering
Removing ECG signal noise is followed by feature extraction. The feature extraction stage is crucial for recognition system and proper visualization of ECG signals. Grouping signals by similarity of their features was carried out through utilizing clustering algorithms, K-means. This algorithm enabled to highlight different patterns of signals, associated with certain conditions of cardiac activity. K-means algorithm is oriented on dividing data into k clusters through minimizing total intercluster distance. The main aspect is to reduce the sum of squares in distance between each of the observation xi and the nearest centroid of the cluster μj, which is expressed mathematically as a function minimization (Formula 2), where C denotes a set of all centroids. This formula presents inertia criteria, where algorithm strives to minimize, and describing as follows optimal separation data into clusters with similar features.
K – means algorithm divides the set of samples N into X to K disjoint clusters C,each of which is described by the average μj of samples in the cluster. Average value is often called as “centroid” of cluster. K – means algorithm aims at centroid choice, which minimizes inertia and the intra- cluster sum of squares criterion.
2.5. PQRST Wave Detection
Precise detection of ECG signal features, such as R peak, QRS complex and other components of waveforms is crucial for detecting cardiac abnormalities. Traditional ECG signal analysis means manual interpretation, which takes plenty of time and prone to human error. Thus, there is a growing interest in designing automated methods for improving preciseness and effectiveness of ECG signal analysis.
The process of detecting peaks P, Q, R, S, and T in ECG signals involves initially identifying R peak. This is followed by detecting other significant peaks by analyzing changes in amplitude and temporary intervals between these peaks and other points on the ECG signal.
The Q-point is identified in the interval before the R peak. A time interval, Qinterval, is used, which is typically approximately 0.04 seconds (or 14.4 samples at a sampling rate of 360 Hz). Thus, to search for a Q-point, the algorithm analyzes the signal in the interval [R−Qinterval,R], where R is the index of the peak R.
S point is identified after R peak. For S point Sinterval, with 0.08 second (or 28.8 counts at the same frequency sampling), is used for S point. S point search interval is [R, R+Sinterval].
T point represents elevation, following S wave, and illustrates period of repolarization in the ventricles of the heart. Interval after the S point is used for searching it. T interval usually starts immediately after S point and can last till 0.2 seconds or 72 counts. Detecting T points involves searching the maximum value of amplitude within this interval.
P wave illustrates period of atrial depolarization and precedes the QRS complex. Interval before Q point is used to detect it. P interval can vary, but is often selected from 0.12 to 0.20 second before Q point. P point searching involves identifying maximum amplitude within the interval.
This process introduces basic methods for detecting important points in the ECG signal. It is worth mentioning that detecting preciseness depends on signal quality, presence of noise and artefacts, and depends on certain parameters of algorithm in signal processing.
2.6. Anomaly Detection in ECG Signals
In this study, we adapted Isolation Forest, a method for detecting abnormalities, to collect data consisting of key point labels in an ECG (waves Q, R, S, T and P). we aimed at detecting potential abnormalities in cardiac rhythm, which could indicate the presence of abnormality or other irregular cardiac conditions. Isolation Forest is a machine-learning algorithm, is based on ensemble decision trees, and used in tasks in detecting abnormalities through isolating individual data points.
The algorithm was set using 100 estimators (`n_estimators=100`), where parameter `contamination` was set as 'auto' for detecting automatically the ration of abnormalities in the dataset. Arbitrary selection of subsamples and divisions within trees were controlled with parameter `random_state=42`, ensuring consistency of the results.
Once the model had been trained on an ECG dataset, abnormal condition of cardiac rhythm was predicted. Algorithm predictions categorized the dataset on normal (designated as “1”) and anomalous means (designated as “-1”). These results were integrated back to the initial dataset, enhancing it with abnormal labels for each ECG record.
2.7. Predicting Heart Disease
The research aims at analyzing relationship between various factors (age, sex, chest pain, blood pressure, cholesterol, alcohol, diabetes, ECG change, smoking) and patient’s health condition.
132 participants from Cardiology center of the Central Clinical Hospital of Almaty, Kazakhstan were chosen, and their data was taken to carry out the study. The study included both men (98 participants) and women (34 participants). Their ages varied from 28 to 68, participants’ average blood pressure was 129.93 mmHg, with minimum value 94 mmHg, and maximum 200 mmHg, cholesterol level was with minimum level at 126 mg / dL and maximum at 341 mg/ dL. 43.18% of participants reported using alcohol, while 31.06% of participants had diabetes. 55.30% of them were smokers, while changes on the ECGs were observed in the 37.12% of participants. Data was collected using conventional cardiac methods of assessment, including measuring blood pressure, cholesterol level, also conducting an ECG study using wearable system built by the authors. The study is aimed at analyzing the relationship between lifestyle, physiological parameters and the risk of developing cardiac diseases. All participants were requested to abstain from alcohol, coffee or tea for 12 hours prior to the experiment. Before the experiment each subject underwent checkup, where we measured their blood pressure, examined medical history. Further during the experiment, we employed wearable ECG device for recording the ECG signals. Results were checked by an experienced cardiologist, and he made notes to collect data for further research.
Participants’ data has 10 attributes. Information about dataset attributes is illustrated in the Table 1.
The aim of the study was to assess 10 parameters, presence of cardiovascular disease (CVD) in patients, those used first 9 parameters. The purpose of the study was to evaluate the tenth parameter, the presence of cardiovascular disease, in patients for whom the first 9 parameters were used.
During the study, various machine learning methods were applied, including logical regression, decision trees, random tree, support vector machines (SVM), XGBoost and convolutional neuron networks (CNN), followed by comparative analysis and investigating their efficiency.
3. Results
3.1. ECG Signal Filter
As mentioned in the section 2.3, the process of filtering the ECG signals with the aim of suppressing noise was implemented in three stages, concurrently; two of them were executed at the hardware level. Particularly, the analog- to - digital conversion was carried out by applying RC – filter, high and low frequency filters, digital thinning filters, and network filters. In the microcontroller, the median filter was involved in removing impulse interference. As a result, ECG signal was obtained, illustrated in the Figure 4. Artifacts were detected that hindered subsequent signal analysis.
Signal filtering is crucial for preparing ECG signals for further analysis, as it improves visualization, which is important for observing components, such as R - peak, and facilitates automatic detection. A bandpass filter was used to improve preciseness and reliance of diagnostic outcomes.
The following parameters were set for filtering the ECG signals:
Low cut range is 0.5 MHz that removes low- frequency oscillations, which are not related to cardiac activity.
High cut range was set at the level of 50.0 MHz that facilitates to suppress high-frequency noises, while maintaining the important components of ECG signals.
Sampling frequency (fs) of ECG signal is 360 MHz, typical value for medical ECG records, and identifies the signal recovery’s overall quality.
Segments after ECG signal filtering were illustrated in the Figure 5 below, where visually seen the effectiveness of implemented pre-processing ECG.
Pre-filtering the signals enabled to remove some artifacts, and highlight the main ones for analyzing signal functions.
3.2. Clustering ECG Signals
Clustering enables to classify signal points by amplitude, facilitating visualization and data interpretation. That algorithm requires specifying the number of clusters (in our case they are 5). It scales well to large numbers of samples and is used in a wide range of ECG signal processing applications.
In the Figure 6 below, there is a graph demonstrating data from electrocardiogram, the processing result using clustering algorithm. X is duration of cardiac activity while the Y axis represents amplitude of electrical signal.
The amplitudes were inverted to improve visualization and analyze individual clusters of signals (Figure 7). This step enabled to correct the polarity of signal and improve the detection of key points in ECG.
As it is seen in the Table 2, there are 5 clusters, and in the Figure 6 and Figure 7, they are designated by different colors.
The algorithm grouped data points of ECG signals based on similarities, detected in features of presented signals. Clusterization highlights the differences in heart rate characteristics, identified in ECG signal.
As the result of clustering, using K-means algorithm, a proper visualized ECG signal was obtained, as it is illustrated in the Figure 8.
The data obtained through the filtering and clustering process will be processed to determine the PQRST wave in the ECG signal.
3.3. PQRST Wave Detection
The process of identifying points P, Q, R, S и T on an ECG involves detecting R-peaks and identifying other points using the amplitude analysis and temporary intervals within them. Q point is identified prior to R-peak, applying temporary interval Qinterval. S point is identified after R-peak, applying interval Sinterval. T point is identified after S waves. P point is detected prior to the QRS complex.
The results of detecting PQRST waves can be seen in the Figure 9.
As it is seen in the figure above, peaks of points P, Q, R, S, T are designated by certain colors: yellow (P point); green (Q point); red (R point). Peaks designated by blue is S point, and purple is T point.
It is obviously seen that forms of waves PQRST are almost the same as described in the section 2.5, meaning that the wearable system was built effectively enough to detect waves in an ECG signal.
3.4. Anomaly Detection in ECG Signals
Obtained result of the study reveals the importance of the complex approach in analyzing ECG signals, including methods of digital signal processing and clustering. We kept (the Table 3) the identified labels with data for further analysis, utilizing the machine learning methods.
The analysis of results demonstrated that certain number of records were classified as “anomalous”, while others were regarded as “normal”. Qualitative assessment revealed the following distribution between anomalous and normal states (the Table 4), that indicates the potential presence of irregular patterns in retrieved dataset from the ECG signals.
Isolation Forest model was trained for 56 cardiac rhythm without prerequisite labels of abnormalities. As the analysis results demonstrate, the model identified 20 records as anomalous, which makes up 35.7 % of total number of records. The remaining 36 records were classified as normal (the Figure 10).
The further analysis demonstrated that average value of Q, R, S, T and P waves index for anomalous records defers from average value of normal records. In particular, anomalous records manifested the early presence of all waves in cardiac rhythm compared with normal records. It can indicate on certain changes in cardiac rhythm, associated with abnormalities.
A boxplot diagram (the Figure 11) was created to visualize the differences between anomalous and normal records. There spread and median values of waves’ indexes were illustrated, highlighting the difference between two groups.
These results represent important information about potential abnormalities in ECG data, which can offer justification for the further research in examining cardiovascular diseases. Worth mentioning that additional analysis, including comparison with medical data and with initial diagnoses is required to confirm the clinical importance of detected abnormalities.
3.5. Predicting Heart Disease
Our data set includes information about the group of patients, explained thoroughly about their demographic characteristics, lifestyles, and indicators that show the health status of the subject. This creates a base for studying relation of “decommunization” between lifestyle choice and consequences of it for health. We used unprocessed data of 132 patients that we collected as the result of using our ECG device. The data fraction is given in the Table 5.
Prior to conducting more detailed analysis of our data, there was a statistical analysis for evaluating the directtions of parameter interrelations. Correlations between each pair of features were analyzed, and identified.
- age - Patient's age
- Sex-Gender of the patient;
- chest pain - is there pain in the patient's heart or not;
- Blood pressure - the patient's blood pressure during the examination;
- Cholesterol - cholesterol levels;
- Alcohol - does the patient drink alcohol or not;
- Diabets - does the patient have diabetes;
- ECG change - a change in the patient's ECG;
- Smoking - cigarette use;
- Condition - sick or not.
Coefficiency of correlation between variables was illustrated in the Figure 12 below. Each table cell represents correlation between two parameters of our dataset. Correlational analysis shows the significance of relationship between some features and health condition of patients.
As it is seen from the correlation diagram, presence or absence of cardiac diseases has a significant variation in distributing such features as chest pain, ECG change, alcohol use, and the presence of diabetes.
A correlational analysis enabled to identify the significant relationship between various features and health status of a patient. Utilizing a correlation heatmap, key factors that the most strongly related with the risk of developing a disease were identified. These factors include cholesterol level, blood pressure, age that coincide with previous researches, highlighting their importance in evaluating the risk of cardiovascular diseases. Visualization of correlations was illustrated in the form of heatmap, were colors denote the degree of correlation between variables, which allow to visually access the most significant correlations.
A data visualization tool, Boxplot, was applied to analyze the effects of various features on a patient’s health condition during the experiment. Boxplot involves the graphical representation of a five-number data summary, including maximum and minimum value, the median in first (Q1) and third (Q3) quartiles. Boxplot whiskers shows varieties beyond quartiles and can represent values that fall in 1.5 times the interquartile range (IQR) from the quartiles, thus facilitating to identify outliers.
With the framework of the study, Boxplot was used for analyzing distribution of key medical indicators, such as cholesterol level, blood pressure and age, depending on a patient’s health condition. Contrasting box plots for cholesterol levels in patients with various health issues might indicate that patients with cardiovascular diseases are tend to exhibit higher blood cholesterol levels. Visualizing data using Boxplot provides valuable information about feature distribution and their impacts on health condition.
The researchers applied statistical and machine learning methods, including logical regression, decision trees, random forest, support vector method (SVM), and convolutional neuron networks (CNN) for analyzing. Efficiency of the model was assessed by accuracy label, a percentage of accurate responses by the model in the relation to all predictions, enabling to evaluate the overall effectiveness of the model.
Multiple random division of preprocessed data into training and evaluation subsets was applied to evaluate the machine learning method. Further, features were scaled to improve training process and accuracy of the model. Scaling gives each feature a standardized form with average value 0 and standard deviation 1.
Graph was built for comparing accuracy of model for analyzing the retrieved data (the Figure 14).
The main parameters of all studied methods of machine learning are given in the Table 6.
Results of training and assessing performance of convolutional neuron networks (CNN) for binary classification tasks show dynamics of model training and its ability to classify based on the given data.
Applying various models of machine learning indicated their various degree of efficiency in predicting patients’ health conditions. Convolutional neuron networks demonstrated remarkable performance, reaching the accuracy of 0.926, which indicates its potential in processing complex data patterns.
The research highlights importance of comprehensive analysis of medical data in predicting health condition. The efficacy of integrating traditional machine learning with deep learning techniques open up new perspectives on designing prediction models in medicine.
4. Discussion
As research has gradually progressed, it has been established that concerns related to cardiovascular system can be predicted by analyzing deviations, detected in ECG data.
This study presents developed wearable device for ECG monitoring and automatic system for predicting diseases, based on machine learning methods, which enable to recognize irregularities in cardiac activity. As findings indicate, this system functions effectively. According to through review, it was identified that our proposed system is the first of its kind electrocardiography monitoring system, covering all steps of monitoring process. These steps include collecting ECG signals, comprehensive signal filtration for suppressing noises, automatic recognition of all segments and waves in ECG, illustration of signals in real time, ECG data transmission and diagnostics based on ECG analysis.
ECG signal registering ECG device was built upon ADS1298, and microcontroller STM32L151xD. Java Script framework with open – source, Vue.js was chosen to create the user interface for the client module of the cardiac diagnostics system, while Django web framework in Python was chosen for hardware and software modules of the service. REST AP, an architectural style was used to retrieve ECG data. The filters including RC – filer, low – frequency filters, high – frequency filters, digital thinning filters, median filter, bandpass filter were employed to suppress noises from ECG. Machine learning methods were used for several purposes, as K-means clustering algorithm was to retrieve features, and Isolation Forest algorithm for detecting abnormalities in ECG.
To predict cardiac diseases, there was a comparative analysis of various machine learning methods, including logical regression, decision trees, random tree, support vector machines (SVM), XGBoost and convolutional neuron networks (CNN), in subsequent steps, their efficiency was studied. Convolutional neuron networks demonstrated remarkable performance, reaching the accuracy of 0.926, which indicates its potential in processing complex data. Data was collected from 132 participants: men (98) and women (34) to conduct the experiment.
This system addresses multiple common issues associated with wearable devices available on the market today:
- There is need for using wearable devices with large number of electrodes (8-12 channels) to obtain ECG signals consisting of all peaks, intervals, segments, and complexes.
- There is an ECG signal filtration issue existing in wearable devices, where not all types of noises and artefacts removed, thus affecting on quality and accuracy of signal that can obscure the diagnosis process.
- In existing wearable devices, there is lack of algorithms for automatically identifying deviations in ECG signals where usually detect only diseases connected with intervals between RR heart rate.
- This is inability to employ one’s own data to predict cardiovascular diseases using machine learning methods. Current systems for the automated detection of cardiac diseases based on machine learning methods, tend to use ECG datasets, such as PhysioNet and so on, that confine their applicability to certain patients or situations.
Despite obtaining significant results, the current research is limited by the fact that developed algorithms aim at detecting pathologies in cardiac activity. However, the algorithms fail to distinguish the types of heart diseases. This means that the system is not fully capable to implement it in clinical practice. Currently, collaborating with the Cardiology Center in Almaty city, Kazakhstan, a research has been being conducted on developing algorithms for detecting myocardial infarction, and the proposed wearable system for ECG monitoring will be integrated. This decision is to improve the functionality of the system and widen its clinical use.
5. Conclusions
During the research, employing machine learning methods, a wearable device for tracking ECG data followed by au automated disease prediction system was developed. The research results indicate the effectiveness of system’s functions. Worth noting that this is the first ECG system in its kind, covering all the steps of monitoring process.
The system consists of hardware component based on ADS1298 for registering ECG signals. As for software component, JavaScript in Vue.js framework was used to build the client’s module, while web framework Django in Python was employed to create the server. In term of signal interpretation, ECG signals were processed through the following algorithms: artefacts filtration methods using bandpass filtering; K-means for signal segmentation and analyzing PQRST components; and Isolation Forest for detecting anomalies in ECG.
To predict cardiac diseases, there was a comparative analysis of various machine learning methods, where convolutional neuron networks (CNN) demonstrated remarkable performance, reaching the accuracy of 0.926, which indicates its potential in processing ECG data.
Thus, the developed system offers significant potential to enhance the monitoring cardiovascular system and to detect diseases early that can lead to a notable reduction in the risk of cardiovascular diseases in patients.
Supplementary Materials
https://drive.google.com/file/d/1ZgiROs4_czb-mTdjXIraEx4NkBWwjoOE/view - signal retrieved from wearable ECG device. ( it matches the Figure 4). https://drive.google.com/file/d/1NgQhpG77dVegXdtIA2uqjk_Epnz1IFgC/view - identified labels (extension of the table 3). https://drive.google.com/file/d/1_A_cFfNis8nFcL6IdbpftnaE560boNH0/view - data of 132 patients collected for predicting cardiac (extension of the table 5). https://colab.research.google.com/drive/1G2_39F4wvGt2fRbeWY9IKZaZv2SJJ8f2?usp=sharing – the code of ECG signal analysis (ECG signal filter, ECG signal clustering, PQRST wave detection, Anomaly detection in ECG signals). https://colab.research.google.com/drive/1W_VCeQ0Rzkfi89DAoKmBVEPIpN3DiOnP#scrollTo=n3V7hdpOkV0i – the code of medical data analysis using machine learning methods for predicting health condition.
Author Contributions
Conceptualization, Zhadyra Alimbayeva and Kassymbek Ozhikenov; Data curation, Aiman Ozhikenova; Funding acquisition, Zhadyra Alimbayeva; Investigation, Nurlan Bayanbay; Methodology, Chingiz Alimbayev; Project administration, Zhadyra Alimbayeva; Resources, Nurlan Bayanbay and Aiman Ozhikenova; Software, Zhadyra Alimbayeva; Supervision, Kassymbek Ozhikenov; Validation, Zhadyra Alimbayeva and Nurlan Bayanbay; Visualization, Zhadyra Alimbayeva; Writing – original draft, Zhadyra Alimbayeva; Writing – review & editing, Chingiz Alimbayev
Funding
This research was funded by Ministry of Science and Higher Education of the Republic of Kazakhstan, grant number AP14969403.
Acknowledgments
The authors express their gratitude to the creative team, who assisted in obtaining the research results, to Kairat Karibayev, the head of Cardiology center of the Central Clinical Hospital of Almaty, and doctorate candidates Kuanysh Zikirbai and Vladimir Makhonin.
Conflicts of Interest
The authors declare no conflicts of interest.
References
- N. Jainakbayev, A. N. Jainakbayev, A. Mansharipova, K. Kashikova, A. Eshmanova, M. Sakhipov, Screening of Cardiovascular Disease in Kazakhstan, JOURNAL OF PHARMACEUTICAL NEGATIVE RESULTS, 2022. [CrossRef]
- Paech, C. , Kobel, M., Michaelis, A., Gebauer, R., Kalden, P., Dähnert, I.,... Rützel, S. (2022). Accuracy of the Apple Watch single-lead ECG recordings in pre-term neonates. Cardiology in the Young, 32(10), 1633-1637. [CrossRef]
- Kobel, M. , Kalden, P., Michaelis, A. et al. Accuracy of the Apple Watch iECG in Children With and Without Congenital Heart Disease. Pediatr Cardiol 43, 191–196 (2022). [CrossRef]
- Climstein, M.; Alder, J.L.; Brooker, A.M.; Cartwright, E.J.; Kemp-Smith, K.; Simas, V.; Furness, J. Reliability of the Polar Vantage M Sports Watch when Measuring Heart Rate at Different Treadmill Exercise Intensities. Sports 2020, 8, 117. [Google Scholar] [CrossRef] [PubMed]
- J. Escalona, A. Villegas, S. Mukhtar, G. Perpinan, D. J. McEneaney, Wireless Arm Wearable Sensor Band for Long-Term Heart Rhythms Surveillance Using a Bipolar Arm-ECG Lead, IEEE 2020 COMPUTING IN CARDIOLOGY, DOI10.22489/CinC.2020.470, 2020.
- J. Escalona, L. McFrederick, M. Borges, P. Linares, R. Villegas, Perpinan, G. I. Perpinan, J. McLaughlin, Wrist and Arm Body Surface Bipolar ECG Leads Signal and Sensor Study for Long-term Rhythm Monitoring, IEEE COMPUTING IN CARDIOLOGY (CINC). https://doi.org/10.22489/CinC.2017.071-458, 2017. [CrossRef]
- C. Michael Gibson, Steven Steinhubl, Dhanunjaya Lakkireddy, Mintu P. Turakhia, Rod Passman, W. Schuyler Jones, T. Jared Bunch, Anne B. Curtis, Eric D. Peterson, Jeremy Ruskin, Leslie Saxon, Michael Tarino, Khaldoun G. Tarakji, Nassir Marrouche, Mithun Patel, Ante Harxhi, Simrati Kaul, Janeta Nikolovski, Stephanie Juan, Kevin Wildenhaus, C.V. Damaraju, John A. Spertus, Does early detection of atrial fibrillation reduce the risk of thromboembolic events? Rationale and design of the Heartline study, American Heart Journal, Volume 259, 2023, Pages 30-41. [CrossRef]
- Cosoli, G.; Antognoli, L.; Scalise, L. Wearable Electrocardiography for Physical Activity Monitoring: Definition of Validation Protocol and Automatic Classification. Biosensors 2023, 13, 154. [Google Scholar] [CrossRef]
- Alizadeh Meghrazi, M. , Tian, Y., Mahnam, A. et al. Multichannel ECG recording from waist using textile sensors. BioMed Eng OnLine 19, 48 (2020). [CrossRef]
- Brehm, P.J.; Anderson, A.P. Modeling the Design Characteristics of Woven Textile Electrodes for long−Term ECG Monitoring. Sensors 2023, 23, 598. [Google Scholar] [CrossRef] [PubMed]
- Sławomir Boncel, Rafał G. Jędrysiak, Marek Czerw, Anna Kolanowska, Anna W. Blacha, Maciej Imielski, Bertrand Jóźwiak, Marzena H. Dzida, Heather F. Greer, and Aleksander Sobotnicki, Paintable Carbon Nanotube Coating-Based Textronics for Sustained Holter-Type Electrocardiography, ACS Applied Nano Materials 2022 5 (10), 15762-15774. [CrossRef]
- Steinberg, C.; Philippon, F.; Sanchez, M.; Fortier-Poisson, P.; O’Hara, G.; Molin, F.; Sarrazin, J.-F.; Nault, I.; Blier, L.; Roy, K.; Plourde, B.; Champagne, J. A Novel Wearable Device for Continuous Ambulatory ECG Recording: Proof of Concept and Assessment of Signal Quality. Biosensors 2019, 9, 17. [Google Scholar] [CrossRef] [PubMed]
- Hafid, A.; Gunnarsson, E.; Ramos, A.; Rödby, K.; Abtahi, F.; Bamidis, P.D.; Billis, A.; Papachristou, P.; Seoane, F. Sensorized T-Shirt with Intarsia-Knitted Conductive Textile Integrated Interconnections: Performance Assessment of Cardiac Measurements during Daily Living Activities. Sensors 2023, 23, 9208. [Google Scholar] [CrossRef] [PubMed]
- A novel low-complexity digital filter design for wearable apparatus. Shadnaz Asgari, Alireza Mehrnia, Published: April 6, 2017. [CrossRef]
- Xu, W.; Wang, T.; Wei, X.; Yue, H.; Wei, B.; Duan, J.; Li, H. Low Noise, High Input Impedance Digital-Analog Hybrid Offset Suppression Amplifier for Wearable Dry Electrode ECG Monitoring. Electronics 2020, 9, 165. [Google Scholar] [CrossRef]
- A Micropower Motion Artifact Estimator for Input Dynamic Range Reduction in Wearable ECG Acquisition Systems, Pholpoke, B; Songthawornpong, T; Wattanapanitch, W., IEEE transactions on biomedical circuits and systems, Volume 13, Issue 5, Page 1021-1035, 2019. [CrossRef]
- El Attaoui, A. , Hazmi, M., Jilbab, A. et al. Wearable Wireless Sensors Network for ECG Telemonitoring Using Neural Network for Features Extraction. Wireless Pers Commun 111, 1955–1976 (2020). [CrossRef]
- Fu, F. , Xiang, W., An, Y. et al. Comparison of Machine Learning Algorithms for the Quality Assessment of Wearable ECG Signals Via Lenovo H3 Devices. J. Med. Biol. Eng. 41, 231–240 (2021). [CrossRef]
- C. Venkatesan, P. C. Venkatesan, P. Karthigaikumar, A. Paul, S. Satheeskumaran and R. Kumar, "ECG Signal Preprocessing and SVM Classifier-Based Abnormality Detection in Remote Healthcare Applications," in IEEE Access, vol. 6, pp. 9767-9773, 2018. [CrossRef]
- Hadiyoso, S. , Fahrozi, F., Hariyani, Y. S., & Sulistyo, M. D. (2022). Image Based ECG Signal Classification Using Convolutional Neural Network. International Journal of Online and Biomedical Engineering (iJOE), 18(04), pp. 64–78. [CrossRef]
- Sraitih,M.;Jabrane,Y.; Hajjam El Hassani, A. An Automated System for ECG Arrhythmia Detection Using Machine Learning Techniques. J. Clin. Med. 2021, 10, 5450. [CrossRef]
- Alfaras M, Soriano MC and Ortín S (2019) A Fast Machine Learning Model for ECG-Based Heartbeat Classification and Arrhythmia Detection. Front. Phys. 7:103. [CrossRef]
- Aspuru, J.; Ochoa-Brust, A.; Félix, R.A.; Mata-López, W.; Mena, L.J.; Ostos, R.; Martínez-Peláez, R. Segmentation of the ECG Signal by Means of a Linear Regression Algorithm. Sensors 2019, 19, 775. [Google Scholar] [CrossRef] [PubMed]
- J. -N. Lee and K. -C. Kwak, "ECG-Based Biometrics Using a Deep Network Based on Independent Component Analysis," in IEEE Access, vol. 10, pp. 12913-12926, 2022. [CrossRef]
- Santos Rodrigues, A.; Augustauskas, R.; Lukoševicˇius, M.; Laguna, P.; Marozas, V. Deep-Learning-Based Estimation of the Spatial QRS-T Angle from Reduced-Lead ECGs. Sensors 2022, 22, 5414. [Google Scholar] [CrossRef]
- Kishore B, A. Nanda Gopal Reddy, Anila Kumar Chillara, Wesam Atef Hatamleh, Kamel Dine Haouam, Rohit Verma, B. Lakshmi Dhevi, Henry Kwame Atiglah, "An Innovative Machine Learning Approach for Classifying ECG Signals in Healthcare Devices", Journal of Healthcare Engineering, vol. 2022, Article ID 7194419, 16 pages, 2022. [CrossRef]
- Luis, J. Mena, Vanessa G. Félix, Alberto Ochoa, Rodolfo Ostos, Eduardo González, Javier Aspuru, Pablo Velarde, Gladys E. Maestre, "Mobile Personal Health Monitoring for Automated Classification of Electrocardiogram Signals in Elderly", Computational and Mathematical Methods in Medicine, vol. 2018, Article ID 9128054, 9 pages, 2018. [CrossRef]
- Marinucci, D.; Sbrollini, A.; Marcantoni, I.; Morettini, M.; Swenne, C.A.; Burattini, L. Artificial Neural Network for Atrial Fibrillation Identification in Portable Devices. Sensors 2020, 20, 3570. [Google Scholar] [CrossRef] [PubMed]
- Jeon E, Oh K, Kwon S, Son H, Yun Y, Jung E, Kim M, A Lightweight Deep Learning Model for Fast Electrocardiographic Beats Classification With a Wearable Cardiac Monitor: Development and Validation Study, JMIR Med Inform 2020;8(3):e17037, URL: https://medinform.jmir.org/2020/3/e17037. [CrossRef]
- Ponciano, V.; Pires, I.M.; Ribeiro, F.R.; Garcia, N.M.; Villasana, M.V.; Zdravevski, E.; Lameski, P. Machine Learning Techniques with ECG and EEG Data: An Exploratory Study. Computers 2020, 9, 55. [Google Scholar] [CrossRef]
Figure 1.
Structure of a wearable system for cardio diagnostics.
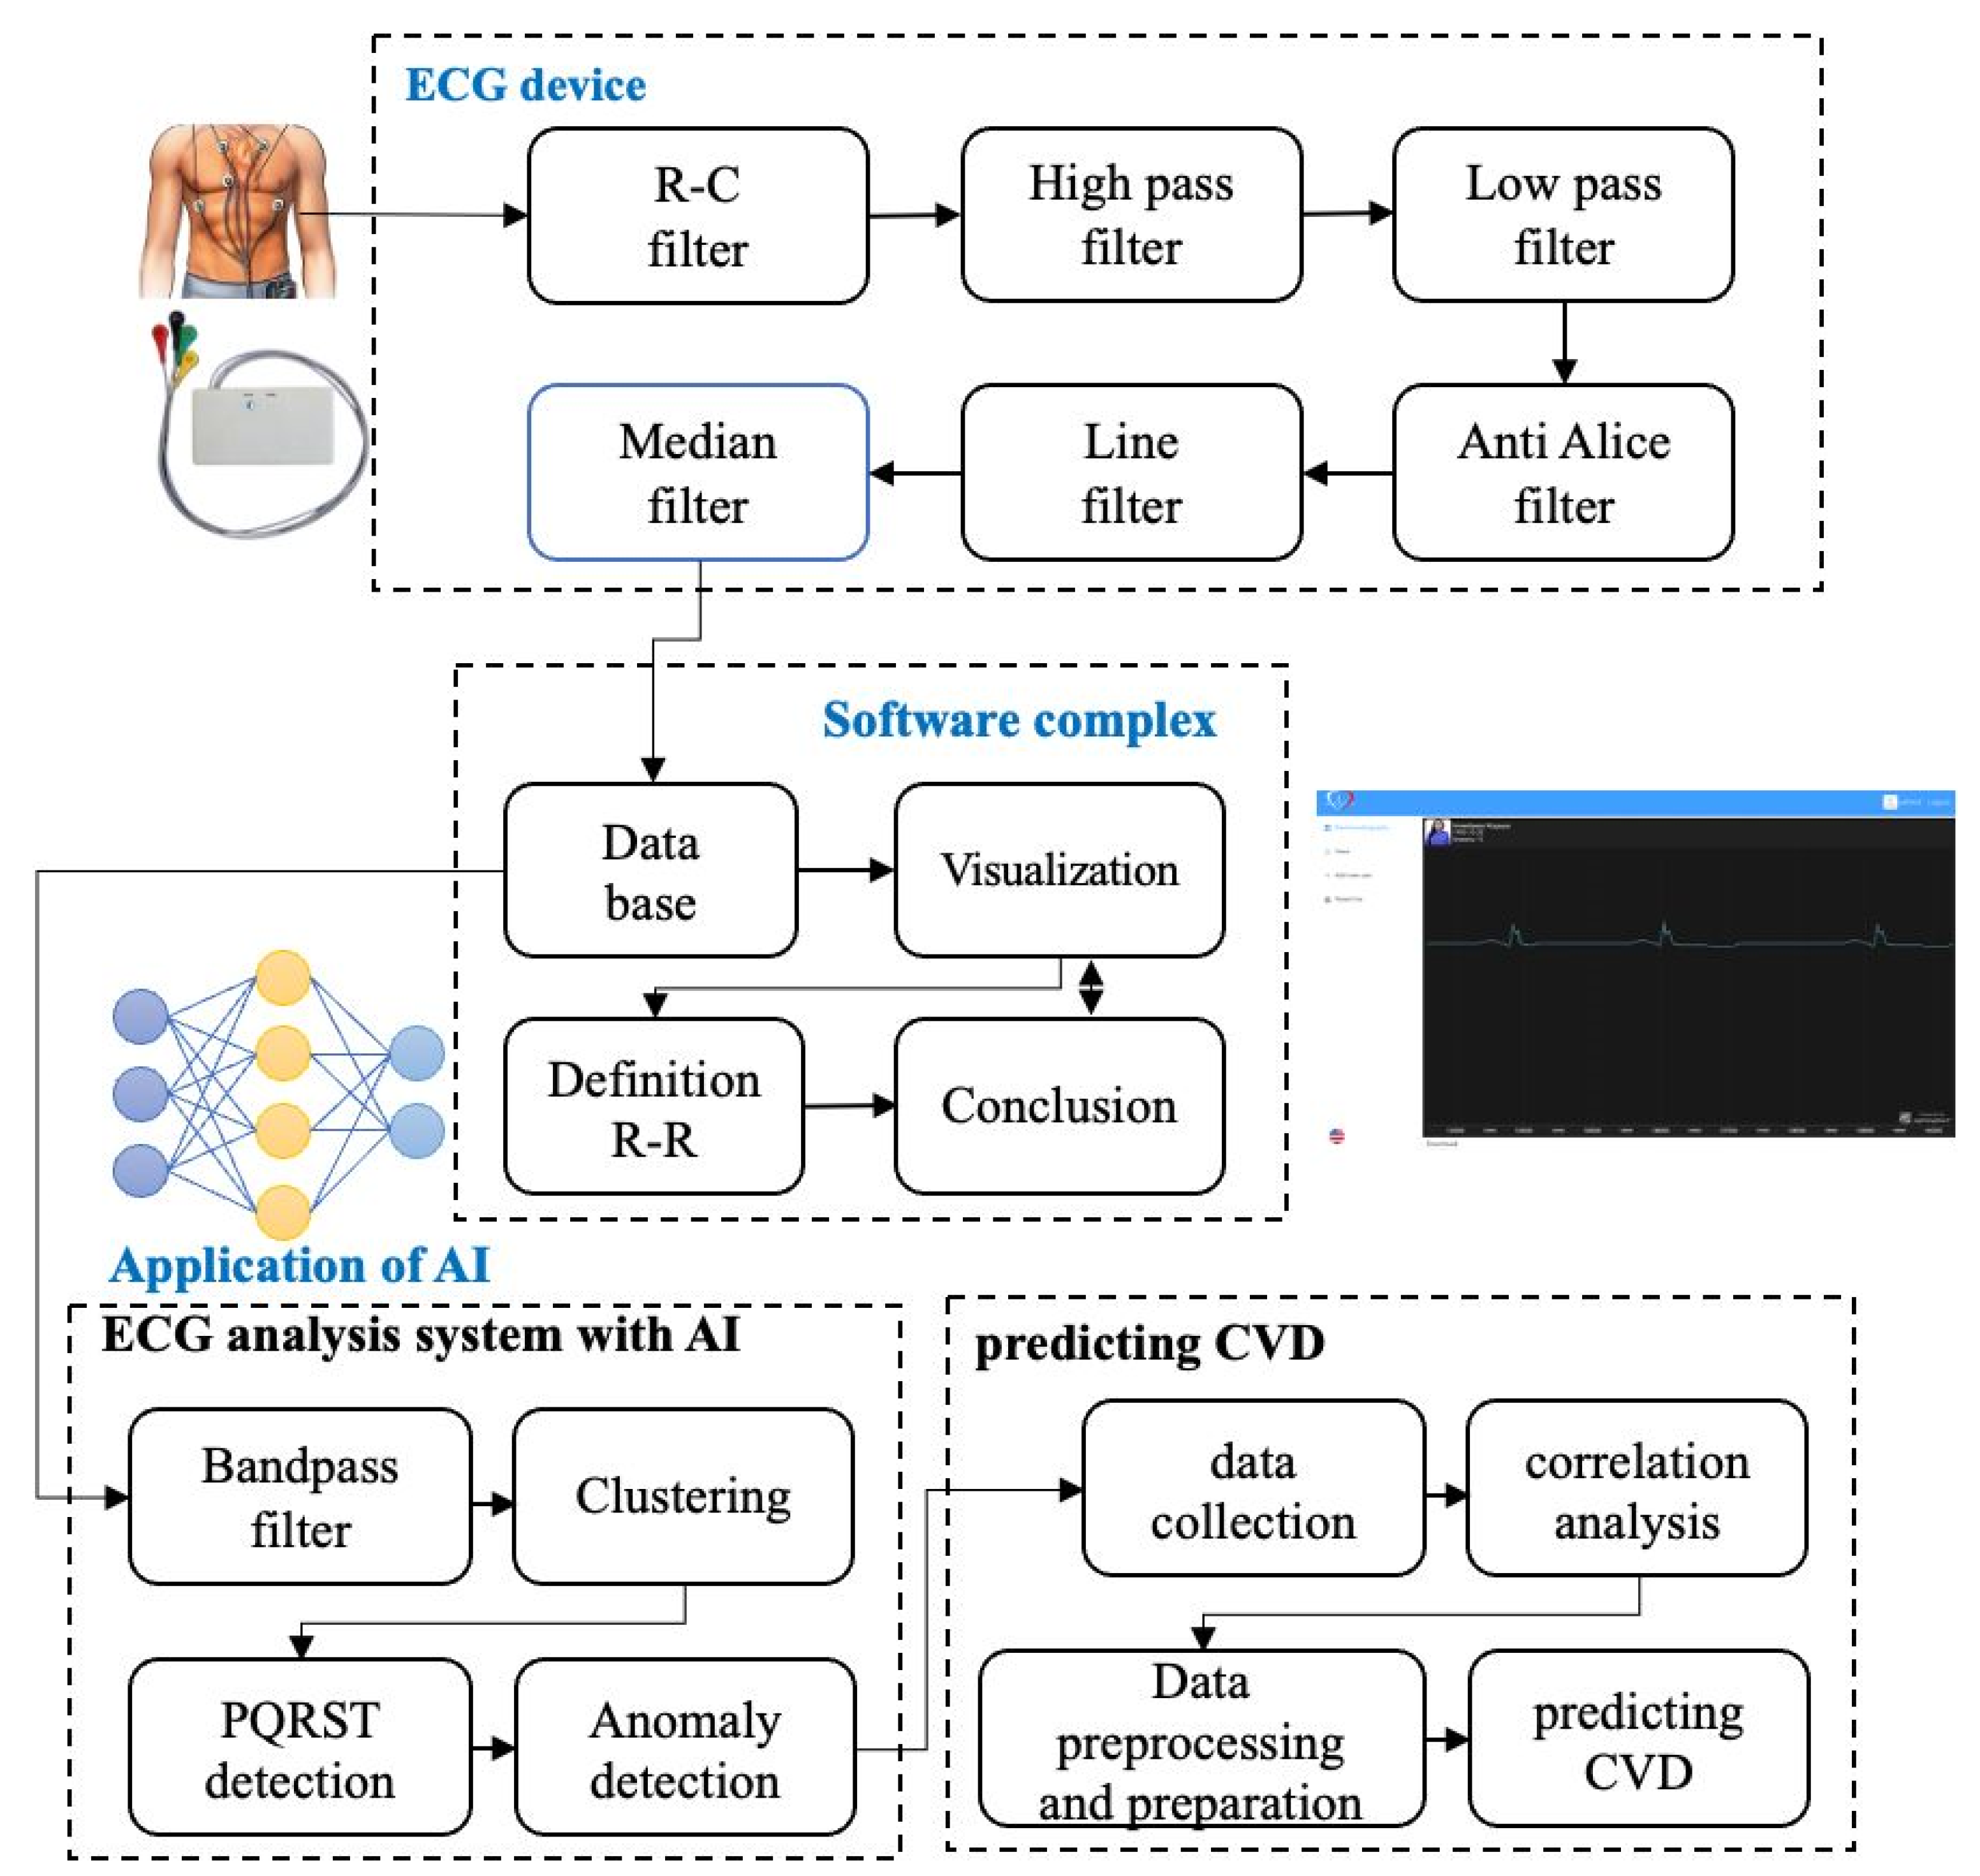
Figure 2.
a prototype of wearable ECG device, developed at the Satbayev University. а – external view; b - board.
Figure 2.
a prototype of wearable ECG device, developed at the Satbayev University. а – external view; b - board.
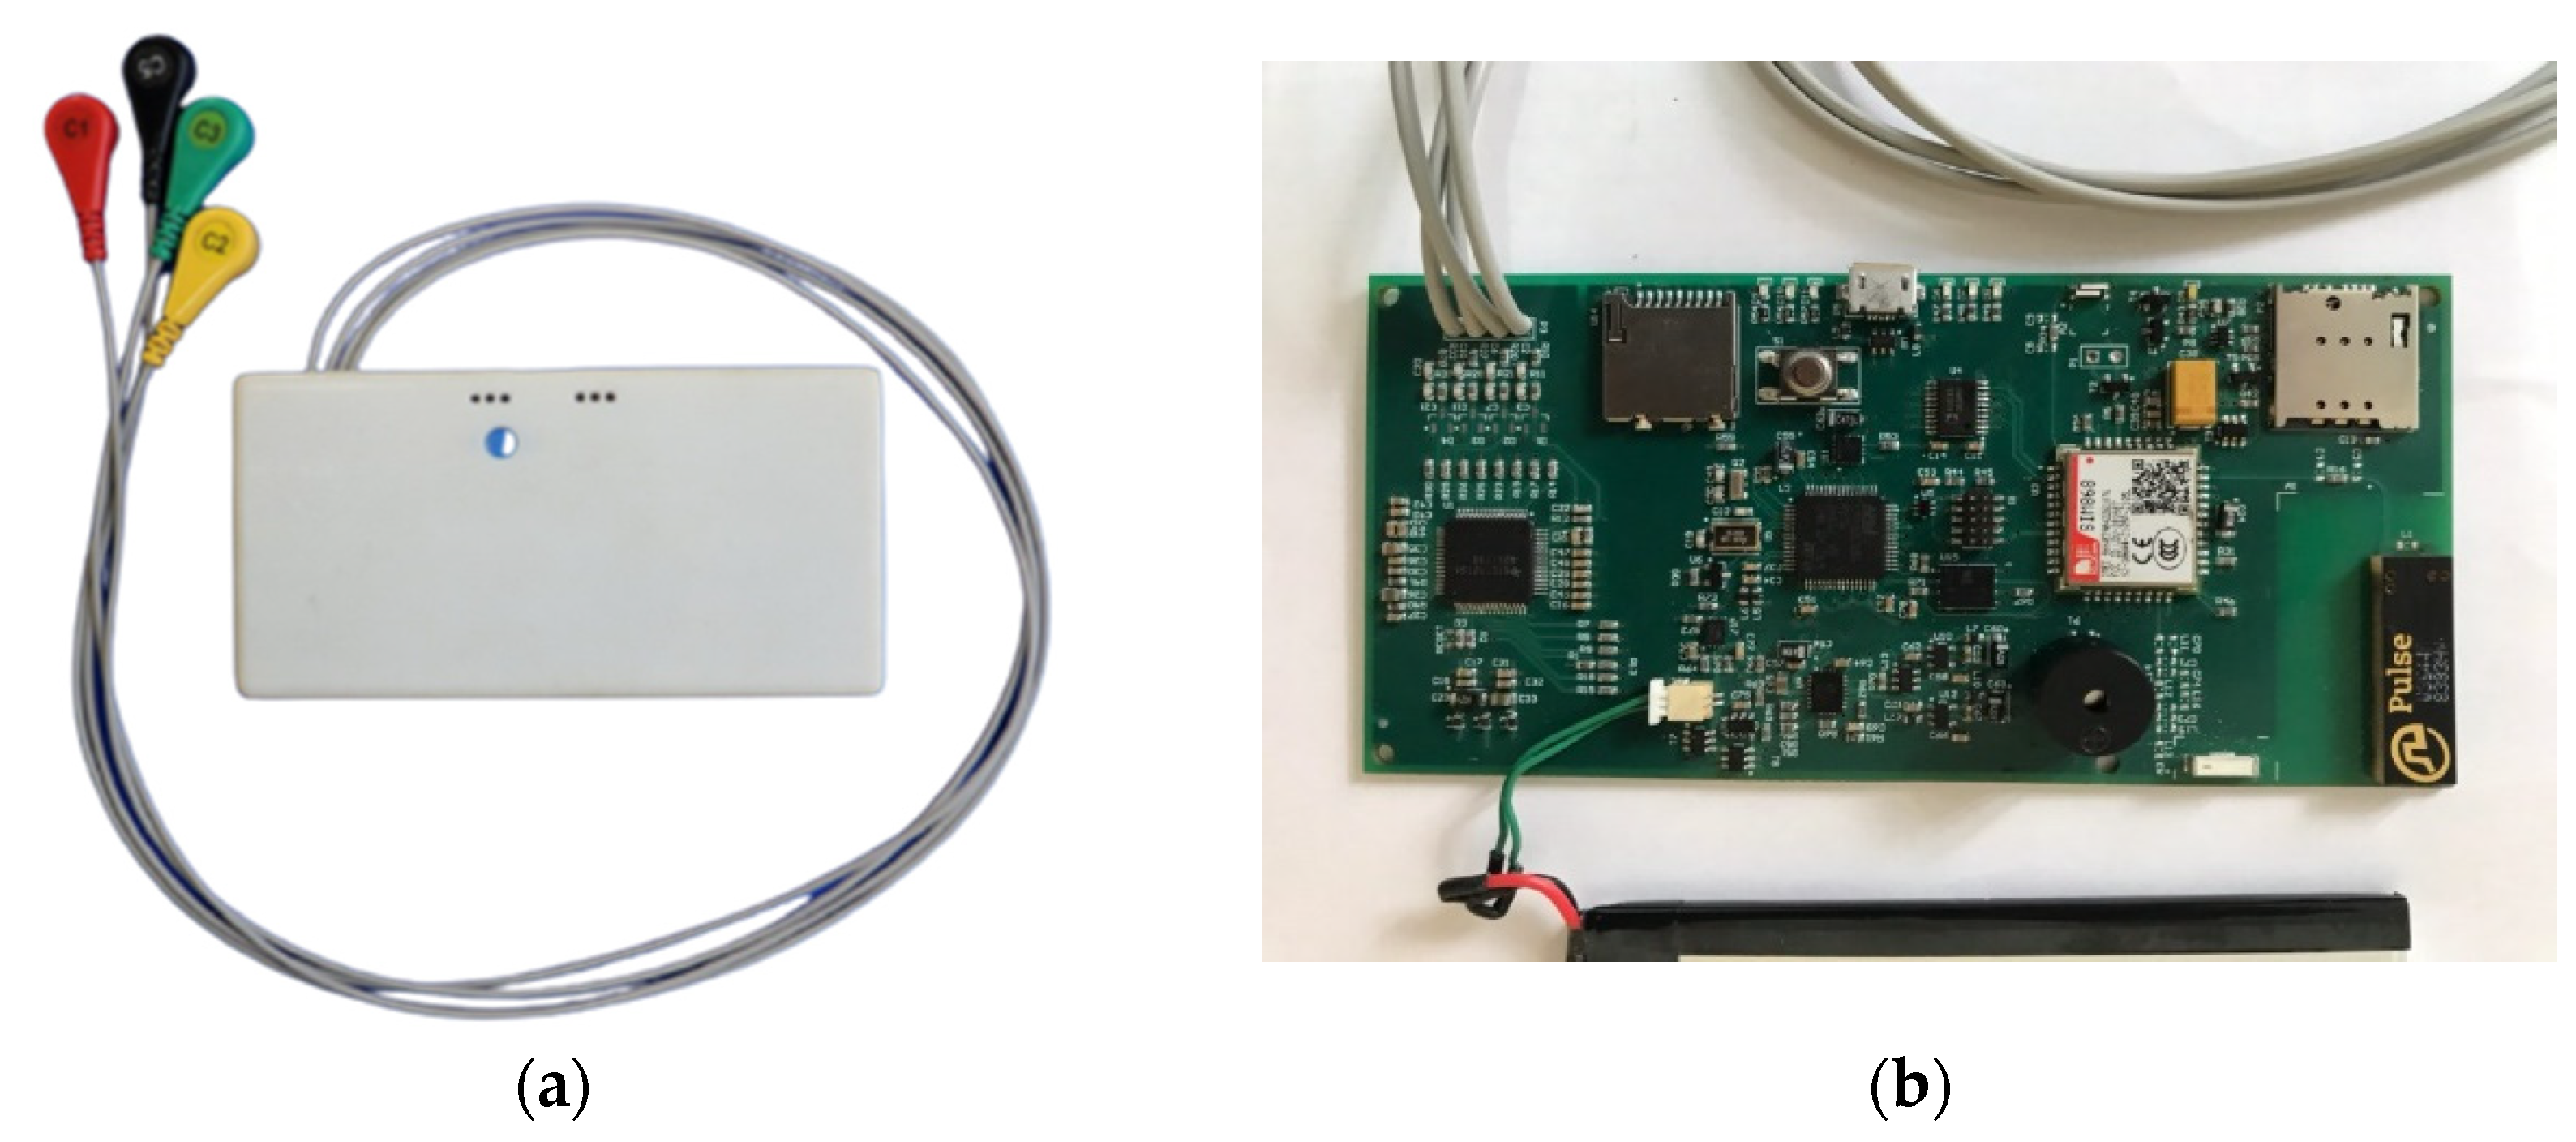
Figure 3.
Functional block diagram of ECG device.
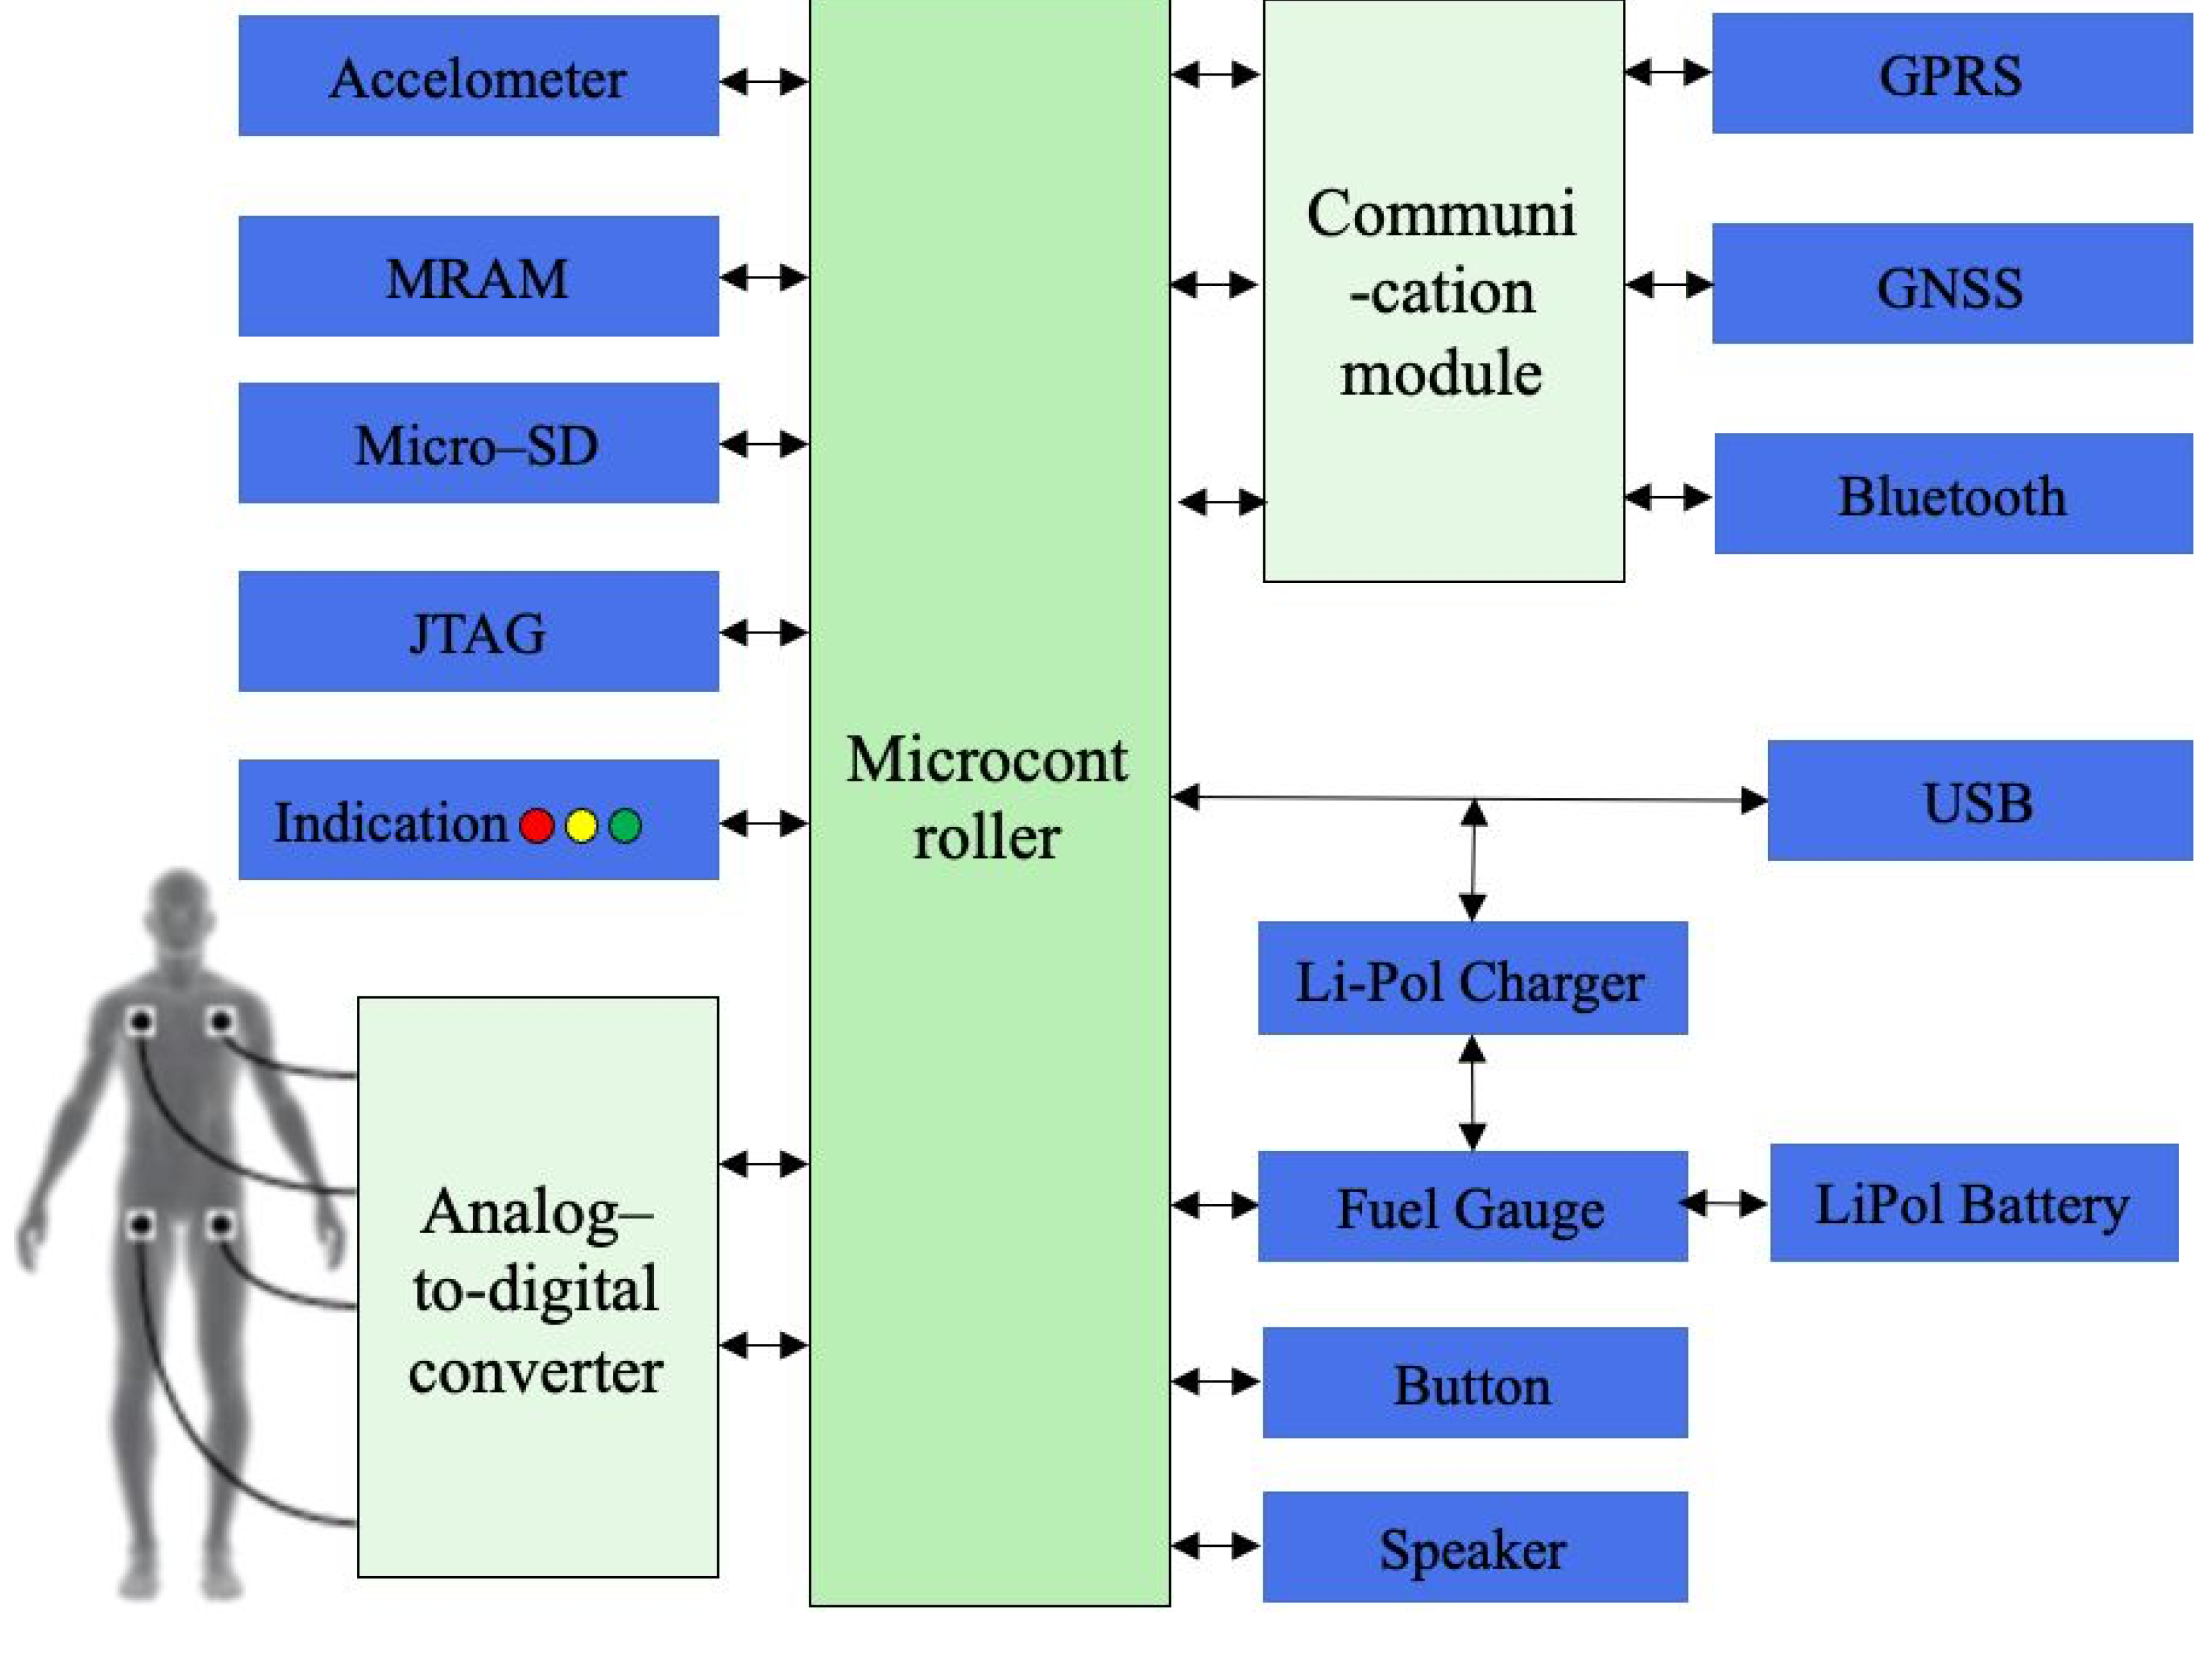
Figure 4.
Retrieved signals from wearable ECG device.
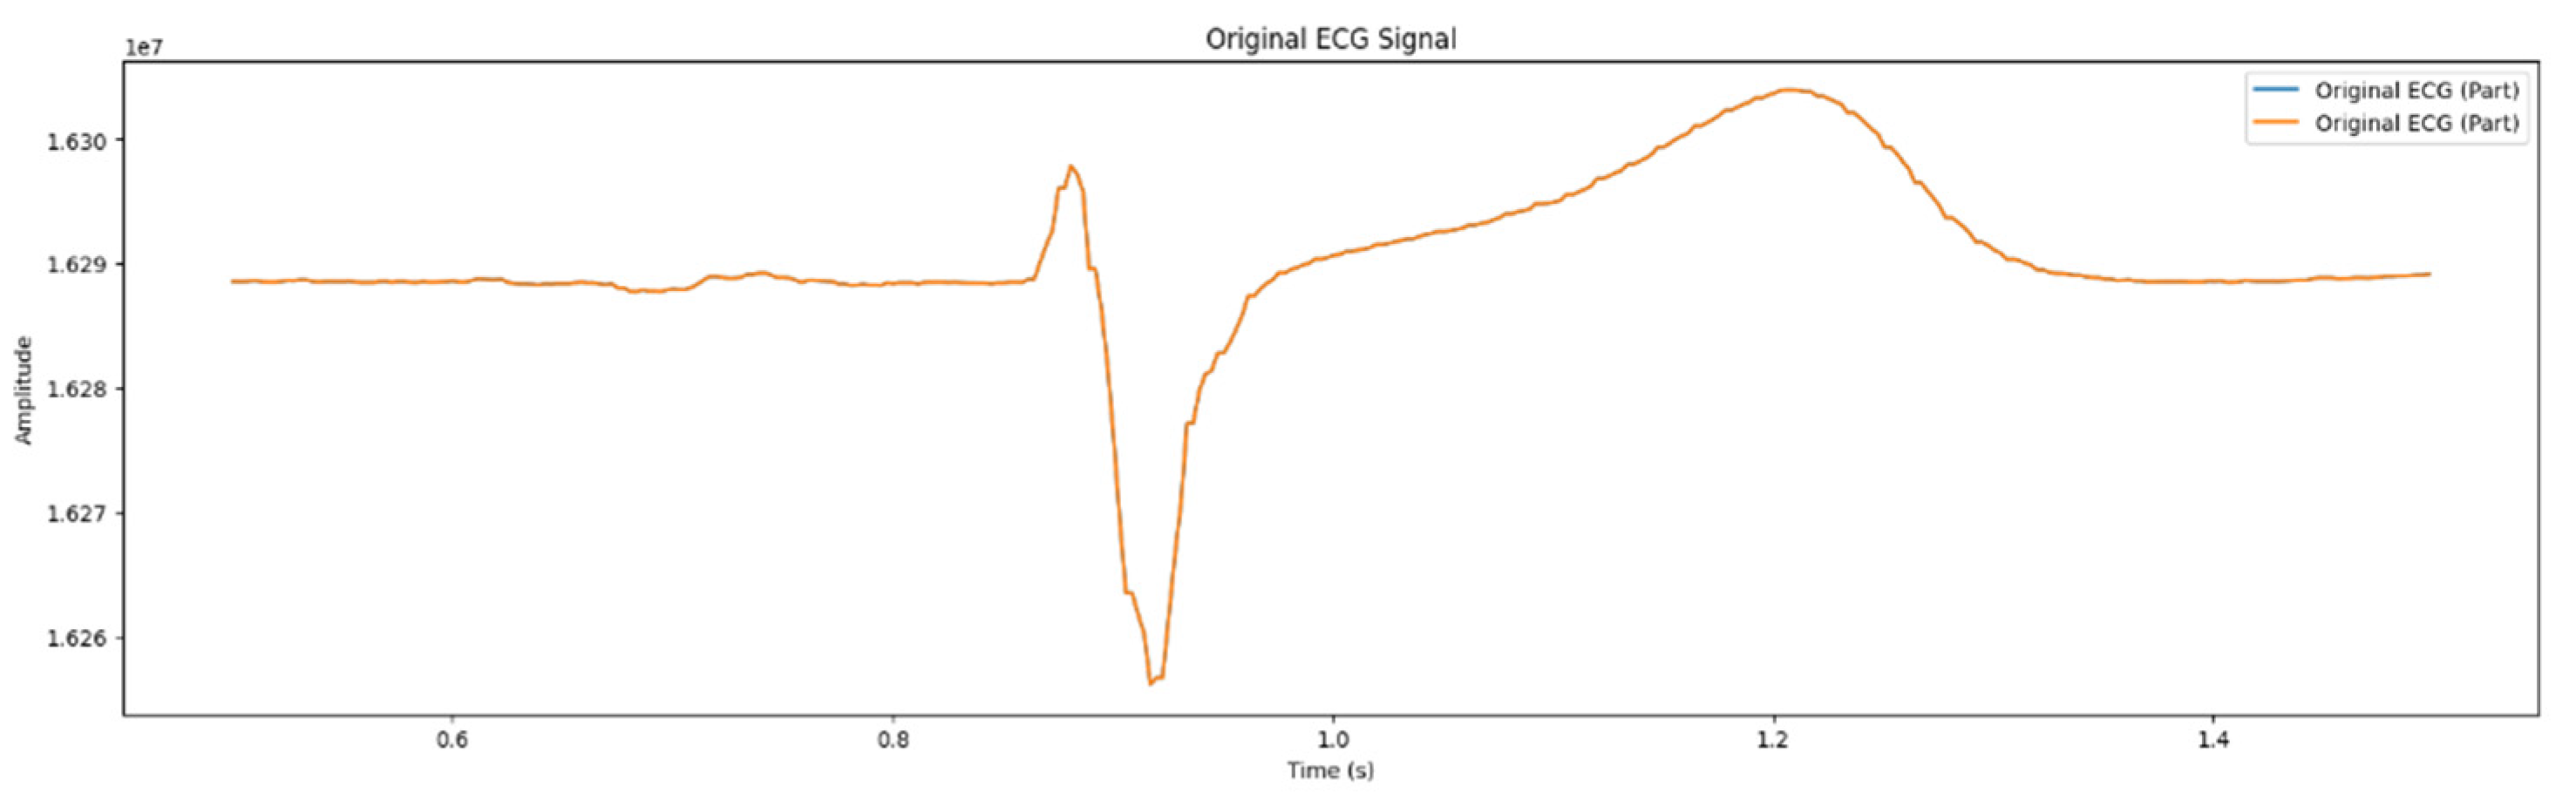
Figure 5.
ECG signals after software implementation of a bandpass filter.
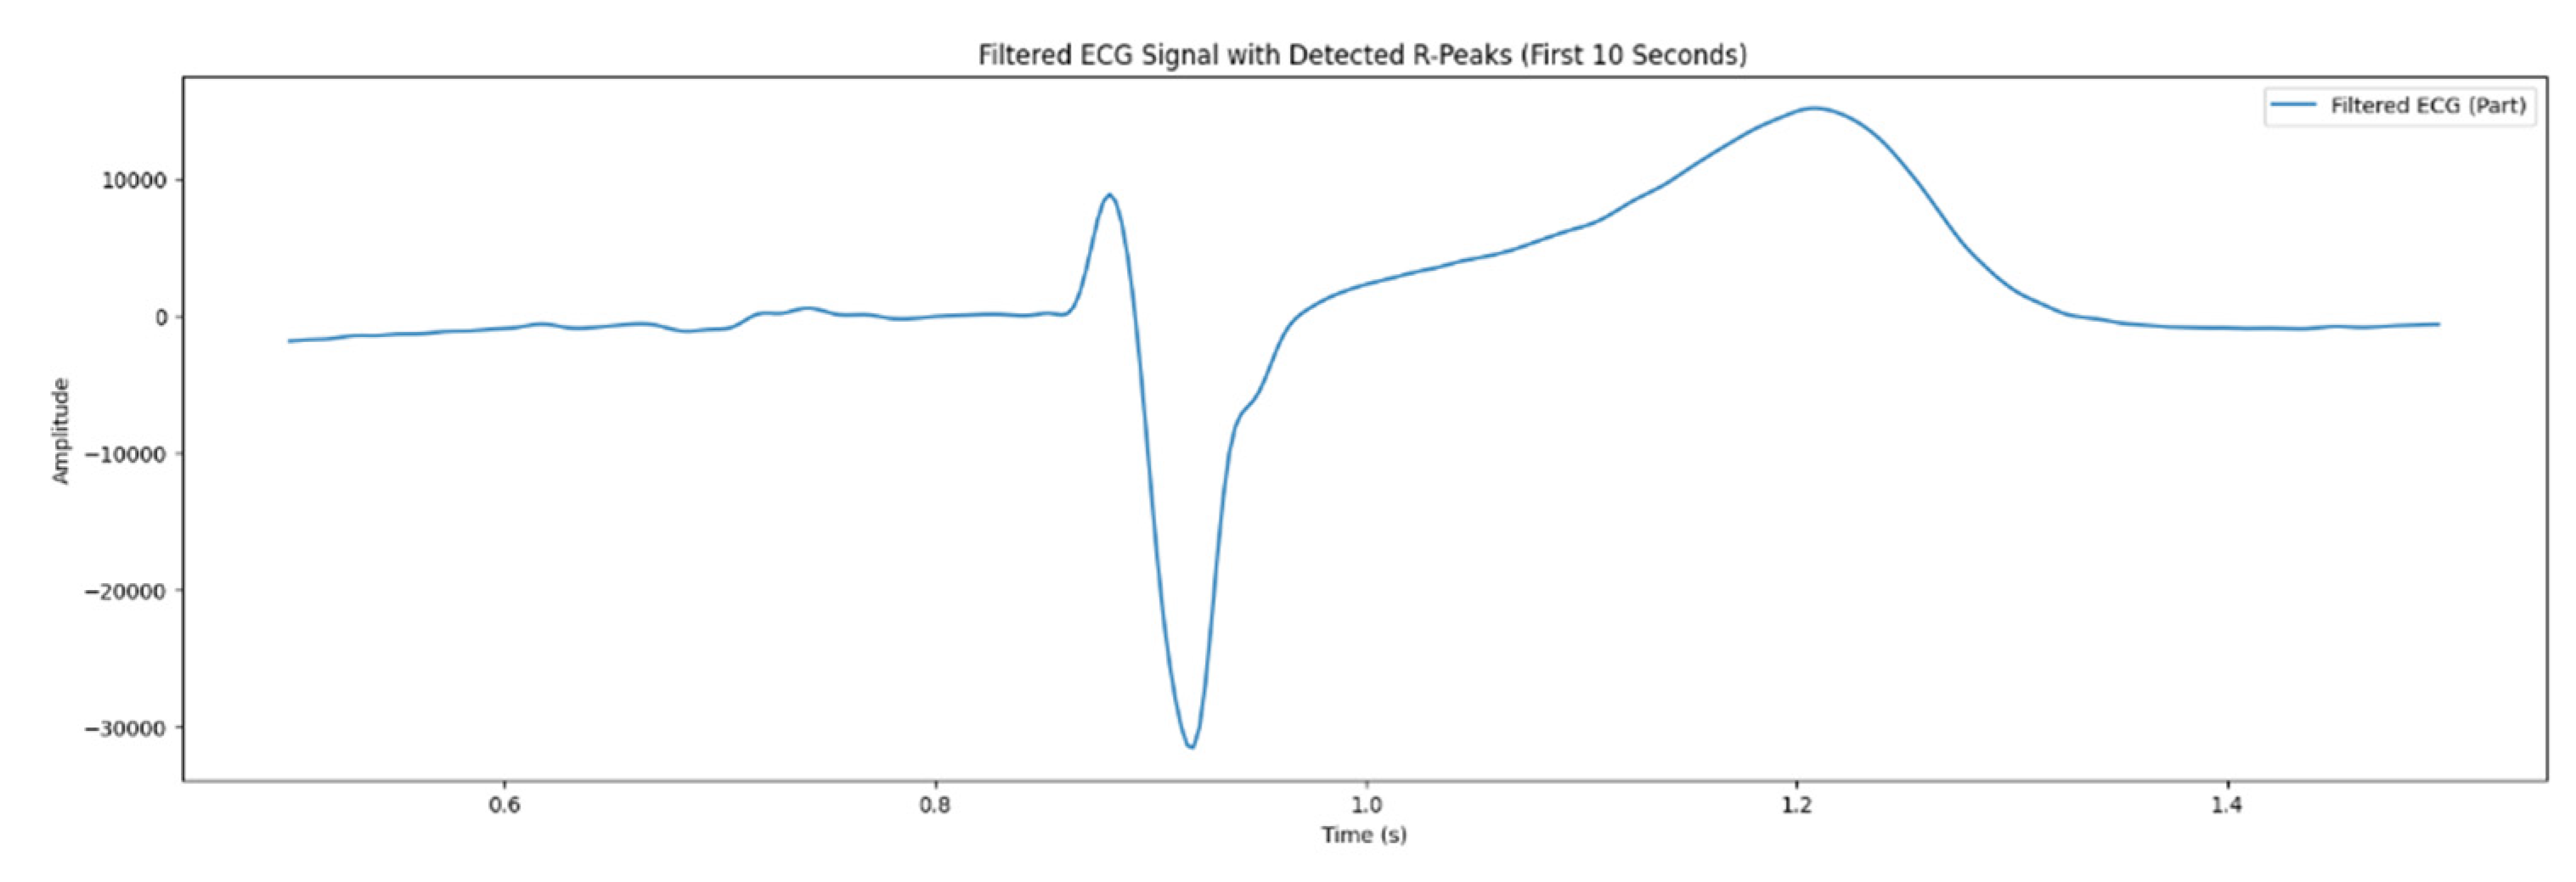
Figure 6.
Clustering signals by their features.
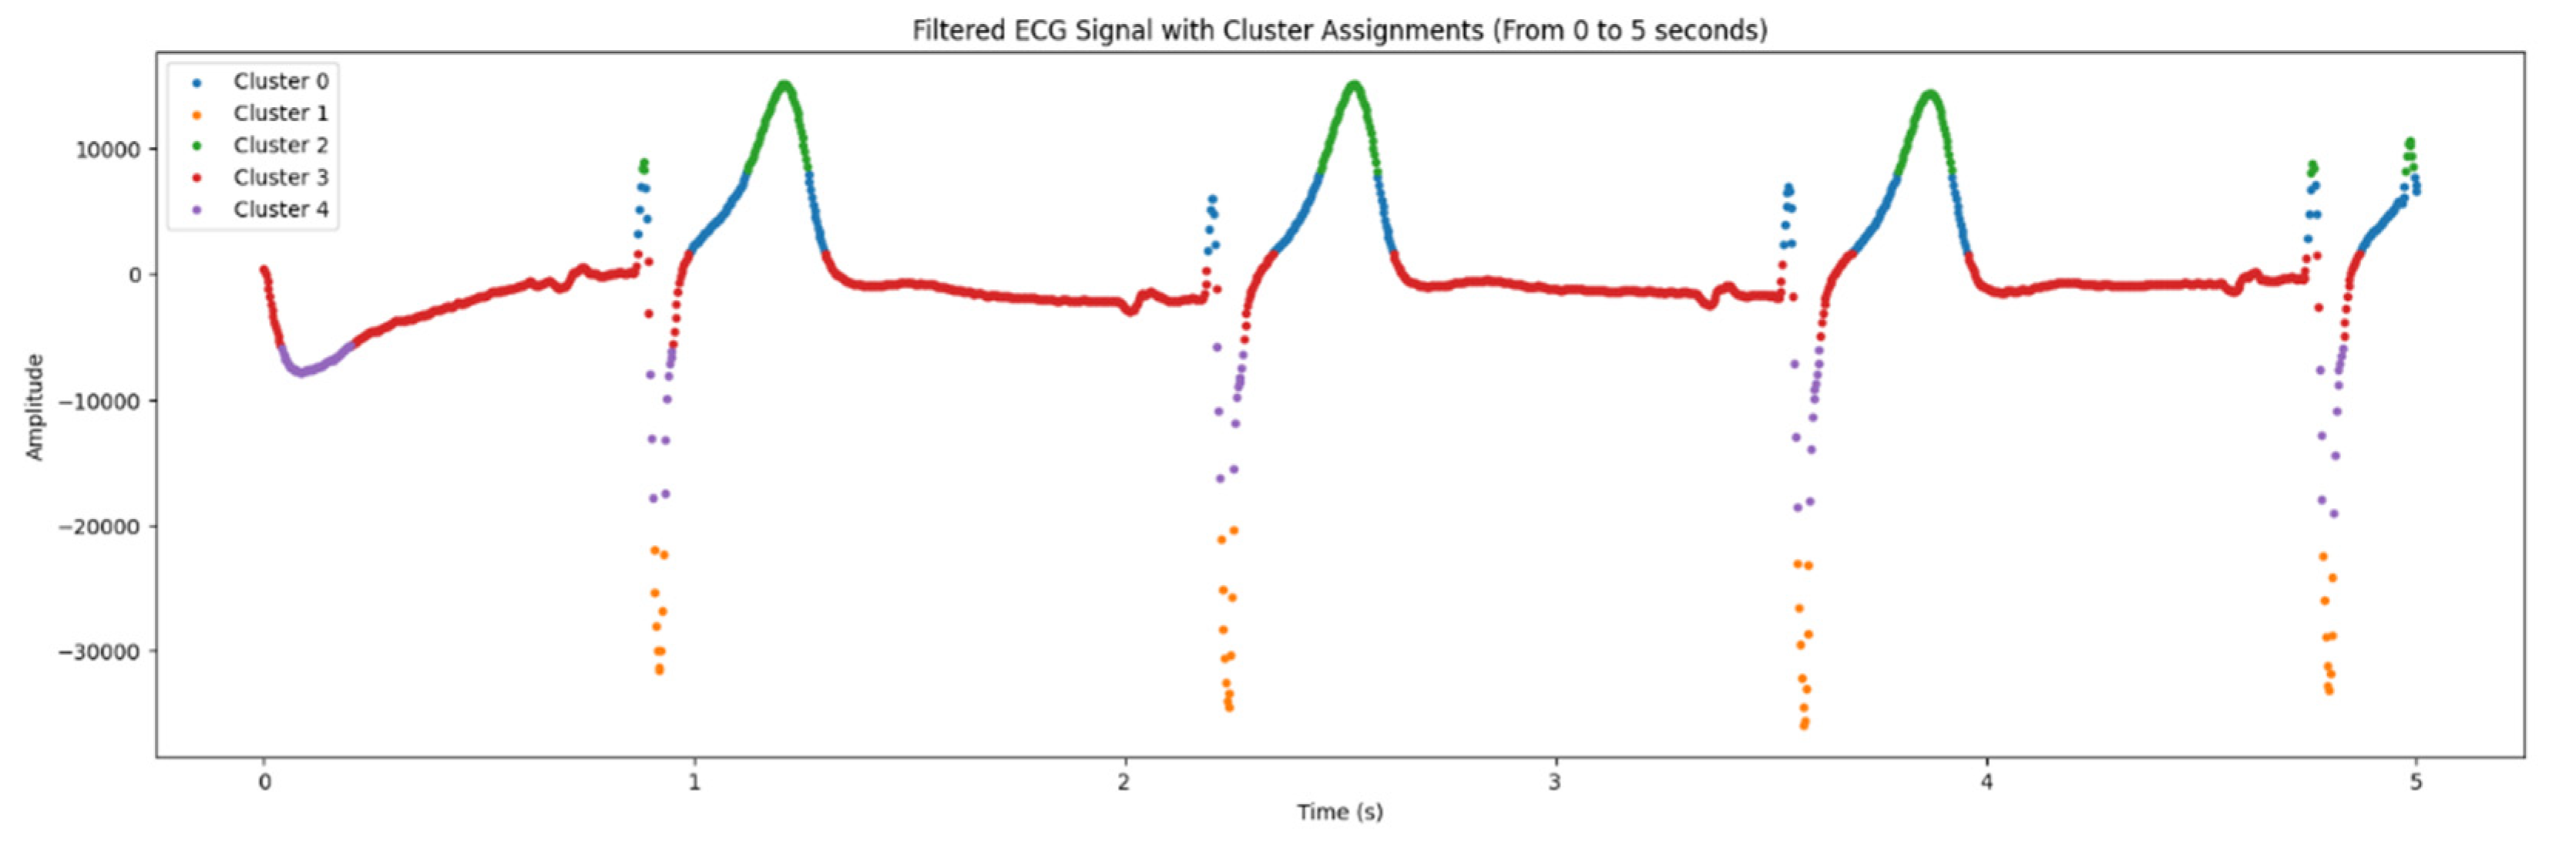
Figure 7.
The result of correct the polarity of signal.
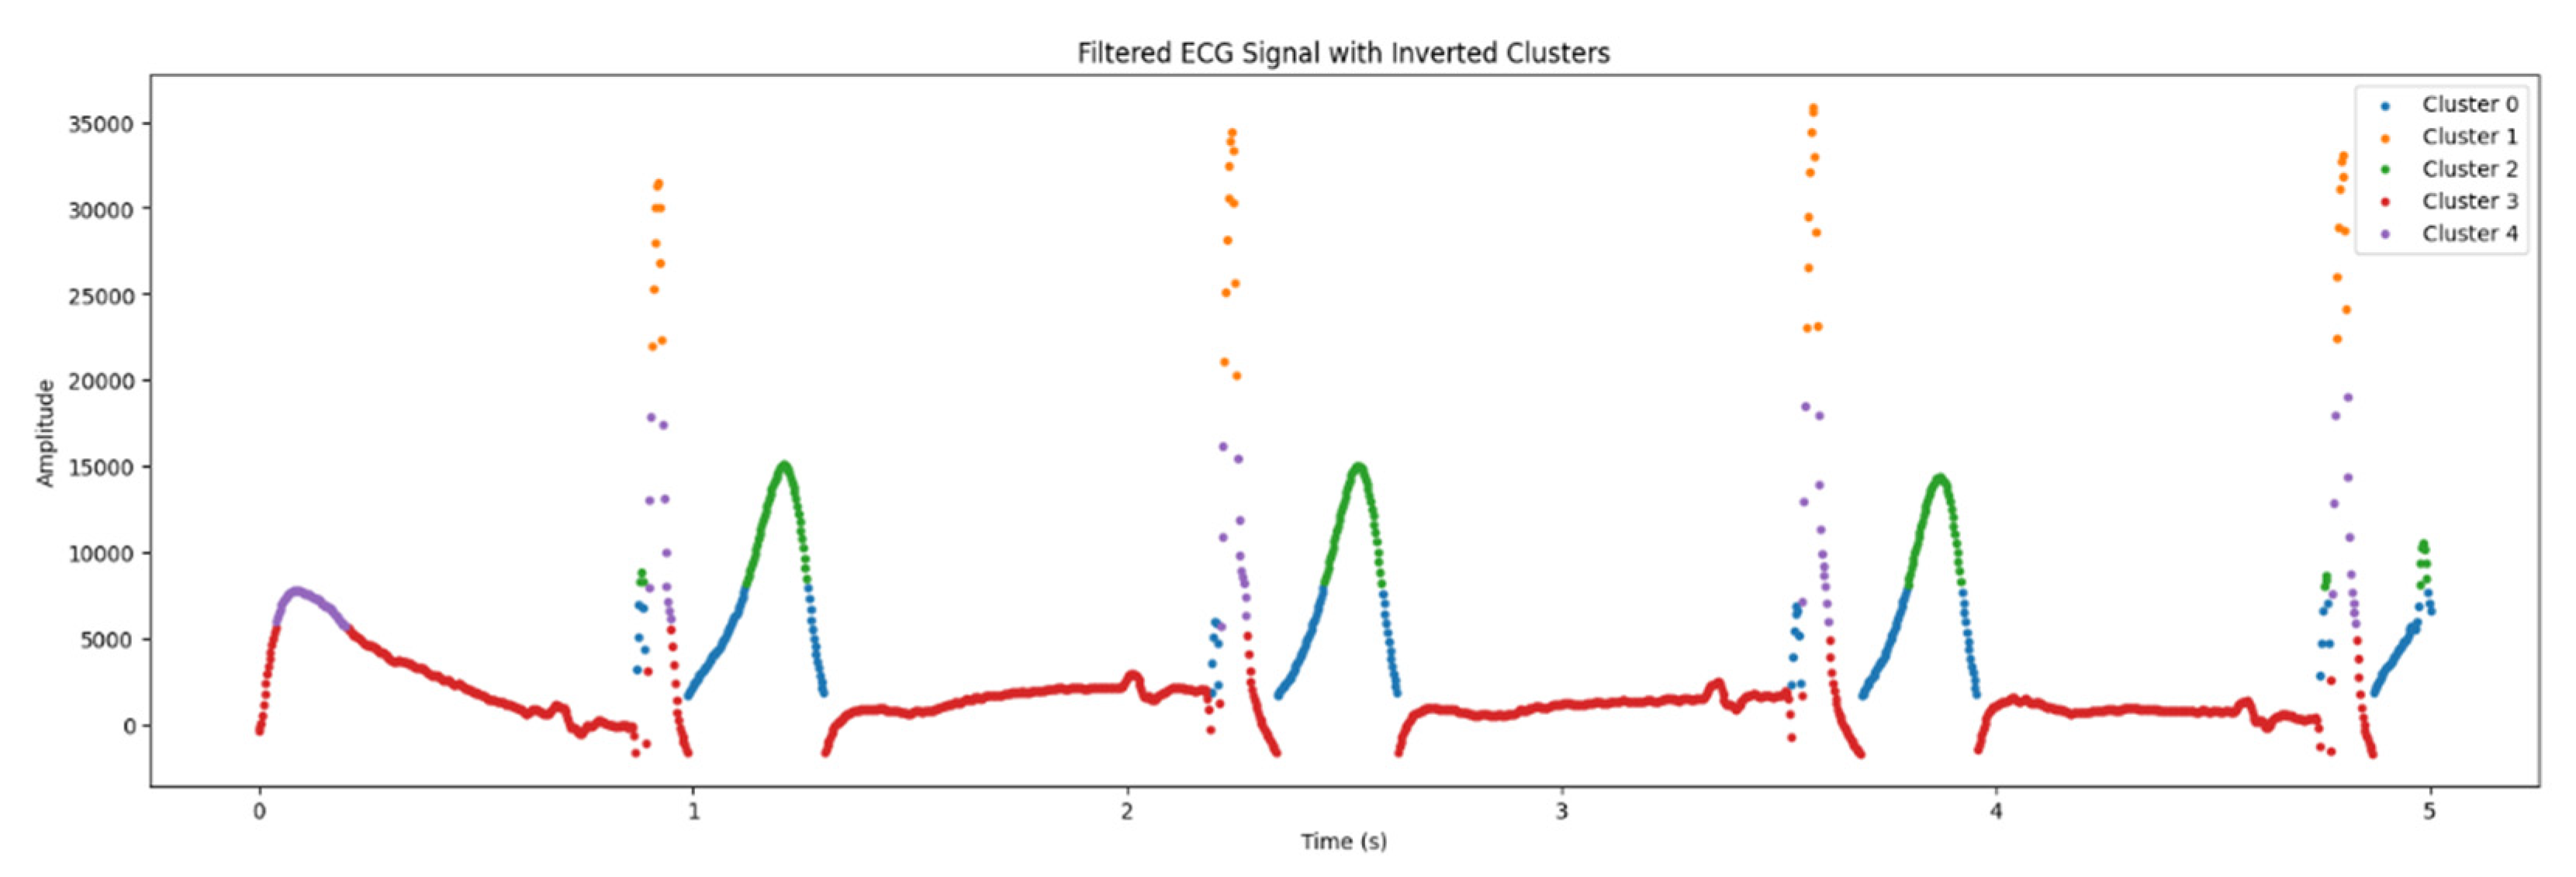
Figure 8.
A proper visualized ECG signal.
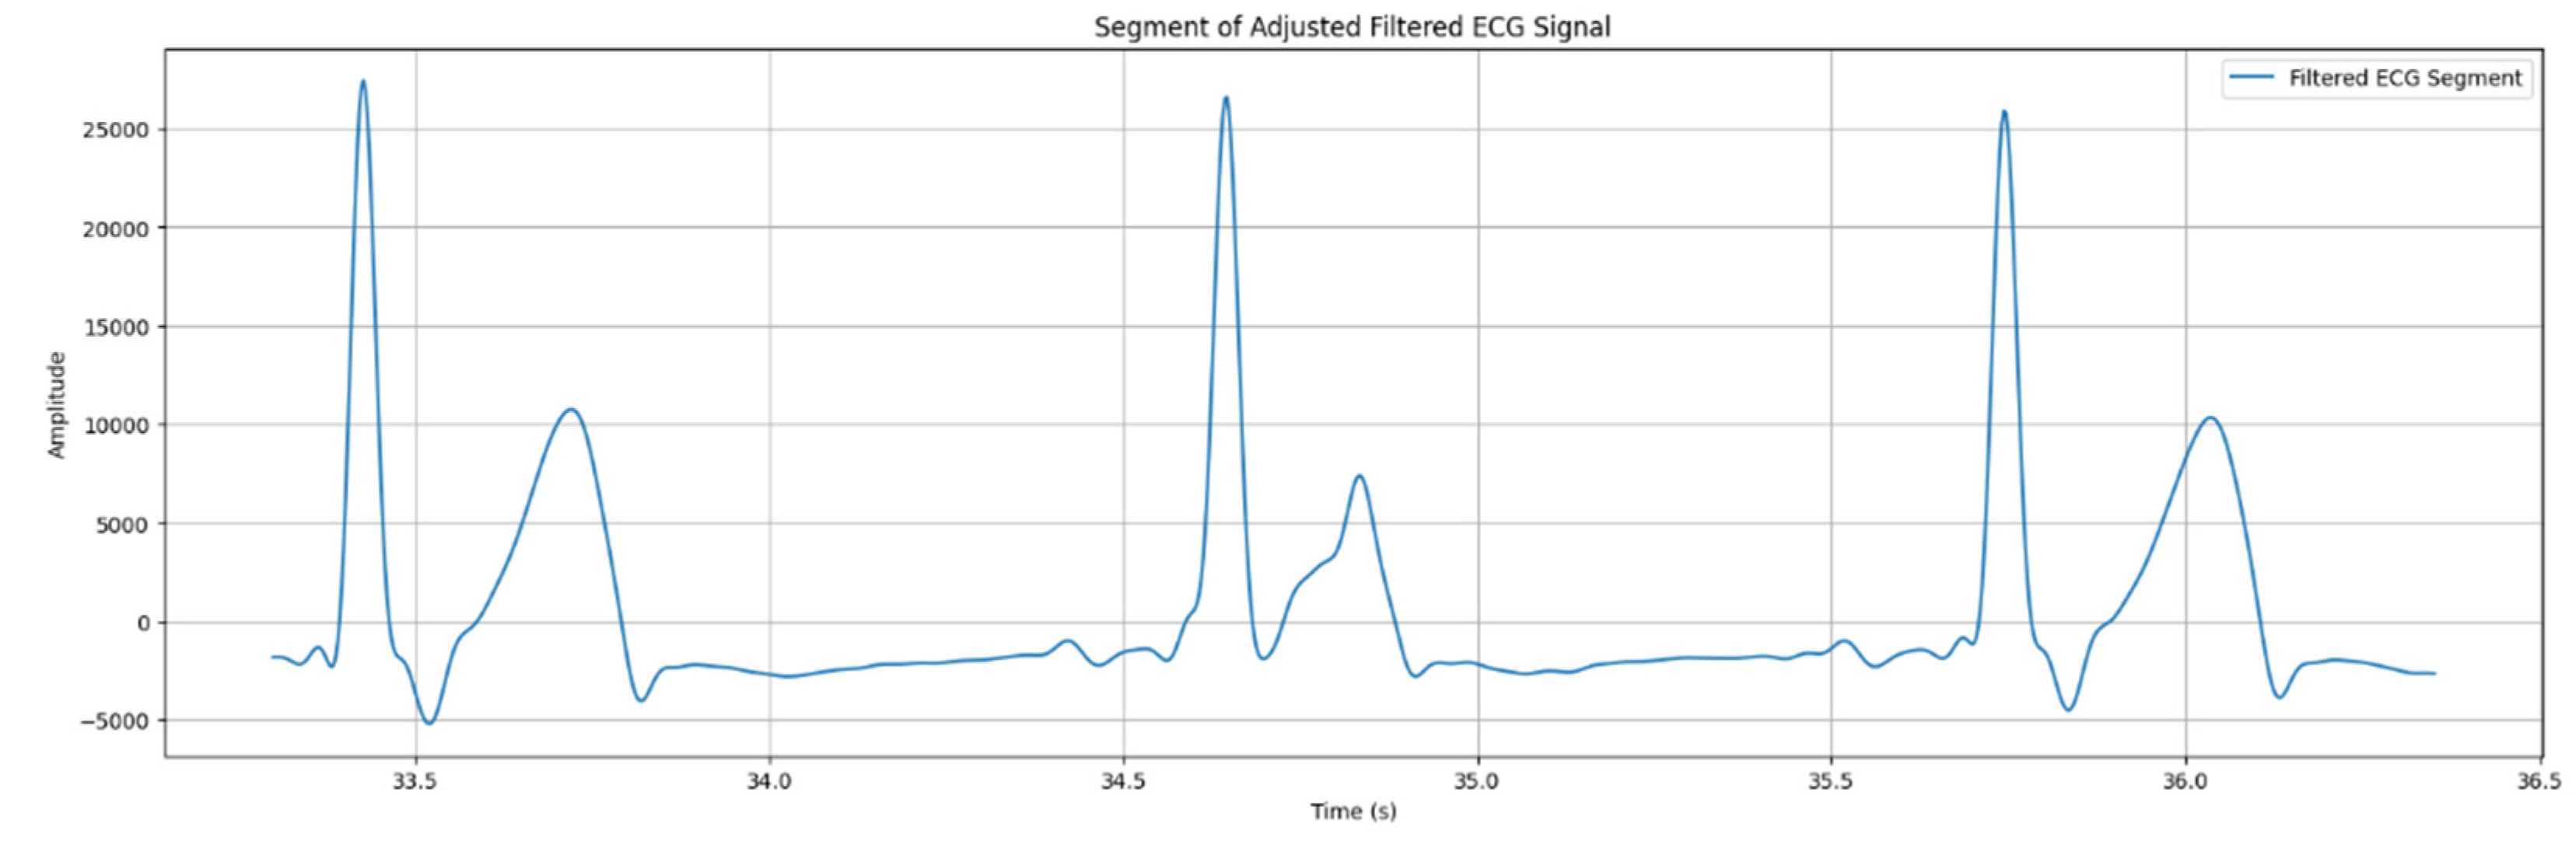
Figure 9.
PQRST wave detection.
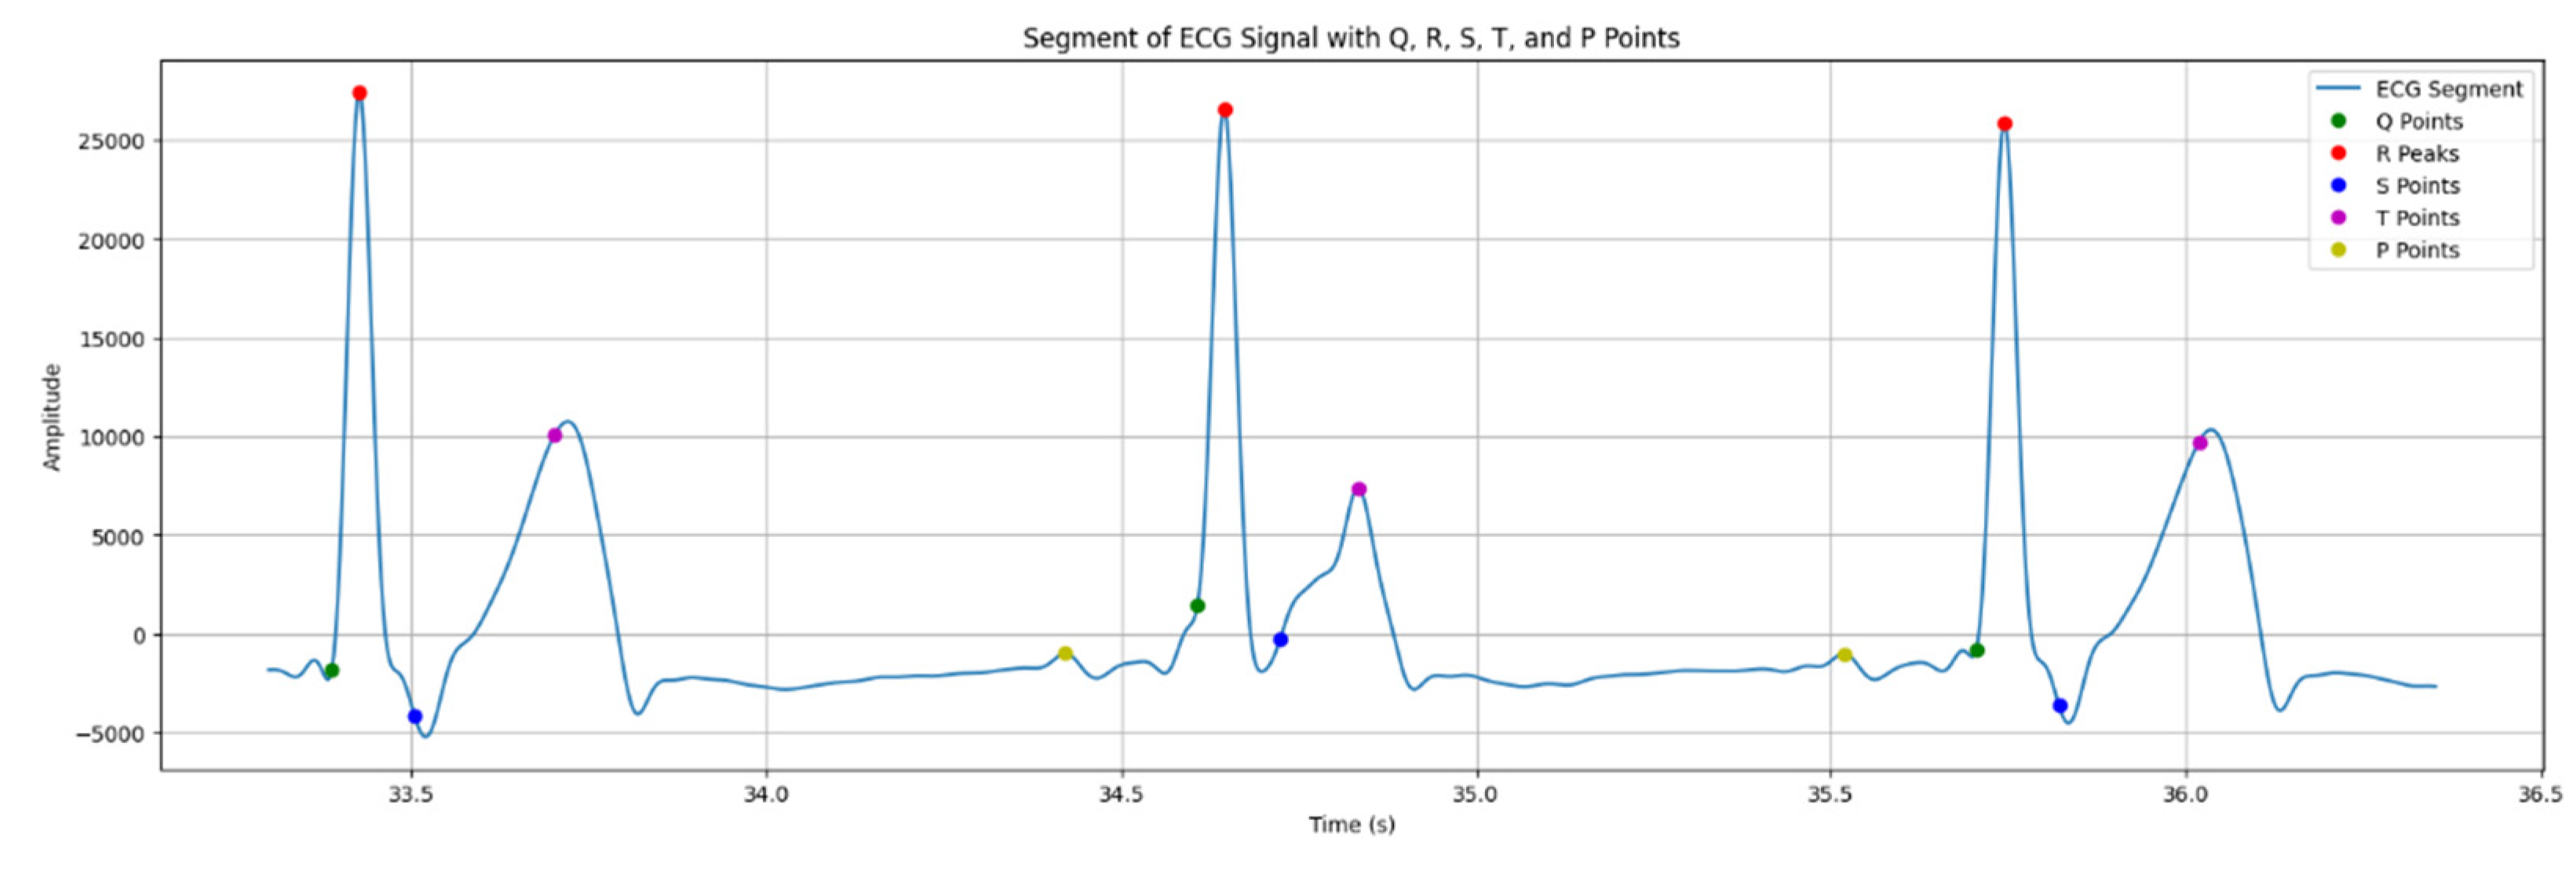
Figure 10.
Results of ECG signal analysis revealed by Isolation Forest model.
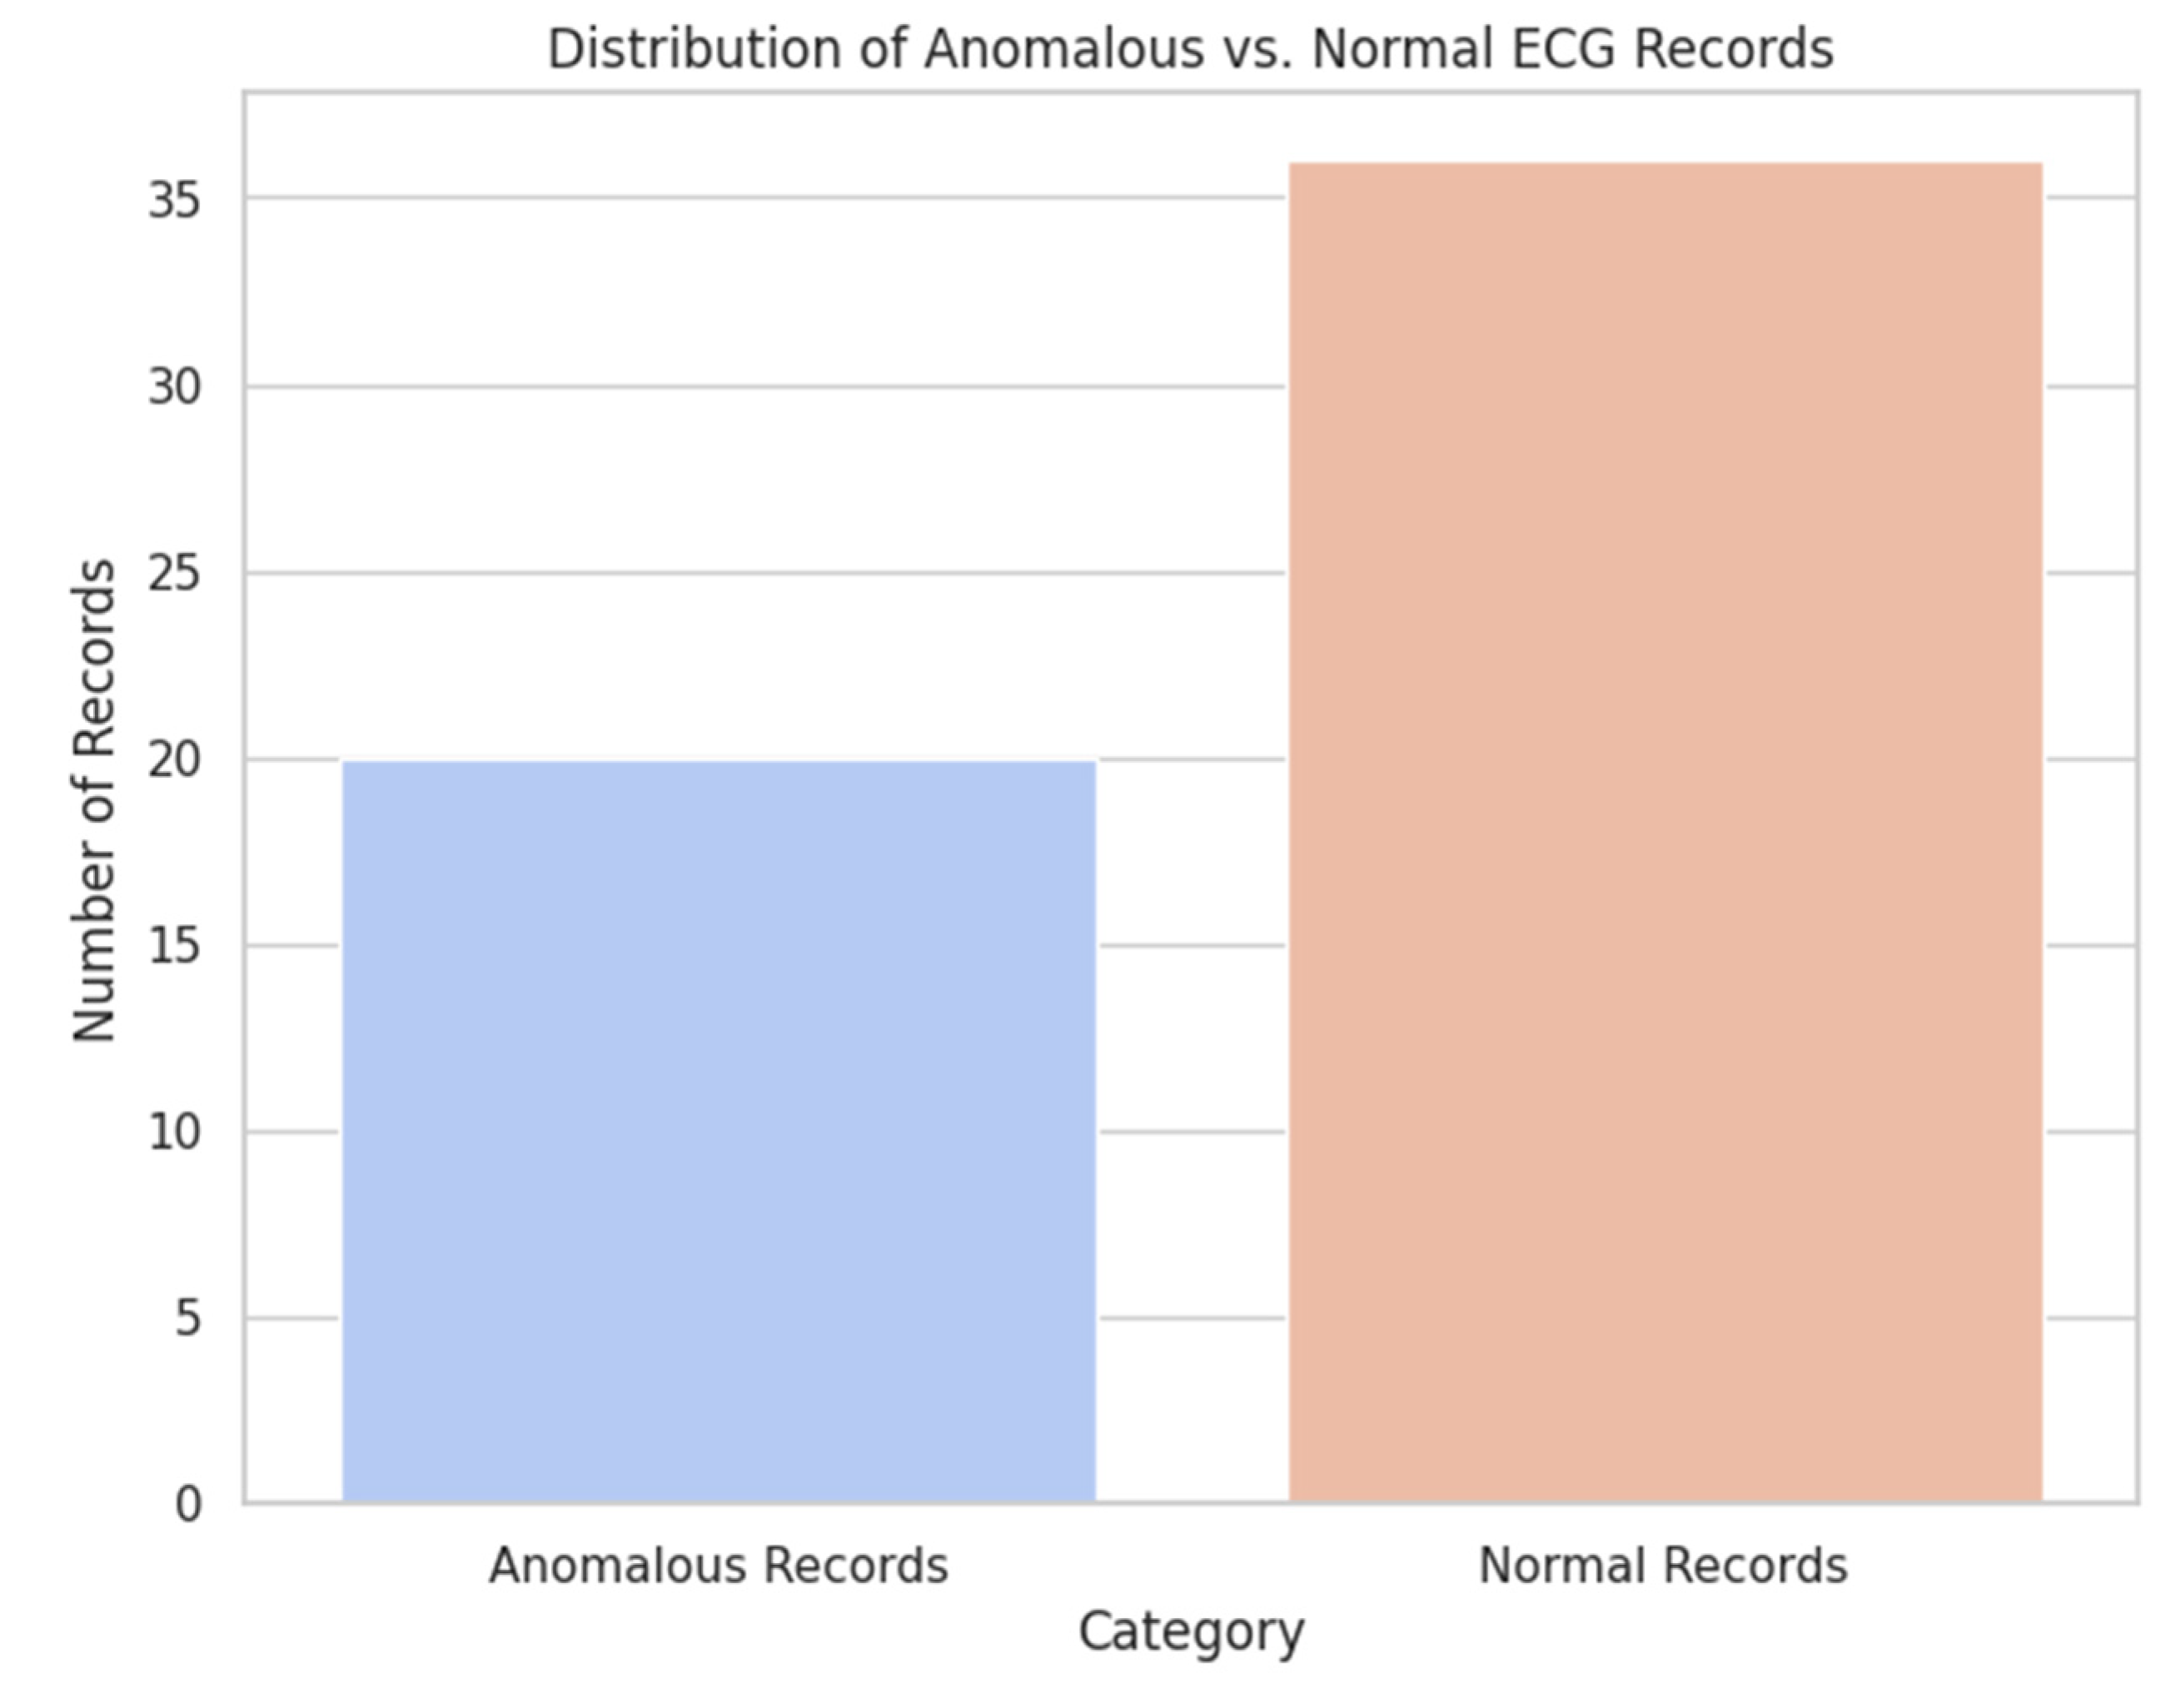
Figure 11.
Illustration of variations between anomalous and normal records.
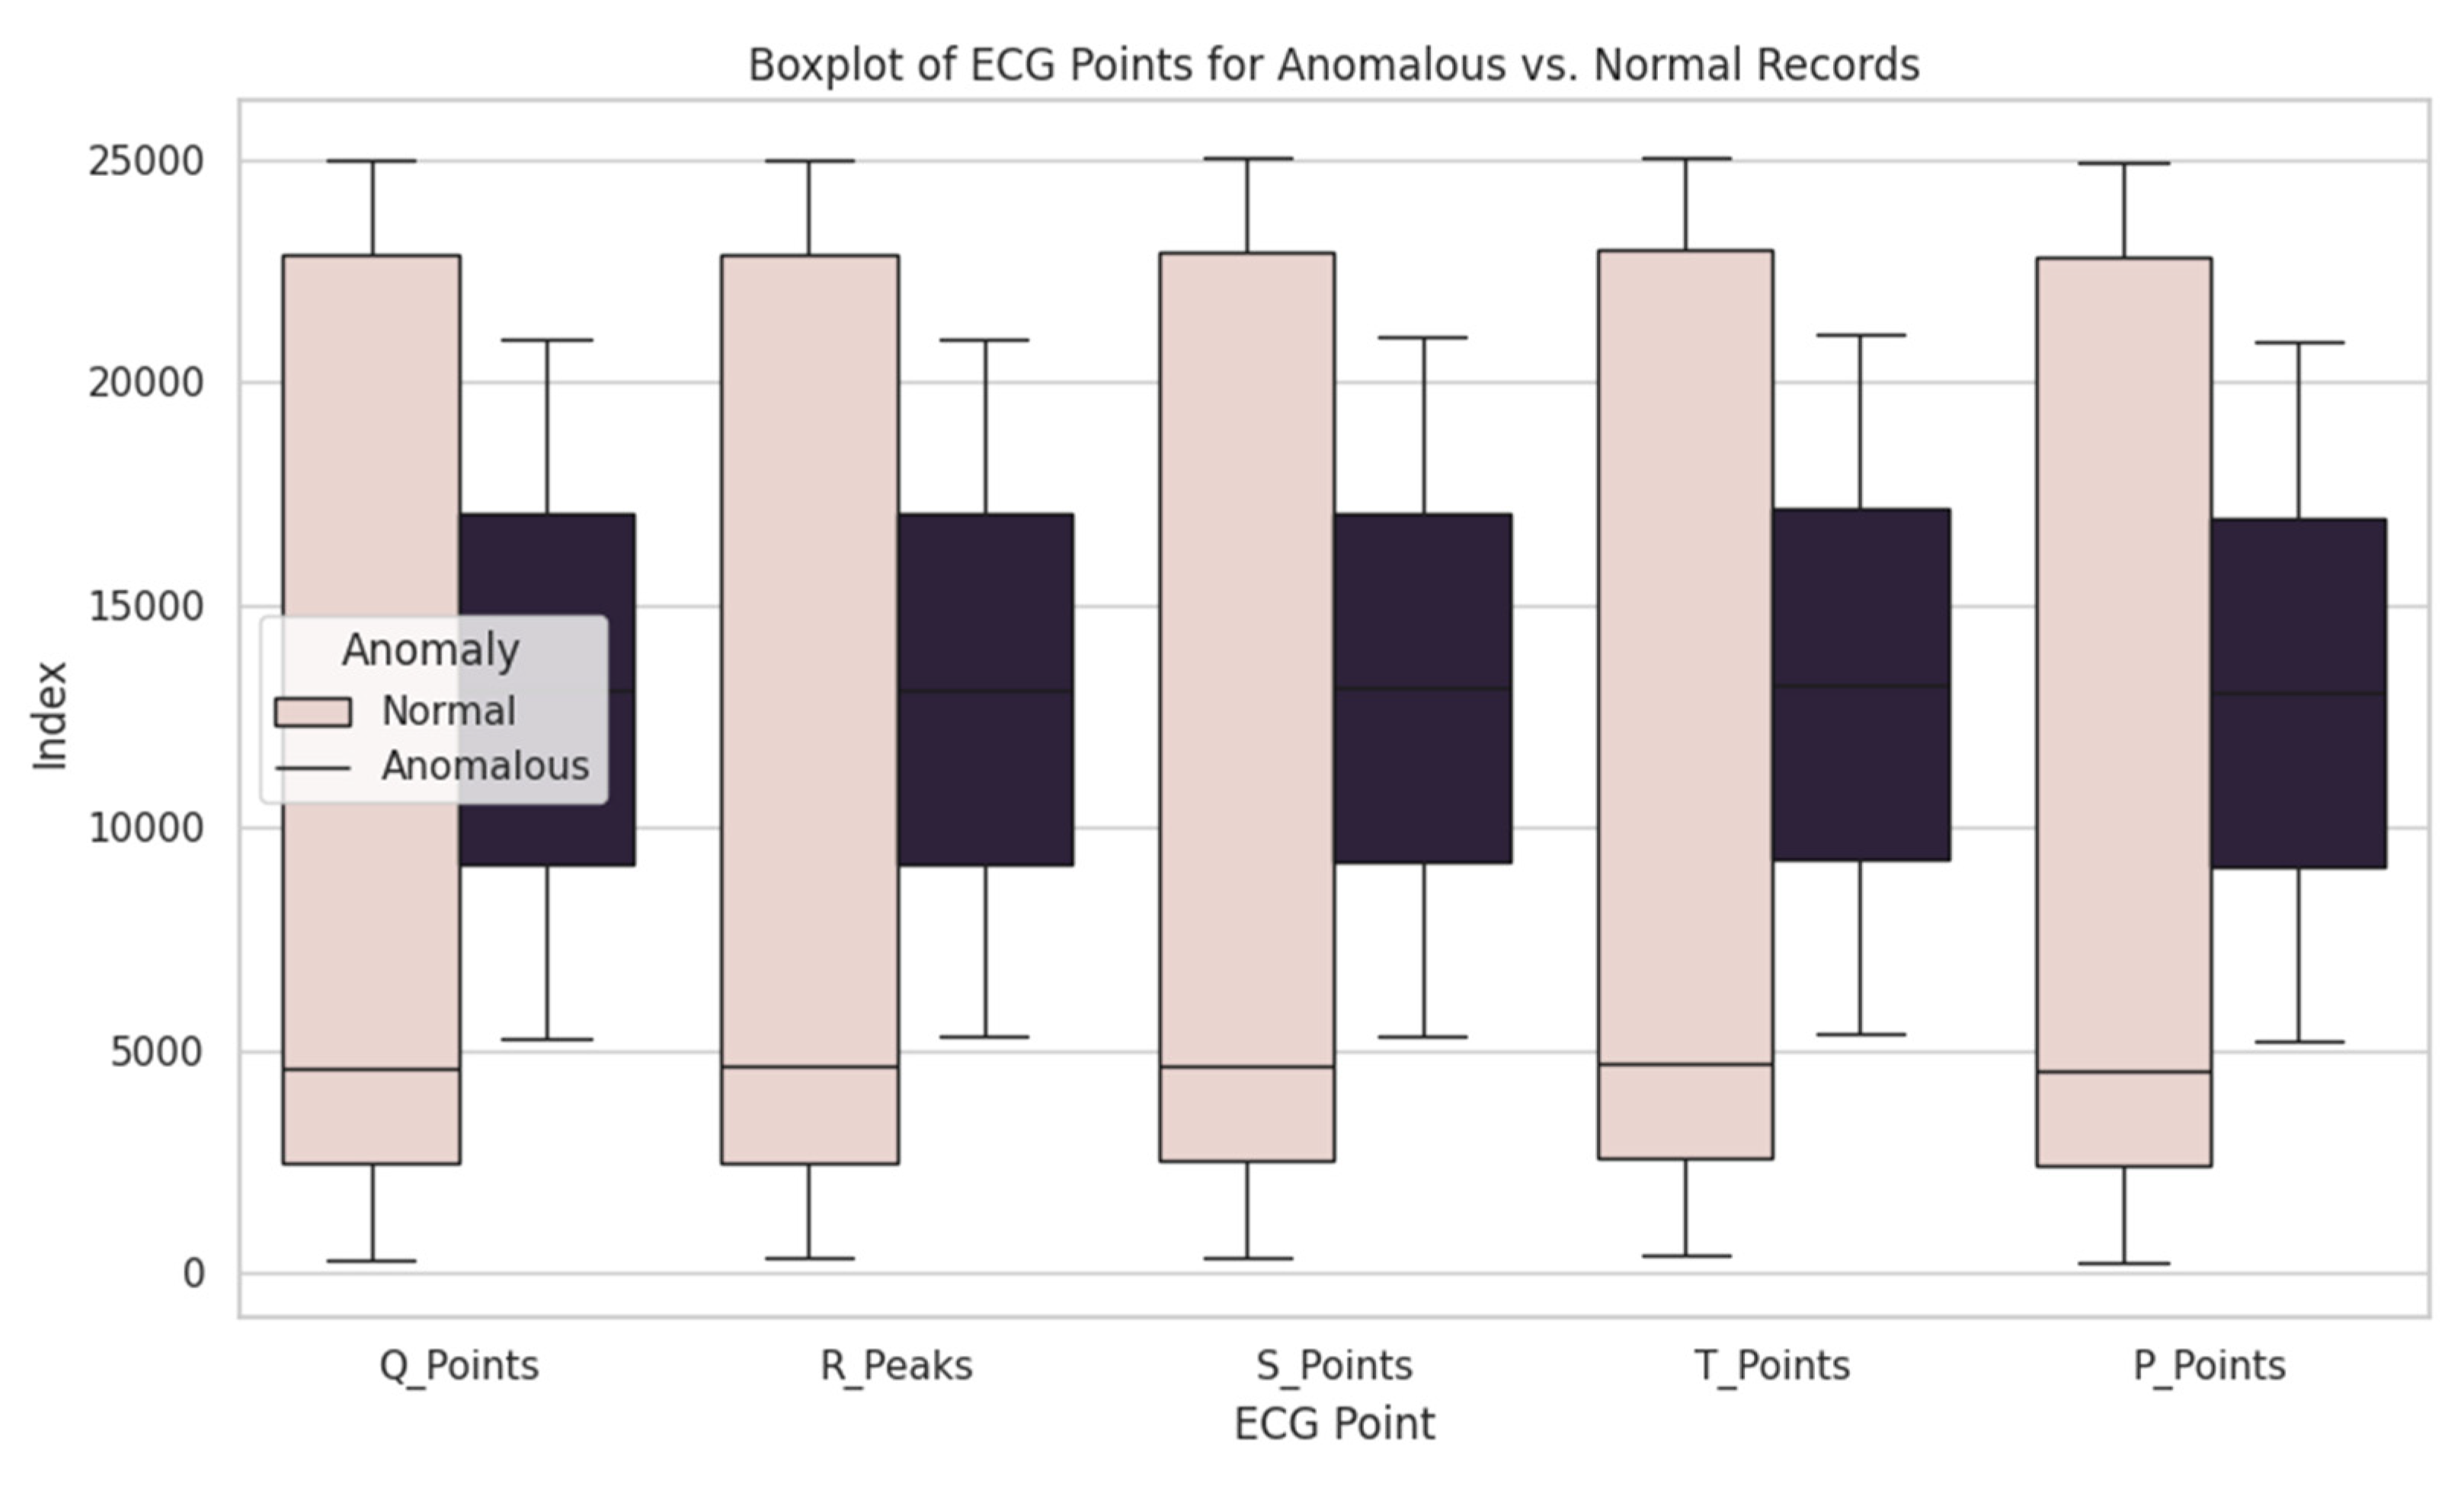
Figure 12.
Correlation between each pair of features.
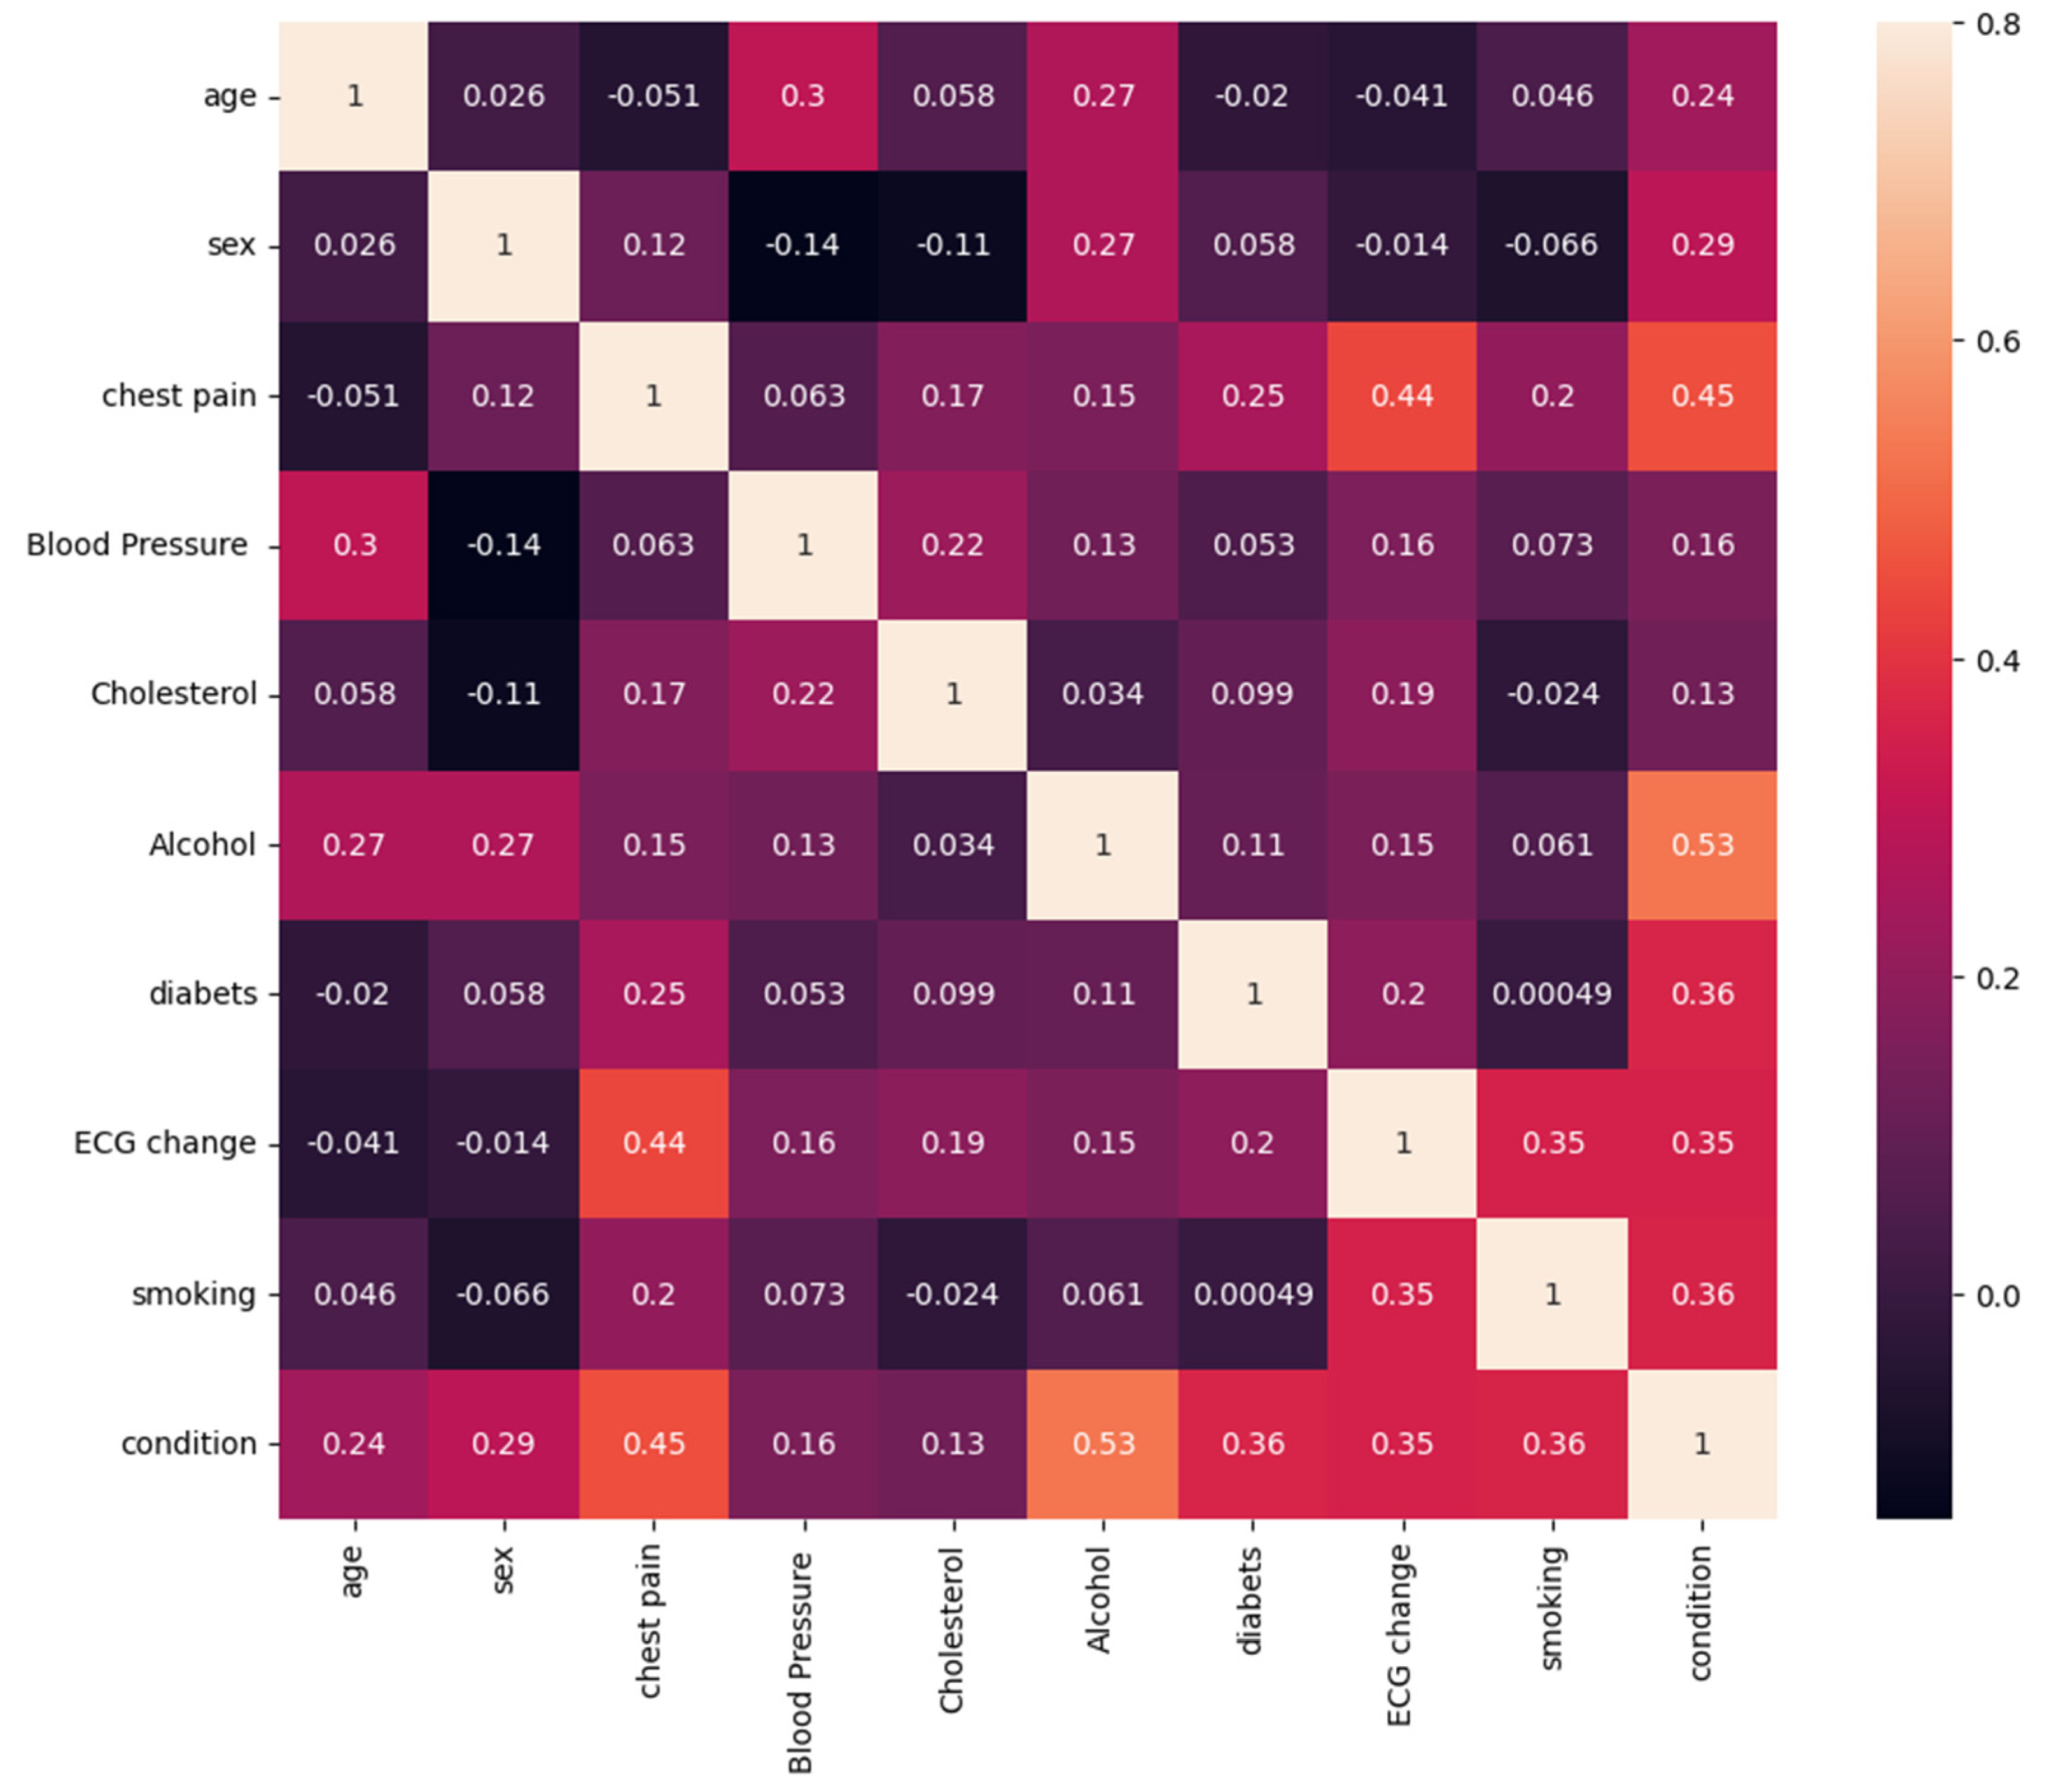
Figure 13.
Distribution of features and their effects on health condition.
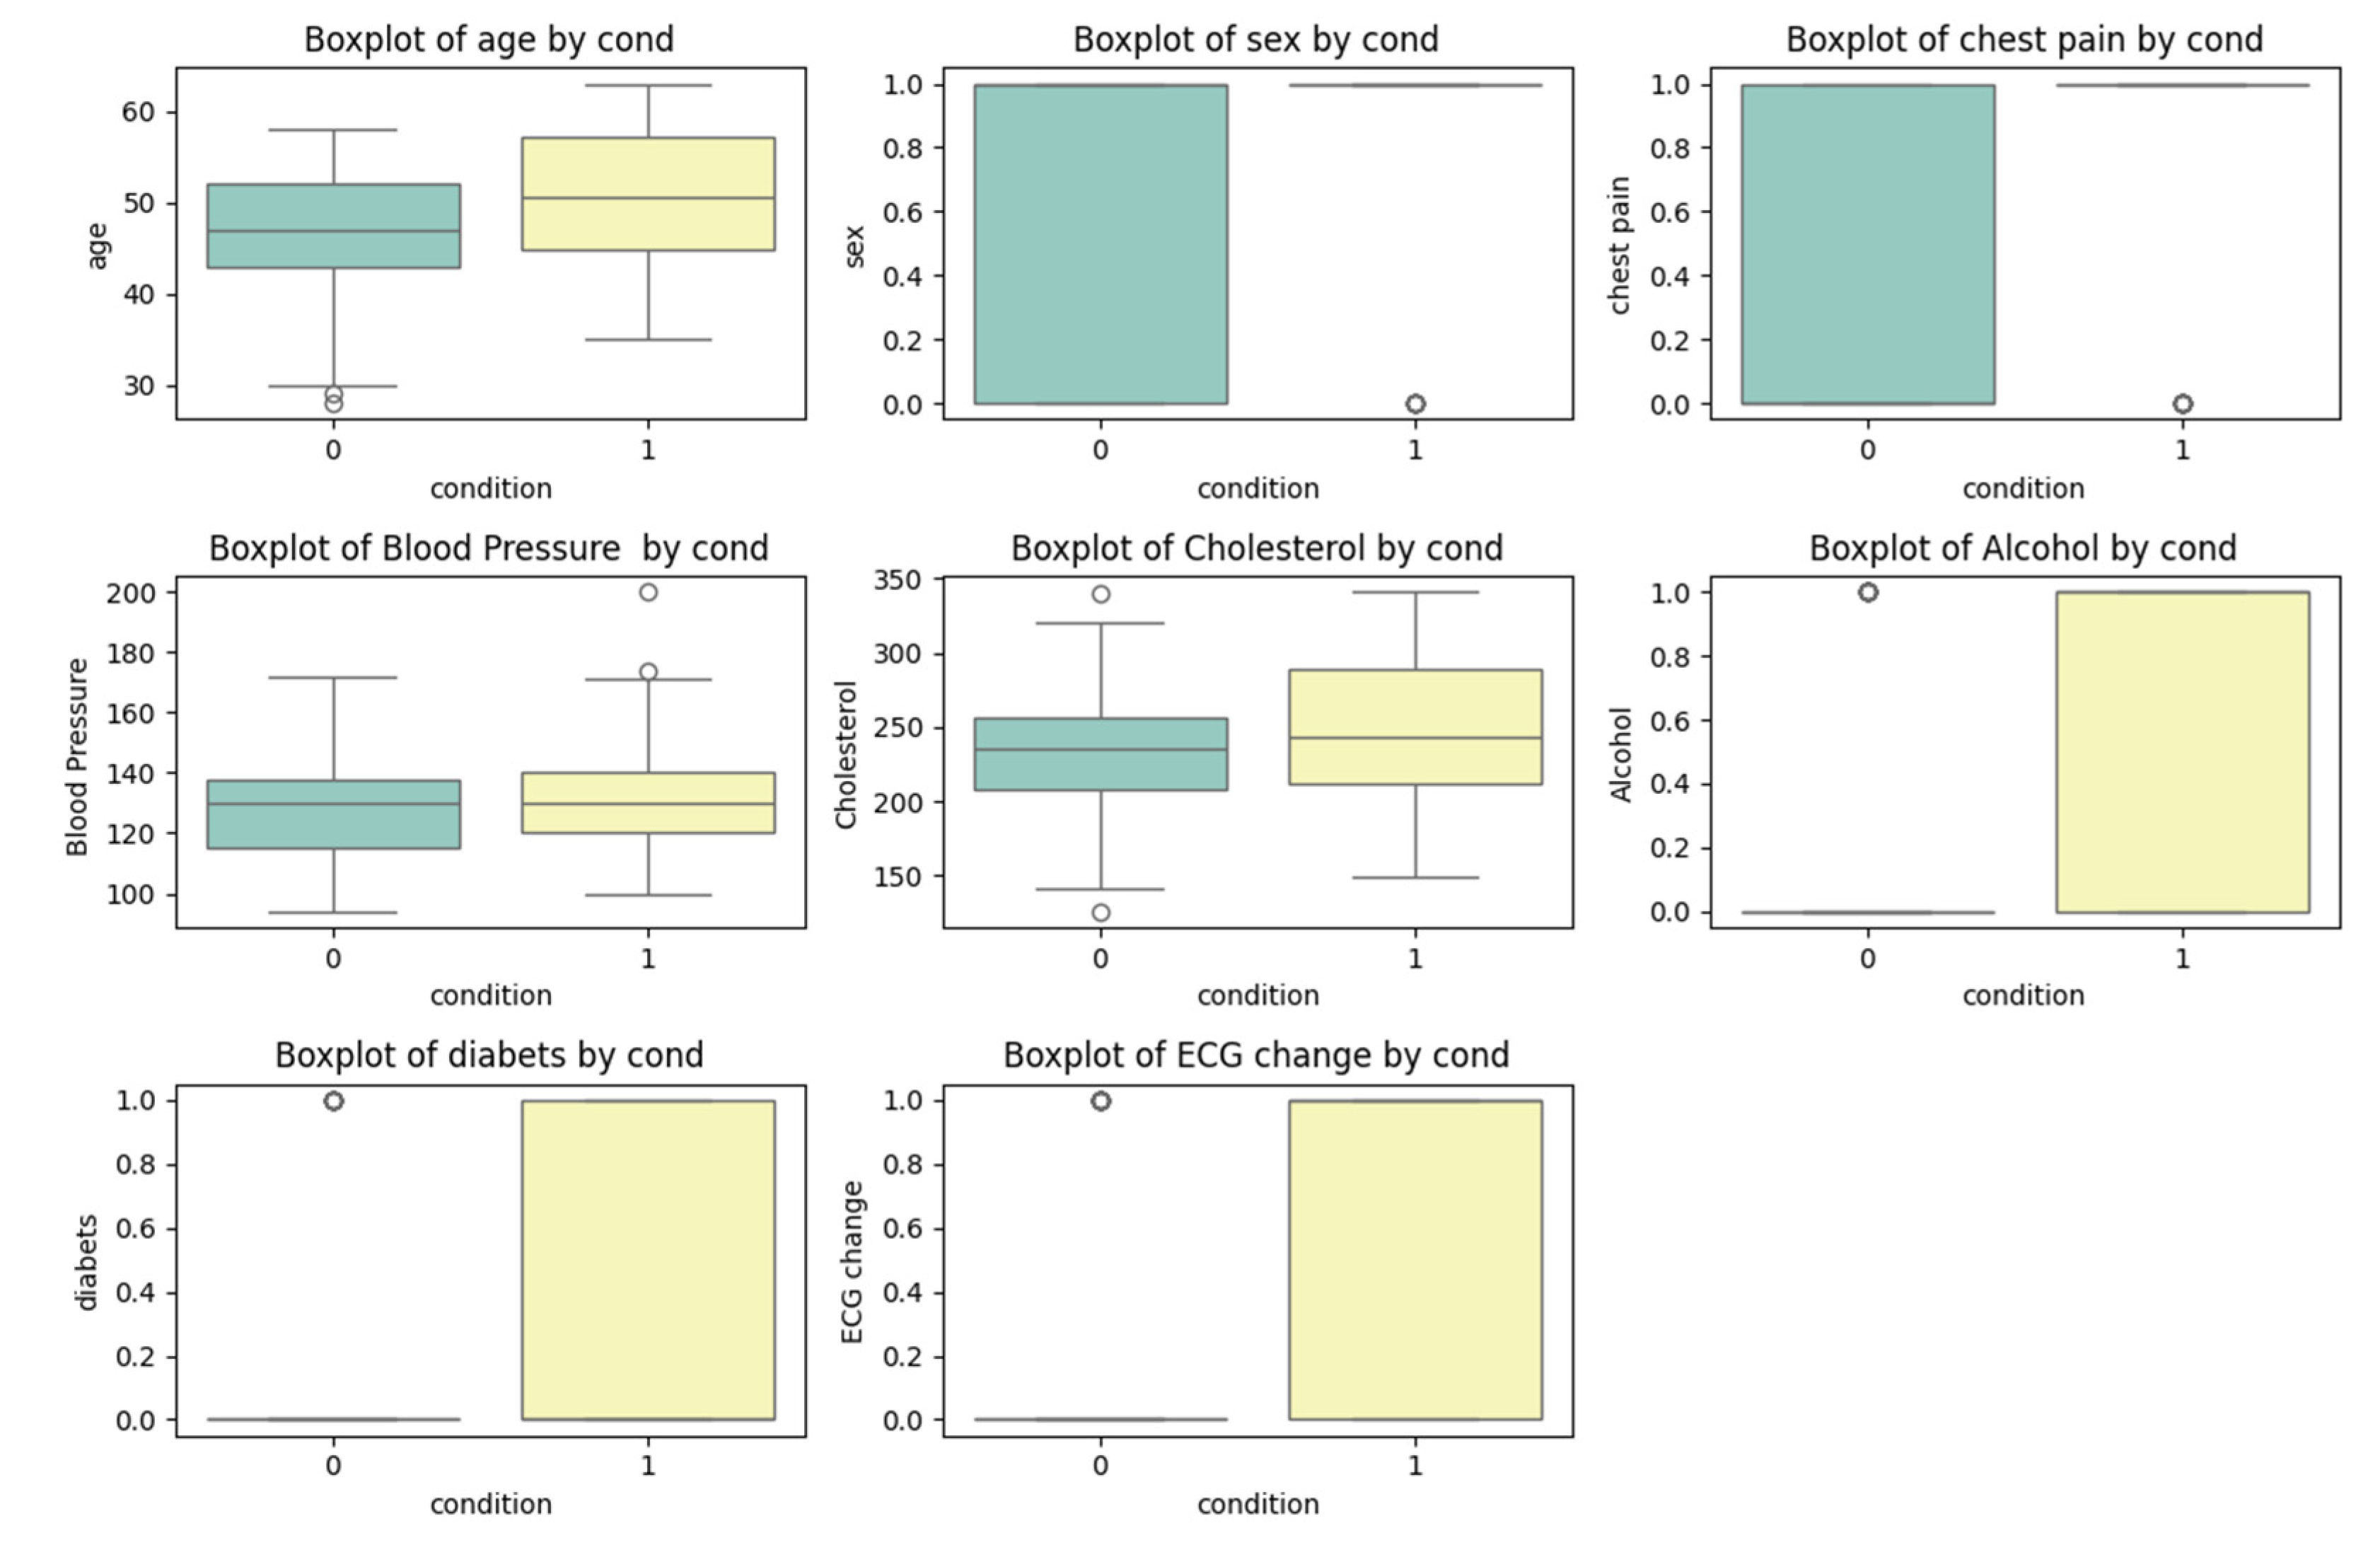
Figure 14.
Graph comparing the accuracy of machine learning models for ECG signal analysis.
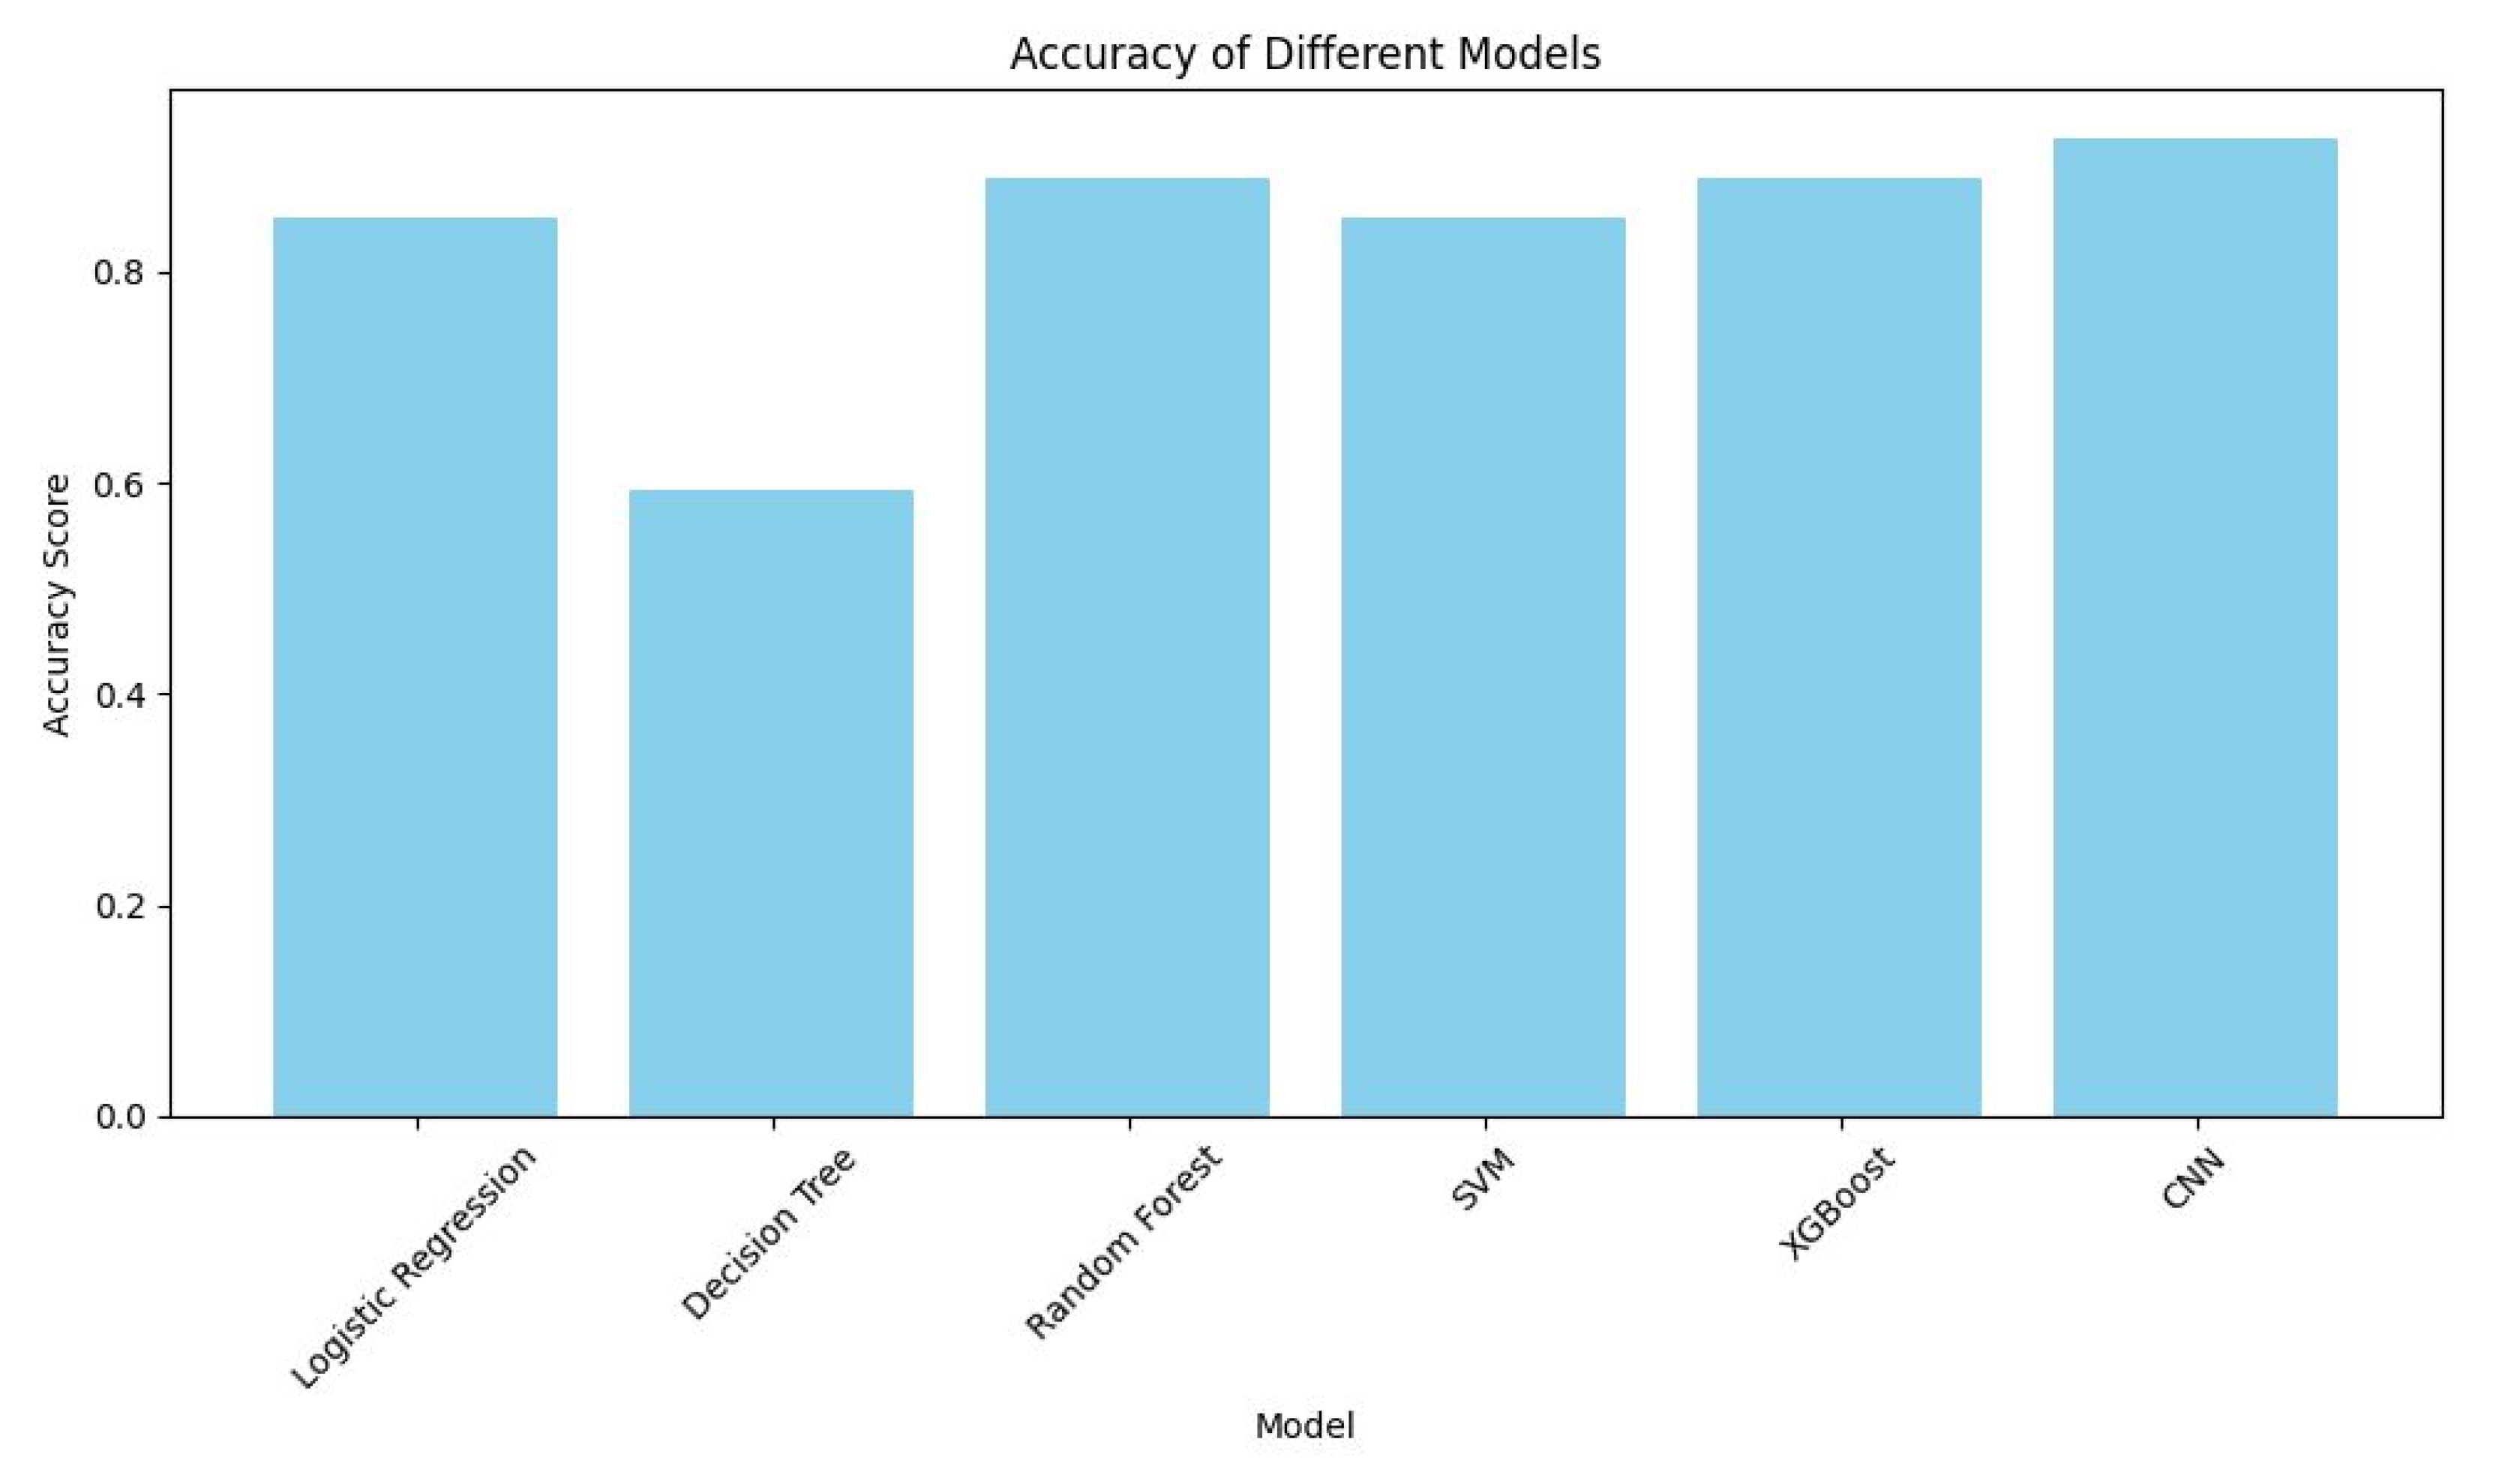

Table 1.
Description of data attributes.
| № | Name of attributes | Values of attributes |
| 1 | age | Numerical value from 28 to 63, age |
| 2 | sex | 0- female; 1- male. |
| 3 | chest pain | does the patient have chest pain: 0- no; 1-yes. |
| 4 | Blood pressure | Numerical value |
| 5 | Cholesterol | Numerical value |
| 6 | Alcohol | does the patient drink alcohol: 0- no; 1-yes. |
| 7 | diabets | the patient has diabetes mellitus: 0- no; 1-yes. |
| 8 | ECG change | there were changes in the ECG after the examination: 0- no; 1-yes. |
| 9 | smoking | does the patient smoke: 0- no; 1-yes. |
| 10 | condition | 0- healthy; 1- sick |
Table 2.
Distribution of data points across clusters.
| Cluster | Number of Points |
| 0 | 3420 |
| 1 | 546 |
| 2 | 2057 |
| 3 | 18364 |
| 4 | 687 |
Table 3.
An excerpt of data with labels.
| index | Q_Points | R_Peaks | S_Points | T_Points | P_Points |
| 0 | 316 | 330 | 358 | 429 | 248 |
| 1 | 791 | 805 | 833 | 904 | 724 |
| 2 | 1273 | 1287 | 1315 | 1386 | 1207 |
| 3 | 1712 | 1726 | 1754 | 1794 | 1645 |
| 4 | 2107 | 2121 | 2149 | 2220 | 2040 |
| 5 | 2582 | 2596 | 2624 | 2695 | 2515 |
| 6 | 3064 | 3078 | 3106 | 3177 | 2997 |
| 7 | 3503 | 3517 | 3545 | 3584 | 3436 |
| 8 | 3898 | 3912 | 3940 | 4011 | 3831 |
| 9 | 4373 | 4387 | 4415 | 4486 | 4306 |
Table 4.
The readings of detected anomalous and normal data.
| Index | Anomalous Means | Normal Means |
| Q_Points | 11858.55 | 13112.25 |
| R_Peaks | 11872.55 | 13126.25 |
| S_Points | 11900.55 | 13154.25 |
| T_Points | 11963.55 | 13217.444444444445 |
| P_Points | 11792.4 | 13045.25 |
| Anomaly | -1.0 | 1.0 |
Table 5.
Fraction of data collected for the study.
| age | sex | chest pain | Blood Pressure | Cholesterol | Alcohol | diabets | ECG change | smoking | condition |
| 35 | 1 | 1 | 120 | 198 | 1 | 0 | 1 | 1 | 1 |
| 35 | 1 | 1 | 126 | 282 | 1 | 1 | 1 | 0 | 1 |
| 42 | 1 | 1 | 136 | 315 | 1 | 0 | 1 | 1 | 1 |
| 48 | 1 | 1 | 124 | 274 | 0 | 1 | 0 | 1 | 1 |
| 44 | 1 | 1 | 120 | 169 | 1 | 1 | 1 | 1 | 1 |
| 28 | 1 | 1 | 104 | 208 | 0 | 0 | 1 | 1 | 0 |
| 45 | 0 | 1 | 138 | 236 | 0 | 0 | 1 | 1 | 0 |
| 47 | 1 | 1 | 112 | 204 | 0 | 0 | 0 | 0 | 0 |
| 30 | 0 | 1 | 138 | 243 | 0 | 0 | 1 | 1 | 0 |
| 46 | 1 | 1 | 140 | 311 | 0 | 0 | 1 | 1 | 1 |
| 53 | 1 | 1 | 140 | 203 | 1 | 1 | 1 | 1 | 1 |
Table 6.
Distribution of data point by clusters .
| Model | Accuracy |
|---|---|
| Logistic Regression | 0.85185 |
| Random Forest | 0.88888 |
| SVM | 0.85185 |
| XGBoost | 0.88888 |
| CNN | 0.92592 |
Disclaimer/Publisher’s Note: The statements, opinions and data contained in all publications are solely those of the individual author(s) and contributor(s) and not of MDPI and/or the editor(s). MDPI and/or the editor(s) disclaim responsibility for any injury to people or property resulting from any ideas, methods, instructions or products referred to in the content. |
© 2024 by the authors. Licensee MDPI, Basel, Switzerland. This article is an open access article distributed under the terms and conditions of the Creative Commons Attribution (CC BY) license (http://creativecommons.org/licenses/by/4.0/).
Copyright: This open access article is published under a Creative Commons CC BY 4.0 license, which permit the free download, distribution, and reuse, provided that the author and preprint are cited in any reuse.


