
Submitted:
23 May 2024
Posted:
23 May 2024
You are already at the latest version
Abstract
Background: The aim of this study was to investigate a series of complete blood cell count – based biomarkers of systemic inflammation as predictors of clinical outcomes in patients who underwent first-line chemoimmunotherapy for advanced NSCLC. Methods: Consecutive patients with pathologically diagnosed stage III/IV NSCLC who underwent first-line chemoimmunotherapy were retrospectively enrolled. The clinical outcomes used for biomarker evaluation were Objective Response Rate (ORR) and Overall Survival (OS). Results: Non-responders had significantly higher values of neutrophil to lymphocyte ratio (NLR, median: 5.36; IQR: 2.78–10.82 vs. 3.31; IQR: 2.15–4.12, p = 0.019), neutrophil to monocyte ratio (NMR, median: 14.00; IQR: 8.82–21.20 vs. 9.20; IQR: 7.45–11.20, p = 0.013), and systemic inflammation index (SII, median: 1,395; IQR: 929–3,334 vs. 945; IQR: 552–1,373, p = 0.025), but only NLR and NMR remained independently related with clinical response in multivariate logistic regression. In univariate analysis white blood cells (OR:1.2202; 95% CI: 1.0339 - 1.4400, p=0.019), neutrophils (OR:1.2916; 95% CI: 1.0692 - 1.5604, p=0.008), NLR (OR:1.3601: 95% CI: 1.0949 - 1.6896, p=0.005) and NMR (OR:1.2159; 95% CI: 1.00396 - 1.4221, p=0.015) were significantly associated with survival; Cox regression models confirmed that neutrophils, NLR and MLR were independently associated with survival; NLR at a cut-off value of 4.0 showed the better AUC (0.749) in predicting survival. Conclusions: Baseline complete blood cell count biomarkers, especially the NLR, can predict clinical outcomes in patients with advanced NSCLC treated with first-line chemoimmunotherapy.
Keywords:
lung cancer
; chemotherapy
; immunotherapy
; NLR
; MNR
; biomarkers
; blood cell count
1. Introduction
Lung cancer is the most common type of cancer worldwide [1,2]. Despite significant progress in identifying and treating the disease, mortality rates remain very high, closely matching the rates of incidence [1]. This is due to several factors, including the subtle onset of the disease leading to delays in diagnosis and clinical evaluation, the lack of understanding of the underlying pathogenic mechanisms, and the absence of effective treatments for many patients, especially for those in advanced stages. A wider implementation worldwide of low dose computed tomography lung cancer screening for specific at-risk population groups, could impact on reducing mortality rates by detecting the disease at an earlier stage [3].
The systemic therapies for advanced stage NSCLC are currently divided into two different therapeutic frontline approaches, depending on whether the disease is oncogene or non-oncogene addicted [4]. In oncogene-addicted cases, specific targeted therapies against the precise genetic alteration detected are used. In non-oncogene addicted disease, different immunotherapy strategies with various immune check point inhibitors (ICIs), depending on the values of the immunohistochemical expression of the biomarker PD-L1, can be used. For PD-L1 expression values greater than 50%, single agent immunotherapy is preferred; for PD-L1 values 0 - 49% a combination of a chemotherapy agent with an ICI is recommended [5,6]. PD-L1 is therefore the only biomarker validated for the section of immunotherapy treatment strategies in advanced stage NSCLC patients with non-oncogene addicted disease [7]. Unfortunately, the immunohistochemical evaluation of PD-L1 has several technical limitations, and no further biomarkers are currently available for an accurate prediction of the clinical outcomes of chemoimmunotherapy treatments.
Complete blood count - based indexes of systemic inflammation, have been shown to have interesting predictive roles in several lung diseases, including lung cancer [8,9,10,11,12]. In particular, the Neutrophil to Lymphocyte Ratio (NLR) showed relevant abilities in predicting clinical outcomes after both surgical and medical treatments of patients with NSCLC [13,14,15]. Numerous studies investigated the prognostic and predictive roles of systemic blood count – based inflammation biomarkers in patients submitted to first – line immunotherapy, with a single ICI [13,16,17]. Nevertheless, limited data are available regarding their role in patients with NSCLC treated with chemo-immunotherapy [17]. For this reason we conducted a retrospective study to assess the association between clinical response and overall survival (OS) and the most common blood – based inflammation biomarkers like NLR, platelet to lymphocyte ratio (PLR), neutrophil to monocyte ratio (NMR), monocyte to lymphocyte ratio (MLR), Systemic Inflammation Index (SII) and the Aggregate Index of Systemic Inflammation (AISI), in patients with advanced-stage NSCLC and PD-L1 immunohistochemistry tumour proportion score (TPS) lower than 49% undergoing first-line chemoimmunotherapy.
2. Materials and Methods
2.1. Patients and Clinical Data
Consecutive patients with pathologically diagnosed stage III/IV NSCLC treated in the medical oncology units of the University of Sassari and of the Hospital of Olbia from January 2019 to December 2023 were retrospectively enrolled in this real-world observational study. The inclusion criteria were: 1) age 18 years or older; 2) affected by histologically diagnosed NSCLC; 3) advanced stage disease (III or IV stage) at diagnosis; 4) PD-L1 TPS score between 0 and 49; 5) patients with at least 6 months of follow-up from treatment initiation; 6) patients with available clinical, pathological and laboratory data; 7) patients who signed the informed consent for the medical procedures performed and for their participation into the study. The demographic and clinical data recorded included information on gender, smoking status, Eastern Cooperative Oncology Group (ECOG) Performance Status, clinical stage as per American Joint Committee on Cancer (AJCC) 8th edition, and comorbidities; oncological response assessment was performed according to the Response Evaluation Criteria in Solid Tumors version 1.1 (RECIST 1.1) buy computed tomography scans every 6 to 12 weeks after treatment initiation. The clinical outcomes used for biomarker evaluation were Objective Response Rate (ORR) and Overall Survival (OS). The clinical, pathological and follow-up date were registered in dedicated digital database accessible solely to the researchers participating into the study. The study was performed in accordance with the principles of the declaration of Helsinki on human research and was approved by the local Ethics Committee (BIOSURG-SS; PROT. PG/2019/4493).
2.2. Laboratory Tests
Routine laboratory tests performed before treatment initiation were evaluated. Fasting blood samples were obtained following standard procedures and protocols by current international and national guidelines and were analysed in a certified laboratory. Basic blood test parameters like haemoglobin, red cell distribution width (RDW), number of platelets and numbers of inflammation cell populations were investigated as predictors of the clinical outcomes mentioned above. In addition, the NLR, MLR, and PLR were tested, as well as the SII (neutrophils × platelets divided by the number of lymphocytes), and the AISI (neutrophils x monocytes x platelets divided by the number of lymphocytes).
2.3. Statistical Analysis
The Kolmogorov–Smirnov test was performed to evaluate variable distribution and data are expressed as mean values (mean ± SD) or median values (median and IQR). Between-group differences of continuous variables were compared using unpaired Student’s t-test or Mann–Whitney rank sum test, as appropriate. Differences between categorical variables were evaluated by chi-squared test. Receiver operating characteristics (ROC) curve analysis was performed to estimate optimal cut-off values, maximizing sensitivity and specificity according to the Youden index. Association between variables and outcomes has been evaluated by univariate and multivariate logistic regression. To avoid overfit two different models has been proposed for multivariate analysis. Model 1 with correction for, age, gender, smoking status, histological type, and PDL1 and Model 2 with correction for, age, gender, smoking status, stage T, and stage N. In addition, to reduce the risk of collinearity bias, the independent diagnostic power of different hematological parameters was separately assessed in the models. For survival analysis, time zero was defined as the time of diagnosis. Survival probability was estimated using the means of the Kaplan–Meier curves with the end point being death. Cox proportional hazards regression was performed for both univariate and multivariate analyses. For multivariate Cox regression, the same models proposed above have been utilized as well. Statistical analyses were performed using MedCalc for Windows, version 22.0.21 64 bit (MedCalc Software, Ostend, Belgium).
3. Results
3.1. Blood – Based Biomarkers and Treatment Response
A total of 62 patients [45 males and 17 females; median age at diagnosis, 68.5 (IQR: 62.0-74.0) years] were included into the study (Table 1). Forty-seven patients (75.8%) were responders while the remaining fifteen (24.2%) were non-responders. Responders, as expected, showed significantly decreased mortality rate (22% vs 80%, p<0.0001), and overall survival was significantly increased in responder group: median 14.5 months (IQR: 9.1-31.9 months) vs 7.5 months (IQR 4.2-11.2 months), p=0.0015. Non-responders had significantly higher values of NLR (median: 5.36; IQR: 2.78–10.82 vs. 3.31; IQR: 2.15–4.12, p = 0.019), NMR (median: 14.00; IQR: 8.82–21.20 vs. 9.20; IQR: 7.45–11.20, p = 0.013), and SII (median: 1,395; IQR: 929–3,334 vs. 945; IQR: 552–1,373, p = 0.025). By contrast, there were no statistically significant differences between responders and non-responders in age, gender, smoking status, histological type, PDL1, stage T, stage N, Hb, RDW, WBC, neutrophils, lymphocytes, monocytes, platelets, MLR, PLR and AISI.
In univariate logistic regression analysis only NLR (OR=1.2561, 95% CI 1.0519 to 1.4998, p=0.012) and NMR (OR=1.1410, 95% CI 1.0121 to 1.2864, p=0.03) were significantly associated with treatment response (Table 2).
These results were also confirmed by multivariate logistic regression. As reported in Table 3, in order to mitigate the risk of overfitting, two distinct models were employed. The first one (Model 1) included age, gender, smoking status, histological type, and PD-L1 as confounders, whereas the second model (Model 2) incorporated age, gender, smoking status, stage T, and stage N. In both models NLR and NMR remained independently related with the clinical response to the treatment.
ROC curve analysis was performed to evaluate the sensitivity, specificity, and accuracy of NLR and NMR in identifying responders vs. non-responders. AUC values were 0.703 (95% CI 0.573 to 0.812) for NLR and 0.715 (9%% CI 0.586 to 0.822) for NMR. The sensitivity and specificity at a NLR cut-off value of 4.56 were 60% and 81%, respectively, while for an NMR cut-off value of 13.7, they were 53% and 91%, respectively.
3.2. Blood – Based Biomarkers and Overall Survival
Information about overall survival (OS) was obtained from 60 patients [44 males and 16 females; median age at diagnosis, 68.0 (IQR: 62.0-73.5) years] (Table 4). Thirty-seven patients (61.7%) were alive while the remaining twenty-three (28.3%) died. Non-survivors had significantly higher values of white blood cells (median: 9.69 × 10⁹ L; IQR: 7.97–14.03 × 10⁹ L vs. 8.26 × 10⁹ L IQR: 6.36–9.92 × 10⁹ L, p = 0.026), neutrophils (median: 7.00 × 10⁹ L; IQR: 6.00–11.95 × 10⁹ L vs. 5.30 × 10⁹ L IQR: 3.48–7.03 × 10⁹ L, p = 0.001), NLR (median: 4.56; IQR: 3.07–9.49 vs. 2.94; IQR: 1.92–3.88, p = 0.012), NMR (median: 10.40; IQR: 8.80–18.18 vs. 9.00; IQR: 7.08–11.05, p = 0.007), PLR (median: 220; IQR: 145–273 vs. 136; IQR: 107–201, p = 0.016), SII (median: 1,493; IQR: 1,000–2, 578 vs. 849; IQR: 488–1,081, p = 0.0004), and AISI (median: 1,016; IQR: 470–1,836 vs. 351; IQR: 256-794, p = 0.006). By contrast, there were no significant differences between survivors and non-survivors in age, gender, smoking status, histological type, PD-L1, stage T, stage N, Hb, RDW, lymphocytes, monocytes, platelets and MLR.
In univariate logistic regression analysis only WBC (OR=1.2202, 95% CI 1.0339 to 1.4400, p=0.019), neutrophils (OR=1.2916, 95% CI 1.0692 to 1.5604, p=0.008), NLR (OR=1.3601, 95% CI 1.0949 to 1.6896, p=0.005) and NMR (OR=1.2159, 95% CI 1.0396 to 1.4221, p=0.015) were significantly associated with survival (Table 5). These associations have been also confirmed after multivariate logistic regression after correction for several confounders by using both the models 1 and 2 cited above (Table 6).
With respect to survival, the optimal cutoff values identified by ROC analysis were as follows: WBC, 11.98; neutrophils, 5.7; NLR, 4.0; NMR, 11.8 (Table 6). The values of area under the curve (AUC) were 0.672 (0.539 to 0.788) for WBC, 0.746 (0.617 to 0.849) for neutrophils, 0.749 (0.620 to 0.852) for NLR, and 0.707 (0.576 to 0.818) for NMR (Table 7).
The Kaplan–Meier survival curves, after classifying the patients on the basis of Youden cut-offs obtained by ROC curves (Figure 1), showed significant lower survival with higher values of WBC (HR= 3.3; 95% CI 1.2–9.3, p=0.02), neutrophils (HR = 4.6; 95% CI 2.00–10.5, p = 0.0003), NLR (HR = 6.6; 95% CI 2.6–17.1, p = 0.0001), and MLR (HR=11.6; 95% CI 3.8–35.9, p < 0.0001).
The multivariate Cox regression models reported in Table 8 showed that, barring WBC, that loss significance in Model 2, both neutrophils, NLR and MLR were significantly associated with survival after correction for confounders of both Models.
4. Discussion
The introduction of immunotherapy for the treatment of non-oncogene addicted NSCLC was one of the most important innovations in medical oncology in the last decade. Several clinical trials have established the efficacy of immune checkpoint blockade, particularly in the form of anti-programmed death 1 (PD-1) antibodies, anti-cytotoxic T-lymphocyte associated protein 4 (CTLA-4) antibodies and anti-programmed death 1 ligand (PD-L1) antibodies [18]. Nivolumab, the first monoclonal antibody against PD-1, demonstrated its utility in the treatment of NSCLC and other solid malignancies. Subsequently, Pembrolizumab, the second anti-PD-1 antibody, has shown positive activity in many cancers, including NSCLC, and other medications have been introduced in clinical practice. Currently, international guidelines suggest the use of first-line mono-immunotherapy when molecular drivers such as EGFR, ALK, ROS1, RET are not detected and the immunohistochemically evaluated PD-L1 TPS is greater than 50%; while for patients with lower PD-L1 scores a combination of a chemotherapy and immunotherapy agent is recommended [4].
The addition of chemotherapy to PD-1/PD-L1 inhibitors is thought to potentiate the anti-tumor immune response by enhancing neoantigen presentation after destruction. In clinical trials, the combination demonstrated significant antineoplastic activity. Chemo-immunotherapy regimens that can be used for advanced NSCLC include pembrolizumab plus a platinum-based drug plus pemetrexed [19], Pembolizumab plus carboplatin plus paclitaxel or nab-paclitaxel [20]. All these regimens have shown significant improvements in progression-free survival (PFS) and OS when compared to regimens of chemotherapy alone. In the KEYNOTE-189 trial, the median overall survival (OS) in the chemoimmunotherapy group was surprising: 22.0 months, which was more than twice the median OS of 10.7 months in the chemotherapy alone group [21].
More recently, a combination of immunotherapy with anti CTLA4 Ipilimumab + Nivolumab and two cycles of chemotherapy has been approved due the results showed in the CheckMate-9LA trials (n = 224 squamous-cell carcinoma patients); it has been proven improved OS in NSCLC (both non-squamous non-small-cell carcinoma and squamous-cell carcinoma) [22].The benefit was enriched in patients with squamous-cell carcinoma (OS HR of 0.63 for squamous-cell carcinoma and 0.78 for non-squamous non-small-cell carcinoma) and in those with PD-L1 < 0 [23]. Consequently, with the introduction of these novel treatment stategies, the prognosis for advanced NSCLC patients has markedly enhanced. Despite the survival benefit obtained with ICIs, only a proportion of patients respond to chemoimmunotherapy and/or experience a durable clinical benefit [24]. Consequently, it becomes necessary to identify prognostic indicators to facilitate time-effective treatment decisions.
Systemic inflammation in cancer is strictly bound and depends on the activity of both the tumors and the immune system. Tumor-infiltrating lymphocytes are reported to be closely related to immunotherapy efficacy [25], while neutrophils release vascular endothelial growth factor (VEGF), matrix metalloproteinase 9 (MMP-9), and other cytokines that can modify the tumor microenvironment [26,27], and platelets interact with tumor cells and protect them from immune surveillance [28].Therefore, circulating indexes of systemic inflammation can be interesting spies of the complex interaction between neoplasms and immune responses, as well as of the clinical reflection of such interactions in terms of response to treatments and final survival. Indeed, numerous studies showed that NLR is a good predictor of response to single agent immunotherapy [13,16,17].
Less is known in the context of patients submitted to chemo-immunotherapy. Our study showed that non-responders had significantly higher values of NLR (median: 5.36; IQR: 2.78–10.82 vs. 3.31; IQR: 2.15–4.12, p = 0.019), NMR (median: 14.00; IQR: 8.82–21.20 vs. 9.20; IQR: 7.45–11.20, p = 0.013), and SII (median: 1,395; IQR: 929–3,334 vs. 945; IQR: 552–1,373, p = 0.025), but only NLR and NMR remained independently related with the clinical response to the treatment in the multivariate logistic regression models created. In addition, in univariate logistic regression analysis we found that only WBC (OR:1.2202; 95% CI: 1.0339 - 1.4400, p=0.019), neutrophils (OR:1.2916; 95% CI: 1.0692 - 1.5604, p=0.008), NLR (OR:1.3601: 95% CI: 1.0949 - 1.6896, p=0.005) and NMR (OR:1.2159; 95% CI: 1.00396 - 1.4221, p=0.015) were significantly associated with survival. The Cox regression models constructed confirmed that neutrophils, NLR and MLR were independently associated with survival; NLR at a cut-off value of 4.0 showed the better AUC (0.749) in predicting survival.
Shi et al. published in 2021 a retrospective study evaluating potential correlations between peripheral blood biomarkers and clinical outcomes in advanced non-small cell lung cancer patients who received immunotherapy-based treatments [29]; among the 103 patients enrolled, 71 (68.9%) were treated with chemo-immunotherapy (53 of them as a first – line treatment). In this study, high NLR (>5; log rank p=0.013) and a high PLR (>median of 196.32; log rank p=0.025) were associated with inferior OS, but not with the occurrence of adverse therapeutic events in the global cohort; SIRI, SII and AISI were not tested. Focusing on the patients who underwent chemo-immunotherapy, high PLR (HR 3.594, 95% CI: 1.096 to 11.789, p=0.035) was found to be an independent poor prognostic factor for PFS but not for OS, in multivariate analysis. In other words, in this study no correlations between circulating biomarkers of systemic inflammation and survival were found, as in our study. Interestingly, the authors found that the pretreatment absolute lymphocyte count was related to an increased risk of immune related adverse events in the whole population of the study (OR: 2.165; 95% CI: 1.040 - 4.509, p=0.039) and patients receiving ICIs only (OR, 6.461; 95% CI: 1.067 - 39.112; p=0.042), but not in patients who received chemo-immunotherapy [29].
More recently, a Spanish multicentre retrospective study was published including 122 and 92 stage I-IIIB NSCLC patients who received neoadjuvant chemo-immunotherapy followed by surgery as discovery and external validation cohort, respectively [30]. In both the discovery and validation cohorts, the on-treatment NLR, dNLR, PLR, and SII levels were significantly lower in the patients with major pathological response (MPR) versus non-MPR. On-treatment SII remained an independent predictor of MPR in multivariate logistic regression analysis. The area under the curve (AUC) of on-treatment SII for predicting MPR was 0.75 (95%CI, 0.67–0.84) in the discovery cohort. Moreover, the predictive value was further improved by combining the on-treatment SII and radiological tumor regression data, demonstrating an AUC of 0.82 (95%CI, 0.74–0.90). The predictive accuracy was validated in the external cohort. Nevertheless, the pretreatment values of these biomarkers were not correlated with pathological responses in this study [30].
Our study has some limitations, mainly the retrospective design, the relatively low number of patients enrolled and the relatively brief follow-up time. In addition, only pretreatment and not on-treatment laboratory tests were retrieved, as we choose to avoid the depletion effect of chemotherapy on the blood cell populations, and its reflection on the systemic inflammation indexes under investigation. Furthermore, no data regarding the specific immune related adverse events occurred to the patients were collected. On the other hand, our study is the first to investigate a wide number of blood test parameters and combined systemic inflammation indexes (like SIRI, SII and AISI) in patients with NSCLC who are candidates to chemo-immunotherapy as a first – line treatment. However, prospective studies with wider cohorts are necessary to confirm our results and better describe the potential clinical usefulness of NLR in this setting.
5. Conclusions
Our results showed that baseline complete blood cell count biomarkers like the absolute number of lymphocytes, the NLR and the MLR can be useful to predict clinical outcomes in patients with advanced NSCLC treated with first-line chemo-immunotherapy. In particular, NLR showed the better AUCs in predicting both the response to treatment and the OS. Further prospective studies performed in larger cohorts are necessary to better evaluate the role and clinical applicability of such biomarkers for this specific setting.
Author Contributions
Conceptualization, C.P.; R.S.; R.C.; and P.P.; methodology, C.P.; P.P.; and A.Z.; software, R.S.; R.C.; and A.Z.; formal analysis, A.Z.; and P.P.; investigation, R.S.; R.C.; G.M.F.; C.S.; A.M.; G.C.G.; A.G.F.; G.P.; A.C.; and P.P; resources, R.S.; R.C.; G.M.F.; C.S.; A.M.; G.C.G.; A.G.F.; G.P.; A.C.; and P.P; data curation, R.S.; R.C.; G.M.F.; C.S.; A.M.; G.C.G.; A.G.F.; G.P.; A.C.; and A.Z.; writing—original draft preparation, C.P.; R.S.; R.C.; G.M.F, G.P.; A.C.; writing—review and editing, P.P.; supervision, C.P.; and P.P.; project administration, C.P.; and P.P. All authors have read and agreed to the published version of the manuscript.
Funding
This research received no external funding.
Institutional Review Board Statement
The study was conducted in accordance with the Declaration of Helsinki and approved by the local Ethics Committee (protocol code BIOSURG-SS; PROT. PG/2019/4493).
Informed Consent Statement
Informed consent was obtained from all subjects involved in the study.
Data Availability Statement
Data are available by the corresponding author upon reasonable request.
Conflicts of Interest
The authors declare no conflicts of interest.
References
- Available on https://gco.iarc.who.int/media/globocan/factsheets/cancers/15-trachea-bronchus-and-lung-fact-sheet.pdf. Accessed on 08/05/2024.
- Colombino, M.; Paliogiannis, P.; Cossu, A.; Santeufemia, D.A.; Sardinian Lung Cancer (SLC) Study Group; Sini, M. C.; Casula, M.; Palomba, G.; Manca, A.; Pisano, M.; et al. EGFR, KRAS, BRAF, ALK, and cMET genetic alterations in 1440 Sardinian patients with lung adenocarcinoma. BMC Pulm Med 2019, 19, 209. [Google Scholar] [CrossRef] [PubMed]
- de Koning, H.J.; van der Aalst, C.M.; de Jong, P.A.; Scholten, E.T.; Nackaerts, K.; Heuvelmans, M.A.; Lammers, J.J.; Weenink, C.; Yousaf-Khan, U.; Horeweg, N.; et al. Reduced lung-cancer mortality with volume CT screening in a randomized trial. N Engl J Med 2020, 382, 503–513. [Google Scholar] [CrossRef] [PubMed]
- Available on https://www.nccn.org/professionals/physician_gls/pdf/nscl.pdf. Accessed on 08/05/2024.
- Hendriks, L.E.; Kerr, K.M.; Menis, J.; Mok, T.S.; Nestle, U.; Passaro, A.; Peters, S.; Planchard, D.; Smit, E.F.; Solomon, B.J.; et al. Non-oncogene-addicted metastatic non-small-cell lung cancer: ESMO Clinical Practice Guideline for diagnosis, treatment and follow-up. Ann Oncol 2023, 34, 358–376. [Google Scholar] [CrossRef]
- Putzu, C.; Canova, S.; Paliogiannis, P.; Lobrano, R.; Sala, L.; Cortinovis, D.L.; Colonese, F. Duration of immunotherapy in non-small cell lung cancer survivors: A lifelong commitment? Cancers (Basel) 2023, 15, 689. [Google Scholar] [CrossRef]
- Akhtar, M.; Rashid, S.; Al-Bozom, I.A. PD-L1 immunostaining: what pathologists need to know. Diagn Pathol 2021, 16, 94. [Google Scholar] [CrossRef]
- Di Lorenzo, B.; Pau, M.C.; Zinellu, E.; Mangoni, A.A.; Paliogiannis, P.; Pirina, P.; Fois, A.G.; Carru, C.; Zinellu, A. Association between red blood cell distribution width and obstructive sleep apnea syndrome: A systematic review and meta-analysis. J Clin Med 2023, 12, 3302. [Google Scholar] [CrossRef]
- Guo, R.; Li, J.; Ma, X.; Pan, L. The predictive value of neutrophil-to-lymphocyte ratio for chronic obstructive pulmonary disease: a systematic review and meta-analysis. Expert Rev Respir Med 2020, 14, 929–936. [Google Scholar] [CrossRef]
- Shojaan, H.; Kalami, N.; Ghasempour Alamdari, M.; Emami Alorizy, S.M.; Ghaedi, A.; Bazrgar, A.; Khanzadeh, M.; Lucke-Wold, B.; Khanzadeh, S. Diagnostic value of the neutrophil lymphocyte ratio in discrimination between tuberculosis and bacterial community acquired pneumonia: A meta-analysis. J Clin Tuberc Other Mycobact Dis 2023, 33, 100395. [Google Scholar] [CrossRef] [PubMed]
- Zhang, S.; Wang, Y.; Cheng, Y. Neutrophil-to-lymphocyte and platelet-to-lymphocyte ratios as prognostic biomarkers in limited-stage small-cell lung cancer: a meta-analysis. Future Oncol 2023, 19, 1303–1314. [Google Scholar] [CrossRef]
- Zhou, H.; Li, J.; Zhang, Y.; Chen, Z.; Chen, Y.; Ye, S. Platelet-lymphocyte ratio is a prognostic marker in small cell lung cancer-A systemic review and meta-analysis. Front Oncol 2023, 12, 1086742. [Google Scholar] [CrossRef]
- Putzu, C.; Cortinovis, D.L.; Colonese, F.; Canova, S.; Carru, C.; Zinellu, A.; Paliogiannis, P. Blood cell count indexes as predictors of outcomes in advanced non-small-cell lung cancer patients treated with Nivolumab. Cancer Immunol Immunother 2018, 67, 1349–1353. [Google Scholar] [CrossRef] [PubMed]
- Ginesu, G.C.; Paliogiannis, P.; Feo, C.F.; Cossu, M.L.; Scanu, A.M.; Fancellu, A.; Fois, A.G.; Zinellu, A.; Perra, T.; Veneroni, S.; et al. Inflammatory indexes as predictive biomarkers of postoperative complications in oncological thoracic surgery. Curr Oncol 2022, 29, 3425–3432. [Google Scholar] [CrossRef] [PubMed]
- Paliogiannis, P.; Ginesu, G.C.; Tanda, C.; Feo, C.F.; Fancellu, A.; Fois, A.G.; Mangoni, A.A.; Sotgia, S.; Carru, C.; Porcu, A, et al. Inflammatory cell indexes as preoperative predictors of hospital stay in open elective thoracic surgery. ANZ J Surg 2018, 88, 616–620. [Google Scholar] [CrossRef] [PubMed]
- Tanaka, S.; Uchino, J.; Yokoi, T.; Kijima, T.; Goto, Y.; Suga, Y.; Katayama, Y.; Nakamura, R.; Morimoto, K.; Nakao, A.; et al. Prognostic Nutritional Index and Lung Immune Prognostic Index as prognostic predictors for combination therapies of immune checkpoint inhibitors and cytotoxic anticancer chemotherapy for patients with advanced non-small cell lung cancer. Diagnostics (Basel) 2022, 12, 423. [Google Scholar] [CrossRef] [PubMed]
- Prelaj, A.; Ferrara, R.; Rebuzzi, S.E.; Proto, C.; Signorelli, D.; Galli, G.; De Toma, A.; Randon, G.; Pagani, F.; Viscardi, G.; et al. EPSILoN: A prognostic score for immunotherapy in advanced non-small-cell lung cancer: A validation cohort. Cancers (Basel) 2019, 11, 1954. [Google Scholar] [CrossRef] [PubMed]
- Punekar, S.R.; Shum, E.; Grello, C.M.; Lau, S.C.; Velcheti, V. Immunotherapy in non-small cell lung cancer: Past, present, and future directions. Front Oncol 2022, 12, 877594. [Google Scholar] [CrossRef] [PubMed]
- Gandhi, L.; Rodríguez-Abreu, D.; Gadgeel, S.; Esteban, E.; Felip, E.; De Angelis, F.; Domine, M.; Clingan, P.; Hochmair, M.J.; Powell, S.F.; et al. Pembrolizumab plus chemotherapy in metastatic non-small-cell lung cancer. N Engl J Med 2018, 378, 2078–2092. [Google Scholar] [CrossRef]
- Paz-Ares, L.; Luft, A.; Vicente, D.; Tafreshi, A.; Gümüş, M.; Mazières, J.; Hermes, B.; Çay Şenler, F.; Csőszi, T.; Fülöp, A.; et al. Pembrolizumab plus chemotherapy for squamous non-small-cell lung cancer. N Engl J Med 2018, 379, 2040–2051. [Google Scholar] [CrossRef] [PubMed]
- Gadgeel, S.; Rodríguez-Abreu, D.; Speranza, G.; Esteban, E.; Felip, E.; Dómine, M.; Hui, R.; Hochmair, M.J.; Clingan, P.; Powell, S.F.; et al. Updated analysis from KEYNOTE-189: Pembrolizumab or placebo plus Pemetrexed and Platinum for previously untreated metastatic nonsquamous non-small-cell lung cancer. J Clin Oncol 2020, 38, 1505–1517. [Google Scholar] [CrossRef]
- Reck, M.; Ciuleanu, T.E.; Cobo, M.; Schenker, M.; Zurawski, B.; Menezes, J.; Richardet, E.; Bennouna, J.; Felip, E.; Juan-Vidal, O.; et al. First-line nivolumab plus ipilimumab with two cycles of chemotherapy versus chemotherapy alone (four cycles) in advanced non-small-cell lung cancer: CheckMate 9LA 2-year update. ESMO Open 2021, 6, 100273. [Google Scholar] [CrossRef]
- Nishio, M.; Ohe, Y.; Ikeda, S.; Yokoyama, T.; Hayashi, H.; Fukuhara, T.; Sato, Y.; Tanaka, H.; Hotta, K.; Sugawara, S.; et al. First-line nivolumab plus ipilimumab in metastatic non-small cell lung cancer: 5-year outcomes in Japanese patients from CheckMate 227 Part 1. Int J Clin Oncol 2023, 28, 1354–1368. [Google Scholar] [CrossRef]
- Kiriu, T.; Yamamoto, M.; Nagano, T.; Hazama, D.; Sekiya, R.; Katsurada, M.; Tamura, D.; Tachihara, M.; Kobayashi, K.; Nishimura, Y. The time-series behavior of neutrophil-to-lymphocyte ratio is useful as a predictive marker in non-small cell lung cancer. PLoS One 2018, 13, e0193018. [Google Scholar] [CrossRef]
- Gibney, G.T.; Weiner, L.M.; Atkins, M.B. Predictive biomarkers for checkpoint inhibitor-based immunotherapy. Lancet Oncol 2016, 17, e542–e551. [Google Scholar] [CrossRef]
- Hawinkels, L.J.; Zuidwijk, K.; Verspaget, H.W.; de Jonge-Muller, E.S.; van Duijn, W.; Ferreira, V.; Fontijn, R.D.; David, G.; Hommes, D.W.; Lamers, C.B.; et al. VEGF release by MMP-9 mediated heparan sulphate cleavage induces colorectal cancer angiogenesis. Eur J Cancer 2008, 44, 1904–1913. [Google Scholar] [CrossRef]
- Malhab, L.J.B.; Saber-Ayad, M.M.; Al-Hakm, R.; Nair, V.A.; Paliogiannis, P.; Pintus, G.; Abdel-Rahman, W.M. Chronic inflammation and cancer: The role of endothelial dysfunction and vascular inflammation. Curr Pharm Des 2021, 27, 2156–2169. [Google Scholar] [CrossRef]
- Schmied, L.; Höglund, P.; Meinke, S. Platelet-mediated protection of cancer cells from immune surveillance - possible implications for cancer immunotherapy. Front Immunol 2021, 12, 640578. [Google Scholar] [CrossRef]
- Shi, Y.; Liu, X.; Liu, J.; Zhang, D.; Liu, X.; Yue, Y.; Zhou, Q.; Gao, X.; Chen, M.; Xu, Y.; et al. Correlations between peripheral blood biomarkers and clinical outcomes in advanced non-small cell lung cancer patients who received immunotherapy-based treatments. Transl Lung Cancer Res 2021, 10, 4477–4493. [Google Scholar] [CrossRef]
- Li, C.; Wu, J.; Jiang, L.; Zhang, L.; Huang, J.; Tian, Y.; Zhao, Y.; Liu, X.; Xia, L.; Gao, P.; et al. The predictive value of inflammatory biomarkers for major pathological response in non-small cell lung cancer patients receiving neoadjuvant chemoimmunotherapy and its association with the immune-related tumor microenvironment: a multi-center study. Cancer Immunol Immunother 2023, 72, 783–794. [Google Scholar] [CrossRef]
Figure 1.
Kaplan–Meier survival curves show significant lower survival with higher values of WBC, neutrophils, NLR, and MLR.
Figure 1.
Kaplan–Meier survival curves show significant lower survival with higher values of WBC, neutrophils, NLR, and MLR.
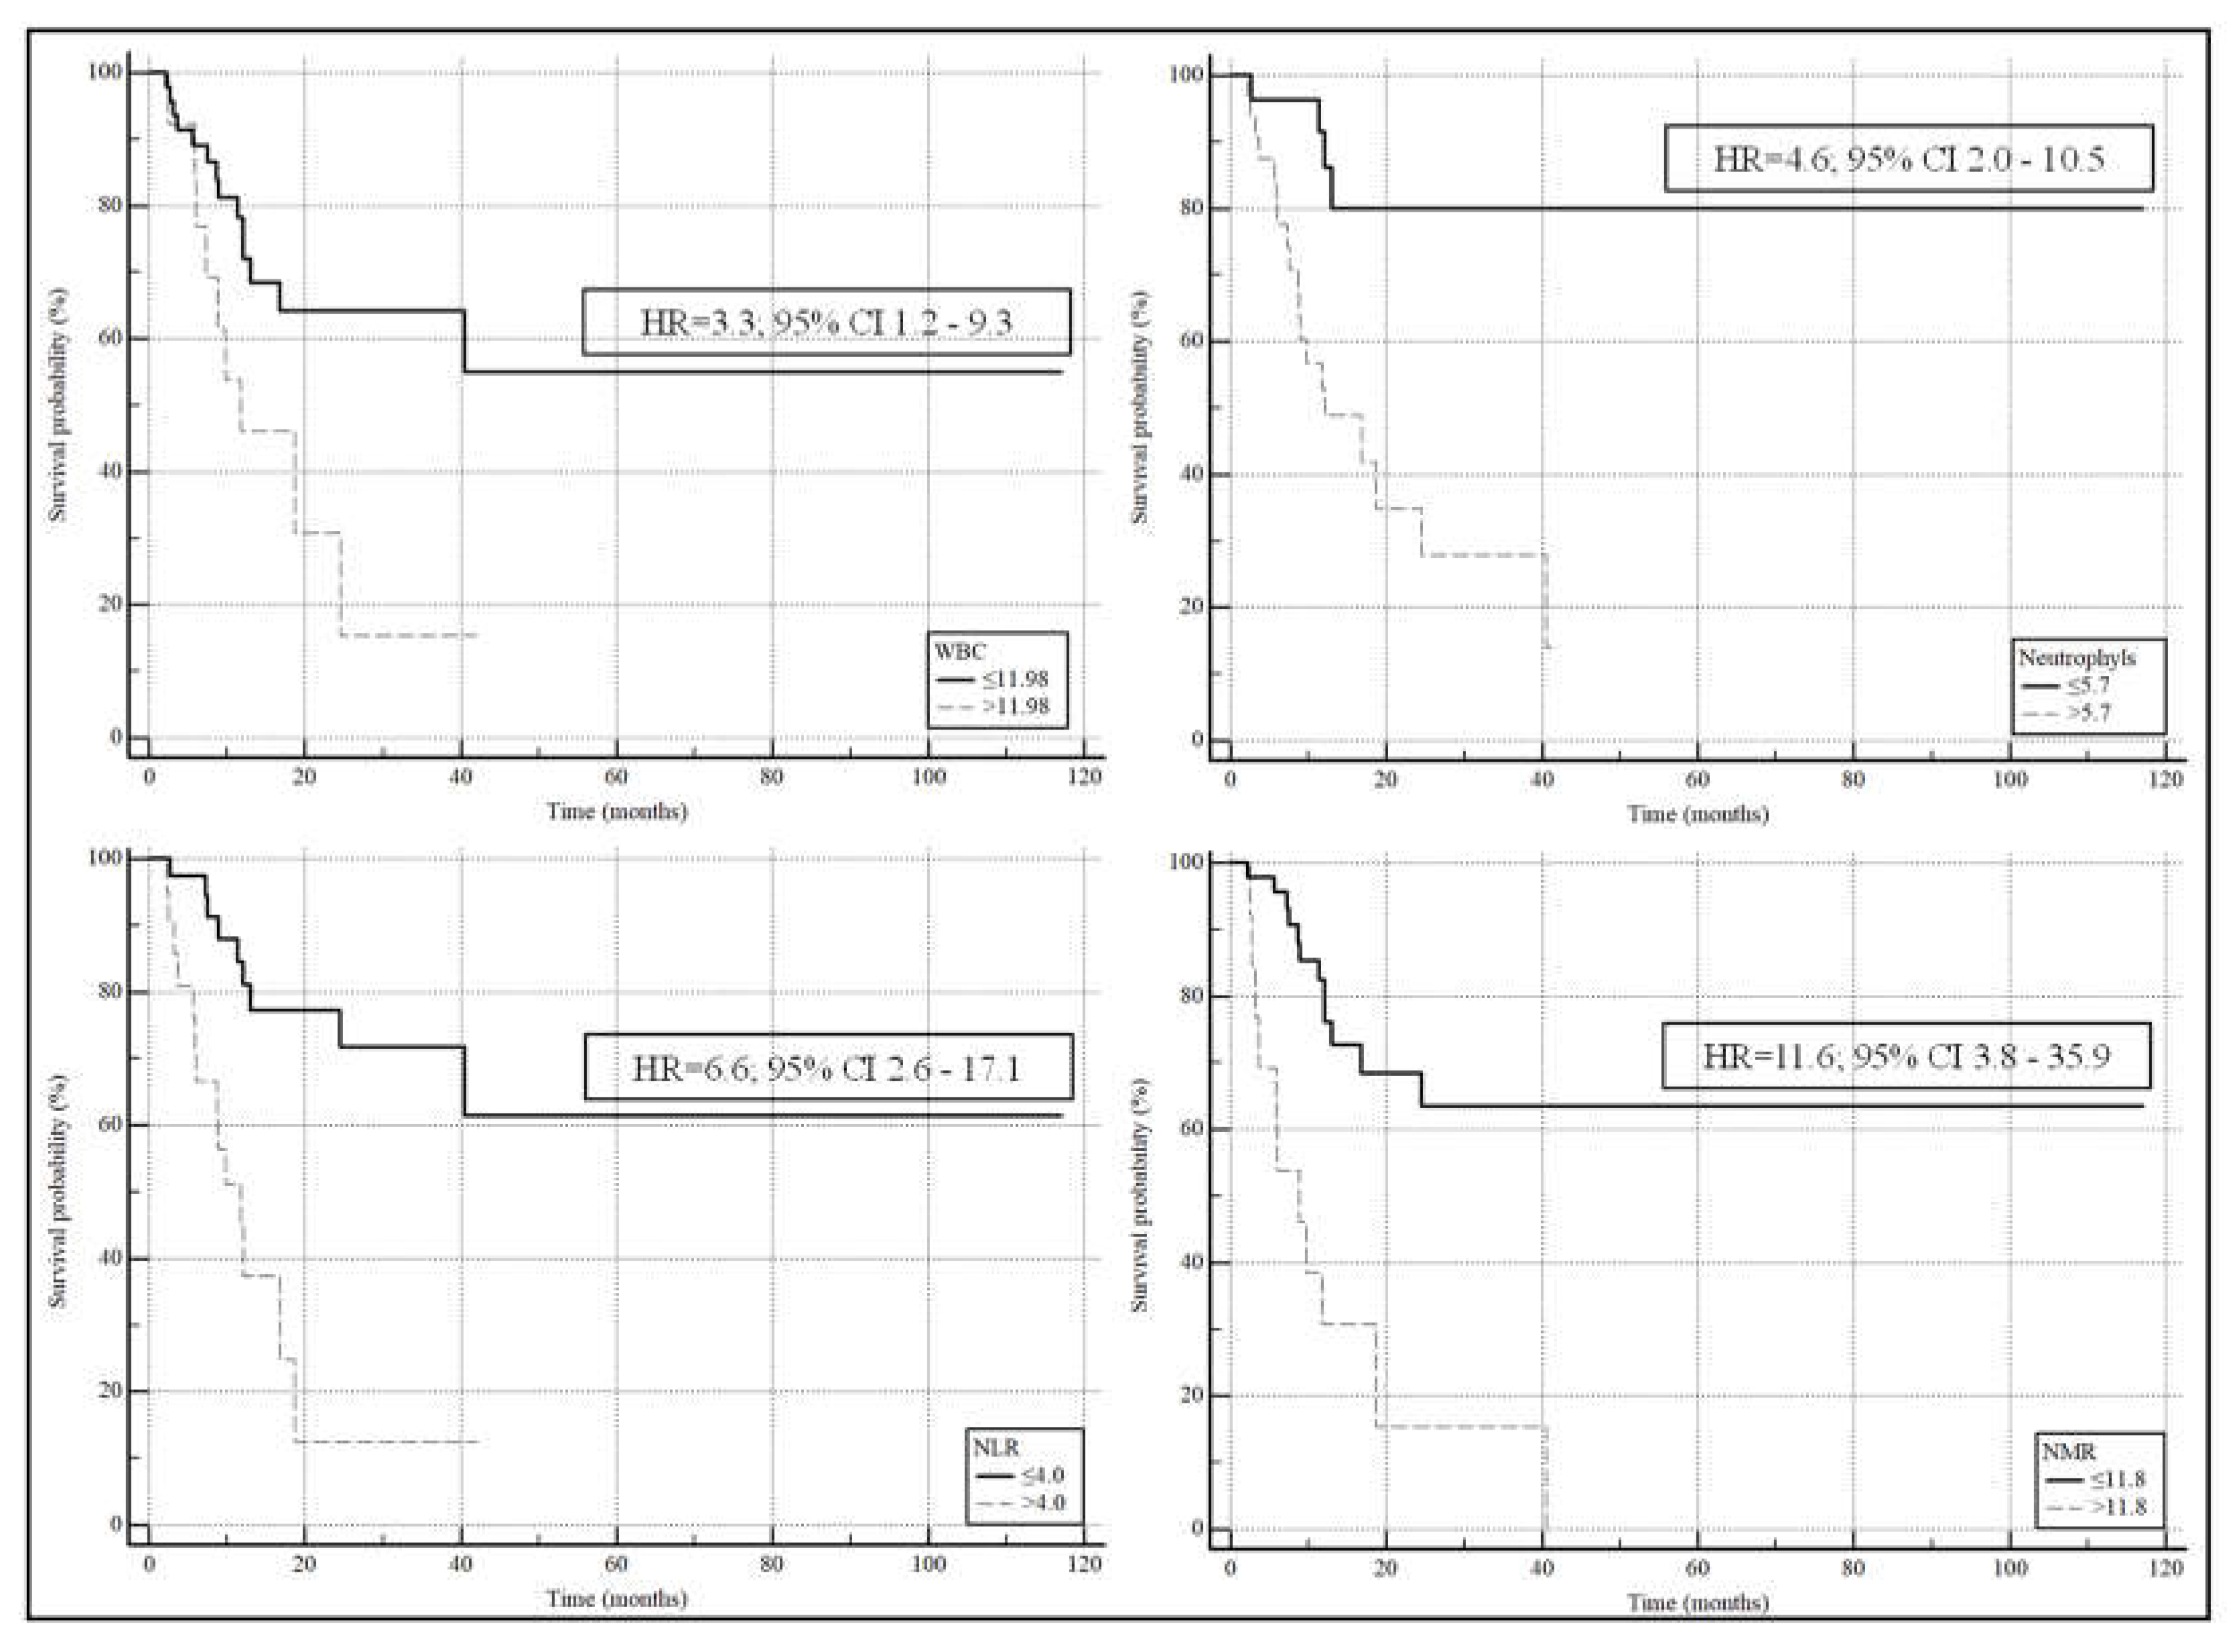

Table 1.
Demographic, clinical, and hematological characteristics of the global population and after sorting for treatment response.
Table 1.
Demographic, clinical, and hematological characteristics of the global population and after sorting for treatment response.
| Global cohort (n=62) |
Responders (n=47) |
Non-responders (n=15) |
p-value | |
|---|---|---|---|---|
| Age, years | 68.5 (62.0-74.0) | 66.0 (61.3-72.8) | 71.0 (64.8-75.0) | 0.17 |
| Gender (M/F) | 45/17 | 34/13 | 11/4 | 0.94 |
| Smoking status, n (no/former/yes) | 3/45/11 | 3/33/9 | 0/12/2 | 0.51 |
| Histological type, n (ADK/SQ) | 53/9 | 41/6 | 12/3 | 0.49 |
| PDL1, n (yes/no) | 30/30 | 23/22 | 7/8 | 0.77 |
| Stage T, n (T1/T2/T3/T4) | 4/2/3/53 | 4/2/2/39 | 0/0/1/14 | 0.53 |
| Stage N, n (N0/N1/N2/N3) | 3/9/11/38 | 3/9/8/26 | 0/0/3/12 | 0.18 |
| Deceased, n (yes/no) | 23/37 | 10/35 | 13/2 | <0.0001 |
| Overall survival, (months) | 12.1 (7.4-24.3) | 14.5 (9.1-31.9) | 7.5 (4.2-11.2) | 0.0015 |
| Hb (g/dL) | 12.3±1.7 | 12.6±1.7 | 11.9±1.8 | 0.47 |
| RDW, (%) | 14.7 (13.8-15.8) | 14.7 (13.4-15.8) | 14.8 (14.1-15.6) | 0.53 |
| WBC, n (×109 L) | 8.86 (7.40-11.15) | 8.74 (6.91-10.72) | 8.96 (7.96-13.73) | 0.29 |
| Neutrophils, n (×109 L) | 6.00 (4.10-7.60) | 5.62 (3.80-7.37) | 6.40 (5.59-11.95) | 0.074 |
| Lymphocytes, n (×109 L) | 1.70 (1.30-2.20) | 1.80 (1.40-2.44) | 1.40 (1.10-1.98) | 0.10 |
| Monocytes, n (×109 L) | 0.60 (0.50-0.80) | 0.60 (0.50-0.80) | 0.60 (0.50-0.80) | 0.55 |
| Platelets, n (×109 L) | 287 (253-355) | 287 (254-362) | 293 (247-349) | 0.91 |
| NLR | 3.45 (2.18-5.47) | 3.31 (2.15-4.12) | 5.36 (2.78-10.82) | 0.019 |
| NMR | 9.75 (7.60-11.80) | 9.20 (7.45-11.20) | 14.00 (8.82-21.20) | 0.013 |
| MLR | 0.33 (0.23-0.53) | 0.33 (0.23-0.51) | 0.40 (0.21-0.55) | 0.67 |
| PLR | 169 (118-246) | 163 (114-244)) | 209 (131-248) | 0.17 |
| SII | 985 (624-1838) | 945 (552-1373) | 1395 (929-3334) | 0.025 |
| AISI | 543 (277-1072) | 487 (273-955) | 837 (357-1524) | 0.20 |
ADK: adenocarcinoma; AISI: aggregate index of systemic inflammation; F: female; Hb: haemoglobin; M: male; MLR: monocyte to lymphocyte ratio; NLR: neutrophil to lymphocyte ratio; NMR: neutrophil to monocyte ratio; PD-L1: programmed death ligand 1; RDW: red cell distribution width; SII: systemic inflammation index; SQ: squamous cell cancer; WBC: white blood cells.
Table 2.
Univariate logistic regression assessing the association between patient characteristics and treatment response.
Table 2.
Univariate logistic regression assessing the association between patient characteristics and treatment response.
| OR | 95% CI | p-value | |
|---|---|---|---|
| Age, years | 1.0424 | 0.9735 to 1.1162 | 0.23 |
| Gender (M/F) | 0.9510 | 0.2564 to 3.5275 | 0.94 |
| Smoking status, n (no/former/yes) | 1.0444 | 0.2906 to 3.7533 | 0.95 |
| Histological type, n (ADK/SQ) | 1.7083 | 0.3707 to 7.8732 | 0.49 |
| PD-L1, n (yes/no) | 1.1948 | 0.3706 to 3.8525 | 0.77 |
| Stage T, n (T1/T2/T3/T4) | 2.3437 | 0.5289 to 10.3860 | 0.26 |
| Stage N, n (N0/N1/N2/N3) | 2.7685 | 0.9610 to 7.9752 | 0.06 |
| Hb (g/dL) | 0.7851 | 0.5462 to 1.1286 | 0.19 |
| RDW, (%) | 1.1248 | 0.8202 to 1.5426 | 0.47 |
| WBC, n | 1.0731 | 0.9289 to 1.2395 | 0.34 |
| Neutrophils, n | 1.1335 | 0.9724 to 1.3213 | 0.11 |
| Lymphocytes, n | 0.4280 | 0.1620 to 1.1309 | 0.09 |
| Monocytes, n | 0.2614 | 0.0253 to 2.7002 | 0.26 |
| Platelets, n | 0.9987 | 0.9939 to 1.0036 | 0.60 |
| NLR | 1.2561 | 1.0519 to 1.4998 | 0.012 |
| NMR | 1.1410 | 1.0121 to 1.2864 | 0.03 |
| MLR | 1.8104 | 0.1299 to 25.2236 | 0.66 |
| PLR | 1.0018 | 0.9983 to 1.0053 | 0.32 |
| SII | 1.0002 | 0.9999 to 1.0005 | 0.27 |
| AISI | 1.0000 | 0.9997 to 1.0003 | 0.84 |
ADK: adenocarcinoma; AISI: aggregate index of systemic inflammation; F: female; Hb: haemoglobin; M: male; MLR: monocyte to lymphocyte ratio; NLR: neutrophil to lymphocyte ratio; NMR: neutrophil to monocyte ratio; PD-L1: programmed death ligand 1; RDW: red cell distribution width; SII: systemic inflammation index; SQ: squamous cell cancer; WBC: white blood cells.
Table 3.
Multivariate logistic regression analysis for hematological biomarkers, in the prediction of treatment response.
Table 3.
Multivariate logistic regression analysis for hematological biomarkers, in the prediction of treatment response.
| Model 1 | Model 2 | |||||
|---|---|---|---|---|---|---|
| aOR | 95% CI | p-value | aOR | 95% CI | p-value | |
| NLR | 1.3210 | 1.0648 to 1.6387 | 0.01 | 1.8300 | 1.1236 to 2.9806 | 0.02 |
| NMR | 1.1585 | 1.0070 to 1.3328 | 0.04 | 1.1698 | 1.0019 to 1.3657 | 0.047 |
Model 1: correction performed with age, gender smoking status, histological type, PDL1. Model 2: correction performed with with age, gender smoking status, stage T and stage N. NLR: neutrophil to lymphocyte ratio; NMR: neutrophil to monocyte ratio.
Table 4.
Demographic, clinical, and hematological characteristics of the global population and after sorting for survival.
Table 4.
Demographic, clinical, and hematological characteristics of the global population and after sorting for survival.
| Global cohort (n=60) |
Survivors (n=37) |
Non-survivors (n=23) |
p-value | |
|---|---|---|---|---|
| Age, years | 68.0 (62.0-73.5) | 66.0 (62.0-73.3) | 70.0 (61.5-74.5) | 0.37 |
| Gender (M/F) | 44/16 | 27/10 | 17/6 | 0.94 |
| Smoking status, n (no/former/yes) | 3/43/11 | 3/25/7 | 0/18/4 | 0.35 |
| Histological type, n (ADK/SQ) | 51/9 | 33/4 | 18/5 | 0.25 |
| PD-L1, n (yes/no) | 29/29 | 18/17 | 11/12 | 0.79 |
| Stage T, n (T1/T2/T3/T4) | 4/2/3/51 | 4/2/2/29 | 0/0/1/22 | 0.23 |
| Stage N, n (N0/N1/N2/N3) | 3/8/10/38 | 3/7/5/21 | 0/1/5/17 | 0.15 |
| Hb (g/dL) | 12.3±1.7 | 12.6±1.8 | 12.2±1.7 | 0.43 |
| RDW, (%) | 14.6 (13.6-15.7) | 14.4 (13.3-15.8) | 14.8 (14.1-15.6) | 0.51 |
| WBC, n (×109 L) | 8.94 (7.41-11.53) | 8.26 (6.36-9.92) | 9.69 (7.97-14.03) | 0.026 |
| Neutrophils, n (×109 L) | 6.00 (4.10-7.81) | 5.30 (3.48-7.03) | 7.00 (6.00-11.95) | 0.001 |
| Lymphocytes, n (×109 L) | 1.70 (1.30-2.23) | 1.80 (1.40-2.50) | 1.50 (1.13-2.00) | 0.14 |
| Monocytes, n (×109 L) | 0.60 (0.50-0.80) | 0.60 (0.50-0.80) | 0.80 (0.50-0.80) | 0.32 |
| Platelets, n (×109 L) | 287 (252-353) | 270 (238-336) | 314 (281-407) | 0.052 |
| NLR | 3.45 (2.20-5.42) | 2.94 (1.92-3.88) | 4.56 (3.07-9.49) | 0.012 |
| NMR | 9.60 (7.60-11.75) | 9.00 (7.08-11.05) | 10.40 (8.80-18.18) | 0.007 |
| MLR | 0.34 (0.24-0.54) | 0.33 (0.24-0.41) | 0.43 (0.24-0.58) | 0.16 |
| PLR | 169 (119-246) | 136 (107-201) | 220 (145-273) | 0.016 |
| SII | 985 (626-1709) | 849 (488-1081) | 1493 (1000-2578) | 0.0004 |
| AISI | 594 (279-1168) | 351 (256-794) | 1016 (470-1836) | 0.006 |
ADK: adenocarcinoma; AISI: aggregate index of systemic inflammation; F: female; Hb: haemoglobin; M: male; MLR: monocyte to lymphocyte ratio; NLR: neutrophil to lymphocyte ratio; NMR: neutrophil to monocyte ratio; PD-L1: programmed death ligand 1; RDW: red cell distribution width; SII: systemic inflammation index; SQ: squamous cell cancer; WBC: white blood cells.
Table 5.
Univariate logistic regression assessing the association between patient characteristics and survival.
Table 5.
Univariate logistic regression assessing the association between patient characteristics and survival.
| OR | 95% CI | p-value | |
|---|---|---|---|
| Age, years | 1.0268 | 0.9706 to 1.0863 | 0.36 |
| Gender (M/F) | 0.9529 | 0.2928 to 3.1016 | 0.94 |
| Smoking status, n (no/former/yes) | 1.3482 | 0.4379 to 4.1505 | 0.60 |
| Histological type, n (ADK/SQ) | 2.2917 | 0.5458 to 9.6219 | 0.26 |
| PD-L1, n (yes/no) | 1.1551 | 0.4030 to 3.3107 | 0.79 |
| Stage T, n (T1/T2/T3/T4) | 3.4877 | 0.6931 to 17.5496 | 0.13 |
| Stage N, n (N0/N1/N2/N3) | 2.0009 | 0.9653 to 4.1472 | 0.06 |
| Hb (g/dL) | 0.8804 | 0.6468 to 1.1982 | 0.42 |
| RDW, (%) | 1.1224 | 0.8410 to 1.4978 | 0.43 |
| WBC, n | 1.2202 | 1.0339 to 1.4400 | 0.019 |
| Neutrophils, n | 1.2916 | 1.0692 to 1.5604 | 0.008 |
| Lymphocytes, n | 0.5819 | 0.2719 to 1.2454 | 0.16 |
| Monocytes, n | 1.7055 | 0.2449 to 11.8784 | 0.59 |
| Platelets, n | 1.0014 | 0.9977 to 1.0052 | 0.45 |
| NLR | 1.3601 | 1.0949 to 1.6896 | 0.005 |
| NMR | 1.2159 | 1.0396 to 1.4221 | 0.015 |
| MLR | 5.6613 | 0.4789 to 66.9198 | 0.17 |
| PLR | 1.0023 | 0.9988 to 1.0058 | 0.19 |
| SII | 1.0004 | 1.0000 to 1.0007 | 0.054 |
| AISI | 1.0002 | 0.9999 to 1.0005 | 0.20 |
ADK: adenocarcinoma; AISI: aggregate index of systemic inflammation; F: female; Hb: haemoglobin; M: male; MLR: monocyte to lymphocyte ratio; NLR: neutrophil to lymphocyte ratio; NMR: neutrophil to monocyte ratio; PD-L1: programmed death ligand 1; RDW: red cell distribution width; SII: systemic inflammation index; SQ: squamous cell cancer; WBC: white blood cells.
Table 6.
Multivariate logistic regression analysis for hematological biomarkers in the prediction of mortality.
Table 6.
Multivariate logistic regression analysis for hematological biomarkers in the prediction of mortality.
| Model 1 | Model 2 | |||||
|---|---|---|---|---|---|---|
| aOR | 95% CI | p-value | aOR | 95% CI | p-value | |
| WBC | 1.2596 | 1.0458 to 1.5171 | 0.015 | 1.2475 | 1.0317 to 1.5084 | 0.023 |
| Neutrophils | 1.3112 | 1.0698 to 1.6071 | 0.009 | 1.2990 | 1.0527 to 1.6028 | 0.015 |
| NLR | 1.3498 | 1.0758 to 1.6936 | 0.01 | 1.3489 | 1.0632 to 1.7114 | 0.014 |
| NMR | 1.2502 | 1.0311 to 1.5158 | 0.02 | 1.5685 | 1.0901 to 2.2568 | 0.015 |
Model 1: correction performed with age, gender smoking status, histological type, PDL1. Model 2: correction performed with with age, gender smoking status, stage T and stage N. NLR: neutrophil to lymphocyte ratio; NMR: neutrophil to monocyte ratio; WBC: white blood cells.
Table 7.
Diagnostic performances of hematological biomarkers in the prediction of mortality.
| AUC | 95% CI | p-value | Cut-off | Sensitivity | Specificity | |
|---|---|---|---|---|---|---|
| WBC | 0.672 | 0.539 to 0.788 | 0.017 | >11.98 | 39 | 89 |
| Neutrophyls | 0.746 | 0.617 to 0.849 | 0.0001 | >5.7 | 83 | 65 |
| NLR | 0.749 | 0.620 to 0.852 | 0.0001 | >4.0 | 61 | 81 |
| NMR | 0.707 | 0.576 to 0.818 | 0.0038 | >11.8 | 48 | 92 |
NLR: neutrophil to lymphocyte ratio; NMR: neutrophil to monocyte ratio; WBC: white blood cells.
Table 8.
Multivariate Cox regression analysis for hematological biomarkers in the prediction mortality.
Table 8.
Multivariate Cox regression analysis for hematological biomarkers in the prediction mortality.
| Model 1 | Model 2 | |||||
|---|---|---|---|---|---|---|
| aHR | 95% CI | p-value | aHR | 95% CI | p-value | |
| WBC | 1.1966 | 1.0443 to 1.3711 | 0.01 | 1.1191 | 0.9944 to 1.2594 | 0.062 |
| Neutrophils | 1.2297 | 1.0745 to 1.4074 | 0.003 | 1.1480 | 1.0162 to 1.2970 | 0.027 |
| NLR | 1.3016 | 1.1267 to 1.5037 | 0.003 | 1.2141 | 1.0666 to 1.3819 | 0.003 |
| NMR | 1.0217 | 1.0056 to 1.0380 | 0.008 | 1.0174 | 1.0027 to 1.0324 | 0.021 |
Model 1: correction performed with age, gender smoking status, histological type, PDL1. Model 2: correction performed with with age, gender smoking status, stage T and stage N. NLR: neutrophil to lymphocyte ratio; NMR: neutrophil to monocyte ratio; WBC: white blood cells.
Disclaimer/Publisher’s Note: The statements, opinions and data contained in all publications are solely those of the individual author(s) and contributor(s) and not of MDPI and/or the editor(s). MDPI and/or the editor(s) disclaim responsibility for any injury to people or property resulting from any ideas, methods, instructions or products referred to in the content. |
© 2024 by the authors. Licensee MDPI, Basel, Switzerland. This article is an open access article distributed under the terms and conditions of the Creative Commons Attribution (CC BY) license (http://creativecommons.org/licenses/by/4.0/).
Copyright: This open access article is published under a Creative Commons CC BY 4.0 license, which permit the free download, distribution, and reuse, provided that the author and preprint are cited in any reuse.


