Submitted:
22 May 2024
Posted:
23 May 2024
You are already at the latest version
Abstract
The electronic properties of calcium intercalated graphite (CaC6) as a function of pressure are revisited using density functional theory (DFT). The electronic band structures of CaC6, like many other layered superconducting materials, display cosine-shaped bands at or near the Fermi level (FL). Such bands encompass bonding/antibonding information with a strong connection to superconducting properties. Using an hexagonal cell representation for CaC6, construction of a double supercell in the c-direction effects six-folding in reciprocal space of the full cosine function, explicitly revealing the bonding/antibonding relationship divide at the cosine midpoint. Similarly, folding of the Fermi surface (FS) reveals physical phenomena relevant to electronic topological transitions (ETT) with application of pressure. For CaC6, the peak value for the superconducting transition temperature, Tc, occurs at about 7.5 GPa, near to the observed pressure of the calculated ETT. At this pressure, the radius of the nearly spherical Ca 4s-orbital FS coincides with three times the distance from the G centre point to the Brillouin zone (BZ) boundary of the 2c supercell (which is equal to half the identically defined distance for the primitive rhombohedral BZ). In addition, the ETT coincides with alignment of the non-bonding (inflection) point of the cosine band (the point at which the sign of the cosine amplitude modulation is reversed) with the FL. At other calculated pressure conditions, the Ca 4s-orbital FS undergoes topological changes that correspond and can be correlated to experimentally determined changes in Tc. The ETT is a key mechanism that circumscribes the known significant drop in Tc for CaC6 as a function of increasing pressure.
Keywords:
Superconductivity
; CaC6
; Fermi surface
; Fermi level
; Electronic topological transition
; superlattice
1. Introduction
Graphite intercalant compounds (GICs) are among the many interesting carbon (C)-containing families of superconductors [1,2,3]. Superconductivity was discovered in the compound calcium intercalated graphite (CaC6) in 2005 exhibiting a critical temperature (Tc) of 11.5K at ambient pressure [4]. In this compound, calcium (Ca) is intercalated between graphene layers. Initially, there was ambiguity regarding the number of graphene layers and Ca stacking in the primitive unit cells, as CaC6 was first believed to adopt an hexagonal structure with double layers [5], similar to other metal-intercalated graphite compounds like YbC6 (which has a Tc of 6.5K) [4]. This misconception was clarified through the synthesis of bulk CaC6 [6], which confirmed a distinctive rhombohedral symmetry () compared to other GICs. This discovery of Tc in CaC6, coupled with aspiration to broaden the applications of graphene, ignited substantial research interest that yielded several pivotal findings [7,8,9].
Understanding of superconductivity in CaC6 has been the subject of ongoing debate among researchers. In 2005, Csányi et al. investigated the influence of the free-electron-like interlayer states on the superconductivity of GICs, including YbC6 and CaC6, using density functional theory (DFT) [10]. They hypothesised that a weak coupling between the interlayer states and the graphene layers in GICs creates conditions favourable for soft charge fluctuations. Such conditions could, in turn, foster s-wave superconductivity via an excitonic pairing mechanism. Mazin [5], using DFT calculations, postulated a different origin for superconductivity in YbC6 and CaC6. Mazin proposed a different mechanism involving vibrations from the intercalating elements with the dominant role of the intercalant electronic states at the Fermi level (FL), leads to a pronounced coupling with soft intercalant modes. However, it should be highlighted that both Csányi and Mazin overlooked the correct symmetry of CaC6 in their analyses.
Weller in 2005 [4] stressed the absence of a direct correlation between the amount of charge transferred and Tc. He speculated that the superconductivity evident in GICs could be associated with a resonant valence bond mechanism. A thorough first-principles electron-phonon coupling study was carried out on CaC6 by Calandra et al. [11]. Employing the McMillan formula [12], the critical temperature was computed by Calandra et al. [11], aligning well with experimental data. Notably, the calculated isotope effect for Ca stood at 0.24K. This value contrasts with experimental observation of a large isotope effect, with about 0.5K shift in Tc for Ca reported by Hinks et al. [13].
Additionally, Hinks et al. [13] highlighted the differences in charge transfer between the two compounds CaC6 and MgB2. In MgB2, complete charge transfer from magnesium to the boron network results in strong coupling between carriers and high-energy in-plane boron vibrations, leading to high-Tc superconductivity. However, in CaC6, charge transfer is incomplete, leading to the presence of an interlayer band at the FL. This interlayer band couples with calcium phonons, and this interaction is believed to be responsible for the relatively high Tc observed in CaC6. The precise details of this interaction and its contribution to the observed Tc are still not fully understood. The discrepancy for the Ca isotope effect suggests that the electron-phonon mechanism alone might not fully account for the superconducting attributes of CaC6 [13].
Subsequent experimental investigations have yielded further evidence elucidating the superconductivity mechanism in CaC6. A landmark study by G. Lamura [14] marked the first measurement of the magnetic penetration depth in bulk CaC6, revealing a depth of 720. Lamura emphasised that a single gap analysis aptly captures the data with minimal determination error. He attributed the pairing to the interaction between Ca s-band electrons and the phonon modes of both C out-of-plane and Ca in-plane. Further validation of the s-wave superconducting gap came from scanning tunnelling spectroscopy [15]. Both DFT calculations [16] and directional point-contact spectroscopy [17] identified an anisotropic gap, noting values of 1.35meV and 1.71meV, respectively. The inconsistency among experimental observations, as well as between theoretical predictions and experimental findings concerning the superconducting properties of CaC6, highlights the necessity for further in-depth investigation.
Like isotopic effects, understanding pressure effects on the superconducting properties of CaC6 can also provide insights into underlying mechanisms. Smith et al. [18] investigated the pressure dependence of Tc for CaC6 and YbC6 up to 1.2 GPa. CaC6 exhibited a linear Tc increase with pressure, while YbC6’s Tc initially rose, peaked, and then declined. In a subsequent experiment [19], the Tc of superconducting CaC6 displayed a prominent linear rise with pressure, reaching 15.1K at 7.5 GPa. However, at 8 GPa, a shift to a new phase was noted, characterised by a diminished Tc and inferior metallic properties at room temperature. This phenomenon is believed to be due to pressure-induced phonon softening linked to an in-plane Ca phonon mode. Separately, Gauzzi et al. [20] analysed the room-temperature crystal structure of bulk CaC6 under pressures up to 13 GPa. At 9 GPa, they identified an order-disorder transition coupled with lattice softening. Contrary to expectations of symmetry reduction, the CaC6 structure favoured a disordered arrangement of intercalant Ca atoms in the a–b plane. While the space group symmetry remained unchanged, there was a significant rise in isothermal compressibility and a pronounced broadening of Bragg peaks.
The Fermi surface (FS)-dependent superconducting gap and electron-phonon coupling in CaC6 were studied by Sugawara et al. [21] and Valla and Pan [22] using Angle Resolved Photoemission (ARPES). They discovered that the superconducting gap is anisotropic and varies depending on the FS and provided insights into the electron-phonon coupling in the compound. Yang et al. [23] provided further insight into the superconducting mechanism of CaC6 using ARPES, emphasizing the critical role of the interaction between the π* antibonding orbitals and interlayer bands. Their analysis of superconducting gaps and electron-phonon coupling strengths highlighted the importance of these parameters in achieving the superconducting phase transition. Additionally, they suggested the possibility of inducing superconductivity in a monolayer of graphene by creating an adatom superlattice. Theoretical investigations also extended beyond the superconductivity of CaC6. Rahnejat et al. [24] observed a charge density wave (CDW) in CaC6 using ARPES, which did not cause any distortion of the carbon nuclei, highlighting the remarkable rigidity of graphene. This finding suggested the possibility of inducing CDW and even superconductivity in a graphene-based field-effect transistor through electron-doping.
Geometrical and topological aspects of superconductivity, both in real and reciprocal spaces, are currently topical and gaining widespread interest from the research community. Topology helps to understand not only the details of the physical phenomena but also some general regularity connecting physical behaviours [25]. Topological properties are relevant for quantum materials, which include superconductors, graphene, topological insulators, Weyl semimetals, quantum spin liquids, and spintronic devices, among others [26]. Topology contributes to the scientific search for universality, assisting in identification of underlying organizing principles, and evaluation of concepts that can be developed to enable a deeper understanding [27].
In this work, using first-principles calculations, we systematically investigate the changes in topology of electronic band structures (EBSs) and FSs of CaC6 under various pressures. We evaluate two software versions of DFT and benchmark specific computational parameters in order to determine, at meV-scale, details of the EBS and FS variation with pressure. The pressure-driven alterations to EBSs, FSs and electronic charge are analysed in terms of a double superlattice cell along the c axis using a hexagonal lattice with Space Group P1. The information derived in this article by using superlattices further validates their introduction and is complementary to the information provided in a companion article [28].
In CaC6, bands at or near the FL show a cosine-modulated dependence. This dependence infers a bonding/antibonding (or in-phase/out-of-phase) modulation as noted in earlier work [28,29]. Interpretation of results from the superlattice perspective identifies an electronic topological transition (ETT), consistent with well-established understanding of ETT’s of other layered and non-layered superconductors. The findings provide fresh insight into the principles driving superconductivity in CaC6, thereby enriching our understanding of superconducting properties.
2. Methods
We have conducted a comprehensive DFT analysis on the EBSs and FSs of CaC6 within a pressure range from 0 GPa up to 16 GPa using Quantum ESPRESSO [30] and Materials Studio CASTEP [31] for comparison. Crystal structures are visualised with Crystal Maker V11.0.2 using geometry optimised cell parameters of experimentally determined values.
Due to the small superconducting gap for CaC6 (~1.7 meV), achieving convergence that accurately predicts ground state properties is essential. Previous studies have indicated the feasibility of deducing critical temperatures from electronic band structures under higher convergence conditions [32,33,34]. Considering the necessity for high precision in determining the superconducting gap, to an accuracy of about meV, we implemented a meticulous benchmarking process, with detailed results provided in the supporting file. This process entailed a thorough evaluation of parameters including plane wave cut-off energies, pseudopotentials, and k-point grids [32]. We provide details of this evaluation in the Supplemental section.
Our benchmarking tests varied cut-off energies from 40 Ry (=544 eV) to 200Ry (=2720 eV) and have shown that low cut off energies lead to large deviations from consistent results. As shown in Figure S2 (Supplemental section), we observed that the total energy of CaC6 converges within a margin of 1 meV for cut-off energies higher than 120 Ry. Additionally, fluctuations in Fermi energies (FEs), with a consistent magnitude of ~ 0.2 meV, were only noted when cut-off energies exceeded 100 Ry. Given that Δ, the zero-temperature superconducting gap, is 1.79±0.08 meV [17,21], selecting cut-off energies above 120 Ry was deemed appropriate for accurate representation.
Further, we evaluated the total system energies and Fermi surface of CaC6 using a variety of k-point grids. The convergence behaviour for both total energy and FE under different k-point grids is detailed in Figure S3 (Supplemental). Our findings suggest that the total energy stabilises using k-point grids of density higher than a 24×24×24 sampling grid, with energy fluctuations ranging from -1 meV to 1 meV beyond this point. The FE demonstrated similar trends, achieving convergence with the 24×24×24 k-point grid.
To select suitable pseudopotentials, we adopted a systematic approach, testing various options and comparing preliminary results with experimental data. In the context of CaC6, a rhombohedral crystal structure has been experimentally determined [6]. The experimental X-ray diffraction data provide lattice constants: and α = . These lattice parameters are converted to an equivalent centrosymmetric hexagonal cell with D3d Schoenflies point group symmetry for EBS calculations.
To assess and optimise the choice of pseudopotentials, we performed unit cell relaxation using ten distinct pseudopotentials. The pseudopotentials include GGA+PAW, GGA+US, LDA+PAW, LDA+US, GGA+US+rVV10 [35], GGA+US+vdW-DF [36,37], GGA+US+ vdW-DF2 [38], GGA+US+vdW-DF3-opt1 [39], GGA+US+vdW-DF3-opt2 [39] and GGA+US+vdW-DF-C6 [40]. These pseudopotentials encompass a range of exchange-correlation approximations and treatments of electron-electron interactions including van der Waal (vdW) interactions [41]. We evaluate these pseudopotentials in order to comprehensively investigate their influence on calculated properties.
By employing this comprehensive array of pseudopotentials and drawing comparisons with experimentally determined lattice constants and other pertinent properties, we aim to identify the pseudopotential that best aligns with observed behaviour of CaC6, ultimately enhancing the accuracy and reliability of our computational predictions. Figure S4 (Supplemental) indicates the disparities between simulated lattice parameters and corresponding experimental data, for various pseudopotentials noted above. The chart offers insight into the accuracy of different pseudopotentials in reproducing experimental lattice parameters (assumed to be measured at low temperature, although the temperature conditions of the experimental XRD analysis are not disclosed [6]) and follows earlier investigations on pseudopotential choices for MB2- and MB6-type compounds [42,43,44].
As shown in Figure S4 (Supplemental), simulations using GGA+PAW, GGA+US and GGA+US+rVV10 pseudopotentials yield lattice parameter values that most closely approximate experimental values. While all three options display promising alignment with experimental data, considerations of computational efficiency became pivotal in the selection process. For simulations employing the GGA+US pseudopotential, the discrepancies in lattice parameters compared to experimental data stand at 0.19% for and 0.46% for These small deviations underscore the reliability of the chosen pseudopotential and capacity to represent the properties of CaC6.
Following these benchmarking calculations, we chose to employ ultrasoft pseudopotentials [45] with a generalised gradient approximation (GGA) [46,47] for the exchange-correlation functional, based on the closest match between calculated and experimental reported lattice parameters. Eigenfunctions were expanded using a plane-wave basis set with a cut-off energy of 120 Ry. For the wavefunctions and density of states, we used a Monkhorst-Pack grid [48] and a 0.02 Ry Methfessel-Vanderbilt smearing [49]. We also explored norm-conserving pseudopotentials within the LDA and GGA approximations using CASTEP with cut-off energy 990 eV and Dk-grid 0.005 Å-1 for additional comparisons.
For CaC6, based on the atomic position symmetry, it is generally accepted that a rhombohedral structure applies with lattice parameters and and group symmetry [28]. This structure can also be represented by an equivalent hexagonal structure with lattice parameters In a rhombohedral view of CaC6, the calcium atoms are stacked along the c-axis in an AαAβAγ sequence. The AA stacking pattern represents two adjacent layers of graphene. In this structure, the intercalant metal atoms within each layer occupy one of three prismatic hexagonal sites, labelled as α, β, and γ. Following standard conventions [50] for high symmetry paths as depicted in Figure S5, key symmetry directions ΓZ and ΓA are related as follows (see also ref [28]):
ΓZR = 3ΓAH
ΓZR = p/c.
c =13.572A
(a1* + a2* + a3*)/3 = p/c
Where a1*, a2* and a3* represent the reciprocal unit cell vectors in the rhombohedral lattice, while c denotes the hexagonal lattice spacing in the direction perpendicular to the graphene layers.
DFT calculations considered both a primitive rhombohedral unit cell and the equivalent hexagonal counterpart. The specific lattice constants used as input for calculations were taken from X-ray diffraction results of bulk CaC6 [6]. Figure 1 shows schematics of the hexagonal structure, after geometry optimisation, for selected isostatic pressures. We have also explored several supercell calculations, which could lead to folding of reciprocal space [28,29] in selected high-symmetry directions. Figure 2 shows a schematic of the 2c double hexagonal supercell. The supercell periods effectively track the bonding/antibonding modulations (or alternating phase changes) in reciprocal space, indicated by an electronic band with cosine function near the FL [51].
Using an hexagonal cell with equivalent symmetry to the rhombohedral cell, the original cosine function, which runs along the direction perpendicular to the planes or layers, has a periodicity of the 2c-lattice parameter in real space [28]. By using a 2c-supercell, the periodicity of a 1c-lattice folded at the mid-point is equivalent in reciprocal space and defines a new BZ boundary where the non-bonding condition is defined.
For the EBS of the supercell, two cosine branches exist, one with lower energy for the bonding condition and another with higher energy for the antibonding condition. These two branches intersect the Γ point at the maximum bonding (lowest) and maximum antibonding (highest) energy values. The periodicities of these phase modulations may also originate from, and correspond to, atomic orbital symmetry as noted in earlier work on MgB2 [32].
For clearer and deeper insight, we mapped the FSs under varying pressures, using FermiSurfer [52] to visualize the FSs from the Quantum ESPRESSO output data. Charge transfer data were calculated using the software Bader Charge Analysis [53,54,55,56]. CASTEP results on FSs were exported in bitmap format from their display in the software with a limited selection of FS branches and used for complementary illustration of information.
3. Results and Discussion
This section presents our findings from the DFT analysis of CaC6, divided into three parts. We begin by looking at how the EBSs and FSs fold when double supercells are introduced. Then, we explore how EBSs and FSs change with different pressure levels and identify the ETT. Finally, we discuss the connection between the ETT, or Lifshitz transition, to the superconducting properties of CaC6. Through this approach, we shed light onto factors that determine the superconducting behaviour of CaC6 and identify further common features with ETTs for other superconductors.is section may be divided by subheadings. It should provide a concise and precise description of the experimental results, their interpretation, as well as the experimental conclusions that can be drawn.
3.1. Electronic Band Structures, Fermi Surfaces and Superlattices
The DFT calculated EBS and reciprocal path directions the for the 2c double hexagonal unit cell are shown in Figure 3a,b, respectively. Equivalent results for the rhombohedral unit cell with high symmetry paths which follow the conventions described in reference [50] are given in Supplementary Figures S5 and S6, for convenience.
A nearly free electron band in the reciprocal space direction, with a folded cosine-modulated shape for the 2c double hexagonal cell, can be observed crossing the FL (see band and labelled regions inside the yellow box in Figure 3a). The mid-point of the cosine-modulated band is an inflection point at Z for the derivative of the band [29,57], separating folded regions with bonding and antibonding character, from Γ to and back from to Γ, respectively. Constructing a double superlattice along 2c in real space folds the reciprocal space in two at the point and folds the EBS; thus, highlighting clearly the bonding and antibonding regions [29,57].
For the hexagonal cell shown in Figures 1a and 1b, the EBS is triply folded in the c*-axis direction (see reference [28]) as expected from the relationship between reciprocal space directions for rhombohedral and hexagonal unit cells given in Equations (1)–(4). A double hexagonal supercell has the correct 2c-lattice dimension that locates the required folding at the midpoint of the original cosine function for distinct separation of bonding and antibonding regions. From Supplemental Figure S6, which displays the projected energy bands and DOS for the primitive rhombohedral unit cell, we can see that the majority of electrons at the Fermi level have Ca 4s and C with 2pz-orbital character. There is a small fractional contribution of electrons from C with 2s-orbital character, particularly for the cosine-shaped band.
Figure 4a,b show cross sections of the FS of CaC6 calculated for the 2c double hexagonal supercell at 0 GPa using CASTEP. In Figure 4a an additional FS band compared to Figure 4b is shown with partial transparency. However, as the number of bands increases, it becomes more difficult to distinguish overlapping sections. Figure 4b shows a magnified view of the FS shown in Figure 4a, but with one less FS band (notice that the circle arc in the equatorial, horizontal direction is missing in Figure 4b). On the other hand, the circular caps at the top and bottom of the FS, which were barely, if at all, visible in Figure 4a, are more clearly distinguishable in Figure 4b. This is one of the advantages of QE over CASTEP for displaying multiple FSs, because cross sections can be precisely cut at chosen planes, while CASTEP shows overlapping volumetric contours.
Figure 4c shows the procedure of how the rhombohedral FS surface can be folded six times to obtain the 2c double hexagonal FS. Notice that for the FSs directly calculated for the 2c double superlattices, the interesctions of the FSs with the BZ boundaries are perpendicular (see red circled regions in Figure 4b) and that adjacent FS branches at potential intersections develop gaps instead. These gaps are more clearly noticeable in CASTEP calculations because of the use of much coarser grid (0.005 Å-1) compared to that used in QE (0.0015 Å-1).
3.2. Electronic Band Structures and Fermi Surfaces with Pressure
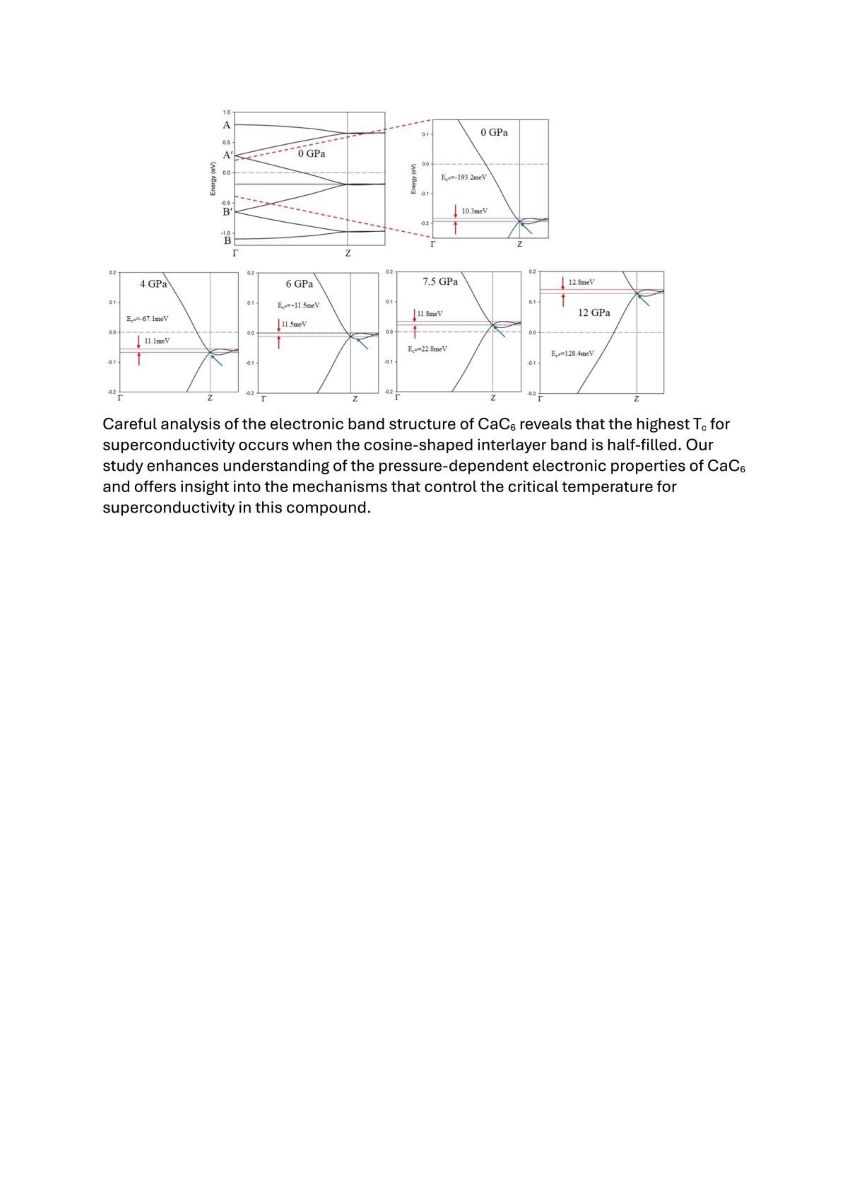
The folded nearly free interlayer band crossing the FL (predominantly with Ca 4s-orbital character) shifts in position towards higher energy values with increasing pressure, as shown in Figure 5. The equivalent calculation results for rhombohedral unit cells are displayed in supplemental Figure S8. Figures 5 and S8 demonstrate that the highest critical temperature (Tc) for CaC6 is achieved when the interlayer band is half-filled, after which there is a notable decline as the band increases in energy. Similarly, the charge transfer from calcium to carbon in CaC6 exhibits a comparable pattern, increasing with pressure, peaking around 7.5 GPa, and then decreasing thereafter (see Table S1).
Figure 6 shows volumetric representations and cross sections of the FS along the plane as a function of pressure for the rhombohedral primitive unit cell (see also Figures 4, S7 and S8). The colour bar represents the relative value of the Fermi velocity of the electrons. For the rhombohedral unit cell, the apex of the FS of predominant Ca 4s-orbital character (i.e., the top of the slightly distorted sphere) is clearly observed moving towards with increased pressure (see Figure 6e). The apex reaches at about 7.5 GPa and continues below at pressures equal to and above 8 GPa, which matches the evolution of the Fermi level (E = 0) relative to the midpoint energy of the cosine band in the EBS’s shown in Figures 5 and S8.
3.3. Bonding/Antibonding, Superlattice and Electronic Topological Transitions
Figure 7a–d show the FSs as a function of pressure for the double supercell, constructed by the folding procedure of the rhombohedral reciprocal unit cell as described in Figure 4c. Figure 7e,f (enlarged view of 7e) show results obtained from calculations at 4 GPa using the double hexagonal supercell (with CASTEP software). A stack of two adjacent reciprocal unit cells is shown in Figure 7e.
As shown earlier in Figure 4 for 0 GPa, gaps are also generated in the double hexagonal supercell calculation for 4 GPa, because of the requirement that bands must intersect BZ boundaries perpendicularly in order to guarantee continuity of the bands and their derivatives. These FS gap regions relate to the establishment of superconducting gaps, simultaneously with the establishment of key nesting relationships [28,29,57], which link the EBS, the FS and special phonon vectors from phonon dispersions (PDs). A detailed discussion of such nesting phenomena is provided in a separate, companion article [28].
In Figure S10 (Supplement), at approximately 7.5 GPa, there is a notable change in the experimentally determined superconducting transition temperature (Tc) for CaC6 (see also Figure 5 of reference [28]). This pressure coincides with a significant reduction in the diameter of the almost spherical Ca 4s-orbital FS to the point where the pockets (labelled 0 in Figure 7a,b) just disappear, and pockets (labelled 1 in Figure 7a–d) become disconnected at the BZ boundary. These alterations in the topology of the FS and the EBS are key to understanding the electronic transport properties of CaC6 as a function of pressure.
3.3.1. Open and Closed Fermi Surfaces—Topological Transition with Pressure
Open and closed are two types of topologically different FSs [25]. Only closed cross-sections can appear for closed FS, causing closed trajectories for the movement of electrons in the presence of a magnetic field. In contrast, open FSs can generate both open and closed cross sections. Figure 8 displays periodically repeated FSs for CaC6 calculated for the 2c double superlattice.
As demonstrated in Figure 7a–f, the FS, characterized by a nearly pure 4s orbital nature, extends to the adjacent BZ until pressure reaches 7.5 GPa, at which point a singularity is observed at the connection point. At 16 GPa, the FS with a pure 4s character is confined entirely within the BZ of the double hexagonal supercell. Below 7.5 GPa, the folded FS produces necking of spherical Fermi regions where continuous domains along the c*-direction can be identified (see Figure 7a–f).
As the pressure is increased, these spherical regions become disconnected, breaking up what was previously (at lower pressure) an open, interconnected FS path (Figure 7a,b) and transitioning into a closed FS loop (Figure 7c,d; see also Figure 8) [25,58]. We posit that at about 7.5 to 8 GPa, the coupled superlattice delineated nesting relationship that we have proposed [28] moves from the two internal open FSs to two open FSs, once the inner FS becomes disconnected and closed as shown in Figure 8.
3.3.2. Isoenergetic Fermi Surfaces—Electron Dynamics and Magnetic Fields
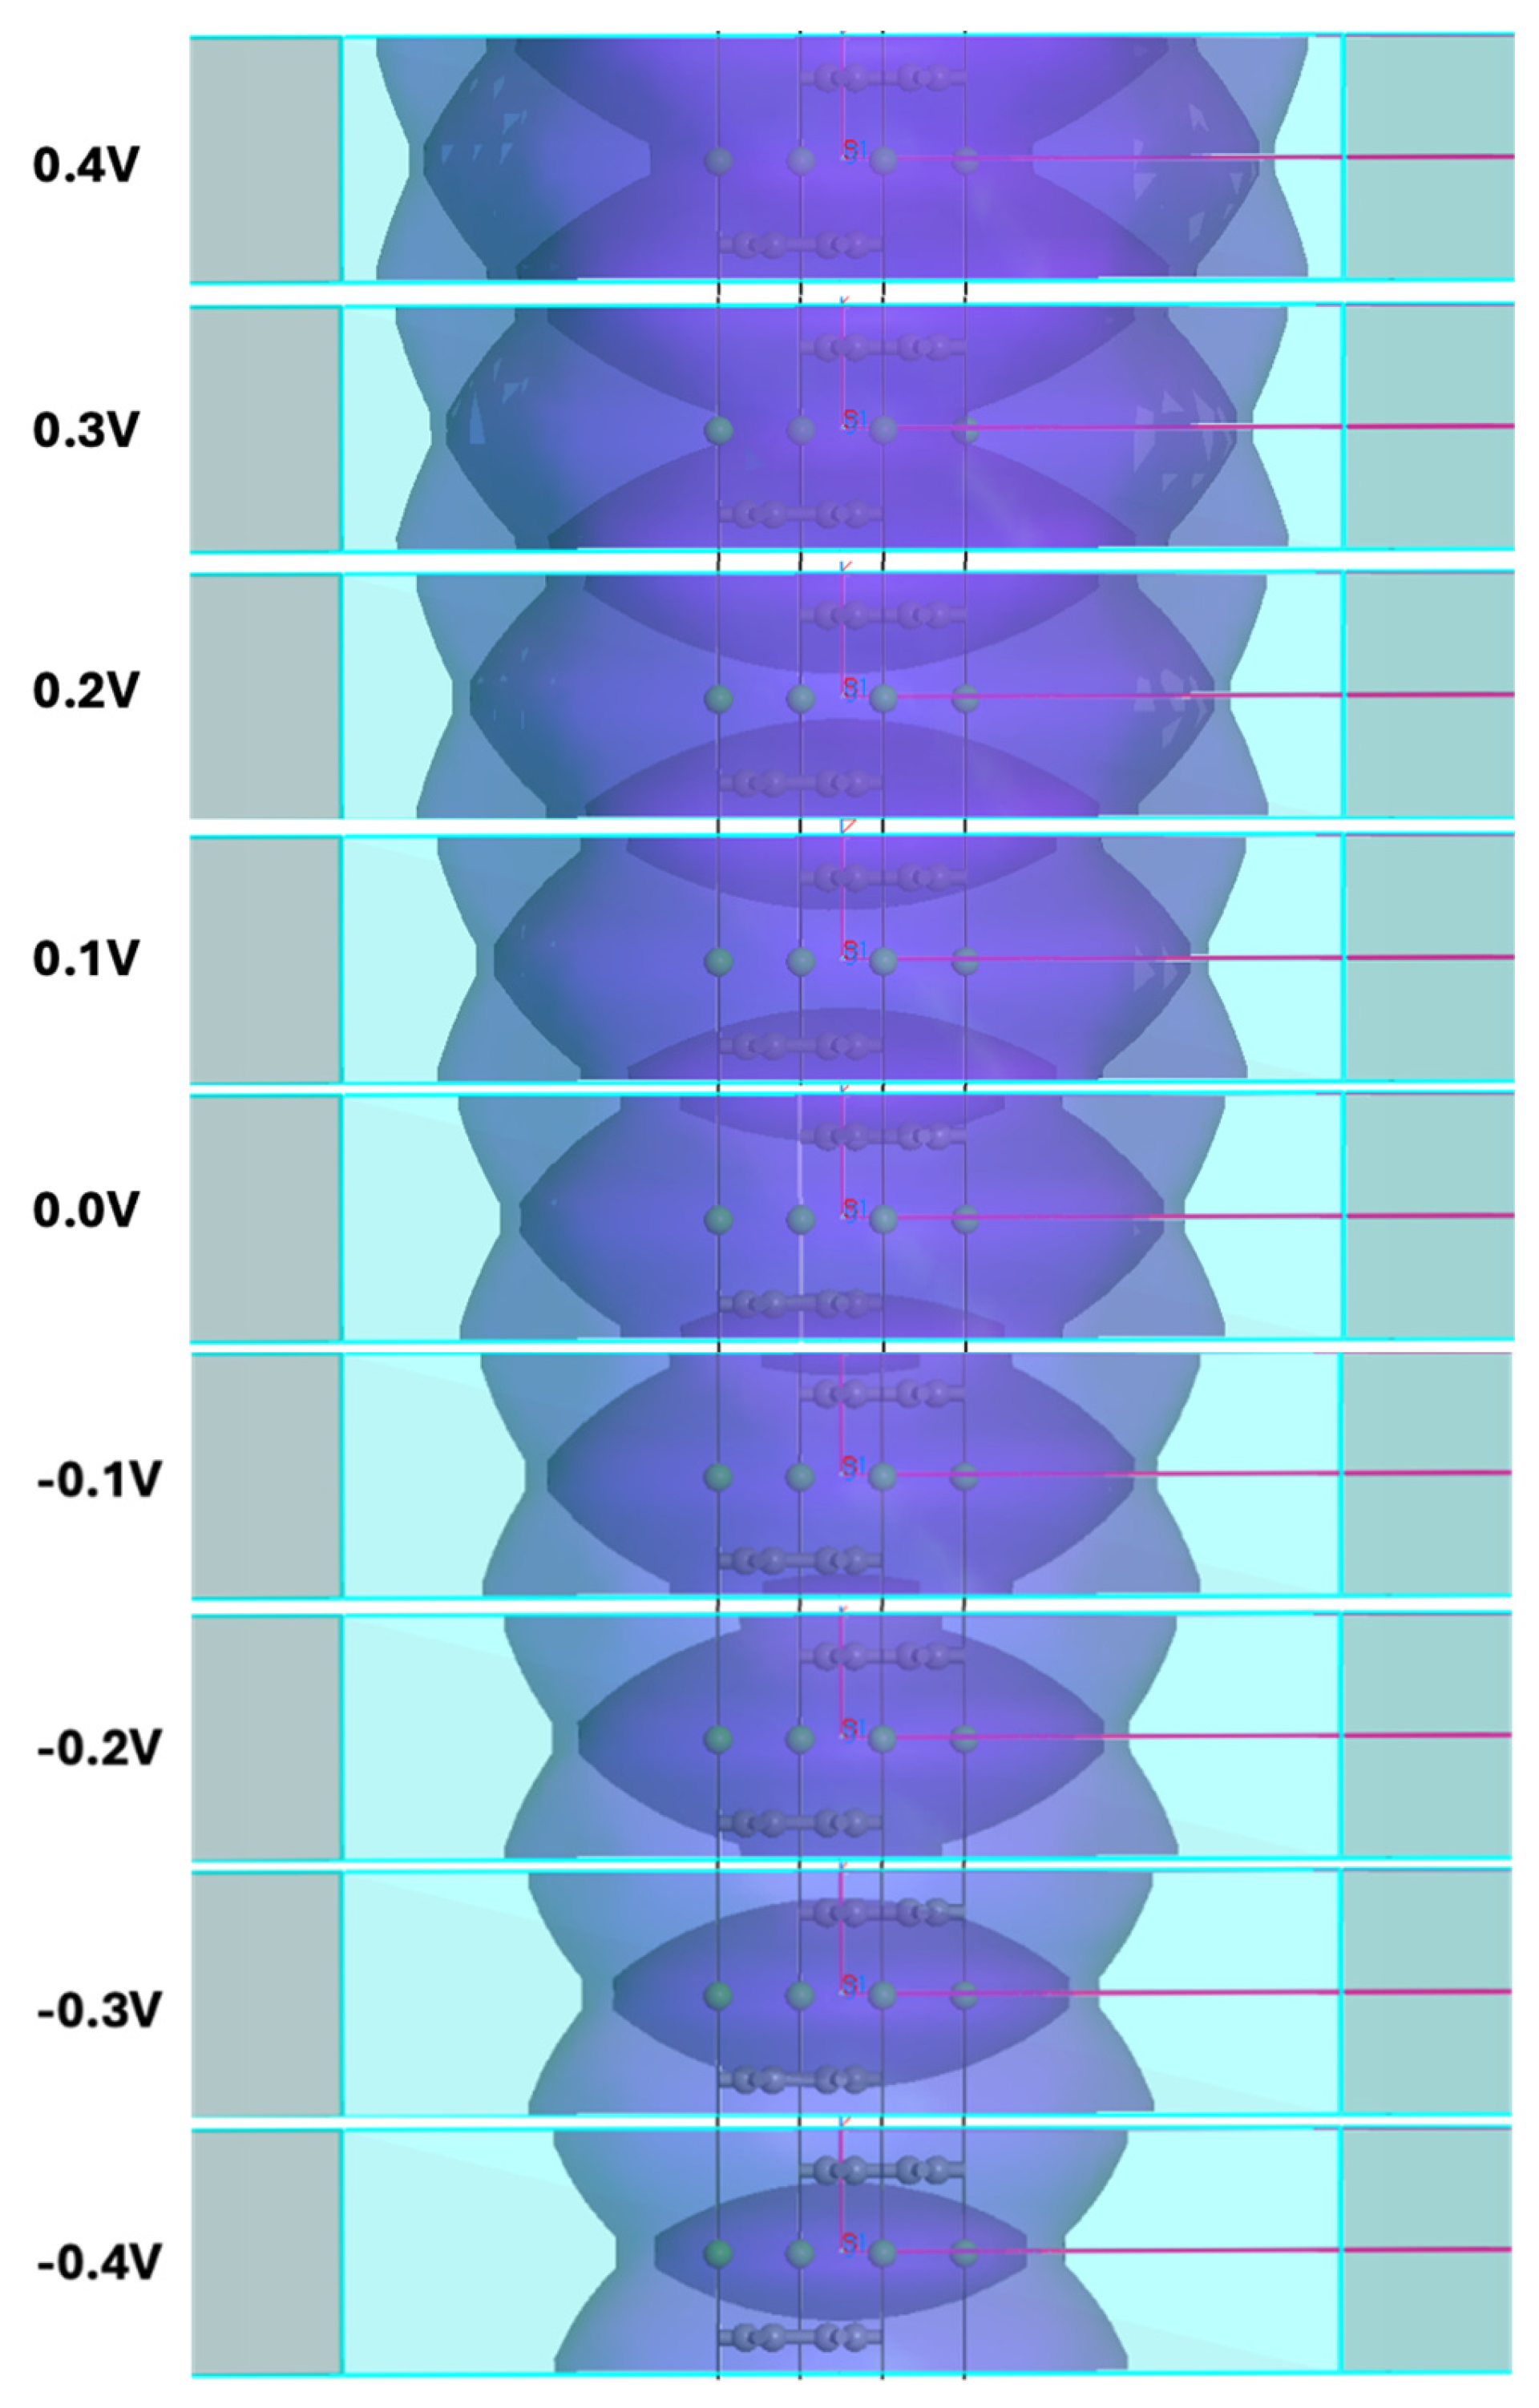
The isoenergetic FSs for the 2c double hexagonal supercell of CaC6 at 0 GPa is displayed in Figure 9. These isoenergetic surfaces are closely linked to the dispersion of the electronic bands [25] and play a significant role in understanding electron dynamics. They can be used to determine the effective mass under a magnetic field [25]. Since experimental determination of superconductivity always requires exposure of the sample to an external electromagnetic field, either electric for a resistive transition determination, or magnetic for a Meissner effect measurement, or electromagnetic via exposure to electromagnetic radiation, at the local level, a range of isoenergetic FSs are always involved.
The topological changes described above are often referred to as Electronic Topological Transitions (ETT) [25,59]. This is a concept which largely evolved from earlier ideas introduced by Lifshitz [25,60]. This concept is typically associated with superconductivity as a function of pressure, as emphasised by Bianconi and colleagues [61,62,63,64,65,66]. Thus, continuity inside and across BZ boundaries of interconnected open FS regions for free-electron-like coupled electron transport appears to be a requirement for superconductivity. When these FS regions are open [67], they appear to correlate with the presence of superconductivity. When they are closed there may be a connection to charge density waves [24].
3.4. Fermi Velocity and Connection to the Superconducting Gap
Such FS topological transitions described above, involving shifts from open to closed FSs, or vice versa, particularly under pressure, display strong resemblance to Lifshitz transitions [68]. These are often associated with changes of Tc and/or even the destruction of superconductivity [61,62,63,64,65,66]. Figure S10 (Supplemental) is a graph of the experimentally determined superconducting transition temperature (Tc) for CaC6, reproduced and adapted from reference [19]. A sharp drop in Tc takes place at about 8 GPa.
The following fundamental relationship is known from the BCS model for superconductivity, where the order parameter or gap energy is related to the Fermi velocity , the reduced Planck’s constant and the coherence length [69] as follows:
Different sections of the FSs display clear differences in Fermi velocities ; therefore, a k-dependent gap energy anisotropy is expected and the coherence lengths must be correspondingly different. From the colour scale of Figure 6, the Fermi velocity in red areas is about twice the Fermi velocity in green areas. Therefore, coherence length anisotropy is expected, and in agreement with experimental results for CaC6.
Emery et al. [6] have observed different coherence lengths in the ab and c directions, and , of 35 nm and 13 nm, respectively. Since the gradient of the FS determines the main direction of movement of the FS under an external field [25,70], we expect that for the Ca 4s dominated spherical FS, a shorter coherence length in the c-direction is accessible. For the predominantly C 2pz dominated FS, the determined coherence length is predominantly in the ab-direction. Therefore, the green and red FS regions (in terms of Fermi velocities) would have, on average, gaps with a ratio of:
Therefore, a change in Tc is expected related with the Fano-Feshbach resonance of the gap between different areas of the Fermi surface if, for different reasons, the anisotropy influences a specific measurement, or if the dominant FS that determines properties alternates between green and red Fermi velocity regions. Cross-sectional views of the plane as a function of pressure is displayed in Figure S11 (Supplemental). Figure S11 shows that the Fermi surface exhibits the most hybridised characteristics at a pressure of 7.5 GPa. This hybridization is likely crucial as it facilitates the intersection and convolution of the FSs for carbon and calcium, forming what is referred to as intercalant FSs [11,21]. According to Sugawara et al. [21], these intercalant FSs and resultant interlayer bands are essential for the stabilization of a superconducting state in CaC6.
Based on the discussion involving Fermi velocities and coherence lengths above and the discussion on ETT with open or closed FS pockets in section 3.4, the gap energies can be different in different regions of the FS; in particular, at the Lifshitz transion for “appearing” at a new Fermi surface area and at “opening a neck” topological transitions. The critical temperature show minima and maxima at the anti-resonance suppression and resonance amplification,respectively, for pair transfer between different Fermi surface areas [61,62,66,71,72]. Thus, explaining the transition temperature dependence with pressure for CaC6 near the ETT controlled by the superstructure.
4. Conclusions
A comprehensive analysis of the electronic properties for CaC6 under varying pressures has been presented. Using DFT calculations, we have investigated the evolution of topologies for the Fermi surface and electronic band structures of CaC6. The Fermi surface of CaC6 consists of three bands, with two of these bands intersecting and gradually decoupling with increasing pressure. This evolution of the FS is concurrent with a sharp drop in superconducting properties, indicating a strong correlation between FS and EBS topology and superconductivity in CaC6.
Our analysis reveals that the highest Tc for superconductivity in CaC6 occurs when the cosine-shaped interlayer band is half-filled. Folding the FS and EBS at the mid-point of this characteristic cosine-shaped band by introducing a 2c supercell (producing a halving of the rhombohedral c* direction), the FS of the double superlattice defines interconnected pockets, or open loops, which are favourable for nearly free electron coupled movement and superconductivity when the pressure is below 7.5 GPa. At pressures above 8 GPa, the original FS pockets become disconnected and transform into closed loops, manifesting substantial changes in superconducting properties.
By invoking a superlattice perspective of material properties, motivated by the bonding/antibonding character encapsulated in the cosine-modulated electronic band, we not only clarify the bonding/antibonding interaction, but also uncover a Lifshitz or electronic topological transition with significant implications for electronic properties with change in external conditions such as pressure. This analysis brings the pressure behaviour and characteristics of CaC6 in line with those of many other layered and non-layered superconductors, based on key fundamental principles and mechanisms that influence superconducting properties.
Our study enhances understanding of the pressure-dependent electronic properties of CaC6 and offers insight into the mechanisms that control the critical temperature for superconductivity in this compound. The findings not only advance our knowledge of superconductivity in graphite intercalation compounds by identifying important EBS and FS characteristics as requirements for superconductivity, but also opens potential new paths for optimising the anisotropic superconducting gap in graphite intercalated compounds and for exploring novel materials with improved superconducting properties under pressure.
Supplementary Materials
The following supporting information can be downloaded at the website of this paper posted on Preprints.org, Figure S1: structures of unit cells before and after relaxation; Figure S2: DFT parameters for CaC6; Figure S3: K-points mesh grid and Fermi energy; Figure S4: Pseudopotentials and change in lattice constants; Figure S5: High symmetry conventions; Figure S6: Projected energy bands and DOS for rhombohedral primitive cell; Figure S7: Schematic of FS directions at 2 GPa; Figure S8: EBS along ΓZ for primitive cell with pressure; Figure S9: Fermi surfaces for rhombohedral unit cell as a function of pressure; Figure S10: Experimental Tc with Pressure for CaC6; Figure S11: Orbital character of FS with Pressure; Table S1: Properties of CaC6 with Pressure.
Author Contributions
Conceptualization, J.A. and I.M.; methodology, B.W., A.B. and J.A.; software, W.B. and J.A.; validation, J.A., I.M. and A.B.; formal analysis, J.A., A.B. and I.M.; investigation, W.B.; resources, J.A.; writing—original draft preparation, W.B. and J.A.; writing—review and editing, J.A. and I.M.; visualization, I.M. and J.A.; supervision, J.A. All authors have read and agreed to the published version of the manuscript.
Funding
This research received no external funding.
Data Availability Statement
The raw data supporting the conclusions of this article will be made available by the authors on request.
Acknowledgments
We extend our gratitude for support from QUT and to Craig Windell, Jakub Szarlat, and Vicki Thomson and the eResearch team for their assistance with High-Performance Computing facilities. Our appreciation also goes to The University of Queensland’s Research Computing Centre (RCC) for its invaluable support in this research, with a special mention to Marlies Hankel for her persistence.
Conflicts of Interest
The authors declare no conflict of interest.
References
- Jishi, R.A.; Dresselhaus, M.S. Superconductivity in graphite intercalation compounds. Phys. Rev. B 1992, 45, 12465–12469. [Google Scholar] [CrossRef]
- Hannay, N.B.; Geballe, T.H.; Matthias, B.T.; Andres, K.; Schmidt, P.; MacNair, D. Superconductivity in Graphitic Compounds. Phys. Rev. Lett. 1965, 14, 225–226. [Google Scholar] [CrossRef]
- Smith, R.P., T. E. Weller, C.A. Howard, M.P.M. Dean, K.C. Rahnejat, S.S. Saxena, M. Ellerby, Superconductivity in graphite intercalation compounds, Physica C: Superconductivity and its Applications 514 2015 50-58.
- Weller, T.E.; Ellerby, M.; Saxena, S.S.; Smith, R.P.; Skipper, N.T. Superconductivity in the intercalated graphite compounds C6Yb and C6Ca. Nat. Phys. 2005, 1, 39–41. [Google Scholar] [CrossRef]
- Mazin, I.I. , Intercalant-Driven Superconductivity in YbC6 and CaC6, Physical Review Letters 95 2005 227001.
- Emery, N., C. Hérold, M. d’Astuto, V. Garcia, C. Bellin, J.F. Marêché, G. Loupias, Superconductivity of Bulk CaC6, Physical Review Letters 95 2005 087003.
- Kanetani, K., K. Sugawara, T. Sato, R. Shimizu, K. Iwaya, T. Hitosugi, T. Takahashi, Ca intercalated bilayer graphene as a thinnest limit of superconducting C₆Ca, Proceedings of the National Academy of Sciences - PNAS 109 2012 19610-19613.
- Ichinokura, S.; Sugawara, K.; Takayama, A.; Takahashi, T.; Hasegawa, S. Superconducting Calcium-Intercalated Bilayer Graphene. ACS Nano 2016, 10, 2761–2765. [Google Scholar] [CrossRef]
- Cao, Y.; Fatemi, V.; Fang, S.; Watanabe, K.; Taniguchi, T.; Kaxiras, E.; Jarillo-Herrero, P. Unconventional superconductivity in magic-angle graphene superlattices. Nature 2018, 556, 43–50. [Google Scholar] [CrossRef]
- Csányi, G.; Littlewood, P.B.; Nevidomskyy, A.H.; Pickard, C.J.; Simons, B.D. The role of the interlayer state in the electronic structure of superconducting graphite intercalated compounds. Nat. Phys. 2005, 1, 42–45. [Google Scholar] [CrossRef]
- Calandra, M., F. Mauri, Theoretical Explanation of Superconductivity in CaC6, Physical Review Letters 95 2005 237002.
- McMillan, W.L. Transition Temperature of Strong-Coupled Superconductors. Phys. Rev. B 1968, 167, 331–344. [Google Scholar] [CrossRef]
- Hinks, D.G., D. Rosenmann, H. Claus, M.S. Bailey, J.D. Jorgensen, Large Ca isotope effect in the CaC6 superconductor, Physical Review B 75 2007 014509.
- Lamura, G., M. Aurino, G. Cifariello, E. Di Gennaro, A. Andreone, N. Emery, P. Lagrange, Experimental Evidence of s-Wave Superconductivity in Bulk CaC6, Physical Review Letters 96 2006 107008.
- Bergeal, N., V. Dubost, Y. Noat, W. Sacks, D. Roditchev, N. Emery, G. Loupias, Scanning Tunneling Spectroscopy on the Novel Superconductor CaC6, Physical Review Letters 97 2006 077003.
- Sanna, A., G. Profeta, A. Floris, A. Marini, E.K.U. Gross, S. Massidda, Anisotropic gap of superconducting CaC6: A first-principles density functional calculation, Physical Review B 75 2007 020511.
- Gonnelli, R.S., D. Daghero, D. Delaude, M. Tortello, G.A. Ummarino, V.A. Stepanov, S. Massidda, Evidence for Gap Anisotropy in CaC6 from Directional Point-Contact Spectroscopy, Physical Review Letters 100 2008 207004.
- Smith, R.P., A. Kusmartseva, Y.T.C. Ko, S.S. Saxena, A. Akrap, L. Forró, N.T. Skipper, Pressure dependence of the superconducting transition temperature in C6Yb and C6Ca, Physical Review B 74 2006 024505.
- Gauzzi, A., S. Takashima, N. Takeshita, C. Terakura, H. Takagi, N. Emery, G. Loupias, Enhancement of Superconductivity and Evidence of Structural Instability in Intercalated Graphite CaC6 under High Pressure, Physical Review Letters 98 2007 067002.
- Gauzzi, A., N. Bendiab, M. d’Astuto, B. Canny, M. Calandra, F. Mauri, M. Mezouar, Maximum Tc at the verge of a simultaneous order-disorder and lattice-softening transition in superconducting CaC6, Physical Review B 78 2008 064506.
- Sugawara, K.; Sato, T.; Takahashi, T. Fermi-surface-dependent superconducting gap in C6Ca. Nat. Phys. 2008, 5, 40–43. [Google Scholar] [CrossRef]
- Valla, T., Z. Pan, Superconductivity and Electron-Phonon Coupling in Graphite Intercalation Compunds, Physics and Applications of Graphene-Experiments, IntechOpen London UK 2011.
- Yang, S.-L.; Sobota, J.A.; Howard, C.A.; Pickard, C.J.; Hashimoto, M.; Lu, D.H.; Mo, S.-K.; Kirchmann, P.S.; Shen, Z.-X. Superconducting graphene sheets in CaC6 enabled by phonon-mediated interband interactions. Nat. Commun. 2014, 5, 3493. [Google Scholar] [CrossRef] [PubMed]
- Rahnejat, K.; Howard, C.; Shuttleworth, N.; Schofield, S.; Iwaya, K.; Hirjibehedin, C.; Renner, C.; Aeppli, G.; Ellerby, M. Charge density waves in the graphene sheets of the superconductor CaC6. Nat. Commun. 2011, 2, 1–6. [Google Scholar] [CrossRef] [PubMed]
- Kosevich, Topology in the Theory of Metals, in: M.I. Monastyrsky (Ed.), Topology in condensed matter, Springer Science & Business Media2006.
- Rezende, S.M. Introduction to Electronic Materials and Devices; Springer Science and Business Media LLC: Dordrecht, GX, Netherlands, 2022. [Google Scholar]
- Moessner, R., J. E. Moore, Topological phases of matter, Cambridge University Press2021.
- Wang, B.; Bianconi, A.; Mackinnon, I.D.R.; Alarco, J.A. Superlattice Delineated Fermi Surface Nesting and Electron-Phonon Coupling in CaC6. Crystals 2024, 14, 499. [Google Scholar] [CrossRef]
- Alarco, J.A., I. D.R. Mackinnon, Superlattices, Bonding-Antibonding, Fermi Surface Nesting, and Superconductivity, Condensed Matter, 2023, pp. 1-13.
- Giannozzi, P.; Baroni, S.; Bonini, N.; Calandra, M.; Car, R.; Cavazzoni, C.; Ceresoli, D.; Chiarotti, G.L.; Cococcioni, M.; Dabo, I.; et al. QUANTUM ESPRESSO: A modular and open-source software project for quantum simulations of materials. J. Phys. Condens. Matter 2009, 21, 395502. [Google Scholar] [CrossRef] [PubMed]
- Clark, S.J.; Segall, M.D.; Pickard, C.J.; Hasnip, P.J.; Probert, M.I.J.; Refson, K.; Payne, M.C. First Principles Methods Using CASTEP. Z. Kristallogr./Cryst. Mater. 2005, 220, 567–570. [Google Scholar] [CrossRef]
- Mackinnon, I.D.R., A. Almutairi, J.A. Alarco, Insights from Systematic DFT Calculations on Superconductors, in: J.M.V. Arcos (Ed.), Real Perspective of Fourier Transforms and Current Developments in Superconductivity, IntechOpen, London UK, 2021, pp. 1-29.
- Alarco, J.A.; Almutairi, A.; Mackinnon, I.D.R. Progress Towards a Universal Approach for Prediction of the Superconducting Transition Temperature. J. Supercond. Nov. Magn. 2019, 33, 2287–2292. [Google Scholar] [CrossRef]
- A Alarco, J.; Talbot, P.C.; Mackinnon, I.D.R. Identification of superconductivity mechanisms and prediction of new materials using Density Functional Theory (DFT) calculations. J. Physics: Conf. Ser. 2018, 1143, 012028. [Google Scholar] [CrossRef]
- Sabatini, R.; Küçükbenli, E.; Pham, C.H.; de Gironcoli, S. Phonons in nonlocal van der Waals density functional theory. Phys. Rev. B 2016, 93, 235120. [Google Scholar] [CrossRef]
- Berland, K.; Londero, E.; Schröder, E.; Hyldgaard, P. Harris-type van der Waals density functional scheme. Phys. Rev. B 2013, 88. [Google Scholar] [CrossRef]
- Hyldgaard, P.; Jiao, Y.; Shukla, V. Screening nature of the van der Waals density functional method: a review and analysis of the many-body physics foundation. J. Physics: Condens. Matter 2020, 32, 393001. [Google Scholar] [CrossRef] [PubMed]
- Lee, K.; Murray, É.D.; Kong, L.; Lundqvist, B.I.; Langreth, D.C. Higher-accuracy van der Waals density functional. Phys. Rev. B 2010, 82, 081101. [Google Scholar] [CrossRef]
- Chakraborty, D., K. Berland, T. Thonhauser, Next-Generation Nonlocal van der Waals Density Functional, Journal of Chemical Theory and Computation 16 2020 5893-5911.
- Berland, K., D. Chakraborty, T. Thonhauser, van der Waals density functional with corrected C6 coefficients, Physical Review B 99 2019 195418.
- Kawaguchi, N.; Shibata, K.; Mizoguchi, T. Possible New Graphite Intercalation Compounds for Superconductors and Charge Density Wave Materials: Systematic Simulations with Various Intercalants Using a van der Waals Density Functional Method. J. Phys. Chem. C 2023, 127, 9833–9843. [Google Scholar] [CrossRef]
- Alarco, J.A.; Talbot, P.C.; Mackinnon, I.D.R. Comparison of Functionals for Metal Hexaboride Band Structure Calculations. Model. Numer. Simul. Mater. Sci. 2014, 04, 53–69. [Google Scholar] [CrossRef]
- Alarco, J.A.; Chou, A.; Talbot, P.C.; Mackinnon, I.D.R. Phonon modes of MgB2: super-lattice structures and spectral response. Phys. Chem. Chem. Phys. 2014, 16, 24443–24456. [Google Scholar] [CrossRef] [PubMed]
- Alarco, J.A.; Talbot, P.C.; Mackinnon, I.D.R. Coherent phonon decay and the boron isotope effect for MgB2. Phys. Chem. Chem. Phys. 2014, 16, 25386–25392. [Google Scholar] [CrossRef] [PubMed]
- Bartók, A.P.; Yates, J.R. Ultrasoft pseudopotentials with kinetic energy density support: Implementing the Tran-Blaha potential. Phys. Rev. B 2019, 99, 235103. [Google Scholar] [CrossRef]
- Perdew, J.P.; Burke, K.; Ernzerhof, M. Generalized gradient approximation made simple. Phys. Rev. Lett. 1996, 77, 3865–3868. [Google Scholar] [CrossRef] [PubMed]
- Perdew, J.P.; Chevary, J.A.; Vosko, S.H.; Jackson, K.A.; Pederson, M.R.; Singh, D.J.; Fiolhais, C. Atoms, molecules, solids, and surfaces: Applications of the generalized gradient approximation for exchange and correlation. Phys. Rev. B 1993, 46, 6671–6687. [Google Scholar] [CrossRef] [PubMed]
- Monkhorst, H.J.; Pack, J.D. Special points for Brillouin-zone integrations. Phys. Rev. B 1976, 13, 5188–5192. [Google Scholar] [CrossRef]
- Marzari, N.; Vanderbilt, D.; De Vita, A.; Payne, M.C. Thermal Contraction and Disordering of the Al(110) Surface. Phys. Rev. Lett. 1999, 82, 3296–3299. [Google Scholar] [CrossRef]
- Setyawan, W.; Curtarolo, S. High-throughput electronic band structure calculations: Challenges and tools. Comput. Mater. Sci. 2010, 49, 299–312. [Google Scholar] [CrossRef]
- A Harrison, W. Applied Quantum Mechanics; World Scientific Pub Co Pte Ltd: Singapore, Singapore, 2000. [Google Scholar]
- Kawamura, M. FermiSurfer: Fermi-surface viewer providing multiple representation schemes. Comput. Phys. Commun. 2019, 239, 197–203. [Google Scholar] [CrossRef]
- Sanville, E.; Kenny, S.D.; Smith, R.; Henkelman, G. Improved grid-based algorithm for Bader charge allocation. J. Comput. Chem. 2007, 28, 899–908. [Google Scholar] [CrossRef] [PubMed]
- Tang, W.; Sanville, E.; Henkelman, G. A grid-based Bader analysis algorithm without lattice bias. J. Phys. Condens. Matter 2009, 21, 084204. [Google Scholar] [CrossRef] [PubMed]
- Yu, M.; Trinkle, D.R. Accurate and efficient algorithm for Bader charge integration. J. Chem. Phys. 2011, 134, 064111. [Google Scholar] [CrossRef] [PubMed]
- Henkelman, G.; Arnaldsson, A.; Jónsson, H. A fast and robust algorithm for Bader decomposition of charge density. Comput. Mater. Sci. 2005, 36, 354–360. [Google Scholar] [CrossRef]
- Alarco, J.A., B. Gupta, M. Shahbazi, D. Appadoo, I.D.R. Mackinnon, THz/Far infrared synchrotron observations of superlattice frequencies in MgB2, Physical Chemistry Chemical Physics 23 2021 23922-23932.
- Mazziotti, M.V.; Raimondi, R.; Valletta, A.; Campi, G.; Bianconi, A. Resonant multi-gap superconductivity at room temperature near a Lifshitz topological transition in sulfur hydrides. arXiv, 2106. [Google Scholar]
- Blanter, Y.; Kaganov, M.; Pantsulaya, A.; Varlamov, A. The theory of electronic topological transitions. Phys. Rep. 1994, 245, 159–257. [Google Scholar] [CrossRef]
- Lifshitz, I.M., M. I. Kaganov, Geometrical concepts in the Electron Theory of Metals, in: M. Springford (Ed.), Electrons at the Fermi Surface, Cambridge University Press Cambridge UK, 2011.
- Bianconi, A. Lifshitz Transitions In Multi-band Hubbard Models for Topological Superconductivity in Complex Quantum Matter. J. Supercond. Nov. Magn. 2018, 31, 603–610. [Google Scholar] [CrossRef]
- Mazziotti, M.V.; Bianconi, A.; Raimondi, R.; Campi, G.; Valletta, A. Spin–orbit coupling controlling the superconducting dome of artificial superlattices of quantum wells. J. Appl. Phys. 2022, 132, 193908. [Google Scholar] [CrossRef]
- Angilella, G.G.N.; Bianconi, A.; Pucci, R. Multiband Superconductors Close to a 3D–2D Electronic Topological Transition. J. Supercond. 2005, 18, 619–623. [Google Scholar] [CrossRef]
- Jarlborg, T.; Bianconi, A. Breakdown of the Migdal approximation at Lifshitz transitions with giant zero-point motion in the H3S superconductor. Sci. Rep. 2016, 6, 24816–24816. [Google Scholar] [CrossRef]
- Simonelli, L., V. Palmisano, M. Fratini, M. Filippi, P. Parisiades, D. Lampakis, A. Bianconi, Isotope effect on the E2g phonon and mesoscopic phase separation near the electronic topological transition in Mg1-xAlxB2, Physical Review B: Condensed Matter and Materials Physics 80 2009 14520.
- Agrestini, S., C. Metallo, M. Filippi, L. Simonelli, G. Campi, C. Sanipoli, A. Bianconi, Substitution of Sc for Mg in MgB2: Effects on transition temperature and Kohn anomaly, Phys. Rev. B 70 2004 134514.
- Brandt, N.B., S. M. Chudinov, Electronic Structure of Metals, Revised from the 1973 Russian ed., Mir, Moscow, 1975.
- Lifshitz, I.M. , Anomalies of Electron Characteristics in the High Pressure Region, 1960.
- Tinkham, M. , Introduction to superconductivity, 2nd ed., Dover Publications, Mineola, N.Y, 2004.
- Alarco, J.A., M. Shahbazi, I.D.R. Mackinnon, Experimental control of Tc in AlB2-type compounds using an applied voltage Cornell University Library / arXiv, 2022.
- Bianconi, A. Feshbach Shape Resonance in Multiband Superconductivity in Heterostructures. J. Supercond. 2005, 18, 625–636. [Google Scholar] [CrossRef]
- Tajima, H.; Aoki, H.; Perali, A.; Bianconi, A. Emergent Fano-Feshbach resonance in two-band superconductors with an incipient quasiflat band: Enhanced critical temperature evading particle-hole fluctuations. Phys. Rev. B 2024, 109, L140504. [Google Scholar] [CrossRef]
Figure 1.
Crystal structure of CaC6 using the 1c hexagonal cell representation for different pressures, 0 GPa, 7.5 GPa and 12.0 GPa. (a) top view along the c, c* or z-axis; (b) view along one side of the basal plane of the hexagonal cell.
Figure 1.
Crystal structure of CaC6 using the 1c hexagonal cell representation for different pressures, 0 GPa, 7.5 GPa and 12.0 GPa. (a) top view along the c, c* or z-axis; (b) view along one side of the basal plane of the hexagonal cell.
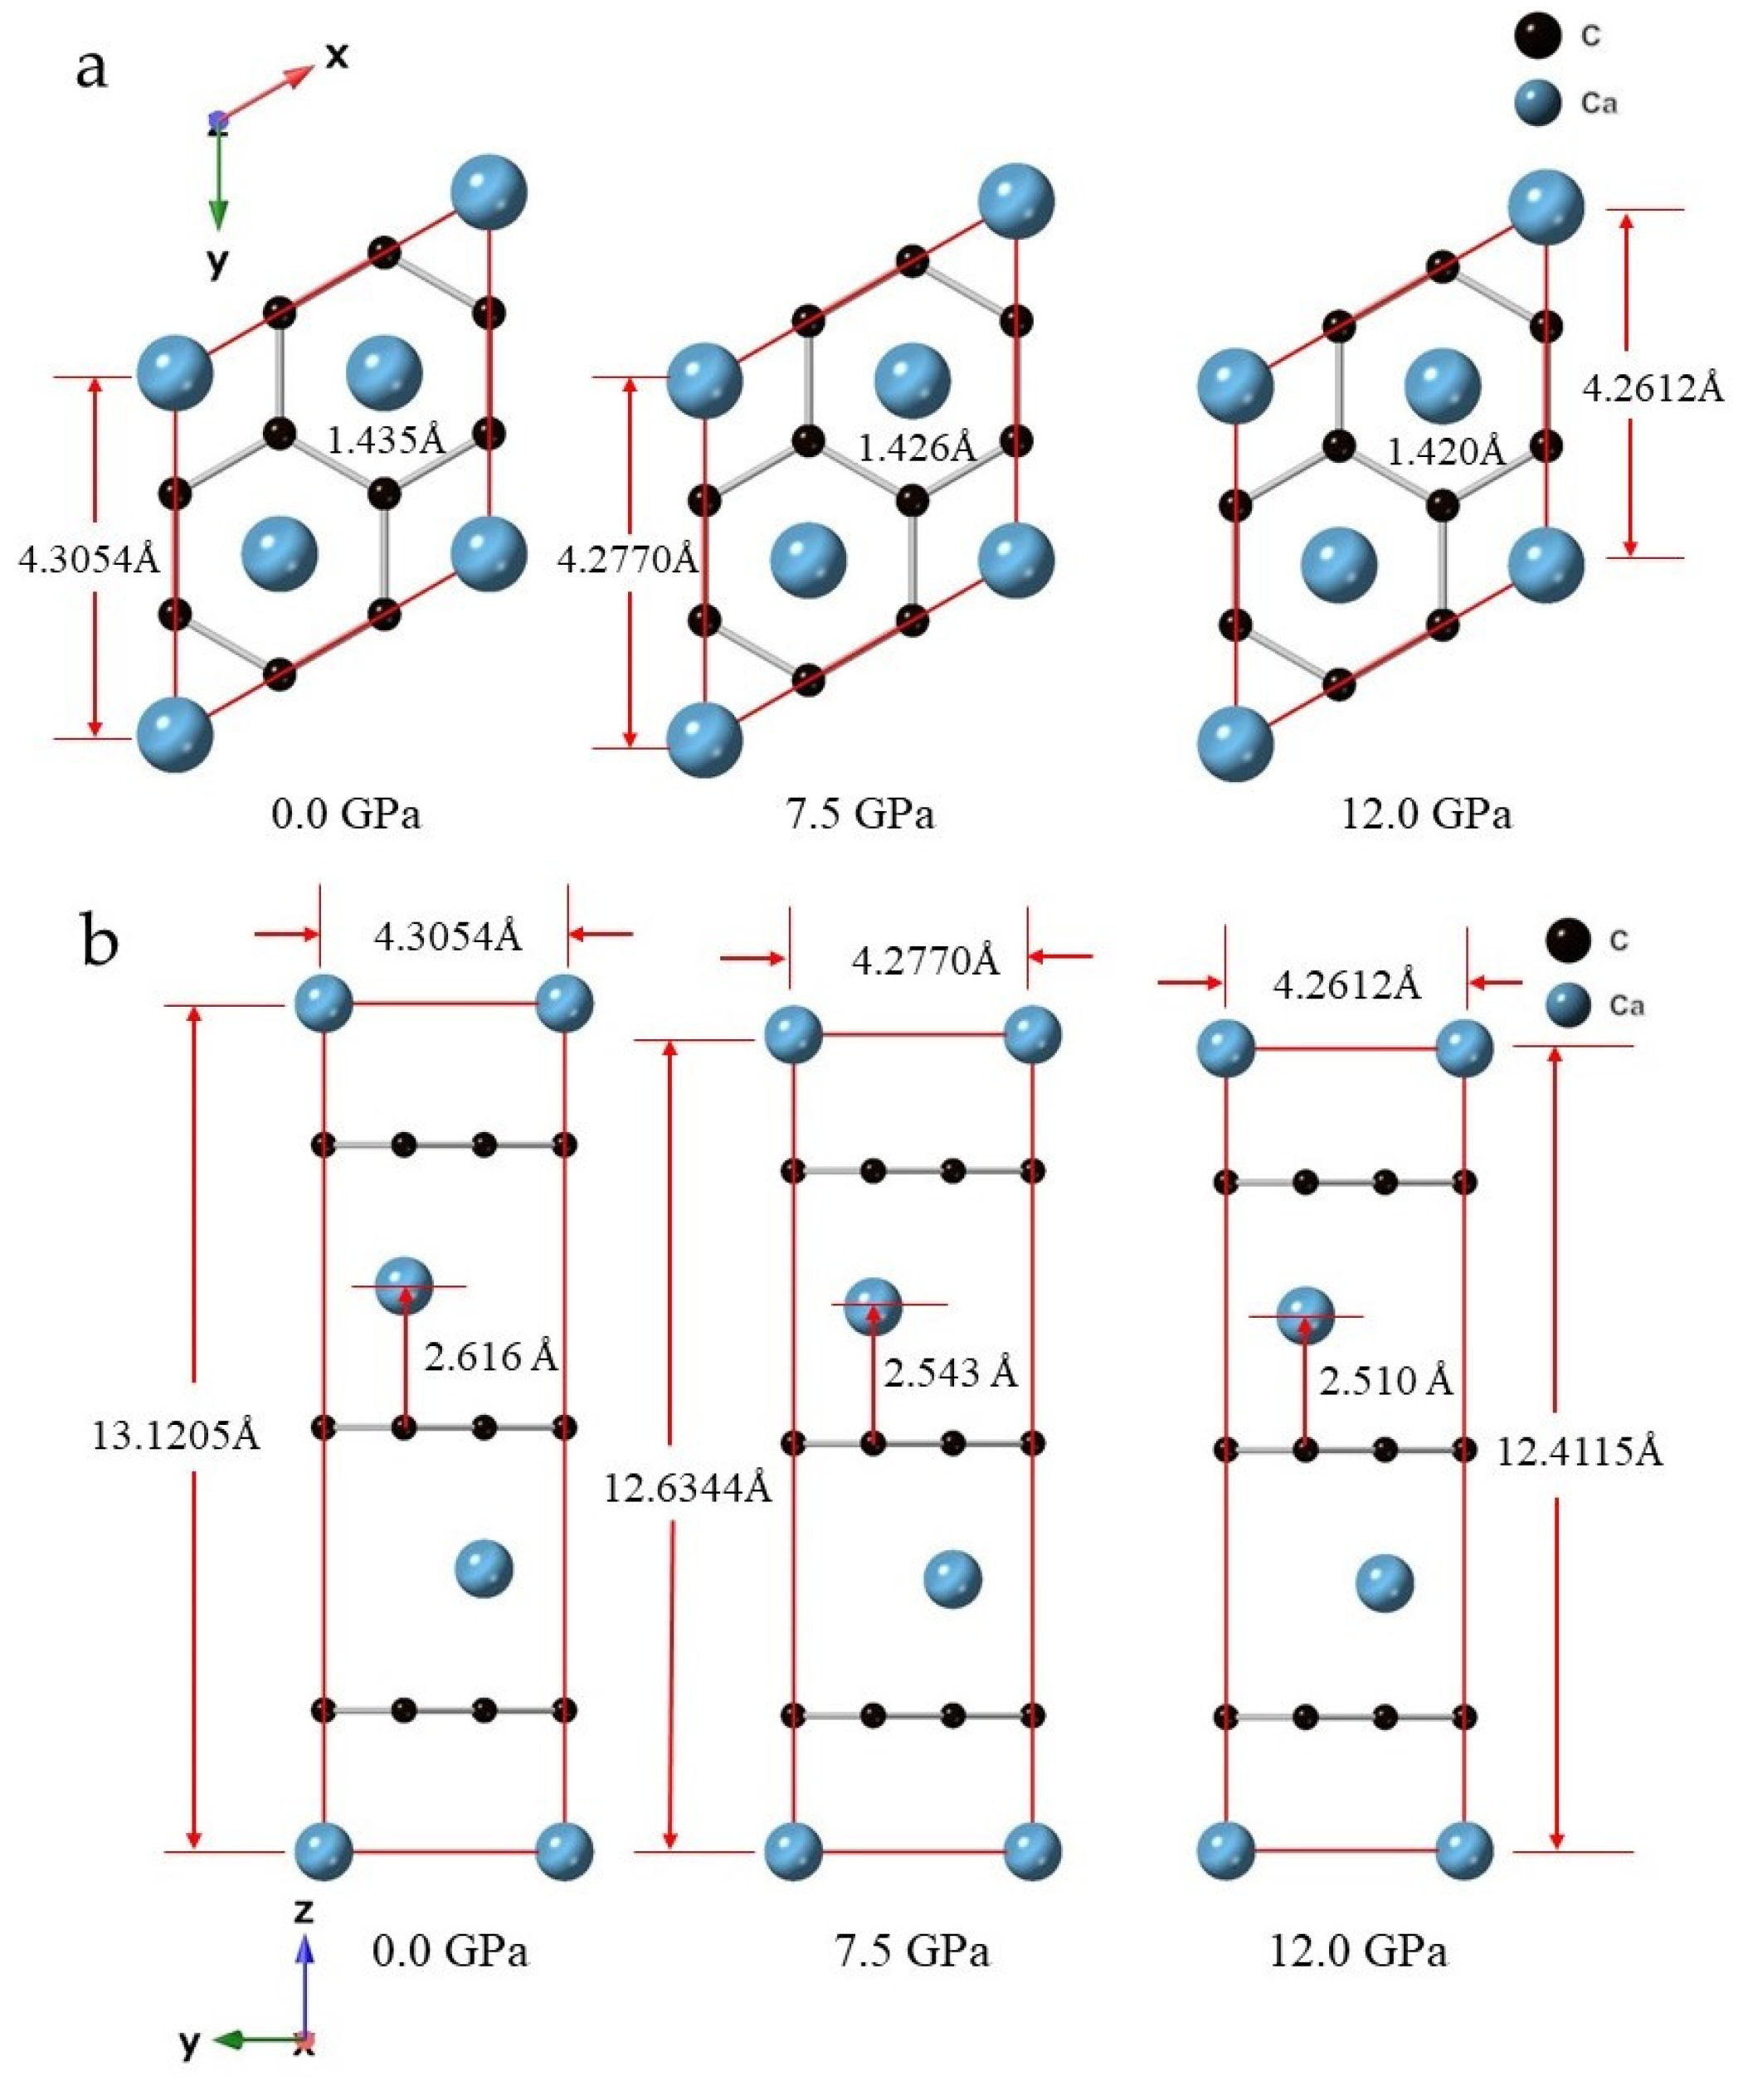
Figure 2.
Crystal structure of CaC6 using the 2c double hexagonal cell representation at 0 GPa pressure. Perspective views along directions ~[100], [001] and [111] are shown and labelled, respectively. Different colours for Ca and C are used to differentiate the layers at which the atoms reside within the 2c double supercell.
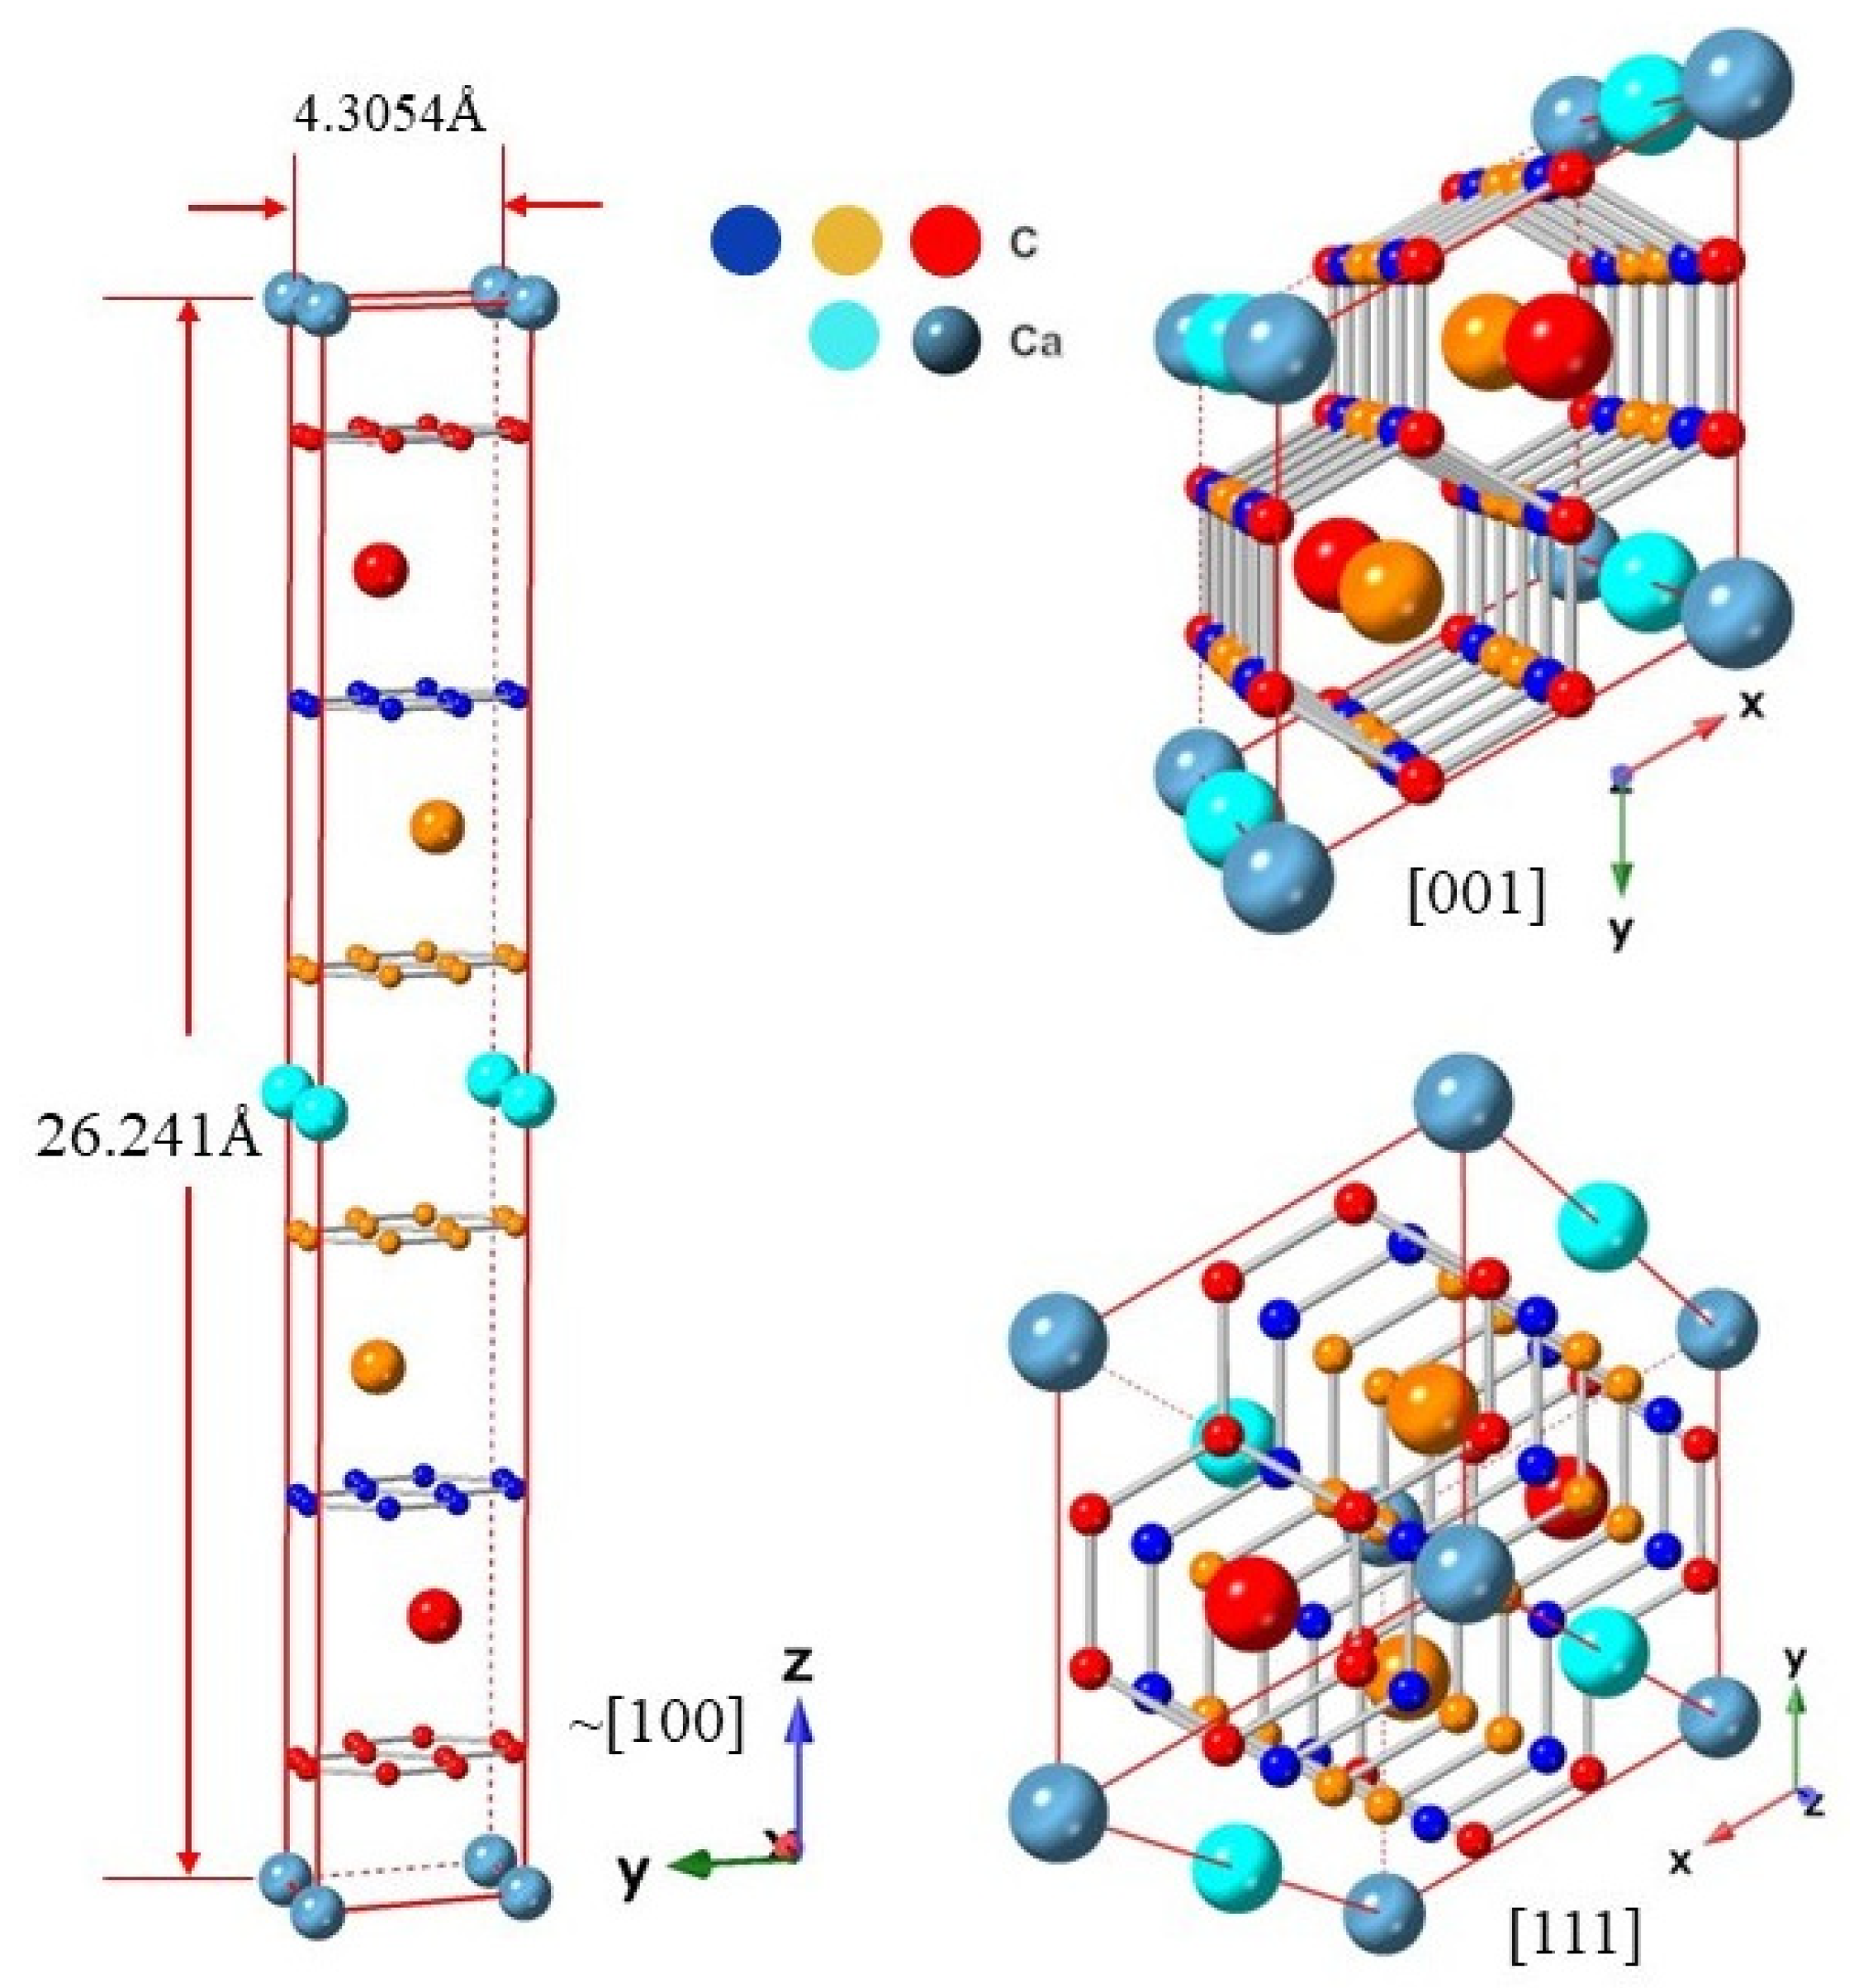
Figure 3.
(a) Band structure and (b) reciprocal path directions for CaC6 using 2c double supercell. The red box encloses a folded version of the cosine-shaped band. Bonding-antibonding character regions of the band are labelled. Intersections of the folded cosine-shaped bands with the Γ line correspond to the locally minimum bonding energy B or B’ and locally maximum antibonding energy A or A’. Note that the approximate (folded) cosine shape is retained as the band moves along the a2* reciprocal axis (labelled g2 in CASTEP) towards the zone boundary (as can be seen in the band along FQ enclosed in the orange box).
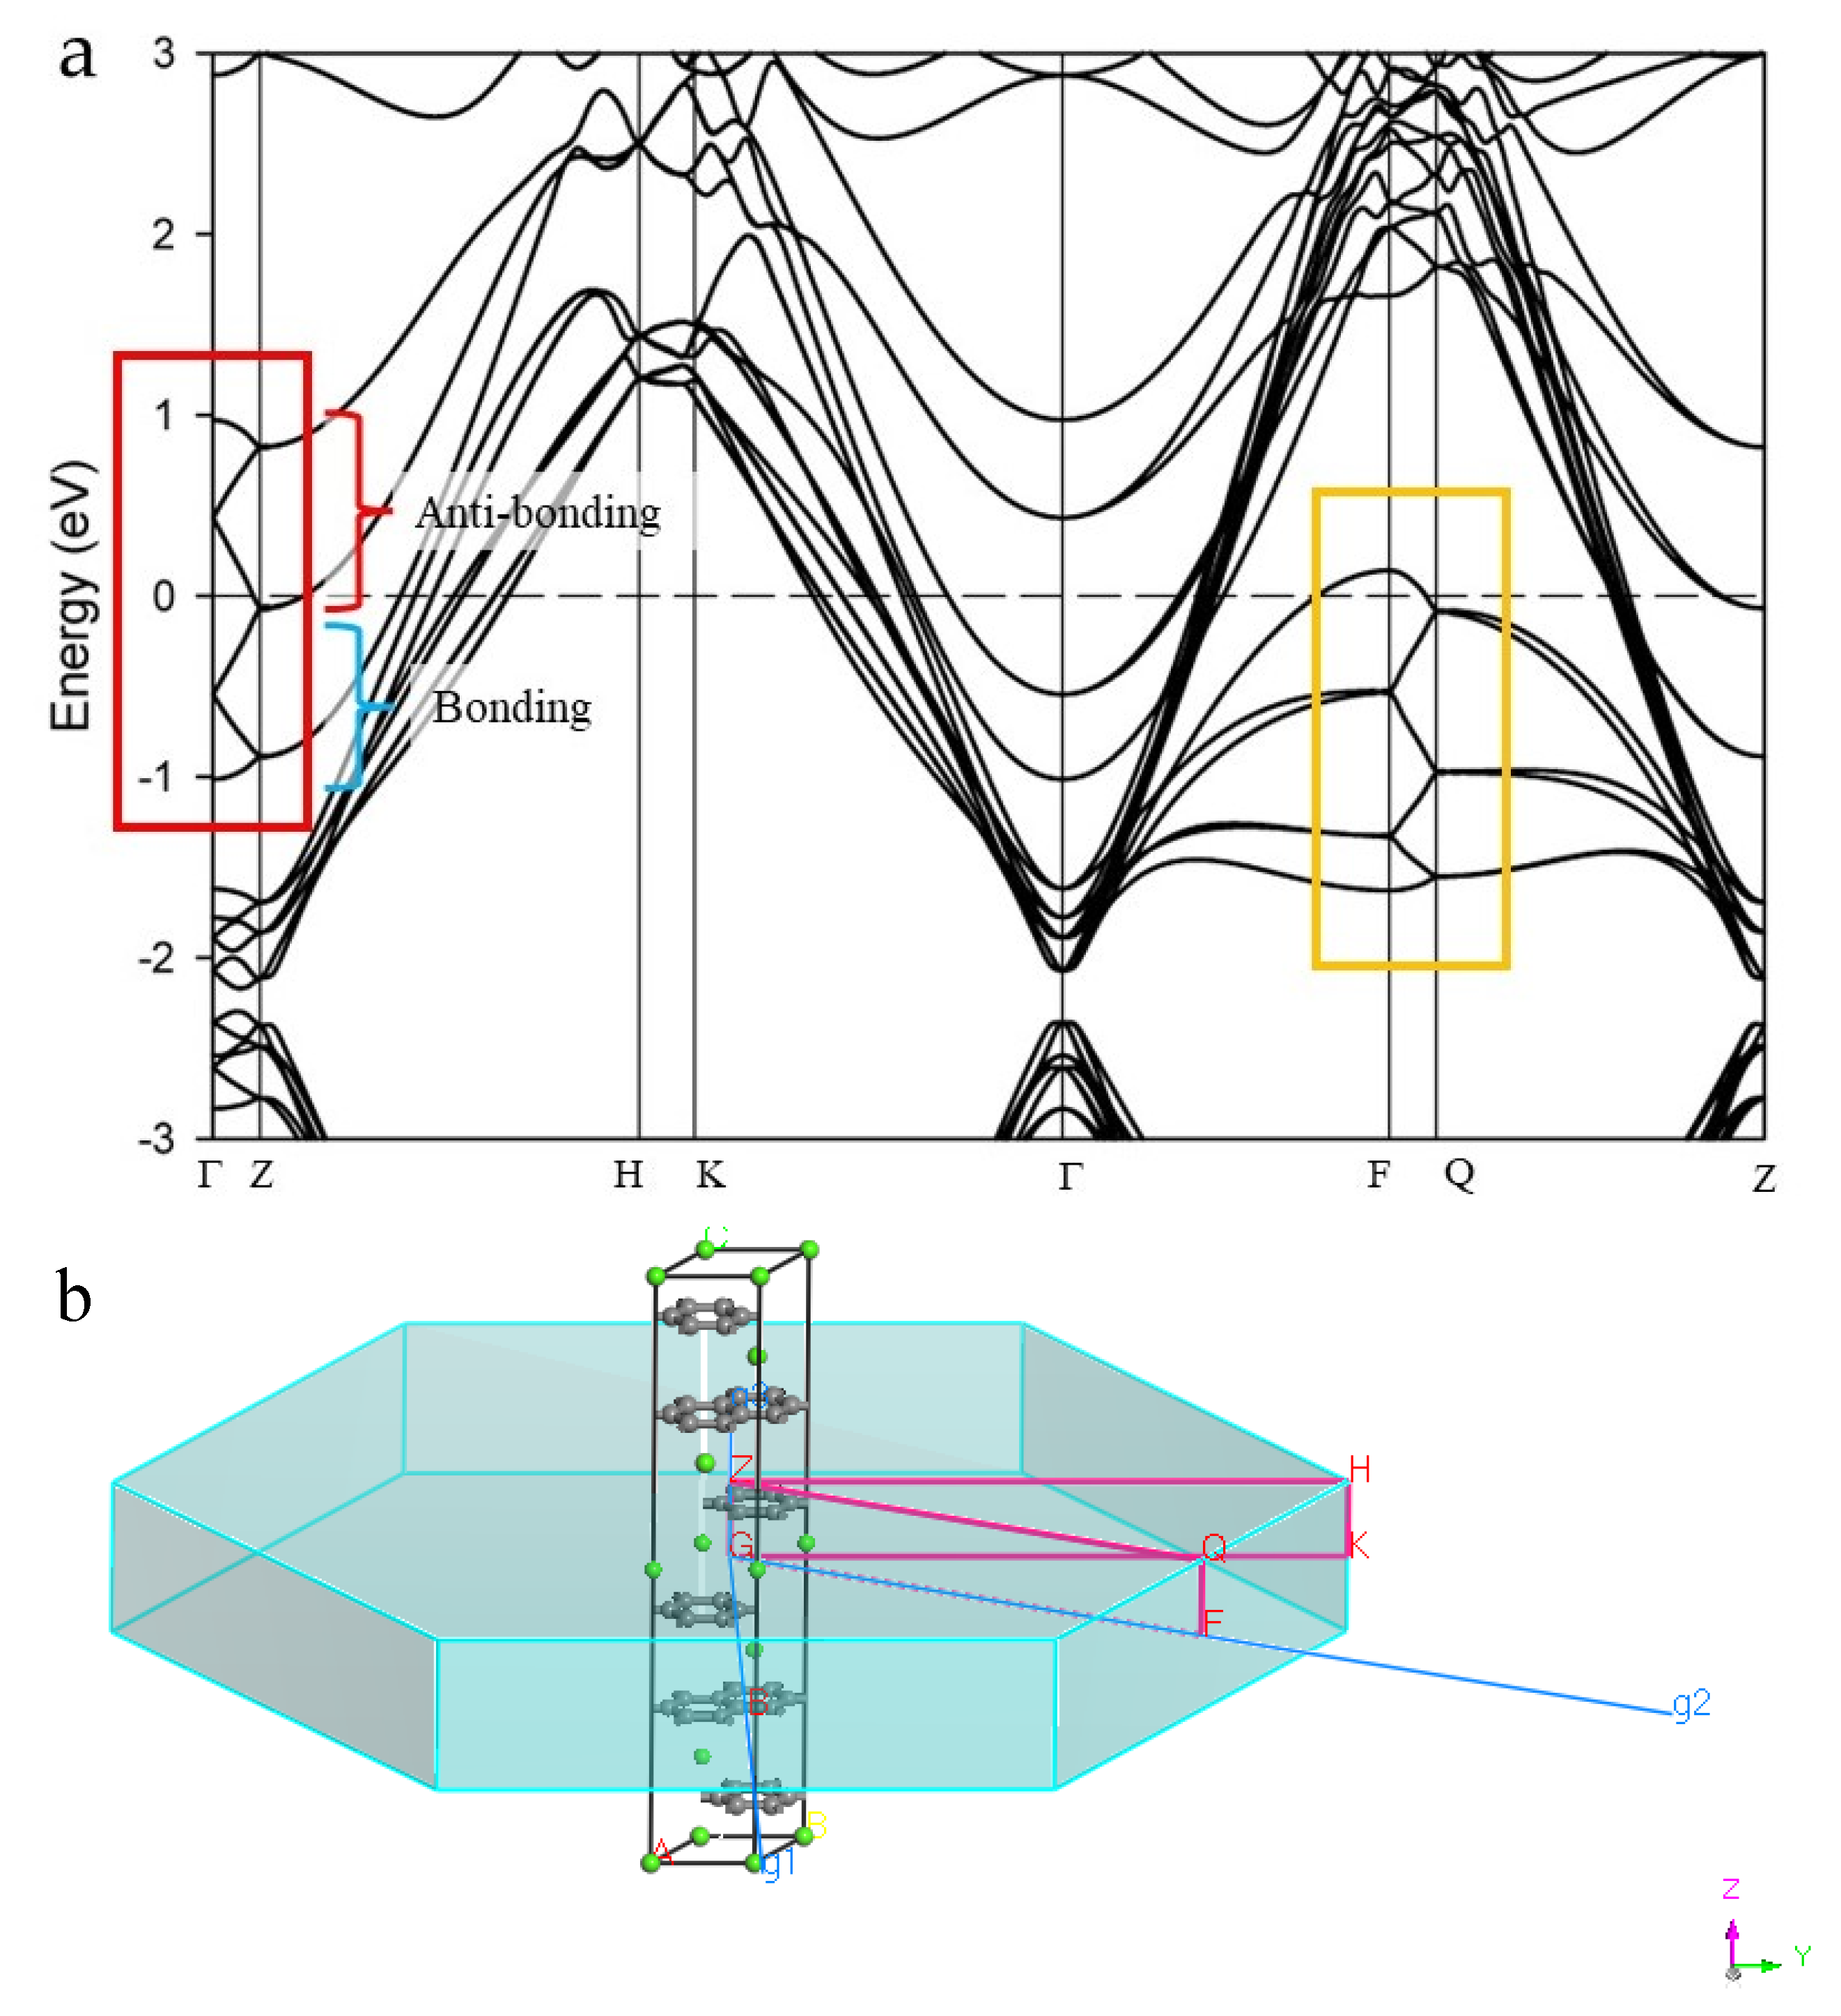
Figure 4.
(a) Side view of the Fermi surface for the 2c double hexagonal superlattice, displaying a few selected FS bands, directly calculated using CASTEP. (b) Enlarged view of the FS in Figure 4a displaying one less FS band, top and bottom FS spherical caps become more apparent. (c) Illustration of folding in the cross-section view of the rhombohedral FS in the upper half of its BZ into 1/6 of the BZ corresponding to the double hexagonal supercell (see text for details).
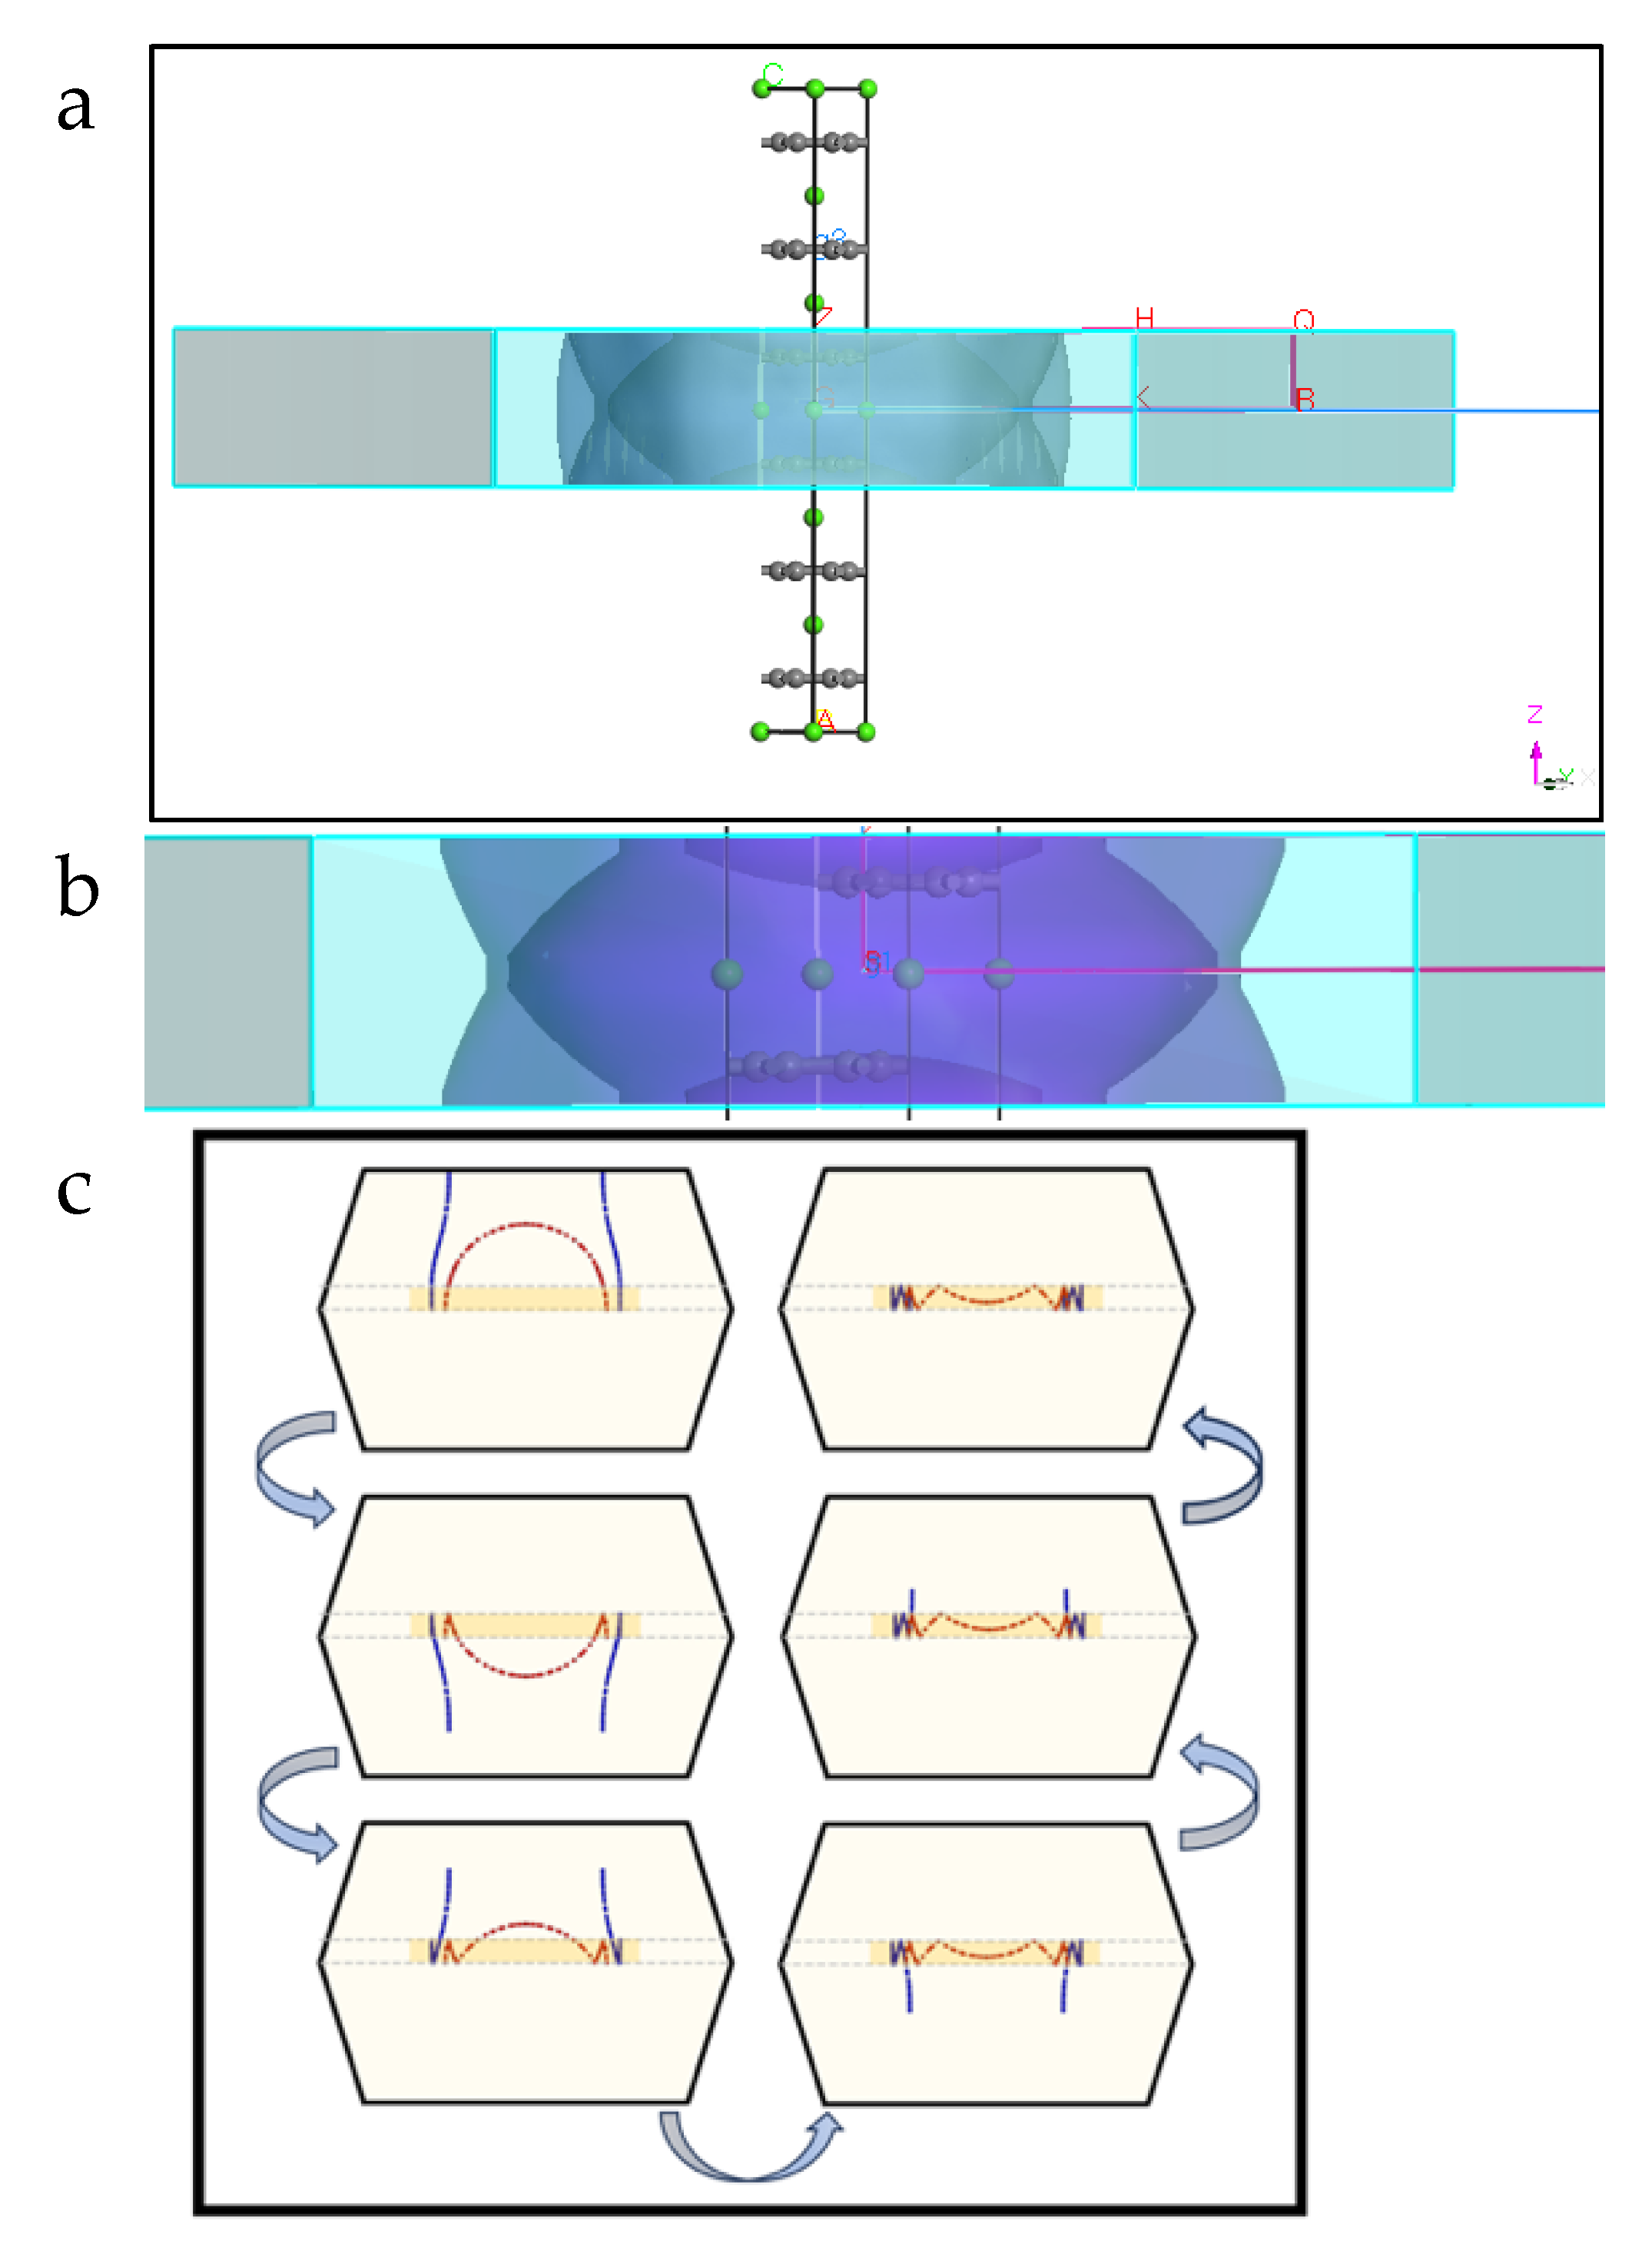
Figure 5.
Folded sections of the electronic band structures of CaC6 along the GZ direction for 2c double hexagonal supercells, presented as a function of pressure. The curve at 0 GPa is an enlarged view of Figure 3a. Comparison of EBSs with same energy and reciprocal direction scale(s) for 0, 4, 6 and 7.5 GPa. Note the shift to higher energy (Ec*) for the intersection of the anti-bonding and bonding bands (blue arrow) with increase in pressure. The corresponding calculations for the primitive rhombohedral unit cell are shown in supplementary Figure S8. The experimentally determined superconducting transition temperatures for the different pressures are given in green below the corresponding cosine-modulated bands in Figure S8.
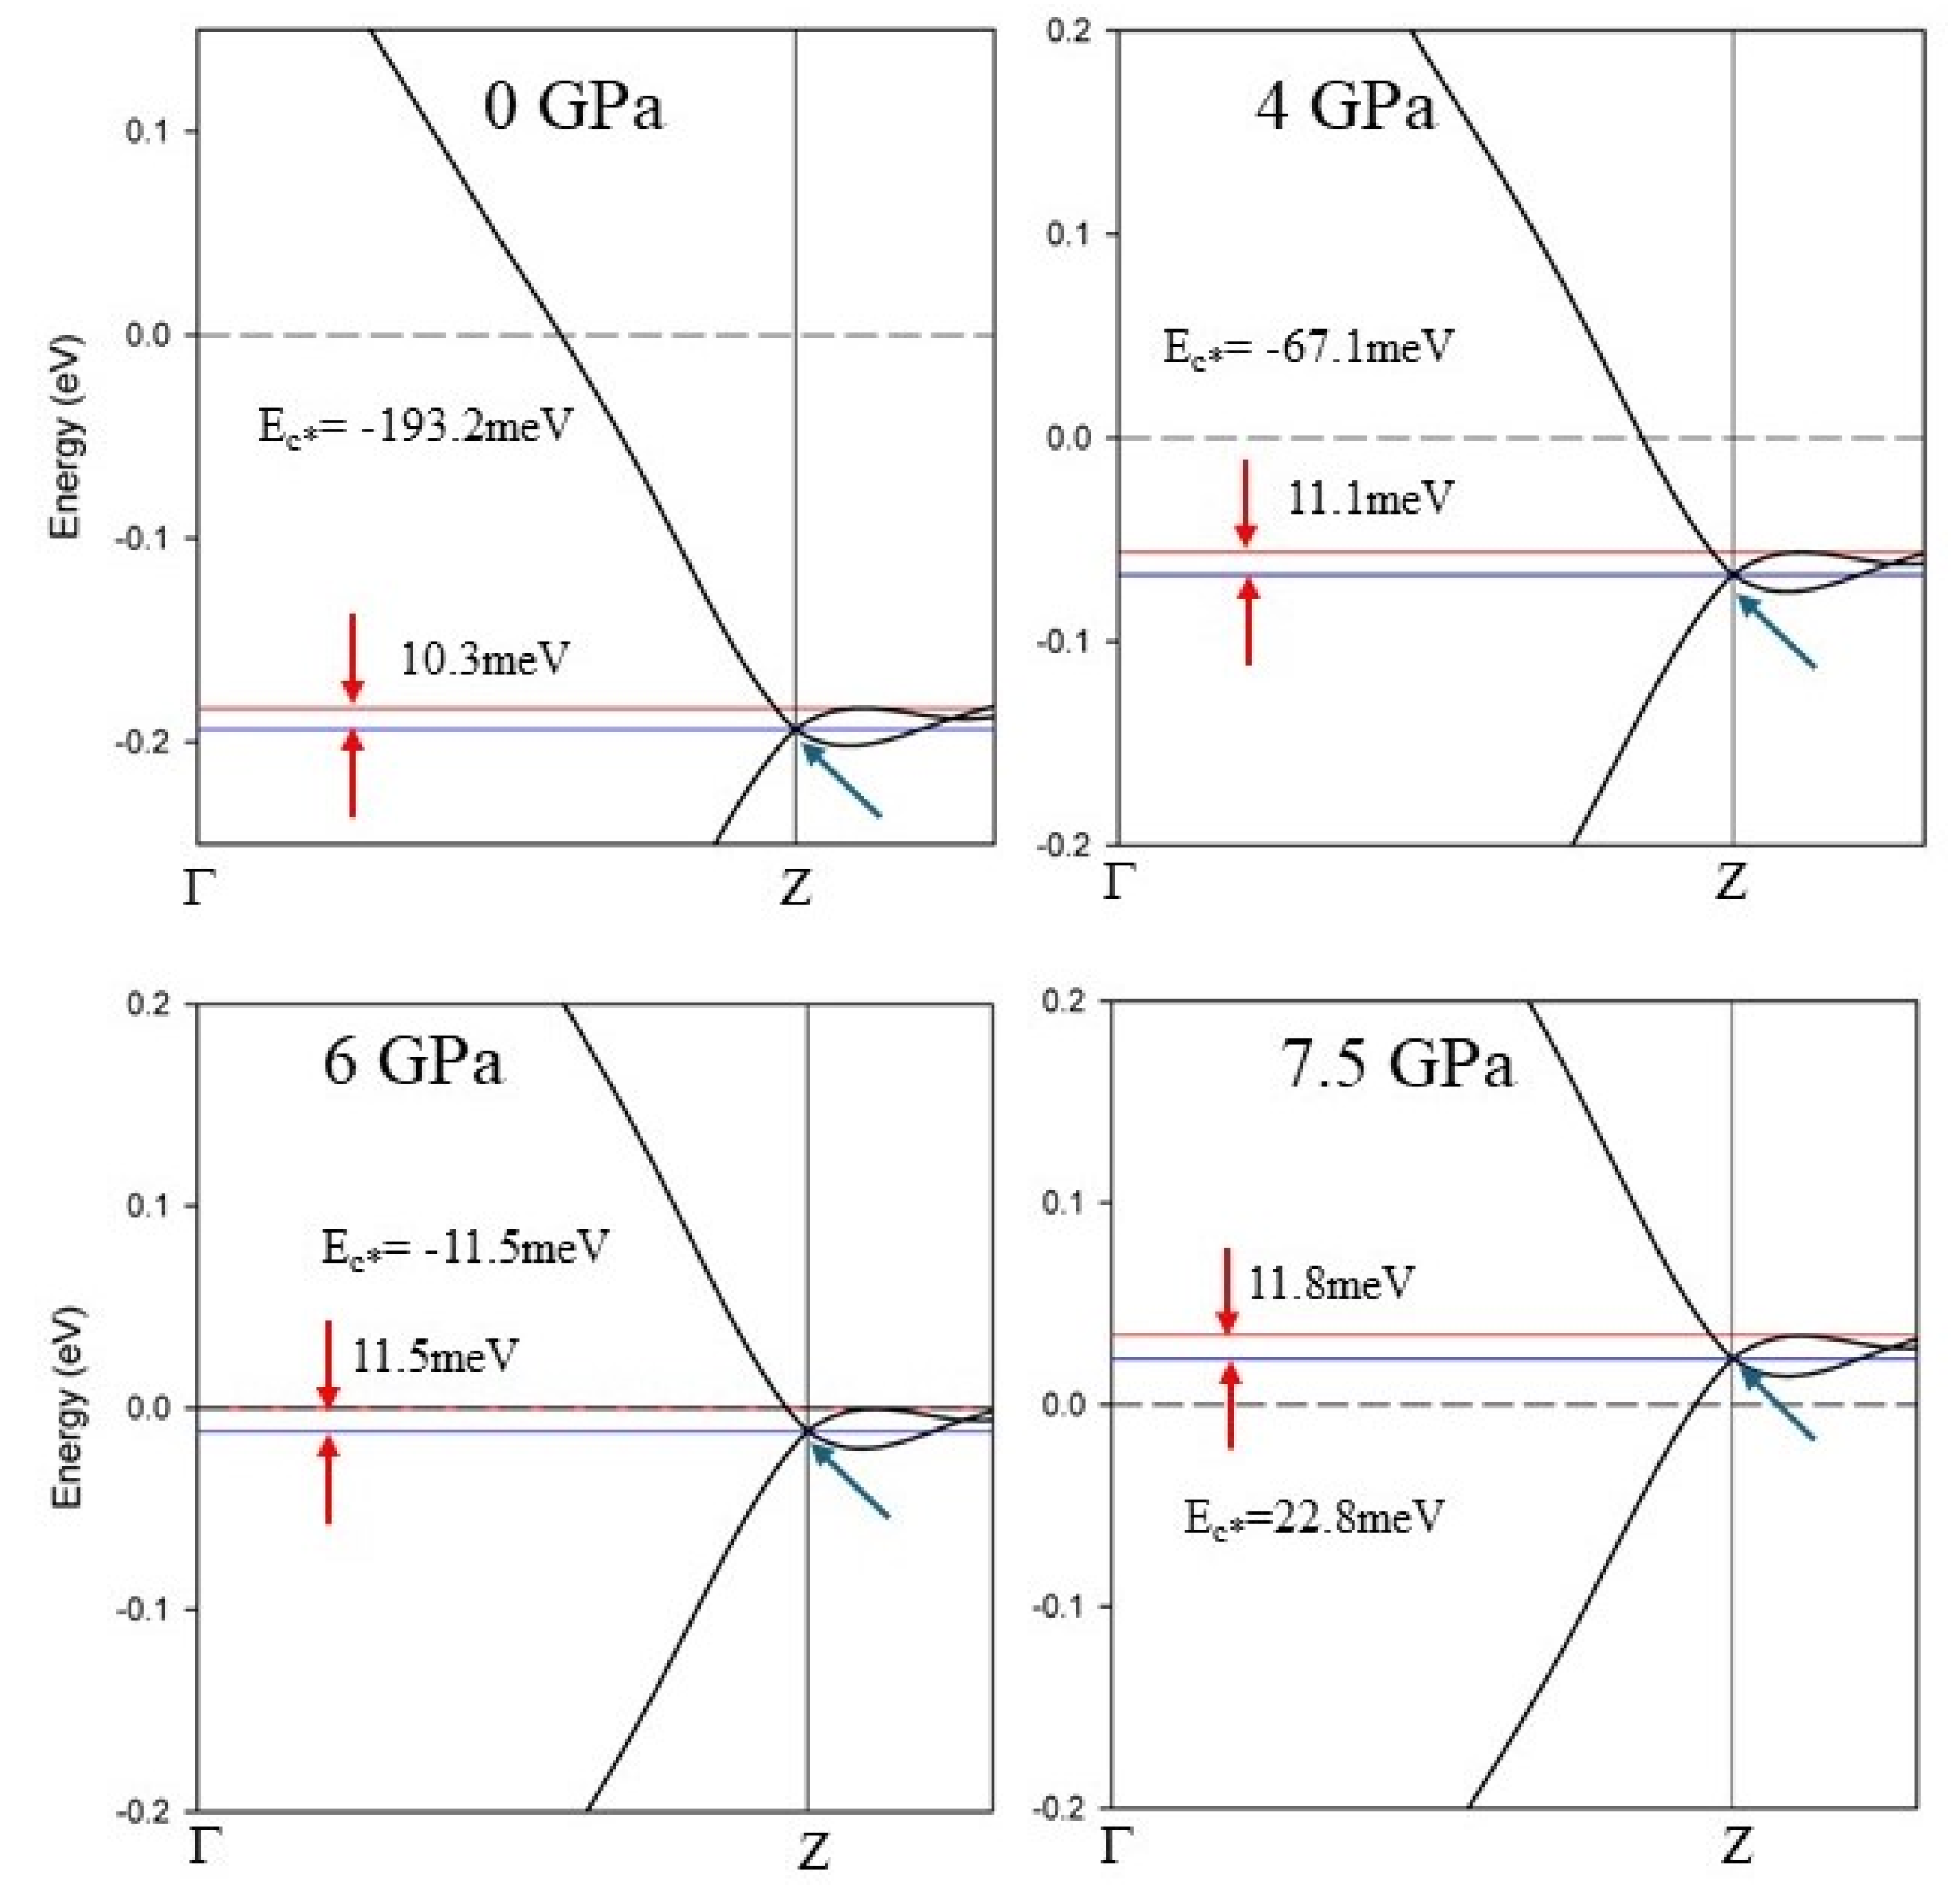
Figure 6.
Fermi surfaces of Rhombohedral unit cell for CaC6. (a). The Fermi surfaces of CaC6 for all bands. (b-d) individual Fermi surface bands. (e) Cross sections of FS sections along the plane (viewed perpendicularly to this plane) as function of pressure for the rhombohedral primitive unit cell. The colour bar represents the value of the Fermi velocity of electrons. See text for details.
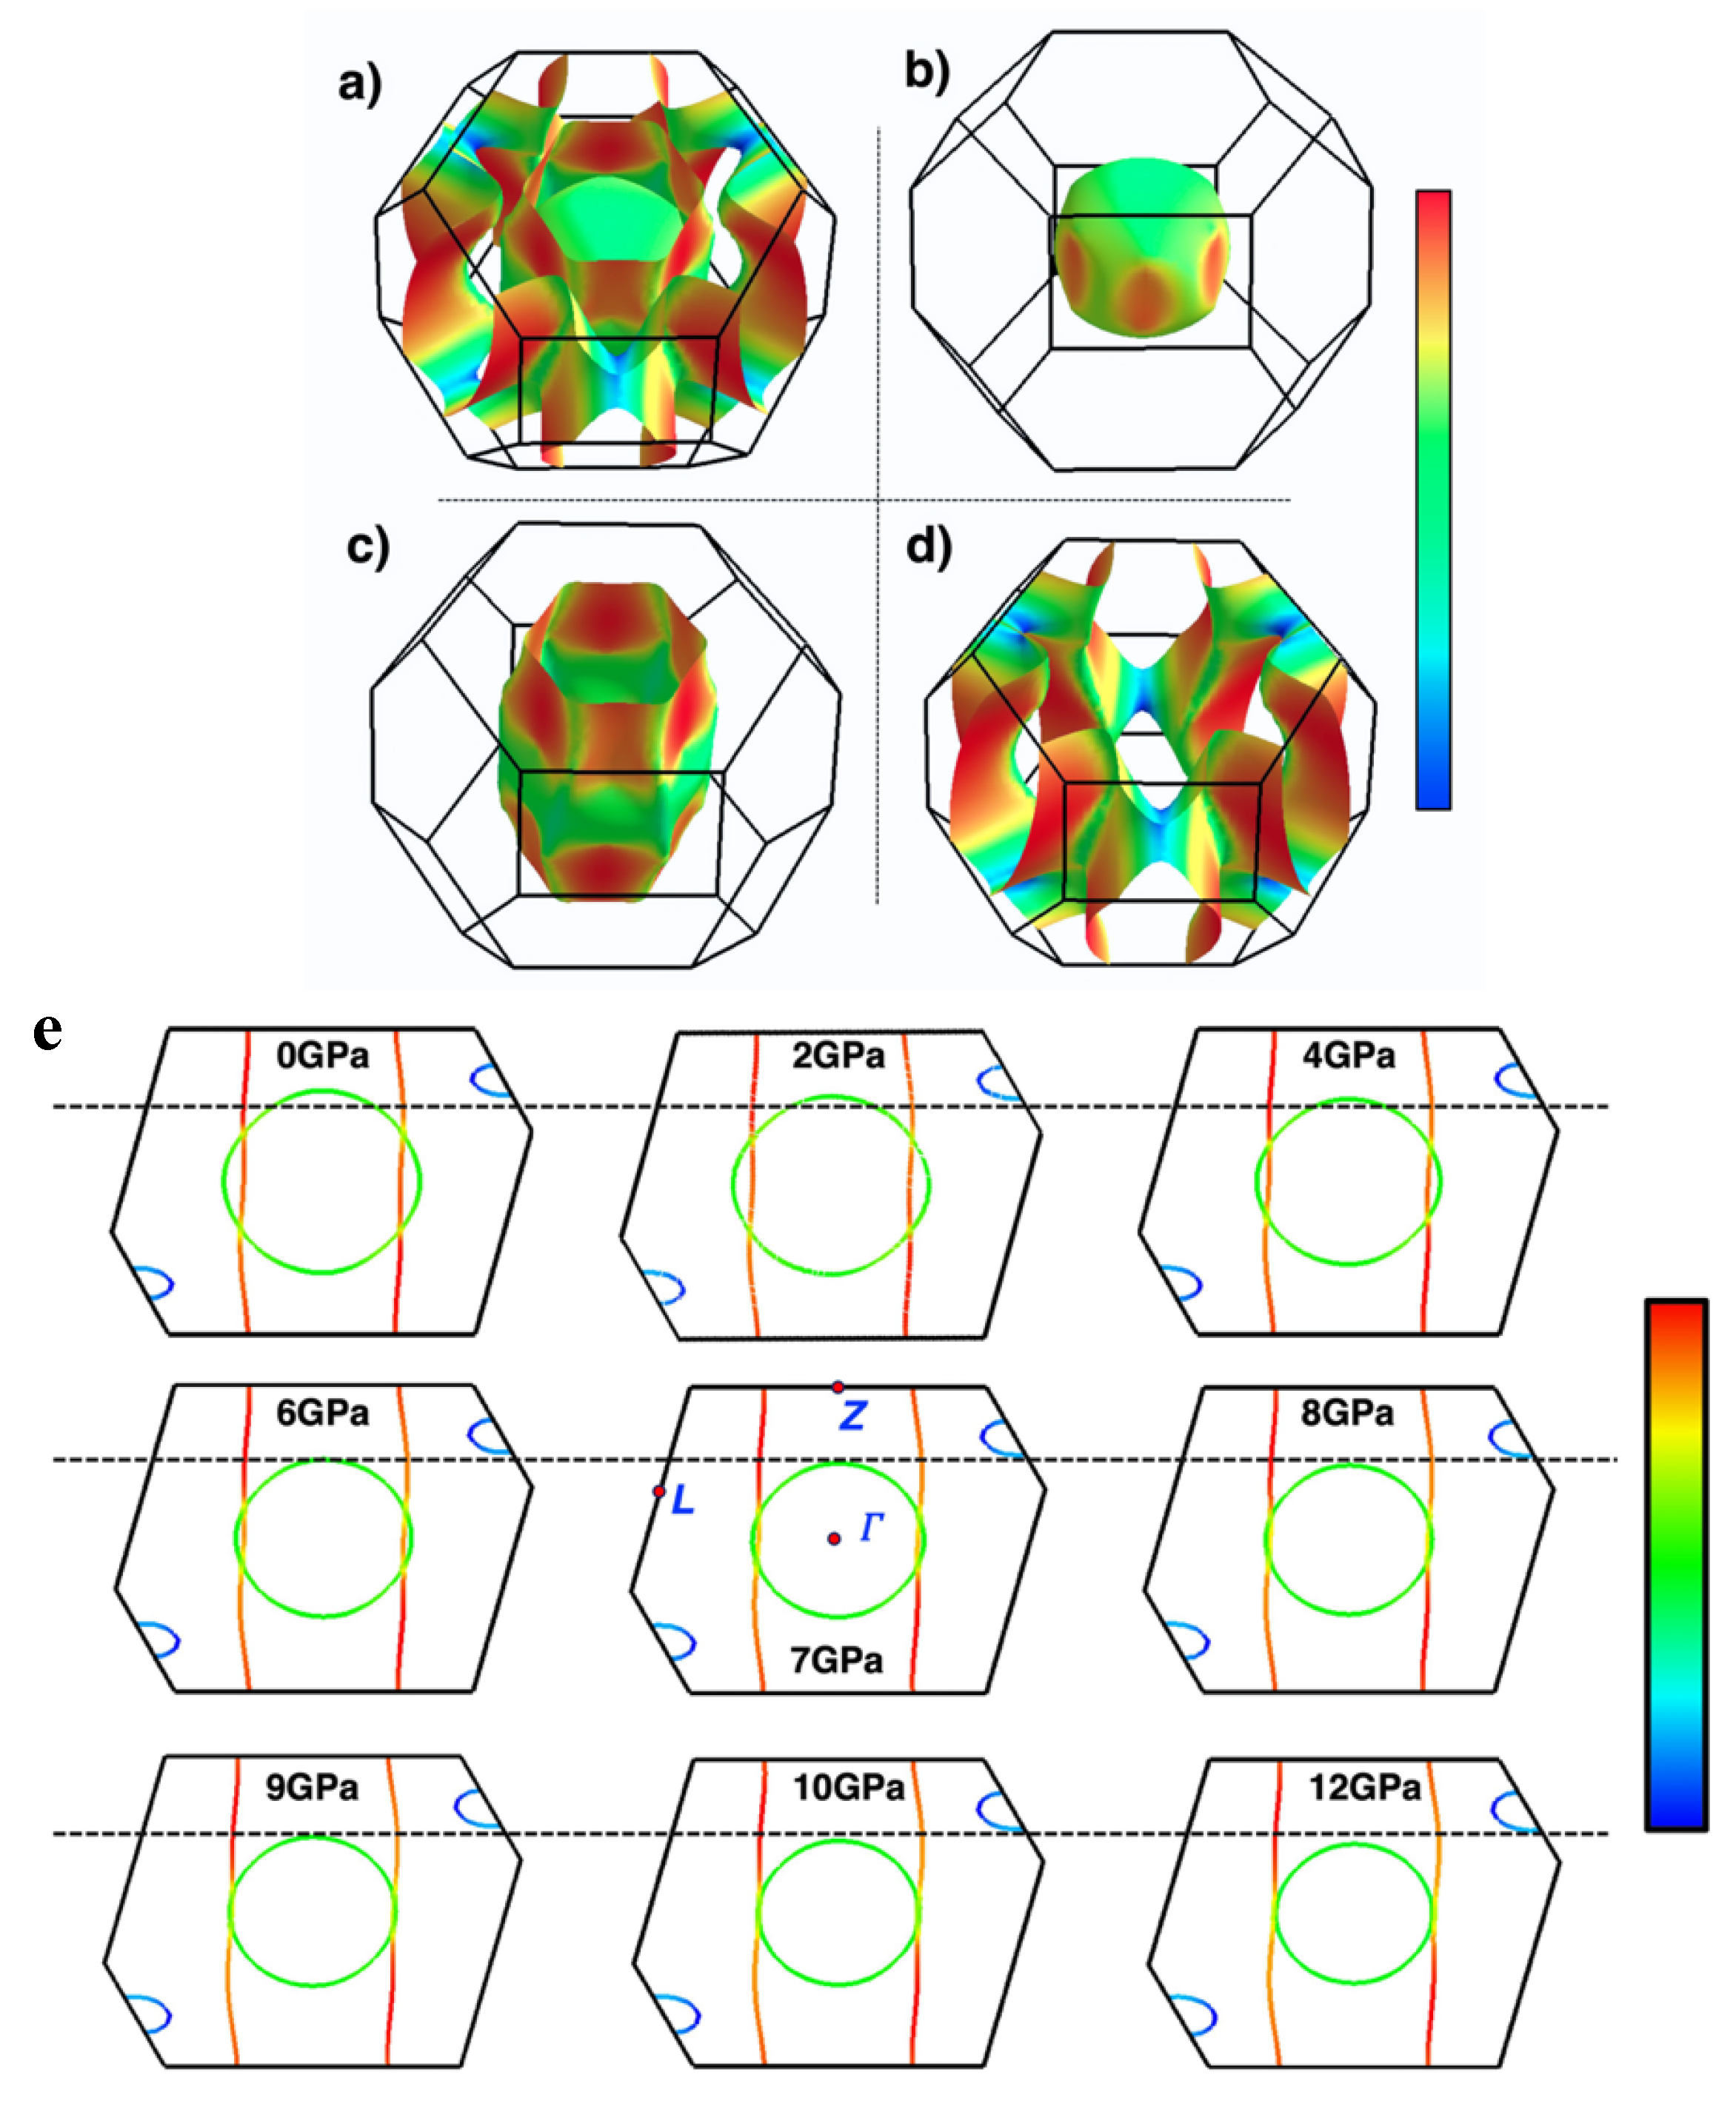
Figure 7.
Folded section views of the FS for CaC6 under: (a) 0GPa, (b) 4GPa, (c) 7.5GPa and (d) 16GPa, respectively. (e) FS calculated for the 2c-double hexagonal supercell using CASTEP, two reciprocal unit cells are displayed together (a single cell is shaded following the scheme of Figure 7a–d), (f) Enlarged view of the intersections with the BZ boundaries. Note that gaps evolve at the boundaries (highlighted inside blue hyphenated circles) because of the requirement that bands must be perpendicular to BZ boundary planes (see also Figure 4).
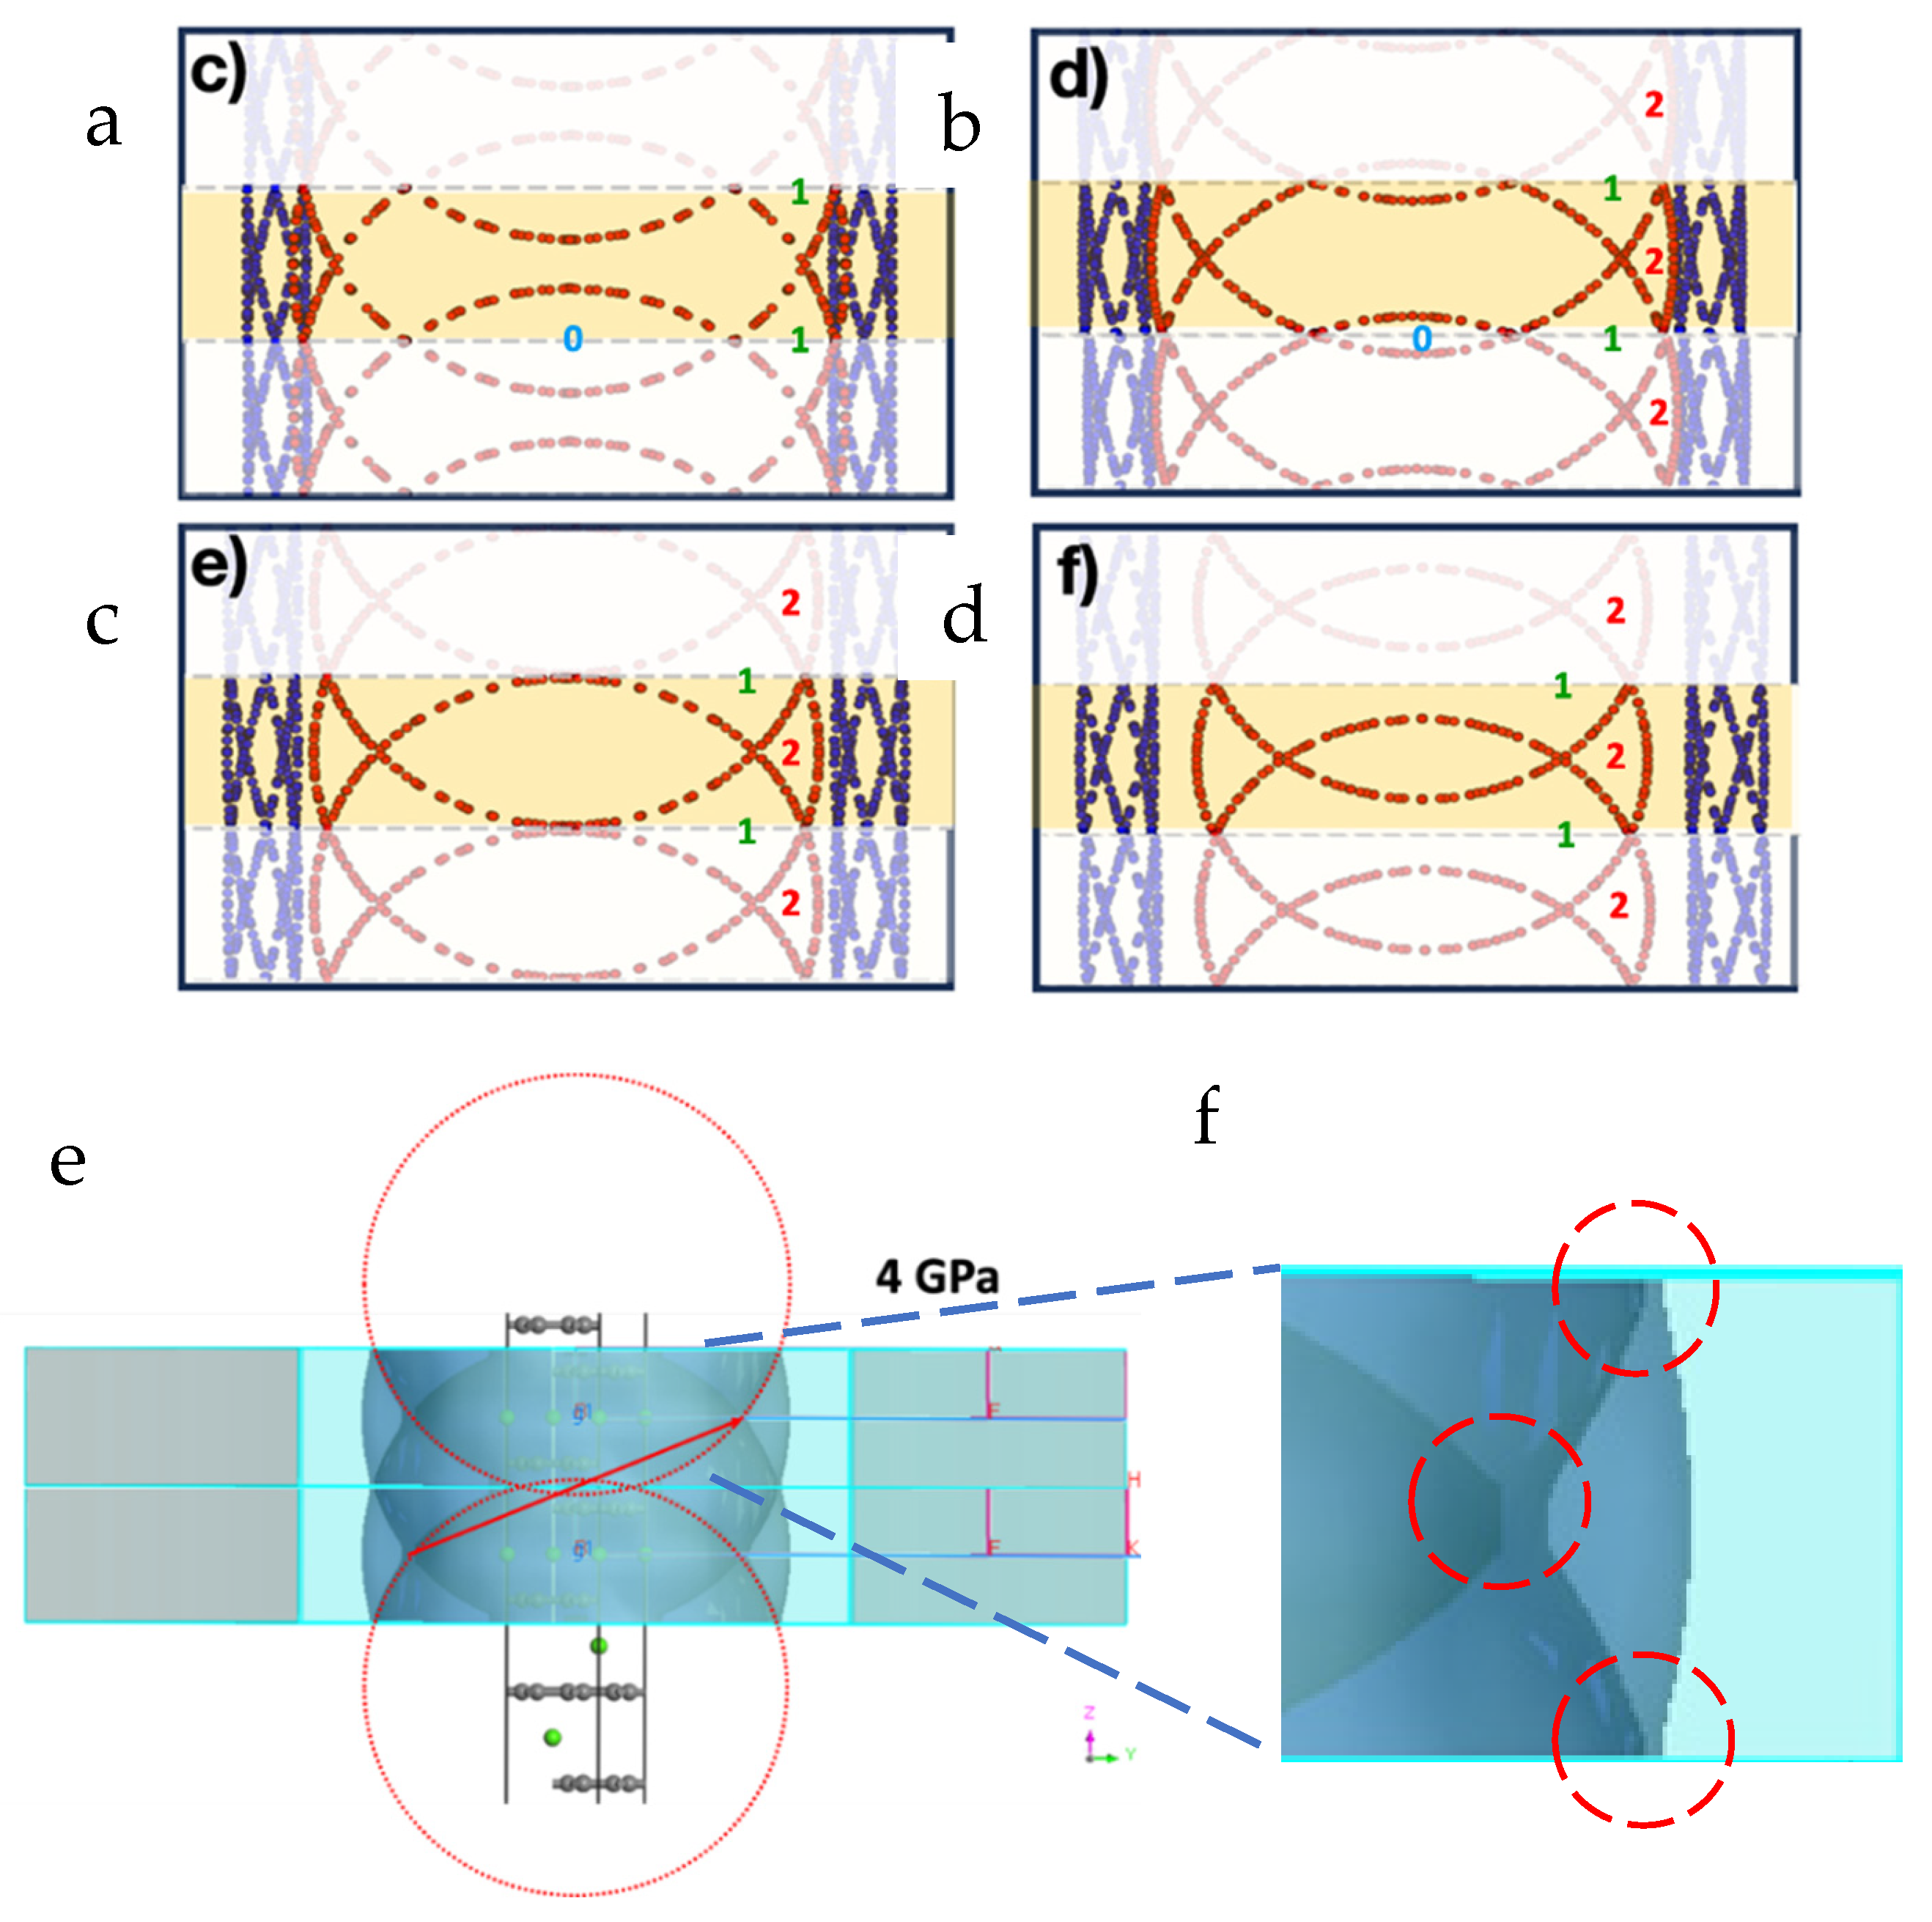
Figure 8.
Periodically repeated FSs for CaC6 calculated for the 2c double superlattice at various pressures: 0 GPa, 7.5 GPa and 12 GPa. Open and closed FSs are labelled. Note that at about 7.5 GPa, the internal open FS is about to become disconnected and closed.
Figure 8.
Periodically repeated FSs for CaC6 calculated for the 2c double superlattice at various pressures: 0 GPa, 7.5 GPa and 12 GPa. Open and closed FSs are labelled. Note that at about 7.5 GPa, the internal open FS is about to become disconnected and closed.
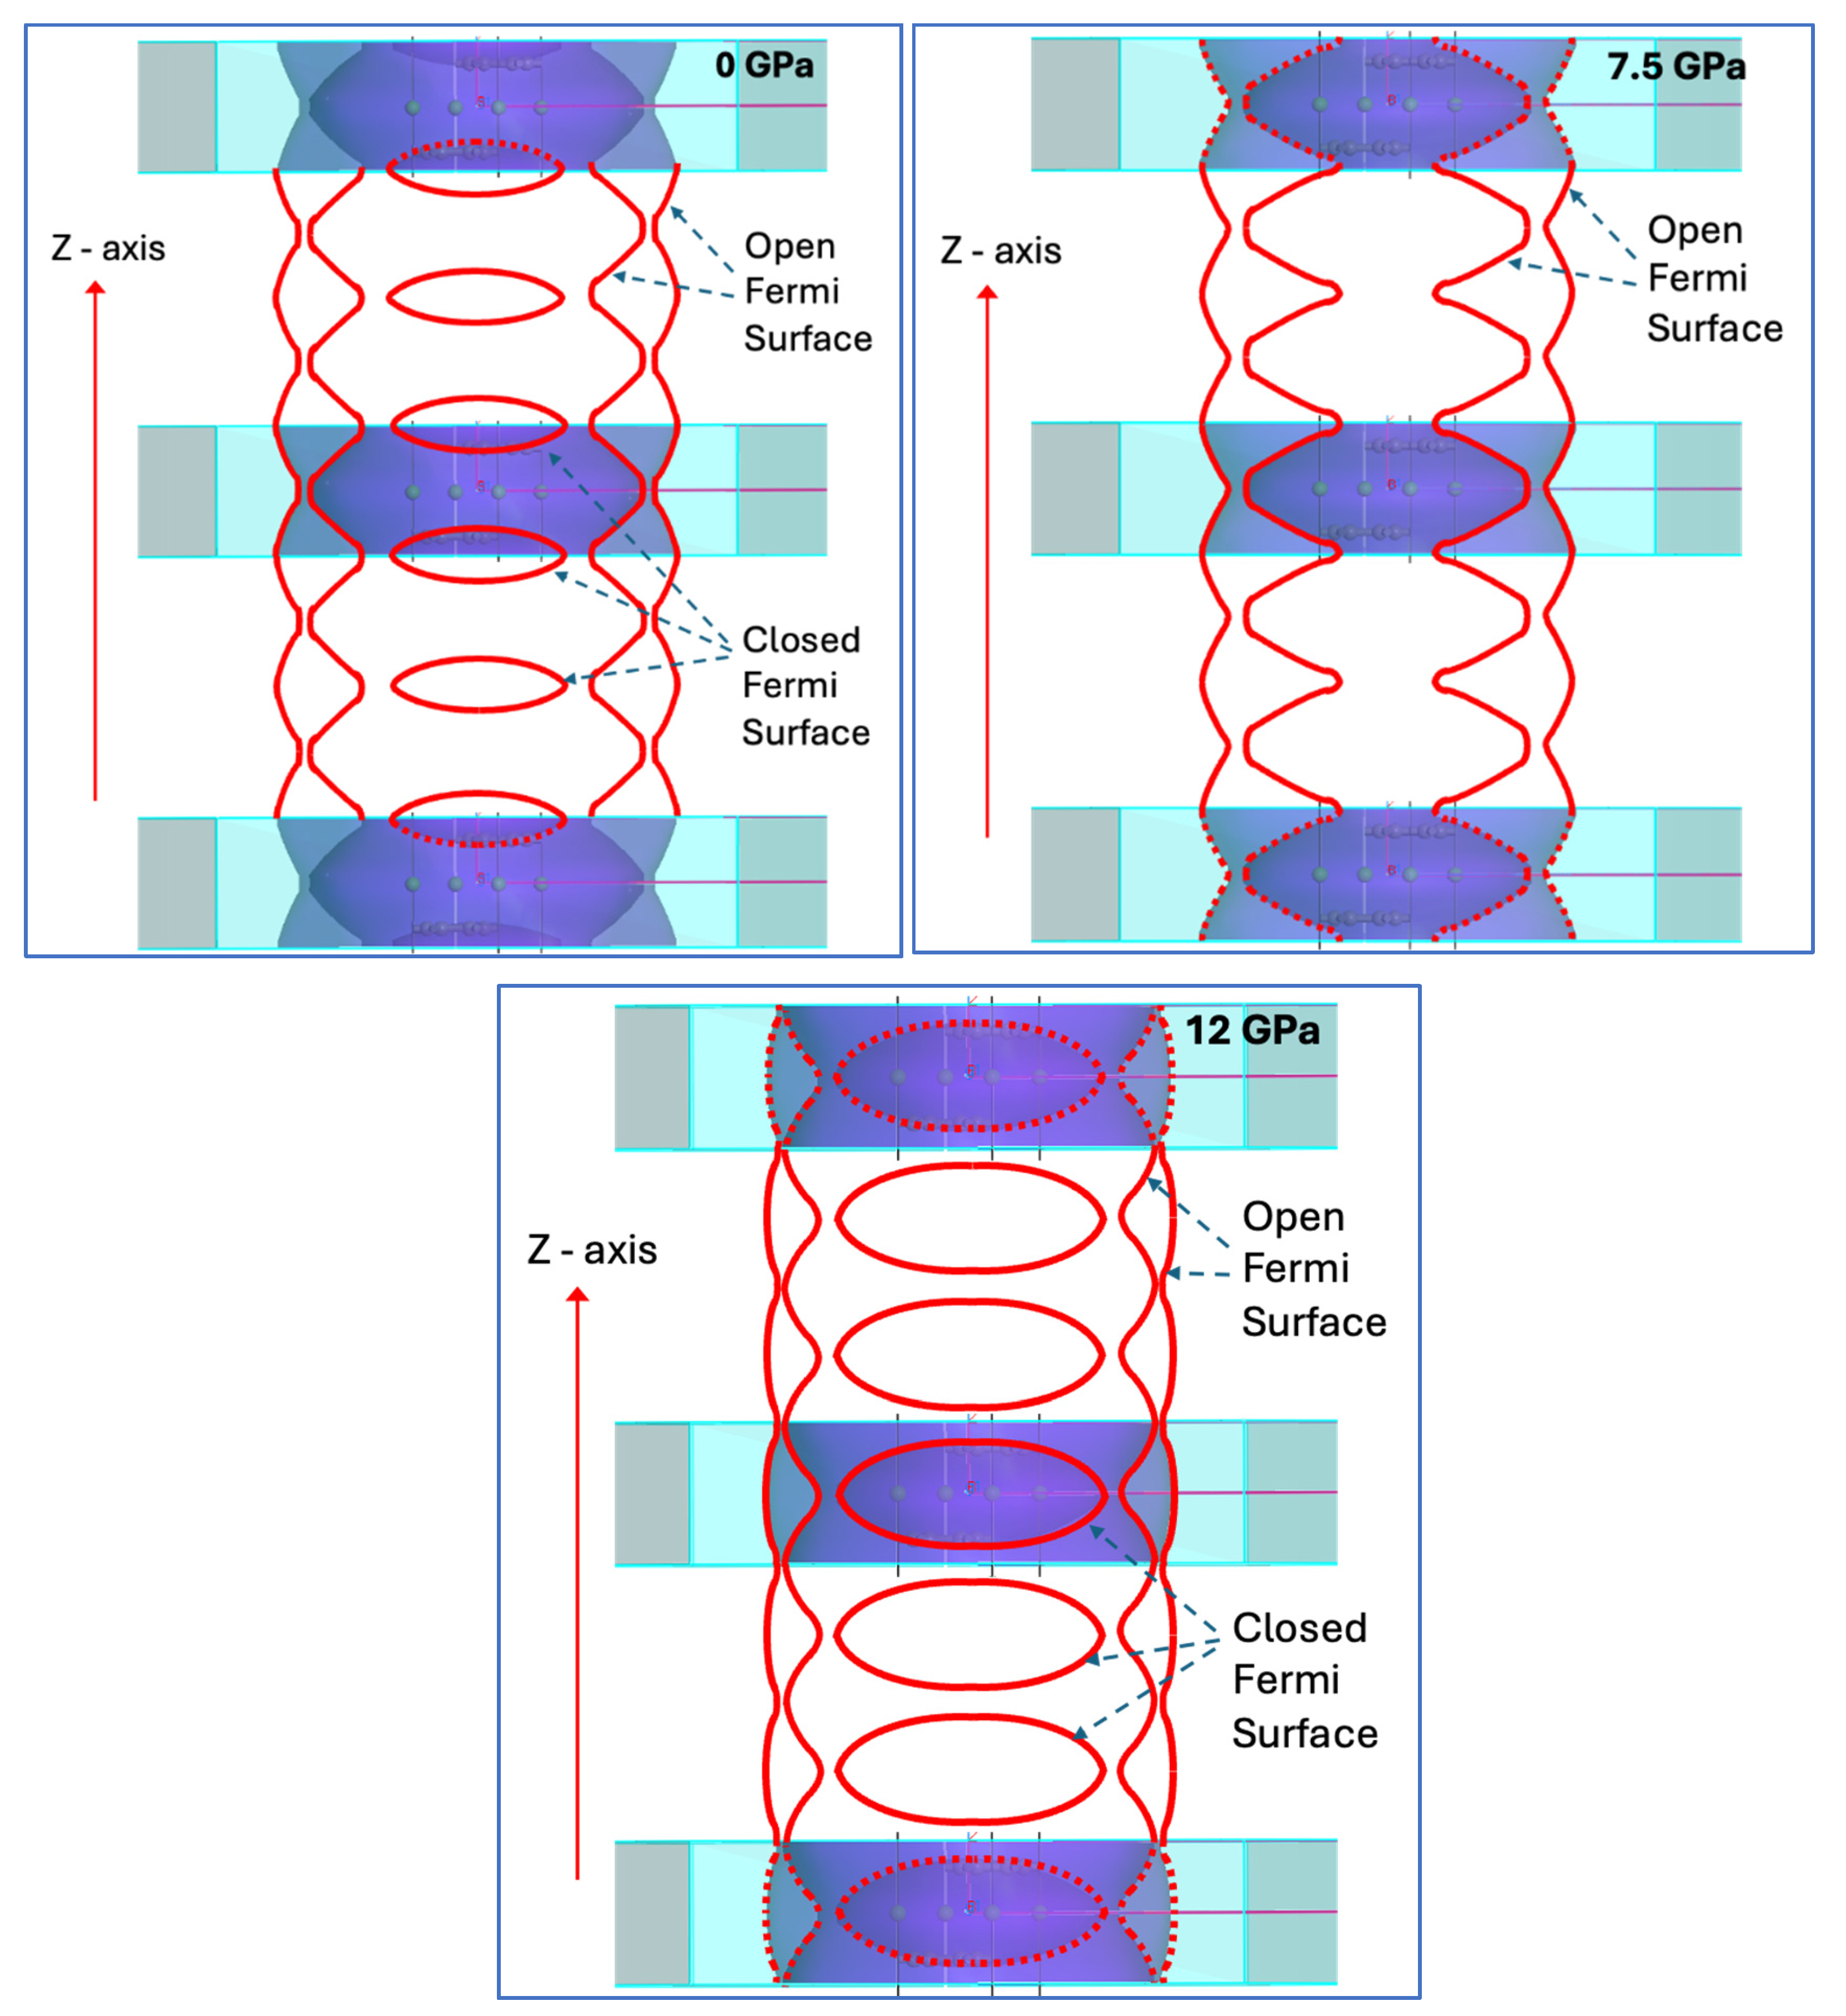
Figure 9.
Sequence of isoenergetic FSs for the 2c double hexagonal supercell of CaC6 at 0 GPa. Isoenergic values are displayed to the left of the corresponding FS cross-section.
Figure 9.
Sequence of isoenergetic FSs for the 2c double hexagonal supercell of CaC6 at 0 GPa. Isoenergic values are displayed to the left of the corresponding FS cross-section.
Disclaimer/Publisher’s Note: The statements, opinions and data contained in all publications are solely those of the individual author(s) and contributor(s) and not of MDPI and/or the editor(s). MDPI and/or the editor(s) disclaim responsibility for any injury to people or property resulting from any ideas, methods, instructions or products referred to in the content. |
© 2024 by the authors. Licensee MDPI, Basel, Switzerland. This article is an open access article distributed under the terms and conditions of the Creative Commons Attribution (CC BY) license (http://creativecommons.org/licenses/by/4.0/).
Copyright: This open access article is published under a Creative Commons CC BY 4.0 license, which permit the free download, distribution, and reuse, provided that the author and preprint are cited in any reuse.


