Submitted:
21 May 2024
Posted:
22 May 2024
You are already at the latest version
Abstract
Spinal cord tumors, though rare, present formidable challenges in clinical management due to their intricate nature. Traditional treatment modalities like surgery, radiation therapy, and chemotherapy have been the mainstay for managing these tumors. However, despite significant advancements, challenges persist, including the limitations of surgical resection and the potential side effects associated with radiation therapy. In response to these limitations, a wave of innovative approaches is reshaping the treatment landscape for spinal cord tumors. Advancements in gene therapy, immunotherapy, and targeted therapy are offering groundbreaking possibilities. Gene therapy holds the potential to modify the genes responsible for tumor growth, while immunotherapy harnesses the body's own immune system to fight cancer cells. Targeted therapy aims to strike a specific vulnerability within the tumor cells, offering a more precise and potentially less toxic approach. Additionally, novel surgical adjuncts are being explored to improve visualization and minimize damage to surrounding healthy tissue during tumor removal. These developments pave the way for a future of personalized medicine for spinal cord tumors. By delving deeper into the molecular makeup of individual tumors, doctors can tailor treatment strategies to target specific mutations and vulnerabilities. This personalized approach offers the potential for more effective interventions with fewer side effects, ultimately leading to improved patient outcomes and a better quality of life. This evolving landscape of spinal cord tumor management signifies the crucial integration of established and innovative strategies to create a brighter future for patients battling this complex condition.
Keywords:
spinal cord tumor
; astrocytoma
; diagnosis
; Current treatment
; surgery
1. Introduction
Spinal cord tumors encompass a diverse range of rare neoplasms originating from tissues in and around the spinal canal. These tumors typically exhibit a benign onset with a gradual progression of signs and symptoms. They are characterized by histological heterogeneity, indicating potential origination from various precursor cells [1,2]. Constituting a mere 2-4% of all primary tumors within the central nervous system (CNS), these tumors present a significant clinical challenge [3,4,5]. Despite their lower incidence compared to intracranial counterparts, spinal cord tumors share histopathological similarities with primary intracranial neoplasms, emphasizing the need for a nuanced approach to their management [4]. By convention, spinal cord tumors are commonly classified by anatomic sublocation as intradural intramedullary, intradural extramedullary, or extradural [1]. (Table 1). Extradural spinal tumors are the most prevalent tumors of the spine, constituting 50% [6]. They are further categorized into primary and secondary tumors. Primary extradural tumors, such as hemangiomas and enostoses, are exceptionally rare, often incidental findings, and frequently asymptomatic, requiring no treatment [7]. In contrast, secondary tumors constitute 97% of all vertebral spinal tumors due to the spine’s rich vascularity and proximity to lymphatic drainage [7].
Intradural extramedullary spinal cord tumors (EMSCTs) develop in the subdural space, outside of the spinal cord, and are the second most common spinal tumor, constituting 40% [6]. They typically arise from leptomeninges or nerve roots [8]. Among EMSCTs, Schwannomas are the most prevalent, accounting for 29%, followed by meningiomas at 25%, and gliomas at 22% [9]. Patients with EMSCTs often present with lower back pain, especially worsened at night or when supine [9]. Intramedullary spinal cord tumors (IMSCTs) constitute approximately 5%-10% of tumors within the spinal canal [10,11]. Gliomas, which include both ependymomas and astrocytomas, make up 80%-90% of IMSCTs, with ependymomas comprising approximately two-thirds and astrocytomas one-third [12]. Most IMSCTs are benign and manifest with back pain, typically exacerbated at night or when supine [13,14].
The classification of CNS tumors has traditionally relied on histological analysis, supplemented by ancillary tests such as immunohistochemistry and ultrastructural studies . However, in recent years, molecular biomarkers have emerged as crucial tools in enhancing diagnostic accuracy and refining classification criteria. The latest edition of the WHO Classification of Tumors of the Central Nervous System (CNS) integrates a multitude of molecular alterations that provide valuable diagnostic and prognostic insights. These molecular changes not only complement histological findings but also offer defining information, thereby contributing to a more precise and comprehensive classification of CNS neoplasms [15] (Table 1 and Table 2).
Navigating the intricate landscape of spinal cord tumors, characterized by their rarity and complexity, demands a comprehensive understanding of both established state-of-the-art treatment modalities and emerging innovative approaches. Various surgical techniques can be employed for tumor excision, depending on factors such as tumor type, surgical goal, and the patient’s overall health status [16]. Traditional treatment modalities, including surgery, radiation therapy, and targeted drug therapies, have formed the backbone of spinal cord tumor management [3,5,17]. Surgical resection, guided by advances in imaging and neurosurgical techniques, remains a primary intervention, aiming for maximal tumor removal while preserving neurological function [3,17]. Radiation therapy, encompassing conventional external beam radiation and modern techniques like stereotactic radiosurgery, plays a crucial role in adjuvant and palliative settings [3]. Additionally, targeted drug therapies, leveraging molecular insights into tumor biology, offer promising avenues for personalized treatment approaches [17]. However, despite the progress achieved with traditional treatment modalities, challenges persist in achieving optimal outcomes for patients with spinal cord tumors. These challenges include limitations in surgical resection due to tumor location or size and the risk of damaging surrounding healthy tissues with radiation therapy [3,17].
Amidst these challenges, the field of spinal cord tumor research is witnessing a surge of innovative approaches aimed at addressing existing limitations and enhancing therapeutic efficacy. Immunotherapy, harnessing the body’s immune system to recognize and attack tumor cells, offers a paradigm shift towards personalized and potentially curative treatment strategies [18,19]. The cytotoxic capabilities of the immune system and the precision afforded by molecular targeting make immunotherapy promising [20].To enhance the precision of procedures and improve postoperative outcomes, emerging digital technologies are increasingly being integrated into tumor resections as complementary tools for visualizing the surgical field [21]. In this review, we will explore how the fusion of established state-of-the-art treatment methods with emerging innovative approaches opens up vast promise and potential in the management of spinal cord tumors, enriching our understanding of this complex field. By seamlessly integrating these strategies, the field aspires to surpass current limitations, leading the path towards a future where patients with spinal cord tumors can access refined treatment protocols and enjoy enhanced quality of life.
2. Diagnosis
2.1. MRI and CT
Diagnosing IMSCTs and EMSCTs are complex due to their diverse behaviors, which can range from benign to malignant [22]. These tumors often elude early detection and only present neurological symptoms after substantial infiltration of the spinal canal, resulting in considerable morbidity and mortality [23]. Consequently, reliable, and timely diagnostic techniques are critical for effective treatment. Magnetic resonance imaging (MRI) is the primary diagnostic tool for identifying spinal tumors, providing detailed information about their size, location, and position along the axis [24].
Table 3 in the context of spinal cord tumors serves as a guide for clinicians to differentiate between various types of spinal cord tumors based on specific imaging and clinical characteristics:
Tumor location: The location of the tumor within the spinal cord or surrounding structures can provide valuable information about its possible origin and nature. For example, tumors located within the spinal cord parenchyma may indicate intramedullary tumors, while those located outside the cord may suggest extramedullary tumors. I IMSCTs: Ependymoma, astrocytoma. EMSCTs: Meningioma, schwannoma [1,6].
MRI intensity, CT density: The intensity or density of the tumor on magnetic resonance imaging (MRI) or computed tomography (CT) scans can offer insights into its composition and characteristics. Different types of tumors may exhibit distinct intensity or density patterns, aiding in their differentiation. Low-grade gliomas (e.g., astrocytomas) may appear hypointense on T1-weighted MRI and hyperintense on T2-weighted MRI. Meningiomas often demonstrate iso intensity on T1-weighted MRI and hyperintensity on T2-weighted MRI [25].
Enhancement pattern: The enhancement pattern observed on contrast-enhanced imaging studies can help distinguish between various types of spinal cord tumors. For instance, certain tumors may show homogeneous enhancement, while others may exhibit heterogeneous enhancement patterns. Ependymomas may exhibit heterogeneous enhancement with contrast due to the presence of cystic components. Schwannomas typically show intense, homogeneous enhancement following contrast administration [26].
Bone erosion: The presence of bone erosion detected on imaging studies, such as CT scans, may suggest an invasive tumor that has extended into the surrounding bone tissue. This finding can help narrow down the differential diagnosis and guide treatment planning. Chordomas are known for causing bone erosion and destruction of adjacent vertebral bodies due to their locally aggressive nature. Metastatic spinal tumors, such as from lung or breast cancer, may also lead to bone erosion as they invade the vertebral column [27,28].
Accompanied findings: Additional imaging findings, such as peritumoral cysts, edema, flow voids, or calcifications, can provide further clues about the nature and characteristics of the tumor. These accompanying features may vary depending on the tumor type and location. Peritumoral cysts: Seen in ependymomas and hemangioblastomas [26,29]. Edema: Commonly observed around high-grade gliomas, such as glioblastomas [30]. Flow voids: Characteristic of vascular tumors like spinal hemangioblastomas [29]. Calcifications: Seen in oligodendrogliomas and meningiomas [31].
Other studies: In some cases, supplementary studies such as angiography, positron emission tomography (PET), or cerebrospinal fluid (CSF) analysis may be necessary to confirm the diagnosis or rule out other possibilities. These additional investigations can contribute to a more comprehensive evaluation and management plan for spinal cord tumors. Angiography: Helpful in delineating vascular malformations or tumors with prominent vascular supply, such as hemangioblastomas. PET scan: Can aid in detecting metabolic activity and differentiating between benign and malignant tumors. CSF study: May be indicated to evaluate for leptomeningeal involvement or detect tumor markers in cerebrospinal fluid, particularly in cases of suspected metastatic disease or primary CNS lymphoma [32].
Among EMSCTs, meningiomas are typically iso- or hypointense on T1-weighted MRI scans and mildly hyperintense on T2-weighted scans, with most showing a “dural tail” sign after gadolinium contrast enhancement [25] (Figure 3 and Figure 4). Additionally, CT myelography is used to detect calcifications within tumors or when MRI is not suitable. In specific scenarios, spinal angiography is utilized preoperatively to facilitate the embolization of the arteries supplying the tumor, thereby reducing intraoperative bleeding and tumor size.
Schwannoma shows usually low intensity in T1 weighted MR imaging and high intensity in T2 weighted MR imaging (Figure 1 and Figure 2). Those tumors often enlarge alongside the nerve root and become dumbbell type [33].The heterogenicity of tumor indicates cystic change.
Meningioma indicates usually iso intensity in both T1 and T2 weighted MR imaging and enhanced homogeneously (Figure 3) [34]. Meningioma sometimes calcified and is recognized in CT (Figure 4). The key point of differential diagnosis of meningioma and schwannoma are Table 4.
Figure 1.
54 M, Spinal Schwannoma. A: T1 weighted midsagittal image, B: T2 weighted midsagittal image, C: Enhanced T1 weighted midsagittal image. Red arrows indicate tumor and blue arrow shows tumor enhancement. The tumor is mixed intensity because of tumor necrosis.
Figure 1.
54 M, Spinal Schwannoma. A: T1 weighted midsagittal image, B: T2 weighted midsagittal image, C: Enhanced T1 weighted midsagittal image. Red arrows indicate tumor and blue arrow shows tumor enhancement. The tumor is mixed intensity because of tumor necrosis.
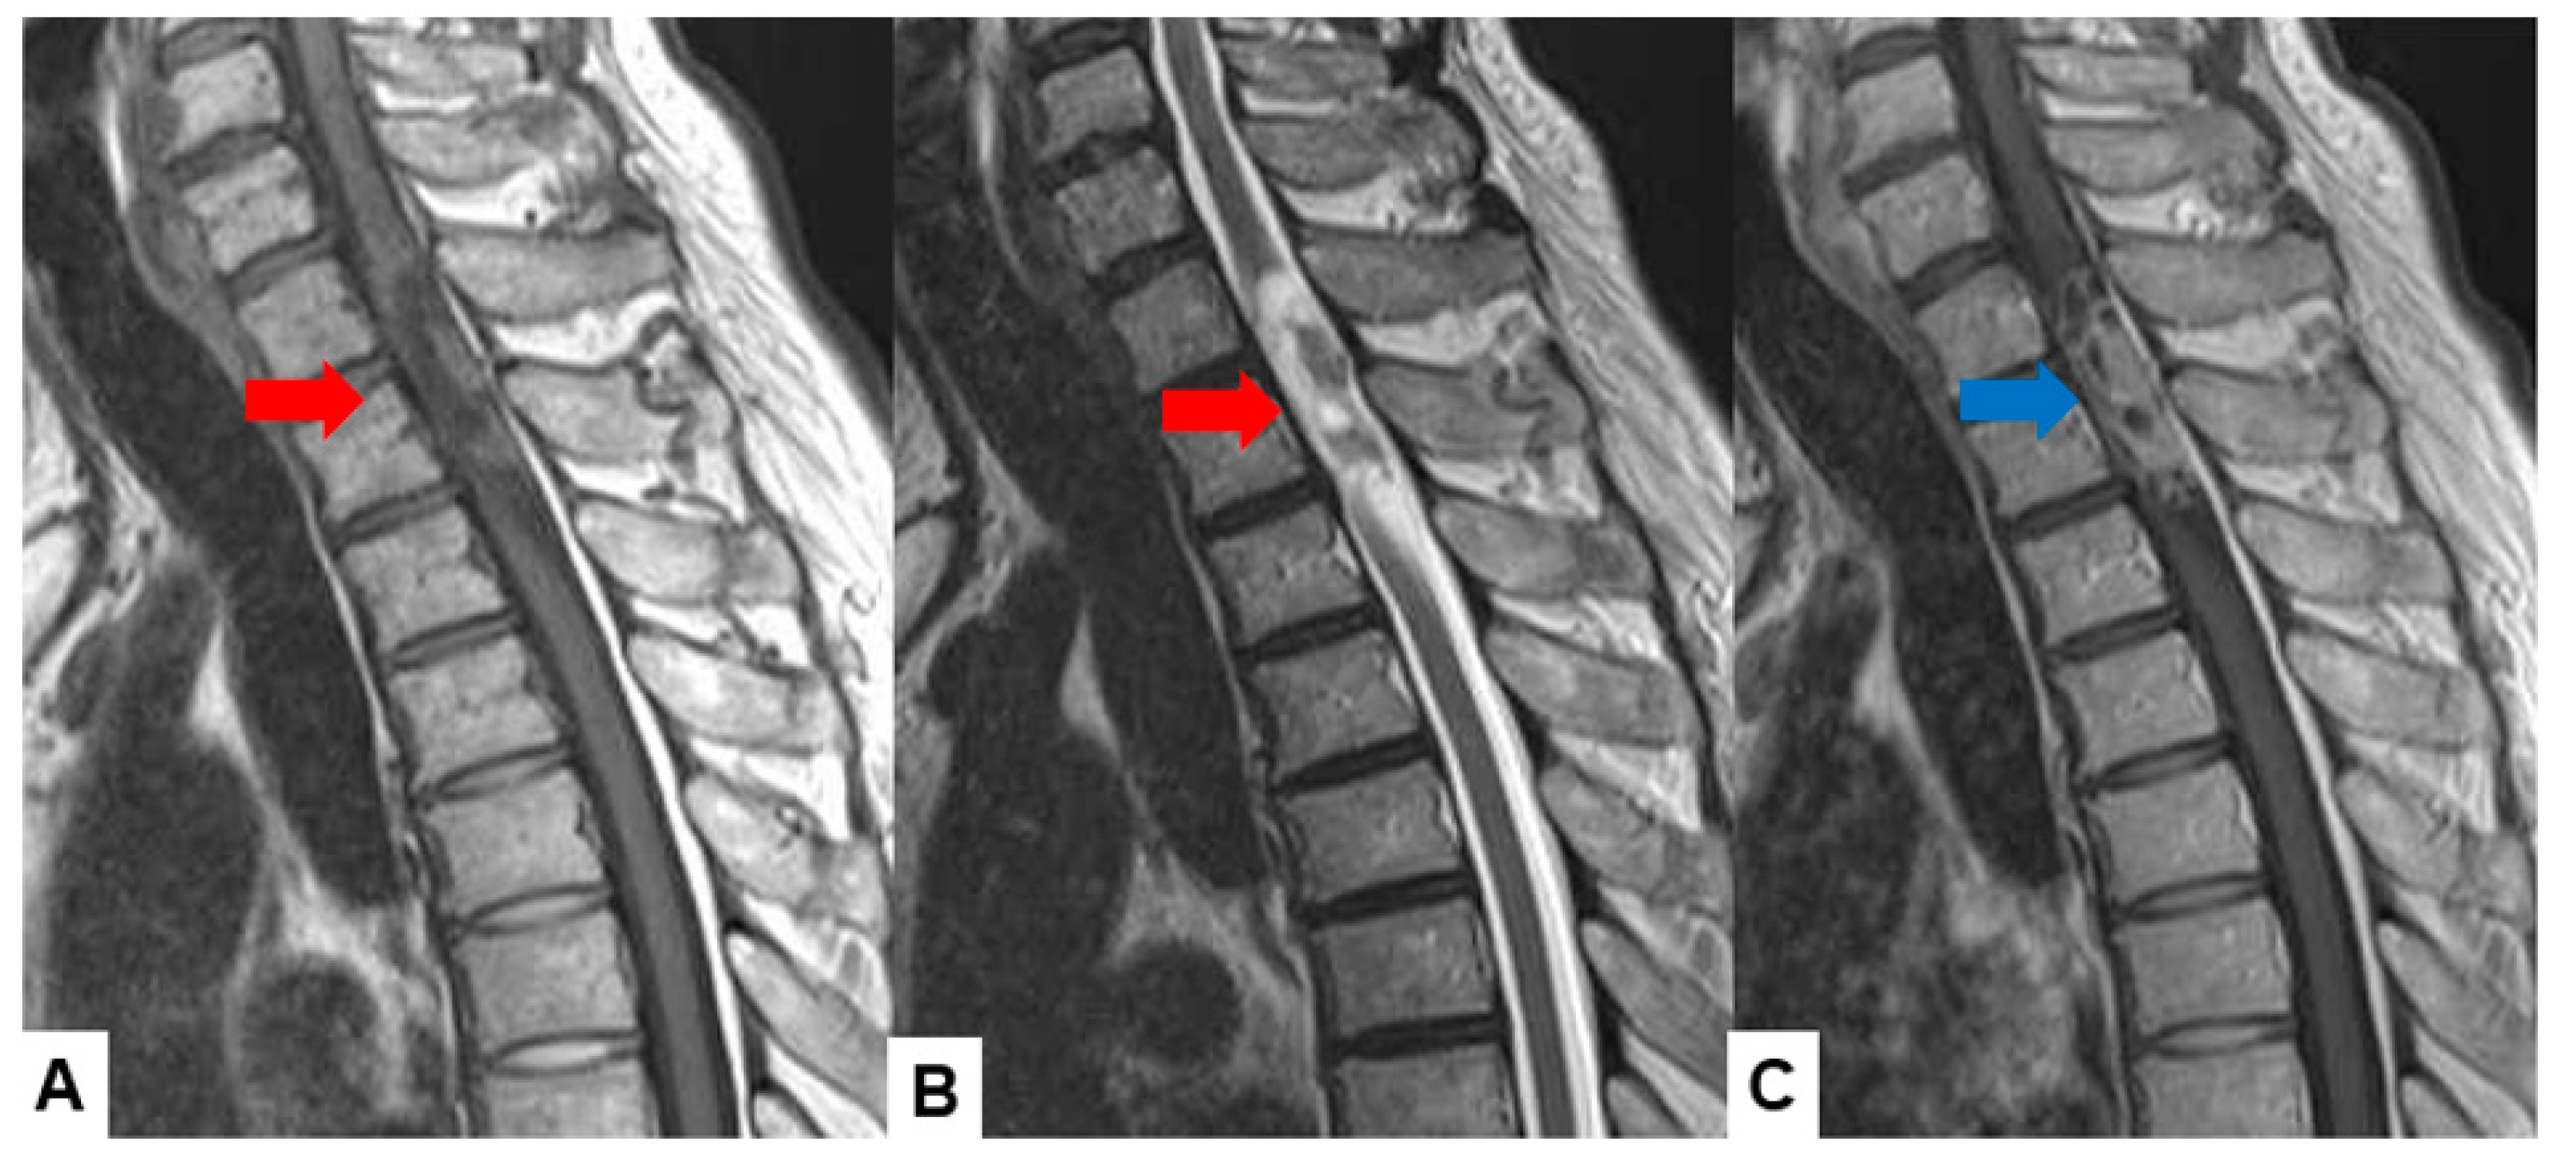
Figure 2.
55 M, Spinal Schwannoma. A: Enhanced T1 weighted midsagittal image, B: T2 weighted midsagittal image, C: Enhanced T1 weighted axial image at C2/3. A red arrow indicate tumor and blue arrow shows tumor enhancement. The tumor is dumbbell shaped (a black arrow).
Figure 2.
55 M, Spinal Schwannoma. A: Enhanced T1 weighted midsagittal image, B: T2 weighted midsagittal image, C: Enhanced T1 weighted axial image at C2/3. A red arrow indicate tumor and blue arrow shows tumor enhancement. The tumor is dumbbell shaped (a black arrow).
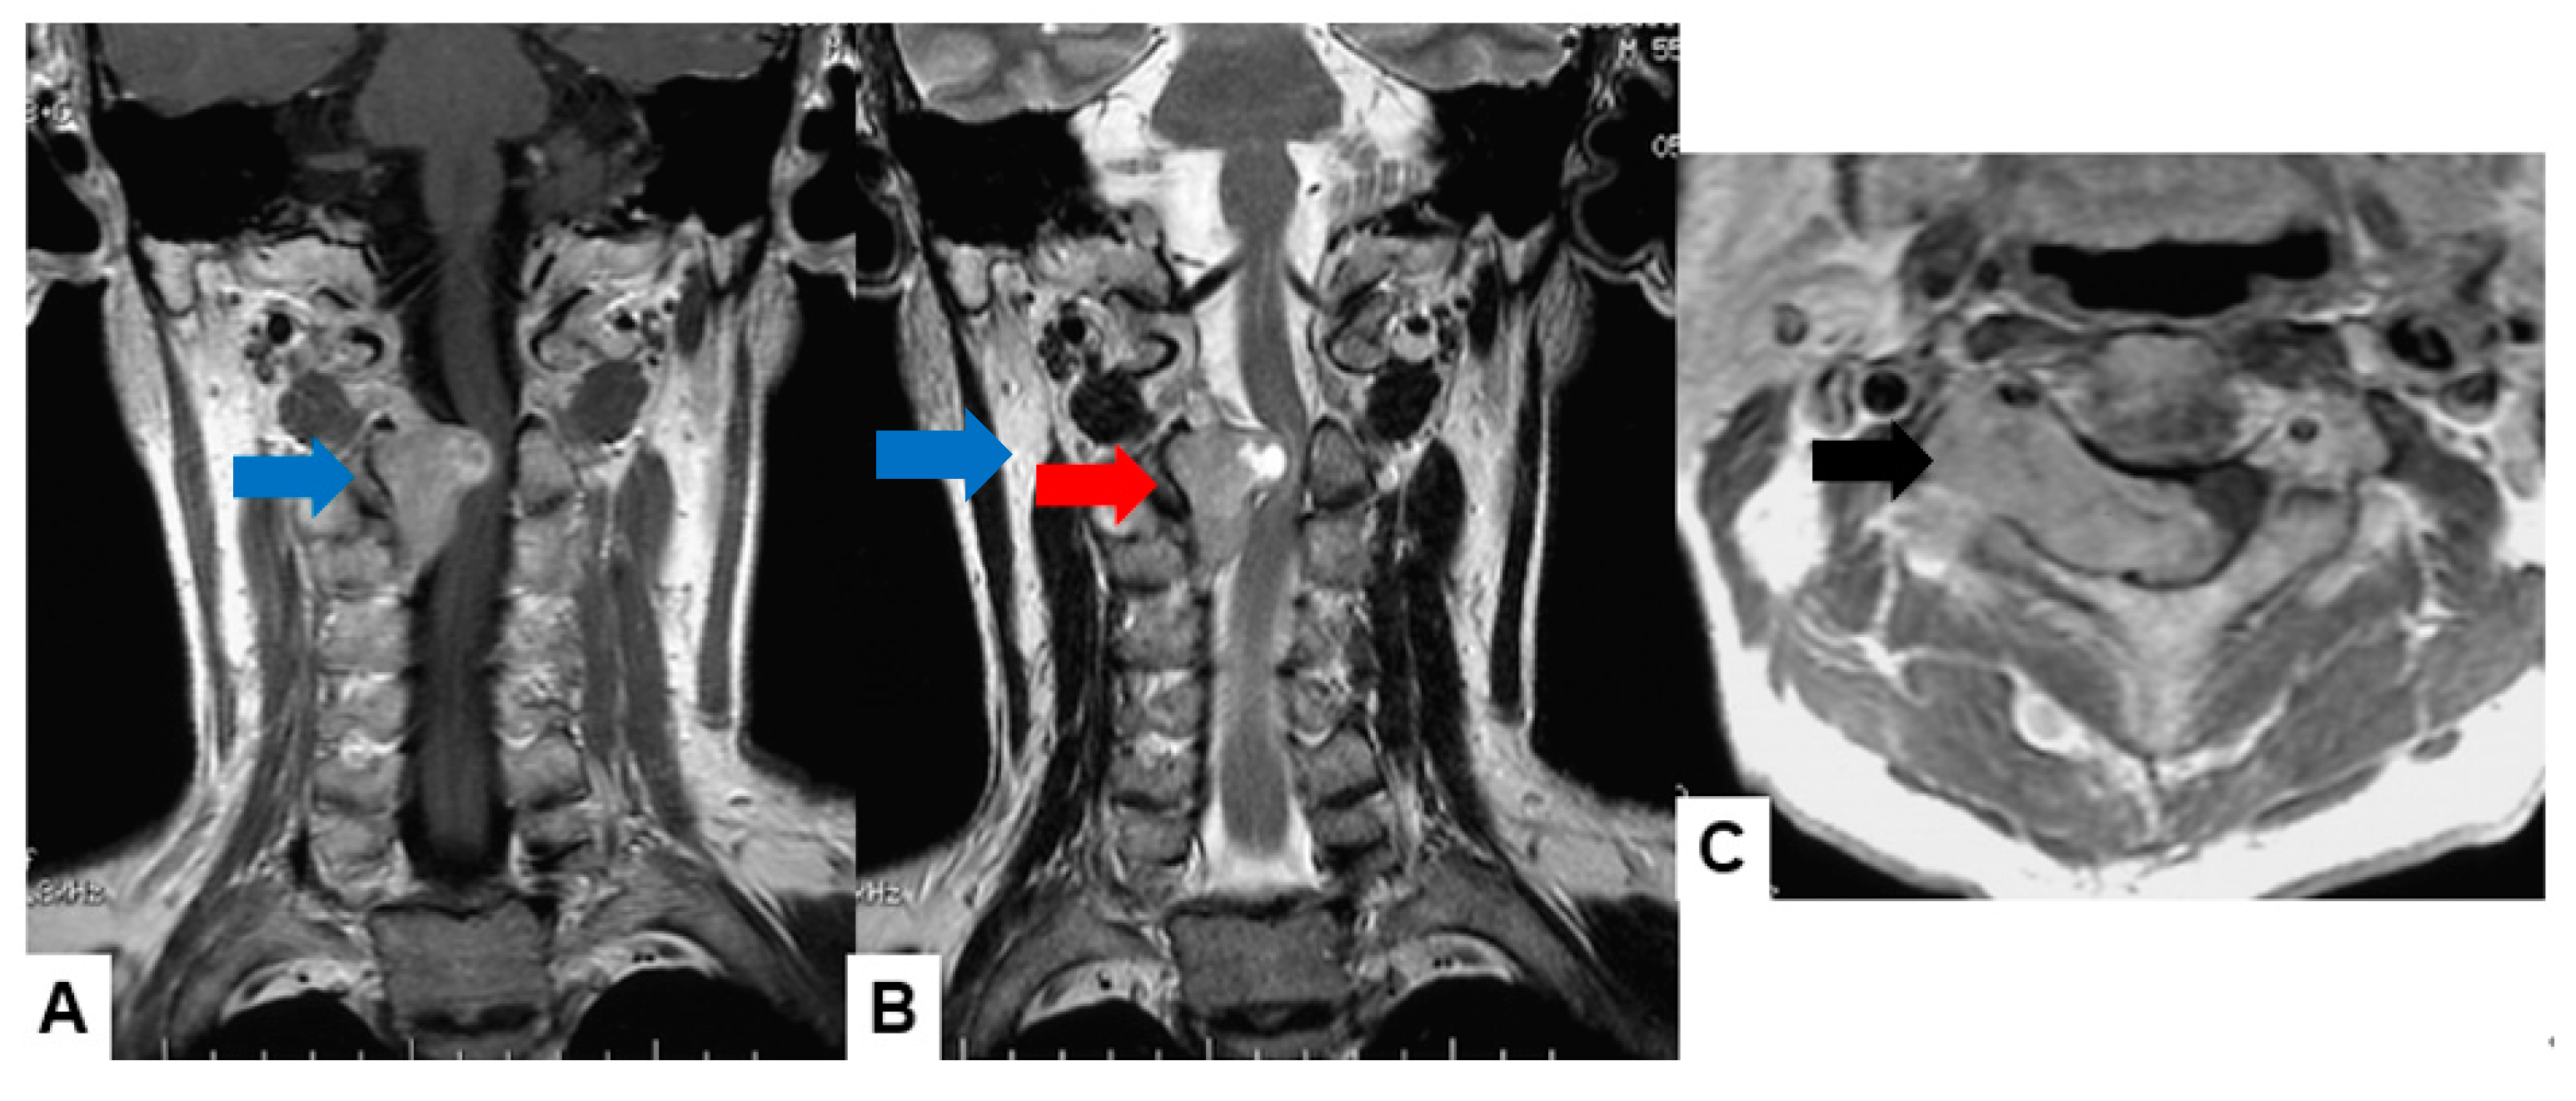
Figure 3.
42 F, Spinal meningioma, A: T1 weighted midsagittal image, B: T2 weighted midsagittal image, C: Enhanced T1 weighted midsagittal image. Red arrows indicate tumor and blue arrow shows tumor enhancement. Red arrows indicate tumor and a blue arrow shows tumor enhancement. A yellow arrow shows dural tail sign and a black arrow indicates tumor ossification.
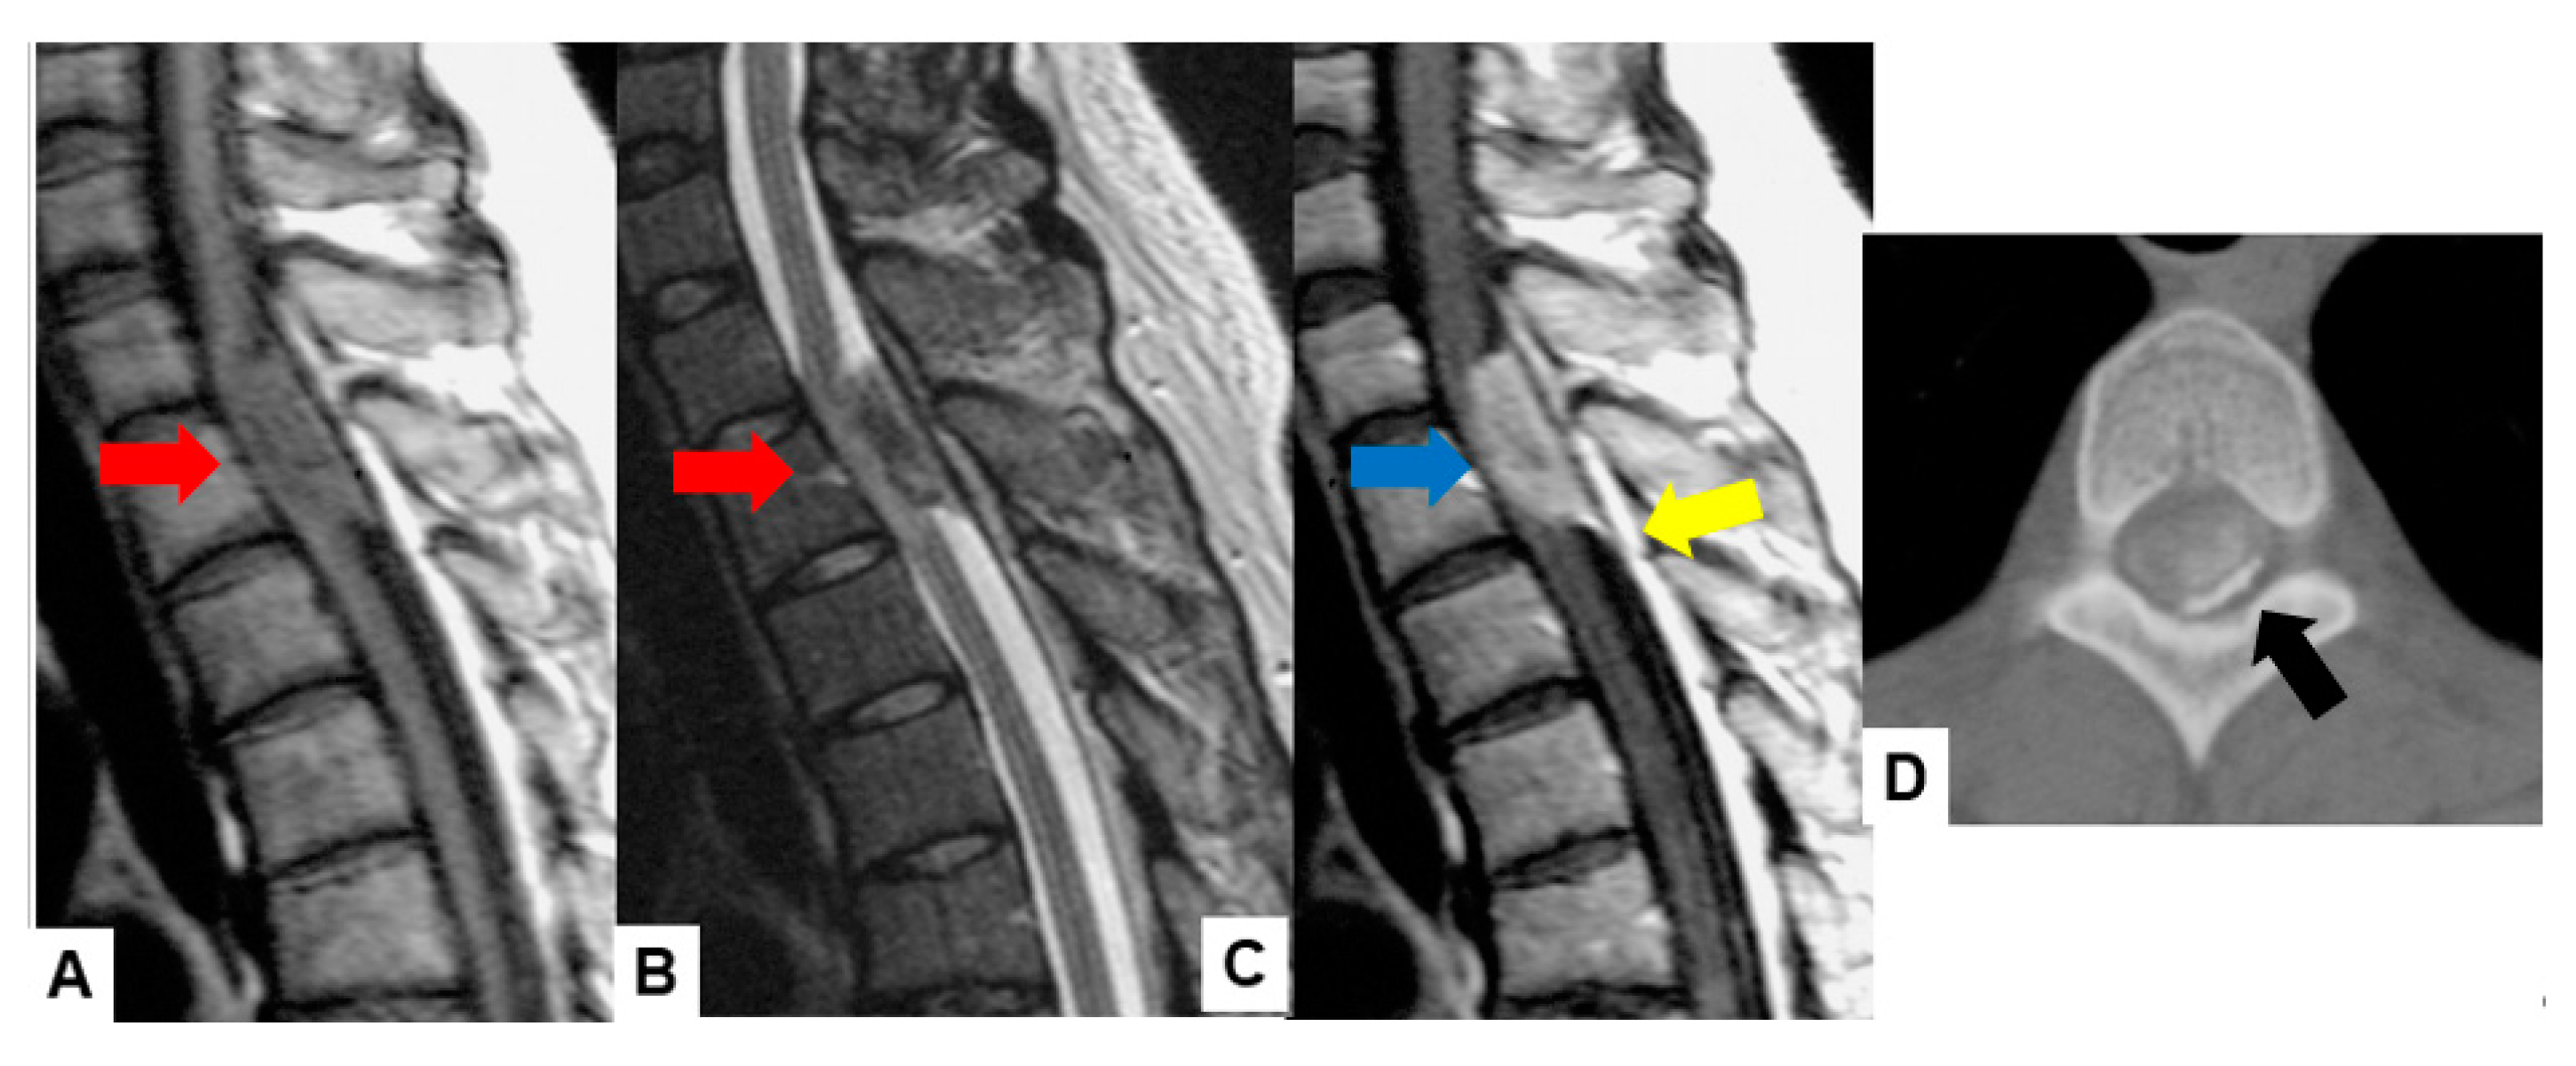
Figure 4.
68 F, Spinal meningioma, A: Enhanced T1 weighted midsagittal image, B: Enhanced T1 weighted axial image at T7/8, C: T2 weighted midsagittal image, D: T2 weighted axial image at T7/8, E: Midsagittal reconstruction CT, F: Axial CT at T7/8. A red arrow indicates tumor and a blue arrow shows tumor enhancement. The tumor is calcified (white arrows).
Characterization of IMSCTs involves distinguishing the tumor from surrounding edema or cavities, which provides crucial information about its position, size, and growth dynamics (Table 5 and Table 6). Addressing the challenges of manual segmentation, Lemay et al. developed an automated technique using a cascaded architecture based on U-Net models [35]. This approach simplifies the segmentation process into two phases of precise localization and labeling, improving the efficiency and accuracy of tumor identification.
Furthermore, the integration of emerging technologies like artificial intelligence (AI) and machine learning is poised to enhance diagnostic precision and accelerate treatment planning for IMSCTs [36]. The adoption of these technologies in clinical settings could transform diagnostic procedures, promoting earlier interventions and better patient outcomes for those with spinal cord tumors.
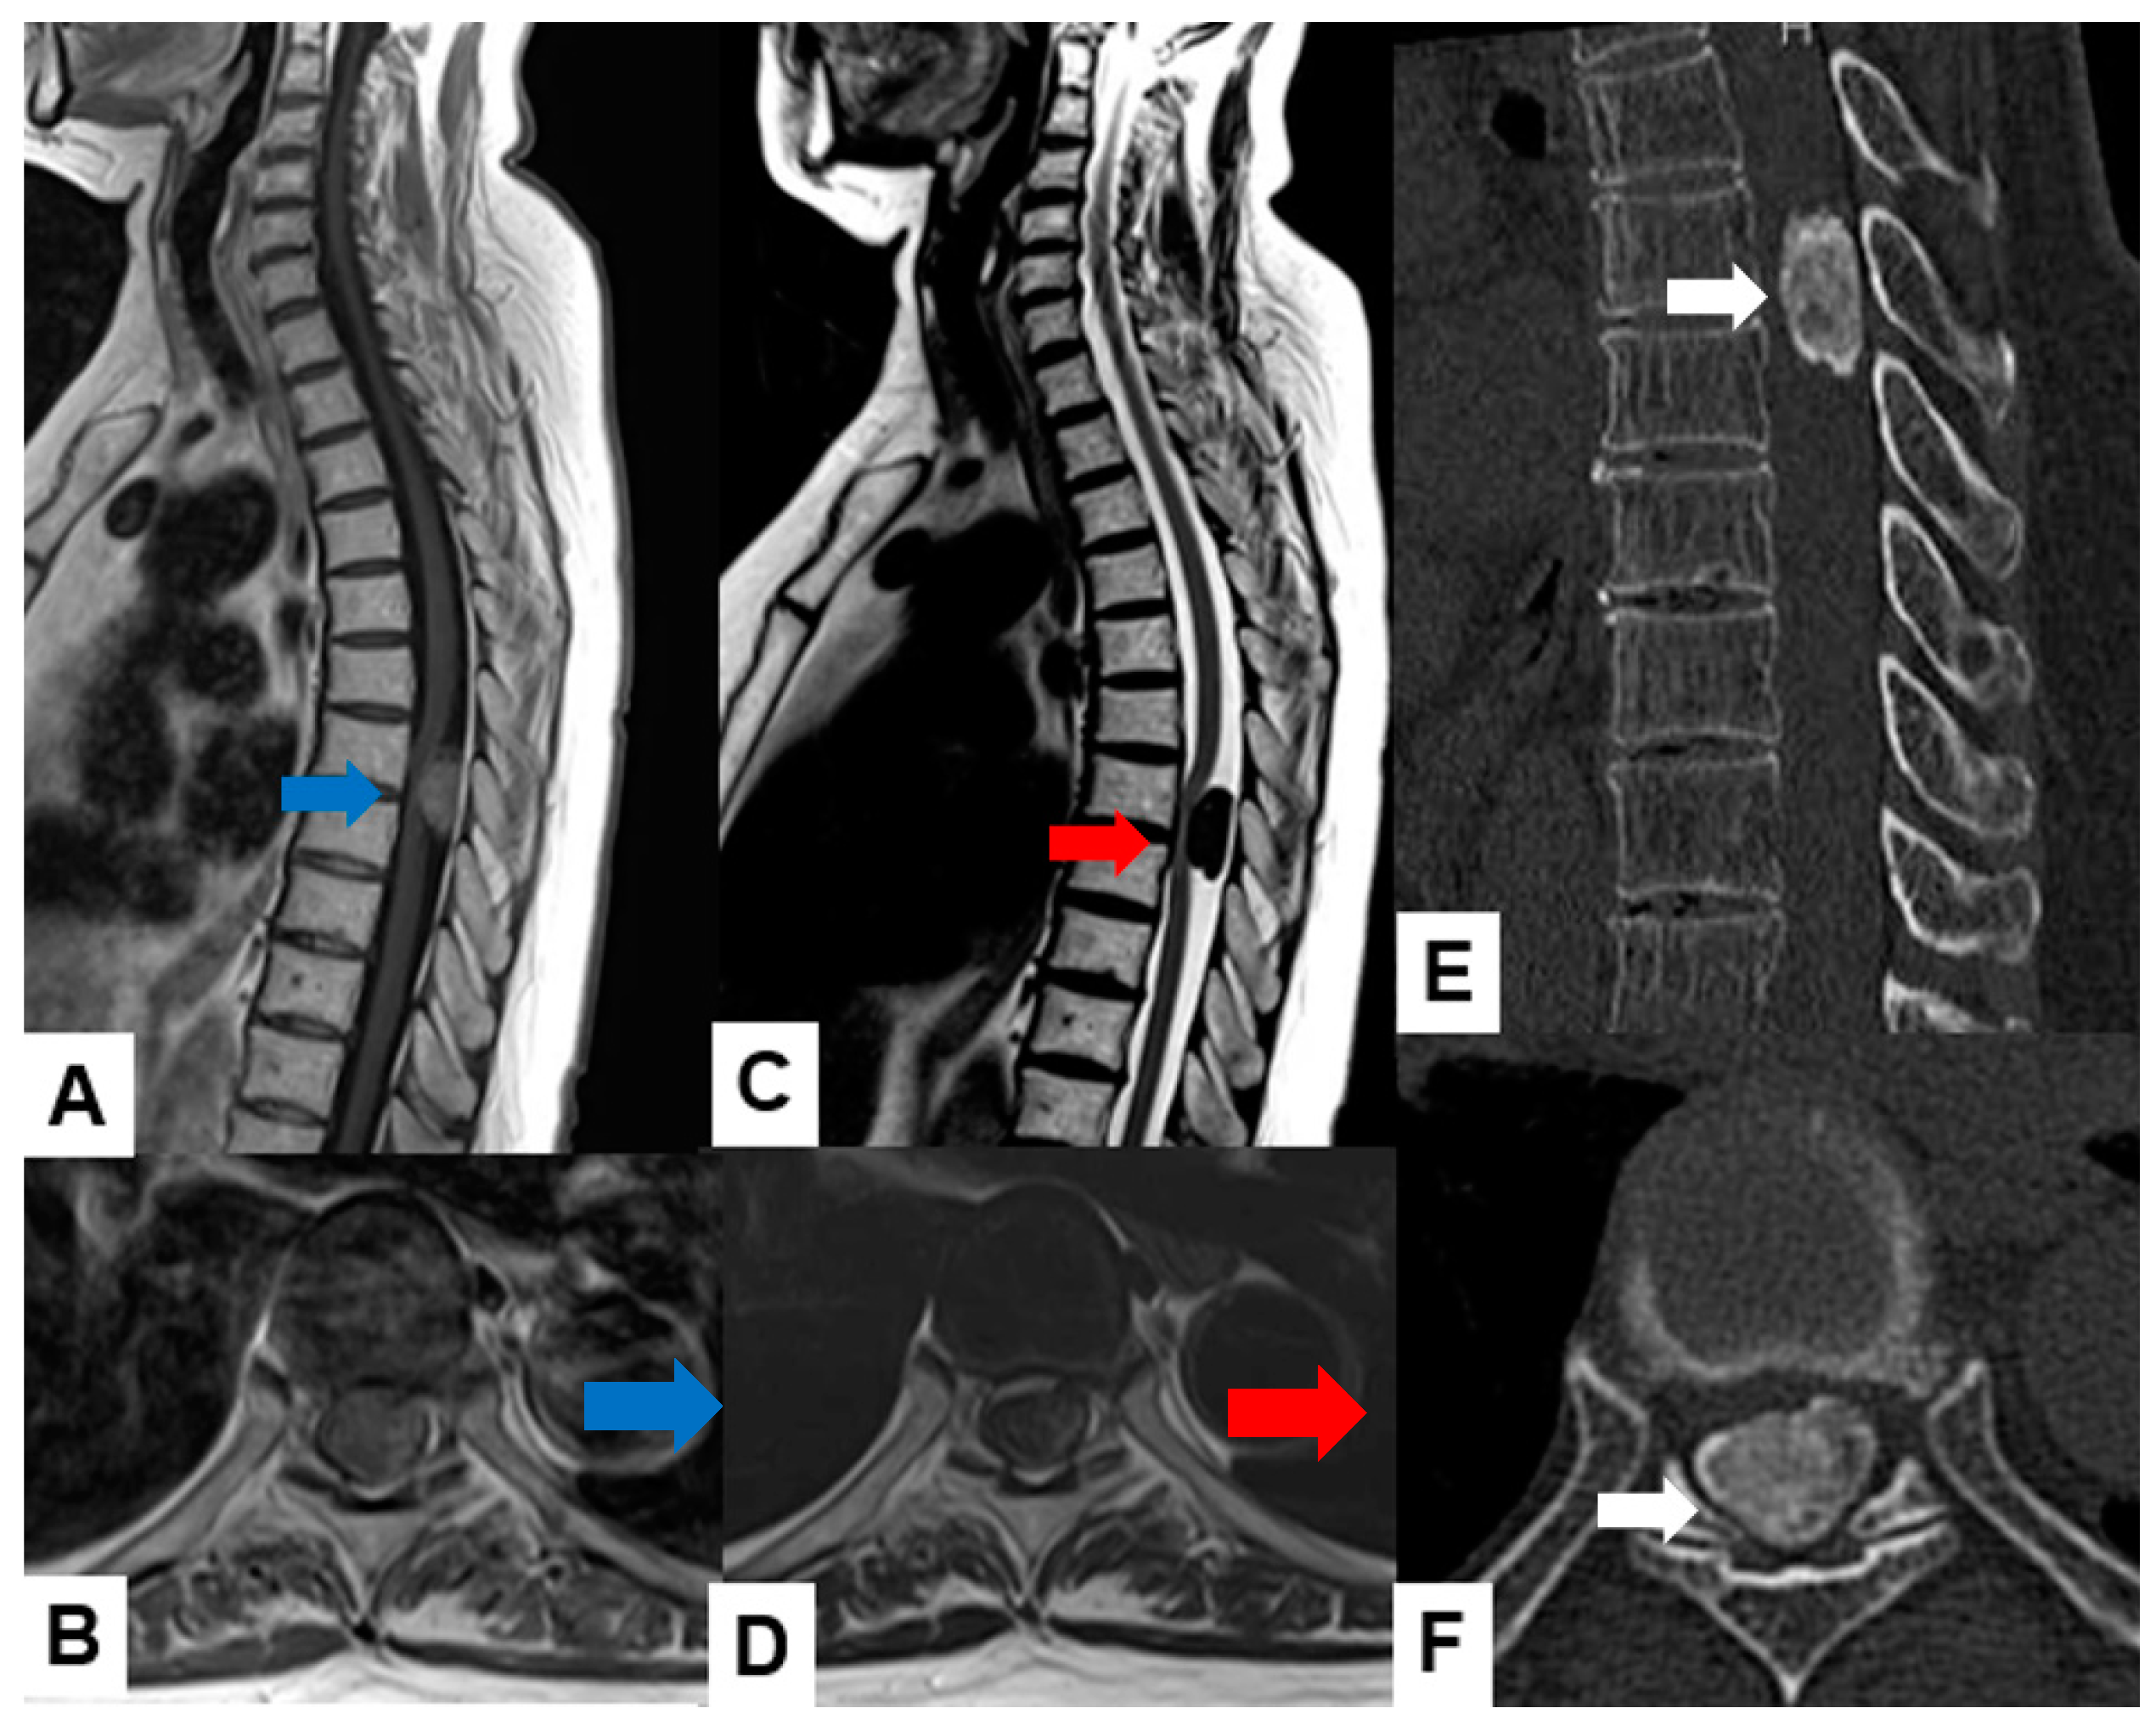
Astrocytoma: Pilocytic astrocytomas typically present as well-circumscribed intramedullary masses with cystic components. They exhibit mixed signal intensity on both T1-weighted and T2-weighted images (Figure 5), often with a mural nodule showing enhancement. High-grade astrocytomas, such as glioblastomas, demonstrate infiltrative growth, with ill-defined margins and heterogeneous enhancement. They may also show surrounding edema and mass effect on adjacent structures.
Ependymoma: Myxopapillary ependymomas typically appear as well-defined intradural extramedullary masses with heterogeneous signal intensity on T1-weighted images and hyperintensity on T2-weighted images (Figure 6). They often demonstrate avid contrast enhancement.
Hemangioblastoma: Hemangioblastomas usually appear as well-circumscribed intramedullary lesions with marked hypointensity on T1-weighted images and hyperintensity on T2-weighted images due to the presence of cystic components and vascularity. They typically demonstrate avid contrast enhancement (Figure 7).
Cavernous angioma: Cavernous angiomas present as well-circumscribed intramedullary lesions with mixed signal intensity on both T1-weighted and T2-weighted images (Figure 8), often showing characteristic “popcorn” appearance due to multiple blood-filled caverns. They may demonstrate variable enhancement patterns.
Metastasis: Metastatic spinal cord tumors often present as multiple intramedullary or intradural extramedullary lesions with variable signal intensity on both T1-weighted and T2-weighted images, depending on the primary tumor’s histology. They may demonstrate avid contrast enhancement and typically show associated vertebral body metastases.
2.2. Molecular and Genetic Profiling
Beyond diagnostic neuroradiology, molecular genomics is increasingly employed to decode the complexities of spinal cord tumors. Research, such as the work of Jung et al. analyzing clinical and radiological data to predict H3 K27M mutations, and Pandey et al. developing techniques to differentiate between driver and passenger mutations in glioblastoma, demonstrates the potential of these approaches [39,40]. These methods help prioritize essential mutations and inform the development of targeted treatments. The genetic and molecular characterization of spinal cord tumors, especially astrocytomas and ependymomas, is challenging due to their rarity and the difficulty in obtaining sufficient samples for thorough analysis compared to brain tumors. Nonetheless, recent progress has illuminated several common and distinct genetic features among these tumor types. For example, spinal ependymomas commonly show mutations in the NF2 gene, whereas spinal meningiomas often have chromosomal irregularities, including the loss of chromosome 22 [41,42]. Additionally, schwannomas and neurofibromas are tightly linked with genetic conditions such as neurofibromatosis type 1 (NF1) and NF2, with schwannomatosis emerging as a separate syndrome associated with SMARCB1 mutations [30,44]. These molecular insights are guiding the development of targeted treatments and personalized care strategies. Overall, molecular and genetic analysis is proving essential for enhancing the diagnosis and treatment of spinal cord tumors.
3. Current Treatment Strategies and Their Limitations
Following the confirmation of a positive diagnosis, the formulation of a therapeutic strategy is entrusted to a multidisciplinary tumor board, comprising experts from various specialized departments including oncology, neurosurgery, radiation oncology, medical oncology, neurology, radiology, pathology, rehabilitation medicine, palliative care, and genetics [23,45]. A diverse array of treatments exists for spine tumors, ranging from radiation therapy to extensive en bloc resection [15]. However, inherent limitations constrain their broad application and efficacy. In response, contemporary technological advancements, including nanotechnology, 3D printing, gene therapy, immunotherapy, and targeted therapy, coupled with novel surgical adjuncts and digital tools, are being increasingly integrated into spine tumor management to address the shortcomings associated with conventional treatment approaches.
3.1. Surgical Method
The primary treatment approach for spinal cord tumors is surgical excision, which should be incorporated into the diagnostic and therapeutic strategy outlined by the tumor board [23,46,47,48]. Surgery aims to achieve maximal resection while minimizing the risk of long-term neurological dysfunction.
Precise access to intramedullary tumors is determined through careful evaluation of diagnostic imaging prior to surgery. Recent advancements in mixed reality (MR) technology, utilizing head-mounted displays (HMDs), enable surgeons to visualize stereoscopic images in 3D [49,50]. MR systems have demonstrated effectiveness in tumor removal by providing surgeons with enhanced visualization of vital structures, such as hidden blood vessels within the surgical field [51,52]. Moreover, utilizing HMDs to view spinal cord tumors in 3D enables surgeons to intuitively comprehend the tumor’s location, facilitating preoperative planning of decompression methods and laminectomy sites [53].
Intraoperative ultrasonography (IOUS) is employed during surgeries for spinal intradural mass lesions to limit the extent of exposure, affecting not just dural incision and myelotomy but also bony exposure [54]. IOUS is capable of evaluating all types of mass lesions and can predict surgical outcomes. It enables the visualization of nerve rootlets and dentate ligaments, aiding in the mobilization of neural structures, particularly in cases with primarily anterior lesions. In situations involving highly infiltrative lesions where the tumor appears isoechoic to the spinal cord, making the tumor-myelin interface indistinct, IOUS proves invaluable in guiding surgical decisions [55]. However, the tool has its limitations, such as the size of the ultrasound probe tip (1 x 3.5 cm) sometimes exceeding the surgical field, difficulty in visualizing parenchyma during heavy bleeding, as well as during the use of excessive hemostatic material, which appears highly hyperechoic [56].
The reliability of matching pathologic findings from frozen biopsies of spinal cord tumors with the final diagnosis remains controversial [57]. Consequently, reliance solely on frozen section results for surgical planning is inadequate; a comprehensive approach incorporating multiple factors—clinical characteristics, preoperative imaging, frozen-section diagnosis, and intraoperative tumor plane—is essential. Despite advancements in software [58], intraoperative ultrasound [59,60], and corrections made by intraoperative MRI [61], current technologies still fail to deliver the needed accuracy for consistent, precise, and extensive tumor resection [62,63]. New technologies are emerging that enable accurate visualization of brain tumors and even residual tumor cells using fluorescent markers.
5-Aminolevulinic acid (5-ALA) is a prodrug that accumulates in tumor cells, which convert it into protoporphyrin IX, a fluorescent compound [64,65]. This fluorescence allows surgeons to better visualize and distinguish tumor tissue from normal spinal cord tissue during surgery [66]. The benefits of using 5-ALA in spinal cord tumor surgery include enhanced visualization, which aids in maximal tumor removal, a reduced risk of neurological damage, and the potential for better patient outcomes such as lower recurrence rates and improved quality of life. However, challenges include the possibility that not all tumor cells may fluoresce, variable sensitivity and specificity of the fluorescence, and the need for specialized training and experience for surgeons [67]. Current studies focus on improving the sensitivity and specificity of fluorescence, exploring its utility in different types of spinal tumors, and integrating it with other surgical technologies like intraoperative MRI and robotics.
The choice of surgical approach is straightforward, aiming for the shortest route to the tumor, given the absence of non-eloquent neural tissues within the spinal cord parenchyma. The three primary surgical accesses include the posterior median sulcus approach, the posterolateral sulcus approach, and the lateral direct subpial approach [68]. A posterior median sulcus approach is commonly used for most gliomas, including ependymomas and astrocytomas, while a lateral myelotomy is more appropriate for vascular tumors like hemangioblastomas or cavernous malformations, where the lesion is visible under microscopic examination [69,70,71].
During surgery, the exposure is widened to fully reveal the intraparenchymal lesion, and a careful dissection plane is established between the tumor and the healthy spinal cord tissue. Typically, the tumor's caudal and rostral boundaries are identified by cystic formations; ependymomas manifest as encapsulated, brownish-red, sausage-shaped tumors, whereas astrocytomas appear as vague, whitish swellings accompanied by cysts.
Ependymomas display a red or dark gray coloration with distinct margins from the surrounding spinal cord tissue, allowing for precise separation along the craniocaudal axis before complete excision. These tumors commonly adhere ventrally to small vessels passing through the anterior median raphe, necessitating careful preservation of the anterior spinal artery [68,72,73,74]. Unlike ependymomas, astrocytomas typically lack a clear boundary between the tumor and spinal cord. Removal of these tumors often involves piecemeal excision, beginning with internal decompression and progressing outward to define the tumor–cord interface [75]. Hemangioblastomas, which are subpial and highly vascular, contain small arterial feeders that end within the tumor. These are excised en bloc by coagulating the feeder vessels near the tumor's surface [76].
Once the interface between the tumor and spinal cord is established, the tumor can be carefully debulked using gentle dissection or ultrasonic cavitation to reduce manipulation of the spinal cord. Nonetheless, achieving a complete resection of benign tumors without causing neurological damage is challenging, especially when the tumor–spinal cord interface is not clearly defined [75].
Intraoperative neuromonitoring plays a vital role in surgical resections. Its outstanding predictive capabilities regarding functional outcomes have established it as an essential tool in all spinal cord tumor surgeries. Mehta et al. demonstrated that dorsal column dysfunction occurred in just 9% of patients monitored with SSEP, compared to 50% in those without SSEP monitoring [77].
3.2. Radiotherapy
Radiotherapy is typically reserved for situations where en bloc resection is unfeasible. Traditionally, high doses of radiation (40–60 Gy) were required, leading to a high incidence of complications due to the proximity of the spinal cord and thoraco-abdominal organs, including radiation myelopathy and various issues affecting gastrointestinal and reproductive health—hormonal imbalances, reduced fertility, uterine dysfunction, miscarriage, preterm labor, low birth weight, and placental abnormalities [39,40,78]. However, with the advent of intensity-modulated radiation therapy and stereotactic radiosurgery, it's now possible to deliver high radiation doses directly to the spinal region while sharply reducing exposure to surrounding areas, thereby minimizing the side effects typical of conventional radiation treatments [79,80].
According to a study by Shin et al., stereotactic radiosurgery (SRS) proves to be an effective treatment for benign neurogenic tumors, though malignant spinal neurogenic tumors (MPNSTs) exhibit variable responses to SRS [81]. Other case series have similarly reported excellent rates of local control with minimal neurotoxicity [82,83]. Thus, while surgical removal continues to be the preferred treatment for most intradural tumors, radiosurgery emerges as a viable alternative, particularly for recurrent, residual, or multiple lesions (such as in familial phakomatoses), or when surgical intervention is contraindicated or ill-advised due to patient comorbidities or poor health [83].
3.3. Systemic Therapy
Chemotherapy, specifically temozolomide, an oral alkylating agent, has a restricted role in treating spinal cord astrocytomas compared to its significant effectiveness against intracranial astrocytomas [84,85]. Studies have shown only a partial response to temozolomide in both low-grade and high-grade spinal cord astrocytomas [86,87,88]. Additionally, pediatric patients with low-grade astrocytomas who received adjuvant radiation therapy and chemotherapy after subtotal resection exhibited longer survival compared to those who had only a subtotal resection, though not as prolonged as those who underwent en bloc resection [89]. A single study suggested that etoposide might benefit patients with recurrent spinal cord ependymomas, but more evidence is needed to support this finding [90]. Targeted therapies for ependymomas are under investigation; for instance, Imatinib showed promise in a case of recurrent spinal cord ependymoma with overexpressed platelet-derived growth factor (PDGF), though such overexpression is not universally present [91]. Bevacizumab has been noted to reduce the size of cystic spinal cord ependymomas in NF2 patients, with clinical improvement observed in 58% of cases [92].
Medical therapy trials for NF2-related schwannomas have had limited success, particularly with agents targeting epidermal growth factor receptor (EGFR) activity. Lapatinib, a selective EGFR inhibitor, showed some efficacy in ependymomas, although follow-up outcomes have been inconsistent [93,94,95].However, despite their potential to curb tumor growth, chemotherapeutic agents must be administered at high systemic doses to achieve effective concentrations at tumor sites, adversely affecting normal tissue health and leading to side effects such as neurotoxicity, kidney toxicity, and cardiac toxicity.
4. Emerging Treatment Strategies
4.1. Immunotherapy
Immunotherapeutic strategies focus on activating the patient’s immune system to target and destroy cancer cells, preventing them from evading or reaching a balance with the immune system [22,39]. Current leading immunotherapy treatments for glioma include checkpoint inhibitors, cancer vaccines, and chimeric antigen receptor T cells (CAR-T cells). Notably, CAR-T cell therapy involves modifying allogeneic or autologous T cells in vitro to carry CAR molecules on their membranes [96]. These modified T cells are reintroduced into the patient’s body to target and destroy tumor cells that express the specific antigen. There is growing interest in applying immunotherapy to gliomas, with developments in immune checkpoint inhibitors, CAR-T therapy, and vaccine-based strategies. Nevertheless, challenges such as the rarity of spinal cord gliomas, limited antigens for targeting, obstacles in crossing the blood-spinal cord barrier, the immunosuppressive tumor microenvironment of the spinal cord, and potential neurotoxic side effects impede the use of immunotherapy in these cases [22]. Furthermore, immune checkpoint inhibitors can lead to autoimmune diseases and, in severe cases, death [97].
4.2. Neural Stem Cells
Neural stem cells (NSCs) are pluripotent cells with the capability to develop into either gliogenic or neurogenic lineages [98]. A notable characteristic of NSCs is their inherent tropism for tumors in vivo, which positions them as excellent vehicles for targeted cancer therapies [99,100]. One innovative approach involves engineering NSCs to produce an enzyme that activates a harmless prodrug, which then transforms into a potent chemotherapeutic agent near the tumor cells [101]. This strategy has shown potential, particularly in initial studies where NSCs were modified to express cytosine deaminase. This enzyme converts the prodrug 5-FC into the active chemotherapeutic, 5-fluorouracil, effectively targeting and reducing tumor size in glioblastoma models in rodents through a bystander effect [99]. Further research includes a dual-gene strategy where NSCs are engineered to express both cytosine deaminase and thymidine kinase, the latter converting the prodrug ganciclovir into the oncolytic agent ganciclovir triphosphate, enhancing the therapeutic impact [102].
4.3. Cancer Vaccine
Cancer vaccines are formulated from antigens that are predominantly expressed on specific cancer cells [103]. These antigens provoke an immune response aimed at selectively eliminating the targeted tumor. Presently, there are five types of antitumor vaccine therapies, with peptide vaccines and dendritic cell (DC) vaccines being the two primary approaches [104,105]. Peptide vaccines for glioma are composed of 8-30 amino acids and originate from tumor-associated antigens like IL13Rα2, or tumor-specific antigens such as isocitrate dehydrogenase (IDH)-1(R132H) and EGFRvIII [100,102]. Conversely, autologous dendritic cell vaccines are developed ex-vivo by culturing CD14+ monocytes with IL-4 and granulocyte-macrophage colony-stimulating factor (GM-CSF) [106]. These vaccines are then primed with tumor-specific antigens before being reintroduced into the patient. Several phase I and II clinical trials have documented the safety and effectiveness of DC vaccines in treating high-grade gliomas [107,108,109,110].
4.4. Tumor-Targeted Therapies (Nanotechnology)
Investigations into the local environment of neoplastic diseases have led to the discovery and detailed study of the tumor microenvironment (TME), enhancing our understanding of cancer progression, and fostering the development of more targeted therapies. Recent advancements include the development of several nano formulations aimed at delivering targeted therapies specifically for spinal cord tumors and spinal metastases. A notable study by Yan et al. [111] involved a novel bone-targeted protein nanomedicine that combines saporin with a boronated polymer, encapsulated in an anionic poly(aspartic acid) layer. In mouse models, these nanoparticles accumulated in the bone and released saporin in response to the acidic tumor environment, effectively inactivating ribosomes and inducing cancer cell death.
For intramedullary spinal cord tumors (IMSCTs), Kheirkhah et al. [112] have developed magnetic nanoparticles loaded with doxorubicin, showing targeted delivery, and localized chemotherapeutic-induced apoptosis in cancer cells, marking them as promising for tumor treatment. Furthermore, Ahmadi et al. [113] have explored an advanced anticancer formulation using methotrexate encapsulated in a smart nanocarrier featuring a magnetic core and a polymeric shell with cationic properties, tested against the Saos-2 human osteosarcoma cell line. Huang et al. [114] have engineered nanoparticles that merge the benefits of exosomes with lncRNA MEG3 to target four human osteosarcoma cell lines, including MNNG/HOS, U2OS, MG63, and SaOS-2, showcasing another innovative approach to cancer treatment.
5. Conclusions
Spinal cord tumors are a rare and complex group of neoplasms that can be challenging to diagnose and treat. This review article discusses the current state of knowledge on spinal cord tumors, including their classification, diagnosis, treatment, and emerging therapeutic strategies. The article highlights the importance of a multidisciplinary approach to care, which involves neurosurgeons, radiation oncologists, medical oncologists, neurologists, radiologists, pathologists, rehabilitation specialists, and palliative care physicians. Current treatment strategies for spinal cord tumors include surgery, radiation therapy, and chemotherapy. However, these treatments can be limited by their side effects and the difficulty of targeting tumors in the spinal cord. Emerging therapeutic strategies, such as immunotherapy, neural stem cell therapy, cancer vaccines, and tumor-targeted therapies, offer promise for improving the outcomes of patients with spinal cord tumors.
Author Contributions
Conceptualization, M.T. and I.D.; methodology, Y.T.; resources, T.T.; data curation, A.O.P.F. , S.A.; T.K. and D.Y; writing—original draft preparation, C.K.; writing—review and editing, D.Y.; M.J.
Funding
This research received no external funding.
Institutional Review Board Statement
The study was conducted in accordance with the Declaration of Helsinki, and approved by the Institutional Review Board of Okayama Rosai Hospital (protocol code 498, May 14th, 2024).
Informed Consent Statement
Informed consent was obtained from all subjects involved in the study.
Data Availability Statement
The data presented in this study are available in the article.
Acknowledgments
: This study was supported by Okayama Spine Group.
Conflicts of Interest
The authors declare no conflicts of interest.
References
- Grimm, S.; Chamberlain, M.C. Adult primary spinal cord tumors. Expert Rev. Neurother. 2009, 9, 1487–1495. [Google Scholar] [CrossRef]
- Tobin, M.K.; Geraghty, J.R.; Engelhard, H.H.; Linninger, A.A.; Mehta, A.I. Intramedullary spinal cord tumors: A review of current and future treatment strategies. Neurosurg. Focus 2015, 39, E14. [Google Scholar] [CrossRef]
- Toniutti, M.; Sasso, A.L.; Carai, A.; Colafati, G.S.; Piccirilli, E.; Del Baldo, G.; Mastronuzzi, A. Central nervous system tumours in neonates: what should the neonatologist know? Eur J Pediatr. 2024, 183, 1485–1497. [Google Scholar] [CrossRef] [PubMed]
- Raco, A.; Esposito, V.; Lenzi, J.; Piccirilli, M.; Delfini, R.; Cantore, G. Long- term follow-up of intramedullary spinal cord tumors: a series of 202 cases. Neurosurgery 2005, 56, 972–981. [Google Scholar]
- Parsa, A.T.; Lee, J.; Parney, I.F.; Weinstein, P.; McCormick, P.C.; Ames, C. Spinal cord and intradural-extraparenchymal spinal tumors: current best care practices and strategies. J. Neurooncol. 2004, 69, 291–318. [Google Scholar] [CrossRef]
- Beall DP, Googe DJ, Emery RL, Thompson DB, Campbell SE, Ly JQ, et al. Extramedullary intradural spinal tumors: a pictorial review. Curr Probl Diagn Radiol. 2007, 36, 185–198. [CrossRef]
- Ciftdemir, M.; Kaya, M.; Selcuk, E.; Yalniz, E. Tumors of the spine. World J Orthop. 2016, 7, 109–16. [Google Scholar] [CrossRef] [PubMed]
- Das, J.M.; Hoang, S.; Mesfin, F.B. Intramedullary spinal cord tumors. StatPearls Treasure Island: StatPearls Publishing LLC; 2022.
- Arnautovic, K.; Arnautovic, A. Extramedullary intradural spinal tumors: a review of modern diagnostic and treatment options and a report of a series. Bosn J Basic Med Sci. 2009, 9, 40–5. [Google Scholar] [CrossRef] [PubMed]
- 10. Chamberlain MC, Tredway TL. Adult primary intradural spinal cord tumors: a review. Curr Neurol Neurosci Rep. 2011, 11, 320–328. [CrossRef]
- Duong, L.M.; McCarthy, B.J.; McLendon, R.E.; Dolecek, T.A.; Kruchko, C.; Douglas, L.L.; Ajani, U.A. Descriptive epidemiology of malignant and nonmalignant primary spinal cord, spinal meninges, and cauda equina tumors, United States, 2004–2007. Cancer. 2012, 118, 4220–4227. [Google Scholar] [CrossRef]
- Milano, M.T.; Johnson, M.D.; Sul, J.; Mohile, N.A.; Korones, D.N.; Okunieff, P.; Walter, K.A. Primary spinal cord glioma: a surveillance, epidemiology, and end results database study. J Neurooncol. 2010, 98, 83–92. [Google Scholar] [CrossRef]
- Cristante, L.; Herrmann, H.D. Surgical management of intramedullary spinal cord tumors: functional outcome and sources of morbidity. Neurosurgery. 1994, 35, 69–74. [Google Scholar] [CrossRef]
- Epstein, F.J.; Farmer, J.P.; Freed, D. Adult intramedullary astrocytomas of the spinal cord. J Neurosurg. 1992, 77, 355–359. [Google Scholar] [CrossRef]
- David N Louis, Arie Perry, Pieter Wesseling, Daniel J Brat, Ian A Cree, Dominique Figarella-Branger, Cynthia Hawkins, H K Ng, Stefan M Pfister, Guido Reifenberger, Riccardo Soffietti, Andreas von Deimling, David W Ellison, The 2021 WHO Classification of Tumors of the Central Nervous System: a summary, Neuro-Oncology, 2021, Volume 23, Issue 8, Pages 1231–1251. [CrossRef]
- Porras, J.L.; Pennington, Z.; Hung, B.; Hersh, A.; Schilling, A.; Goodwin, C.R.; Sciubba, D.M. Radiotherapy and Surgical Advances in the Treatment of Metastatic Spine Tumors: A Narrative Review. World Neurosurg. 2021; 151, 147–154. [CrossRef]
- Elsberg, C.A. Some aspects of the diagnosis and surgical treatment of tumors of the spinal cord: With a study of the end results in a series of 119 operations. Ann Surg. 1925, 81, 1057–73. [Google Scholar] [CrossRef]
- Swartz, A.M.; Shen, S.H.; Salgado, M.A.; Congdon, K.L.; Sanchez-Perez, L. Promising vaccines for treating glioblastoma. Expert Opin Biol Ther 2018, 18, 1159–70. [Google Scholar] [CrossRef]
- Berger, M.S.; Prados, M. Textbook of neuro-oncology, 2025, 1st ed. Philadelphia, PA: Elsevier Saunders.
- Hu, J.; Liu, T.; Han, B.; Tan, S.; Guo, H.; Xin, Y. A Potential Approach for High-Grade Spinal Cord Astrocytomas. Front Immunol. 2021, 11, 582828. [Google Scholar] [CrossRef] [PubMed] [PubMed Central]
- Sumdani, H.; Aguilar-Salinas, P.; Avila, M.J.; Barber, S.R.; Dumont, T. Utility of Augmented Reality and Virtual Reality in Spine Surgery: A Systematic Review of the Literature. World Neurosurg. 2022, 161, e8–e17. [Google Scholar] [CrossRef]
- Grady, C.; Melnick, K.; Porche, K.; Dastmalchi, F.; Hoh, D.J.; Rahman, M.; Ghiaseddin, A. Glioma immunotherapy: Advances and challenges for spinal cord gliomas. Neurospine. 2022, 19, 13. [Google Scholar] [CrossRef]
- Missenard, G.; Bouthors, C.; Fadel, E.; Court, C. Surgical strategies for primary malignant tumors of the thoracic and lumbar spine. Orthop. Traumatol. Surg. Res. 2020, 106, S53–S62. [Google Scholar] [CrossRef] [PubMed]
- Apostolov, G.; Kehayov, I.; Kitov, B. Clinical aspects of spinal meningiomas: a review. Folia Med (Plovdiv). 2021, 63, 24–9. [Google Scholar] [CrossRef] [PubMed]
- Koeller, K.K.; Shih, R.Y. Intradural extramedullary spinal neoplasms: radiologic-pathologic correlation. Radiographics. 2019, 39, 468–90. [Google Scholar] [CrossRef]
- Villanueva-Castro, E.; Meraz-Soto, J.M.; Hernández-Dehesa, I.A.; Tena-Suck, M.L.; Hernández-Reséndiz, R.; Mateo-Nouel, E.J.; Ponce-Gómez, J.A.; Arriada-Mendicoa, J.N. Spinal Ependymomas: An Updated WHO Classification and a Narrative Review. Cureus. 2023 Nov 20;15:e49086. [CrossRef]
- Lee, C.S.; Jung, C.H. Metastatic spinal tumor. Asian Spine J. 2012, 6, 71–87. [Google Scholar] [CrossRef]
- Maclean, F.M.; Soo, M.Y.; Ng, T. Chordoma: radiological-pathological correlation. Australas Radiol. 2005, 49, 261–8. [Google Scholar] [CrossRef]
- Thippeswamy, P.B.; Soundararajan, D.C.R.; Kanna, R.M.; Kuna, V.S.; Rajasekaran, S. Sporadic Intradural Extramedullary Hemangioblastoma of Cauda Equina with Large Peritumoral Cyst-A Rare Presentation. Indian J Radiol Imaging. 2022, 31, 1057–1061. [Google Scholar] [CrossRef]
- Ohmura, K.; Tomita, H.; Hara, A. Peritumoral Edema in Gliomas: A Review of Mechanisms and Management. Biomedicines 2023, 11, 2731. [Google Scholar] [CrossRef]
- Zulfiqar, M.; Dumrongpisutikul, N.; Intrapiromkul, J.; Yousem, D.M. Detection of intratumoral calcification in oligodendrogliomas by susceptibility-weighted MR imaging. Am J Neuroradiol. 2012, 33, 858–64. [Google Scholar] [CrossRef]
- Bönig, L.; Möhn, N.; Ahlbrecht, J.; Wurster, U.; Raab, P.; Puppe, W.; Sühs, K.W.; Stangel, M.; Skripuletz, T.; Schwenkenbecher, P. Leptomeningeal Metastasis: The Role of Cerebrospinal Fluid Diagnostics. Front Neurol. 2019, 10, 839. [Google Scholar] [CrossRef]
- Abdel Razek, A.A.K.; Gamaleldin, O.A.; Elsebaie, N.A. Peripheral Nerve Sheath Tumors of Head and Neck: Imaging-Based Review of World Health Organization Classification. J Comput Assist Tomogr. 2020, 44, 928–940. [Google Scholar] [CrossRef]
- Eraky, A.M.; Beck, R.T.; Treffy, R.W.; Aaronson, D.M.; Hedayat, H. Role of Advanced MR Imaging in Diagnosis of Neurological Malignancies: Current Status and Future Perspective. J Integr Neurosci. 2023, 22, 73. [Google Scholar] [CrossRef] [PubMed]
- Lemay, A.; Gros, C.; Zhuo, Z.; Zhang, J.; Duan, Y.; Cohen-Adad, J.; Liu, Y. Automatic multiclass intramedullary spinal cord tumor segmentation on MRI with deep learning. Neuroimage Clin. 2021, 31, 102766. [Google Scholar] [CrossRef] [PubMed]
- Bhardwaj, A. Promise and Provisos of Artificial Intelligence and Machine Learning in Healthcare. J Healthc Leadersh. 2022, 14, 113–118. [Google Scholar] [CrossRef] [PubMed]
- Tobin, M.K.; Geraghty, J.R.; Engelhard, H.H.; Linninger, A.A.; Mehta, A.I. Intramedullary spinal cord tumors: a review of current and future treatment strategies. Neurosurg Focus. 2015, 39, E14. [Google Scholar] [CrossRef]
- Jallo, G.I.; Freed, D.; Epstein, F. Intramedullary spinal cord tumors in children. Childs Nerv Syst. 2003, 19, 641–9. [Google Scholar] [CrossRef] [PubMed]
- Jung, J.S.; Choi, Y.S.; Ahn, S.S.; Yi, S.; Kim, S.H.; Lee, S.K. Differentiation between spinal cord diffuse midline glioma with histone H3 K27M mutation and wild type: Comparative magnetic resonance imaging. Neuroradiology 2019, 61, 313–322. [Google Scholar] [CrossRef] [PubMed]
- Pandey, M.; Anoosha, P.; Yesudhas, D.; Gromiha, M.M. Identification of potential driver mutations in glioblastoma using machine learning. Brief Bioinform. 2022, 23, bbac451. [Google Scholar] [CrossRef] [PubMed]
- Louis, D.N.; Perry, A.; Reifenberger, G.; von Deimling, A.; Figarella-Branger, D.; Cavenee, W.K.; Ohgaki, H.; Wiestler, O.D.; Kleihues, P.; Ellison, D.W. The 2016 World Health Organization Classification of Tumors of the Central Nervous System: a summary. Acta Neuropathol. 2016, 131, 803–20. [Google Scholar] [CrossRef] [PubMed]
- Ebert, C.; von Haken, M.; Meyer-Puttlitz, B.; Wiestler, O.D.; Reifenberger, G.; Pietsch, T.; von Deimling, A. Molecular genetic analysis of ependymal tumors. NF2 mutations and chromosome 22q loss occur preferentially in intramedullary spinal ependymomas. Am J Pathol. 1999, 155, 627–32. [Google Scholar] [CrossRef] [PubMed]
- Dang, D.D.; Mugge, L.A.; Awan, O.K.; Gong, A.D.; Fanous, A.A. Spinal Meningiomas: A Comprehensive Review and Update on Advancements in Molecular Characterization, Diagnostics, Surgical Approach and Technology, and Alternative Therapies. Cancers (Basel). 2024, 16, 1426. [Google Scholar] [CrossRef] [PubMed]
- Sestini, R.; Bacci, C.; Provenzano, A.; Genuardi, M.; Papi, L. Evidence of a four-hit mechanism involving SMARCB1 and NF2 in schwannomatosis-associated schwannomas. Hum Mutat. 2008, 29, 227–31. [Google Scholar] [CrossRef]
- Anwar M.A.; El-Baba C.; Elnaggar M.H.; Elkholy Y.O.; Mottawea M.; Johar D.; Al Shehabi T.S.; Kobeissy F.; Moussalem C.; Massaad E.; Omeis I, Darwiche N, Eid AH. Novel therapeutic strategies for spinal osteosarcomas. Semin. Cancer Biol. 2020, 64, 83–92. [CrossRef]
- Ottenhausen, M.; Ntoulias, G.; Bodhinayake, I.; Ruppert, F.-H.; Schreiber, S.; Förschler, A.; Boockvar, J.A.; Jödicke, A. Intradural spinal tumors in adults—Update on management and outcome. Neurosurg. Rev. 2019, 42, 371–388. [Google Scholar] [CrossRef] [PubMed]
- Vuong, H.G.; Dunn, I.F. Chondrosarcoma and Chordoma of the Skull Base and Spine: Implication of Tumor Location on Patient Survival. World Neurosurg. 2022, 162, e635–e639. [Google Scholar] [CrossRef] [PubMed]
- Ahangar, P.; Akoury, E.; Ramirez Garcia Luna, A.S.; Nour, A.; Weber, M.H.; Rosenzweig, D.H. Nanoporous 3D-Printed Scaffolds for Local Doxorubicin Delivery in Bone Metastases Secondary to Prostate Cancer. Materials. 2018, 11, 1485. [Google Scholar] [CrossRef]
- Aoyama, R.; Anazawa, U.; Hotta, H.; Watanabe, I.; Takahashi, Y.; Matsumoto, S. The utility of augmented reality in spinal decompression surgery using CT/MRI fusion image. Cureus. 2021, 13, :e18187. [CrossRef]
- Burström, G.; Persson, O.; Edström, E.; Elmi-Terander, A. Augmented reality navigation in spine surgery: a systematic review. Acta Neurochir (Wien) 2021, 163, 843–852. [Google Scholar] [CrossRef] [PubMed]
- Jud, L.; Fotouhi, J.; Andronic, O.; Aichmair, A.; Osgood, G.; Navab, N.; Farshad, M. Applicability of augmented reality in orthopedic surgery - a systematic review. BMC Musculoskelet Disord. 2020, 21, 103. [Google Scholar] [CrossRef] [PubMed]
- Sugahara, K.; Koyachi, M.; Koyama, Y.; Sugimoto, M.; Matsunaga, S.; Odaka, K.; Abe, S.; Katakura, A. Mixed reality and three dimensional printed models for resection of maxillary tumor: a case report. Quant Imaging Med Surg. 2021, 11, 2187–2194. [Google Scholar] [CrossRef] [PubMed]
- Aoyama, R.; Anazawa, U.; Hotta, H.; Watanabe, I.; Takahashi, Y.; Matsumoto, S. A Novel Technique of Mixed Reality Systems in the Treatment of Spinal Cord Tumors. Cureus. 2022, 14, e23096. [Google Scholar] [CrossRef]
- Elmesallamy, W.A.E.A.; Yakout, H.; Hassanen, S.; Elshekh, M. The role of intraoperative ultrasound in management of spinal intradural mass lesions and outcome. Egypt J Neurosurg, 2023. [Google Scholar] [CrossRef]
- Prada, F.; Vetrano, I.G.; Filippini, A.; Del Bene, M.; Perin, A.; Casali, C.; Legnani, F.; Saini, M.; DiMeco, F. Intraoperative ultrasound in spinal tumor surgery. J Ultrasound. 2014, 17, 195–202. [Google Scholar] [CrossRef] [PubMed]
- Selbekk, T.; Jakola, A.S.; Solheim, O.; Johansen, T.F.; Lindseth, F.; Reinertsen, I.; Unsgård, G. Ultrasound imaging in neurosurgery: approaches to minimize surgically induced image artefacts for improved resection control. Acta Neurochir (Wien) 2013, 155, 973–980. [Google Scholar] [CrossRef]
- Chang, K.W.; Noh, S.H.; Park, J.Y.; Cho, Y.E.; Chin, D.K. Retrospective Study on Accuracy of Intraoperative Frozen Section Biopsy in Spinal Tumors. World Neurosurg. 2019, 129, e152–e157. [Google Scholar] [CrossRef]
- Roberts, D.W.; Hartov, A.; Kennedy, F.E.; Miga, M.I.; Paulsen, K.D. Intraoperative brain shift and deformation: a quantitative analysis of cortical displacement in 28 cases. Neurosurgery 1998, 43, 749–58; discussion 758–60.
- Reinertsen, I.; Lindseth, F.; Askeland, C.; Iversen, D.H.; Unsgard, G. Intra-operative correction of brain-shift. Acta Neurochir 2014, 156, 1301–10. [Google Scholar] [CrossRef]
- Lindner, D.; Trantakis, C.; Renner, C.; Arnold, S.; Schmitgen, A.; Schneider, J.; Meixensberger, J. Application of intraoperative 3D ultrasound during navigated tumor resection. Minim Invasive Neurosurg. 2006, 49, 197–202. [Google Scholar] [CrossRef] [PubMed]
- Prada, F.; Del Bene, M.; Mattei, L.; Lodigiani, L.; DeBeni, S.; Kolev, V.; Vetrano, I.; Solbiati, L.; Sakas, G.; DiMeco, F. Preoperative magnetic resonance and intraoperative ultrasound fusion imaging for real-time neuronavigation in brain tumor surgery. Ultraschall Med. 2015, 36, 174–86. [Google Scholar] [CrossRef] [PubMed]
- Tyurikova, O.; Dembitskaya, Y.; Yashin, K.; Mishchenko, M.; Vedunova, M.; Medyanik, I.; Kazantsev, V. Perspectives in Intraoperative Diagnostics of Human Gliomas. Comput Math Methods Med. 2015, 2015, 479014. [Google Scholar] [CrossRef] [PubMed]
- Belykh, E.; Martirosyan, N.L.; Yagmurlu, K.; Miller, E.J.; Eschbacher, J.M.; Izadyyazdanabadi, M.; Bardonova, L.A.; Byvaltsev, V.A.; Nakaji, P.; Preul, M.C. Intraoperative Fluorescence Imaging for Personalized Brain Tumor Resection: Current State and Future Directions. Front Surg. 2016, 3, 55. [Google Scholar] [CrossRef] [PubMed]
- Teixidor, P.; Arráez, M.Á.; Villalba, G.; Garcia, R.; Tardáguila, M.; González, J.J.; Rimbau, J.; Vidal, X.; Montané, E. Safety and Efficacy of 5-Aminolevulinic Acid for High Grade Glioma in Usual Clinical Practice: A Prospective Cohort Study. PLoS ONE. 2016, 11, e0149244. [Google Scholar] [CrossRef]
- Hadjipanayis, C.G.; Stummer, W.; Sheehan, J.P. 5-ALA fluorescence-guided surgery of CNS tumors. J. Neurooncol. 2019, 141, 477–478. [Google Scholar] [CrossRef]
- Mazurek, M.; Kulesza, B.; Stoma, F.; Osuchowski, J.; Mańdziuk, S.; Rola, R. Characteristics of Fluorescent Intraoperative Dyes Helpful in Gross Total Resection of High-Grade Gliomas-A Systematic Review. Diagnostics. 2020, 10, 1100. [Google Scholar] [CrossRef]
- Pacioni, S.; D'Alessandris, Q.G.; Giannetti, S.; Della Pepa, G.M.; Offi, M.; Giordano, M.; Caccavella, V.M.; Falchetti, M.L.; Lauretti, L.; Pallini, R. 5-Aminolevulinic Acid (5-ALA)-Induced Protoporphyrin IX Fluorescence by Glioma Cells-A Fluorescence Microscopy Clinical Study. Cancers (Basel). 2022, 14, 2844. [Google Scholar] [CrossRef]
- Takami, T.; Naito, K.; Yamagata, T.; Ohata, K. Surgical management of spinal intramedullary tumors: radical and safe strategy for benign tumors. Neurol Med Chir (Tokyo). 2015, 55, 317–27. [Google Scholar] [CrossRef]
- Kucia, E.J.; Bambakidis, N.C.; Chang, S.W.; Spetzler, R.F. Surgical technique and outcomes in the treatment of spinal cord ependymomas, part 1: intramedullary ependymomas. Neurosurgery. 2011, 68(1 Suppl Operative), 57-63; discussion 63. [CrossRef]
- Ohata, K.; Takami, T.; Gotou, T.; El-Bahy, K.; Morino, M.; Maeda, M.; Inoue, Y.; Hakuba, A. Surgical outcome of intramedullary spinal cord ependymoma. Acta Neurochir (Wien) 1999, 141, 341–346; discussion 346–347. [CrossRef]
- Goto, T.; Ohata, K.; Takami, T.; Nishikawa, M.; Nishio, A.; Morino, M.; Tsuyuguchi, N.; Hara, M. Prevention of postoperative posterior tethering of spinal cord after resection of ependymoma. J Neurosurg. 2003, 99, 181–187. [Google Scholar] [CrossRef] [PubMed]
- Ottenhausen, M.; Ntoulias, G.; Bodhinayake, I.; Ruppert, F.H.; Schreiber, S.; Förschler, A.; et al. Intradural spinal tumors in adults – Update on management and outcome. Neurosurg Rev. 2019, 42, 371–88. [Google Scholar] [CrossRef] [PubMed]
- Giammattei, L.; Penet, N.; Parker, F.; Messerer, M. Intramedullary ependymoma: Microsurgical resection technique Neurochirurgie. 2017, 63, 398–401. [CrossRef]
- Hussain, I.; Parker, W.E.; Barzilai, O.; Bilsky, M.H. Surgical management of intramedullary spinal cord tumors Neurosurg Clin N Am. 2020, 31, 237–49. [CrossRef]
- Abd-El-Barr, M.M.; Huang, K.T.; Moses, Z.B.; Iorgulescu, J.B.; Chi, J.H. Recent advances in intradural spinal tumors. Neuro Oncol. 2018, 20, 729–742. [Google Scholar] [CrossRef] [PubMed]
- Tendulkar, R.D.; Pai Panandiker, A.S.; Wu, S.; Kun, L.E.; Broniscer, A.; Sanford, R.A.; Merchant, T.E. Irradiation of pediatric high-grade spinal cord tumors. Int J Radiat Oncol Biol Phys. 2010, 78, 1451–6. [Google Scholar] [CrossRef] [PubMed]
- Mehta, A.I.; Mohrhaus, C.A.; Husain, A.M.; Karikari, I.O.; Hughes, B.; Hodges, T.; Gottfried, O.; Bagley, C.A. Dorsal column mapping for intramedullary spinal cord tumor resection decreases dorsal column dysfunction. J Spinal Disord Tech. 2012, 25, 205–9. [Google Scholar] [CrossRef] [PubMed]
- Wo, J.Y.; Viswanathan, A.N. Impact of Radiotherapy on Fertility, Pregnancy, and Neonatal Outcomes in Female Cancer Patients. Int. J. Radiat. Oncol. Biol. Phys. 2009, 73, 1304–1312. [Google Scholar] [CrossRef] [PubMed]
- Dea, N.; Gokaslan, Z.; Choi, D.; Fisher, C. Spine oncology‒primary spine tumors. Neurosurgery. 2017, 80(3S), S124–S130. [Google Scholar] [CrossRef] [PubMed]
- Purvis, T.E.; Goodwin, C.R.; Lubelski, D.; Laufer, I.; Sciubba, D.M. Review of stereotactic radiosurgery for intradural spine tumors. CNS Oncol. 2017, 6, 131–138. [Google Scholar] [CrossRef] [PubMed]
- S Shin, D.W.; Sohn, M.J.; Kim, H.S.; Lee, D.J.; Jeon, S.R.; Hwang, Y.J.; Jho, E.H. Clinical analysis of spinal stereotactic radiosurgery in the treatment of neurogenic tumors. J Neurosurg Spine. 2015, 23, 429–37. [Google Scholar] [CrossRef]
- Gerszten, P.C.; Quader, M.; Novotny, J., Jr.; Flickinger, J.C. Radiosurgery for benign tumors of the spine: clinical experience and current trends. Technol Cancer Res Treat. 2012, 11, 133–139. [Google Scholar] [CrossRef]
- Marchetti, M.; De Martin, E.; Milanesi, I.; Fariselli, L. Intradural extramedullary benign spinal lesions radiosurgery. Medium- to long-term results from a single institution experience. Acta Neurochir (Wien). 2013, 155, 1215–1222. [Google Scholar] [CrossRef] [PubMed]
- Hegi, M.E.; Diserens, A.C.; Gorlia, T.; et al. MGMT gene silencing and benefit from temozolomide in glioblastoma. N Engl J Med. 2005, 352, 997–1003. [Google Scholar] [CrossRef] [PubMed]
- Stupp R, Hegi ME, Mason WP, van den Bent MJ, Taphoorn MJ, Janzer RC, Ludwin SK, Allgeier A, Fisher B, Belanger K, Hau P, Brandes AA, Gijtenbeek J, Marosi C, Vecht CJ, Mokhtari K, Wesseling P, Villa S, Eisenhauer E, Gorlia T, Weller M, Lacombe D, Cairncross JG, Mirimanoff RO; European Organisation for Research and Treatment of Cancer Brain Tumour and Radiation Oncology Groups; National Cancer Institute of Canada Clinical Trials Group. Effects of radiotherapy with concomitant and adjuvant temozolomide versus radiotherapy alone on survival in glioblastoma in a randomised phase III study: 5-year analysis of the EORTC-NCIC trial. Lancet Oncol. 2009, 10, 459–66. [CrossRef]
- Chamberlain, M.C. Temozolomide for recurrent low-grade spinal cord gliomas in adults. Cancer. 2008, 113, 1019–1024. [Google Scholar] [CrossRef] [PubMed]
- Kaley, T.J.; Mondesire-Crump, I.; Gavrilovic, I.T. Temozolomide or bevacizumab for spinal cord high-grade gliomas. J Neurooncol. 2012, 109, 385–389. [Google Scholar] [CrossRef] [PubMed]
- Kim, W.H.; Yoon, S.H.; Kim, C.Y.; Kim, K.J.; Lee, M.M.; Choe, G.; Kim, I.A.; Kim, J.H.; Kim, Y.J.; Kim, H.J. Temozolomide for malignant primary spinal cord glioma: an experience of six cases and a literature review. J Neurooncol. 2011, 101, 247–54. [Google Scholar] [CrossRef] [PubMed]
- Ahmed, R.; Menezes, A.H.; Torner, J.C. Role of resection and adjuvant therapy in long-term disease outcomes for low-grade pediatric intramedullary spinal cord tumors. J Neurosurg Pediatr. 2016, 18, 594–601. [Google Scholar] [CrossRef] [PubMed]
- Chamberlain, M.C. Etoposide for recurrent spinal cord ependymoma. Neurology. 2002, 58, 1310–1311. [Google Scholar] [CrossRef] [PubMed]
- Fakhrai, N.; Neophytou, P.; Dieckmann, K.; Nemeth, A.; Prayer, D.; Hainfellner, J.; Marosi, C. Recurrent spinal ependymoma showing partial remission under Imatimib. Acta Neurochir (Wien). 2004, 146, 1255–8. [Google Scholar] [CrossRef] [PubMed]
- Morris, K.A.; Afridi, S.K.; Evans, D.G.; et al. The response of spinal cord ependymomas to bevacizumab in patients with neurofibromatosis Type 2. J Neurosurg Spine. 2017, 26, 474–482. [Google Scholar] [CrossRef]
- Karajannis, M.A.; Legault, G.; Hagiwara, M.; Ballas, M.S.; Brown, K.; Nusbaum, A.O.; Hochman, T.; Goldberg, J.D.; Koch, K.M.; Golfinos, J.G.; Roland, J.T.; Allen, J.C. Phase II trial of lapatinib in adult and pediatric patients with neurofibromatosis type 2 and progressive vestibular schwannomas. Neuro Oncol. 2012, 1163–70. [Google Scholar] [CrossRef]
- Fouladi, M.; Stewart, C.F.; Blaney, S.M.; Onar-Thomas, A.; Schaiquevich, P.; Packer, R.J.; Gajjar, A.; Kun, L.E.; Boyett, J.M.; Gilbertson, R.J. Phase I trial of lapatinib in children with refractory CNS malignancies: a Pediatric Brain Tumor Consortium study. J Clin Oncol. 2010, 28, 4221–7. [Google Scholar] [CrossRef] [PubMed]
- DeWire, M.; Fouladi, M.; Turner, D.C.; Wetmore, C.; Hawkins, C.; Jacobs, C.; Yuan, Y.; Liu, D.; Goldman, S.; Fisher, P.; Rytting, M.; Bouffet, E.; Khakoo, Y.; Hwang, E.I.; Foreman, N.; Stewart, C.F.; Gilbert, M.R.; Gilbertson, R.; Gajjar, A. An open-label, two-stage, phase II study of bevacizumab and lapatinib in children with recurrent or refractory ependymoma: a collaborative ependymoma research network study (CERN). J Neurooncol. 2015, 123, 85–91. [Google Scholar] [CrossRef] [PubMed]
- Kringel, R.; Lamszus, K.; Mohme, M. Chimeric Antigen Receptor T Cells in Glioblastoma-Current Concepts and Promising Future. Cells. 2023, 12, 1770. [Google Scholar] [CrossRef] [PubMed]
- Tan, S.; Li, D.; Zhu, X. Cancer immunotherapy: Pros, cons and beyond. Biomed. Pharmacother. 2020, 124, 109821. [Google Scholar] [CrossRef] [PubMed]
- Llorens-Bobadilla, E.; Martin-Villalba, A. Adult NSC diversity and plasticity: the role of the niche. Curr Opin Neurobiol. 2017, 42, 68–74. [Google Scholar] [CrossRef]
- Aboody, K.S.; Brown, A.; Rainov, N.G.; Bower, K.A.; Liu, S.; Yang, W.; Small, J.E.; Herrlinger, U.; Ourednik, V.; Black, P.M.; Breakefield, X.O.; Snyder, E.Y. Neural stem cells display extensive tropism for pathology in adult brain: evidence from intracranial gliomas. Proc Natl Acad Sci U S A. 2000, 7, 97:12846–51. https://doi.org/10.1073/pnas.97.23.12846. Erratum in: Proc Natl Acad Sci U S A 2001 Jan 16;98:777. [CrossRef]
- Kim, S.K.; Cargioli, T.G.; Machluf, M.; Yang, W.; Sun, Y.; Al-Hashem, R.; Kim, S.U.; Black, P.M.; Carroll, R.S. PEX-producing human neural stem cells inhibit tumor growth in a mouse glioma model. Clin Cancer Res. 2005, 5, 11:5965–70. [CrossRef]
- Aboody, K.; Capela, A.; Niazi, N.; Stern, J.H.; Temple, S. Translating stem cell studies to the clinic for CNS repair: current state of the art and the need for a Rosetta stone. Neuron. 2011, 70, 597–613. [Google Scholar] [CrossRef] [PubMed]
- Ropper, A.E.; Zeng, X.; Haragopal, H.; Anderson, J.E.; Aljuboori, Z.; Han, I.; Abd-El-Barr, M.; Lee, H.J.; Sidman, R.L.; Snyder, E.Y.; Viapiano, M.S.; Kim, S.U.; Chi, J.H.; Teng, Y.D. Targeted Treatment of Experimental Spinal Cord Glioma With Dual Gene-Engineered Human Neural Stem Cells. Neurosurgery. 2016, 79, 481–91. [Google Scholar] [CrossRef] [PubMed]
- Teng, Y.D.; Abd-El-Barr, M.; Wang, L.; Hajiali, H.; Wu, L.; Zafonte, R.D. Spinal cord astrocytomas: progresses in experimental and clinical investigations for developing recovery neurobiology-based novel therapies. Exp Neurol. 2019, 311, 135–47. [Google Scholar] [CrossRef] [PubMed]
- Xu, S.; Tang, L.; Li, X.; Fan, F.; Liu, Z. Immunotherapy for glioma: current management and future application. Cancer Lett. 2020, 476, 1–12. [Google Scholar] [CrossRef]
- Hu, J.; Liu, T.; Han, B.; Tan, S.; Guo, H.; Xin, Y. Immunotherapy: a potential approach for high-grade spinal cord astrocytomas. Front Immunol. 2020, 11, 582828. [Google Scholar] [CrossRef]
- Huang, B.; Li, X.; Li, Y.; Zhang, J.; Zong, Z.; Zhang, H. Current immunotherapies for glioblastoma multiforme. Front Immunol. 2020, 11, 603911. [Google Scholar] [CrossRef] [PubMed]
- Kumar, A.; Weber, M.H.; Gokaslan, Z.; Wolinsky, J.P.; Schmidt, M.; Rhines, L.; Fehlings, M.G.; Laufer, I.; Sciubba, D.M.; Clarke, M.J.; Sundaresan, N.; Verlaan, J.J.; Sahgal, A.; Chou, D.; Fisher, C.G. Metastatic Spinal Cord Compression and Steroid Treatment: A Systematic Review. Clin Spine Surg. 2017, 30, 156–163. [Google Scholar] [CrossRef] [PubMed]
- Wang, Q.T.; Nie, Y.; Sun, S.N.; Lin, T.; Han, R.J.; Jiang, J.; Li, Z.; Li, J.Q.; Xiao, Y.P.; Fan, Y.Y.; Yuan, X.H.; Zhang, H.; Zhao, B.B.; Zeng, M.; Li, S.Y.; Liao, H.X.; Zhang, J.; He, Y.W. Tumor-associated antigen-based personalized dendritic cell vaccine in solid tumor patients. Cancer Immunol Immunother. 2020, 69, 1375–1387. [Google Scholar] [CrossRef] [PubMed]
- Mitsuya, K.; Akiyama, Y.; Iizuka, A.; Miyata, H.; Deguchi, S.; Hayashi, N.; Maeda, C.; Kondou, R.; Kanematsu, A.; Watanabe, K.; Ashizawa, T.; Abe, Y.; Ito, I.; Oishi, T.; Sugino, T.; Nakasu, Y.; Yamaguchi, K. Alpha-type-1 Polarized Dendritic Cell-based Vaccination in Newly Diagnosed High-grade Glioma: A Phase II Clinical Trial. Anticancer Res. 2020, 40, 6473–6484. [Google Scholar] [CrossRef]
- Chang, C.N.; Huang, Y.C.; Yang, D.M.; Kikuta, K.; Wei, K.J.; Kubota, T.; Yang, W.K. A phase I/II clinical trial investigating the adverse and therapeutic effects of a postoperative autologous dendritic cell tumor vaccine in patients with malignant glioma. J Clin Neurosci. 2011, 18, 1048–54. [Google Scholar] [CrossRef]
- Yan, Y.; Zhou, L.; Sun, Z.; Song, D.; Cheng, Y. Targeted and intracellular delivery of protein therapeutics by a boronated polymer for the treatment of bone tumors. Bioact. Mater. 2022, 7, 333–340. [Google Scholar] [CrossRef]
- Kheirkhah, P.; Denyer, S.; Bhimani, A.D.; Arnone, G.D.; Esfahani, D.R.; Aguilar, T.; Zakrzewski, J.; Venugopal, I.; Habib, N.; Gallia, G.L.; Linninger, A.; Charbel, F.T.; Mehta, A.I. Magnetic Drug Targeting: A Novel Treatment for Intramedullary Spinal Cord Tumors. Sci Rep. 1: 8, 1141. [Google Scholar] [CrossRef]
- Ahmadi, D.; Zarei, M.; Rahimi, M.; Khazaie, M.; Asemi, Z.; Mir, S.M.; Sadeghpour, A.; Karimian, A.; Alemi, F.; Rahmati-Yamchi, M. ; Salehi R, Niaragh F, Yousefi M, Khelgati N, Majidinia M, Safa A, Yousefi B. et al. Preparation and in-vitro evaluation of pH-responsive cationic cyclodextrin coated magnetic nanoparticles for delivery of methotrexate to the Saos-2 bone cancer cells. J. Drug Deliv. Sci. Technol, 2020; 57, 101584. [Google Scholar] [CrossRef]
- Huang, X.; Wu, W.; Jing, D.; Yang, L.; Guo, H.; Wang, L.; Zhang, W.; Pu, F.; Shao, Z. Engineered exosome as targeted lncRNA MEG3 delivery vehicles for osteosarcoma therapy. J. Control. Release. 2022, 343, 107–117. [Google Scholar] [CrossRef]
Figure 5.
14 M, Spinal astrocytoma Grade 3, A: T1 weighted midsagittal image, B: T2 weighted midsagittal image, C: Enhanced T1 weighted midsagittal image. Red arrows indicate tumor and blue arrow shows tumor enhancement.
Figure 5.
14 M, Spinal astrocytoma Grade 3, A: T1 weighted midsagittal image, B: T2 weighted midsagittal image, C: Enhanced T1 weighted midsagittal image. Red arrows indicate tumor and blue arrow shows tumor enhancement.
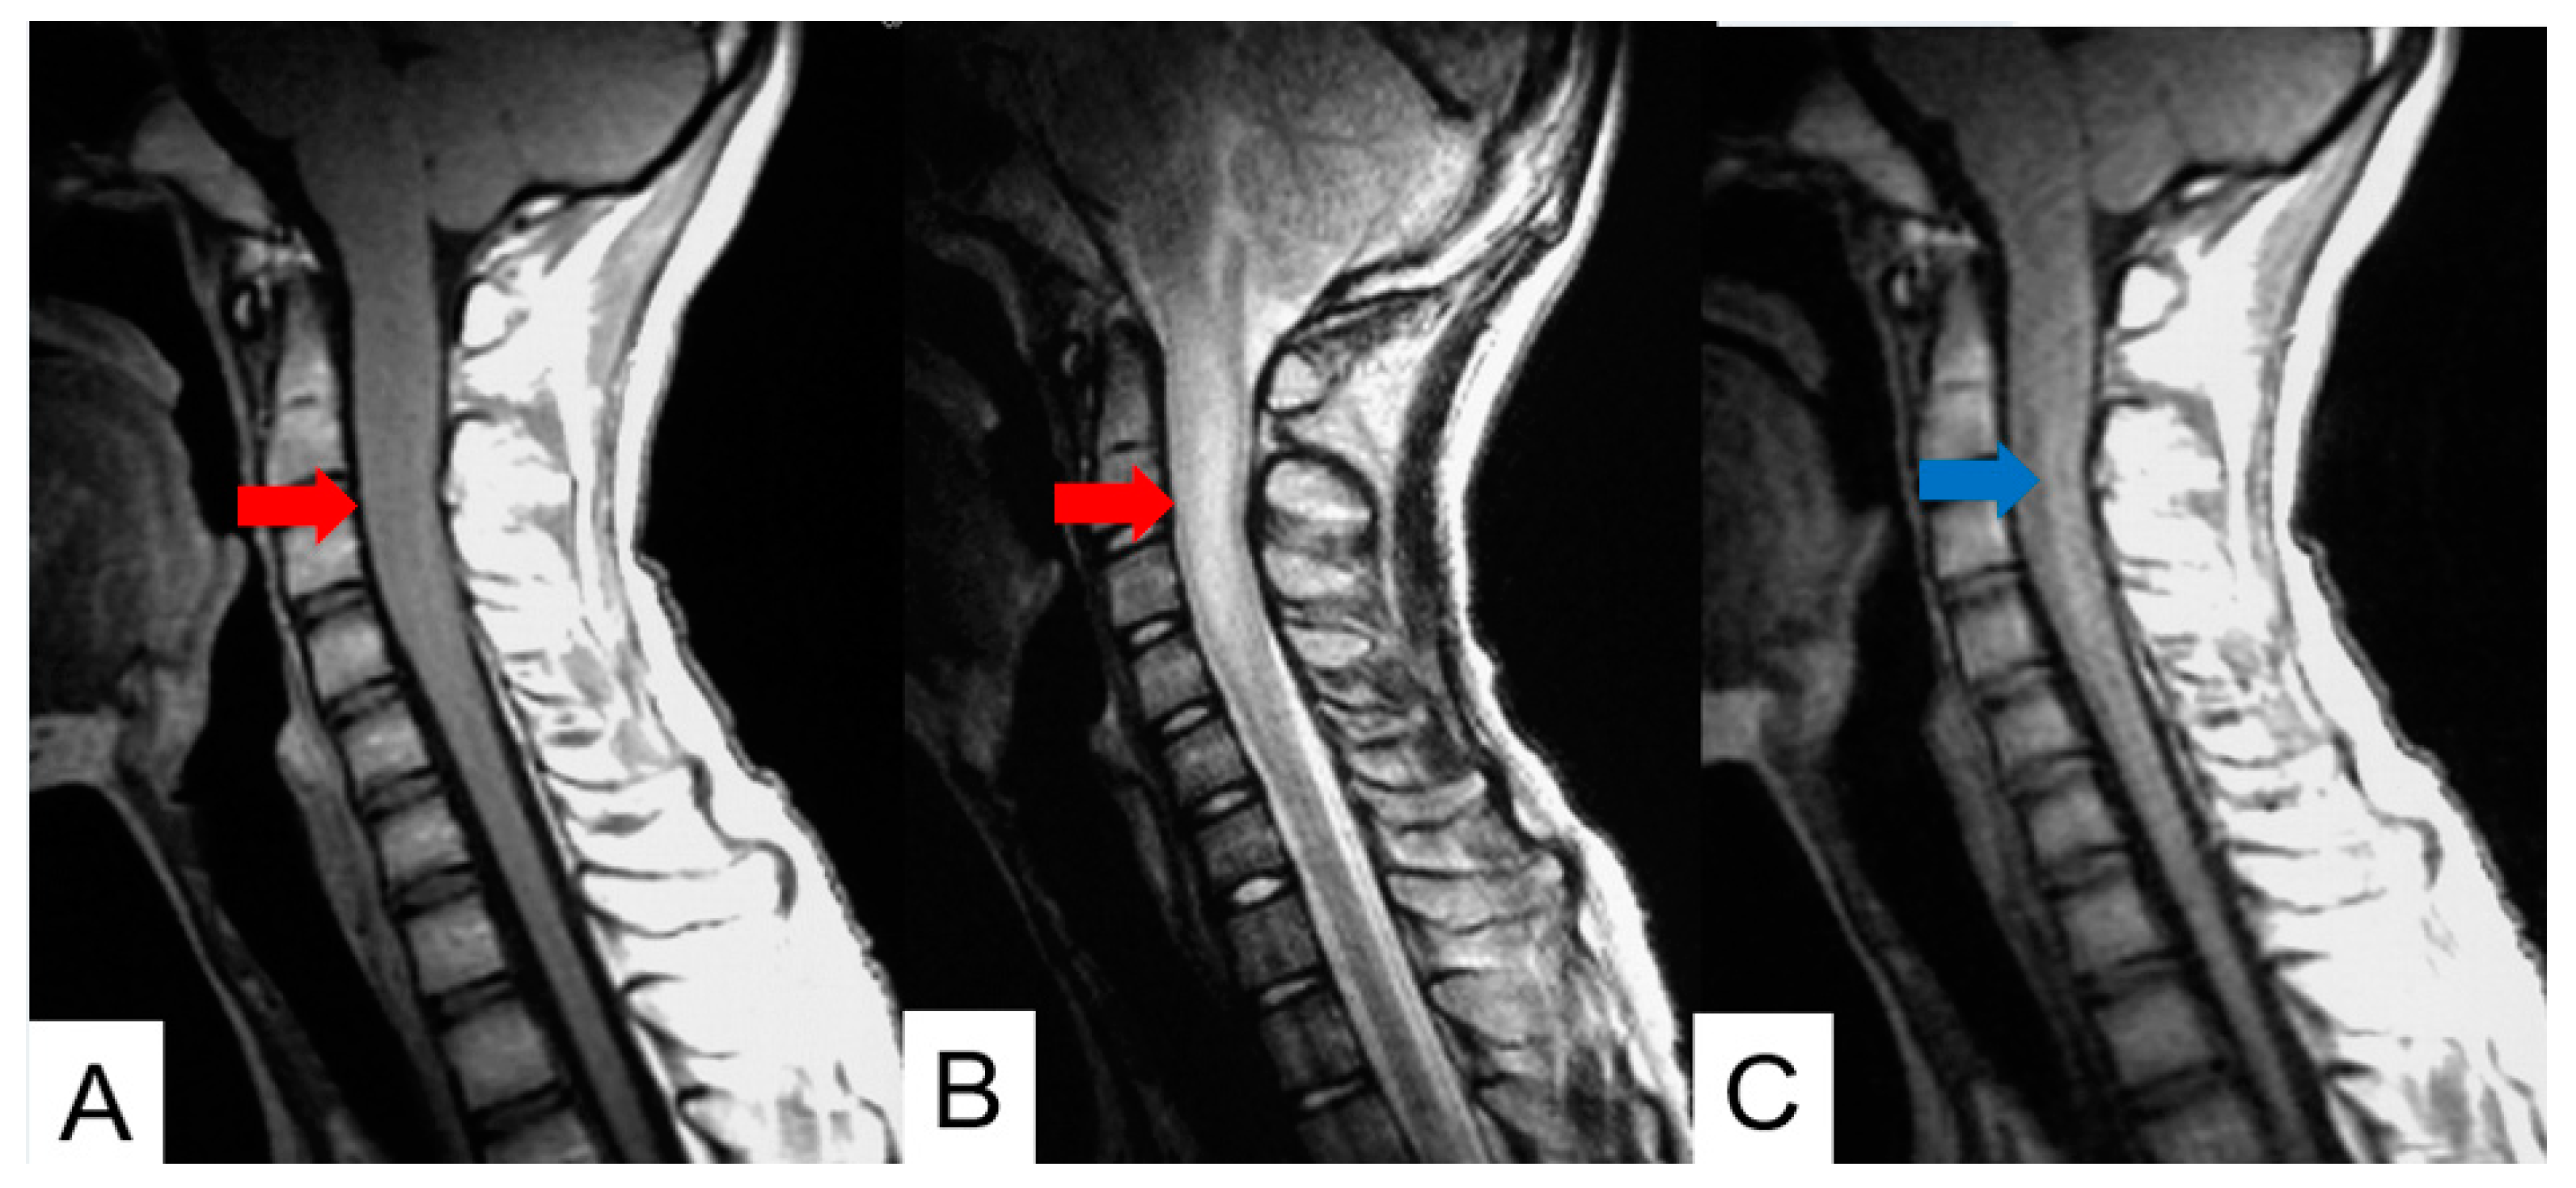
Figure 6.
37 M, Spinal ependymoma Grede1, A: T1 weighted midsagittal image, B: T1 weighted axial image at C4/5. C: T2 weighted midsagittal image, D: T2 weighted axial image at C4/5, E: Enhanced T1 weighted midsagittal image, D: Enhanced T1 weighted axial image at C4/5. Red arrows indicate tumor, a blue arrow shows enhancement. Grenn arrows indicate large syringomyelia.
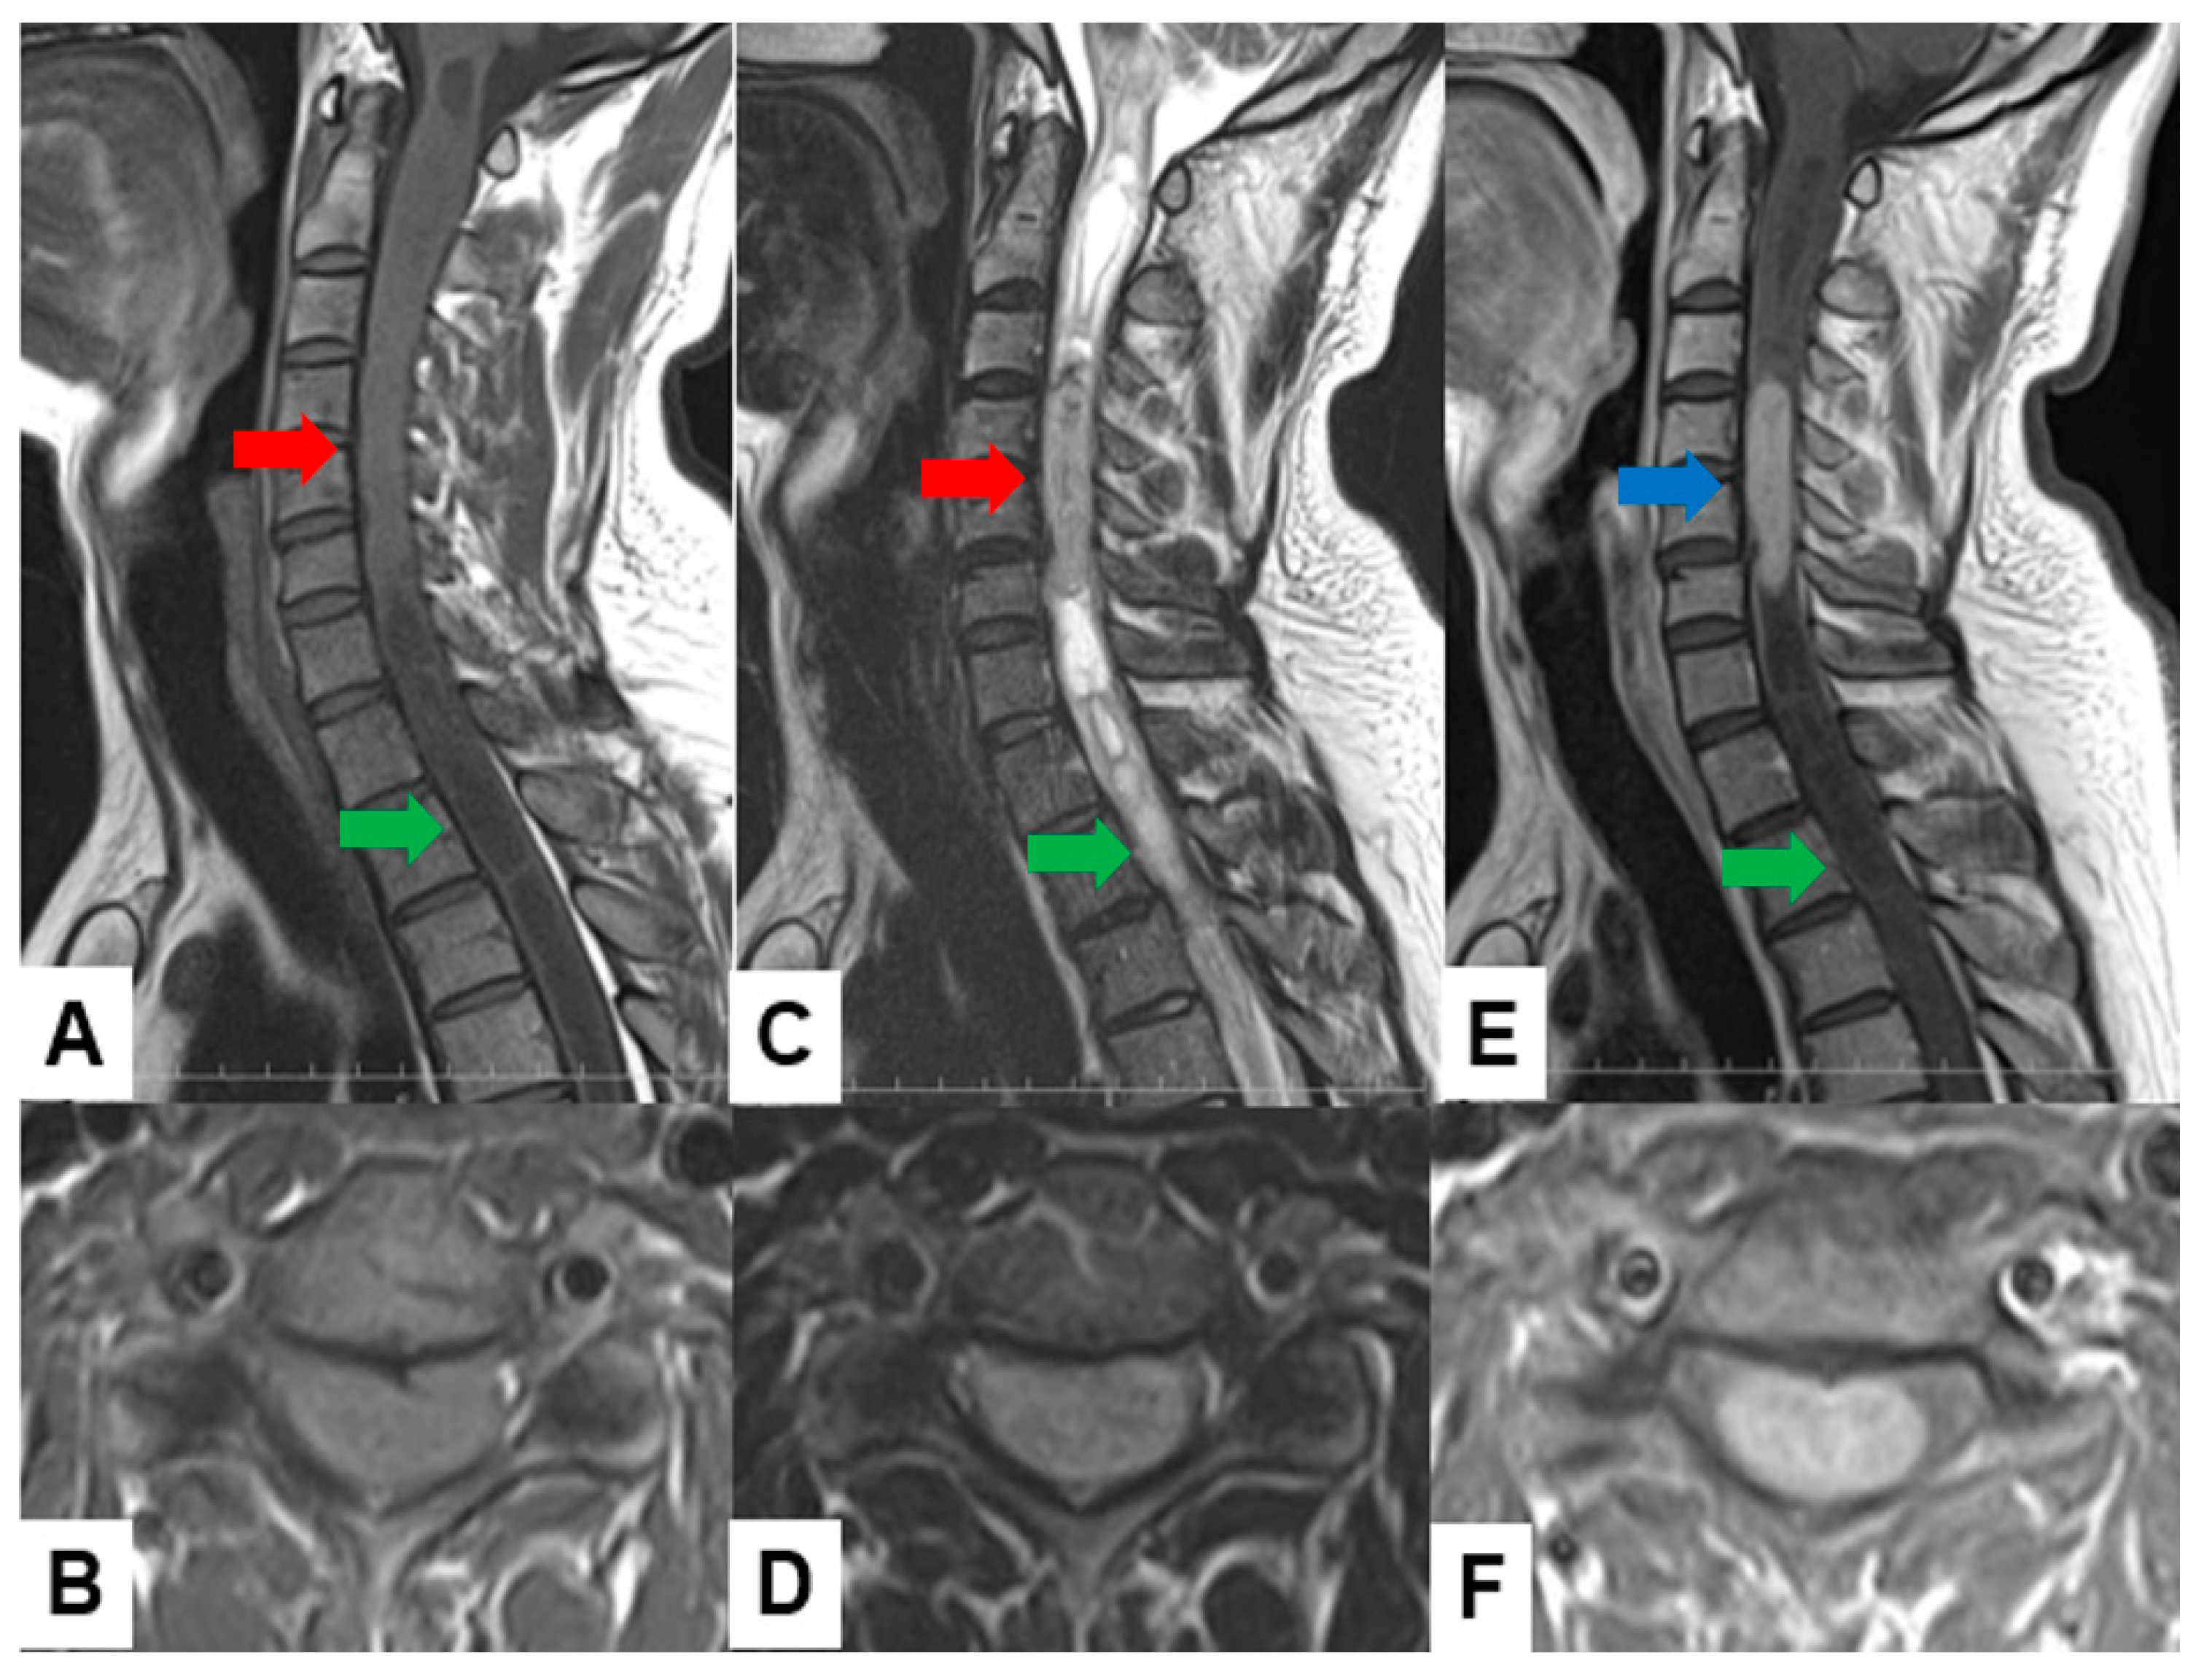
Figure 7.
54 M, Spinal hemangioblastoma Grade 1, A: Enhanced T1 weighted midsagittal image, B: Enhanced T1 weighted axial image at T2/3. Blue arrows indicate tumor enhancement and a green arrow shows syringomyelia.
Figure 7.
54 M, Spinal hemangioblastoma Grade 1, A: Enhanced T1 weighted midsagittal image, B: Enhanced T1 weighted axial image at T2/3. Blue arrows indicate tumor enhancement and a green arrow shows syringomyelia.
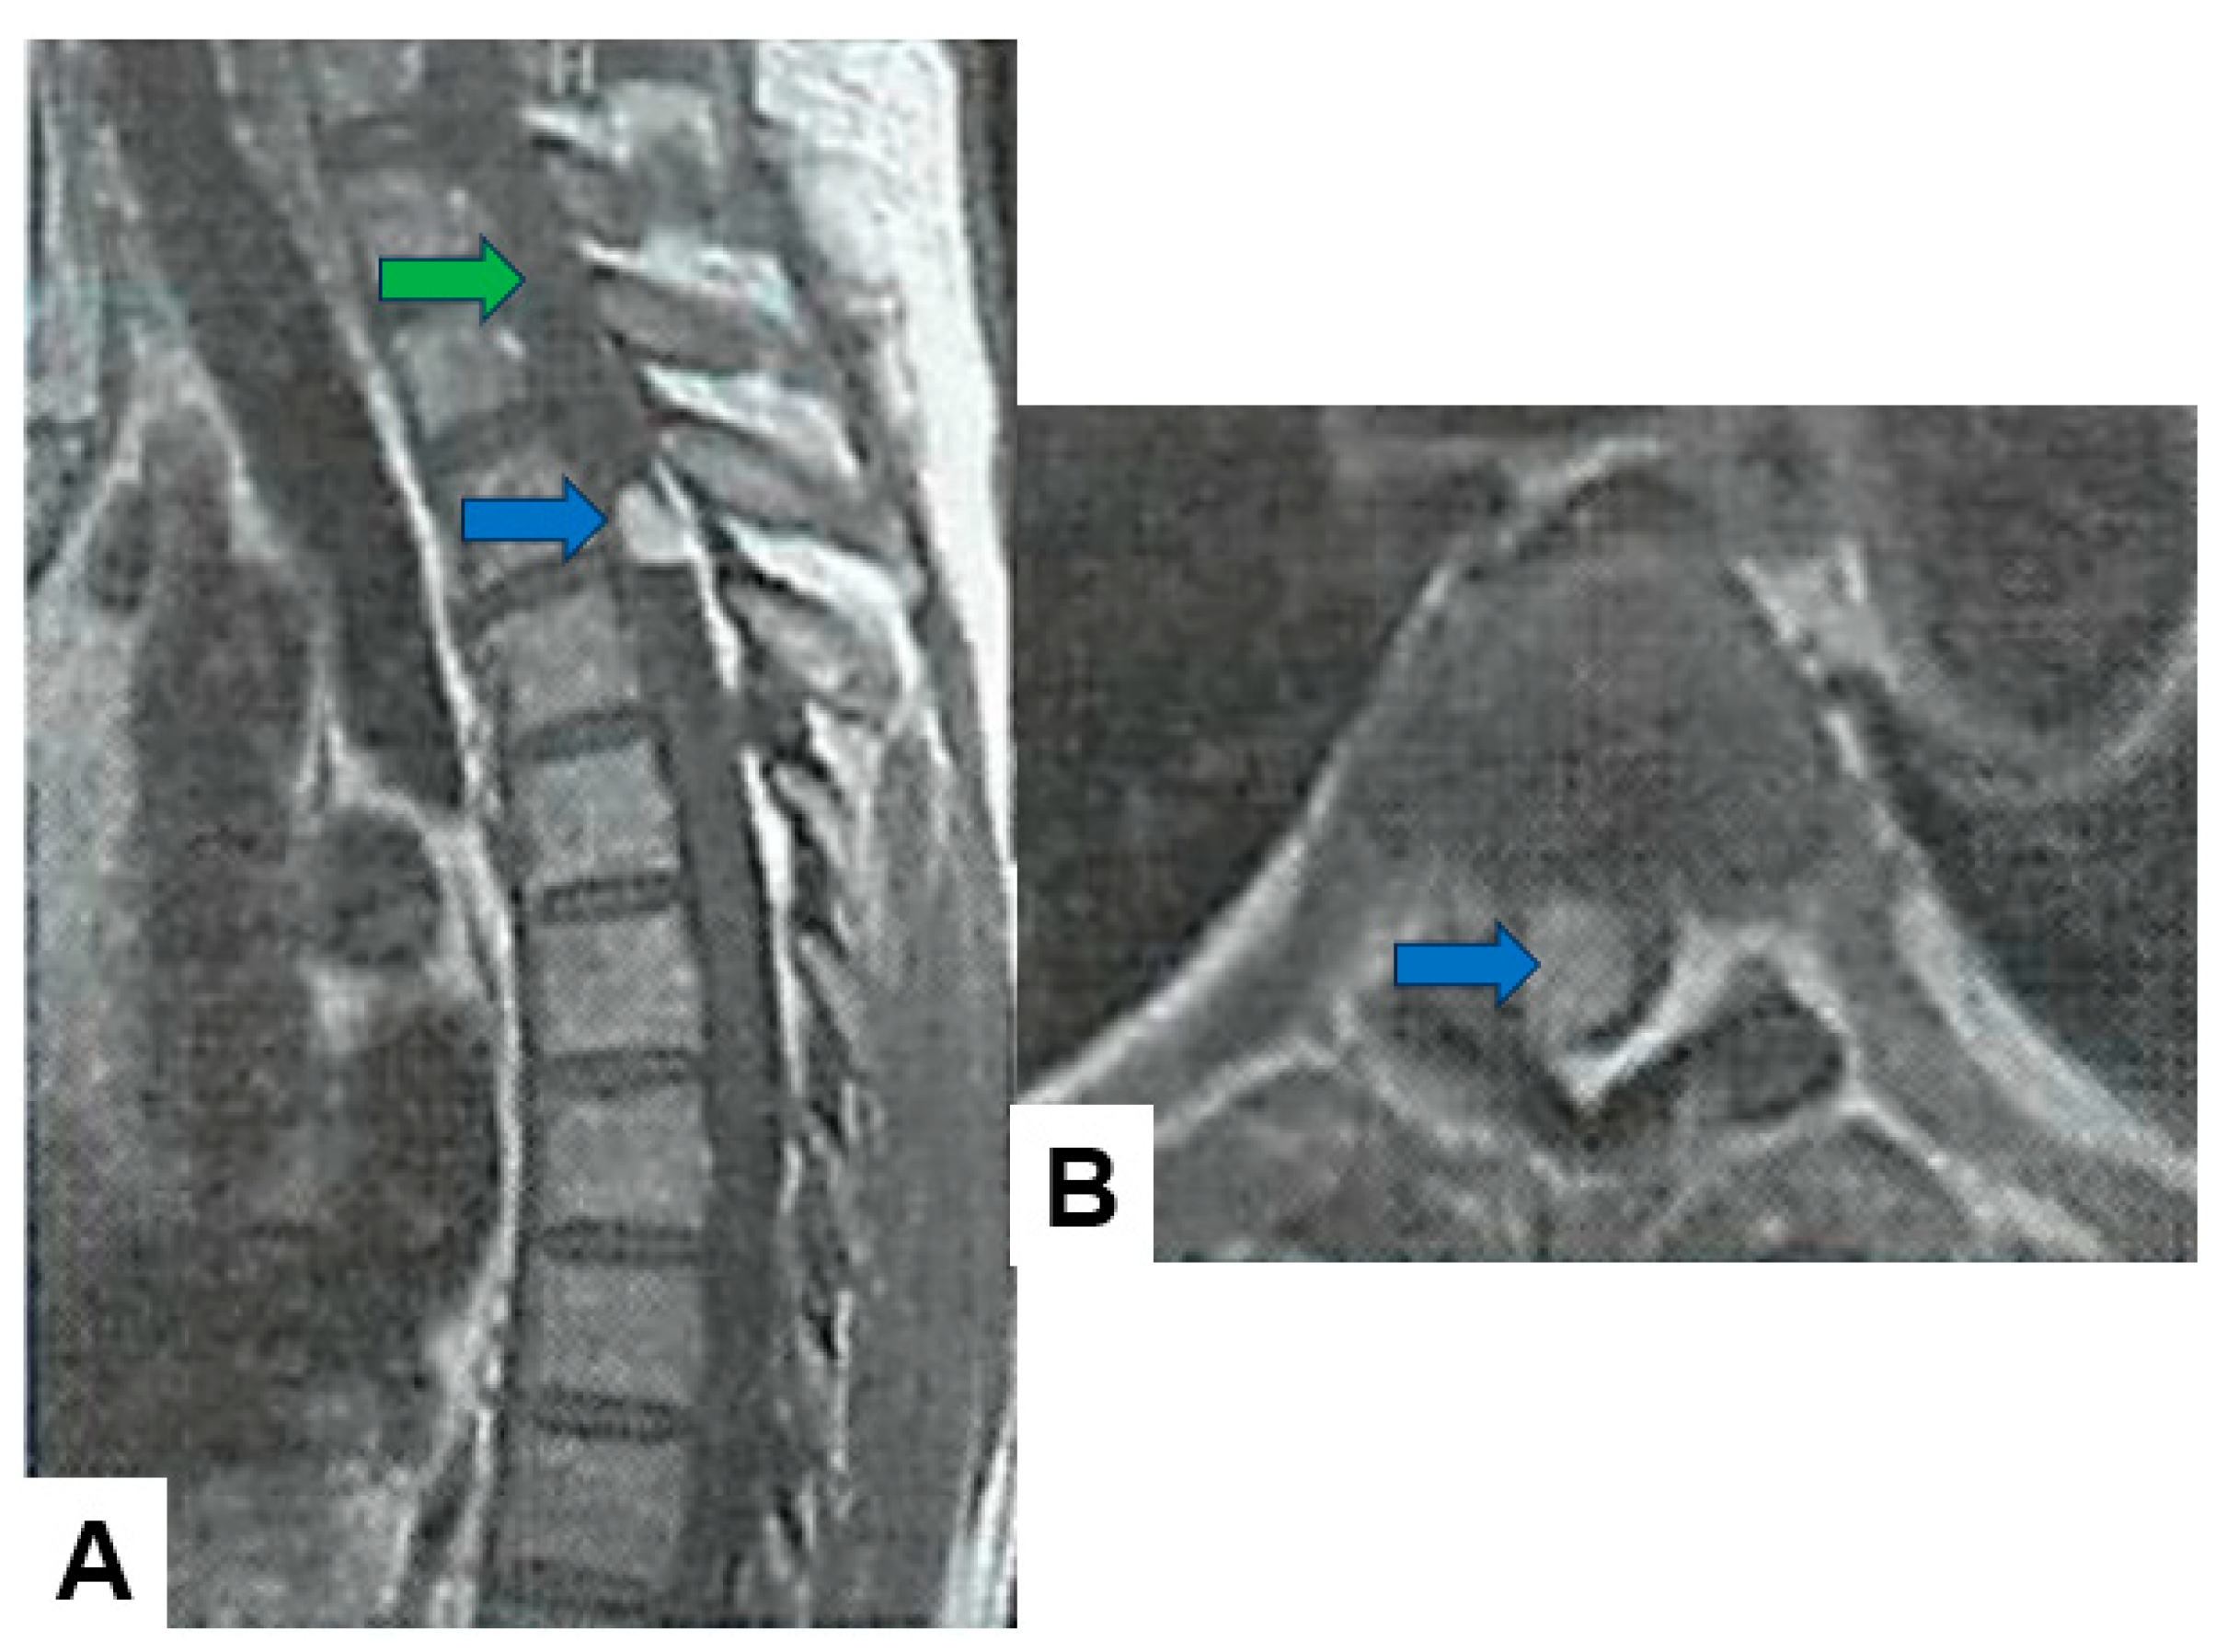
Figure 8.
49 M, Cavernous angioma, A: T2 weighted midsagittal image, B: T2 weighted axial image at C3. Red arrows indicate tumor.
Figure 8.
49 M, Cavernous angioma, A: T2 weighted midsagittal image, B: T2 weighted axial image at C3. Red arrows indicate tumor.
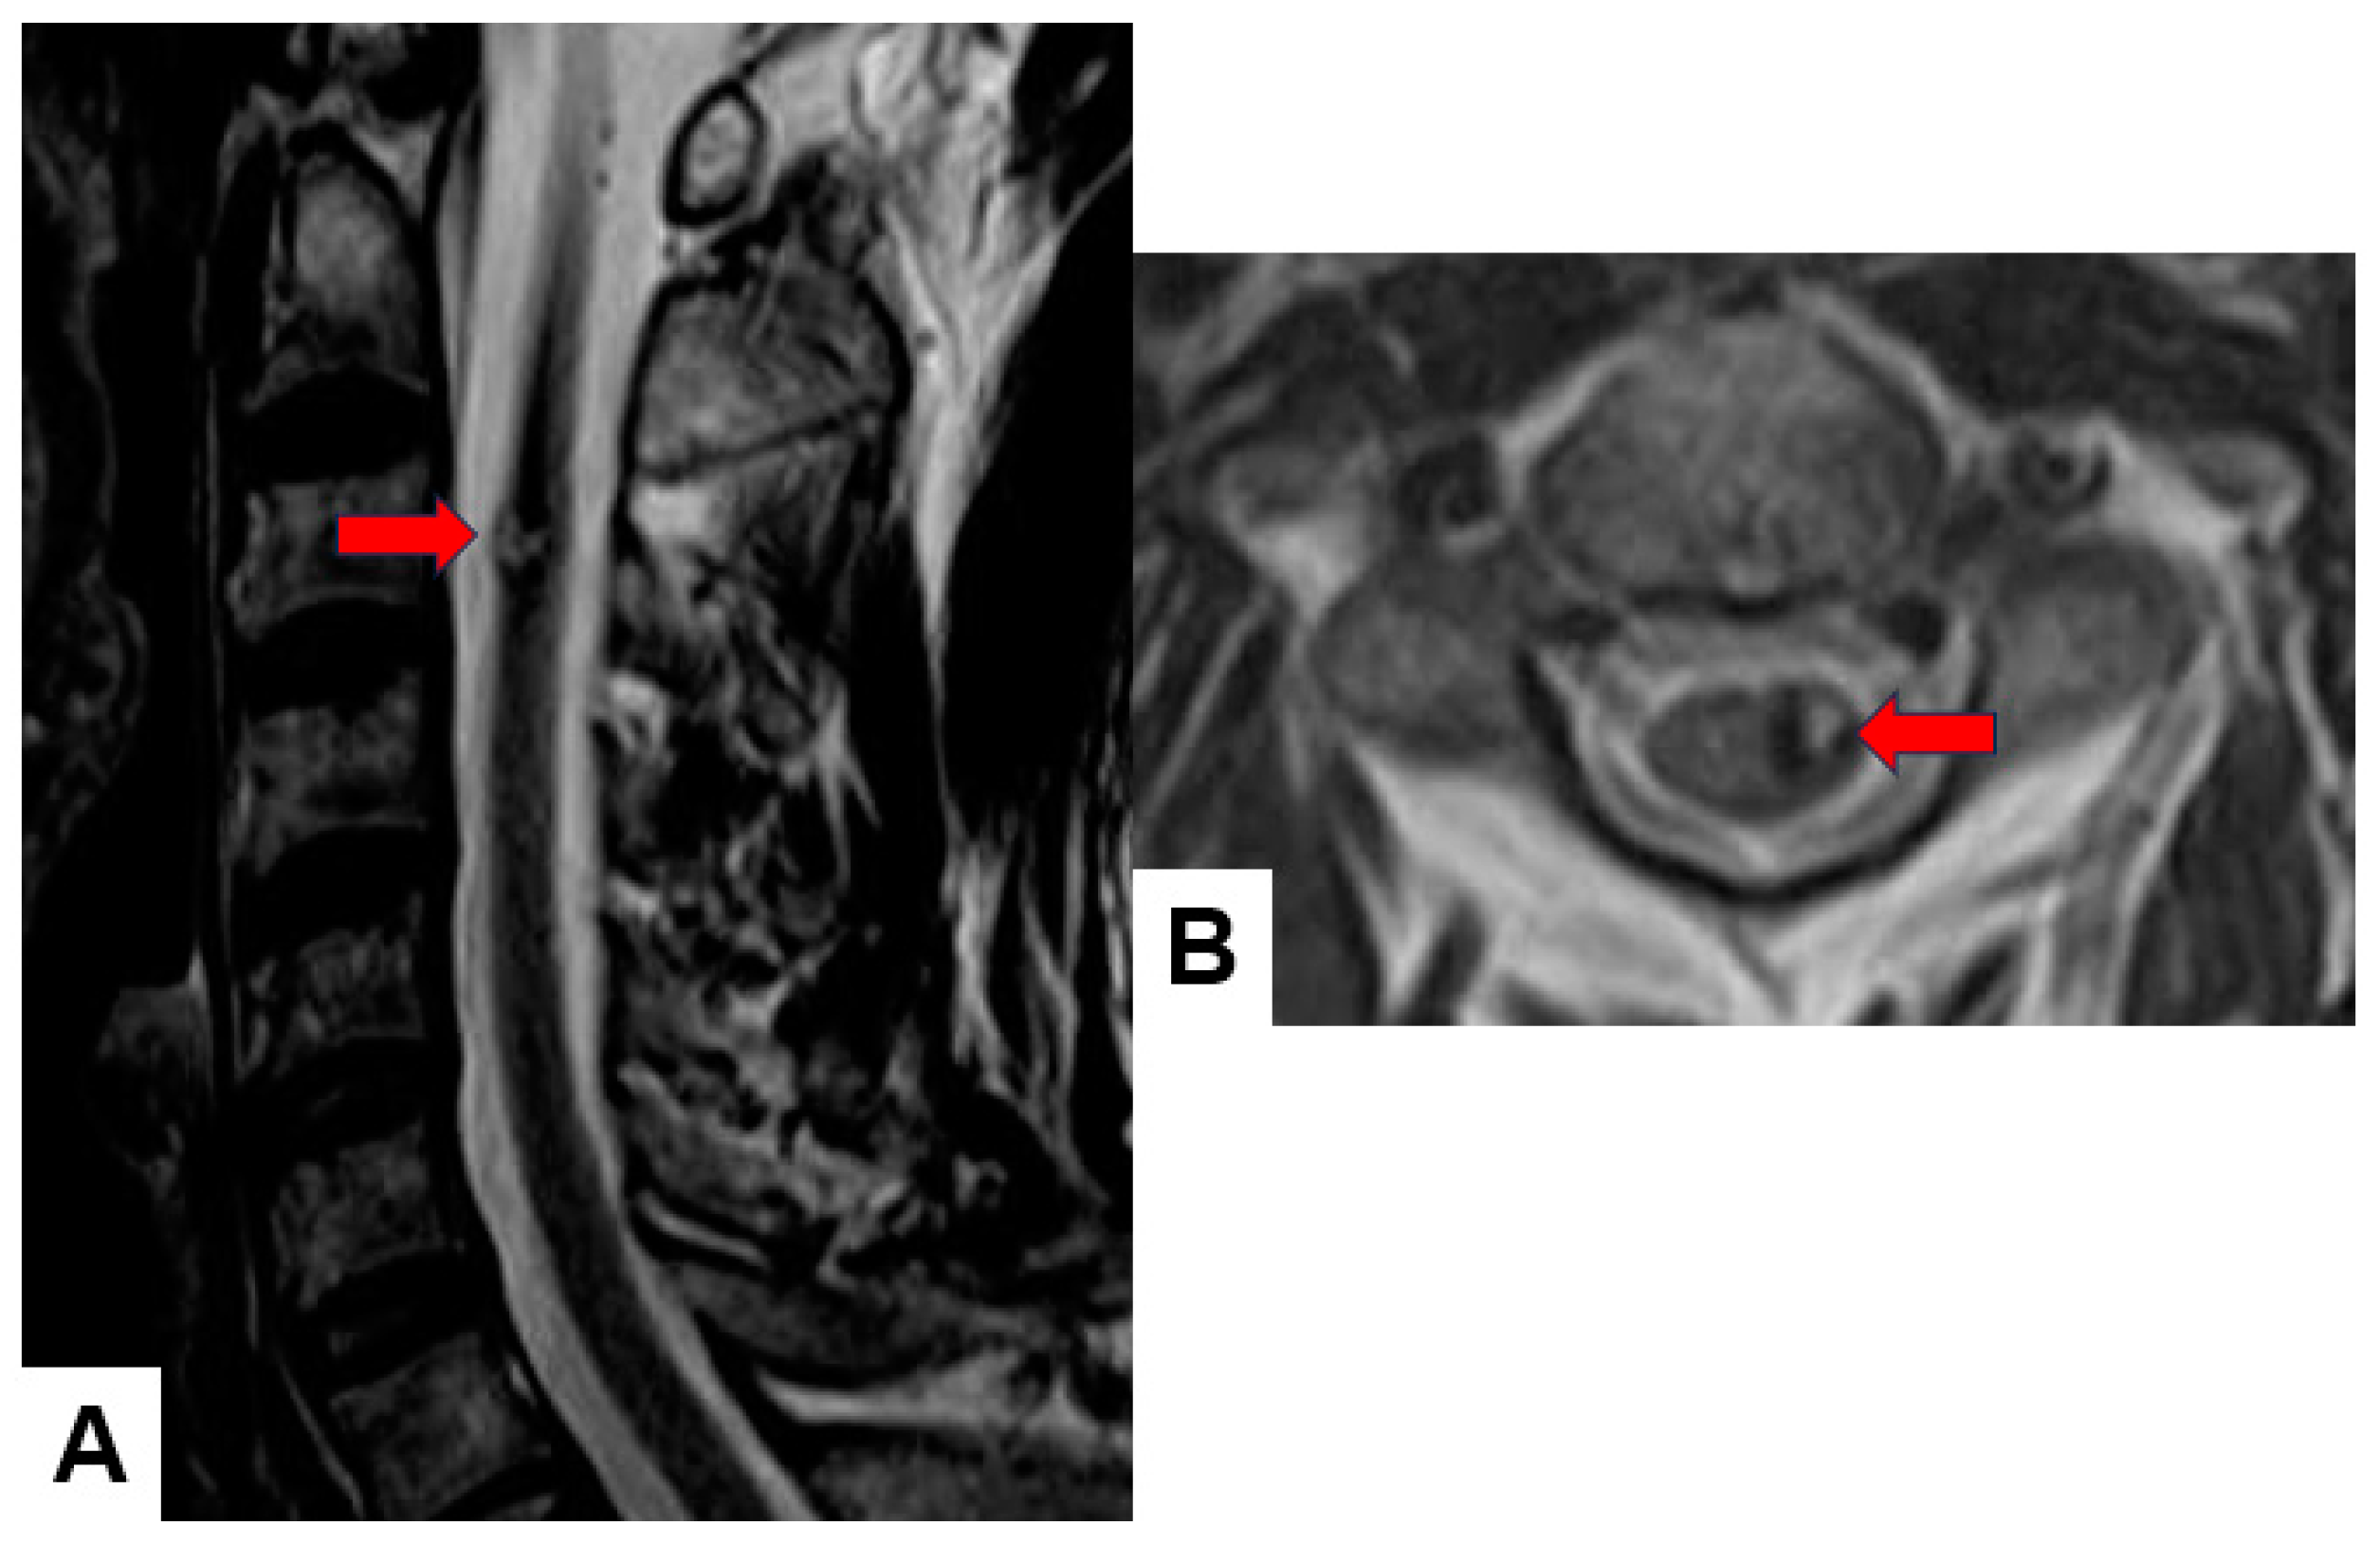

Table 1.
WHO Classification (grading) [15].
Table 1.
WHO Classification (grading) [15].
| Grade 1 | These are the least malignant tumors and are usually associated with long-term survival. They grow slowly and have an almost normal appearance when viewed through a microscope. Surgery alone may be an effective treatment for this grade tumor. |
| Grade 2 | These tumors are slow-growing and look slightly abnormal under a microscope. Some can spread into nearby normal tissue and recur, sometimes as a higher grade tumor. |
| Grade 3 | These tumors are, by definition, malignant although there is not always a big difference between grade II and grade III tumors. The cells of a grade III tumor are actively reproducing abnormal cells, which grow into nearby normal brain tissue. These tumors tend to recur, often as a grade IV. |
| Grade 4 | These are the most malignant tumors. They reproduce rapidly, can have a bizarre appearance when viewed under the microscope, and easily grow into nearby normal brain tissue. These tumors form new blood vessels so they can maintain their rapid growth. They also have areas of dead cells in their centers. |
Table 2.
WHO Classification (origin) [15].
Table 2.
WHO Classification (origin) [15].
| Neuroepithelial tissue | |
| Paraspinal nerves | |
| Meninges | meningothelial cells mesenchymal primary melanocytic lesions other neoplasms |
| Lymphoma and hematopoietic neoplasms | |
| Germ cell tumors | |
| Metastatic tumors |
Table 3.
Differential Diagnosis Tips.
| Tumor location |
| MRI intensity, CT density |
| Enhancement pattern |
| Bone erosion |
| Accompanied findings (peritumoral cyst, edema, flow void, calcification, etc.) |
| Other study (angiography, PET, CSF study, etc.) |
Table 4.
The key point of differential diagnosis of meningioma and schwannoma.
| Category | meningioma | schwannoma |
|---|---|---|
| T2 weighted MR imaging | iso-low | high, heterogenous |
| Enhance | homogenous | heterogenous |
| Location | lateral | posterior |
| Cyst | - ~ + | ++ |
| Calcification | - ~ + | - |
| Tumor angle | dull | sharp |
| Dural tail | + | - |
| Mobile tumor | - | + |
Table 5.
Spinal intramedullary tumor in adults [37].
Table 5.
Spinal intramedullary tumor in adults [37].
| Tumor | Incidence |
|---|---|
| Ependymoma | 50-60% |
| - myxopapillary | 20-30% |
| Astrocytoma | 15-30% |
| - pilocytic | 10-45% |
| - high grade | 10-33% |
| Hemangioblastoma | 3-11% |
| Cavernous angioma | 4-5% |
| Schwannoma | 1% |
| Metastasis | 1% |
Table 6.
Spinal intramedullary tumor in children [38].
Table 6.
Spinal intramedullary tumor in children [38].
| Tumor | Incidence |
|---|---|
| Astrocytoma | 41% |
| - pilocytic | 6% |
| - high grade | 26% |
| Ganglioglioma | 27% |
| Ependymoma | 12% |
| - myxopapillary | 35% |
| Hemangioblastoma | 2% |
Disclaimer/Publisher’s Note: The statements, opinions and data contained in all publications are solely those of the individual author(s) and contributor(s) and not of MDPI and/or the editor(s). MDPI and/or the editor(s) disclaim responsibility for any injury to people or property resulting from any ideas, methods, instructions or products referred to in the content. |
© 2024 by the authors. Licensee MDPI, Basel, Switzerland. This article is an open access article distributed under the terms and conditions of the Creative Commons Attribution (CC BY) license (http://creativecommons.org/licenses/by/4.0/).
Copyright: This open access article is published under a Creative Commons CC BY 4.0 license, which permit the free download, distribution, and reuse, provided that the author and preprint are cited in any reuse.


