Submitted:
11 May 2024
Posted:
22 May 2024
You are already at the latest version
Abstract
Counter-current spontaneous imbibition of water is a critical oil-recovery mechanism. In the laboratory, the Amott test is a widely used technique to assess efficacy of brine imbibition into oil-saturated core plugs. The classic Amott-cell methodology was designed to estimate ultimate oil recovery, but not the recovery dynamics that provides essential information about the imbibition mechanisms. Retention of oil droplets at the external core surface and delayed onset of oil production are the two key artifacts of the classic Amott experiment. This retention, referred to here as the ``external-surface oil holdup effect'', often results in stepwise recovery curves that obscure true dynamics of spontaneous imbibition. To address these holdup drawbacks of the classic Amott method, we modified the Amott cell and experimental procedure. For the first time, using water-wet Indiana limestone cores saturated with brine and mineral oil, we showed that our improvements of the Amott method enabled accurate and reproducible measurements of oil-recovery dynamics. We used the Generalized Extreme Value (GEV) statistics to describe oil-production histories from water-wet heterogeneous limestone cores with finite initial water saturations, for the first time. We demonstrated that our four-parameter GEV model accurately described the recovery dynamics, and that optimal GEV parameter values systematically reflected the key characteristics of the oil-rock system, such as oil viscosity and rock permeability. These findings gave us a more fundamental understanding of spontaneous, counter-current imbibition mechanisms and insights into what constitutes a predictive model of counter-current water imbibition into oil-saturated rocks with finite initial water saturation.
Keywords:
counter-current spontaneous imbibition
; mineral oil
; finite (non-zero) initial water saturation
; oil recovery modeling
1. Introduction
Current estimates indicate that carbonate reservoirs contain over half of the crude oil, which remains after primary production and secondary recovery. Improved Oil Recovery (IOR) methods aim to increase the total volume of oil extractable from a reservoir. The most important mechanism of incremental oil recovery is counter-current spontaneous imbibition of brine into the rock, driven by the capillary pressure gradient, , between the oil-saturated, low-permeability carbonate matrix [1] (high ) and waterflooded rock fractures or permeable macropore systems (low ).
The dynamics of spontaneous water imbibition into porous media saturated with immiscible fluids follows from the displacement mechanisms in both fluids [2,3]. Analyzing imbibition dynamics can shed light on the pore-level processes that govern fluid displacement and help identify the most efficient IOR methods during laboratory screening. In the laboratory, the Amott method is commonly used for studying the spontaneous imbibition of brine into oil-saturated rock samples [4]. This method uses an oil-saturated core plug inserted into a brine-filled glass jar and connected to a graduated glass burette used to measure the volumetric oil production history. The sufficiently wetting aqueous phase imbibes spontaneously into the porous rock displacing the non-wetting oil phase. Although some concerns exist [5], the Amott test is believed to approximate closely reservoir conditions during waterflooding, relying on capillarity (but not imposed pressure gradient) and wettability to govern the spontaneous imbibition of brine into core plugs saturated with oil.
The Amott test was designed to evaluate ultimate oil recovery [4]. The original protocol does not focus on the dynamics of oil recovery and introduces several artifacts that hinder the analysis and modeling of oil production dynamics. First, when oil is produced from a core, oil droplets at the water-wet external core surface must be “inflated” into the outer continuous aqueous phase. The droplet-inflation process introduces resistance to water imbibition, because a capillary pressure inflation threshold has to be overcome. Fernø et al. [6,7] described this effect and named it a capillary back-pressure. Curvature of oil droplets decreases monotonically during their growth in the surrounding brine, and the capillary back-pressure resistance has a uniformly decreasing effect. Indeed, past the initial resistance, the external drop inflation rate is rapid.
Second, the inflated drops can now only be detached by snap-off at the external surface, assisted by buoyancy. This process involves imbibition of the wetting phase and snap-off of emerging oil near the throat of the pores that expel the drops. The rate of this process is controlled by the local imbibition rate of the aqueous phase around that pre-droplet. This core behavior in an experiment is well captured in Figure 5a, see the Results and Discussion section below. However, after the drop snaps off from the oil phase inside the rock, it can still linger on the outer rock surface because of contact-line pinning, external surface contamination, and wettability. Moreover, large drops can be fed from and therefore held by many pores.
All of these effects delay drop detachment and lead to experimental artifacts, especially in small cores, such as step-wise recovery histories, and/or delay of production onset. These artifacts have been reported in the literature. However, their occurrence and description is not systematic because of the large number of variables among published experiments. Below we discuss a few examples.
Oil droplets are usually dislodged from the external rock surface by manually shaking the Amott jar before each measurement [8,9] or by a Teflon rod [10,11]. Although intermittent manual shaking is effective in removing oil droplets, it does not eliminate recovery discontinuity and sometimes even amplifies it. To improve accuracy of data recording in spontaneous imbibition experiments, various modifications have been proposed. For example, earlier studies used rock samples suspended in brine with a thread attached to a balance, which registered rock weight changes [11,12]. However, this method still required manual removal of oil droplets using a Teflon rod. Another study investigated quasi-spontaneous imbibition of brine using a centrifuge operating at a slow rotational speed. A high-resolution camera was used to record the volumetrical oil production [13]. However, centrifuge cups obstruct production from the core sides, significantly slowing the recovery process. Additionally, estimates of oil production based on time-lapse images may cause errors and lead to a reduction of cumulative oil production over time (Figure 13 in [13]). None of the existing Amott-cell procedures allows for a systematic, continuous and timely removal of the oil drops attached to the core.
Delay of initial production has been discussed in the literature, but the exact mechanism(s) are still not fully understood. For core plugs saturated with crude oil, some studies link the initial delay or the induction time to the rock wettability state [14,15]. Other studies note finite induction times for cylindrical water-wet cores with limited outer surface areas, e.g. with only one or two open flat faces, and that induction time is uncommon in setups where all core surfaces are open [6,7]. To the best of our knowledge, no prior studies discussed delay in production onset in cylindrical cores with large exposed external surface area and finite initial water saturation.
Imbibition experiments are often conducted using core plugs that are fully saturated with oil (initially water-free). However, the dynamics of spontaneous imbibition changes fundamentally when initial water is present in the pore corners compared to situations with 100% initial oil saturation. For example, Akin et al. [16] showed that in cores entirely filled with mineral oil, a uniform and piston-like sharp front of water is seen throughout spontaneous imbibition. In contrast, experiments with initial water demonstrate a uniform increase in water saturation throughout the core. This uniform saturation is attributed to the swelling of connate water that remains connected throughout the core. After initial water drainage by invading oil, some water always remains within the rock, maintaining capillary connectivity through pore corners and thin, sometimes molecularly thin, water films [17,18,19,20,21,22]. To mimic accurately the waterflooding of reservoir rocks, spontaneous imbibition experiments must always be conducted in the presence of initial (“connate”) water.
An additional complexity in the classic Amott experiment arises from the presence of various flow regimes. Brine typically imbibes into a cylindrical core plug from all directions. Regardless of the sample orientation, for many reasons, axial and radial imbibition rates are quite different in general, making modeling both of them rather difficult. This challenge has been extensively discussed in the literature [12,23,24,25]. To minimize the axial flow regime, many studies on spontaneous imbibition use core samples with sealed ends. However, these methods often involve permanent sealing, usually with epoxy resin [26,27] or polyester [28,29], which make these core samples unsuitable for repeated experiments.
We argue that the systematic, precise measurements of oil production dynamics can significantly enhance the understanding of spontaneous imbibition mechanisms. In our study, we modify the classic Amott experiment by incorporating continuous, automated shaking of the Amott cell, accompanied by frequent data recording. This modification minimizes the oil holdup effect and enables quantitative measurement of recovery histories. Additionally, we introduce a non-destructive sealing method that permits core reuse in subsequent experiments. This aspect is essential for conducting reproducibility studies and ensuring reliability of experimental outcomes. Finally, our method allows for conducting the imbibition experiments at elevated temperatures. To our knowledge, such a combination of experimental modifications has neither been documented in academic literature nor implemented commercially.
Pioneering studies by Richards [30], Richards [31], Muskat [32], and Rapoport and Leas [33] developed classical continuum models for spontaneous imbibition. They characterize this essentially transient non-equilibrium process using equilibrium capillary pressure curves and steady state relative permeabilities. In other words, the classical continuum models assume that water and oil flows are locally distributed along their steady flow paths, and that capillary pressure and relative permeability are universal functions of local water saturation. This assumption results in an ability to estimate relative permeabilities from steady-state flow experiments [34,35,36,37]. However, spontaneous imbibition is essentially non-equilibrium multiphase flow. The fluid-fluid and fluid-solid interfaces are created and destroyed, continue to change shapes and surface areas, and the equilibrium Young-Laplace relation may no longer describe curvatures of the interfaces between immiscible fluids. Consequently, static capillary-pressure and relative-permeability functions no longer hold.
Barenblatt et al. [38] introduced and compared a non-equilibrium model for capillary imbibition with the classical continuum mechanics model. Figure 4 and Figure 5 of Barenblatt et al. [38] show that the continuum model does not capture recovery dynamics, which can only be modeled with a non-equilibrium approach. Moreover, the current equilibrium models of imbibition contain a large number of parameters that are rarely independently and precisely determined. Commonly, these parameters are adjusted to fit experimental data [39,40,41]. Given the large number and uncertainty of the involved parameters, the agreement of equilibrium models of spontaneous imbibition with experimental data does not confer physical validity. Based on this analysis, we explore an alternative scaling approach to model the dynamics of spontaneous imbibition without contradicting the non-equilibrium essence of the process.
Silin and Patzek [42] developed a non-equilibrium scaling formulation for counter-current spontaneous imbibition in large blocks of homogeneous isotropic rock without initial water saturation. As mentioned previously, presence of connate water is the key differentiator between the diametrically different flow regimes. Consequently, the non-equilibrium description proposed by Silin and Patzek [42] cannot be applied for settings with initial water saturation.
In our study, we employ Generalized Extreme Value (GEV) statistics [43] to model non-equilibrium spontaneous imbibition, for the first time. GEV statistics describes the distribution of extreme events i.e. of the left and/or right tails of ordinary distributions. For example, GEV was successfully applied to model gas production from US shales by Patzek et al. [44] and Saputra et al. [45], Saputra et al. [46], Saputra et al. [47]. In these works, the authors argued that gas production from each well is the maximum of what this well could produce by draining gas from matrix blocks and delivering this gas to the wellbore via a network of connected fractures. In our work here, we assume that the volume of each oil droplet that appears externally and then detaches from the outer rock surface represents a maximum that the core surface can retain against surface forces and gravity. Therefore, GEV distribution must be applicable for modeling the distribution of all oil droplets produced during spontaneous imbibition. Our initial development of the GEV paradigm focuses solely on water-wet cores with connate water.
2. Materials and Methods
2.1. Core Plugs and Solutions
All experiments used 1.5×3 in. Indiana limestone core plugs obtained from foot-long cores (Kocurek Industries Inc). We conducted imbibition experiments with several twin pairs of Indiana limestone core-plug. Twin pairs IL-22/IL-23 and IL-20a/IL-21a were obtained from a single core and assumed to have close petrophysical characteristics and pore structures. A twin pair IL-6/IL-7 was cut from another foot-long core. The twin pair IL-6/IL-7 was used for the reproducibility analysis, and was then denoted as IL-6b/IL-7b. The twin pair IL-11a/IL-15a originated from two different cores with much higher permeability than the other pairs. The porosity and permeability of core plugs were measured with a brine using the Basic Core Flood System, under a confining pressure of 500 psi and a back-pressure of 150 psi (MetaRock Laboratories). The parameters of the core samples are listed in Table 1.
This study used purified water and high-grade chemicals (Fisher Scientific). 0.1M NaCl solution was used for core porosity and core permeability measurements, as well as in spontaneous imbibition experiments. Two mineral oils with different viscosities were used for core plug saturation. Oil-1 was a blend of hexadecane and light mineral oil (15 wt.% and 85 wt.%, respectively). Oil-2 was a heavy mineral oil. The oil viscosity was determined using the Anton Paar MCR 302 rheometer, CC27 geometry (see Table 1).
2.2. Core Plug Saturation
A dry core plug was saturated with 0.1M NaCl brine solution, prior to oil saturation. The core was placed in a Viton sleeve, loaded into a stainless-steel core holder, and then confined to 500 psi. The core was evacuated for a night and then saturated with brine by opening the core inlet to a burette containing saturating brine. Finally, the brine-filled core plug was drained with a mineral oil. To ensure homogeneous distribution of mineral oil within the sample, we used a hydrophilic ceramic porous plate positioned underneath the core plug. The injection of mineral oil was performed at the confining pressure of 500 psi, ambient temperature, and pore pressure of 80 psi. The twin core samples were saturated simultaneously by connecting two injection lines to a single ISCO pump (Teledyne ISCO).
The average oil saturation was estimated by measuring the volume of drained brine, which was collected in a calibrated burette positioned at the core outlet. The oil injection was performed continuously until a 70-80% oil saturation was reached (typically 2-3 days). For experiments using high-viscosity oil, core samples were drained at 60 °C to attain the same saturation level over the same time period.
2.3. Modified Amott-Cell Experiment
To address the oil-holdup effect during spontaneous imbibition (see Introduction for definition) and to obtain smooth oil-recovery histories, we made several modifications to the classic Amott-cell design and test procedure. We started by capping the top and bottom faces of the vertical core plugs to 1) minimize the axial flow, thereby simplifying the modeling process, and to 2) to prevent the retention of oil droplets on the top face of the core samples. Both effects are more pronounced in experiments involving crude oil and low oil/brine interfacial tension [49]. In this manuscript, we exclusively test water-wet cores saturated with mineral oil. However, in the subsequent paper, we will compare the results of spontaneous imbibition experiments using water-wet and mixed-wet cores. To ensure consistency between both studies, we maintained the same core geometry.
Extensive testing using a variety of materials, revealed that solid glass discs with heat-shrinkable sleeves provided the most effective capping. Figure 1 illustrates the step-by-step method used to attach these discs to the core faces. Two, 6.5-mm thick borosilicate glass discs were fitted with a heat-shrinkable Viton band. Then, the band was gently shrunk using a heat gun. Next, a heat-shrinkable Teflon band was placed around the Viton band and shrunk using the same method to obtain a tight seal. Multiple tests showed that the Viton band provided a tight seal of the glass discs to the core faces. The Teflon band prevented oil accumulation on the band due to its omniphobic nature.
Importantly, to remove mineral oil droplets from the external curved rock surface, we used a VWR Advanced orbital shaker (Henry Troemner LLC) that continuously rotated glass jars within an orbit of 19 mm in diameter and at a speed of 200 RPM (Figure 2a). The Amott cell was equipped with a custom-made glass seat for the core plug to prevent sample movement during the rotation of the cell. Designed with two flanges, the Amott cell ensured convenient positioning of rock samples into the seat. Figure 3 demonstrates the new Amott cell design with a core plug affixed to the glass seat.
After saturation, the core plug was capped with glass discs and positioned into the glass seat of the Amott cell as shown in Figure 3. A brine was poured into the bottom flange, then the cell was assembled using a clamp and filled up to the middle of the graduated burette. To minimize generation of gas bubbles at the outer rock surface, the brine was preheated to 60 °C and degassed. The Amott cells were assembled on an orbital shaker, which was placed in an oven. The experiment started when shaking was initiated. All experiments were conducted at 60 °C typical of reservoir conditions. We compared twin core pairs in dynamic (shaking) and static (classic) modes, as shown in Figure 2b. Under static conditions, the Amott cell remained undisturbed throughout the entire testing period. In both tests, core faces were capped to ensure consistent surface geometry.
Oil production was recorded through visual observation. To improve the accuracy of oil-production measurements, we chose a burette with a high resolution of 0.05 ml for Amott cell manufacturing. The measurements were taken at short intervals, typically every 10-15 minutes during the initial hours, then every 30-60 minutes for the subsequent hours, and finally every 2-3 hours after the production rate began to decline. At these experimental settings, the minimal increment of oil production represented 0.6% (0.006 fraction) of the oil recovery factor for typical core sample saturations of 9 ml. As will be demonstrated in Results and Discussion, the frequency of oil-production measurements falls closely within 0.6% increment. Therefore, we assert that within the volumetric measurement error, our results are unaffected by the measurement delay.
The developed capping technique ensures fast and reliable sealing of solid glass discs onto core plug faces. After a spontaneous-imbibition experiment lasting 2-3 months, the sealing remained intact during constant shaking of the Amott cell. The sealing covers 4-5 mm of the core surface from each end (top and bottom, see Figure 1), meaning that only about 10% of the surface is covered by a band. We assert that this small loss of external surface area has minimal impact on the radial flow regime. Our capping procedure is also effective for cores with rough surfaces and minor damage such as chips or fractures. We emphasize that our new Amott-cell methodology introduces a non-destructive sealing technique that permits core reuse in subsequent experiments, which we believe is crucial for conducting reproducibility studies.
The mineral oil recovery factor was plotted as the ratio of the produced oil volume to the total oil volume in a core plug against a square-root transformation of the elapsed time of the experiment (see Results and Discussion). This means that the plot labels are actual times, but they are spaced according to the square-root of time. This approach emphasizes the short-time data while compressing the longer ones, and provides a better visual representation of the early time data when oil-recovery rates are the highest.
2.4. GEV Scaling of Cumulative Oil Recovery
2.4.1. GEV Distribution
Generalized Extreme Value (GEV) distribution [43] is a probability distribution of the extrema (minima or maxima) of independent and identically distributed random variables. The GEV models have been successfully applied by Patzek et al. [44], Patzek et al. [50], and Saputra et al. [45], Saputra et al. [47], Saputra et al. [51], Saputra et al. [52], Haider et al. [53], Saputra et al. [54] to model gas, oil and condensate production from the US shale formations (see Introduction).
In this paper, GEV statistics is used to quantify cumulative oil recovery from the water-wet limestone core plugs that initially contain water. The oil drops, which appear at the rock surface, then grow and detach, are generated dynamically and cooperatively by evacuating many pore clusters. Therefore, at every instant of time and point of the exterior core surface, all droplets attain the largest possible volumes that this core surface can retain against surface tension and buoyancy forces. Therefore, the volumes and frequency of detachment of these droplets are described by an extreme value probability density function (pdf). The time integral of pdf – cumulative distribution function (cdf) – represents the normalized cumulative oil recovery, known as recovery factor ().
The GEV distribution of a random variable has outputs x, – location parameter, – scale parameter, and – shape parameter. The following is always true
The pdf of GEV is given by
First, we obtain the normalized recovery factor, by scaling the Amott oil recovery with the corresponding experimental ultimate recovery, . Then, we scale the elapsed time, t of an Amott-cell experiment by the characteristic capillary pressure diffusion time, . The unknown a priori is analogous to that in [50]. The resulting dimensionless time, , replaces x in Equations (2) and (3). Finally, we fit the scaled experimental data to Equation (3) and obtain the characteristic capillary pressure diffusion time () and the GEV fit parameters (, , and ). Thus, the objective function depends on a 4D parameter vector .
The oil recovery is then plotted as dimensionless cumulative oil production, , against dimensionless time, . Using the optimal GEV parameters, the scaled oil-recovery rates are obtained from the GEV pdf (2). All scaled rates and cumulative recoveries are plotted against the square-root-of-time-transformed x-axis.
2.4.2. Finding from a Nonlinear Constrained Nelder-Mead Optimization
We solve the following optimization problem for each experimental :
where are the experimental times, in hours, N is the number of data points, and is the weight of each datum. The early and late times of the experimental data points have increased weights. Using the constrained Nelder-Mead optimization [55] we minimize Equation (4), subject to the condition .
2.4.3. Analysis of Oil Production Dynamics
The fit parameters in the optimal GEV curves depend on variations of the physical characteristics of the specific oil-bine-rock system. Here, we only report qualitative correlations between the GEV modeling outcomes – the “best” characteristic capillary pressure diffusion time (), location parameter (), scale parameter (), and shape parameter () – and physical properties of the system, such as mineral oil viscosity and core-plug permeability.
When we fit a scaled experimental oil recovery to a GEV cdf, the obtained characteristic time scales the rate of oil production and, therefore, the overall time required for the process to complete. Experiments exhibiting fast spontaneous imbibition are characterized by shorter values, whereas longer values indicate a slower imbibition process. Variations in the location, scale, and shape parameters change the cdf curve shape and foreshadow different imbibition mechanisms.
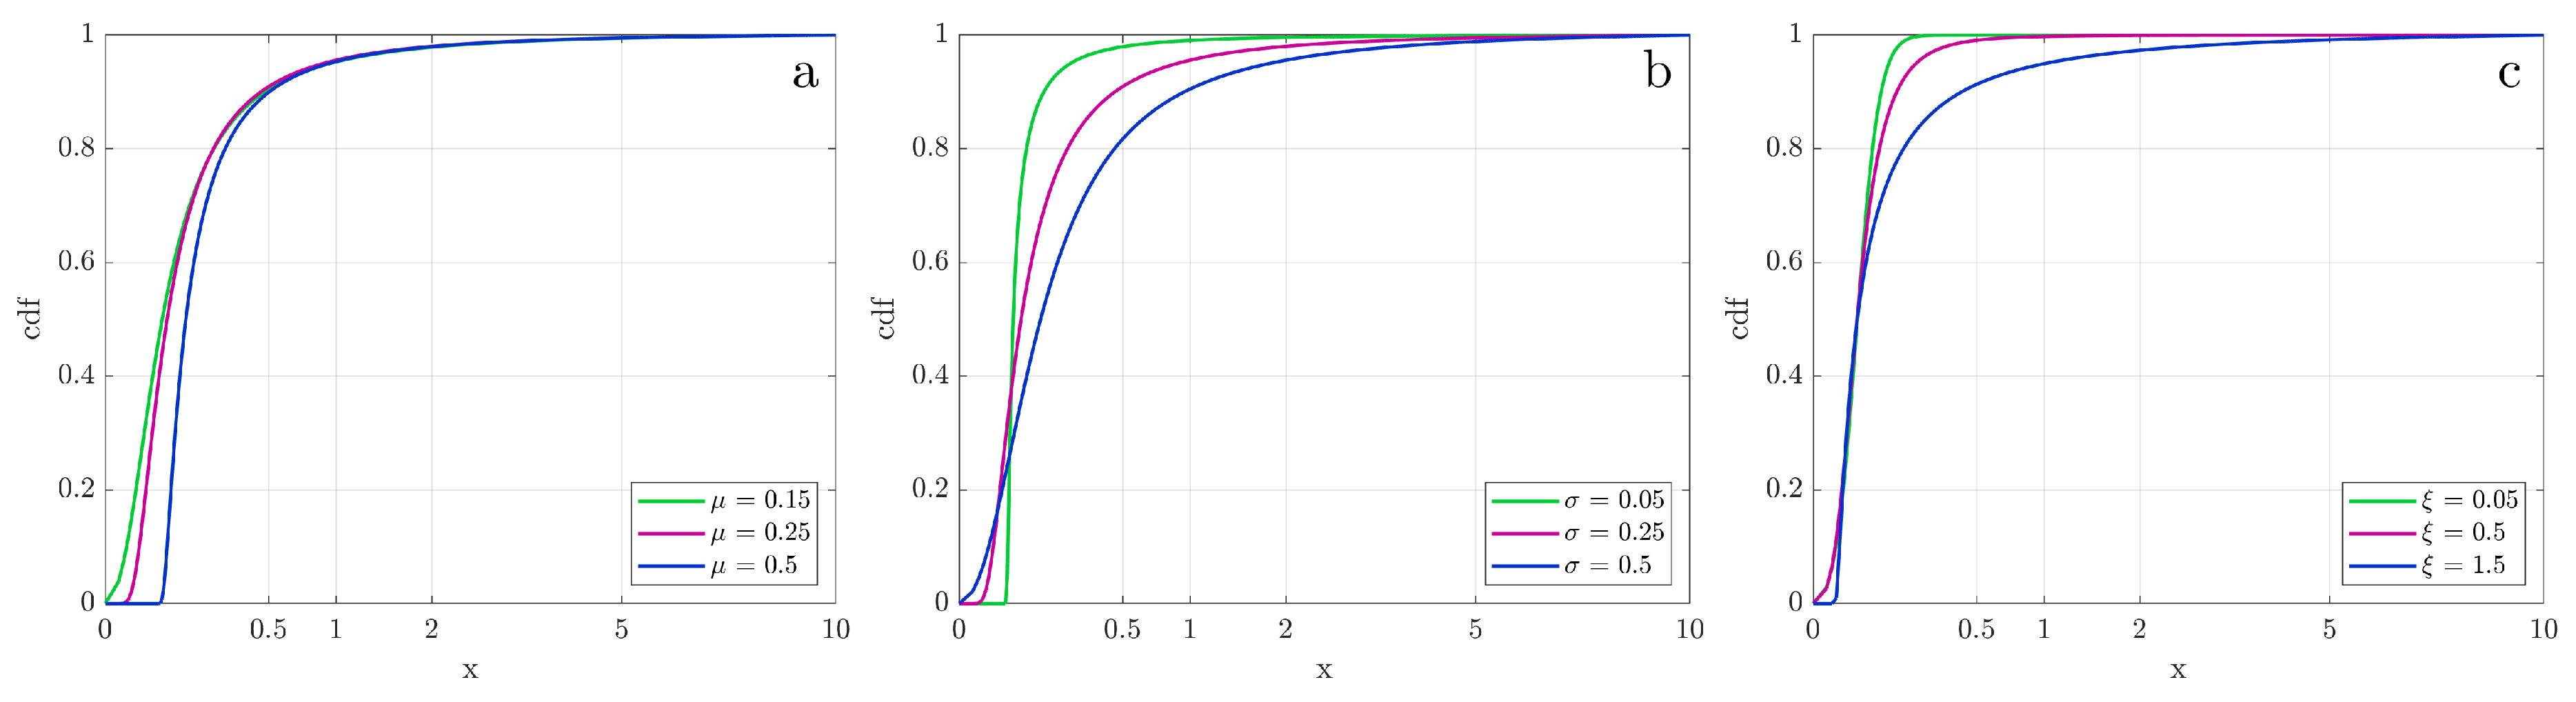
Figure 4 illustrates the normalized GEV cumulative distribution functions () for different sets of parameter values. For visualization purposes, these distributions are plotted against the square-root-transformed x-axis. In our scaling approach, the ends of the GEV curves are pinned to the corresponding upper and lower graph limits of graphs and stretched by the same scaling factors. The location parameter, , is responsible for the initial production delay (induction time). Higher values of the location parameter delay more the onset of oil production and vice versa (Figure 4a). We attribute large values to either a long induction time or slow oil displacement (e.g., to high oil viscosity and/or low rock permeability). The scale parameter, , shapes both ends of the GEV curves, with the right end representing ultimate recovery. Specifically, a large indicates slow initial and late dynamics, whereas a small signifies rapid initial and late dynamics (Figure 4b). Fast oil recovery observed in high-permeability cores and with low-viscosity mineral oil always results in small values. The shape parameter, , determines the tail behavior of the distribution (Figure 4c). A larger suggests a longer tail, and therefore, slower late dynamics, whereas a smaller relates to faster late dynamics. Interactions between the and parameters lead to a number of different distribution shapes.
Figure 4.
The GEV for different location, scale, and shape parameters settings: (a) Varying , =0.25 and =1. (b) Varying , =0.25 and =1. (c) Varying , =0.25 and =0.25.
Figure 4.
The GEV for different location, scale, and shape parameters settings: (a) Varying , =0.25 and =1. (b) Varying , =0.25 and =1. (c) Varying , =0.25 and =0.25.
3. Results and Discussion
3.1. Oil Holdup in Amott Experiments
In spontaneous-imbibition experiments, oil droplets are produced from the porous rock matrix into continuous aqueous phase, but are retained at the outer rock surface. This oil holdup effect is pronounced in experiments with high oil/brine interfacial tension (IFT).
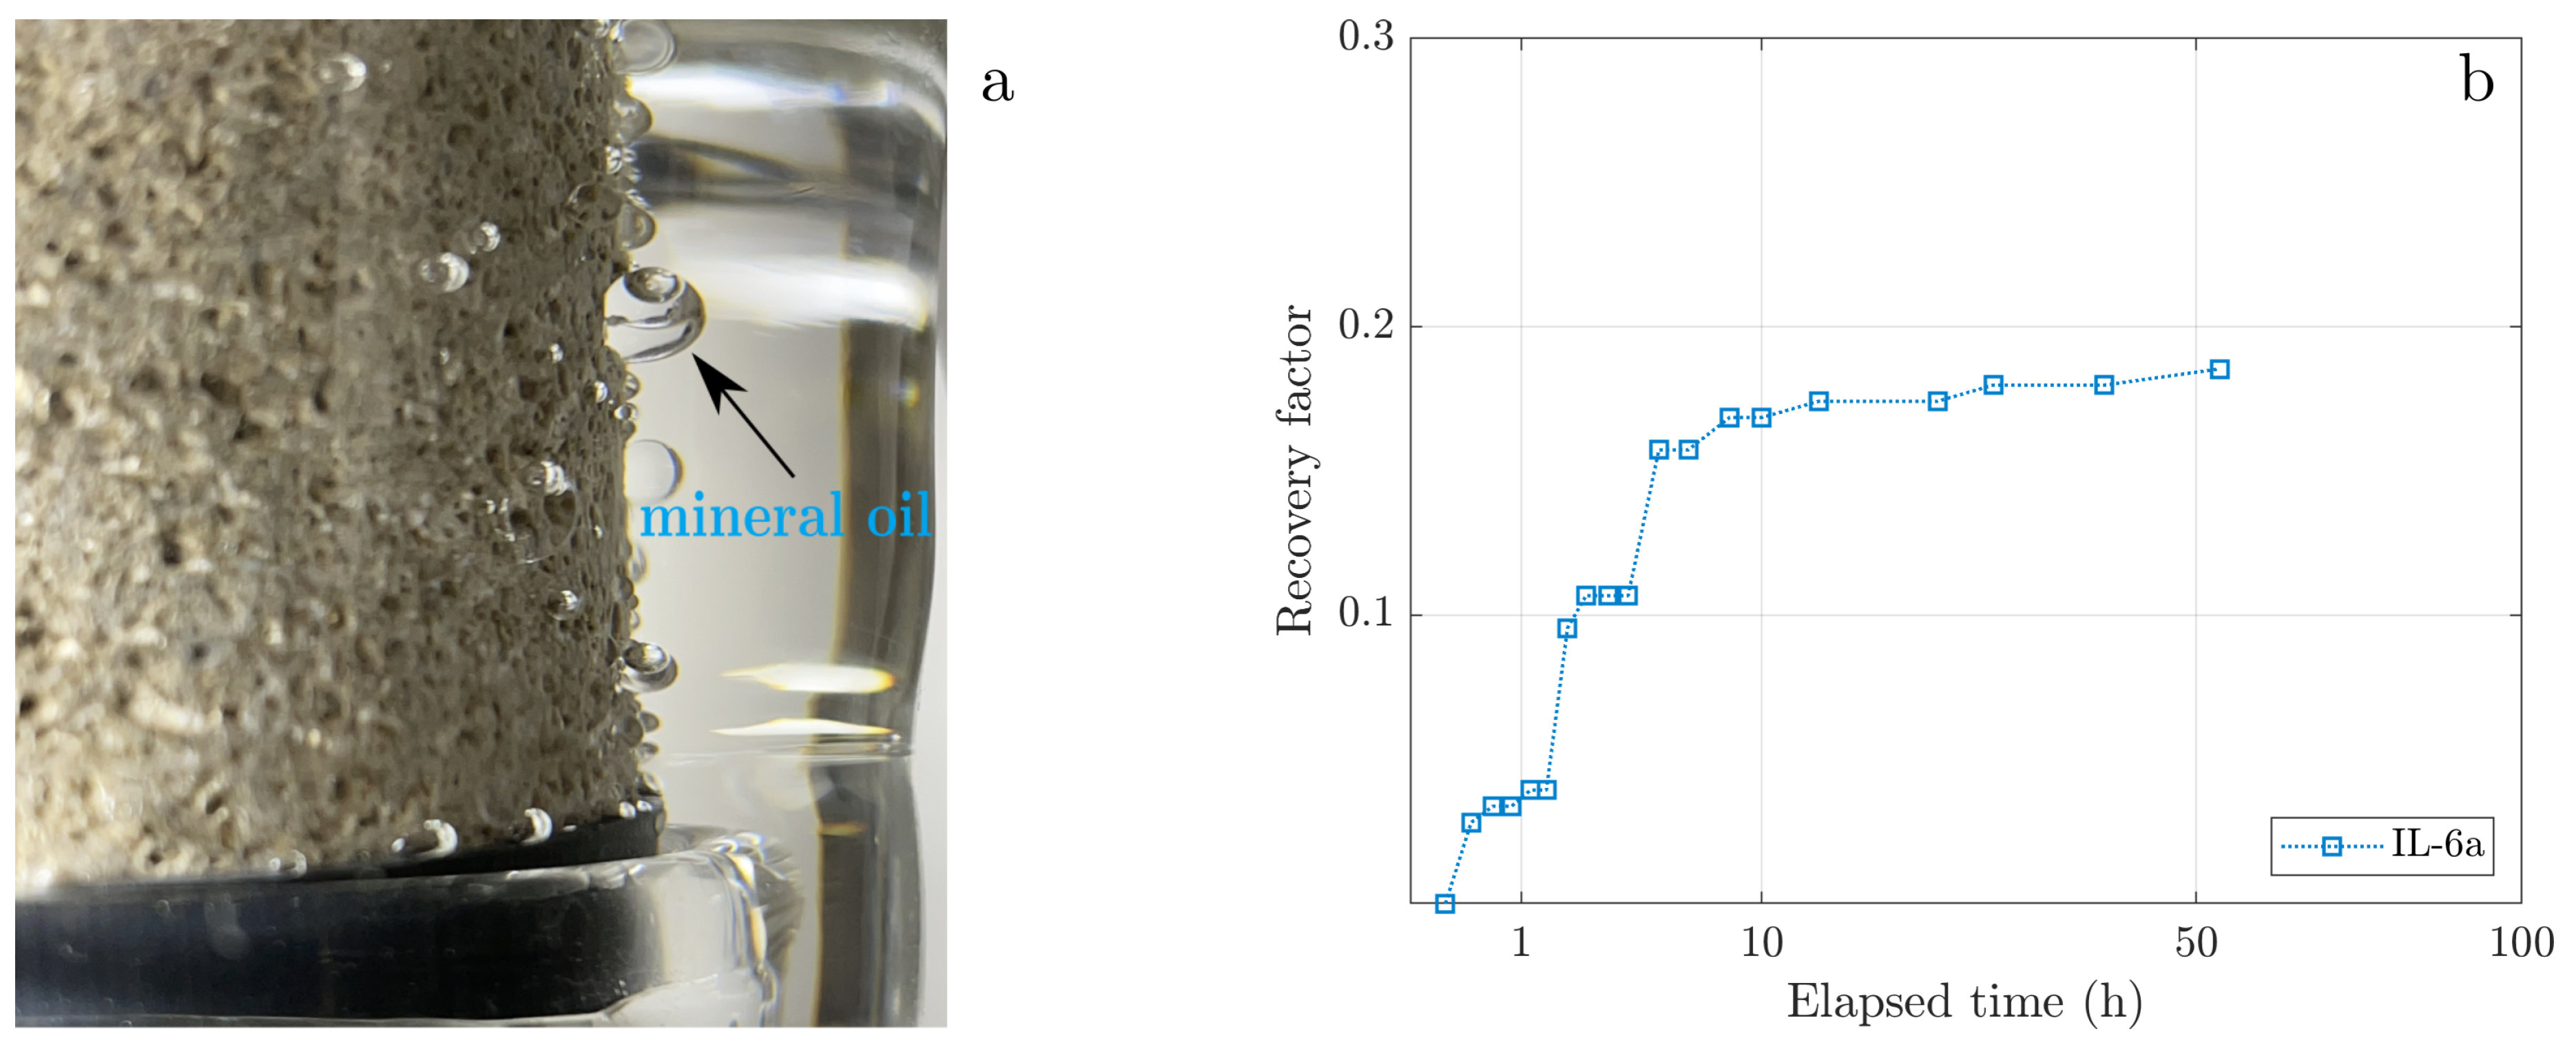
Figure 5a demonstrates the holdup effect for an Indiana limestone rock sample, which was saturated with a brine and followed by a high-IFT mineral oil (52 mN/m). For this IFT, the Bond number is of the order of 0.002 – much below the critical level for gravity segregation suggested by Schechter et al. [23] (see Appendix A). Indeed, the outer rock surface uniformly expels mineral oil along its entire height. This experimental observation agrees with the no gravity-segregation conclusion based on the Bond number.
Figure 5.
Spontaneous imbibition Amott-cell experiment: (a) The effect of oil holdup on the external core plug surface. The released droplets of mineral oil grow large at the core surface and ultimately detach due to buoyancy. (b) Cumulative mineral oil recovery versus square root of time illustrating stepwise oil recovery caused by the oil holdup effect.
An inflated oil droplet detaches from the outer rock surface only after it snaps off from an oil flow path that extends to the core surface. This process is slow, because it is driven by the always decreasing local capillary pressure. Because both fluids are incompressible and volume is conserved, the pressure decrease during an external snap-off is transmitted through the entire system of interfaces. In larger cores, each such pressure pulse is attenuated by the rock and fluid compressibilities as it propagates away from a snap off-site. Moreover, even after external snap-off a drop can remain on the external rock surface due to contact line pinning or favorable wettability of the outer rock surface. Consequently, the oil that was produced but remained on the external core surface would not immediately contribute to the recorded production history. This phenomenon obscures actual production dynamics by delaying production onset (or introducing an “induction time”), and adding noise to the recovery history in the form of step-wise patterns.
Figure 5b demonstrates step-wise cumulative production history for the core plug shown in Figure 5a. This core plug was saturated with mineral oil to a residual water saturation of 29% and later placed in the Amott cell. The cell remained undisturbed throughout the experiment (i.e., was not shaken), which led to the formation of large oil droplets on the outer core surface. In this case, the oil-production history is characterized by a clear initial induction time and several long periods of zero production. Since it takes time for the exterior oil droplets to inflate enough to detach by buoyancy, the recorded production history is discontinuous. This “staircase” history is less pronounced in samples with homogeneous porosity and small pores.
As detailed in the Materials and Methods section, we implemented several modifications to the classic Amott-cell design and testing procedure. Specifically, we introduced continuous shaking of the Amott cell to reduce the oil holdup effect, and thus smoothing the oil recovery curves. Throughout this manuscript, experiments conducted with shaking are referred to as “dynamic” or “shaker”, while the classic Amott experiments are denoted as “static”. Even though our Bond numbers are quite small, we capped the top and bottom faces of the core plug with glass discs to enforce 1D radial two-phase flow, thus enhancing reliability of the experiments and accuracy of simulating reservoir conditions.
3.2. Results of Imbibition Experiments and GEV Modeling
In this section, we present the results of mineral oil recovery experiments conducted on twin pairs of Indiana limestone core plugs, as detailed in the Materials and Methods section. The parameters of our spontaneous imbibition experiments are summarized in Table 1. Although all 8 core plugs originated from the same Indiana limestone formation, no detailed pore structure analysis was conducted. We do expect reasonable differences in pore structure and surface pore cluster connectivity among the cores used. In our experiments, we varied oil viscosity, rock permeability and, to an unknown extent, pore connectivity, while maintaining relatively uniform oil saturations and using identical brines for imbibition. Below, we demonstrate that our improved Amott test provides more consistent oil-recovery histories compared to the classic Amott test. We also present the results of oil-recovery modeling applying the Generalized Extreme Value (GEV) distribution, and we discuss how the GEV fitting parameters – , , , and – relate to the physical properties of the oil-rock system during spontaneous imbibition. The GEV modeling results are detailed in Table 1. Both experimental and scaled recoveries are plotted against the square-root-transformed time-axis (see Materials and Methods).
3.2.1. High–Viscosity Oil
Figure 6 demonstrates the spontaneous imbibition and GEV modeling results for the core-plug twin pair IL-22/IL-23. This twin pair was saturated with the high–viscosity Oil-2 (see Table 1). Due to the high oil viscosity and low permeability of these samples, oil recovery was slow, with a noticeable initial production delay lasting several hours and ultimate recoveries being reached after approximately 200 hours. Distinct differences are evident between the classic experiment (IL-22) and the modified experiment (IL-23). The static Amott experiment yields a jagged, step-wise oil recovery curve and a slower rate of recovery, significantly influenced by the oil holdup effect. In contrast, the dynamic experiment results in a smoother production history, although with some minor fluctuations. The linear recovery regime vs. the square-root of time can be clearly identified from the experimental data. Some differences in ultimate recovery and induction time are apparently due to the oil-holdup effect, and less likely to different oil saturations. The twin core plugs were simultaneously saturated under the same conditions, but they exhibited different saturation levels (0.81 vs. 0.72). This difference may suggest variations in pore connectivity and structure between the twin plugs. The 8% difference in initial oil saturations is unlikely to impact significantly the oil-production history.
Figure 6b presents the GEV modeling results for the IL-22/IL-23 twin pair. The GEV statistics describe detachment of the largest possible drop volumes and, therefore, provide an accurate depiction of both recovery curves. The Materials and Methods section details the effect of GEV parameters on oil-production histories.
To account for the initial production delay, we assigned greater weights to the initial and final data points (see Materials and Methods). During the early period, the GEV model adequately captures the square-root-of-time behavior after the initial delay. In the later stages, the rate of oil recovery is well represented for the dynamic dataset, whereas the static dataset is significantly distorted by the oil-holdup effect, leading to noticeable outliers. Long characteristic times () for IL-22/IL-23 core pair (see Table in Figure 6b) are indicative of a slow imbibition process. The pronounced holdup effect in the static test additionally reduces the imbibition rate, doubling the characteristic time ( h vs. 92 h), required for data normalization. Large values of the location parameter () for both curves indicate significant induction times, in line with experimental observations. The static test yields a notably higher , attributable to the oil-holdup effect. Because delay in production can be caused by oil holdup, the location parameter is an indirect characteristic of the oil holdup, especially for static tests. Large values of the scale parameter () suggest slow dynamics for both datasets. Lastly, the large parameter in the dynamics test(s) indicates a notable recovery-rate decline close to the end of production. Conversely, for the static test, a minimal value of points to fundamental differences in recovery dynamics, predominantly due to the holdup effect.
3.2.2. Low-Viscosity Oil
Next, we examined the influence of oil viscosity on the GEV-fitting parameters through the interdependent Amott tests on the core twin pair IL-20a/IL-21a, which originates from the same core source as the twin pair IL-22/IL-23 (refer to Materials and Methods). Figure 7 presents the spontaneous imbibition and GEV modeling results for IL-20a/IL-21a, saturated with the low-viscosity Oil-1. Both tests were performed using the modified-Amott methodology. As shown in Figure 7a, these modifications resulted in the remarkably consistent oil-production histories. Both recovery curves are smooth and nearly replicate each other, underscoring the excellent reproducibility of oil recovery in parallel experiments.
Compared with the previous core pair, the first significant difference for Oil-1 pair is a shorter induction time, mainly due to reducing mineral oil viscosity by a factor of three (see Table 1). The early recovery dynamics are characterized by a more rapid production of most oil within the initial 5 hours, while achieving ultimate recovery required an additional one hundred hours, indicating slower late-time recovery. The samples showed minimal variability, yielding identical ultimate recovery values. By comparing IL-20a/IL-21a pair with IL-22/IL-23 pair, we conclude a significant reduction in droplet oil holdup effect in terms of both data smoothness and initial induction time when using low-viscosity mineral oil.
Figure 7b presents the GEV theory results for IL-20a/IL-21a. Due to the high reproducibility in production histories for IL-20a/IL-21a, the GEV fit parameters are close (see Table in Figure 7b). The GEV model captures the early-time dynamics well but shows some deviation in the late-time regime. The characteristic time for IL-20a/IL-21a is an order of magnitude shorter compared to IL-22/IL-23, suggesting more efficient water flow into pores containing oil with lower viscosity. The location parameter is 2.5-3 times smaller, indicative of a shorter induction time. A two times lower scale parameter suggests faster dynamics for IL-20a/IL-21a relative to IL-22/IL-23. Finally, the high value of the shape parameter for IL-20a/IL-21a implies a slow reduction in oil production rate towards the end of the imbibition process.
Figure 8a compares static and dynamic experiments for the similar core pair IL-6/IL-7, which was saturated with the low-viscosity Oil-1. This core set shows faster oil recovery dynamics, characterized by a steep slope of the early recovery and reaching the ultimate recovery within 50 hours. In the first several hours, the static and dynamic experiments demonstrate similar recovery dynamics. However, the difference becomes evident after 4 hours. The accumulation of oil droplets on the outer core surface delays oil production and distorts the recovery dynamics. After 16 hours, the static Amott cell was manually agitated, resulting in the detachment of oil droplets and, thus restoring the actual recovery dynamics. Based on the experiments with the low-viscosity oil, we conclude that our improved Amott tests significantly mitigated the impact of the oil holdup effect on the recovery dynamics, but did not affect the induction time or ultimate recovery.
Figure 8b presents the results of the GEV scaling for the twin core pair IL-6/IL-7. The GEV model captures well the square root of time region in the recovery curves during the early time periods. As oil production slows during the later stages, the static data are obscured by the oil holdup effect, making the outliers clearly visible. The shaking data appear smooth and are well captured by the GEV model. Because the twin pairs IL-6/IL-7 and IL-20a/IL-21a were saturated with the same mineral oil and have very similar petrophysical characteristics, the GEV fitting parameters are close. Note, that lower values of the parameter for the twin pair IL-6/IL-7 compared to similar pair IL-20a/IL-21a indicate faster production, consistent with the experimental observations.
To assess the reproducibility of results under shaking conditions, we cleaned, dried, and resaturated the twin pair IL-6/IL-7. The subsequent oil recovery histories, now denoted as the twin pair IL-6b/IL-7b, are displayed in Figure 9a. As expected, the oil-recovery curves for both samples are smooth and show similar dynamics. These results also replicate the ultimate recovery and the dynamics observed in the initial shaking experiment shown in Figure 8a. We confirm the excellent repeatability of both the experimental and modeling results by comparing the GEV fit parameters in these two series of experiments in Figure 9b, which are in good agreement.
3.2.3. High-Permeability Core
We further explored spontaneous imbibition for the core twin pair IL-11a/IL-15a characterized by an order of magnitude greater permeability (see Table 1). Figure 10a presents the experimental findings for this core-plug set, which was saturated with the high-viscosity Oil-2. Both tests were conducted using dynamic conditions. The early phase of the recovery process is notably fast, highlighted by a rapid increase of cumulative production. The delay in the production onset is minimal. For sample IL-11a, the transition from the quick early recovery to the slower late-time dynamics reflects a minimal oil-holdup effect. The decrease in production rate during the later stages is also rapid, reaching a plateau in just 5 hours, which is faster than in any other all experiments discussed previously. The notable difference in ultimate recovery between these core plugs can be attributed to their different pore structures, because they originated from different cores.
Figure 10b displays the GEV-scaled oil recovery for the twin pair IL-11a/IL-15a. The fit is very accurate, highlighting the benefits of the modified Amott test. Comparing the GEV fit parameters with those of other twin pairs, we find that pair IL-11a/IL-15a exhibits the smallest location and shape parameters. This indicates that cores with higher permeability exhibit the shortest induction times and the most rapid recovery dynamics among the recovery histories discussed. Based on these experimental findings, we conclude that permeability is the principal factor affecting the rate of mineral-oil production from strongly water-wet heterogeneous carbonate cores.
3.2.4. Summary
Figure 6a–Figure 10a demonstrate that our modifications of the Amott-cell experiment effectively reduce the oil-holdup end effect, producing smoother and reproducible oil-recovery histories. We emphasize that accurate and frequent data recording is insufficient to acquire meaningful recovery dynamics in imbibition experiments with pronounced oil holdup. Appendix B illustrates that a spontaneous-imbibition experiment conducted with a high data acquisition rate (two data points per minute), yet without core agitation, does not overcome the oil holdup effect. We contend that only experiments that involve continuous shaking of the core plugs can yield recovery dynamics unaffected by the oil holdup effect. Additionally, the developed non-destructive sealing technique allows for the reuse of core plugs without contamination. Imbibition experiments conducted with the same pairs of cores exhibit remarkable reproducibility of oil-recovery dynamics in sequential experimental runs, as illustrated in Figure 9a.
In all reported spontaneous-imbibition experiments, we consistently observed an initial delay of oil production, which is rarely seen in initially water-free core plugs (100% initial oil saturation) of the same geometry [7]. Therefore, we conclude that, irrespective of the core geometry, the observed induction time is indicative of spontaneous imbibition into core plugs containing initial water. It is well-known [18,56] that in cores with initial water saturation the complex oil production mechanisms (piston-type Main Terminal Meniscus (MTAM) invasion, corner film swelling, cooperative pore body invasion and snap off) are fundamentally different than just the piston-type water invasion of water-free cores [42]. Imbibition induction time is particularly significant in limestone core samples, which are characterized by the large pore body-throat aspect ratios and multimodal porosity [1]. Multiscale, complex pore geometry and topology require more time for the MTAMs to invade sufficiently to produce first measurable oil detaching from the core surface. Additionally, we confirmed experimentally that rock permeability and oil viscosity are significant factors influencing the induction period of oil production. We believe this finding is general, however, more research is needed to assess importance of these factors in mixed(oil)-wet systems.
In micritic limestone reservoir rock [1] under countercurrent imbibition, tiny oil droplets emerge from the micritized grains into the large macropores and fractures that are full of water from a peripheral water drive that imposes a small, reservoir-scale viscous pressure gradient. Since the accommodation space in the subsurface rock is small, the emerging droplet size distribution is truncated from those in the Amott test. But injected water flow in the connected macro pore-fracture system detaches the largest emerging droplets, and reconnects and carries them to the producers. This picture is too simplistic, because rock mixed wettability modifies oil-droplet behavior relative to this work; more details will appear in the subsequent paper.
The smooth oil-recovery dynamics engendered by our modifications of the Amott test, is accurately modeled using the GEV statistical model, as demonstrated in Figure 6b–Figure 10b. The four GEV-model parameters – , , , and – are directly related to the different values and spatial distributions of the physical properties of the oil-water-rock systems. We only report qualitative correlations between the optimized GEV distributions and the key physical characteristics of the imbibition process, such as oil viscosity and rock permeability. Figure 11 summarizes all scaled dimensionless cumulative-oil recoveries and the corresponding scaled oil-recovery rates obtained from the GEV statistics (see Materials and Methods). Clearly, the scaled oil-production and recovery-rate curves form three clusters determined by the core and oil properties. Experiments IL-20a/IL-21a, IL-6/IL-7, and IL-6b/IL-7b (solid lines), which use the same oil and have similar core characteristics, exhibit similar behaviors and can be described by a universal GEV curve (Cluster 1). The GEV scaling results for the high oil-viscosity experiments (IL-22/IL-23, dashed lines) reflect the initial delay in oil production and lower production rates (Cluster 2), whereas for experiments with high core-plug permeability (IL-11a/IL-15a, dash-dotted lines), GEV scaling indicates short experimental durations and high rates of oil production (Cluster 3).
4. Conclusions
We devise a modified Amott cell that reduces the external-surface oil-holdup effect and produces smooth(er) oil-recovery histories. We demonstrate that the combination of our modifications is unique and necessary to eliminate or mitigate experimental artifacts. In contrast, relying solely on the high-frequency data acquisition rate does not guarantee artifact-free data. For low Bond numbers, our method encourages radial flow by non-destructively blocking flow paths from the top and bottom core faces. Therefore, the developed methodology allows for repeated testing of the same samples and reduces experimental uncertainty. Using water-wet Indiana limestone rock samples intially saturated with brine and mineral oil, we demonstrated high reproducibility of the oil recovery curves in both parallel and sequential experimental runs.
Next, we investigated the effect of oil viscosity and rock permeability on the recovery dynamics. For the first time, our findings reliably and repeatedly demonstrate the initial delay in oil production (induction time) in all samples with finite initial water saturation. In our experiments with water-wet Indiana limestone, the delay is influenced by both oil viscosity and rock permeability. As previously reported, the induction time was mainly controlled by rock wettability [15]. Therefore, our results now reveal other factors, specifically oil viscosity and rock permeability, that contribute to the induction time constituting new insights into previously overlooked physical phenomenon.
For the first time, experimental oil-recovery histories were modeled using the Generalized Extreme Value (GEV) statistics. Our GEV model uses four fit parameters to capture oil-recovery dynamics. Analysis of the GEV-fitting parameters reveals systematic correlations with the physical properties of the oil-rock systems. Specifically, the characteristic capillary-pressure diffusion times, , are shorter for the low-viscosity oil and high-permeability core tests, representing faster oil-production rates. The location parameter, , is larger in experiments with high-viscosity oil, signaling a more pronounced initial production delay. The scale parameter, , is least in tests with higher core permeability, suggesting that in spontaneous imbibition core permeability dominates oil viscosity. Larger shape parameter, , controls decline rate of oil production towards the end of the imbibition process. An extension of this work to the field scale will be introduced in the subsequent paper on the mixed-wet rock-crude oil-reservoir limestone core systems.
Author Contributions
Conceptualization, T.W.P. and C.J.R.; methodology, T.W.P., K.M.K., M.P.Y. and M.M.; software, T.W.P.; validation, T.W.P. and K.M.K.; formal analysis, T.W.P., K.M.K. and M.P.Y.; investigation, T.W.P., C.J.R., K.M.K. and M.P.Y.; resources, T.W.P., K.M.K. and M.P.Y.; data curation, T.W.P. and K.M.K.; writing—original draft preparation, T.W.P., K.M.K., and M.P.Y.; writing—review and editing, T.W.P., C.J.R., K.M.K., M.P.Y., A.G., S.A. and A.Y.; visualization, T.W.P. and K.M.K.; supervision, T.W.P.; project administration, T.W.P., A.G., S.A. and A.Y.; funding acquisition, T.W.P., A.G., S.A. and A.Y. All authors have read and agreed to the published version of the manuscript.
Funding
This research was funded by Saudi Arabian Oil Company. Partial financial support was provided by the baseline research funding to Prof. Patzek.
Institutional Review Board Statement
Not applicable.
Informed Consent Statement
Not applicable.
Data Availability Statement
Not applicable.
Acknowledgments
The authors thank Samuel D. Fontalvo Guzman and Sirisha Kamireddy, ANPERC (KAUST), for their assistance in conducting the laboratory measurements.
Conflicts of Interest
The authors declare no conflict of interest.
Appendix A
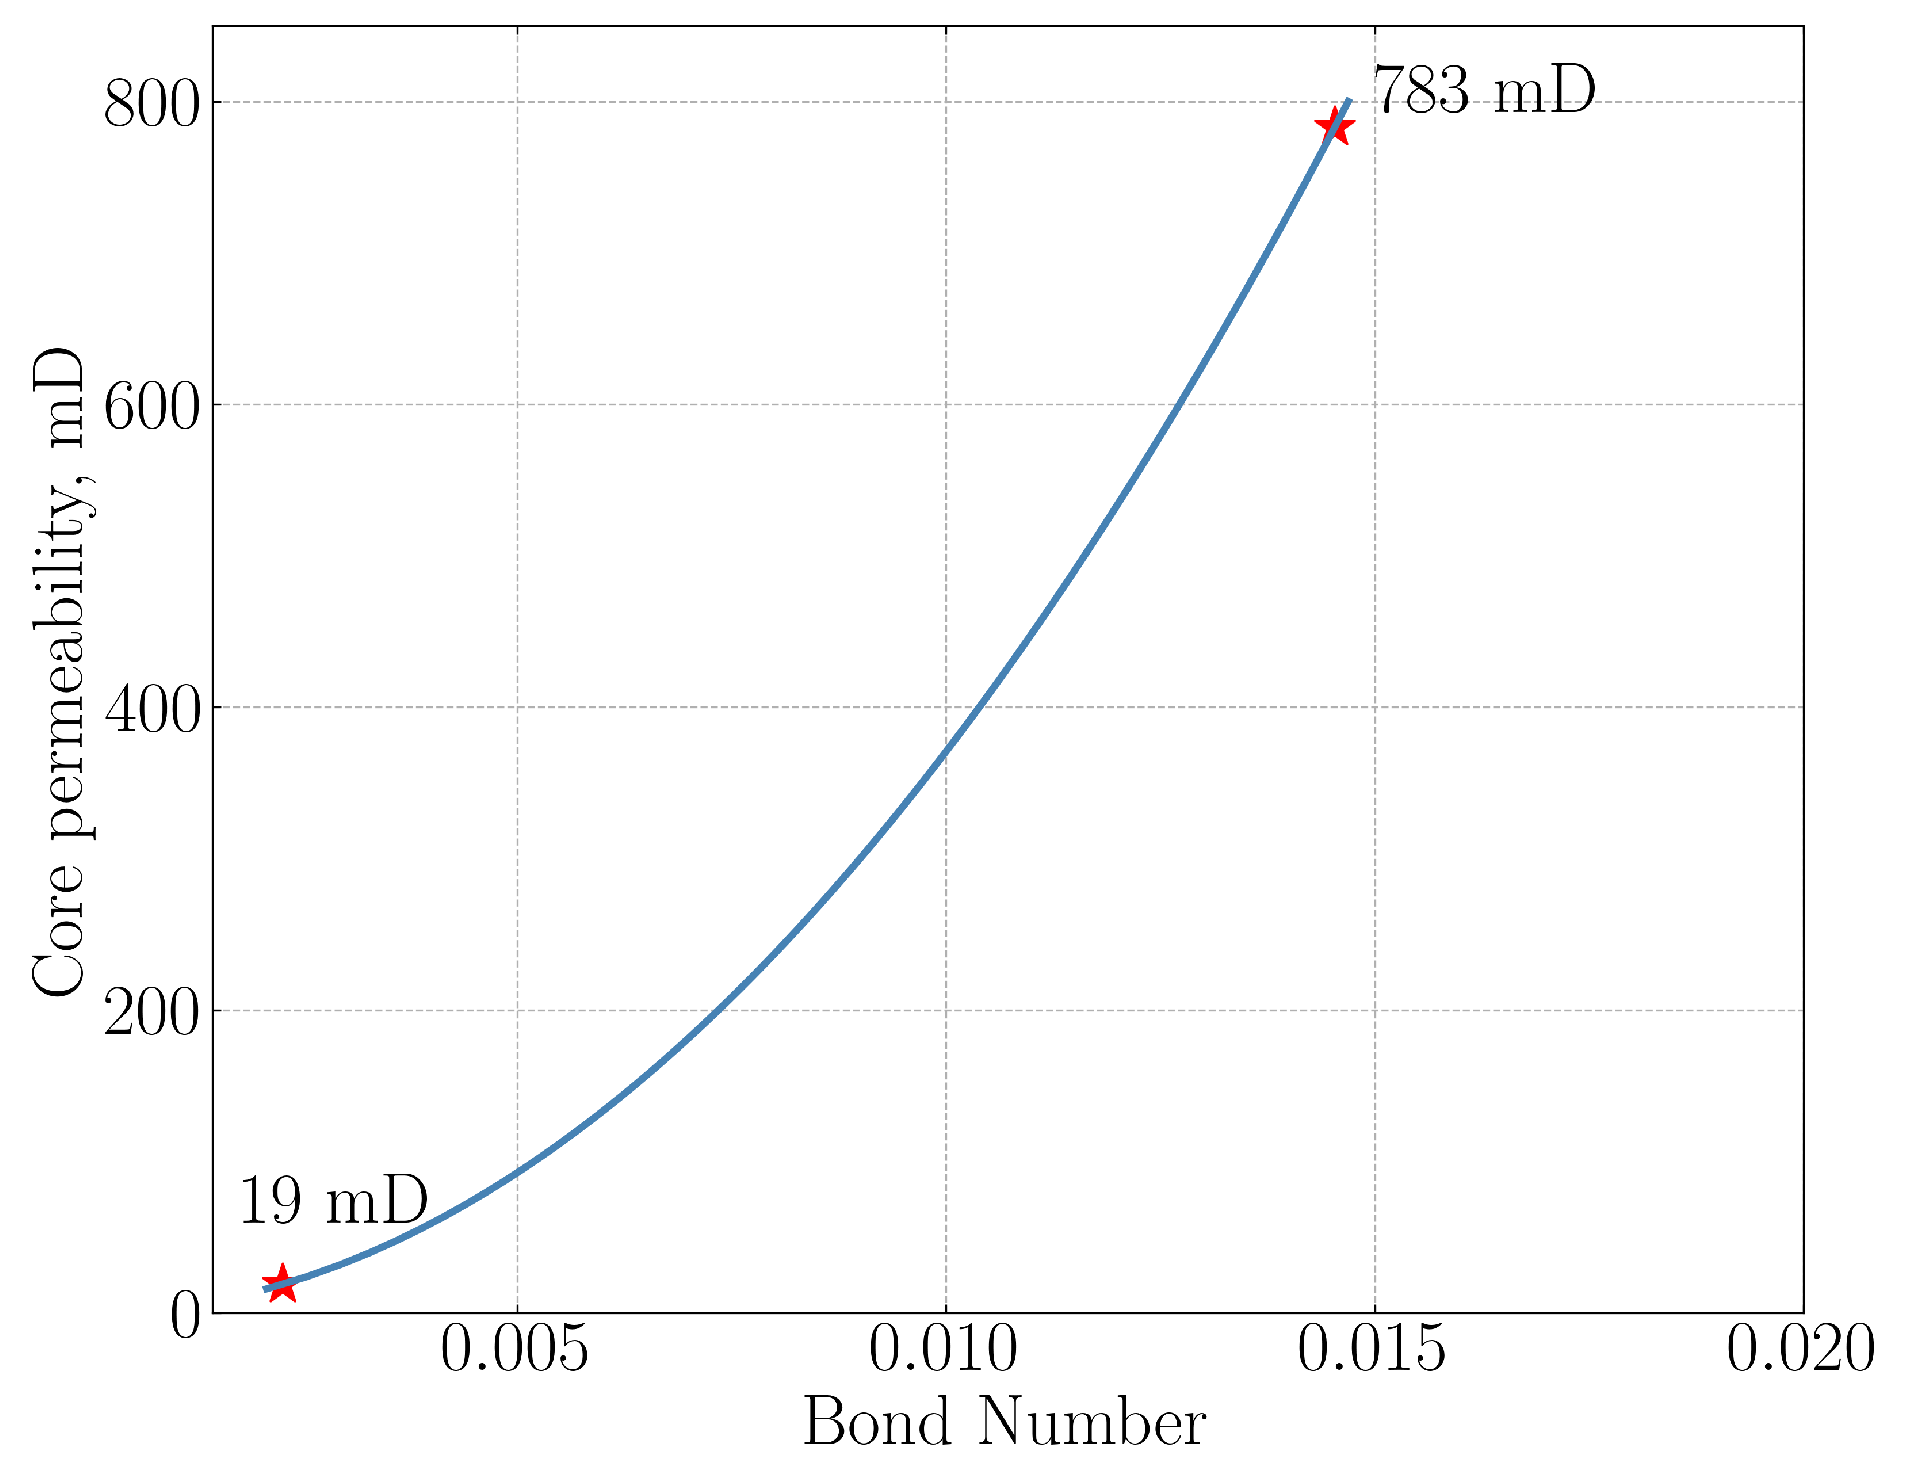
Figure A1 illustrates the calculated Bond number () for the permeability range used in the current study (see Table 1). The Bond number represents the ratio of gravitational to capillary forces, providing insights into the dominant forces driving spontaneous imbibition at the core level. The calculations were performed using Equation (A1) based on [23]:
where is the coefficient for the capillary tube model, =1.002 g/ml and =0.825 g/ml are the densities of brine and oil at 60 °C, H=3 inches is the height of the core plug, =52 mN/m is the oil/brine interfacial tension, and and k are the core porosity and permeability (detailed in Table 1).
The values represented in Figure A1 range from 0.002 to 0.015 for corresponding core permeabilities between 19 and 783 mD. According to Schechter et al. [23], under these conditions, capillary forces are the main driver of spontaneous imbibition, while the influence of gravitational force is minimal. Consequently, this results in uniform counter-current spontaneous imbibition across all surfaces of a vertical core plug (please refer to Figure 8 in [23]).
Appendix B
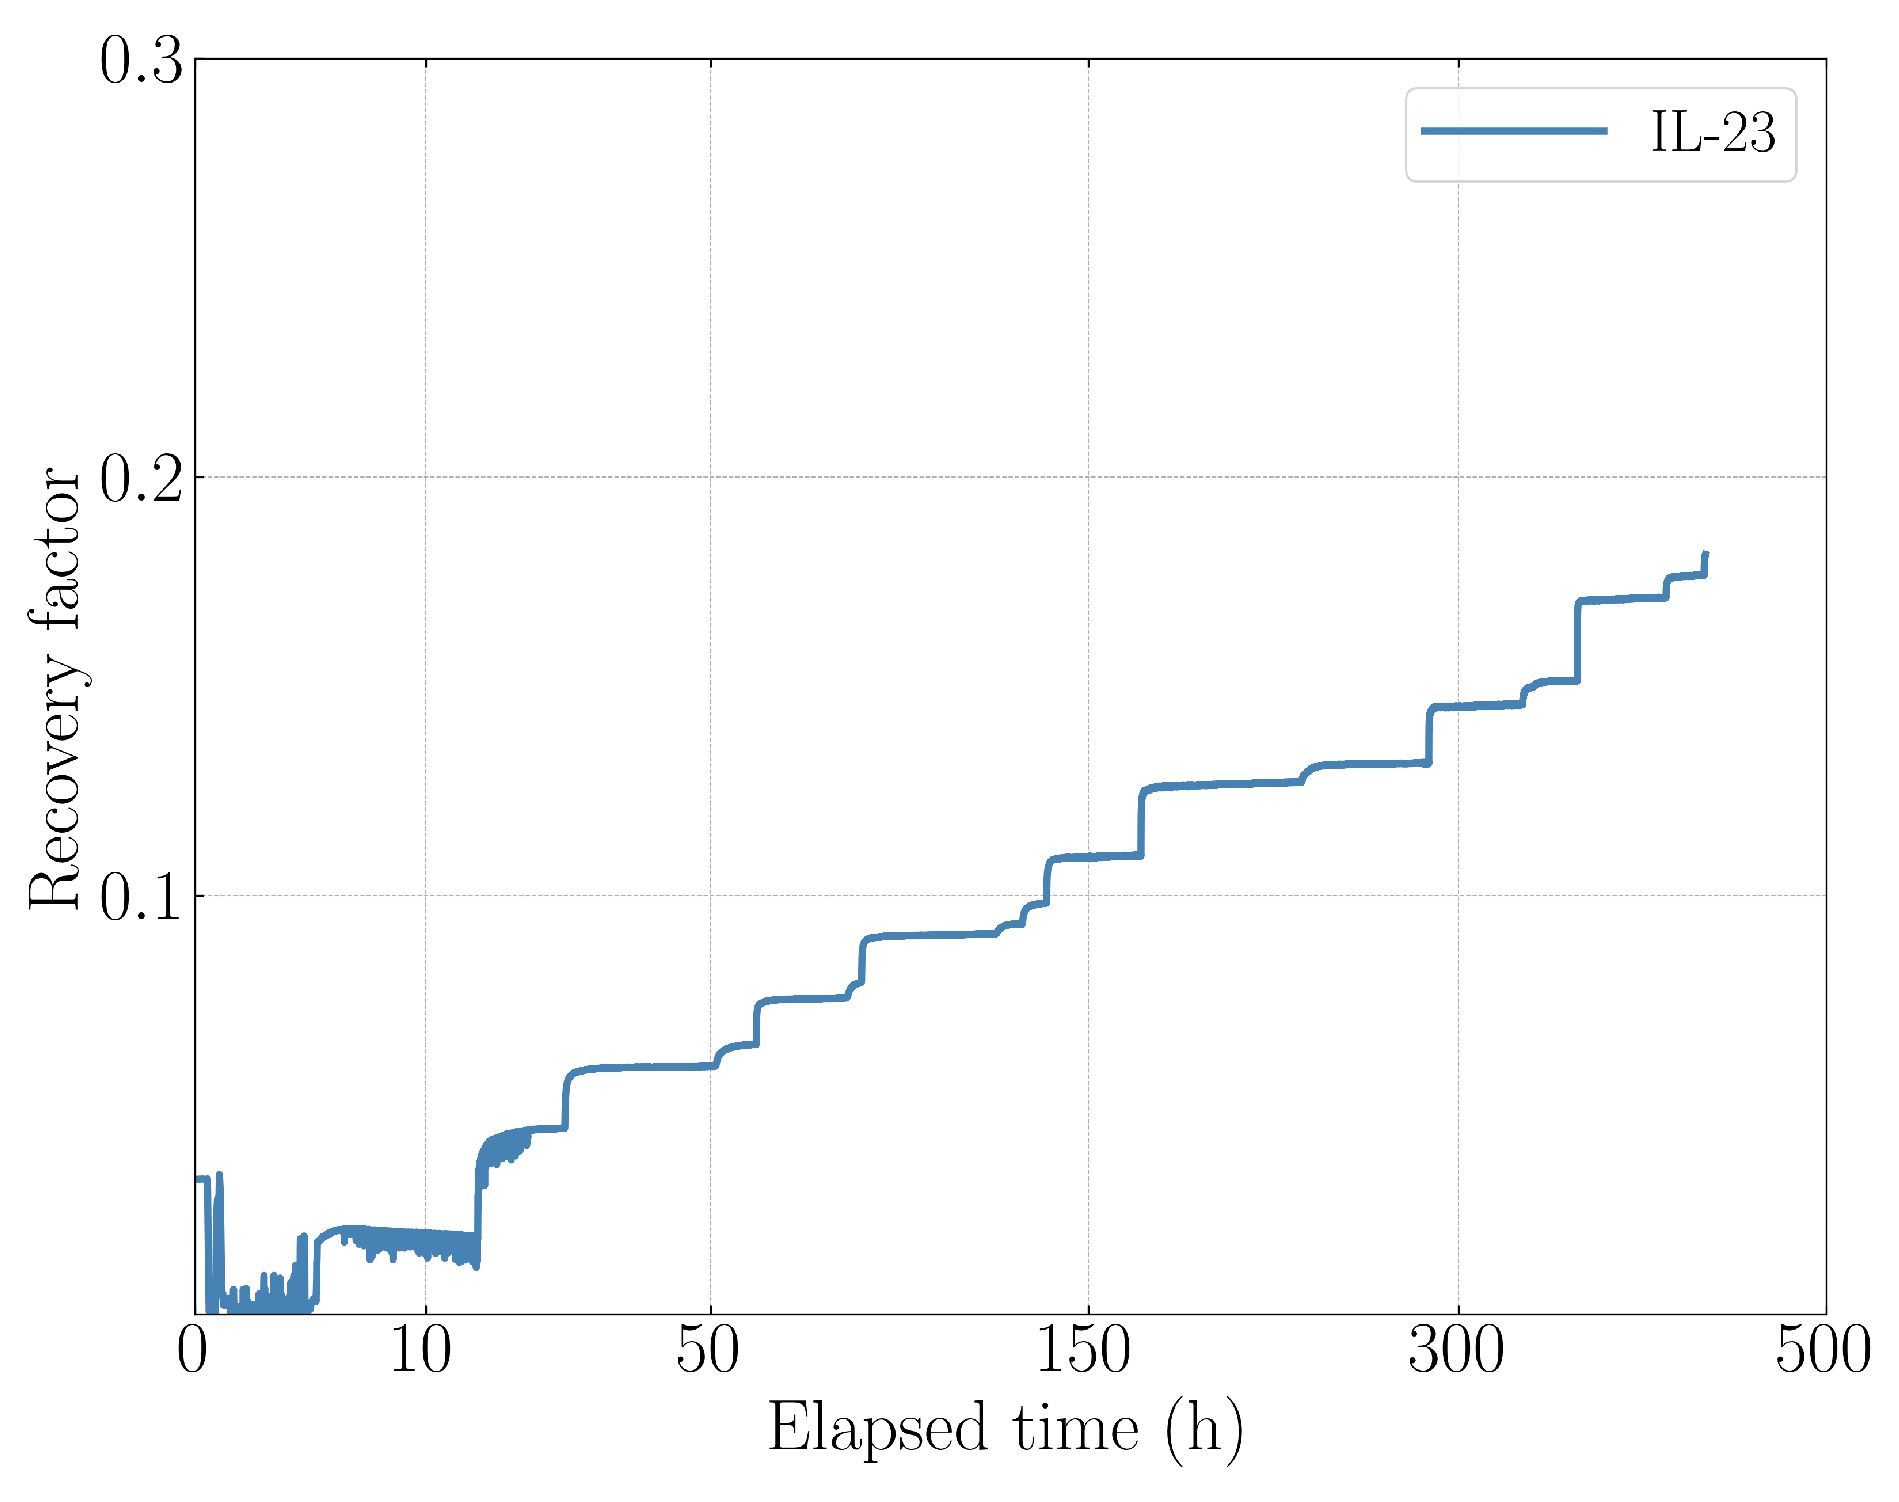
Figure A2 illustrates the mineral oil production history in a spontaneous imbibition experiment performed using the Acoustic Amott System (MetaRock Laboratories). This system allows for automatic monitoring of oil production from a core sample in real-time by measuring oil/brine interface position from acoustic pulse arrival time. For this experiment, an Indiana limestone rock sample (IL-23) was saturated with Oil-1 to a connate water saturation of 28%. The oil-saturated core plug was fixed inside the cylindrical core holder, which was subsequently filled with a brine. Mineral oil recovery was recorded at a frequency of two data points per minute. The resulting production curve exhibits a stepwise pattern, as demonstrated in Figure A2, highlighting a strong oil holdup effect. This observation emphasizes that a high data acquisition rate is insufficient to ensure a smooth recovery curve, emphasizing the importance of continuous shaking to mitigate the oil holdup effect.
Figure A2.
Cumulative mineral oil recovery in spontaneous imbibition experiment performed using the Acoustic Amott System (MetaRock Laboratories) with high data acquisition rate.
Figure A2.
Cumulative mineral oil recovery in spontaneous imbibition experiment performed using the Acoustic Amott System (MetaRock Laboratories) with high data acquisition rate.
References
- Patzek, T.W.; Saad, A.M.; Hassan, A. Multimodal Carbonates: Distribution of Oil Saturation in the Microporous Regions of Arab Formations. Energies 2022, 15, 1243. [Google Scholar] [CrossRef]
- Lenormand, R.; Zarcone, C.; Sarr, A. Mechanisms of the Displacement of One Fluid by Another in a Network of Capillary Ducts. Journal of Fluid Mechanics 1983, 135, 337–353. [Google Scholar] [CrossRef]
- Zhao, B.; MacMinn, C.W.; Juanes, R. Wettability Control on Multiphase Flow in Patterned Microfluidics. Proceedings of the National Academy of Sciences 2016, 113, 10251–10256. [Google Scholar] [CrossRef] [PubMed]
- Amott, E. Observations Relating to the Wettability of Porous Rock. Petroleum Transactions, AIME 1959, 216, 156–162. [Google Scholar] [CrossRef]
- Alaamri, J.; Chandra, V.; Addassi, M.; Hoteit, H. Experimental and Numerical Investigation of Spontaneous Imbibition in Multilayered Porous Systems. Energy & Fuels 2023, 37, 11694–11706. [Google Scholar] [CrossRef]
- Fernø, M.; Haugen, Å.; Wickramathilaka, S.; Howard, J.; Graue, A.; Mason, G.; Morrow, N. Magnetic Resonance Imaging of the Development of Fronts During Spontaneous Imbibition. Journal of Petroleum Science and Engineering 2013, 101, 1–11. [Google Scholar] [CrossRef]
- Fernø, M.; Haugen, A.; Brattekas, B.; Morrow, N.; Mason, G. Spontaneous Imbibition Revisited - A New Method to Determine Kr and Pc by Inclusion of the Capillary Backpressure. In Proceedings of the Proceedings. EAGE Publications BV; 2015. [Google Scholar] [CrossRef]
- Graue, A.; Viksund, B.G.; Eilertsen, T.; Moe, R. Systematic Wettability Alteration by Aging Sandstone and Carbonate Rock in Crude Oil. Journal of Petroleum Science and Engineering 1999, 24, 85–97. [Google Scholar] [CrossRef]
- Cobos, J.E.; Sandnes, M.; Steinsbo, M.; Brattekas, B.; Sogaard, E.G.; Graue, A. Evaluation of Wettability Alteration in Heterogeneous Limestone at Microscopic and Macroscopic Levels. Journal of Petroleum Science and Engineering 2021, 202, 108534. [Google Scholar] [CrossRef]
- Morrow, N.; Ma, S.; Zhou, X.; Zhang, X. Characterization of Wettability from Spontaneous Imbibition Measurements. Journal of Canadian Petroleum Technology 1999, 38. [Google Scholar] [CrossRef]
- Zhou, X.; Morrow, N.; Ma, S. Interrelationship of Wettability, Initial Water Saturation, Aging Time, and Oil Recovery by Spontaneous Imbibition and Waterflooding. SPE Journal 2000, 5, 199–207. [Google Scholar] [CrossRef]
- Ghedan, S.G.; Canbaz, C.H.; Mtawaa, B. Effect of Shape Factor, IFT and Amott Method Derived Wettability on the Imbibition Process. In Proceedings of the International Petroleum Technology Conference held in Doha, Qatar, 7–9 December 2009; 2009. [Google Scholar] [CrossRef]
- Clerke, E.; Funk, J.; Shtepani, E. Spontaneous Imbibition of Water into Oil Saturated M_1 Bimodal Limestone. In Proceedings of the International Petroleum Technology Conference, Beijing, China, March 2013; 2013. [Google Scholar] [CrossRef]
- Tang, G.Q.; Firoozabadi, A. Effect of Pressure Gradient and Initial Water Saturation on Water Injection in Water-Wet and Mixed-Wet Fractured Porous Media. SPE Reservoir Evaluation & Engineering 2001, 4, 516–524. [Google Scholar] [CrossRef]
- Fernø, M.A.; Torsvik, M.; Haugland, S.; Graue, A. Dynamic Laboratory Wettability Alteration. Energy & Fuels 2010, 24, 3950–3958. [Google Scholar] [CrossRef]
- Akin, S.; Schembre, J.M.; Bhat, S.K.; Kovscek, A.R. Spontaneous Imbibition Characteristics of Diatomite. J. Petroleum Sci. and Eng. 2000, 25, 149–165. [Google Scholar] [CrossRef]
- Salathiel, R. Oil Recovery by Surface Film Drainage In Mixed-Wettability Rocks. Journal of Petroleum Technology 1973, 25, 1216–1224. [Google Scholar] [CrossRef]
- Patzek, T.W. Verification of a Complete Pore Network Model of Drainage and Imbibition. SPEJ 2001, 6, 144–156. [Google Scholar] [CrossRef]
- Kovscek, A.R.; Wong, H.; Radke, C.J. A Pore-Level Scenario for the Development of Mixed Wettability in Oil Reservoirs. AIChE Journal 1993, 39, 1072–1085. [Google Scholar] [CrossRef]
- Schmatz, J.; Klaver, J.; Jiang, M.; Urai, J.L. Nanoscale Morphology of Brine-Oil-Mineral Contacts in Connected Pores of Carbonate Reservoirs: Insights on Wettability from Cryo-BIB-SEM. In Proceedings of the Day 1 Wed, April 20, 2016; SPE, 2016; p. 16BERG. [Google Scholar] [CrossRef]
- Freer, E.; Svitova, T.; Radke, C. The role of interfacial rheology in reservoir mixed wettability. Journal of Petroleum Science and Engineering 2003, 39, 137–158. [Google Scholar] [CrossRef]
- Hu, X.; Yutkin, M.P.; Hassan, S.; Wu, J.; Prausnitz, J.M.; Radke, C.J. Asphaltene Adsorption from Toluene onto Silica through Thin Water Layers. Langmuir 2018, 35, 428–434. [Google Scholar] [CrossRef] [PubMed]
- Schechter, D.; Zhou, D.; Orr, F. Low IFT Drainage and Imbibition. Journal of Petroleum Science and Engineering 1994, 11, 283–300. [Google Scholar] [CrossRef]
- Kashchiev, D.; Firoozabadi, A. Analytical Solutions for 1-D Countercurrent Imbibition in Water-Wet Media. In Proceedings of the SPE/DOE Improved Oil Recovery Symposium, Tulsa, Oklahoma, April 2002. [Google Scholar] [CrossRef]
- Babadagli, T. Dynamics of Capillary Imbibition When Surfactant, Polymer, and Hot Water Are Used as Aqueous Phase for Oil Recovery. Journal of Colloid and Interface Science 2002, 246, 203–213. [Google Scholar] [CrossRef]
- Xie, X.; Morrow, N.R. Oil Recovery by Spontaneous Imbibition from Weakly Water-Wet Rocks. Petrophysics 2001, 42, 313–322. [Google Scholar]
- Sukee, A.; Nunta, T.; Haruna, M.A.; Kalantariasl, A.; Tangparitkul, S. Influence of Sequential Changes in the Crude Oil-Water Interfacial Tension on Spontaneous Imbibition in Oil-Wet Sandstone. Journal of Petroleum Science and Engineering 2022, 210, 110032. [Google Scholar] [CrossRef]
- Standnes, D.C. Experimental Study of the Impact of Boundary Conditions on Oil Recovery by Co-Current and Counter-Current Spontaneous Imbibition. Energy & Fuels 2003, 18, 271–282. [Google Scholar] [CrossRef]
- Standnes, D.C. Spontaneous imbibition of water into cylindrical cores with high aspect ratio: Numerical and experimental results. Journal of Petroleum Science and Engineering 2006, 50, 151–160. [Google Scholar] [CrossRef]
- Richards, L.A. The Usefulness of Capillary Potential to Soil Moisture and Plant Investigations. J. Agricultural Research 1928, 37, 719–742. [Google Scholar]
- Richards, L.A. Capillary Conduction of Liquids Through Porous Medium. Physics 1931, 1, 318–333. [Google Scholar] [CrossRef]
- Muskat, M. The Flow of Homogeneous Fluids Through Porous Media; McGraw-Hill Book Company, Inc.: New York, 1937. [Google Scholar]
- Rapoport, L.A.; Leas, W.J. Properties of Linear Waterfloods. AIME 1953, 216, 139–148. [Google Scholar] [CrossRef]
- Kashchiev, D.; Firoozabadi, A. Analytical Solutions for 1D Countercurrent Imbibition in Water-Wet Media. SPE Journal 2003, 8, 401–408. [Google Scholar] [CrossRef]
- Schmid, K.S.; Geiger, S. Universal scaling of spontaneous imbibition for water-wet systems. Water Resources Research 2012, 48. [Google Scholar] [CrossRef]
- Schmid, K.; Geiger, S. Universal scaling of spontaneous imbibition for arbitrary petrophysical properties: Water-wet and mixed-wet states and Handy’s conjecture. Journal of Petroleum Science and Engineering 2013, 101, 44–61. [Google Scholar] [CrossRef]
- Schmid, K.S.; Alyafei, N.; Geiger, S.; Blunt, M.J. Analytical Solutions for Spontaneous Imbibition: Fractional-Flow Theory and Experimental Analysis. SPE Journal 2016, 21, 2308–2316. [Google Scholar] [CrossRef]
- Barenblatt, G.I.; Patzek, T.W.; Silin, D.B. The Mathematical Model of Non-Equilibrium Effects in Water-Oil Displacement. SPEJ 2003, 8, 409–416. [Google Scholar] [CrossRef]
- Mason, G.; Fischer, H.; Morrow, N.; Ruth, D. Correlation for the effect of fluid viscosities on counter-current spontaneous imbibition. Journal of Petroleum Science and Engineering 2010, 72, 195–205. [Google Scholar] [CrossRef]
- Mirzaei-Paiaman, A.; Masihi, M. Scaling Equations for Oil/Gas Recovery from Fractured Porous Media by Counter-Current Spontaneous Imbibition: From Development to Application. Energy & Fuels 2013, 27, 4662–4676. [Google Scholar] [CrossRef]
- Bassir, S.M.; Shokrollahzadeh Behbahani, H.; Shahbazi, K.; Kord, S.; Mirzaei-Paiaman, A. Towards prediction of oil recovery by spontaneous imbibition of modified salinity brine into limestone rocks: A scaling study. Journal of Petroleum Exploration and Production Technology 2022, 13, 79–99. [Google Scholar] [CrossRef]
- Silin, D.B.; Patzek, T.W. On the Barenblatt Model of Non-Equilibrium Imbibition. TiPM 2004, 54, 297–322. [Google Scholar]
- Gumbel, E.J. Statistics of Extremes; Columbia University Press: New York, 1958. [Google Scholar]
- Patzek, T.W.; Saputra, W.; Kirati, W.; Marder, M. Generalized Extreme Value Statistics, Physical Scaling, and Forecasts of Gas Production in the Barnett Shale. Energy & Fuels 2019, 33, 12154–12169. [Google Scholar] [CrossRef]
- Saputra, W.; Kirati, W.; Patzek, T. Physical Scaling of Oil Production Rates and Ultimate Recovery from All Horizontal Wells in the Bakken Shale. Energies 2020, 13, 2052. [Google Scholar] [CrossRef]
- Saputra, W.; Kirati, W.; Patzek, T.W. Generalized extreme value statistics, physical scaling and forecasts of gas production in the Haynesville shale. Journal of Natural Gas Science and Engineering 2021, 94, 104041. [Google Scholar] [CrossRef]
- Saputra, W.; Kirati, W.; Patzek, T. Generalized Extreme Value Statistics, Physical Scaling and Forecasts of Oil Production from All Vertical Wells in the Permian Basin. Energies 2022, 15, 904. [Google Scholar] [CrossRef]
- Kaprielova, K.; Yutkin, M.; Gmira, A.; Ayirala, S.; Radke, C.; Patzek, T. Improved Amott Cell Procedure for Predictive Modeling of Oil Recovery Dynamics from Mixed-Wet Carbonates. In Proceedings of the SPE Improved Oil Recovery Conference, Virtual, April 2022. apr 2022. [Google Scholar] [CrossRef]
- Kaprielova, K.; Yutkin, M.; Gmira, A.; Ayirala, S.; Yousef, A.; Radke, C.; Patzek, T. Improved Amott Tests Help Quantify Primary Driving Forces in Spontaneous Imbibition in Water-Wet and Oil-Wet Limestone Rock. In Proceedings of the Middle East Oil, Gas and Geosciences Show, Bahrain, February 2023. mar 2023. [Google Scholar] [CrossRef]
- Patzek, T.W.; Male, F.; Marder, M. Gas Production in the Barnett Shale Obeys a Simple Scaling Theory. Proceedings of the National Academy of Sciences 2013, 110, 19731–19736. [Google Scholar] [CrossRef] [PubMed]
- Saputra, W.; Kirati, W.; Patzek, T. Generalized Extreme Value Statistics, Physical Scaling and Forecasts of Oil Production in the Bakken Shale. Energies 2019, 12, 3641. [Google Scholar] [CrossRef]
- Saputra, W.; Kirati, W.; Patzek, T. Forecast of Economic Tight Oil and Gas Production in Permian Basin. Energies 2022, 15, 43. [Google Scholar] [CrossRef]
- Haider, S.; W., S.; W., P.T. The key physical factors that yield a good horizontal hydrofractured gas well in mudrock. Energies 2020, 13, 2348. [Google Scholar] [CrossRef]
- Saputra, W.; Patzek, T.; Torres-Verdín, C. URTEC-3858983-MS: Physics-Based and Data-Driven Production Forecasting in the Eagle Ford Shale. Society of Petroleum Engineers, SPE/AAPG/SEG Unconventional Resources Technology Conference, Jun 2023. [CrossRef]
- Nelder, J.A.; Mead, R. A Simplex Method for Function Minimization. Computer Journal 1965, 7, 308–313. [Google Scholar] [CrossRef]
- Akin, S.; Schembre, J.M.; Bhat, S.K.; Kovscek, A.R. Spontaneous Imbibition Characteristics of Diatomite. J. Petroleum Sci. and Eng. 2000, 25, 149–165. [Google Scholar] [CrossRef]
Figure 1.
Preparation of a core plug for spontaneous imbibition experiment: (a) Masking the core plug face with a glass disc. (b) Fixing the glass disc with a heat-shrinkable Viton band. (c) Fixing a heat-shrinkable Teflon band above the Viton band. (d) The core plug with masked top and bottom faces.
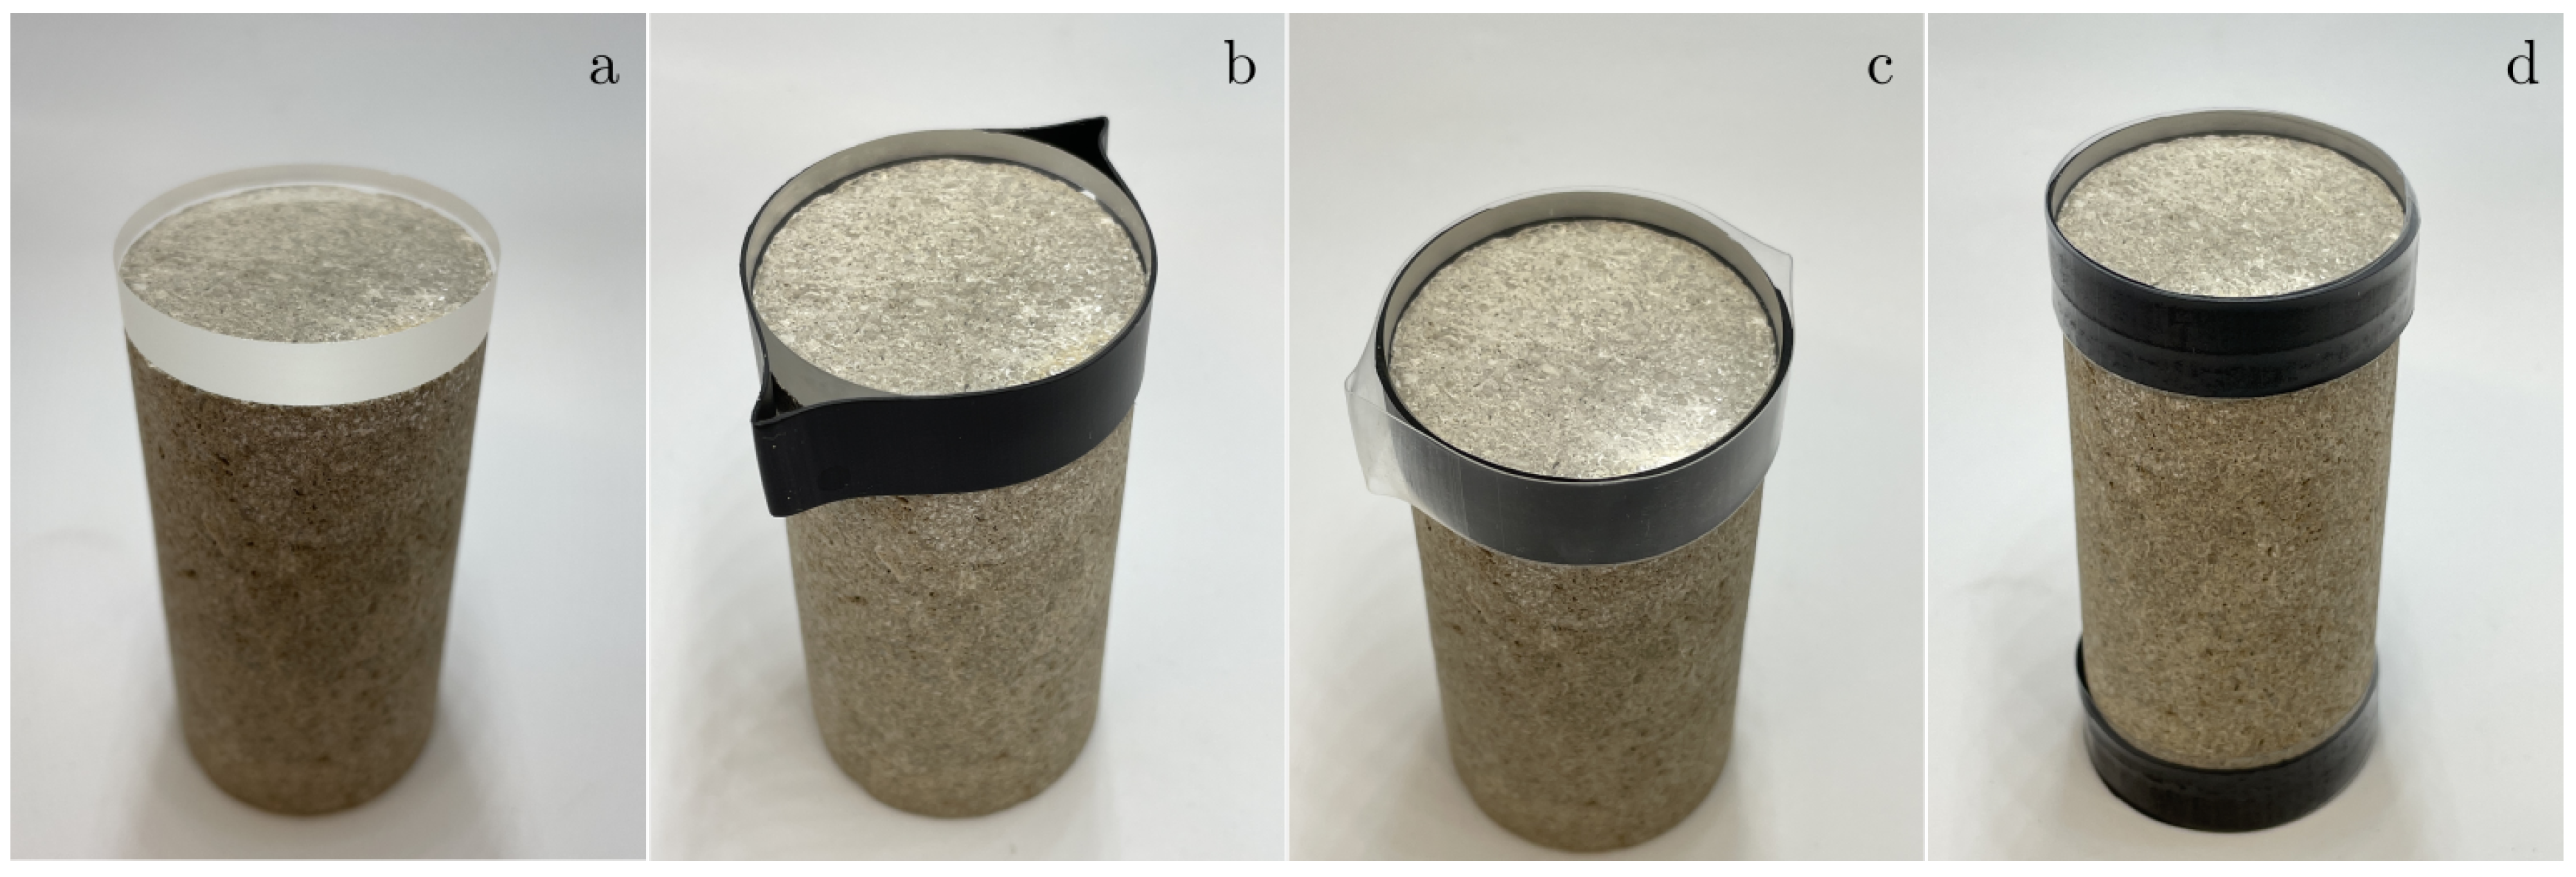
Figure 2.
Spontaneous imbibition experiment with continuous shaking of the Amott cells: (a) A VWR Advanced orbital shaker with the orbit diameter of 19 mm. b) The Amott cells with core plugs mounted on the shaker platform. For comparison, similar core plugs were tested at static conditions (the right two cells in the photo).
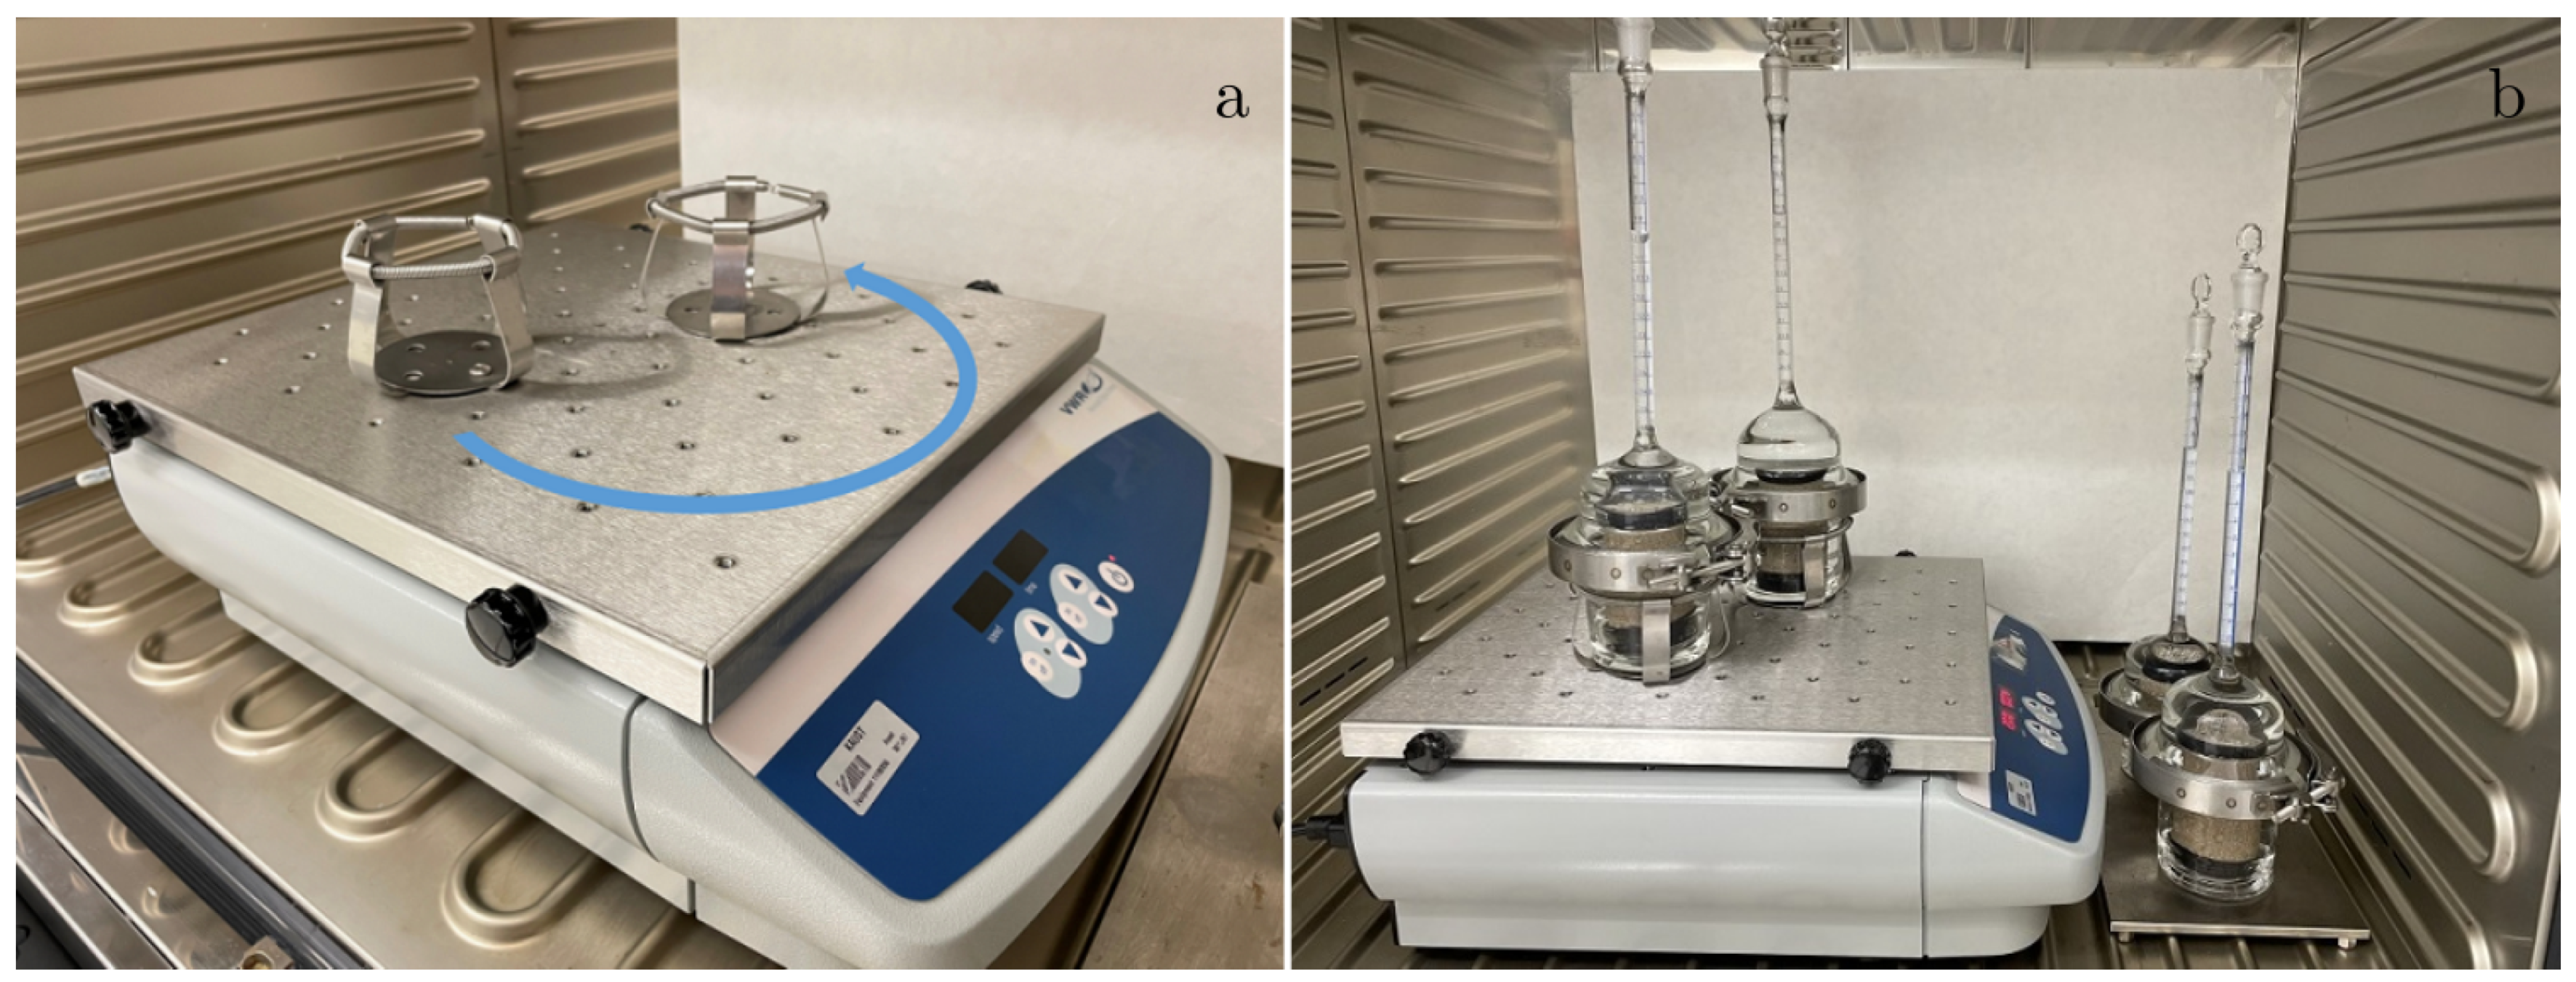
Figure 3.
Custom-made Amott cell: (a) Positioning a core sample into the glass seat. This modification ensures sample lateral stability during shaking. (b) Assembling two flanges of the cell with a clamp. (c) Full view of the modified Amott cell.
Figure 3.
Custom-made Amott cell: (a) Positioning a core sample into the glass seat. This modification ensures sample lateral stability during shaking. (b) Assembling two flanges of the cell with a clamp. (c) Full view of the modified Amott cell.
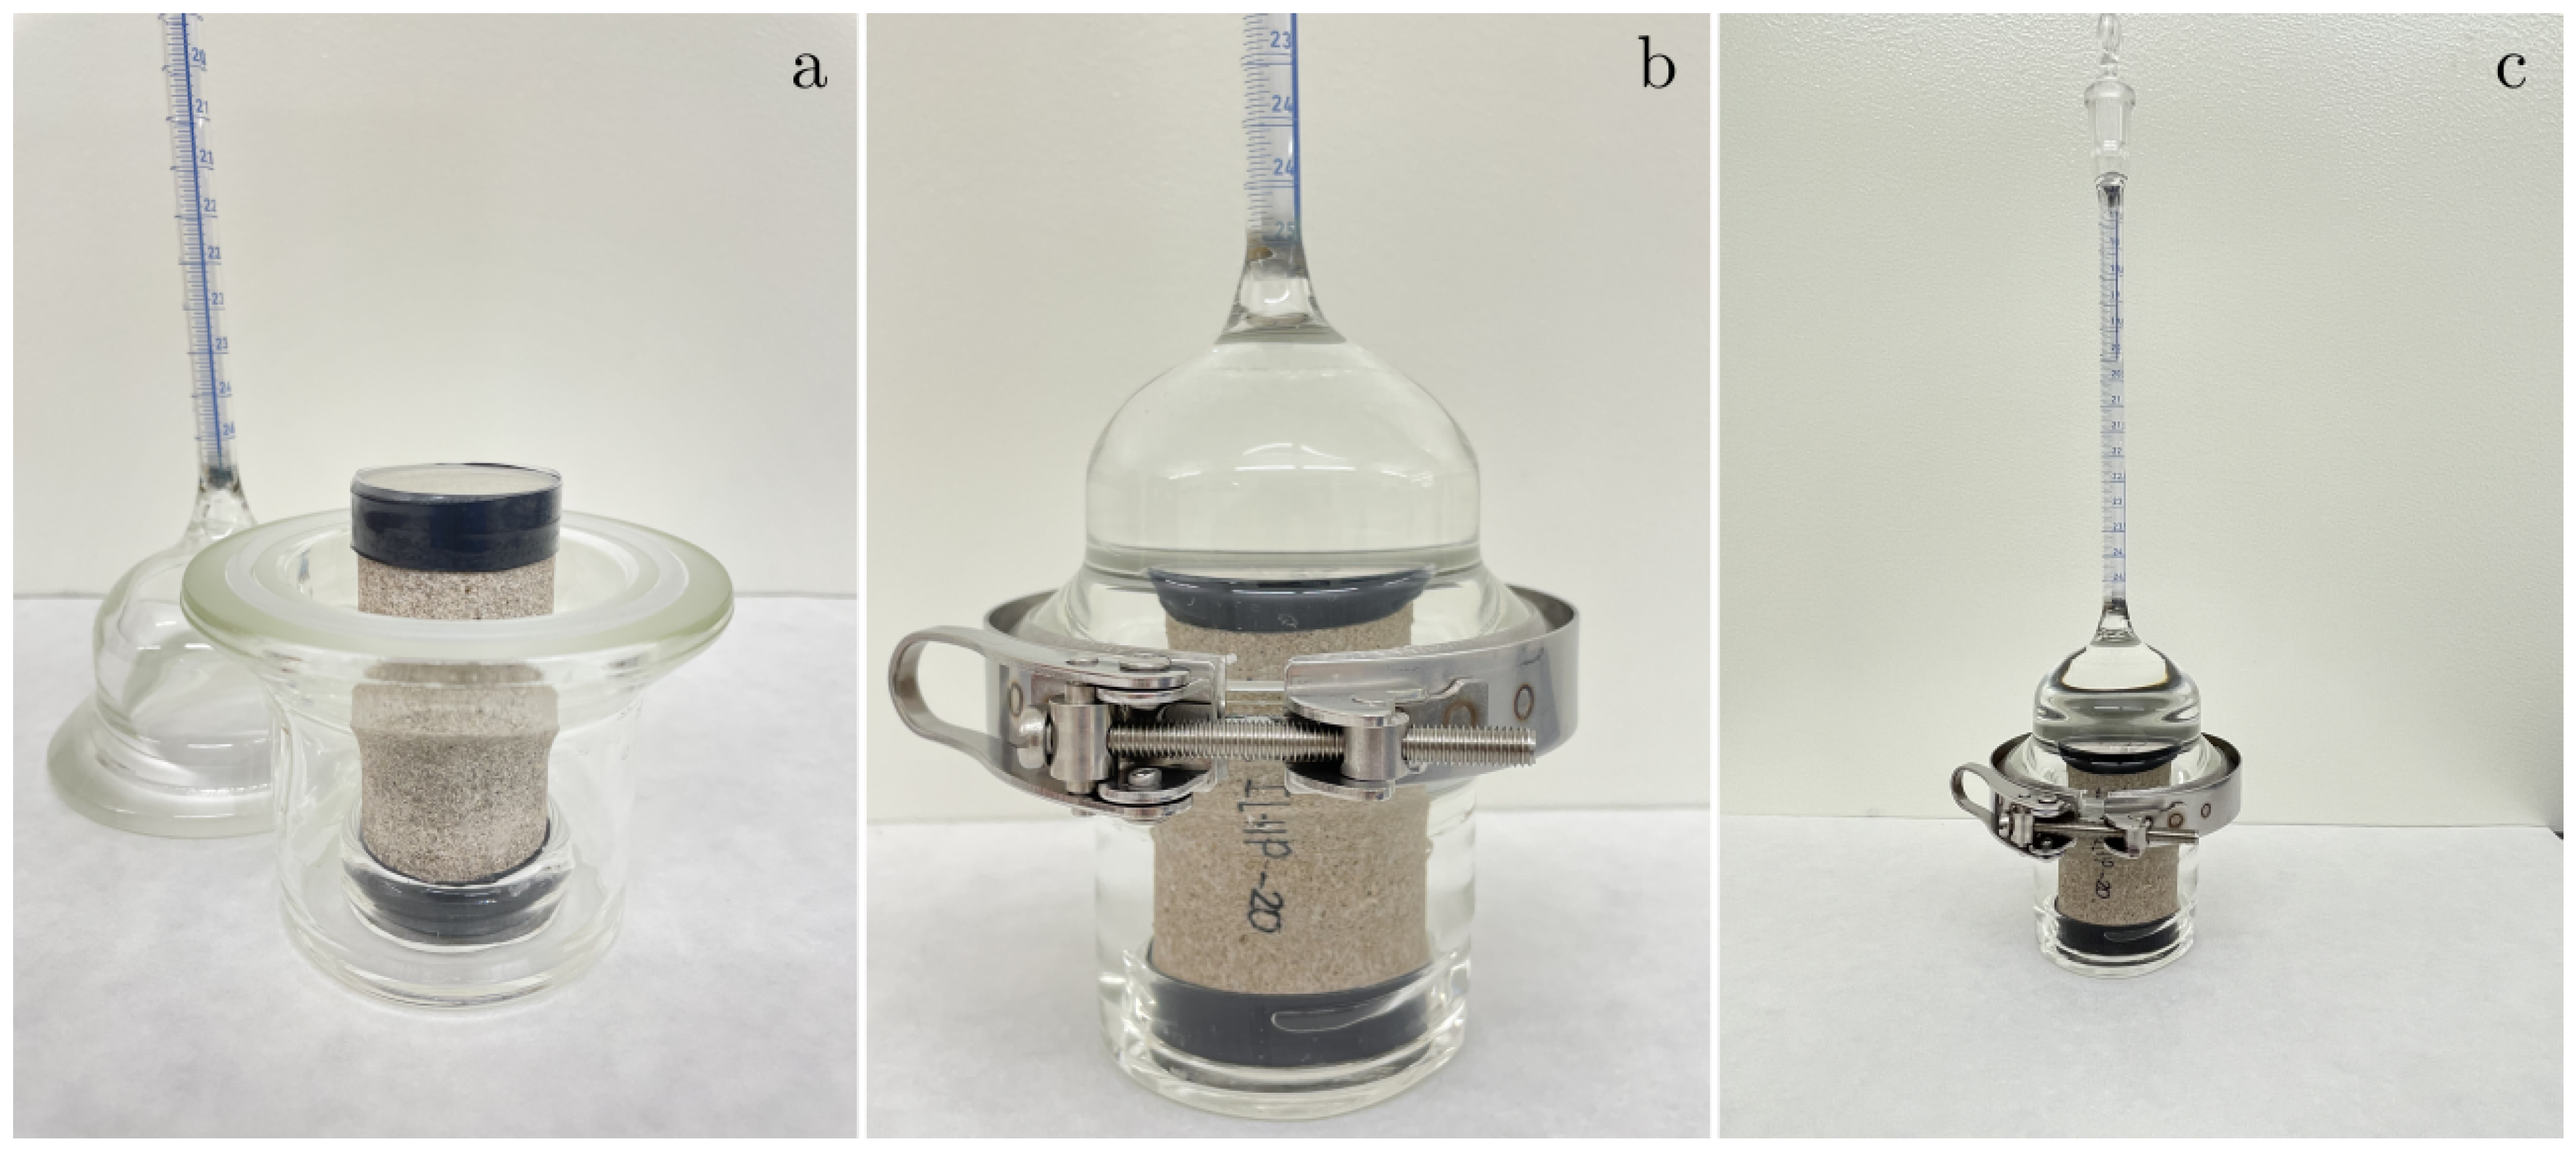
Figure 6.
Spontaneous imbibition dynamics for the twin pair IL-22/IL-23: (a) Experimental cumulative recovery versus the square root of time. (b) Scaled cumulative recovery versus the square root of dimensionless time.
Figure 6.
Spontaneous imbibition dynamics for the twin pair IL-22/IL-23: (a) Experimental cumulative recovery versus the square root of time. (b) Scaled cumulative recovery versus the square root of dimensionless time.
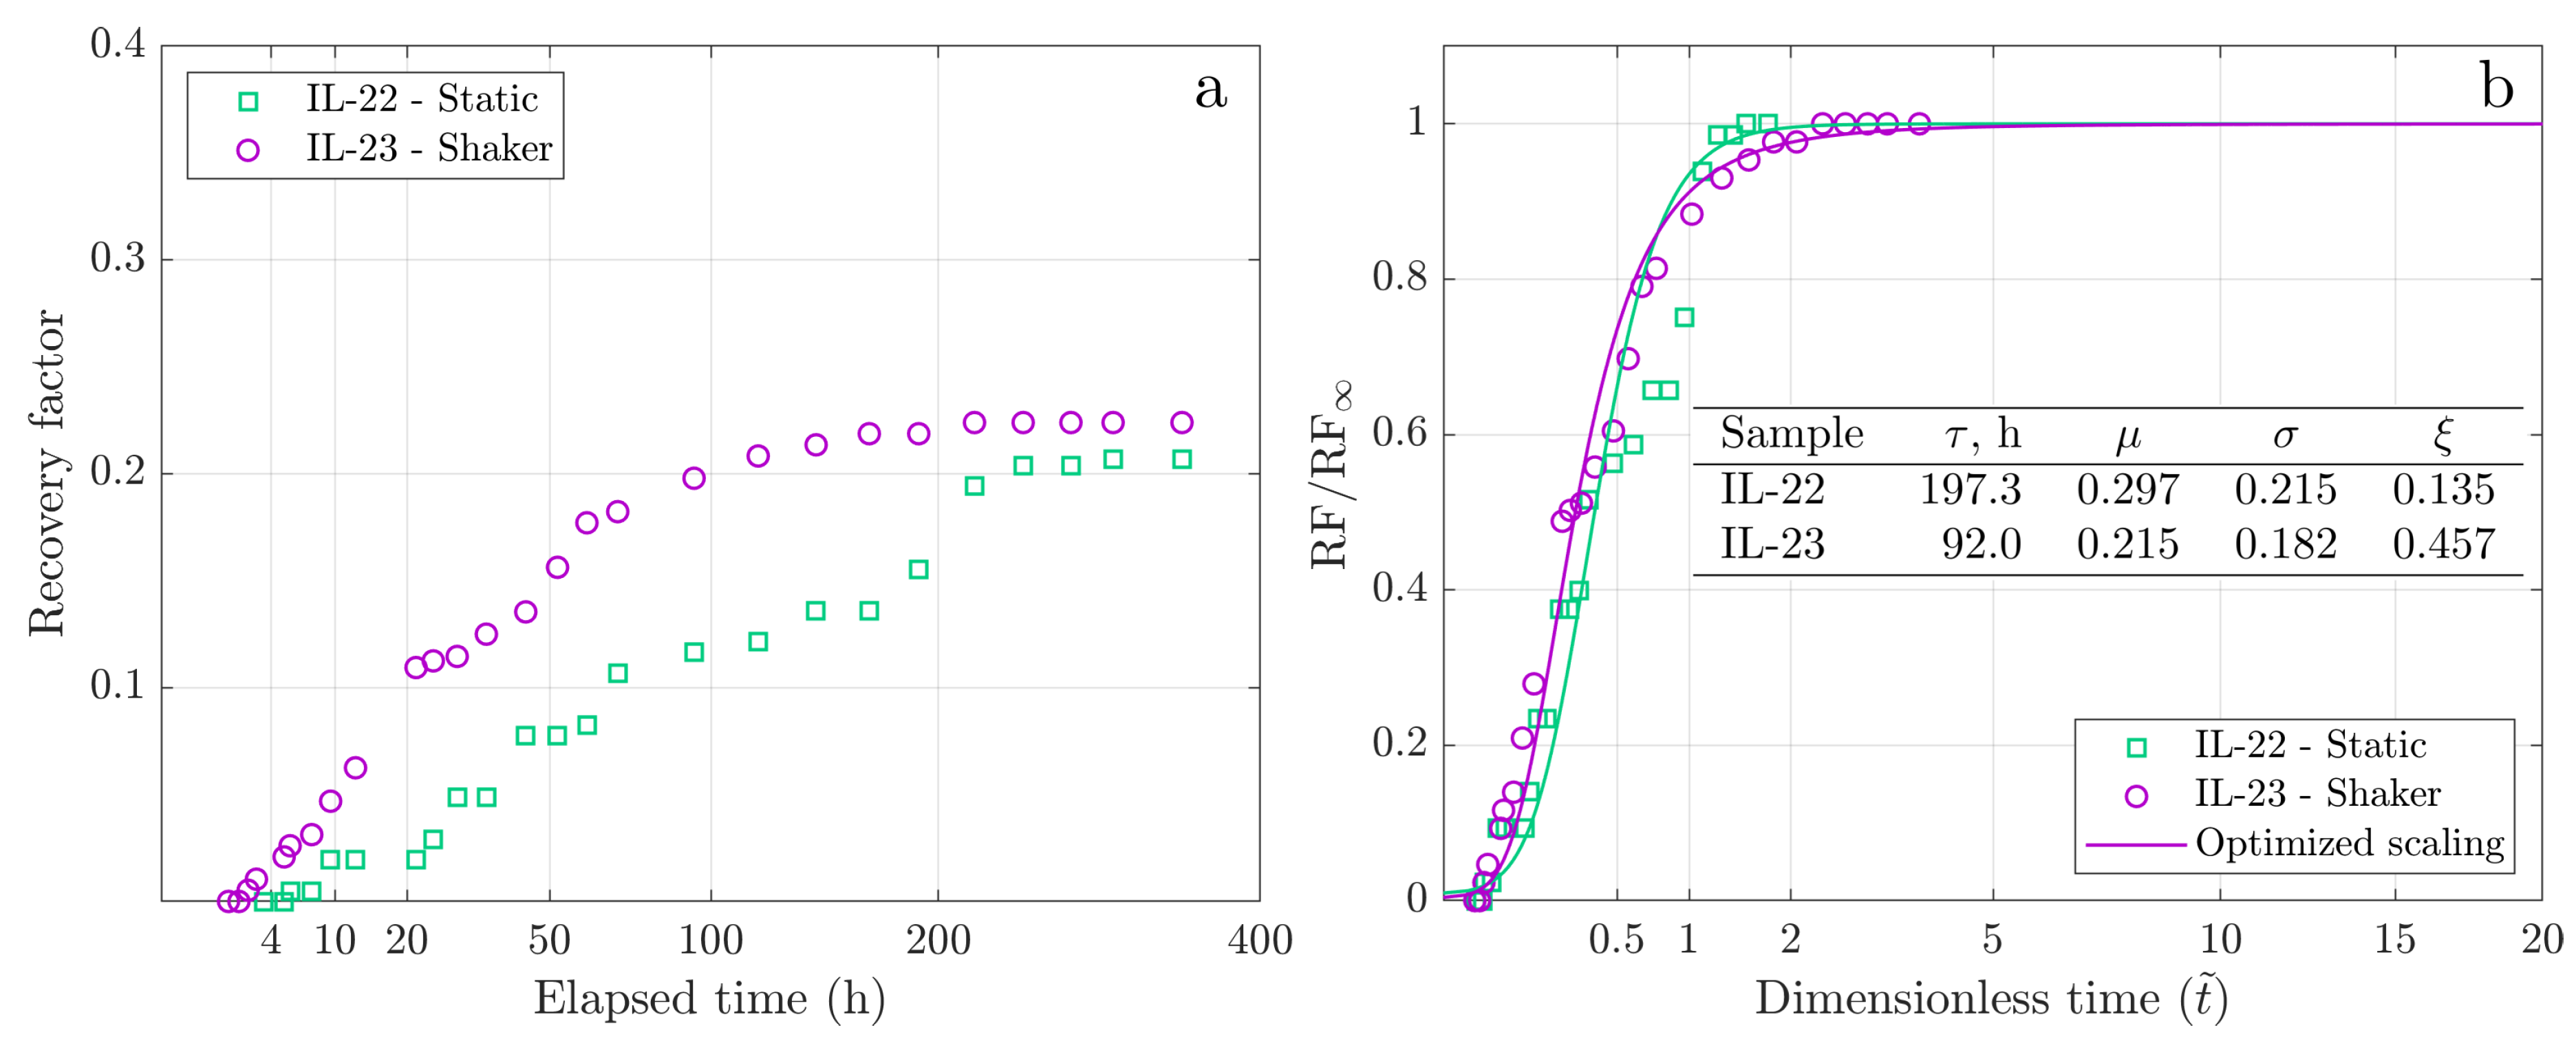
Figure 7.
Spontaneous imbibition dynamics for the twin pair IL-20a/IL-21a: (a) Experimental cumulative recovery versus the square root of time. (b) Scaled cumulative recovery versus the square root of dimensionless time.
Figure 7.
Spontaneous imbibition dynamics for the twin pair IL-20a/IL-21a: (a) Experimental cumulative recovery versus the square root of time. (b) Scaled cumulative recovery versus the square root of dimensionless time.
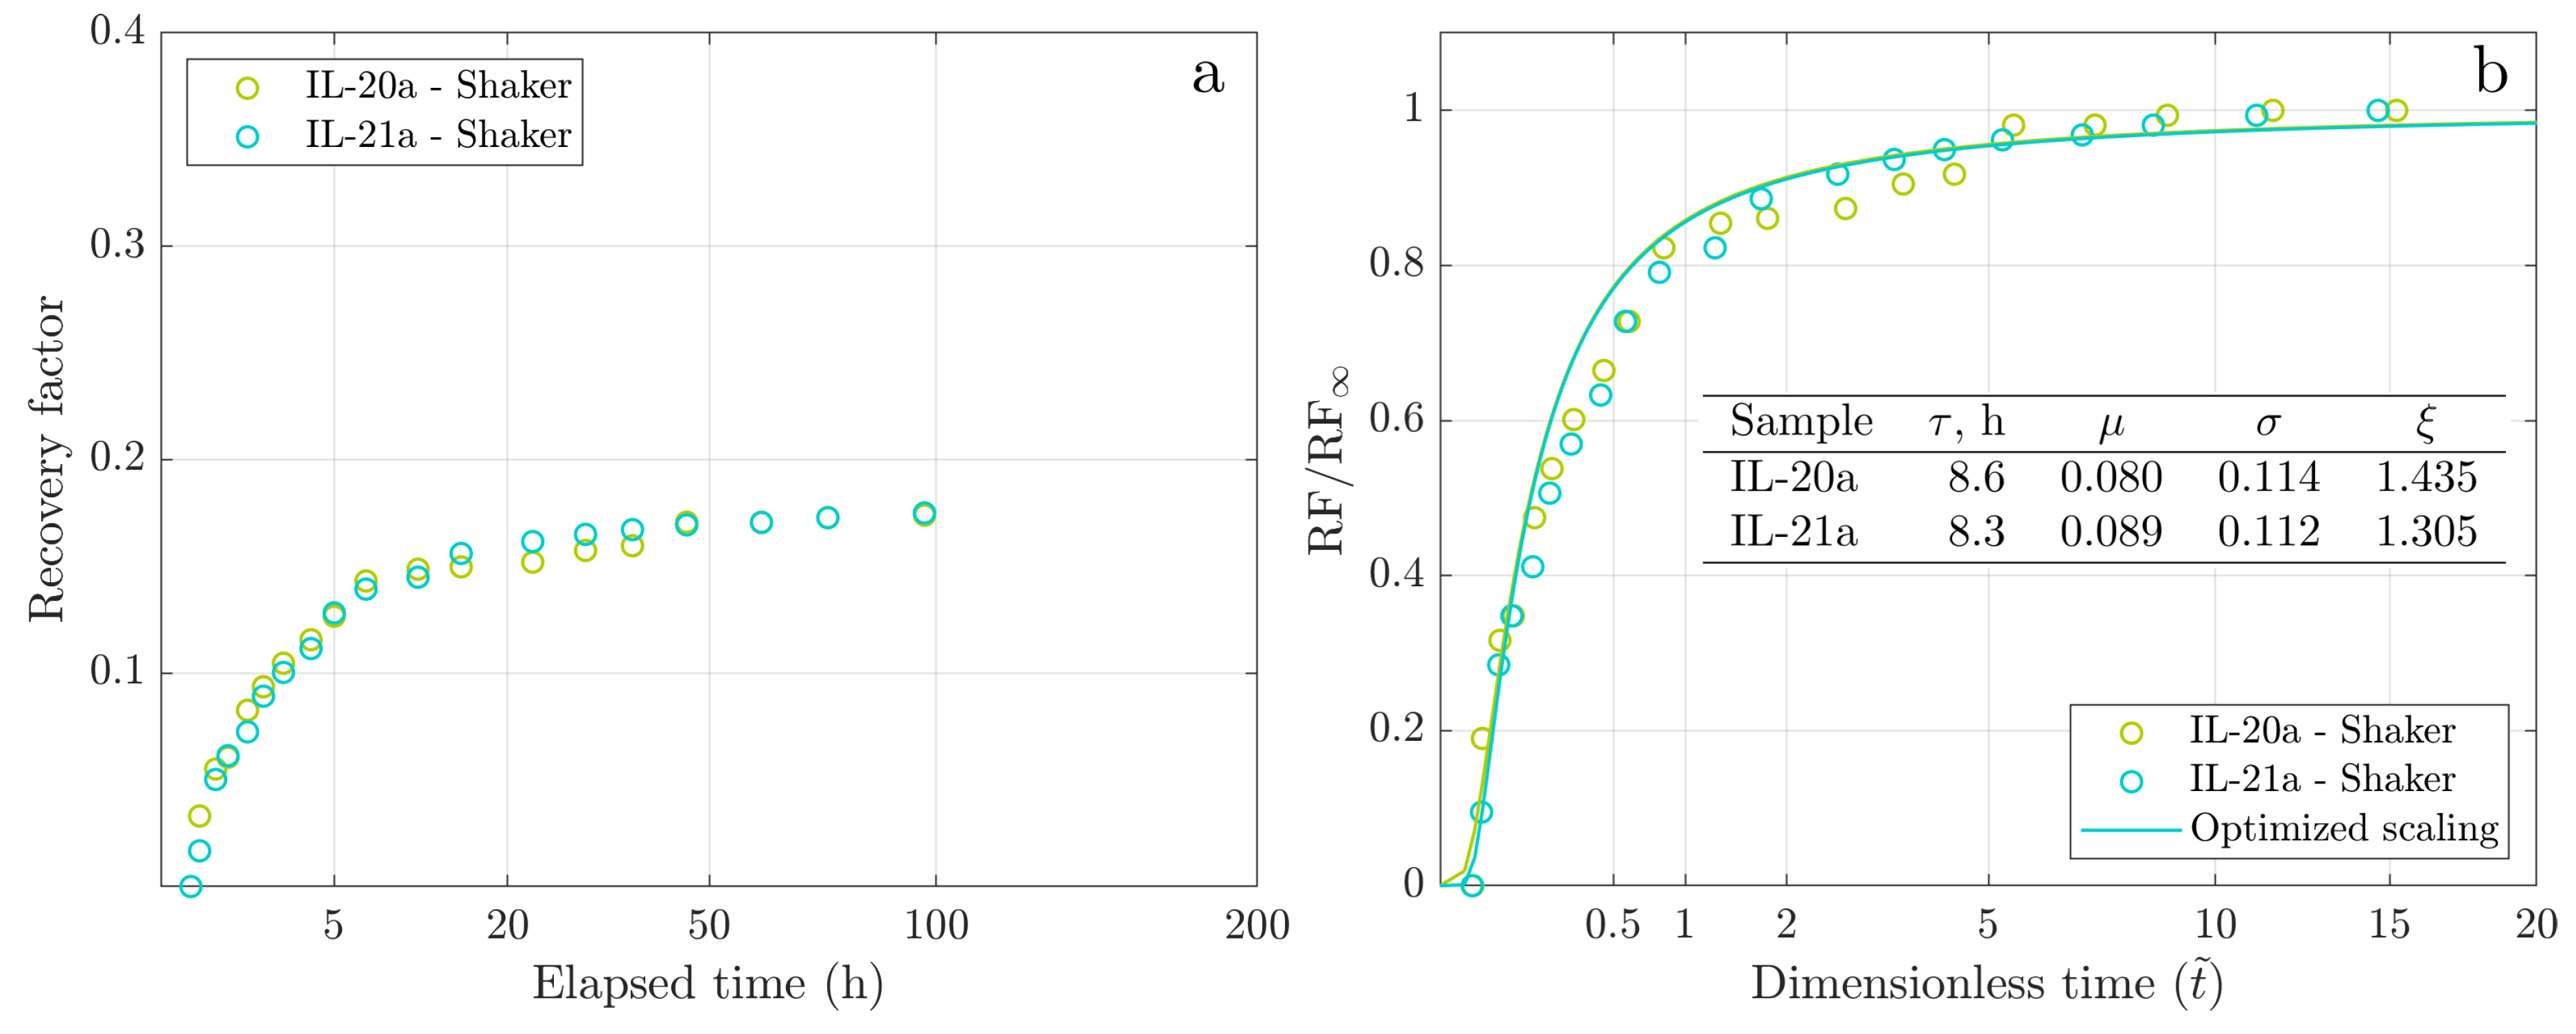
Figure 8.
Spontaneous imbibition dynamics for the twin pair IL-6/IL-7: (a) Experimental cumulative recovery versus the square root of time. (b) Scaled cumulative recovery versus the square root of dimensionless time.
Figure 8.
Spontaneous imbibition dynamics for the twin pair IL-6/IL-7: (a) Experimental cumulative recovery versus the square root of time. (b) Scaled cumulative recovery versus the square root of dimensionless time.
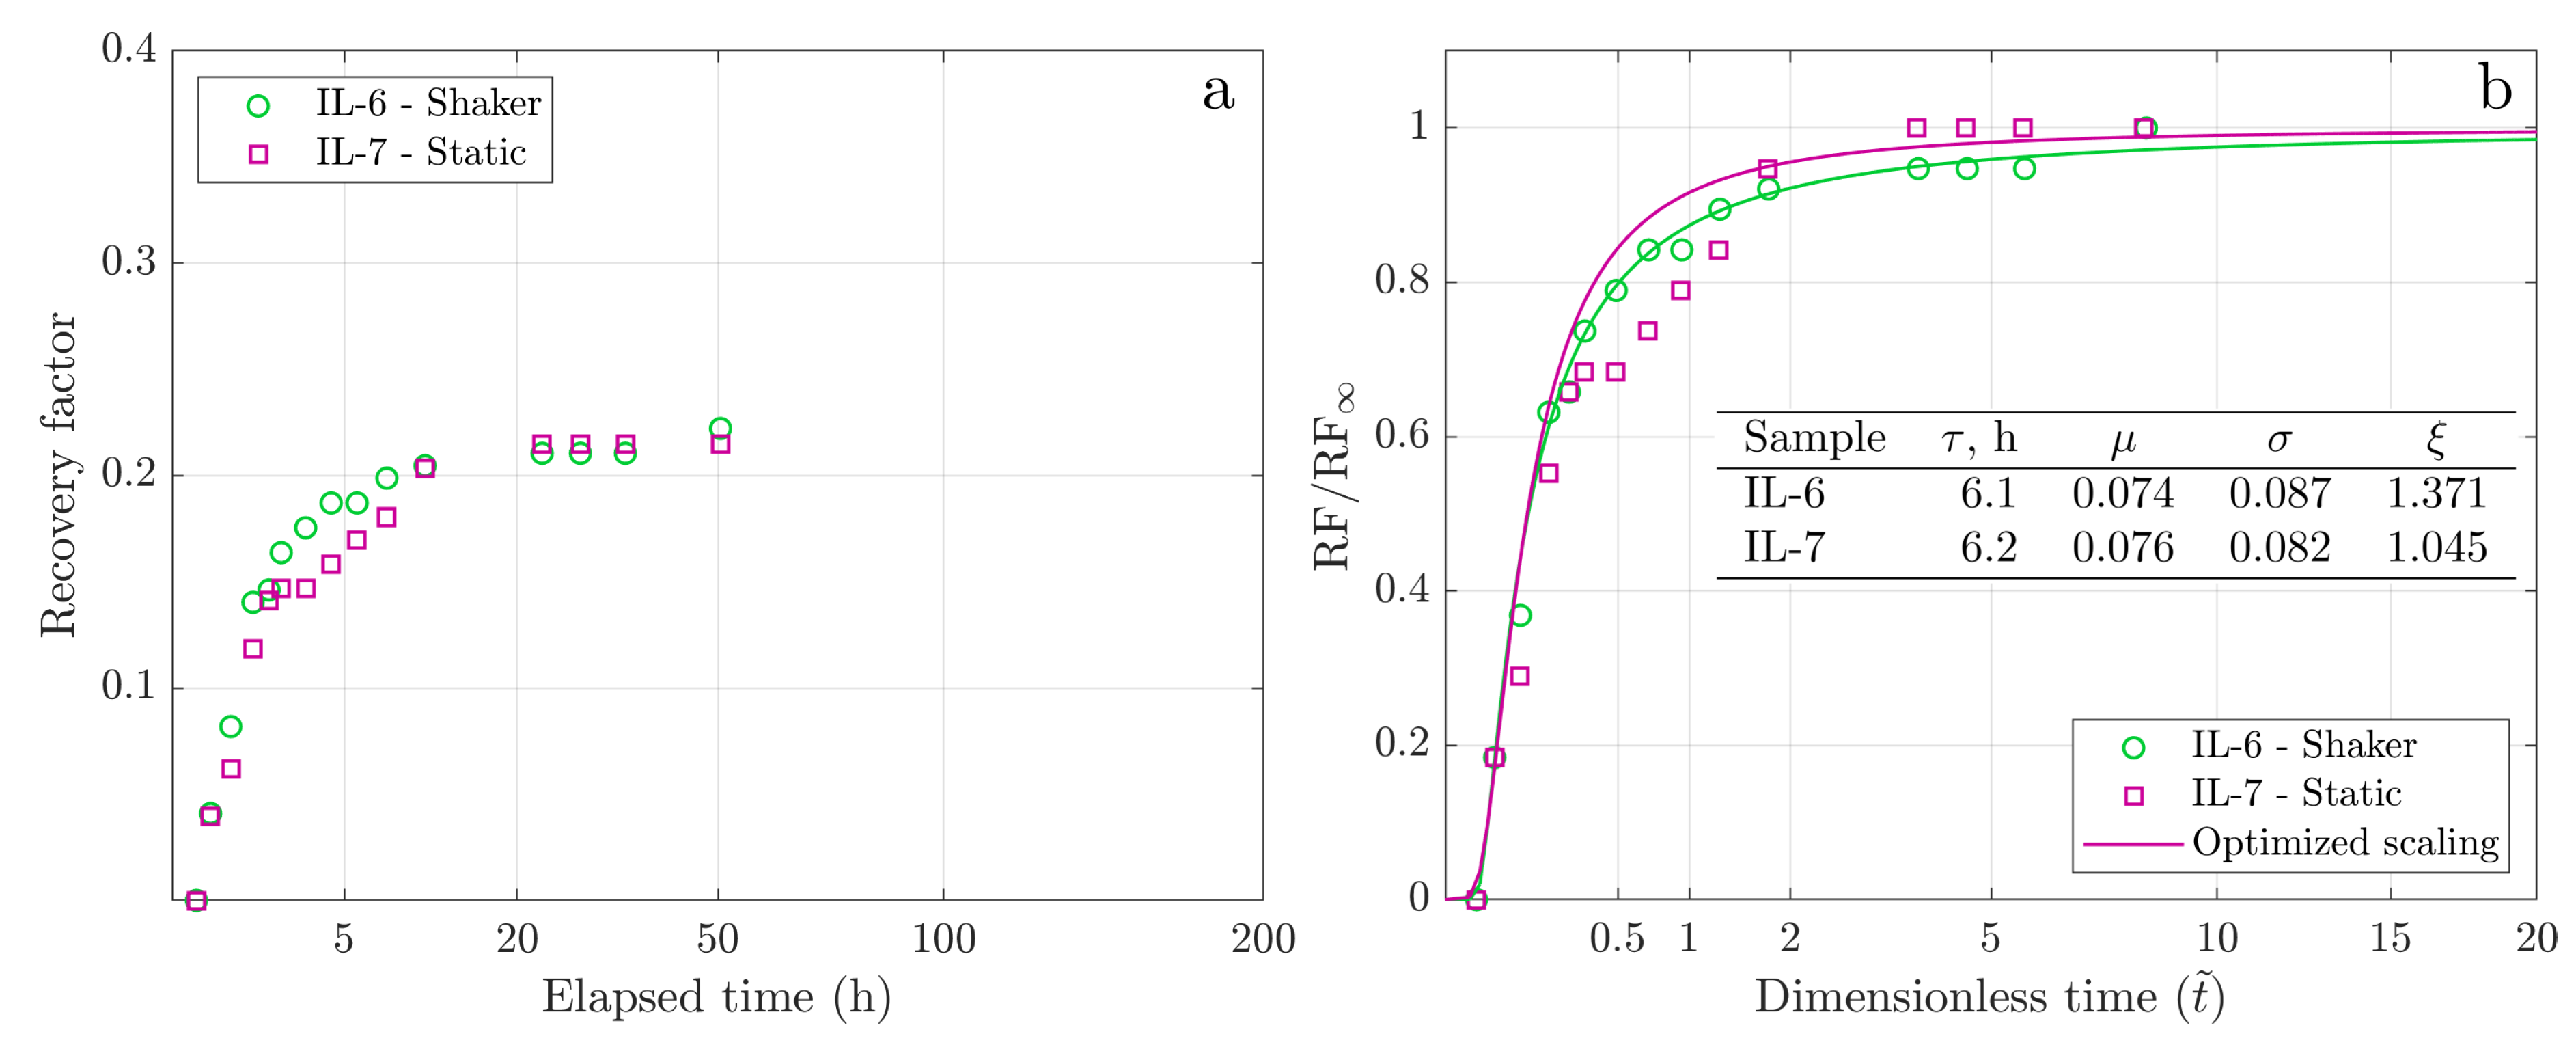
Figure 9.
Spontaneous imbibition dynamics for the twin pair IL-6b/IL-7b: (a) Experimental cumulative recovery versus the square root of time. (b) Scaled cumulative recovery versus the square root of dimensionless time.
Figure 9.
Spontaneous imbibition dynamics for the twin pair IL-6b/IL-7b: (a) Experimental cumulative recovery versus the square root of time. (b) Scaled cumulative recovery versus the square root of dimensionless time.
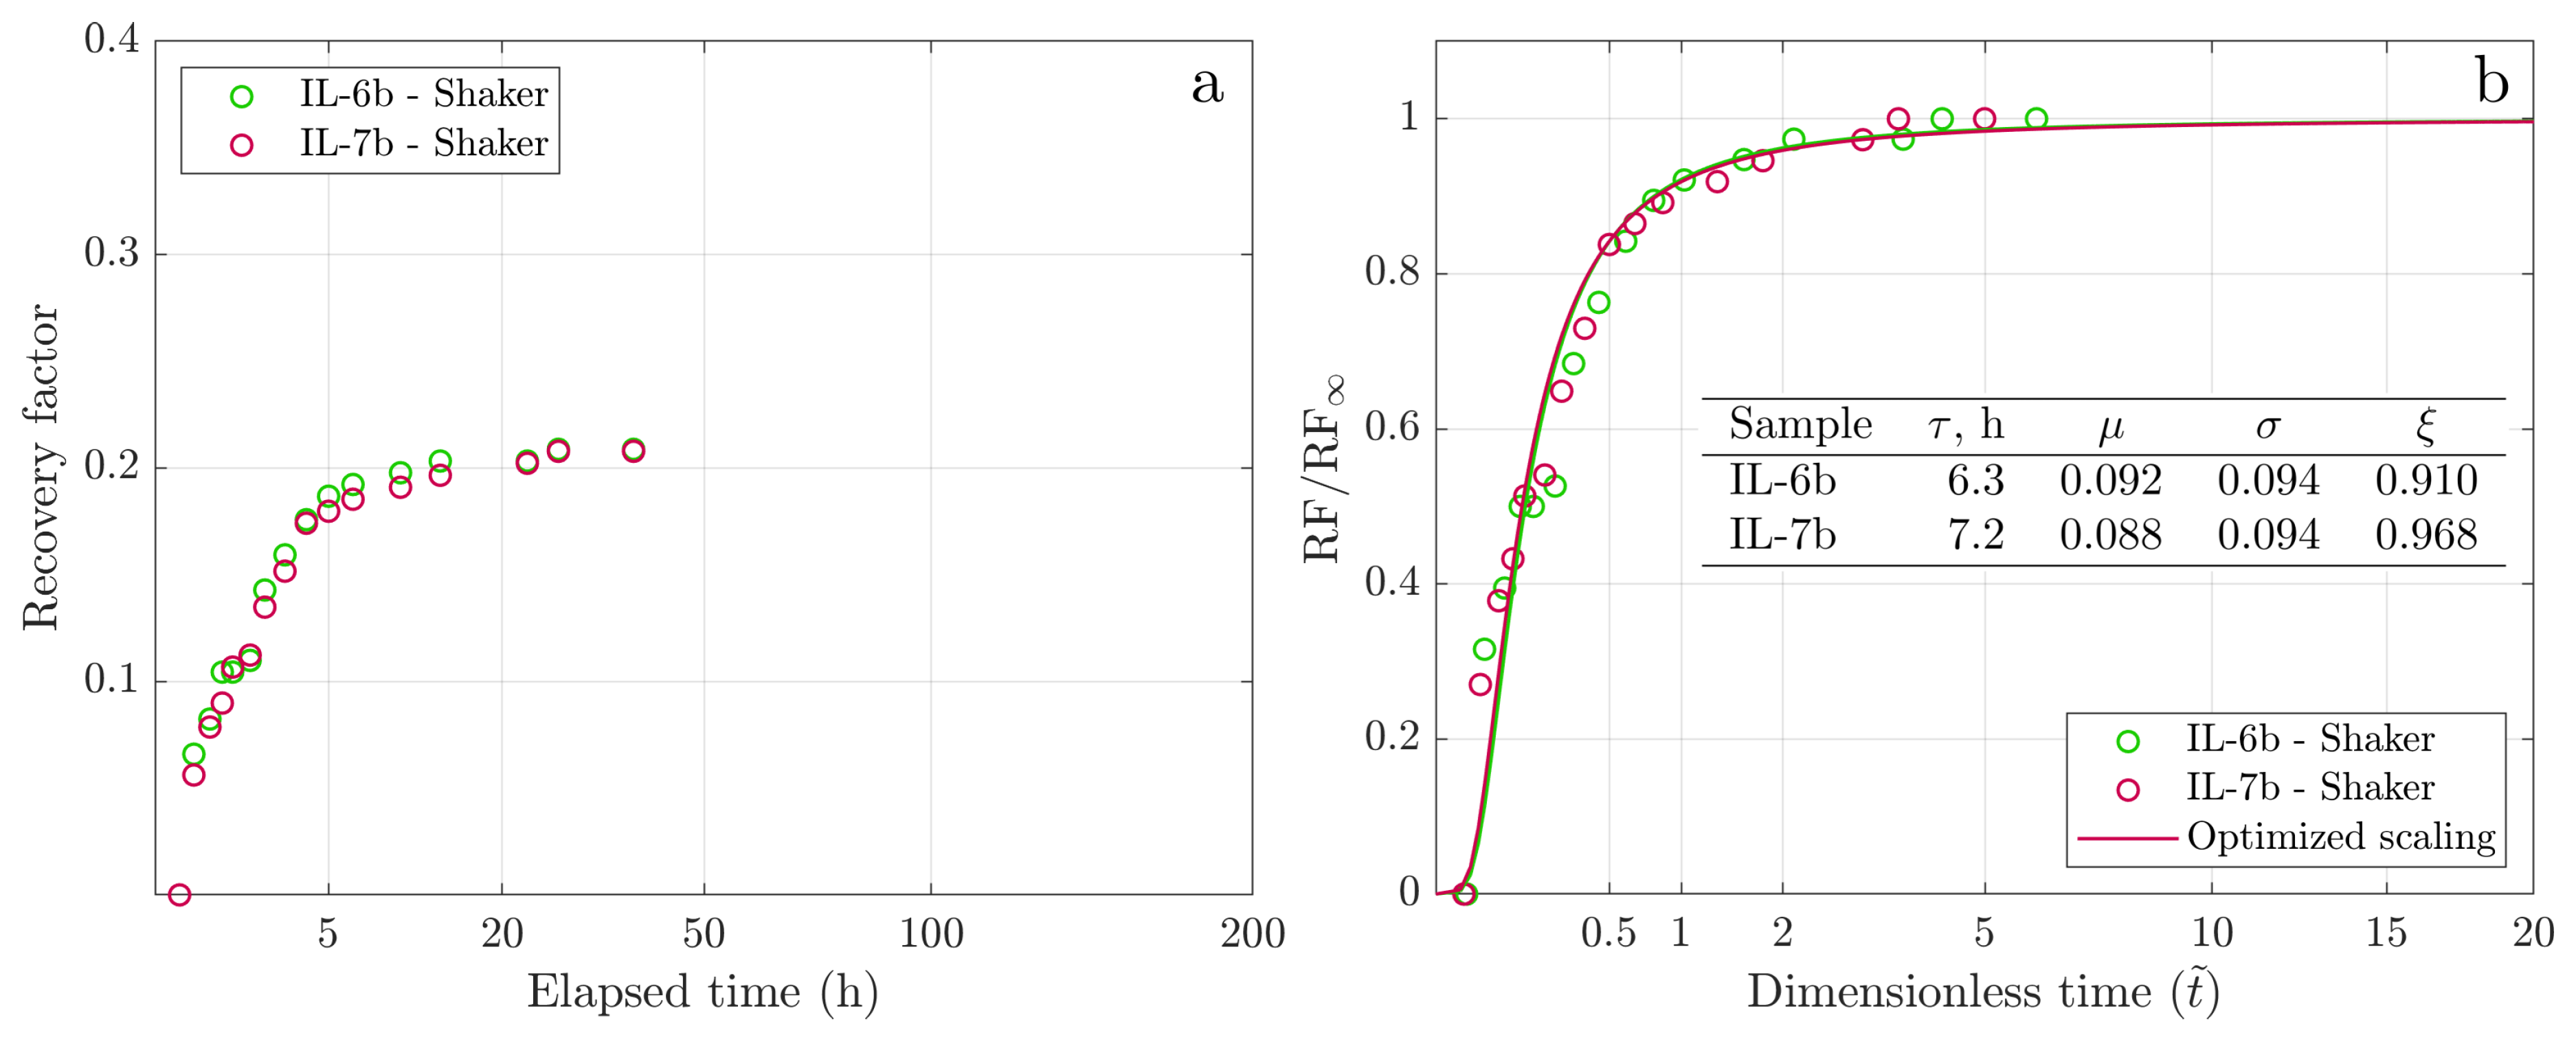
Figure 10.
Spontaneous imbibition dynamics for the twin pair IL-11a/IL-15a: (a) Experimental cumulative recovery versus the square root of time. (b) Scaled cumulative recovery versus the square root of dimensionless time.
Figure 10.
Spontaneous imbibition dynamics for the twin pair IL-11a/IL-15a: (a) Experimental cumulative recovery versus the square root of time. (b) Scaled cumulative recovery versus the square root of dimensionless time.
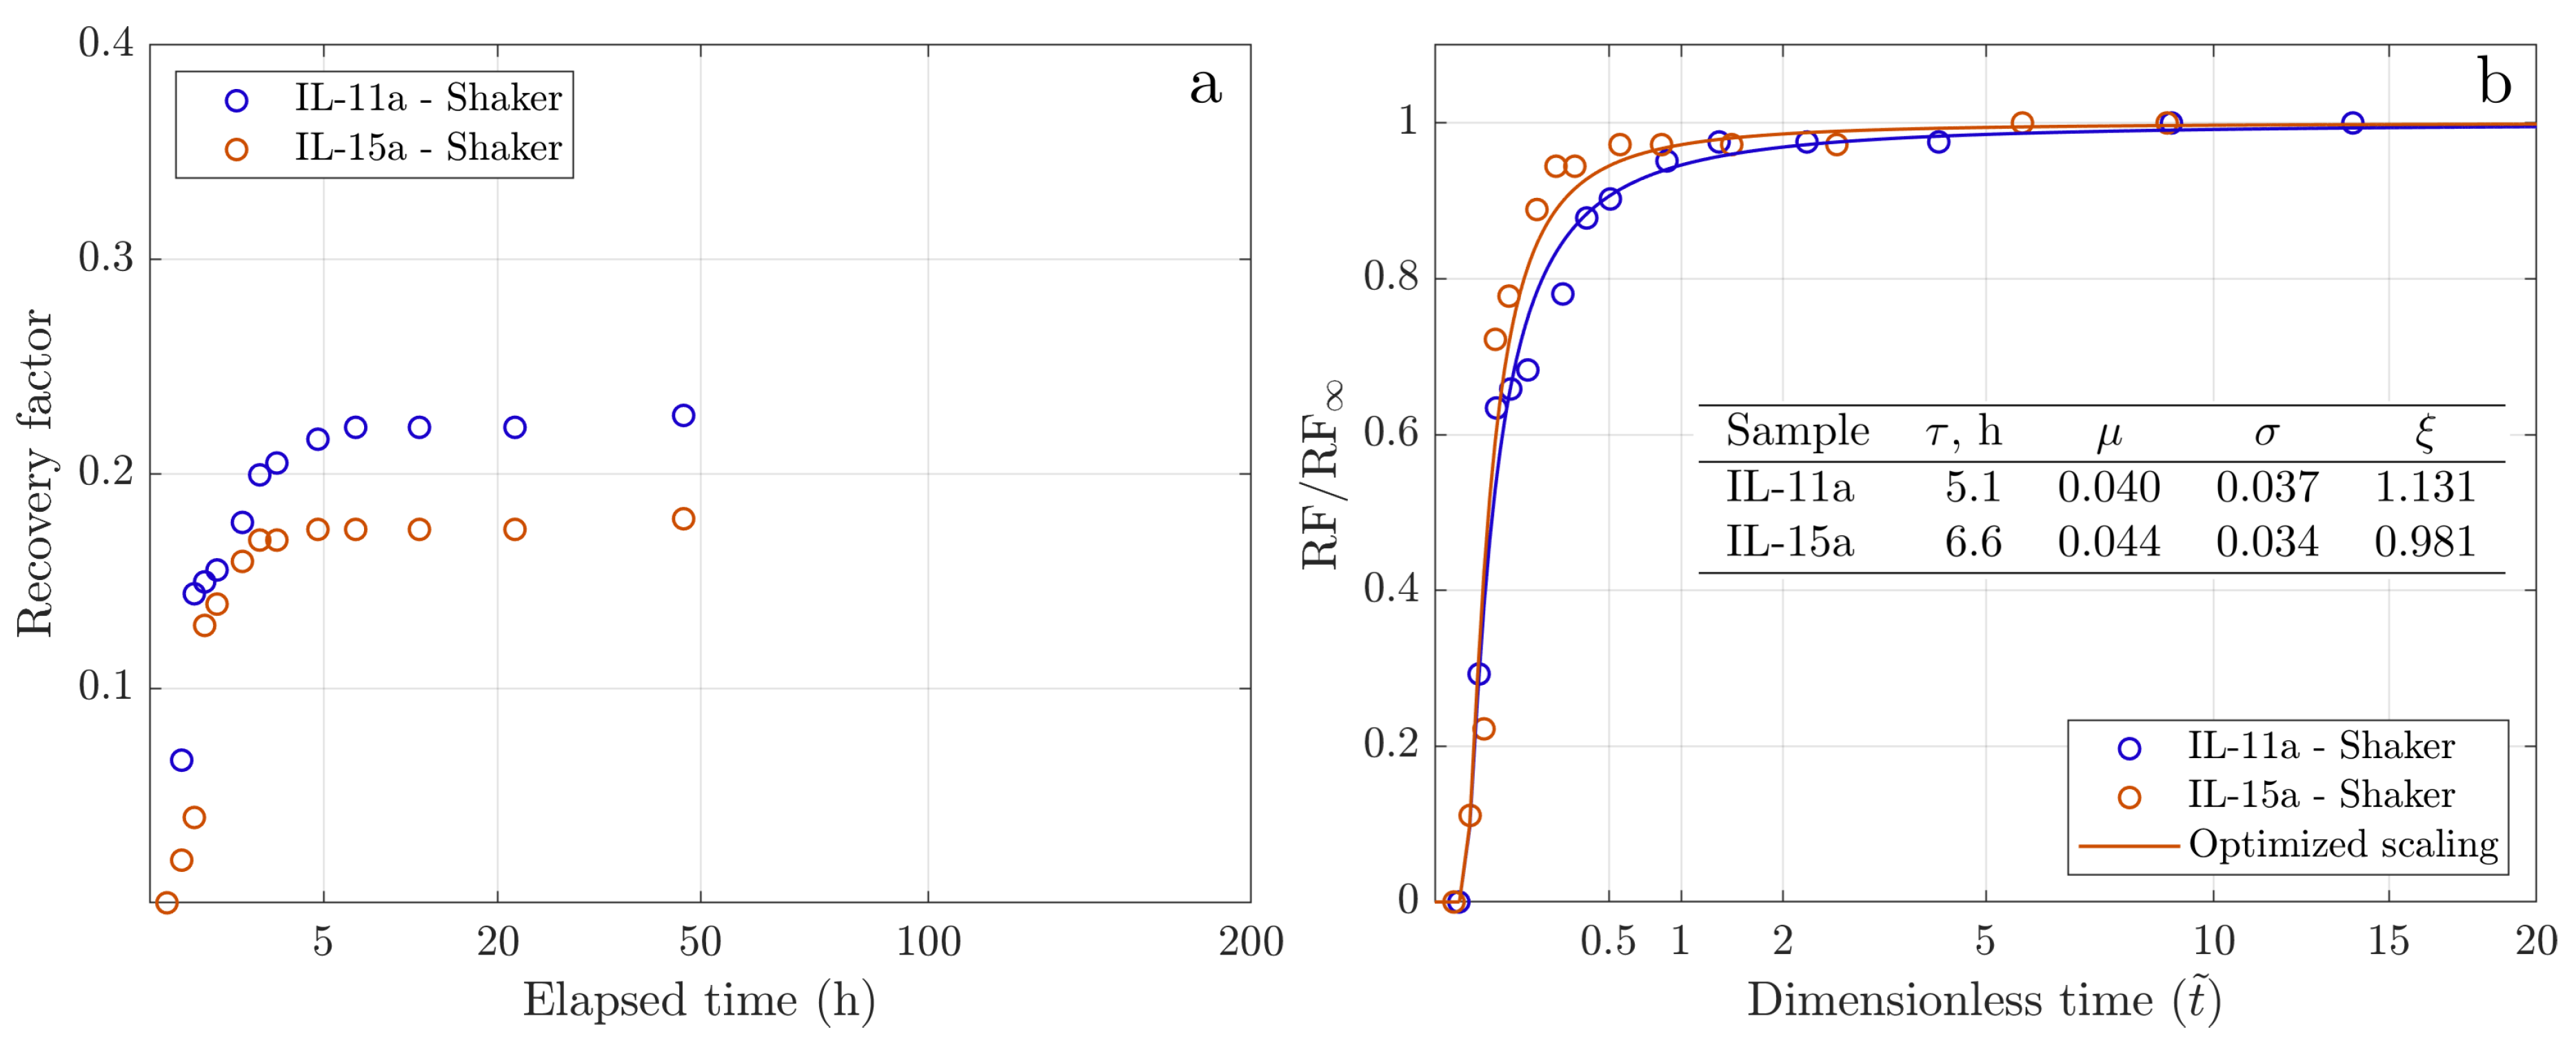
Figure 11.
Scaling summary for spontaneous imbibition experiments: (a) GEV-scaled cumulative oil recoveries. (b) GEV-scaled oil production rates. A common legend applies to both subplots. Dashed lines – experiments with high-viscosity oil, dash-dotted lines – experiment with high-permeability cores, and solid lines – other experiments. The GEV-fitting parameters are presented in Table 1.
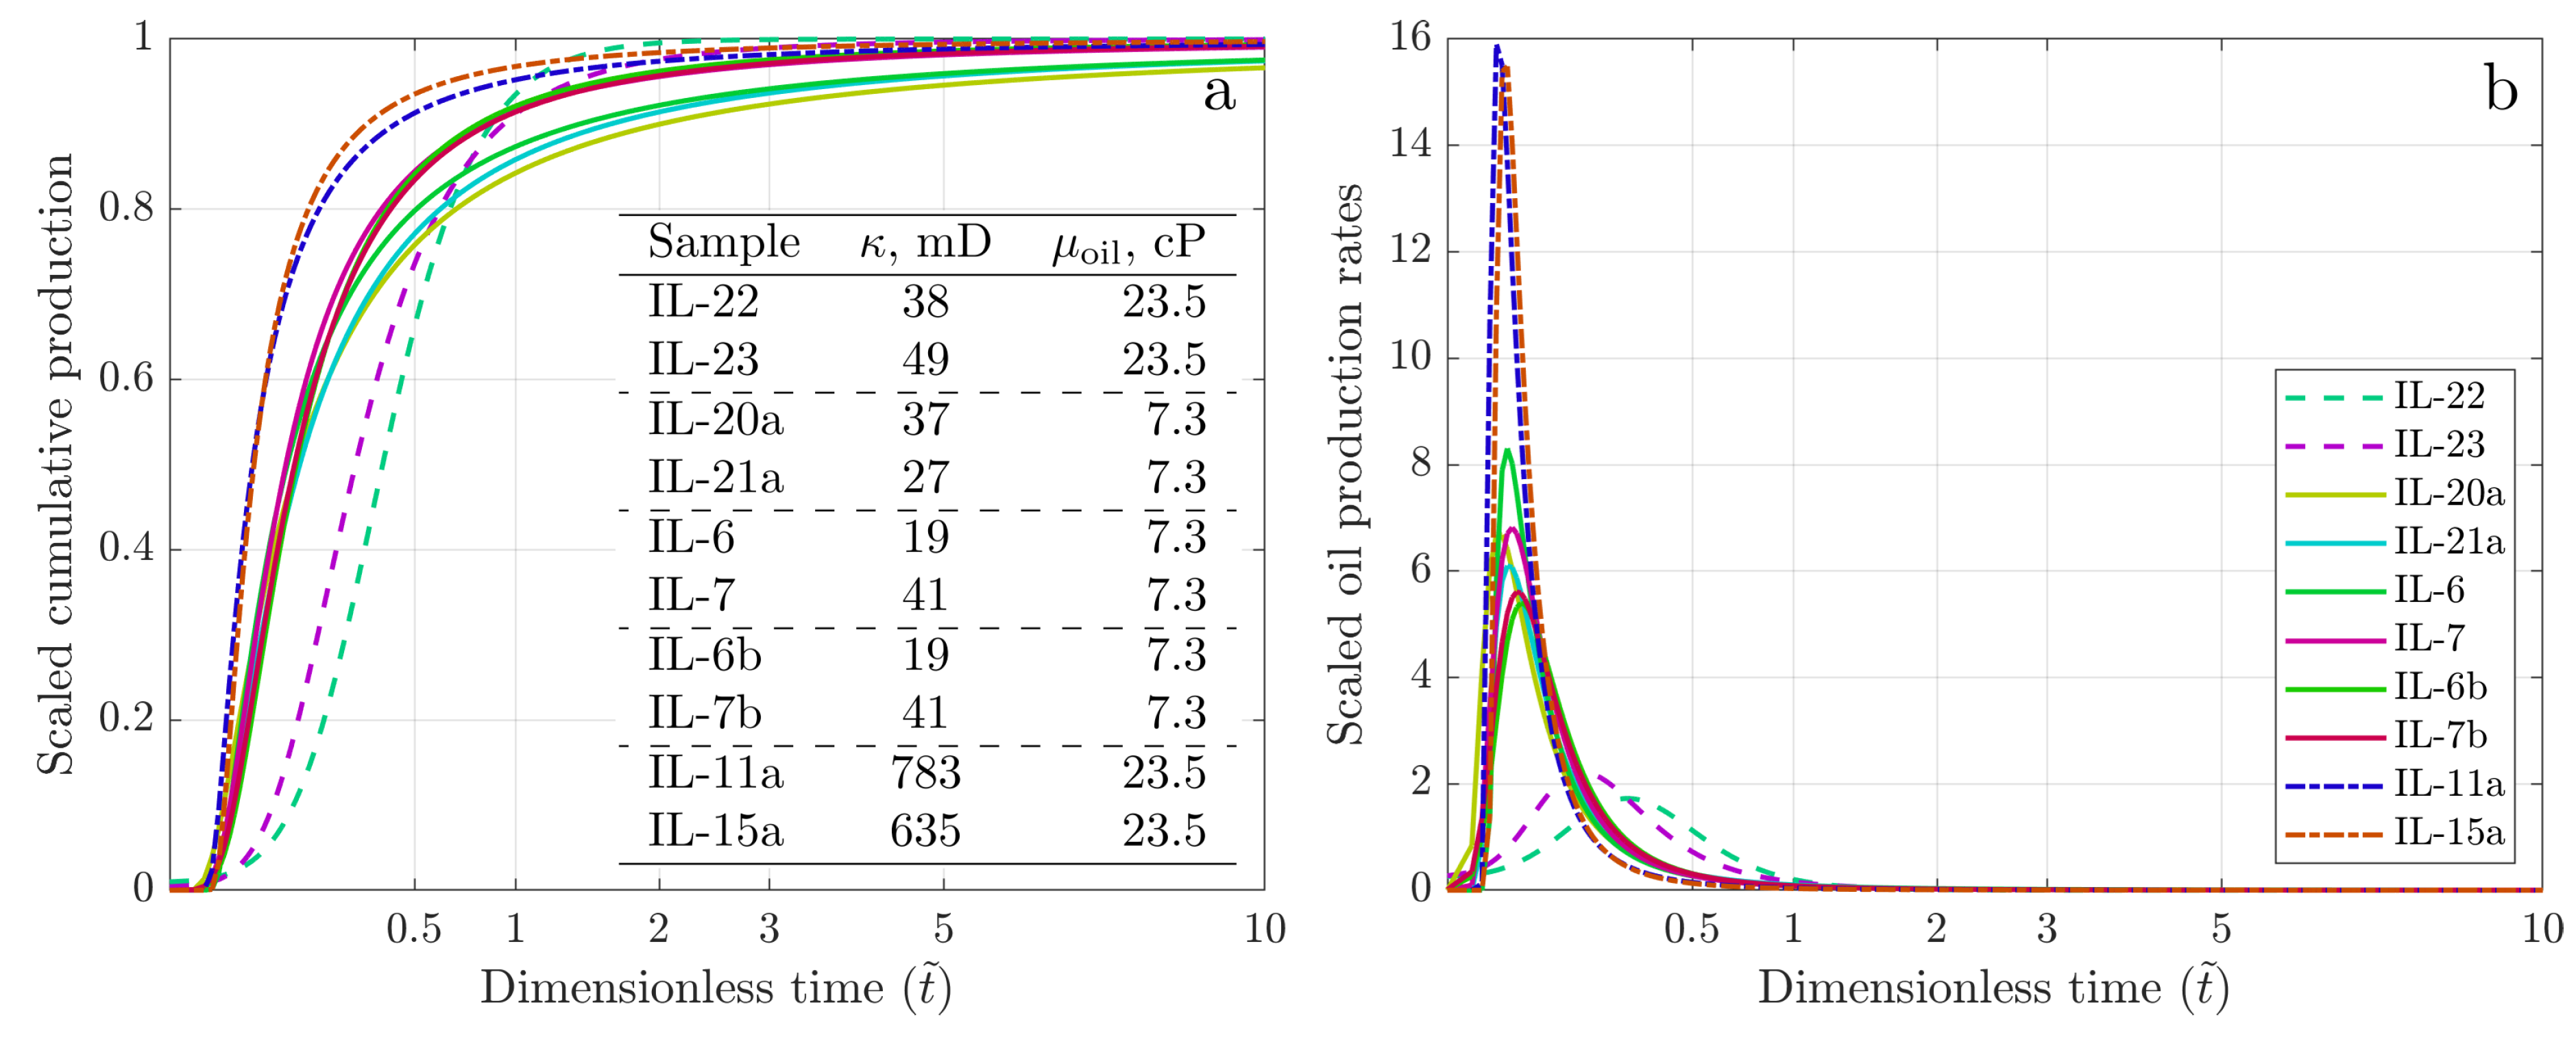

Table 1.
Characteristics of rock samples and results of the Amott spontaneous imbibition experiments and GEV modeling.
Table 1.
Characteristics of rock samples and results of the Amott spontaneous imbibition experiments and GEV modeling.
| Sample | , | , | Oil | , cP | , | RF, | Imbibition | GEV | GEV | GEV | GEV |
|---|---|---|---|---|---|---|---|---|---|---|---|
| code | % | mD | code | at 60 °C | fraction | fraction | regime | , h | |||
| IL-22 | 15.5 | 38 | Oil-2 * | 23.5 | 0.81 | 0.207 | static | 197.3 | 0.297 | 0.215 | 0.135 |
| IL-23 | 16.0 | 49 | Oil-2 | 23.5 | 0.72 | 0.224 | shaking | 92.0 | 0.215 | 0.182 | 0.457 |
| IL-20a | 16.0 | 37 | Oil-1 | 7.3 | 0.73 | 0.174 | shaking | 8.6 | 0.080 | 0.114 | 1.435 |
| IL-21a | 15.1 | 27 | Oil-1 | 7.3 | 0.75 | 0.176 | shaking | 8.3 | 0.089 | 0.112 | 1.305 |
| IL-6 | 14.8 | 19 | Oil-1 | 7.3 | 0.69 | 0.222 | shaking | 6.1 | 0.074 | 0.087 | 1.371 |
| IL-7 | 15.1 | 41 | Oil-1 | 7.3 | 0.70 | 0.215 | static | 6.2 | 0.076 | 0.082 | 1.045 |
| IL-6b | 14.8 | 19 | Oil-1 | 7.3 | 0.73 | 0.209 | shaking | 6.3 | 0.092 | 0.094 | 0.910 |
| IL-7b | 15.1 | 41 | Oil-1 | 7.3 | 0.70 | 0.208 | shaking | 7.2 | 0.088 | 0.094 | 0.968 |
| IL-11a | 15.9 | 783 | Oil-2 | 23.5 | 0.65 | 0.227 | shaking | 5.1 | 0.040 | 0.037 | 1.131 |
| IL-15a | 16.5 | 635 | Oil-2 | 23.5 | 0.70 | 0.179 | shaking | 6.6 | 0.044 | 0.034 | 0.981 |
* For consistency, the numbering is the same as in [48].
Disclaimer/Publisher’s Note: The statements, opinions and data contained in all publications are solely those of the individual author(s) and contributor(s) and not of MDPI and/or the editor(s). MDPI and/or the editor(s) disclaim responsibility for any injury to people or property resulting from any ideas, methods, instructions or products referred to in the content. |
© 2024 by the authors. Licensee MDPI, Basel, Switzerland. This article is an open access article distributed under the terms and conditions of the Creative Commons Attribution (CC BY) license (http://creativecommons.org/licenses/by/4.0/).
Copyright: This open access article is published under a Creative Commons CC BY 4.0 license, which permit the free download, distribution, and reuse, provided that the author and preprint are cited in any reuse.


