Submitted:
16 May 2024
Posted:
16 May 2024
You are already at the latest version
Abstract
Exosomal microRNAs (miRNAs) from cancer cells play a key role in mediating the oral squamous cell carcinoma (OSCC) microenvironment. The objective aimed to investigate how long non-coding RNA (lncRNA) MEG3 affects OSCC angiogenesis through exosomal miR-421. Global miRNA microarray analysis and quantitative real-time PCR (qRT-PCR) were performed to determine the level of miRNAs in OSCC cells-derived exosomes. Cell migration, invasion, tube formation, immunohistochemistry and hemoglobin concentration were used to study the effects of exosomal miR-421 in angiogenesis. Western blotting was used to determine the expression level of HS2ST1 and VEGFR2-related downstream proteins. MiRNA array and qRT-PCR identified upregulation of miR-421 in OSCC cell-derived exosomes. Furthermore, exosome-miR-421 can be taken up by human umbilical vein endothelial cells (HUVEC) and then targets HS2ST1 through VEGF-mediated ERK and AKT phosphorylation, thereby promoting HUVEC migration, invasion, and tube formation. Additionally, enforced expression of lncRNA MEG3 in OSCC cells reduced exosomal miR-421 levels and then increased HS2ST1 expression, thereby reducing the VEGF/VEGFR2 pathway in HUVEC. Our results demonstrate a novel mechanism by which lncRNA MEG3 can act as a tumor suppressor and regulate endothelial angiogenesis through the exosomal miR-421/HS2ST1 axis, which provides a potential therapeutic strategy for OSCC angiogenesis.
Keywords:
microRNA
; long non-coding RNA (lncRNA)
; oral squamous cell carcinoma (OSCC)
; exosome
; angiogenesis
; miR-421
; HS2ST1
1. Introduction
Oral squamous cell carcinoma (OSCC), with a 5-year survival rate of 50-60%, is the major cause of oral cancer morbidity and mortality and has become a major global health challenge [1,2]. In the past 20 years, despite therapeutic improvements, the prognosis of OSCC has not improved significantly, mainly due to late diagnosis, frequent locoregional recurrence and metastasis [3]. Angiogenesis has been reported to be associated with tumor metastasis, disease progression, and poor prognosis in OSCC [4]. It is the complex biological process of new blood vessels formation involving interactions between vascular cells and the extracellular environment [5]. Tumor cells can induce angiogenesis by secreting various growth factors, cytokines, proteases, and even exosomes to the surrounding environment, and then provide oxygen and nutrients through new blood vessels to maintain tumor growth [5]. However, the detailed mechanisms between tumorigenicity and angiogenesis in OSCC are not fully understood.
Heparan sulfate proteoglycans (HSPGs) are a group of distinct glycoproteins, found on the cell surface and in the extracellular matrix (ECM), composed of a core protein with one or more covalently linked heparan sulfate (HS), a type of glycosaminoglycan (GAG) [6,7]. Both HS GAGs and HSPGs bind various ligands and play important roles in normal physiology and pathological effects, including embryonic development, homeostasis, inflammatory responses, microbial infection, angiogenesis, and tumor initiation and progression [7,8]. However, HS chains appear to determine the binding affinity to various ligands such as growth factors, cytokines, chemokines and ECM components [7,9]. HS are unbranched polysaccharides composed of uronic acid (glucuronic acid, GlcA, or iduronic acid, IdoA) and N-acetyl-glucosamine (GlcNAc) disaccharide repeats with various sulfation modifications [10]. Sulfation of HS is an important post-translational modification catalyzed by 2-O, 3-O and 6-O sulfotransferases. 2-O sulfation occurs on GlcA and IdoA residues with a strong preference for IdoA, while 3-O and 6-O sulfation occur on GlcNAc residues [11,12]. 2-O-sulfation within HS is catalyzed by HS 2-O sulfotransferase (HS2ST1) and is critical for HS to participate in various ligand-binding capabilities and signaling transductions [13]. Abnormal expression and function of HS2ST1 have been detected in breast cancer, where upregulation of HS2ST1 is associated with reduced invasive behavior and cancer stem cells phenotype [14,15]. Furthermore, it has been shown that upregulation of HS2ST1 lead to conformational change in HS and reduces basic fibroblast growth factor binding, resulting in reduced p44/42 MAPK and p38 MAPK activity, which correlates with a reduced invasive phenotype. [14]. These results highlight the tumor suppressor role of HS2ST1 in cancer. HSPGs are also present on the surface of vascular endothelial cells and contribute to the regulation of vascular permeability, immune cell trafficking, ligands binding and blood vessels formation [16,17]. Although HS2ST1 plays a key role in cancer progression, its regulation and mechanisms involved in vascular endothelial cells have not been clearly elucidated.
It is widely recognized that tumor-derived exosomes possess the capacity to regulate cell-cell communication between the tumor and surrounding tumor microenvironment (TME) by transferring cargoes such as proteins, nucleic acids, and lipids [18]. One of the most important cargoes in exosomes are microRNAs (miRNAs), which belong to the family of single-stranded non-coding RNAs, around 18-25 nucleotides, involved in the gene regulation at the post-transcriptional level [19]. Accumulating evidence suggests that tumor-derived exosomal miRNAs play an key role in stimulating endothelial cell migration and blood vessel formation that in turn support tumor progression and metastasis [20]. For example, in OSCC derived exosomes, miR-221 has been reported to downregulate phosphoinositide-3-kinase regulatory subunit 1 in endothelial cells, thereby promoting cellular migration and tube formation [21]. In addition, Wang et al. also reported that OSCC exosomal miR-210-3p targeting EFNA3 promotes angiogenesis in oral cancer via PI3K/AKT pathway [22]. In this study, we found that miR-421 is abundantly present in OSCC-derived exosomes and was able to significantly induce tube formation in endothelial cell. MiR-421 has been shown to exert oncogenic and inhibitory effects on programmed cell death protein 4 in OSCC cells [23]. However, there are currently no studies in the literature on the related role of OSCC-derived exosomal miR-421 in human endothelial cells.
Here, we focused on exosomal miR-421 to study its effect on OSCC angiogenesis. We demonstrated that miR-421 could be transferred to human umbilical vein vascular endothelial cells (HUVECs) via exosomes secreted by OSCC cells. Furthermore, the internalized exosome-miR-421 targets HS2ST1 through VEGF-mediated activation of ERK and AKT, thus promoting HUVEC migration, invasion, and tube formation. Maternally expressed gene 3 (MEG3), a long non-coding RNA (lncRNA), has been reported to function as a tumor suppressor gene in various solid cancers [24,25]. We further found that downregulation of lncRNA MEG3 can lead to upregulation of miR-421 in OSCC cells. In addition, treatment the exosomes derived from MEG3-overexpressing OSCC cells significantly increased the expression of HS2ST1 protein and, conversely, decreased the phosphorylation of VEGFR2, ERK, AKT and tube formation of HUVEC cells. Taken together, our results suggest that the lncRNA MEG3-mediated exosomal miR-421/HS2ST1 axis may be a new therapeutic target for OSCC angiogenesis.
2. Results
2.1. OSCC Cell-Derived Exosomal miR-421 Promotes HUVEC Tube Formation, Migration and Invasion
To determine the function of exosomes-mediated angiogenesis, we treated HUVECs with exosomes derived from OSCC cells (OCE-M1 and TW2.6) and transformed normal human keratinocyte (OKF4/hTERT) to study the effects of exosomes on the ability of migration, invasion and tube formation. We isolated exosomes from cell culture medium and observed their appearance by transmission electron microscope (TEM)(Supplementary Figure S1A), size determination by dynamic light scattering (DLS) (Supplementary Figure S1B) and exosomal surface markers analysis (CD9 and CD81) by western blot (Supplementary Figure S1C) to verify the presence of exosomes. These results indicate that the particles we isolated have typical sizes (50-120 nm), specific surface markers and characteristic morphology of exosomes. We then treated HUVECs with the obtained exosomes for 6 h. We found that exosomes derived from OSCC cells significantly increased HUVECs migration (Figure 1A), invasion (Figure 1B) and tube formation (Figure 1C) when compared with exosomes extracted from normal human keratinocyte OKF4/hTERT, indicating that OSCC-derived exosomes have a remarkable ability to induce angiogenesis in endothelial cells.
Recently, it has been reported that tumor-derived exosomal miRNAs can act as key messengers in intercellular communication, regulating tumor angiogenesis and metastasis [30,31]. Therefore, we used miRNA microarray analysis to explore the differentially expressed miRNAs in OSCC-derived exosomes compared with those in normal OKF4/hTERT cells. We then found 228 miRNAs in OEC-M1 exosomes and 233 miRNAs in TW2.6 exosomes as compared to normal OKF4/hTERT exosomes. Combining these two sets of results, we identified 181 miRNAs that were consistently differentially expressed in OSCC exosomes (Figure 1D and Supplementary Table S1). Next, to highlight the clinical significance of these miRNAs, we intersected these 181 miRNAs with OSCC patients whose miRNA expression data were deposited in the GEO database through our previous study (GSE37991) [32]. Finally, we screened 12 miRNAs that were upregulated in OSCC-derived exosomes with filtered p-value ≤0.05 and >2-fold change (Figure 1E and Supplementary Table S2). To determine whether these 12 of selective miRNAs have direct effects on vascular endothelial cells, we transfected miRNAs mimics (PM) directly into HUVECs cells and assessed their effects on tube formation ability, respectively. The results show that miR-421 and miR-130b-3p appear to exhibit a significant ability to induce tube formation on HUVEC cells (Figure 1F). Since exosome-derived miR-130b-3p promoted angiogenesis has been reported in OSCC [33]. Thus, miR-421 was chosen for subsequent experiments. We found that miR-421 not only stimulated the tube formation, but also significantly induced migration and invasion of HUVECs in vitro (Figure 1G). Next, we transfected mimics of miR-421 (PM421) into OEC-M1 to generate miR-421-enriched exosomes. As expected, HUVECs incubated with miR-421-enriched exosomes showed increased migration, invasion and tube formation (Figure 1H), suggesting that miR-421 in OSCC cells-secreted exosomes plays a key role in promoting HUVEC angiogenesis.
2.2. miR-421 Induces Neovascularization In Vivo
To further confirm the above findings, matrigel plug assay was then used to explore the miR-421 function in angiogenesis in vivo. Matrigel mixed with miR-421 was injected subcutaneously into the flanks of nude mice and analyzed 12 days later. After sacrifice, it was shown that matrigel plugs mixed with miR-421 (PM421) had more blood vessels and higher hemoglobin concentration than matrigel plugs mixed with scramble control (SC)(Figure 2A). In addition, IHC staining of H&E and CD31 was performed to determine the effect of miR-421 in neovascularization. The results revealed that matrigel plugs containing miR-421 exhibited more microvessels than in those containing scramble control (Figure 2B). Furthermore, the levels of miR-421 were abnormally elevated in OSCC cells and OSCC patients, consistent with the levels of miR-421 in exosomes released from OSCC cells. (Figure 2C and Supplementary Figure S2). Additionally, Kaplan-Meier analysis revealed that miR-421 expression was correlated with poor overall survival in TCGA’s OSCC cohort (n = 239) (p = 0.043; Figure 2D). Taken together, these finding suggest that OSCC cells expressed high level of miR-421 which can be secreted by OSCC cells and delivered to HUVECs via exosomes, leading to angiogenesis.
2.3. HS2ST1 Is a Target of miR-421 in HUVECs
In order to determine the downstream target genes of miR-421 in HUVECs, we performed genome-wide gene expression analysis using miR-421 transfected HUVECs. Compared with control cells, a total of 371 differentially expressed genes were obtained in miR-421 transfected HUVECs (Figure 3A). To search whether these 371 genes are direct target genes of miR-421, we used the miRWalk database (http://mirwalk.umm.uni-heidelberg.de/) to further compare whether there are binding sites of miR-421 in the 3’-UTR regions of these genes. Through this step, we identified 27 genes that were not only downregulated in miR-421-transfected HUVECs but also contained miR-421 binding sites (Figure 3B, C and Supplementary Table S3). Using quantitative real time-PCR, we validated the expression level of 27 genes in miR-421-transfected HUVEC cells. As expected, most genes were significantly reduced in miR-421-transfected HUVECs (Figure 3D).
Among these genes, we are particularly interested in HS2ST1 gene. HS biosynthetic enzyme HS2ST1 catalyzed a 2-O sulfation of glucosamine in HSPGs [34]. Previous studies demonstrated that HS modifications of HSPGs play an important role in cancer growth, motility, and angiogenesis [35,36]. However, little is known about the specific functional role of HS2ST1 in HUVECs angiogenesis. Using bioinformatics analysis, we predicted three putative binding sites of miR-421 in 3’-UTR of HS2ST1 (Figure 3E). We then tested whether miR-421 could directly interact with HS2ST1 through performing luciferase reporter assay. The relative luciferase activity of the reporter gene containing the HS2ST1 wild-type 3’-UTR was significantly inhibited by transfection with a miR-421 mimic (PM421), but the activity of the reporter gene containing the HS2ST1 mutant 3’-UTR (Mut) was no significant change. (Figure 3F). The protein level of HS2ST1 was also decreased after transfection of miR-421 mimic (PM421) in HUVEC cells (Figure 3G). Furthermore, we examined the role of HS2ST1 in HUVECs angiogenesis. We found that knockdown of HS2ST1 (si-HS2ST1#1 and si-HS2ST1#2) using siRNA technology not only attenuated HS2ST1 protein expression (Figure 3H), but also promoted the tube formation in HUVEC cells (Figure 3I, J). These data suggested that HS2ST1 acted as a direct target gene of miR-421 and involved in HUVECs angiogenesis.
2.4. HS2ST1 Modulates VEGF-Mediated Activation of ERK and AKT in HUVECs
We next tested whether HS2ST1 could affect the angiogenesis-related ERK and AKT signaling. Phosphorylation of ERK and AKT was increased in HS2ST1 knockdown HUVEC cells compared with control cells (si-NT) (Figure 4A). Not only that, knockdown of HS2ST1 also resulted in enhanced migration and invasion abilities of HUVEC cells. (Figure 4B). In contrast, HS2ST1 overexpression showed decreased migration, invasion and tube formation (Figure 4C,D) in HUVECs. Phosphorylation of ERK and AKT was decreased in HS2ST1-overexpressing HUVEC cells compared with control cells (NT) (Figure 4E). These results suggested an important role of HS2ST1 in mediating angiogenesis-related signaling pathways. Previous studies have reported that 2-O-sulfated HS oligosaccharides by HS2ST1 can block basic fibroblast growth factor (FGF-2) binding to its receptor and modulate FGF-2-mediated MAPK signaling [14,37]. Given these findings, we hypothesized that HS2ST1 may involve in the VEGF-induced ERK and AKT activation in HUVEC cells. To test this hypothesis, we examined the phosphorylation level of VEGFR2, ERK, and AKT in the presence of VEGF (5 ng/ml). As expected, HS2ST1 overexpression potently suppressed VEGF-induced phosphorylation of VEGFR2, ERK and AKT in HUVEC cells (Figure 4F). We then asked whether miR-421 could regulate the activities of VEGFR2, ERK, and AKT. We observed that miR-421 (PM421) overexpression not only decreased the expression of HS2ST1, but also increased the phosphorylation levels of VEGFR2, ERK and AKT (Figure 4G). Besides, we also found that overexpression of miR-421 increased the expression of mesenchymal markers, such as N-cadherin, snail, and slug, and conversely, decreased the expression of epithelial markers, such as VE-cadherin (Figure 4H). Overall, these data demonstrated that miR-421/HS2ST1 axis modulates VEGF/VEGFR2-mediated activation of ERK and AKT, and indicated a shift tread for EMT phenotype.
2.5. Exosomal miR-421 Promotes Tube Formation by Targeting HS2ST1
So far, we have demonstrated that HS2ST1 is the direct target of miR421, but whether miR-421 induced tube formation through HS2ST1 remains unclear. To determine whether miR-421-induced tube formation is mediated by HS2ST1, we cotransfected HUVECs with the miR-421 mimics (PM421) and a HS2ST1 expression plasmid that did not contain the 3’-UTR of HS2ST1. We observed that miR-421-induced HUVEC migration, invasion, tube formation and phosphorylation of VEGFR2, ERK and AKT were inhibited by HS2ST1 overexpression (Figure 5A–C). We repeated the above experiments by replacing miR-421 with miR-421-enriched exosomes isolated from OEC-M1 cells. Consistent with the above observation, HS2ST1 overexpression also suppressed the exosomal-miR-421-induced HUVEC migration, invasion, tube formation and phosphorylation of VEGFR2, ERK and AKT (Figure 5D–F). These results indicated that exosomal miR-421 promotes HUVECs tube formation and modulates angiogenetic signaling mainly through HS2ST1 downregulation.
2.6. LncRNA MEG3 Inhibits Tube Formation via Targeting miR-421
In previously study, we have found that lncRNA MEG3 was hypermethylated and downregulated in OSCC cells [32]. Recently, lncRNA MEG3 was reported to act as a competing endogenous RNA (ceRNA) to regulate tumorigenesis by targeting miRNAs [38]. Therefore, we are very interested to explore whether lncRNA MEG3 competitively binds and absorbs miR-421 as a ceRNA in OSCC cells. Using MS2 RNA-Immunoprecipitation (RNA-IP), we attempted to pull down endogenous miRNA bound to lncRNA MEG3. The results showed that MEG3 RNA-IP was significantly enriched for miR-421 in OEC-M1 cells compared with MS2 control vector (Figure 6A). Furthermore, transfection of MEG3-wild-type (WT) and miR-421 mimic reduced luciferase activity compared to the group transfected with MEG3-mutant (Mut) and miR-421 mimic (Figure 6B), indicated that lncRNA MEG3 could suppress the expression level of miR-421 through direct binding. We then asked whether MEG3 affects HUVEC angiogenesis through exosomal miR-421. We observed that MEG3 overexpression (Figure 6C) not only reduced the level of cellular miR-421 (Figure 6D), but also decreased the level of exosomal miR-421 (Figure 6E) in OSCC cells. In addition, when HUVEC cells were treated with exosomes derived from MEG3-overexpressing OSCC cells, not only significantly increased HS2ST1 protein, but also decreased VEGFR2, ERK, AKT phosphorylation (Figure 6F) and tube formation of HUVEC cells (Figure 6G).To consolidate our findings, we also examined the expression profiles of lncRNA MEG3 and miR-421 in OSCC patients. The data showed that MEG3 levels were significantly downregulated and miR-421 levels were significantly up-regulated in tumors (T) compared with corresponding normal samples (N) (p<0.0001) (Figure 6H). Moreover, the expression level of LncRNA MEG3 was significantly negatively correlated with the expression level of miR-421. (Figure 6I). Taken together, these results indicate that downregulation of lncRNA MEG3 in OSCC cells can stimulate angiogenesis by regulating miR-421 expression and promoting exosomal miR-421 release and targeting HUVEC cells.
2.7. Blocking Exosome Uptake Inhibits Tube Formation in HUVECs
Dynasore is a small pharmacological inhibitor that inhibits the GTPase activity of dynamin and is known to interfere with exosome internalization [39]. To determine the process of tube formation that contributes to the internalization of OSCC cell-derived exosomes, exosomes stained with PKH26 dye were added to the medium of dynasore-treated or untreated HUVECs. We found that red fluorescence was decreased in HUVEC cells depended on the dynasore concentration (Figure 7A, B left). Dynasore significantly blocked 50% of exosome uptake (20 μM) and 91% of exosome uptake (20 μM) compared with DMSO control HUVEC cells (Figure 7B right). Dynasore not only inhibited exosome uptake, but also decreased miR-421 level in endothelial cells (Figure 7C), which in turn increased HS2ST1 protein expression, decreased VEGFR2 phosphorylation (Figure 7D), and ultimately suppressed tube formation in HUVECs (Figure 7E). These results suggest that exosomes released by OSCC cells can act as angiogenesis promoters, and inhibiting exosome uptake by HUVEC cells may be a potential therapeutic approach for cancer treatment.
3. Discussion
Angiogenesis is a crucial process in solid cancer tumorigenesis, promoting tumor growth, recurrence and metastasis [5]. Despite large evidence suggested that targeting angiogenesis can provide clinical advantage in the treatment of solid tumors [40]. However, there are no FDA-approved anti-angiogenic drugs for OSCC, although this cancer occurs in highly vascularized tissues [41]. In this study, we showed that OSCC-derived exosomal miR-421 can target endothelial cells to increase angiogenesis by targeting HS2ST1 via VEGFR2 and downstream signaling pathways. Furthermore, we also found that miR-421 was negatively regulated by lncRNA MEG3, which acts as a ceRNAs in OSCC (Figure 8). Therefore, our study not only suggests that blocking the transmission of pro-angiogenic miRNAs in exosomes might be an effective antiangiogenic therapeutic approach for OSCC, but also provides insights about the regulation and functionality of lncRNA MEG3.
LncRNA MEG3 is located in the imprinted DLK1–MEG3 locus on human chromosome 14q32 region [42]. An increasing number of studies have shown that lncRNA MEG3 is hypermethylated and downregulated in various cancer tissues and cancer cell lines, playing the role of a tumor suppressor gene, and is a good biomarker for cancer diagnosis and prognosis [43]. In terms of the role of ceRNA, lncRNA MEG3 can bind different miRNAs like a “sponge” and contribute to the regulatory network of miRNAs. For example, the neuroprotective effect of MEG3 silencing on PC12 cells is through the regulation of PI3K/AKT and NF-kB pathways by sponging miR-21 [44]. Likewise, another study showed that down-expression of MEG3 could promote the proliferation of colonic stem cells in early colorectal cancer through binding miR-708 [45]. Furthermore, previous studies have shown that MEG3 regulated EMT by sponging miR-421 targeting E-cadherin in HNSCC [46]. Ye et al. found that anisomycin inhibited the downstream signaling of the Notch1 pathway by attenuating the molecular sponge effect of the lncRNA Meg3 with miR-421 in ovarian cancer cells [47]. Consistent with these findings, we also showed that MEG3 exerted its regulatory role in oral cancer by interacting with miR-421, and includes several novel observations: (1) MEG3 restoration not only reduced the levels of miR-421 in OSCC cells but also resulted in decreased miR-421 levels in OSCC-deriver exosomes. (2) OSCC-deriver exosomes from MEG3 restoration resulted in reduced VEGFR2, ERK, and AKT activities, leading to reduced tube formation in HUVECs. Our study shows that down-regulated MEG3 can increase the expression of miR-421, which is then packaged in OSCC cell-derived exosomes and secreted into the extracellular microenvironment to target vascular endothelial cells and induce angiogenesis. To our knowledge, this is the first study to show that lncRNA MEG3 can affect exosomal miRNA secretion from OSCC and cause angiogenesis in the tumor microenvironment.
Recently, exosomes have been receiving enormous attention in both basic and translational medicine [48]. This is mainly because exosomes derived from cancer cells can change the behavior of target cells in tumor microenvironment, and more importantly, exosomes have shown utility in the diagnosis and treatment of various cancers [49]. Zhang et al. reported that treatment of esophageal squamous cell carcinoma cells with the exosome inhibitor SW4869 largely attenuated the migration and tube formation of HUVECs [50]. Collectively, these results demonstrate that cancer cells-derived exosomes exerts an angiogenic effect and suggest that exosomes are indeed potential targets for cancer therapy, whether by blocking the generation of exosomes in cancer cells or by inhibiting the exosome internalization in HUVECs. Many in vitro studies and pre-clinical in vivo studies indicate that lots of compounds have the ability to block the formation and release of exosomes, which may prove useful for interfering the progression of certain types of cancers [51]. For example, imipramine (acid sphingomyelinase inhibitor), simvastatin (HMG-CoA reductase inhibitor) and DPTIP (neutral sphingomyelinase 2 inhibitor) are designed for blocking exosomes biogenesis. Calpeptin (an inhibitor of the Ca2+-dependent protease), and manumycin A (Ras farnesyltransferase inhibitor) are designed for inhibiting exosomes release. On the other hand, methyl-β-cyclodextrin inhibits caveolin-mediated endocytosis, which blocks exosomes uptake in recipient cells. These inhibitors affect different stages of exosome biogenesis and trafficking, and disruption of cell-to-cell communication from cancer cell-derived exosomes appears to provide an exciting new approach to cancer therapy [52]. Currently, based on research results and clinical trials, exosomes are considered as immunotherapeutic vaccines for various cancers [48]. Dendritic cells (DCs)-derived exosomes have been found to activate naturel killer cells and antigen-specific cytotoxic T lymphocytes in the treatment of patients [53]. DCs-derived exosomes not only contain various bioactive molecules responsible for antigen presentation, but also have a smaller size to escape clearance by the mononuclear phagocyte system [48]. Thus, using natural sources of exosomes from immune cells to suppress tumor growth represent an important strategy for cancer therapy.
Emerging evidence suggests that exosomal cargo, especially miRNA, is valuable for predicting disease progression and prognosis [54]. In addition to avoiding RNase-mediated degradation, another advantage of packaging miRNAs into cellular exosomes is that they can be easily taken up by neighboring cells or carried to distant sites, thus potentially inducing phenotypic changes in recipient cells. Since oral cancer cells-derived exosomes can enhance endothelial cell migration and tube formation, the purpose of this study was to identify and characterize selective exosomal miRNA profiles and speculate on their potential targets involved in angiogenesis. To this end, we performed miRNA array analysis on oral cancer cell-derived exosomes and tissue samples from OSCC patients. Our study showed that high expression of miR-421 in oral cancer cell and OSCC patients is clinically associated with poor patient survival, suggesting that miR-421 may be a useful biomarker for OSCC prognosis. Additionally, we found that HS2ST1 expression was lower in HUVECs treated with exosomal miR-421. Restoration of HS2ST1 reversed exosomal miR-421-induced HUVECs tube formation, suggesting that HS2ST1 contributes to miR-421-mediated angiogenesis. Aberrant expression of HE2ST1 is frequently observed in tumors, suggesting that HS2ST1 plays an important role in tumor progression. For example, upregulation of HS2ST1 was associated with reduced invasive ability by attenuating FGF-2-induced MAPK activation in breast cancer cells [14]. In addition, overexpression of HS2ST1 can decrease the stemness phenotype in triple negative MDA-MB-231 breast cancer cell line, possibly by regulating notch and Wnt-signaling pathways [55]. However, little literature discusses the role of HS2ST1 in vascular endothelial cells. In this report, we demonstrate a novel role for HS2ST1 in regulating tube formation in vascular endothelial cells through VEGFR2-mediated MAPK signaling. Importantly, HS2ST1 overexpression reduced VEGF-induced phosphorylation of VEGFR2, ERK, and AKT, suggesting that HS 2-O-sulfation by HS2ST1 interferes the binding of VEGF to its receptor, VEGFR2. The mechanism by which HS2ST1 inhibits VEGF signaling is not well understood, however, previous studies have shown that 2-O-sulfated HS oligosaccharides are highly negatively-charge, which interacts with positively charged ligand proteins, thereby blocking ligand-receptor binding [37]. Another possible speculation is that the sulfated HS by HS2ST1 may induce a conformational change in HS that hinders the binding of VEGF and VEGFR2. Therefore, whether it is the charge change or the configuration change that blocks the ligand engagement needs further investigation.
4. Materials and Methods
4.1. Cell Culture
OSCC cell lines (OEC-M1 and TW2.6) were cultured as previously described [26]. Transformed normal human keratinocyte (OKF4/hTERT) was obtained from Rheinwald lab, and cultured in oral keratinocyte medium (OKM; ScienCell Research Laboratories, Carlsbad, CA, USA) according to the manufacturer’s instructions. HUVEC cells were cultured in M199 medium (Gibco, Grand Island, NY, USA) supplemented with 500 units/mL of heparin (Sigma-Aldrich, St. Louis, MO, USA) and 0.03 mg/mL of endothelial cell growth supplement (Sigma-Aldrich). All cells were definite by cell morphology and growth features, and cultured at 37 °C in 10% fetal bovine serum (FBS, Kibbutz BeitHaemek, Israel) within 2 months of resuscitation from the frozen stock.
4.2. Exosome Purification, Characterization and Quantification
Exosomes from the culture medium were purified by ultracentrifugation method. Briefly, cell culture medium was replaced with serum-free medium for 48 h. The collected culture medium was centrifuged at 300xg for 10 min to remove cellular debris. The supernatant was then centrifuged at 1,200xg for 20 min and 10,000xg for 30 min to remove large vesicles. Finally, the supernatant was ultracentrifuged at 110,000×g for 2 h to collect exosome pellet using Beckman Optima XL-90 ultracentrifuge (GMI Inc., Ramsey, MN, USA). The obtained exosome pellets were lastly washed and resuspended in PBS.
The morphology of exosome pellets was examined under a Hitachi H-7650 transmission electron microscope (TEM)( Hitachi Ltd., Tokyo, Japan). Briefly, 5 μL of exosomes in PBS drops were loaded onto carbon-coated copper grids and left at room temperature for 10 min. The exosomes on the copper mesh were washed with sterile distilled water, and then incubated with 1% phosphotungstic acid for 5 min. Let the samples dry under the lamp for 10 min before viewing on the TEM. For examining the particle size and quantity of exosomes, dynamic light scattering (DLS) was performed using a Nano Zetasizer (Malvern Instruments Inc., Westborough, MA, USA) according to the operating instructions.
The BCA kit was used to measure the protein concentration of exosomes. 25 μg of exosomes were used for each experiment. Exosome-specific surface proteins, CD9 (GTX100912, GeneTex, Irvine, CA, USA) and CD81 (GTX101766, GeneTex), were detected by western blot.
4.3. Tube Formation Assay
For tube formation assay, a precooled 96-well plate was coated with 10 μl of Matrigel (BD Biosciences) in each well and incubated at room temperature for 1 h. A total of 3,500 HUVEC cells of cell suspension was added to each well and incubated for 6 h, and the tubes that formed were imaged and counted with image J software package. Mean number of meshes was statistically analyzed and used as angiogenesis index.
4.4. Cell Migration and Invasion Assays
The 24-well Fluoro-Blok inserts (#351152, BD Biosciences, Franklin Lakes, NJ) were utilized to measure the invasion and migration ability of HUVECs. 3x10⁴ cells were seeded in the upper chamber coated with (for invasion assay) or without (for migration assay) Matrigel (BD Biosciences) in culture medium containing 10% NuSerum. Following an 8-hour incubation for migration assays and 24-hour incubation for invasion assays, cells that had crossed the Fluoro-Blok membrane were fixed with 95% methanol and stained with propidium iodide. Fluorescent images were then counted using the Analytical Imaging Station software e (Imaging Research, Ontario, Canada).
4.5. RNA Extraction, Reverse Transcription and Quantitative-PCR (q-PCR)
TRIzol reagent (Life Technologies, Gaithersburg, MD, USA) was used to purify total RNA and exosomes based on the manufacturer’s protocol. RNA concentration was determined by NanoDrop ND-1000 spectrophotometer (Thermo Fisher Scientific, Wilmington, DE, USA). For mRNA and lncRNA analysis, the cDNA was synthesized using random hexamer primers and SuperScript III reverse transcriptase (Invitrogen, Carlsbad, CA, USA). For miRNA analysis, the cDNA was synthesized using specific stem-loop RT primers and TaqMan MicroRNA Reverse Transcription Kit (Applied Biosystems, Carlsbad, CA, USA). q-PCR analysis was performed using Omics Green EvaGreen q-PCR Master Mix (OMICS Biotechnology, New Taipei City, Taiwan) to detect gene expression levels, and using QuantiTect SYBR Green PCR System (Qiagen, Hilden, Germany) to detect miRNA expression levels, respectively, according to the manufacturer’s instructions on the ABI StepOnePlus Real-time PCR system (Applied Biosystems). Bdi-miR-159-5p was used as the spike-in control for exosomal miRNA analysis, while, GAPDH and RUN44 were used as the internal control for the detection of mRNA and miRNA in cells. All primers used for this study are listed in Supplementary Table S4.
4.6. Exosomal miRNA Profiling
Exosomal miRNA isolated from OKF4/hTERT, OEC-M1 and TW2.6 cells were extracted using TRIzol reagent (Life Technologies). The miRNA RNA purity, concentration and integrity were determined using a NanoDrop ND-1000 spectrophotometer (Thermo Fisher Scientific, Wilmington, DE, USA) and Agilent 2100 Bioanalyzer (Agilent Technologies, Santa Clara, CA, USA), respectively. Exosomal miRNA profiling was performed using Affymetrix, GeneChipTM miRNA 3.0 array (Thermo Fisher Scientific) according to the manufacturer’s protocol.
4.7. In Vivo Matrigel Plug Assay
A total of 400 μl of growth factor-reduced Matrigel HC (#354262, Corning Inc., Corning, NY, USA), containing 15U of heparin (#H3393, Sigma-Aldrich) and 100 μl of miR-421 mimics (PM421) or scramble control (SC) was injected into the right flank of 6-week-old male nude mice (BALB/cAmM.CgFoxn1nu/CrlNarl), 4 mice per group. The plug was removed after 12 days, half of the plug was formalin-fixed and sliced for immunohistochemistry [27], and the other half of the plug was used for hemoglobin analysis. The presence of the blood endothelial cell-specific marker was assessed with CD31 antibody (#3528, Cell signaling, Danvers, MA, USA). Hemoglobin concentration was measured using a hemoglobin kit (#EIAHGBC, Invitrogen, Carlsbad, CA) following the manufacturer’s protocol to indicate as an angiogenic index.
4.8. Clinical Samples and Microarray Profiling
A total of 40 paired OSCC tissue, including tumor and their adjacent non-tumorous tissues, were obtained from the National Cheng Kung University Hospital (Tainan, Taiwan) as previously described [26]. The research protocol was reviewed and approved by the Research Ethics Committee of National Health Research Institutes (No: EC1040409-E) and Institutional Human Experiment and Ethic Committee of National Cheng Kung University Hospital (HR-97-100). These matched pairs of oral tumor/adjacent normal (T/N) tissues were prepared for microarray analysis using the whole genome DASL HumanRef-8-v3 chip and the Human-2v MicroRNA Expression BeadChips (Illumina, Inc.). These microarray profiling data are deposited in Gene Expression Omnibus (GEO) under accession number GSE37991 for gene expression and GSE45238 for miRNA expression.
4.9. Plasmids, Transfection and Virus Infections Assays
To construct the dual-luciferase reporter vectors, the entire 3’-untranslated region (3’-UTR) of HS2ST1 fragment and the entire MEG3 gene, containing target sequences of miR-421, were PCR amplified and cloned into the pmirGLO vector (Promega, Madison, WI, USA) according to the manufacturer’s instructions. The miR-421 binding site mutation vectors were also constructed by using Site-Directed Mutagenesis Kit (Stratagene, La Jolla, CA), and all the constructs were verified by DNA sequencing.
For transfection of the plasmids, cells were transfected with 2 μg of plasmids using Lipofectamine 2000 (Invitrogen) according to the manufacturer’s protocol. The miRNA mimics (PM) and scramble control (SC) were obtained from Thermo Fisher Scientific, the small interfering RNAs (siRNAs) of HS2ST1 (si-HS2ST1#1, #2) and si-non-targeting control (si-NT) were purchased from Horizon Discovery (Cambridge, UK). The nucleotide transfection was performed using Lipofectamine RNAiMAX (Thermo Fisher Scientific) according to the manufacturer’s instructions.
The lentiviral vectors expressing HS2ST1 or the control (NT) were transfected into the packaging cell line 293FT, along with pMD. G and pCMV△R8.91 plasmid, using the Polyjet transfection reagent (SignaGen Lab, Ijamsville, MA, USA), and the lentivirus was collected after 48 h to infect HUVEC cells.
4.10. Luciferase Reporter Assay
Cells were cotransfected with reporter vector containing the 3’-UTR of HS2ST1 or MEG3 sequence and miR-421 mimics (PM421, 20 nM) or scramble control (SC, 20 nM). After 48 h, firefly and Renilla luciferase activities were detected using the Dual Luciferase Reporter Assay System (Promega, Madison, WI, USA) on the Orion L luminometer (Berthold, GmbH, Pforzheim, Germany) according to the manufacturer’s protocol.
4.11. Protein Extraction and Western Blotting Analysis
Protein extraction and western blotting were performed as previously described [28]. The primary antibodies used in the present study included HS2ST1 (sc-376530, Santa Cruz Biotechnology, Santa Cruz, CA, USA), CK18 (sc-6259, Santa Cruz Biotechnology), ERK (#9102, Cell Signaling), phosphor-ERK (p-ERK, #9101, Cell Signaling), AKT (#9272, Cell Signaling), phosphor-AKT (p-AKT, #9271, Cell Signaling), VEGFR2 (#24792, Cell Signaling), phosphor-VEGFR2 (p-VEGFR2, #2478, Cell Signaling). GAPDH (GTX100118, GeneTex) was used as an internal control. Signals from HRP-conjugated secondary antibodies were visualized using the enhanced chemiluminescence (ECL) detection system (PerkinElmer, Waltham, MA) and the chemiluminescence was exposed onto Kodak X-Omat film (Kodak, Chalon/Paris, France).
4.12. RNA-Immunoprecipitation (RNA-IP)
RNA-IP was performed and modified as previously described [29]. Briefly, cells were infected with virus particles which contained pCDH-HA-2xMCP-SBP, pCDH-24xMS2 or pCDH-MEG3-24xMS2 plasmids for 48 h. Then, cells were lysed using RIPA extraction buffer containing RNase inhibitor and protease inhibitor cocktail (Sigma-Aldrich, Inc. Louis, MO, USA). The protein concentration was then determined using the BCA assay kit (Thermo Fisher Scientific) with bovine serum albumin as standard. Before immunoprecipitation, Streptavidin-Sepharose beads slurry (GE Healthcare, Chicago, IL) were pre-swollen in NT2 buffer (50 mM Tris-HCl, pH7.4, 150 mM NaCl, 1mM MgCl2, 0.05% NP-40) supplemented with 20 mM DTT, 20 mM EDTA and 200U RNase inhibitor. Equal amounts of protein lysates were subjected to immunoprecipitation overnight mixed with Streptavidin-Sepharose beads at 4℃. Pellet beads were then washed with ice-cold NT2 buffer plus 0.5 M Urea (Mallinckrodt) for 4-5 times. To isolate RNA from immunoprecipitated pellets, phenol-chloroform-isoamyl alcohol with glycogen was added to the beads at -20℃ for overnight. Precipitate RNA was resuspend in a volume suitable for subsequent assay.
4.13. Fluorescence Analysis and Exosome Uptake Assay
For exosome uptake experiments, HUVECs were pretreated with endocytosis inhibitor (dynasore) or dimethyl sulfoxide (DMSO) solvent for 6 h. And then, HUVECs were washed with PBS and incubated with PKH26 (Sigma-Aldrich)-labeled exosomes (25 μg) isolated from OEC-M1 cells at 37 °C for 2 h. As a negative control, HUVECs were incubated with DMSO only. Uptake of exosomes in HUVECs was photographed under a TCS SP5 II Confocal Microscopy (Leica, Wetzlar, Germany). Exosome uptake was also assessed by measuring PKH26 fluorescence intensity using a FACSCalibur cytometer equipped with CellQuest™ Pro software (BD Biosciences).
4.14. Statistical Analysis
All statistical analyzes were performed using GraphPad Prism 5 software Ver.5.01 (San Diego, CA, USA), and results are expressed as mean ± standard deviation (SD). Differences between groups were analyzed by two-tailed Student’s t-test. Correlations between data pairs were performed by parametric Pearson Spearman correlation analysis. Values of p < 0.05 were considered statistically significant.
5. Conclusions
Our results demonstrated a novel mechanism that MEG3 as a downregulated lncRNA, which increases the amount of OSCC-derived exosomal miR-421 that is taken by vascular endothelial cells to induce angiogenesis by targeting HS2ST1 and additional signaling pathways. Our study is the first highlights the critical role of exosomal miR421 in HS modifier enzyme, HS2ST1, in HUVEC cells. These findings further suggest that targeting the lncRNA MEG3/exosomal miR-421/HS2ST1 axis may be an effective strategy for the treatment of OSCC.
Supplementary Materials
The following supporting information can be downloaded at the website of this paper posted on Preprints.org, Figure S1 Isolation and characterization of tumor-derived exosomes; Figure S2 Expression profile of miR-421 in cell lines; Table S1. List of primer sequences. Table S2. List of 181 exosomal miRNA candidates. Table S3. List of 12 of exosomal miRNA candidates. Table S4. List of 27 of miR-421 target genes.
Author Contributions
S.-G.S., and C.-Y.H., conceived and designed the experiments. C.-Y.H., and S.-G.S., performed the data analysis and interpretation. C.-Y.H., S.-T.C., G.-H.W., Y.-M.H., and W.-J.C., performed the experiments. S.-T.C., performed the bioinformatics analysis. J.-R.H., contributed clinical materials. C.-Y.H., H.-D.W., and S.-G.S., were involved in the manuscript preparation. S.-G.S., contributed in the coordination of the study. All authors have read and agreed to the published version of the manuscript.
Funding
This study was funded by National Health Research Institutes (NHRI) grants from Taiwan (NHRI-CA-111-PP03, NHRI-CA-112-PP03), and the Ministry of Health and Welfare (MOHW) from Taiwan (MOHW112-TDU-B-222-124012, MOHW112-TDU-B-222-124014), and the Ministry of Science and Technology (MOST) grant from Taiwan (MOST-111-2314-B-400-037-).
Institutional Review Board Statement
The study protocol was approved by the Research Ethics Committee of National Health Research Institutes (EC1091104-E) and Institutional Human Experiment and Ethic Committee of National Cheng Kung University Hospital (HR-97-100) for the use of clinical materials for research purpose. Animal study protocol was approved by the Institutional Animal Care and Use Committee of the National Health Research Institutes (NHRI-IACUC-109059-A).
Informed Consent Statement
Not applicable.
Data Availability Statement
The dataset supporting the conclusions of this article is included within the article.
Acknowledgments
The authors thank for providing clinical samples from the tissue bank of the Research Center of Clinical Medicine, National Cheng Kung University Hospital. We also thank the Pathology Core Laboratory, funded by the National Institutes of Health (NHRI) in Taiwan, for providing technical support for the immunohistochemical experiments with optical image capture.
Conflicts of Interest
The authors declare no competing financial interests.
References
- Panarese, I.; Aquino, G.; Ronchi, A.; Longo, F.; Montella, M.; Cozzolino, I.; Roccuzzo, G.; Colella, G.; Caraglia, M.; Franco, R. Oral and Oropharyngeal squamous cell carcinoma: prognostic and predictive parameters in the etiopathogenetic route. Expert. Rev. Anticancer Ther. 2019, 19, 105–119. [Google Scholar] [CrossRef] [PubMed]
- Johnson, D.E.; Burtness, B.; Leemans, C.R.; Lui, V.W.Y.; Bauman, J.E.; Grandis, J.R. Head and neck squamous cell carcinoma. Nat. Rev. Dis. Primers 2020, 6, 92. [Google Scholar] [CrossRef] [PubMed]
- Roi, A.; Roi, C.I.; Negrutiu, M.L.; Rivis, M.; Sinescu, C.; Rusu, L.C. The Challenges of OSCC Diagnosis: Salivary Cytokines as Potential Biomarkers. J. Clin. Med. 2020, 9. [Google Scholar] [CrossRef] [PubMed]
- Macluskey, M.; Chandrachud, L.M.; Pazouki, S.; Green, M.; Chisholm, D.M.; Ogden, G.R.; Schor, S.L.; Schor, A.M. Apoptosis, proliferation, and angiogenesis in oral tissues. Possible relevance to tumour progression. J. Pathol. 2000, 191, 368–375. [Google Scholar] [CrossRef] [PubMed]
- Koontongkaew, S. The tumor microenvironment contribution to development, growth, invasion and metastasis of head and neck squamous cell carcinomas. J. Cancer 2013, 4, 66–83. [Google Scholar] [CrossRef] [PubMed]
- Sarrazin, S.; Lamanna, W.C.; Esko, J.D. Heparan sulfate proteoglycans. Cold Spring Harb. Perspect. Biol. 2011, 3. [Google Scholar] [CrossRef] [PubMed]
- Bishop, J.R.; Schuksz, M.; Esko, J.D. Heparan sulphate proteoglycans fine-tune mammalian physiology. Nature 2007, 446, 1030–1037. [Google Scholar] [CrossRef] [PubMed]
- Espinoza-Sanchez, N.A.; Gotte, M. Role of cell surface proteoglycans in cancer immunotherapy. Semin Cancer Biol. 2020, 62, 48–67. [Google Scholar] [CrossRef] [PubMed]
- Denys, A.; Allain, F. The Emerging Roles of Heparan Sulfate 3-O-Sulfotransferases in Cancer. Front. Oncol. 2019, 9, 507. [Google Scholar] [CrossRef]
- Karamanos, N.K.; Piperigkou, Z.; Theocharis, A.D.; Watanabe, H.; Franchi, M.; Baud, S.; Brezillon, S.; Gotte, M.; Passi, A.; Vigetti, D.; et al. Proteoglycan Chemical Diversity Drives Multifunctional Cell Regulation and Therapeutics. Chem. Rev. 2018, 118, 9152–9232. [Google Scholar] [CrossRef]
- Hull, E.E.; Montgomery, M.R.; Leyva, K.J. Epigenetic Regulation of the Biosynthesis & Enzymatic Modification of Heparan Sulfate Proteoglycans: Implications for Tumorigenesis and Cancer Biomarkers. Int. J. Mol. Sci. 2017, 18. [Google Scholar] [CrossRef]
- Witt, R.M.; Hecht, M.L.; Pazyra-Murphy, M.F.; Cohen, S.M.; Noti, C.; van Kuppevelt, T.H.; Fuller, M.; Chan, J.A.; Hopwood, J.J.; Seeberger, P.H.; et al. Heparan sulfate proteoglycans containing a glypican 5 core and 2-O-sulfo-iduronic acid function as Sonic Hedgehog co-receptors to promote proliferation. J. Biol. Chem. 2013, 288, 26275–26288. [Google Scholar] [CrossRef]
- Esko, J.D.; Selleck, S.B. Order out of chaos: assembly of ligand binding sites in heparan sulfate. Annu. Rev. Biochem. 2002, 71, 435–471. [Google Scholar] [CrossRef] [PubMed]
- Vijaya Kumar, A.; Brezillon, S.; Untereiner, V.; Sockalingum, G.D.; Kumar Katakam, S.; Mohamed, H.T.; Kemper, B.; Greve, B.; Mohr, B.; Ibrahim, S.A.; et al. HS2ST1-dependent signaling pathways determine breast cancer cell viability, matrix interactions, and invasive behavior. Cancer Sci. 2020, 111, 2907–2922. [Google Scholar] [CrossRef] [PubMed]
- Bonuccelli, G.; Casimiro, M.C.; Sotgia, F.; Wang, C.; Liu, M.; Katiyar, S.; Zhou, J.; Dew, E.; Capozza, F.; Daumer, K.M.; et al. Caveolin-1 (P132L), a common breast cancer mutation, confers mammary cell invasiveness and defines a novel stem cell/metastasis-associated gene signature. Am. J. Pathol. 2009, 174, 1650–1662. [Google Scholar] [CrossRef]
- Constantinescu, A.A.; Vink, H.; Spaan, J.A. Endothelial cell glycocalyx modulates immobilization of leukocytes at the endothelial surface. Arterioscler. Thromb. Vasc. Biol. 2003, 23, 1541–1547. [Google Scholar] [CrossRef]
- Pretorius, D.; Richter, R.P.; Anand, T.; Cardenas, J.C.; Richter, J.R. Alterations in heparan sulfate proteoglycan synthesis and sulfation and the impact on vascular endothelial function. Matrix Biol. Plus 2022, 16, 100121. [Google Scholar] [CrossRef]
- He, C.; Zheng, S.; Luo, Y.; Wang, B. Exosome Theranostics: Biology and Translational Medicine. Theranostics 2018, 8, 237–255. [Google Scholar] [CrossRef]
- Liu, Q.; Peng, F.; Chen, J. The Role of Exosomal MicroRNAs in the Tumor Microenvironment of Breast Cancer. Int. J. Mol. Sci. 2019, 20. [Google Scholar] [CrossRef] [PubMed]
- Kumar, V.B.S.; Anjali, K. Tumour generated exosomal miRNAs: A major player in tumour angiogenesis. Biochim. Biophys. Acta Mol. Basis Dis. 2022, 1868, 166383. [Google Scholar] [CrossRef]
- He, S.; Zhang, W.; Li, X.; Wang, J.; Chen, X.; Chen, Y.; Lai, R. Oral squamous cell carcinoma (OSCC)-derived exosomal MiR-221 targets and regulates phosphoinositide-3-kinase regulatory subunit 1 (PIK3R1) to promote human umbilical vein endothelial cells migration and tube formation. Bioengineered 2021, 12, 2164–2174. [Google Scholar] [CrossRef]
- Wang, H.; Wang, L.; Zhou, X.; Luo, X.; Liu, K.; Jiang, E.; Chen, Y.; Shao, Z.; Shang, Z. OSCC Exosomes Regulate miR-210-3p Targeting EFNA3 to Promote Oral Cancer Angiogenesis through the PI3K/AKT Pathway. Biomed. Res. Int. 2020, 2020, 2125656. [Google Scholar] [CrossRef]
- Hao, C.; Wangzhou, K.; Liang, Z.; Liu, C.; Wang, L.; Gong, L.; Tan, Y.; Li, C.; Lai, Z.; Hu, G. Circular RNA ITCH Suppresses Cell Proliferation but Induces Apoptosis in Oral Squamous Cell Carcinoma by Regulating miR-421/PDCD4 Axis. Cancer Manag. Res. 2020, 12, 5651–5658. [Google Scholar] [CrossRef] [PubMed]
- Zhang, J.; Lin, Z.; Gao, Y.; Yao, T. Downregulation of long noncoding RNA MEG3 is associated with poor prognosis and promoter hypermethylation in cervical cancer. J. Exp. Clin. Cancer Res. 2017, 36, 5. [Google Scholar] [CrossRef] [PubMed]
- Zhang, X.; Gejman, R.; Mahta, A.; Zhong, Y.; Rice, K.A.; Zhou, Y.; Cheunsuchon, P.; Louis, D.N.; Klibanski, A. Maternally expressed gene 3, an imprinted noncoding RNA gene, is associated with meningioma pathogenesis and progression. Cancer Res. 2010, 70, 2350–2358. [Google Scholar] [CrossRef] [PubMed]
- Chou, S.T.; Peng, H.Y.; Mo, K.C.; Hsu, Y.M.; Wu, G.H.; Hsiao, J.R.; Lin, S.F.; Wang, H.D.; Shiah, S.G. MicroRNA-486-3p functions as a tumor suppressor in oral cancer by targeting DDR1. J. Exp. Clin. Cancer Res. 2019, 38, 281. [Google Scholar] [CrossRef] [PubMed]
- Shiah, S.G.; Hsiao, J.R.; Chang, H.J.; Hsu, Y.M.; Wu, G.H.; Peng, H.Y.; Chou, S.T.; Kuo, C.C.; Chang, J.Y. MiR-30a and miR-379 modulate retinoic acid pathway by targeting DNA methyltransferase 3B in oral cancer. J. Biomed. Sci. 2020, 27, 46. [Google Scholar] [CrossRef] [PubMed]
- Peng, H.Y.; Jiang, S.S.; Hsiao, J.R.; Hsiao, M.; Hsu, Y.M.; Wu, G.H.; Chang, W.M.; Chang, J.Y.; Jin, S.L.; Shiah, S.G. IL-8 induces miR-424-5p expression and modulates SOCS2/STAT5 signaling pathway in oral squamous cell carcinoma. Mol. Oncol. 2016, 10, 895–909. [Google Scholar] [CrossRef] [PubMed]
- Liu, S.; Zhu, J.; Jiang, T.; Zhong, Y.; Tie, Y.; Wu, Y.; Zheng, X.; Jin, Y.; Fu, H. Identification of lncRNA MEG3 Binding Protein Using MS2-Tagged RNA Affinity Purification and Mass Spectrometry. Appl. Biochem. Biotechnol. 2015, 176, 1834–1845. [Google Scholar] [CrossRef]
- Mao, S.; Lu, Z.; Zheng, S.; Zhang, H.; Zhang, G.; Wang, F.; Huang, J.; Lei, Y.; Wang, X.; Liu, C.; et al. Exosomal miR-141 promotes tumor angiogenesis via KLF12 in small cell lung cancer. J. Exp. Clin. Cancer Res. 2020, 39, 193. [Google Scholar] [CrossRef]
- Tan, Y.; Luo, X.; Lv, W.; Hu, W.; Zhao, C.; Xiong, M.; Yi, Y.; Wang, D.; Wang, Y.; Wang, H.; et al. Tumor-derived exosomal components: the multifaceted roles and mechanisms in breast cancer metastasis. Cell Death Dis. 2021, 12, 547. [Google Scholar] [CrossRef] [PubMed]
- Shiah, S.G.; Hsiao, J.R.; Chang, W.M.; Chen, Y.W.; Jin, Y.T.; Wong, T.Y.; Huang, J.S.; Tsai, S.T.; Hsu, Y.M.; Chou, S.T.; et al. Downregulated miR329 and miR410 promote the proliferation and invasion of oral squamous cell carcinoma by targeting Wnt-7b. Cancer Res. 2014, 74, 7560–7572. [Google Scholar] [CrossRef] [PubMed]
- Yan, W.; Wang, Y.; Chen, Y.; Guo, Y.; Li, Q.; Wei, X. Exosomal miR-130b-3p Promotes Progression and Tubular Formation Through Targeting PTEN in Oral Squamous Cell Carcinoma. Front. Cell Dev. Biol. 2021, 9, 616306. [Google Scholar] [CrossRef] [PubMed]
- Li, J.P.; Kusche-Gullberg, M. Heparan Sulfate: Biosynthesis, Structure, and Function. Int. Rev. Cell Mol. Biol. 2016, 325, 215–273. [Google Scholar] [CrossRef]
- Sasisekharan, R.; Shriver, Z.; Venkataraman, G.; Narayanasami, U. Roles of heparan-sulphate glycosaminoglycans in cancer. Nat. Rev. Cancer 2002, 2, 521–528. [Google Scholar] [CrossRef] [PubMed]
- Beckouche, N.; Bignon, M.; Lelarge, V.; Mathivet, T.; Pichol-Thievend, C.; Berndt, S.; Hardouin, J.; Garand, M.; Ardidie-Robouant, C.; Barret, A.; et al. The interaction of heparan sulfate proteoglycans with endothelial transglutaminase-2 limits VEGF165-induced angiogenesis. Sci. Signal. 2015, 8, ra70. [Google Scholar] [CrossRef]
- Ashikari-Hada, S.; Habuchi, H.; Sugaya, N.; Kobayashi, T.; Kimata, K. Specific inhibition of FGF-2 signaling with 2-O-sulfated octasaccharides of heparan sulfate. Glycobiology 2009, 19, 644–654. [Google Scholar] [CrossRef] [PubMed]
- Dong, Z.; Zhang, A.; Liu, S.; Lu, F.; Guo, Y.; Zhang, G.; Xu, F.; Shi, Y.; Shen, S.; Liang, J.; et al. Aberrant Methylation-Mediated Silencing of lncRNA MEG3 Functions as a ceRNA in Esophageal Cancer. Mol Cancer Res. 2017, 15, 800–810. [Google Scholar] [CrossRef]
- Zheng, Y.; Tu, C.; Zhang, J.; Wang, J. Inhibition of multiple myeloma-derived exosomes uptake suppresses the functional response in bone marrow stromal cell. Int. J. Oncol. 2019, 54, 1061–1070. [Google Scholar] [CrossRef]
- Makrilia, N.; Lappa, T.; Xyla, V.; Nikolaidis, I.; Syrigos, K. The role of angiogenesis in solid tumours: an overview. Eur. J. Intern. Med. 2009, 20, 663–671. [Google Scholar] [CrossRef]
- Micaily, I.; Johnson, J.; Argiris, A. An update on angiogenesis targeting in head and neck squamous cell carcinoma. Cancers Head Neck 2020, 5, 5. [Google Scholar] [CrossRef]
- Zhou, Y.; Zhang, X.; Klibanski, A. MEG3 noncoding RNA: a tumor suppressor. J. Mol. Endocrinol. 2012, 48, R45–53. [Google Scholar] [CrossRef]
- He, Y.; Luo, Y.; Liang, B.; Ye, L.; Lu, G.; He, W. Potential applications of MEG3 in cancer diagnosis and prognosis. Oncotarget 2017, 8, 73282–73295. [Google Scholar] [CrossRef] [PubMed]
- Deng, D.; Liang, H. Silencing MEG3 protects PC12 cells from hypoxic injury by targeting miR-21. Artif. Cells Nanomed. Biotechnol. 2020, 48, 610–619. [Google Scholar] [CrossRef]
- Zhang, S.; Ji, W.W.; Wei, W.; Zhan, L.X.; Huang, X. Long noncoding RNA Meg3 sponges miR-708 to inhibit intestinal tumorigenesis via SOCS3-repressed cancer stem cells growth. Cell Death Dis. 2021, 13, 25. [Google Scholar] [CrossRef]
- Ji, Y.; Feng, G.; Hou, Y.; Yu, Y.; Wang, R.; Yuan, H. Long noncoding RNA MEG3 decreases the growth of head and neck squamous cell carcinoma by regulating the expression of miR-421 and E-cadherin. Cancer Med. 2020, 9, 3954–3963. [Google Scholar] [CrossRef] [PubMed]
- Ye, W.; Ni, Z.; Yicheng, S.; Pan, H.; Huang, Y.; Xiong, Y.; Liu, T. Anisomycin inhibits angiogenesis in ovarian cancer by attenuating the molecular sponge effect of the lncRNA-Meg3/miR-421/PDGFRA axis. Int. J. Oncol. 2019, 55, 1296–1312. [Google Scholar] [CrossRef]
- Rezaie, J.; Feghhi, M.; Etemadi, T. A review on exosomes application in clinical trials: perspective, questions, and challenges. Cell. Commun. Signal. 2022, 20, 145. [Google Scholar] [CrossRef] [PubMed]
- Zhang, Y.; Bi, J.; Huang, J.; Tang, Y.; Du, S.; Li, P. Exosome: A Review of Its Classification, Isolation Techniques, Storage, Diagnostic and Targeted Therapy Applications. Int. J. Nanomedicine 2020, 15, 6917–6934. [Google Scholar] [CrossRef]
- Zhang, Y.; Chen, C.; Liu, Z.; Guo, H.; Lu, W.; Hu, W.; Lin, Z. PABPC1-induced stabilization of IFI27 mRNA promotes angiogenesis and malignant progression in esophageal squamous cell carcinoma through exosomal miRNA-21-5p. J. Exp. Clin. Cancer Res. 2022, 41, 111. [Google Scholar] [CrossRef]
- Catalano, M.; O’Driscoll, L. Inhibiting extracellular vesicles formation and release: a review of EV inhibitors. J. Extracell. Vesicles 2020, 9, 1703244. [Google Scholar] [CrossRef] [PubMed]
- Kim, J.H.; Lee, C.H.; Baek, M.C. Dissecting exosome inhibitors: therapeutic insights into small-molecule chemicals against cancer. Exp. Mol. Med. 2022, 54, 1833–1843. [Google Scholar] [CrossRef] [PubMed]
- Escudier, B.; Dorval, T.; Chaput, N.; Andre, F.; Caby, M.P.; Novault, S.; Flament, C.; Leboulaire, C.; Borg, C.; Amigorena, S.; et al. Vaccination of metastatic melanoma patients with autologous dendritic cell (DC) derived-exosomes: results of thefirst phase I clinical trial. J. Transl. Med. 2005, 3, 10. [Google Scholar] [CrossRef] [PubMed]
- Wang, M.; Yu, F.; Ding, H.; Wang, Y.; Li, P.; Wang, K. Emerging Function and Clinical Values of Exosomal MicroRNAs in Cancer. Mol. Ther. Nucleic Acids 2019, 16, 791–804. [Google Scholar] [CrossRef]
- Teixeira, F.; Vijaya Kumar, A.; Kumar Katakam, S.; Cocola, C.; Pelucchi, P.; Graf, M.; Kiesel, L.; Reinbold, R.; Pavao, M.S.G.; Greve, B.; et al. The Heparan Sulfate Sulfotransferases HS2ST1 and HS3ST2 Are Novel Regulators of Breast Cancer Stem-Cell Properties. Front. Cell Dev. Biol. 2020, 8, 559554. [Google Scholar] [CrossRef]
Figure 1.
Exosomal miR-421 derived from OSCC cells promotes HUVEC migration, invasion and tube formation. (A-C) Exosome isolated from normal oral keratinocyte (OKF4/hTERT) or OSCC cells (OEC-M1 and TW2.6) was incubated with HUVEC cells for migration assay (A), invasion assay (B), and tube formation assay (C). (D) Heat map of differential expressed exosomal miRNAs. Two biological replicates (for OKF4/hTERT) and three biological replicates (for OEC-M1 and TW2.6) were used for Affymetrix miRNA array. (E) Venn diagram of 12 differentially expressed miRNAs based on the intersection of OSCC-derived exosomal miRNAs with OSCC patient miRNA database (GSE37991). (F) Tube formation assay of HUVECs treated with 12 differentially expressed miRNA mimics. (G) Transwell migration and invasion assay of HUVEC cells treated with miR-421 mimics (PM421). (H) Relative expression level of miR-421 in exosomes isolated from miR-421 (PM421) or scramble control (SC)-transfected OEC-M1 cells using quantitative-RT-PCR (left). Exosome isolated from miR-421 (PM421) or scramble control (SC)-transfected OEC-M1 cells was incubated with HUVEC cells for migration, invasion, and tube formation assay (middle and right). Data are represented as mean ± SD; *p < 0.05; **p < 0.01; ***p < 0.001.
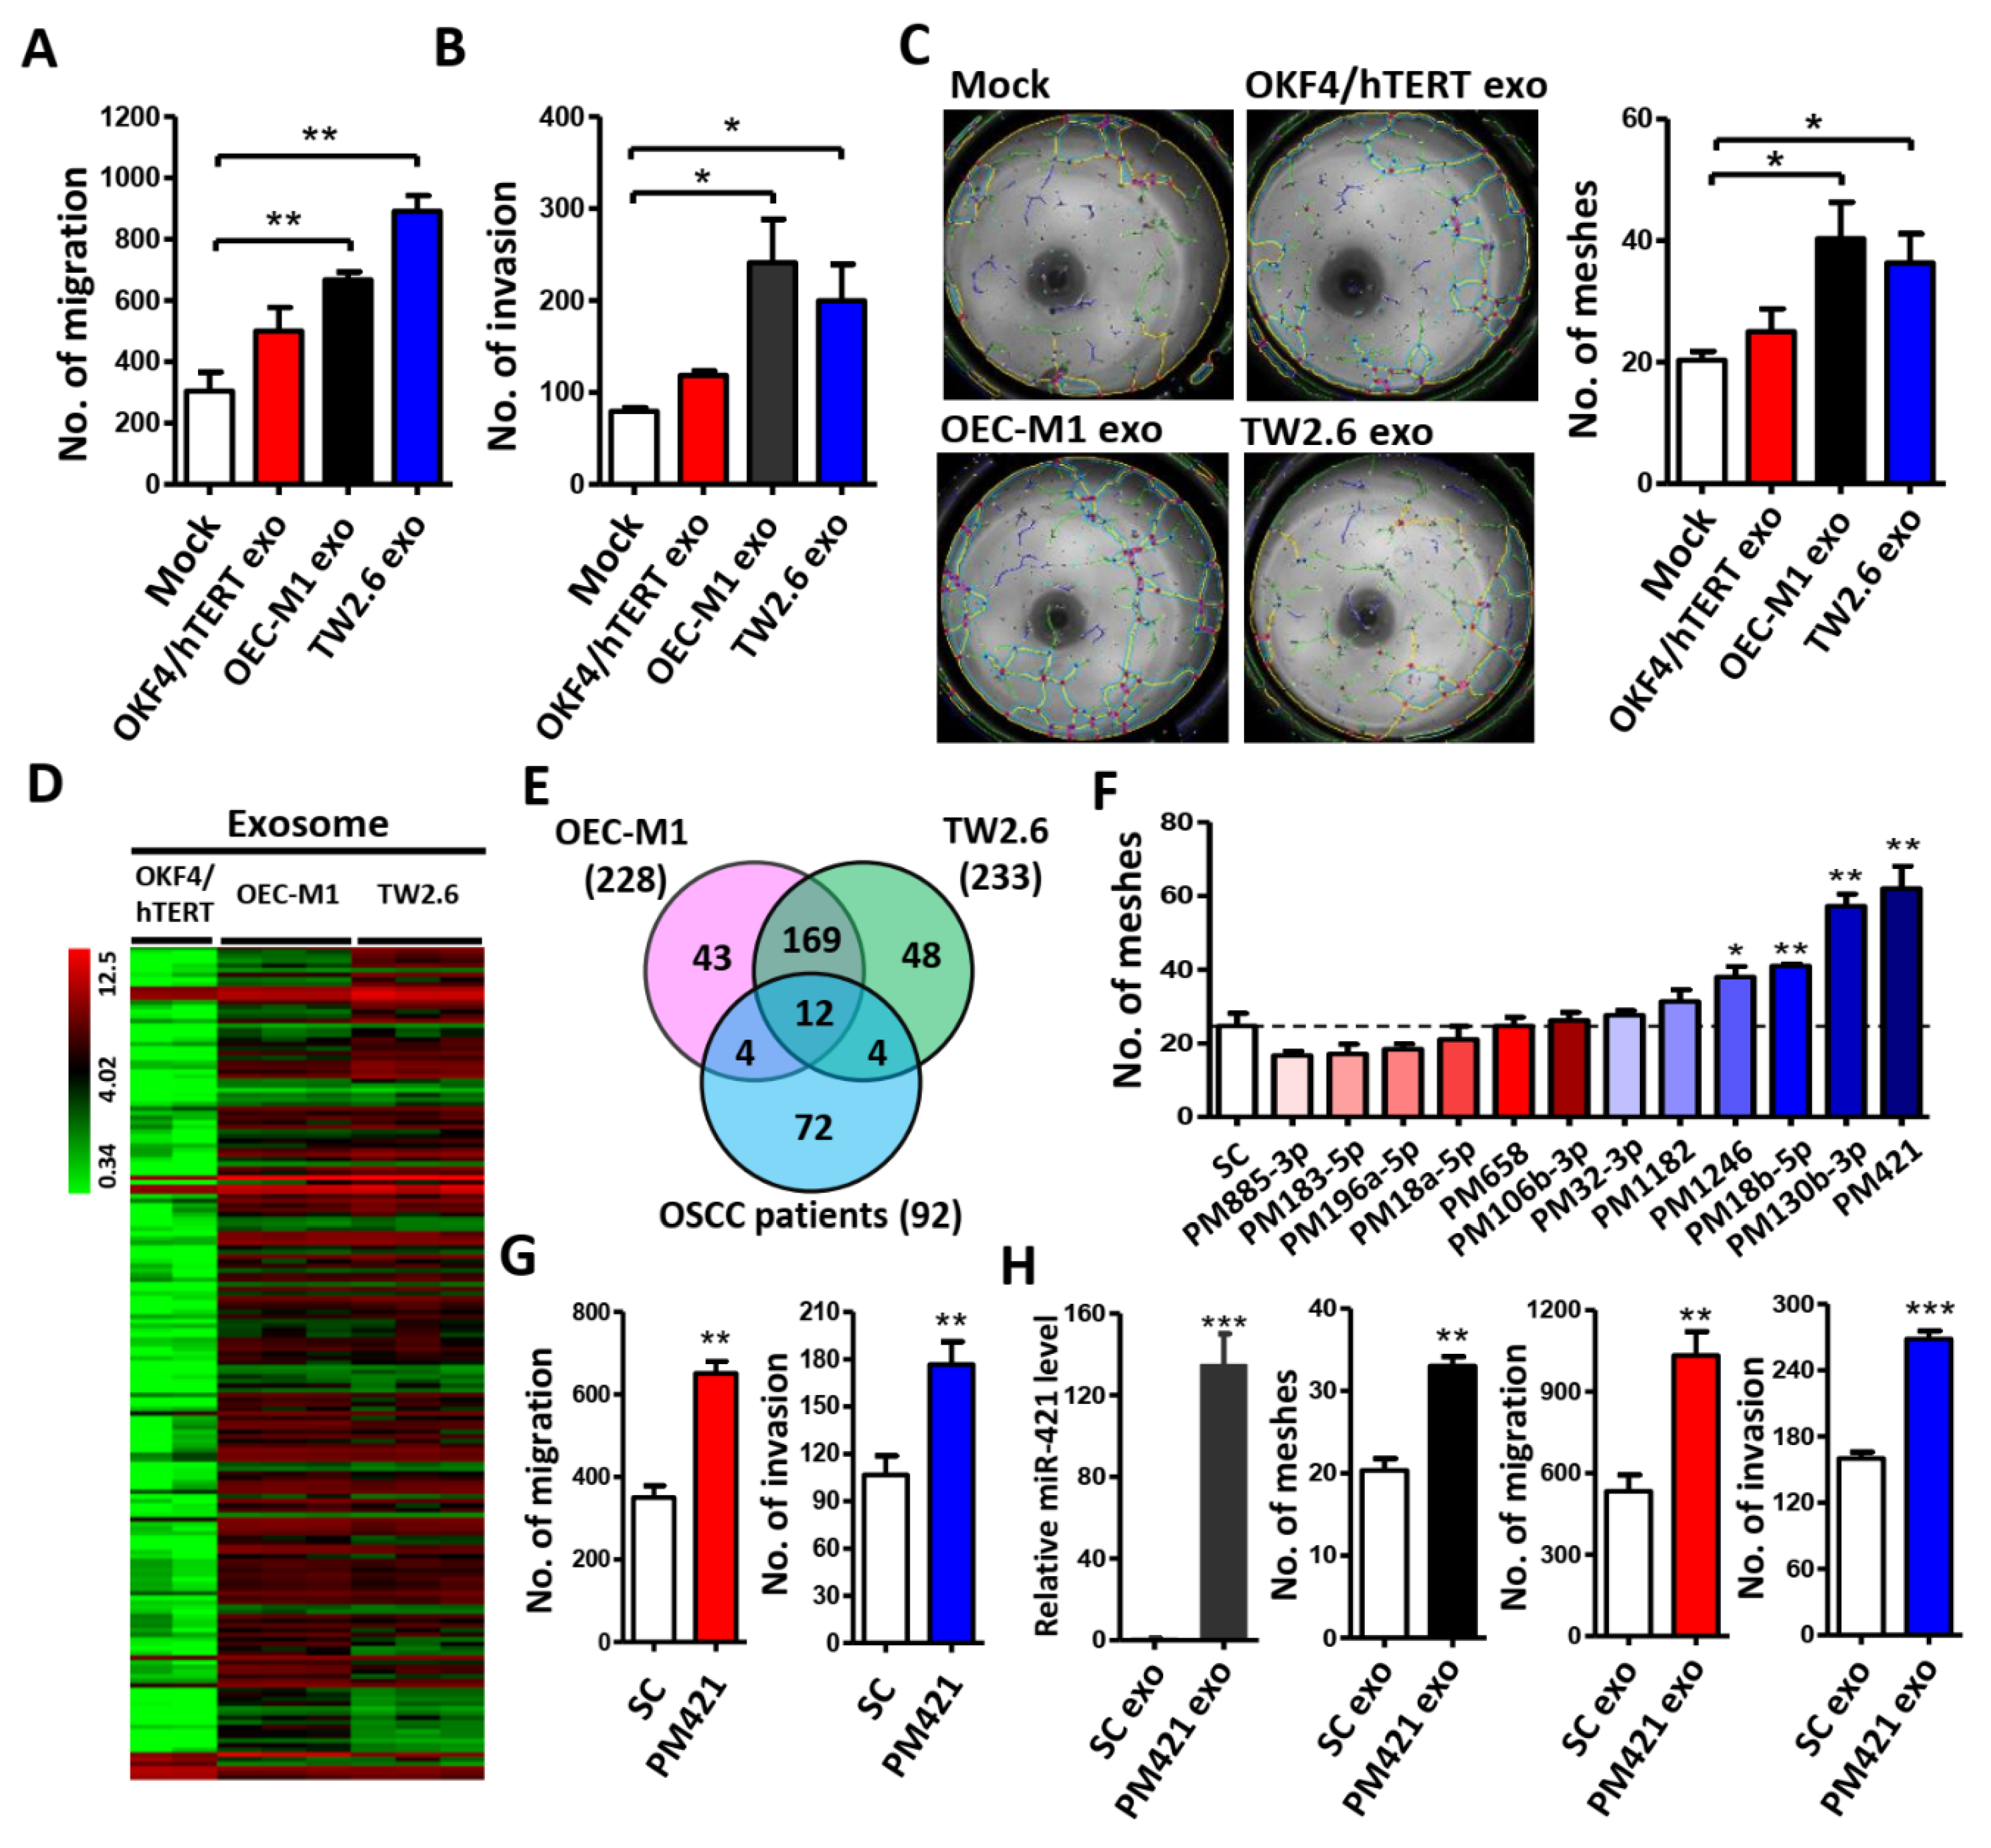
Figure 2.
miR-421 induces neovascularization in vivo. (A) Image of Matrigel plugs from mice for 12 days after injection of Matrigel mixed with scrambled control (SC) or miR-421 mimic (PM421)(upper). Hemoglobin concentration of plugs was determined and used as angiogenesis index (lower). (B) Representative images of IHC staining for H&E and CD31 from Matrigel plugs. Selective case number was showed from (A) (scale bar: 100 μm). Arrowheads show the location of microvascular structures with CD31 positive staining. (C) Clinical expression profile of miR-421 in Taiwanese OSCC cohort (GSE37991, left) and TCGA cohort (GDC Head and Neck Cancer, right).(D) Kaplan–Meier analysis of overall survival according to miR-421 expression from 239 OSCC patients in TCGA’s cohort (GDC Head and Neck Cancer). Data are represented as mean ± SD; *p < 0.05; ***p < 0.001.
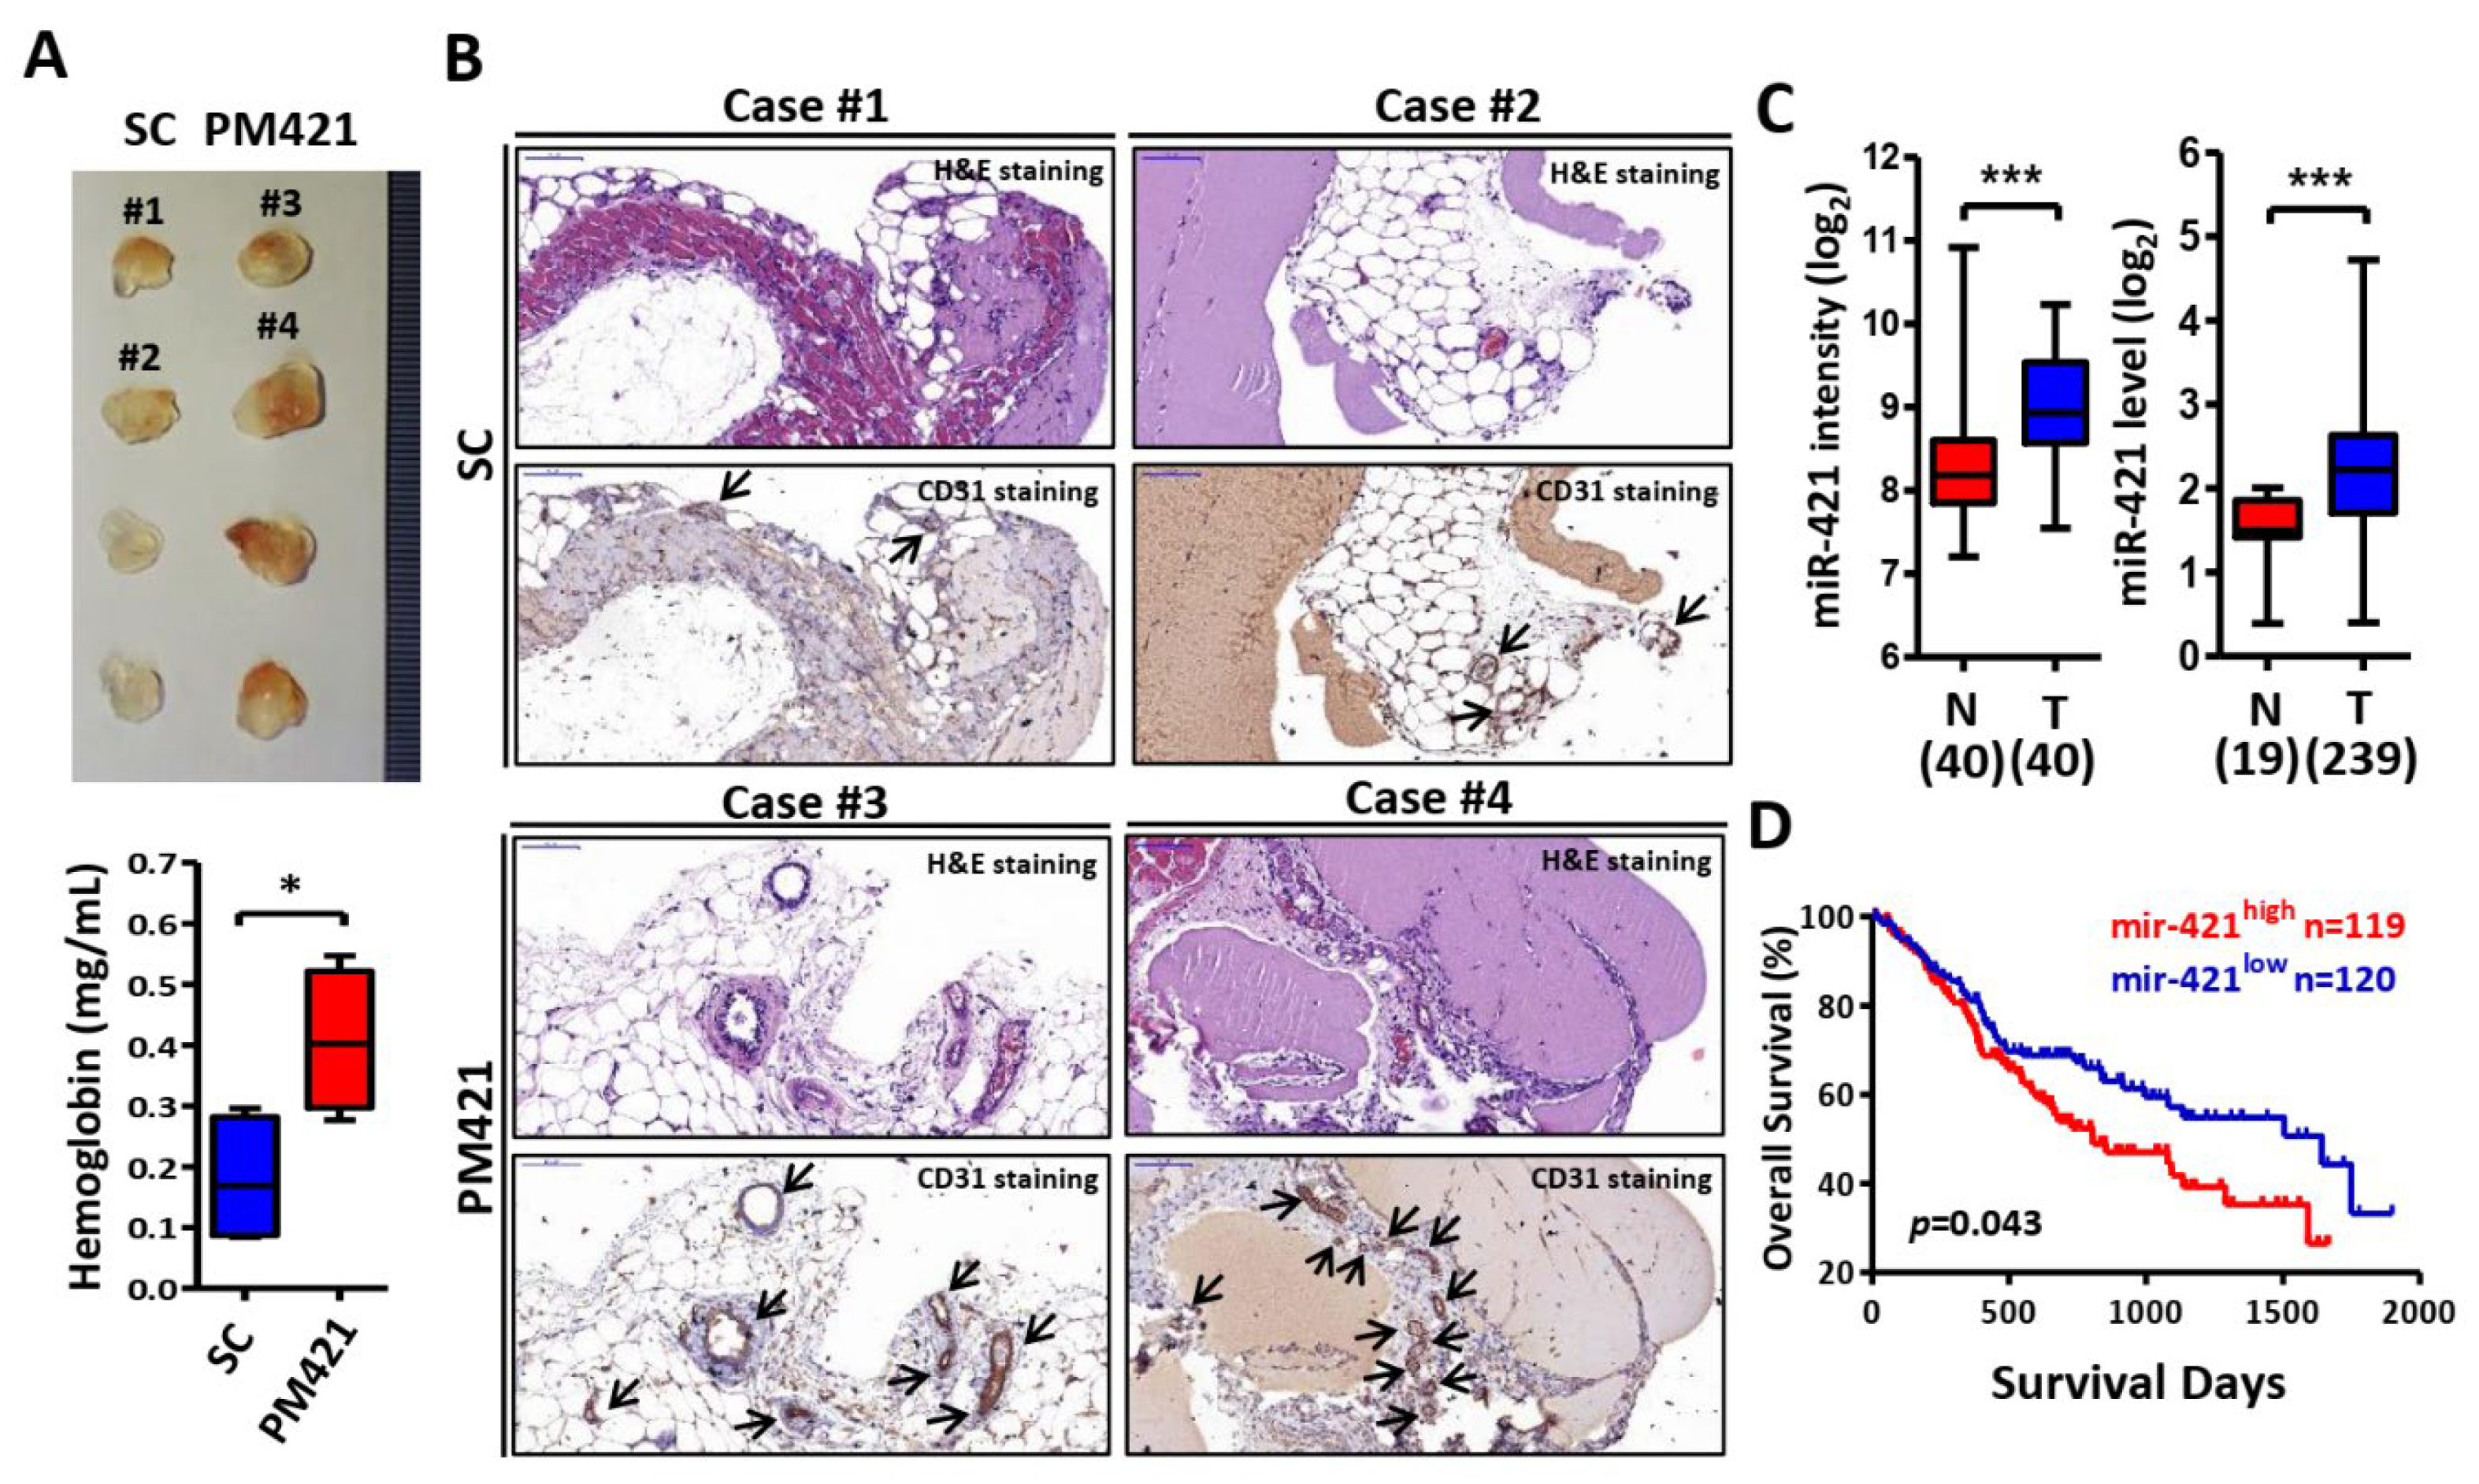
Figure 3.
HS2ST1 is a target of miR-421 in HUVECs. (A) A heatmap of 371 differentially expressed genes was obtained in HUVECs transfected with miR-421 (PM421, 20 nM) compared to control cells (SC) with three biological replicates using Affymetrix microarrays (ClariomTM S Assay). (B) Venn diagram of 27 miR-421-targeted genes based on the intersection of Affymetrix microarray with miRWalk database. (C) Heatmap of 27 miR-421-targeted genes. (D) Validation of the expression level of 27 genes in miR-421-transfected HUVEC cells using quantitative real time-PCR. (E) Schematic representation of the putative miR-421 binding sequence in the 3’-UTR of HS2ST1 with wild-type form (HS2ST1 3’-UTR WT) and deleted form (HS2ST1 3’-UTR Mut). The matched nucleotides are labeled with green and red color. (F) The effect of miR-421 (PM421, 20 nM) on the luciferase activities of the constructs containing the wild-type or mutant-type 3’-UTR in HUVEC cells. (G) Western blot analysis of HS2ST1 in HUVEC cells following miR-421 (PM4421, 20 nM) or scramble control (SC) transfection for 48 h. GAPDH was used as an internal control. (H) Western blot analysis of HS2ST1 protein in HUVEC cells following transfection of si-HS2ST1 (si-HS2ST1 #1 and #2) or si-non-targeting control (si-NT) for 48 h. (I-J) Tube formation assay of HUVECs treated with the indicated transfection. Data are represented as mean ± SD; **p < 0.01; ***p < 0.001.
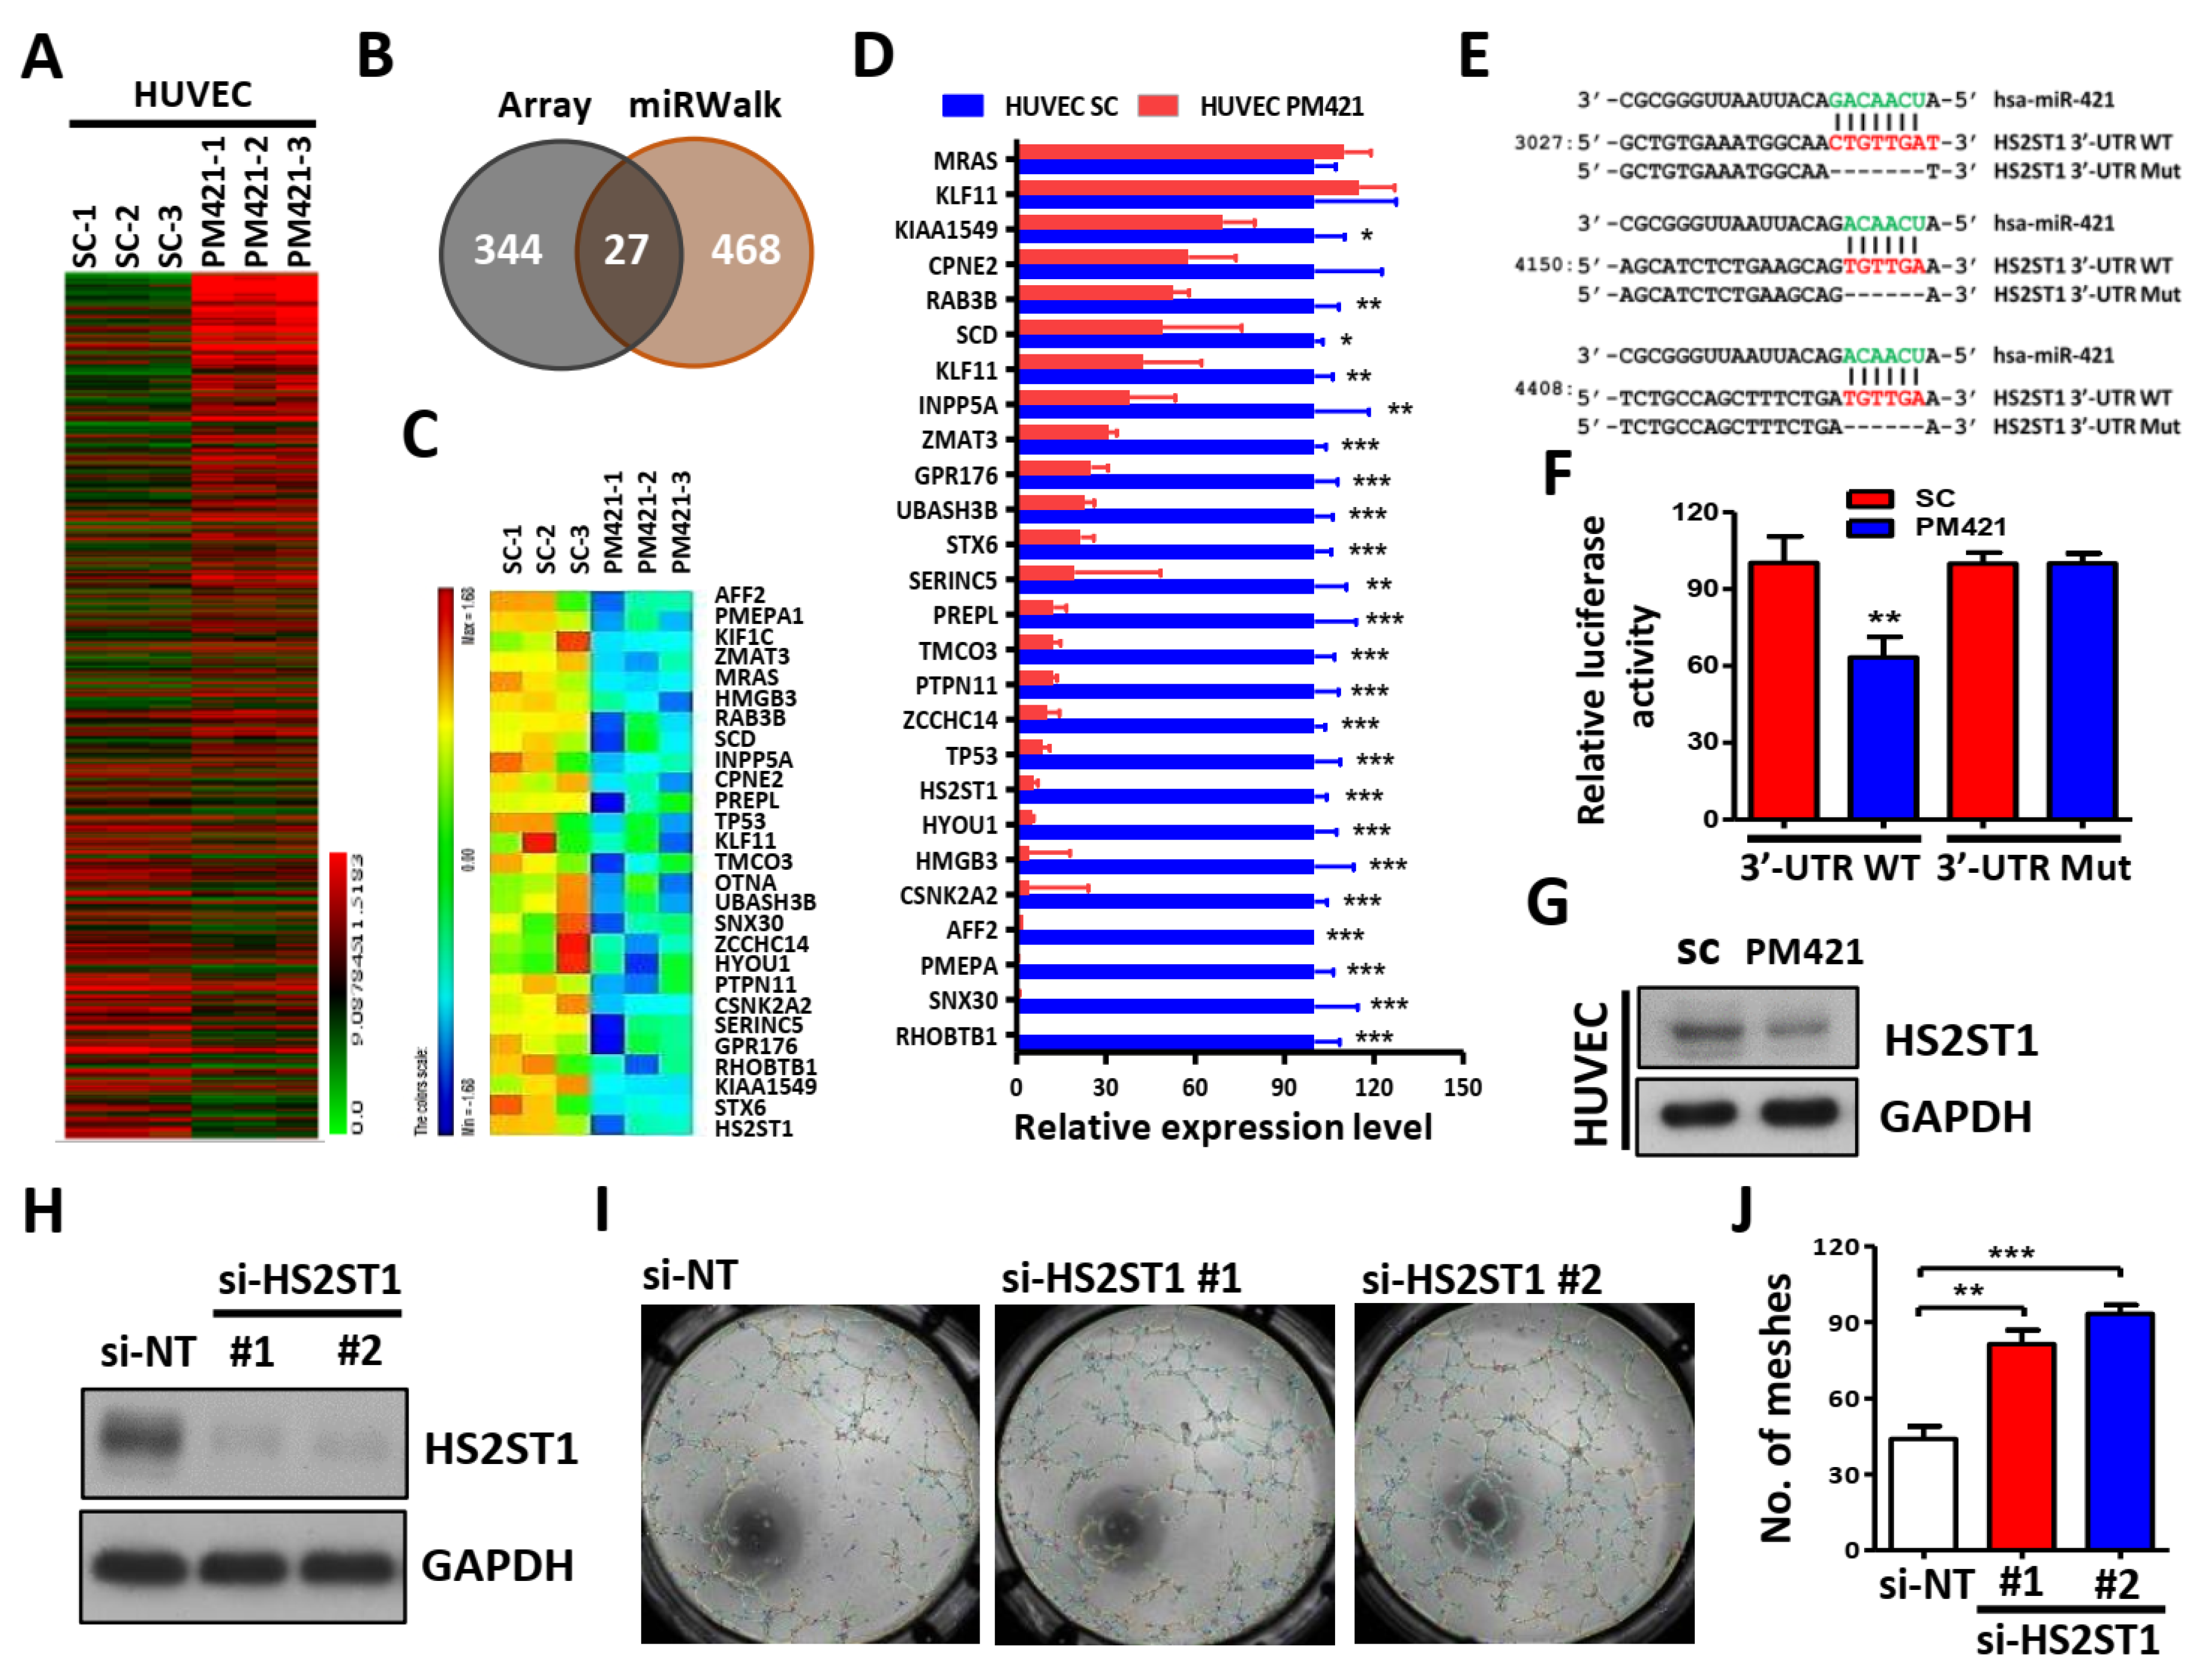
Figure 4.
HS2ST1 blocks VEGF-induced tube formation. (A) Western blot analysis of ERK, phosphor-ERK (p-ERK), AKT, phosphor-AKT (p-AKT) after transfecting the si-HS2ST1 (si-HS2ST1 #1 and #2) or si-non-targeting control (si-NT) for 48 h. GAPDH was used as an internal control. (B) Transwell migration and invasion assay of HUVEC cells following transfection of siRNA for 24h. (C) Tube formation assay of HUVEC cells after transfection with HS2ST1 expression vector or control vector (Vec). Western blot analysis showed the HS2ST1 protein level (right upper). Mean number of meshes was statistically analyzed (right bottom). (D) Transwell migration and invasion assay of HUVEC cells following transfection of HS2ST1 expression vector or control vector (Vec) for 24h. (E-H) Western blot analysis of ERK, phosphor-ERK (p-ERK), AKT, phosphor-AKT (p-AKT), HS2ST1, VEGFR2, phosphor-VEGFR2 (p-VEGFR2), N-Cadherin, snall, slug, and VE-Cadherin in HUVEC cells treated with the indicated treatment and transfection. GAPDH was used as an internal control. Data are represented as mean ± SD; *p < 0.05; **p < 0.01.
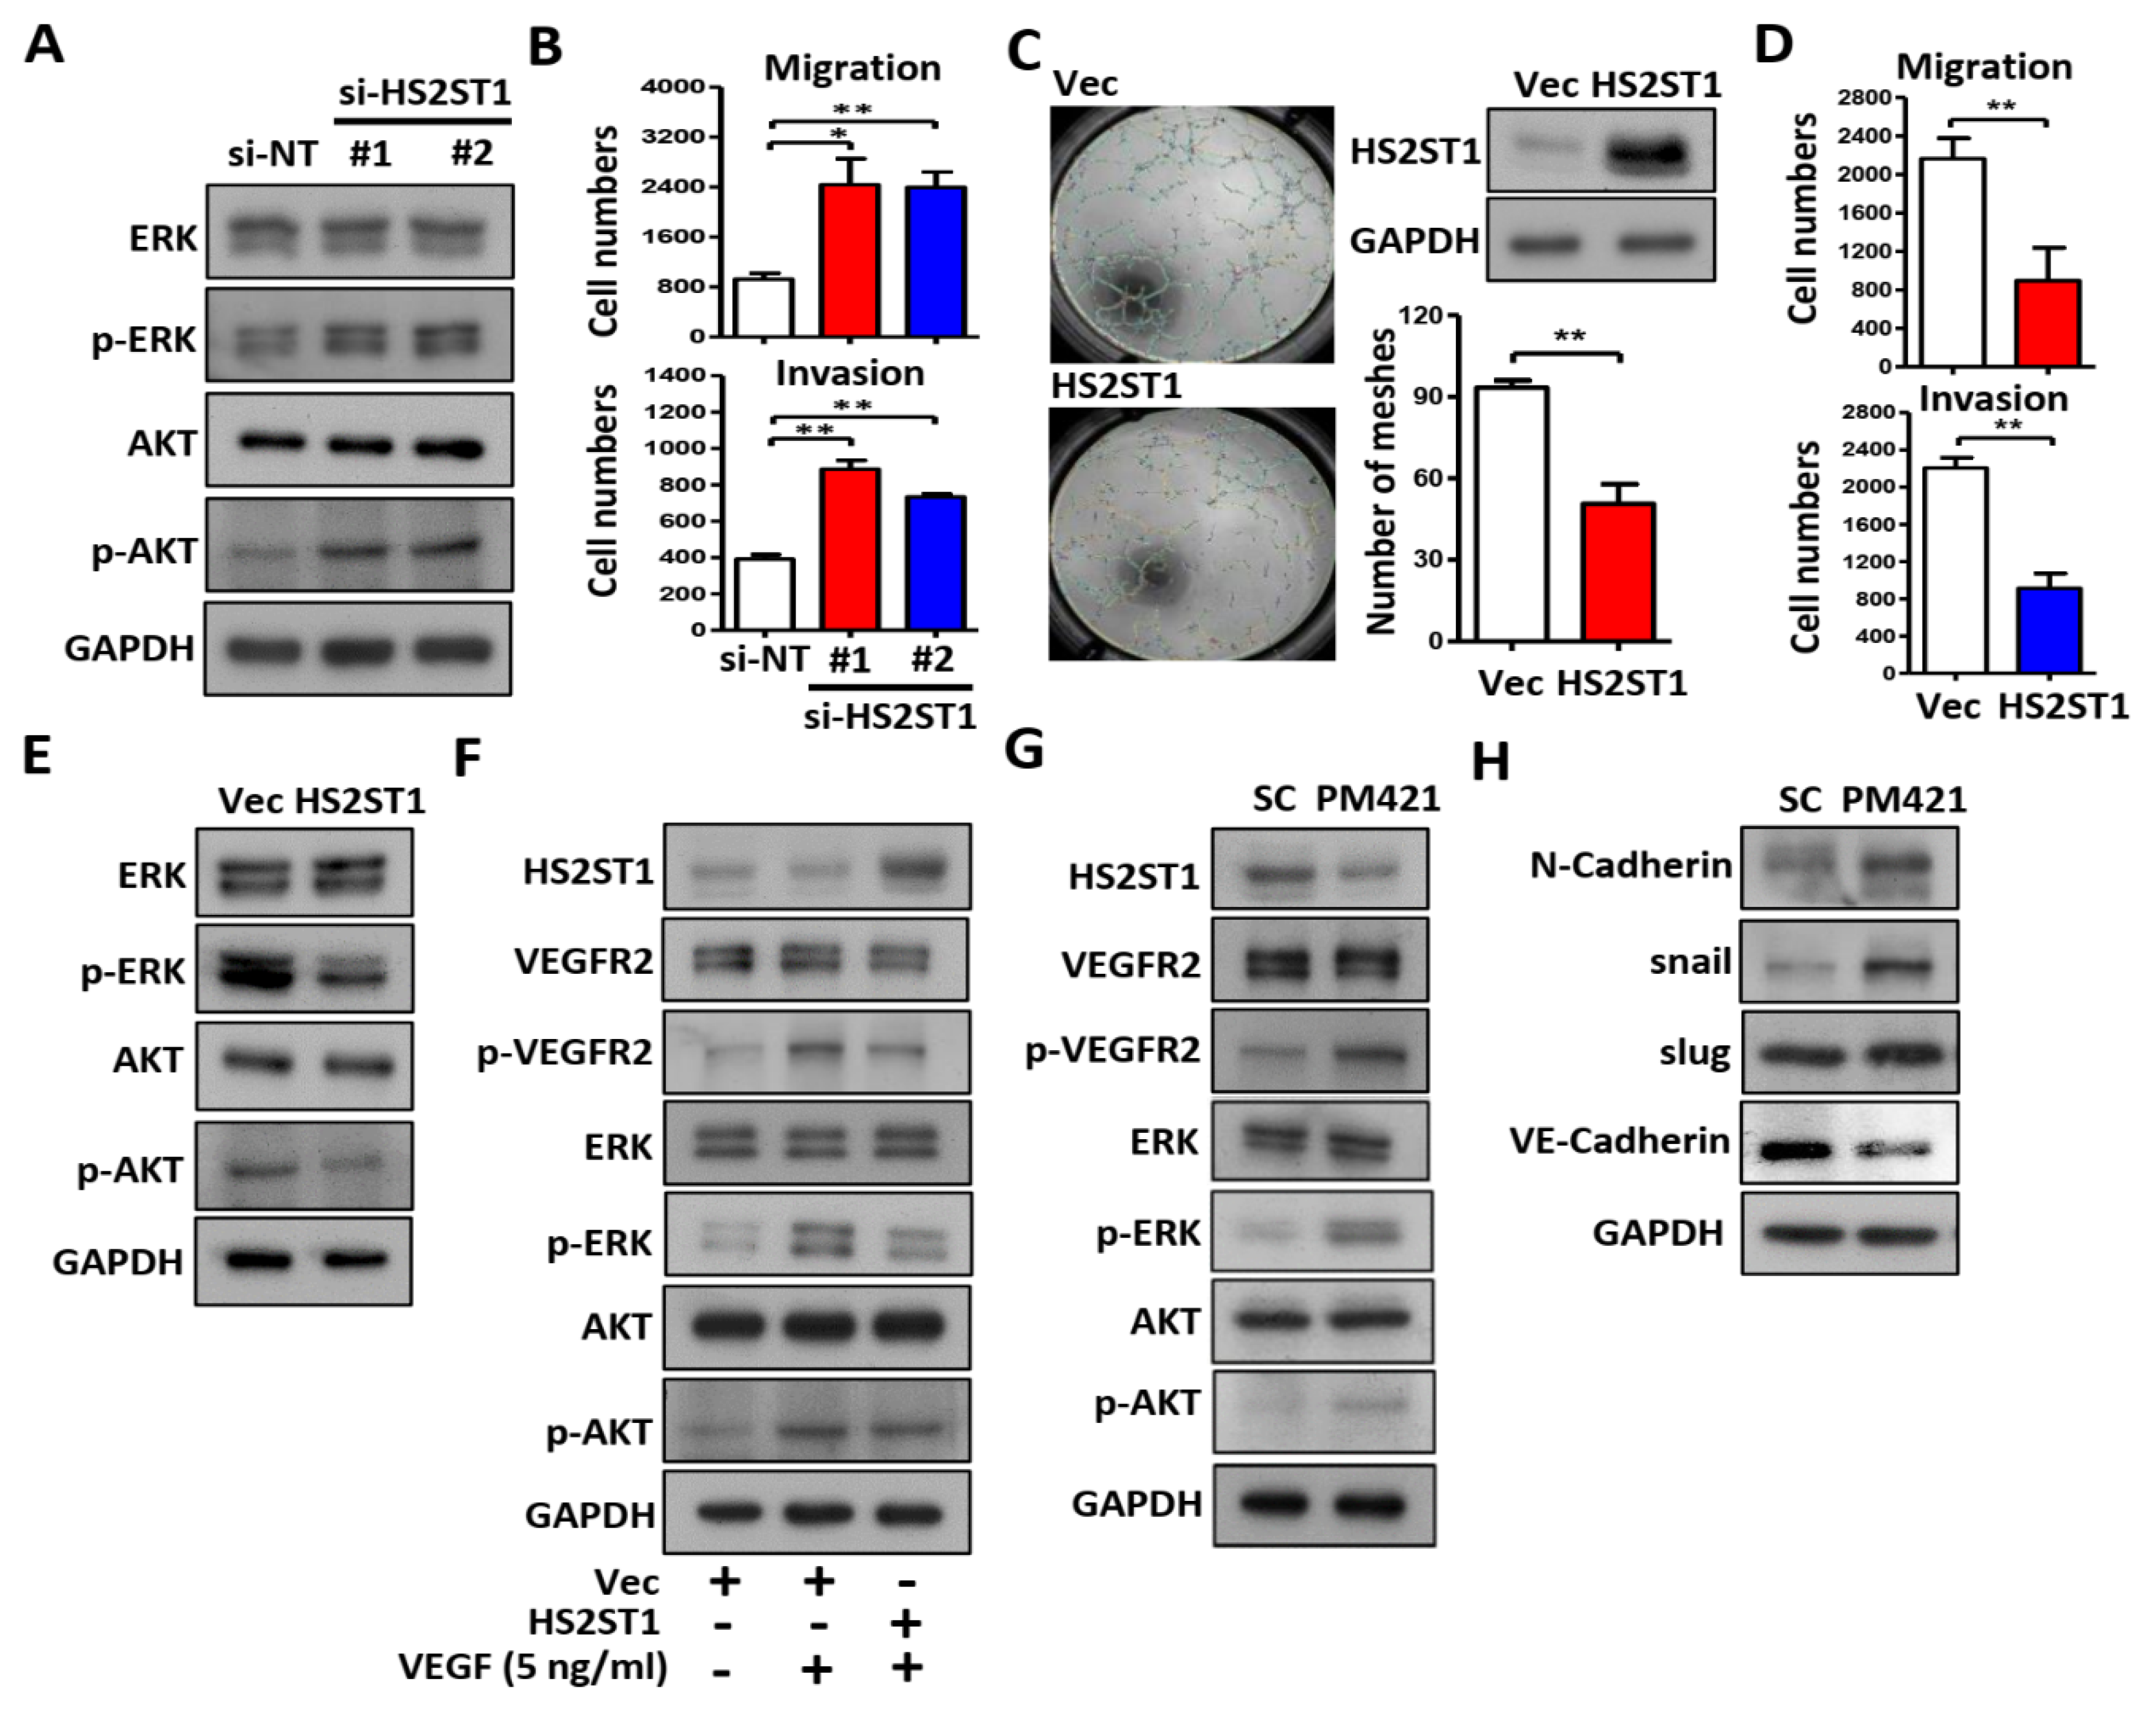
Figure 5.
Exosomal miR-421 promotes tube formation by targeting HS2ST1in HUVEC cells. (A and D) Images of tube formation assay of HUVECs treated with the indicated transfection. (B and E) Transwell migration, invasion and tube formation assay of HUVECs treated with the indicated transfection. Data are represented as mean ± SD; *p < 0.05; **p < 0.01; ***p < 0.001. (C and F) Western blot analysis of HS2ST1, VEGFR2, phosphor-VEGFR2 (p-VEGFR2), ERK, phosphor-ERK (p-ERK), AKT and phosphor-AKT (p-AKT) in HUVEC cells treated with the indicated transfection. GAPDH was used as an internal control.
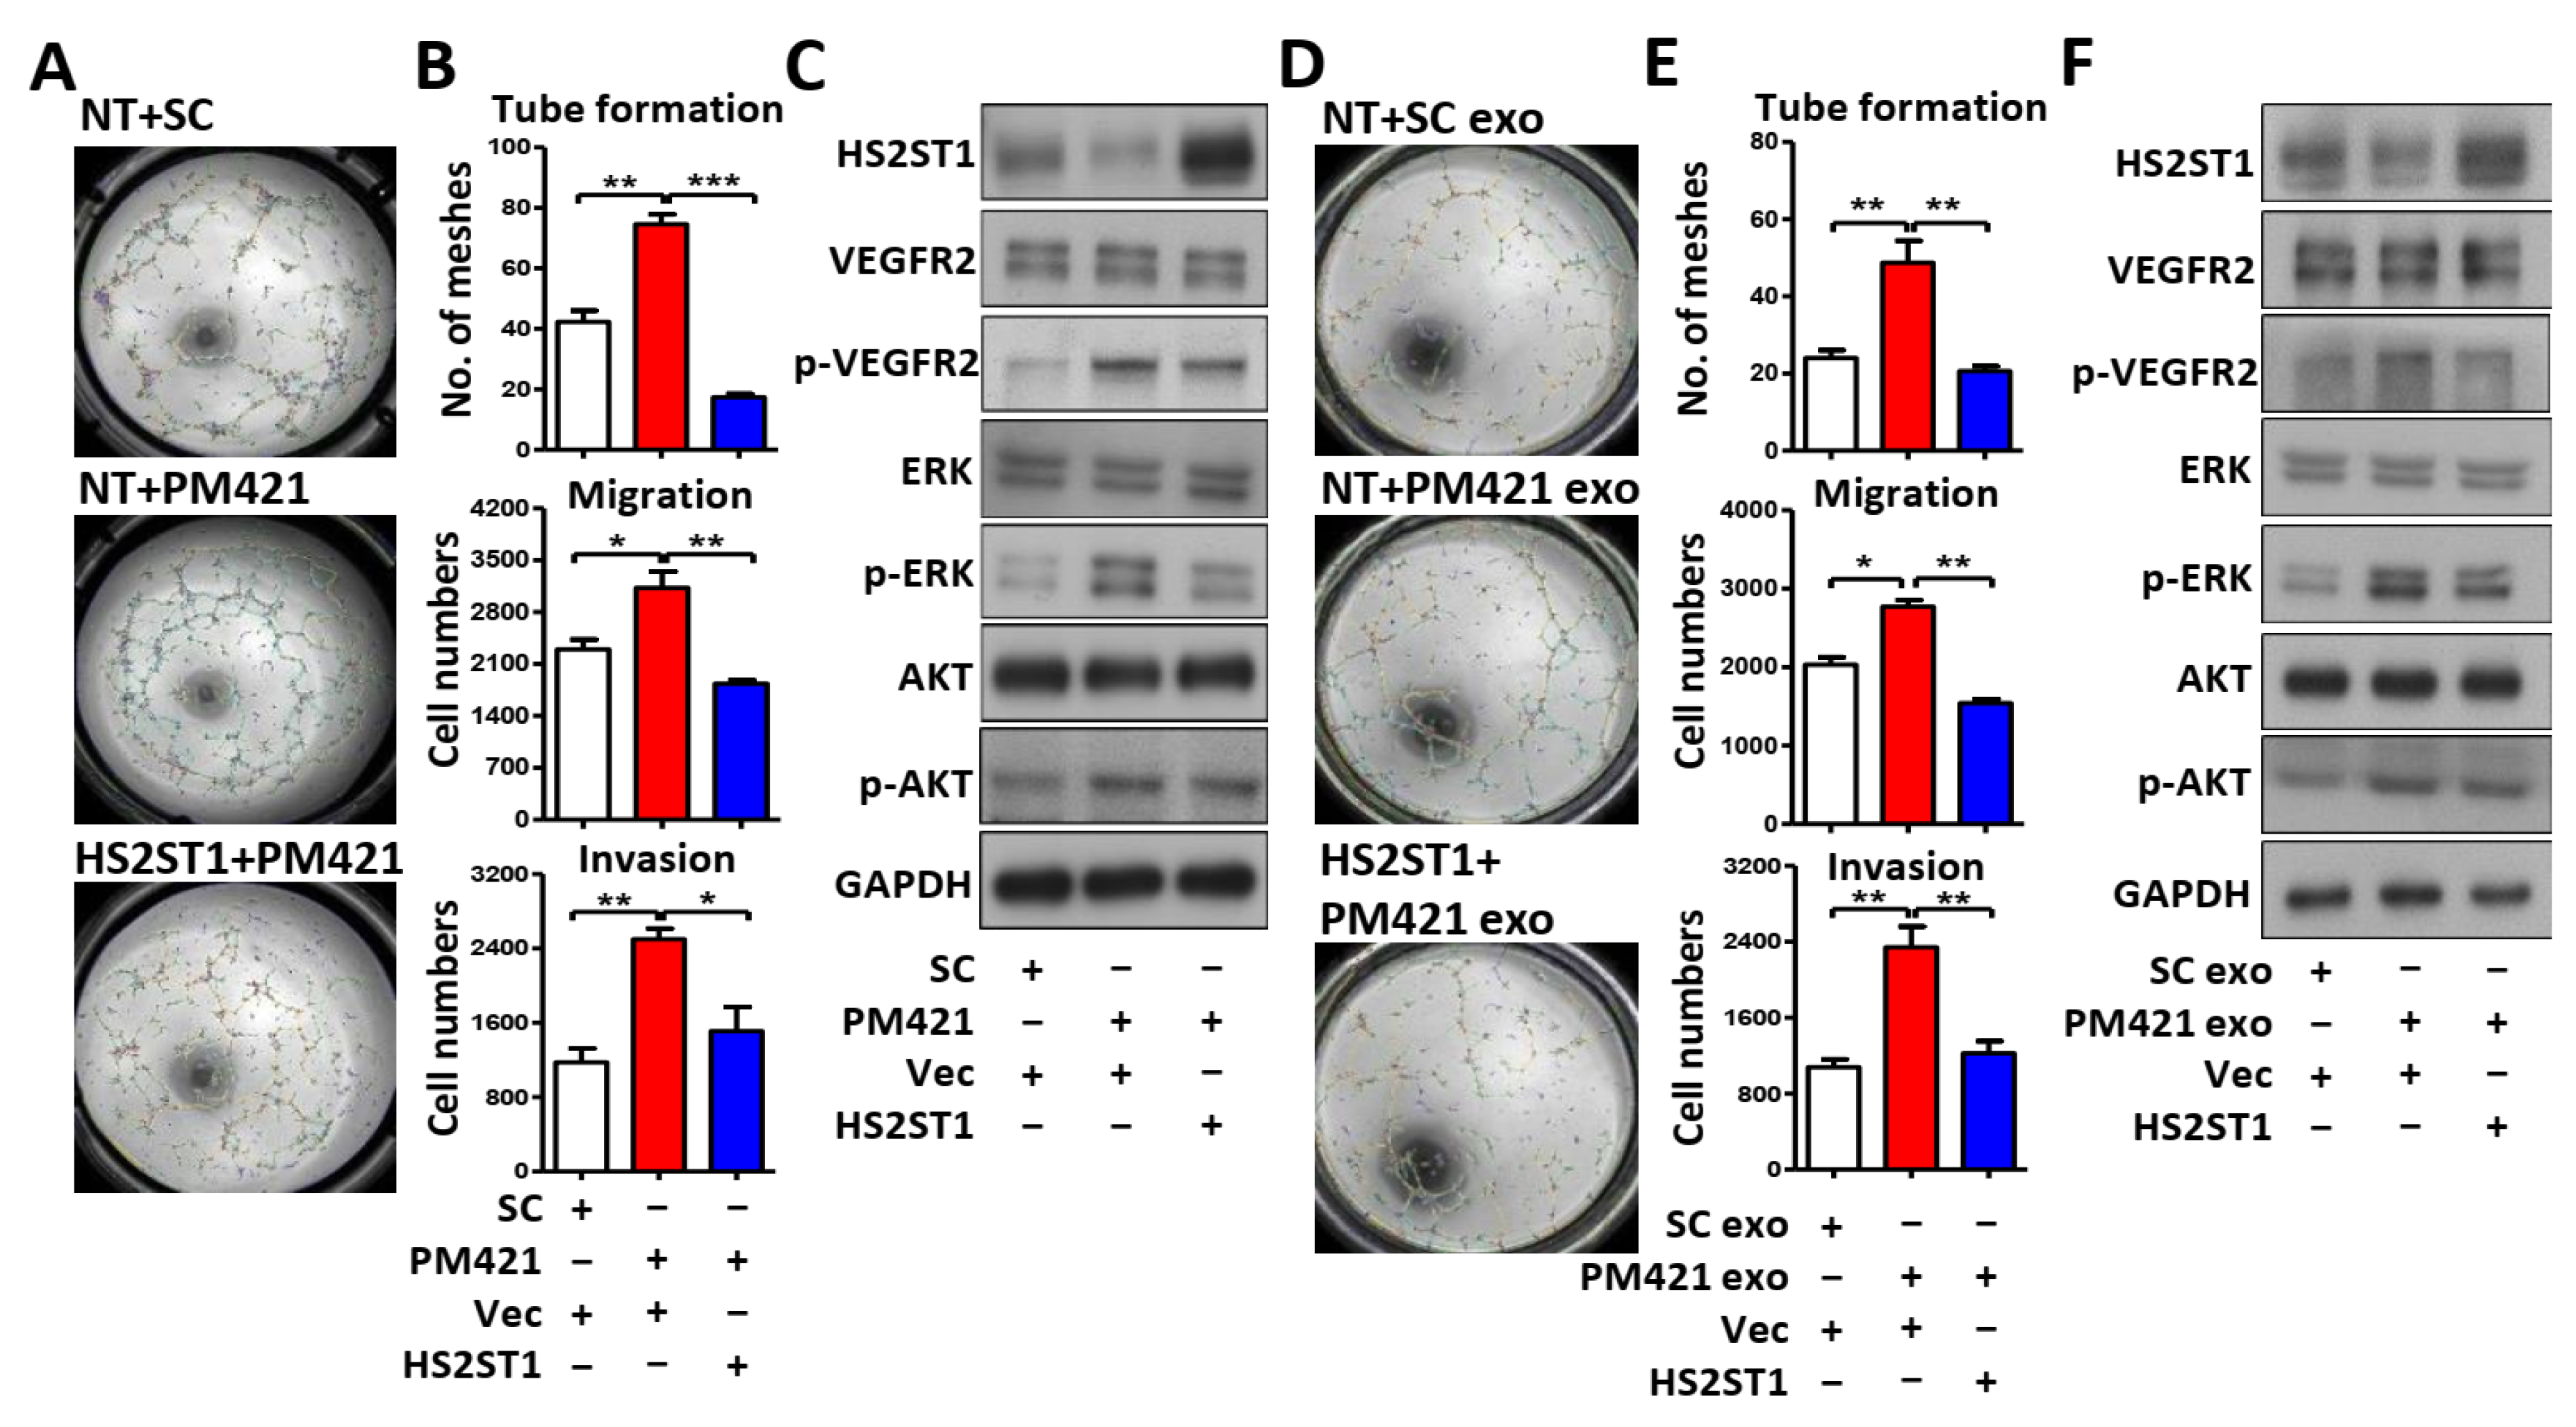
Figure 6.
LncRNA MEG3 inhibits tube formation via targeting miR-421. (A) Following MS2 RNA-immunoprecipitation in OEC-M1 cells, RNA was extracted by Trizol-chloroform and precipitated by isopropanol plus glycogen at -20 oC. The level of miR-421 was measure by qRT-PCR in pCDH-MEG3-MS2 group (MEG3) compared with pCDH-MS2 control vector group (Vec). (B) Upper, schematic representation of the putative miR-421 binding sequence in the LncRNA MEG3 with wild-type form (MEG3 WT) and mutant form (MEG3 Mut). The matched nucleotides are labeled with green and red color. The mutant nucleotides are labeled with blue color. Lower, the effect of miR-421 (PM421, 20 nM) on the luciferase activities of the constructs containing the wild-type or mutant-type MEG3 in OEC-M1 cells. (C & D) Relative expression of MEG3 and miR-421 in OEC-M1 and TW2.6 cells after transfection of MEG3 expression vector or control vector (Vec). (E-G) Relative miR-421 levels, western blot analysis and tube formation assay in HUVECs after incubation with exosomes derived from OEC-M1 and TW2.6 cells which were transfected with MEG3 expression vector or control vector (Vec). (H) MEG3 or miR-421 expression level by qRT-PCR in 40 of OSCC tumors (T) compared with their own adjacent normal tissues (N). Expression levels are expressed as the log2 ratios. (I) Correlation analysis of miR-421 and MEG3 in human OSCC patients. Data are represented as mean ± SD; **p < 0.01; ***p < 0.001.
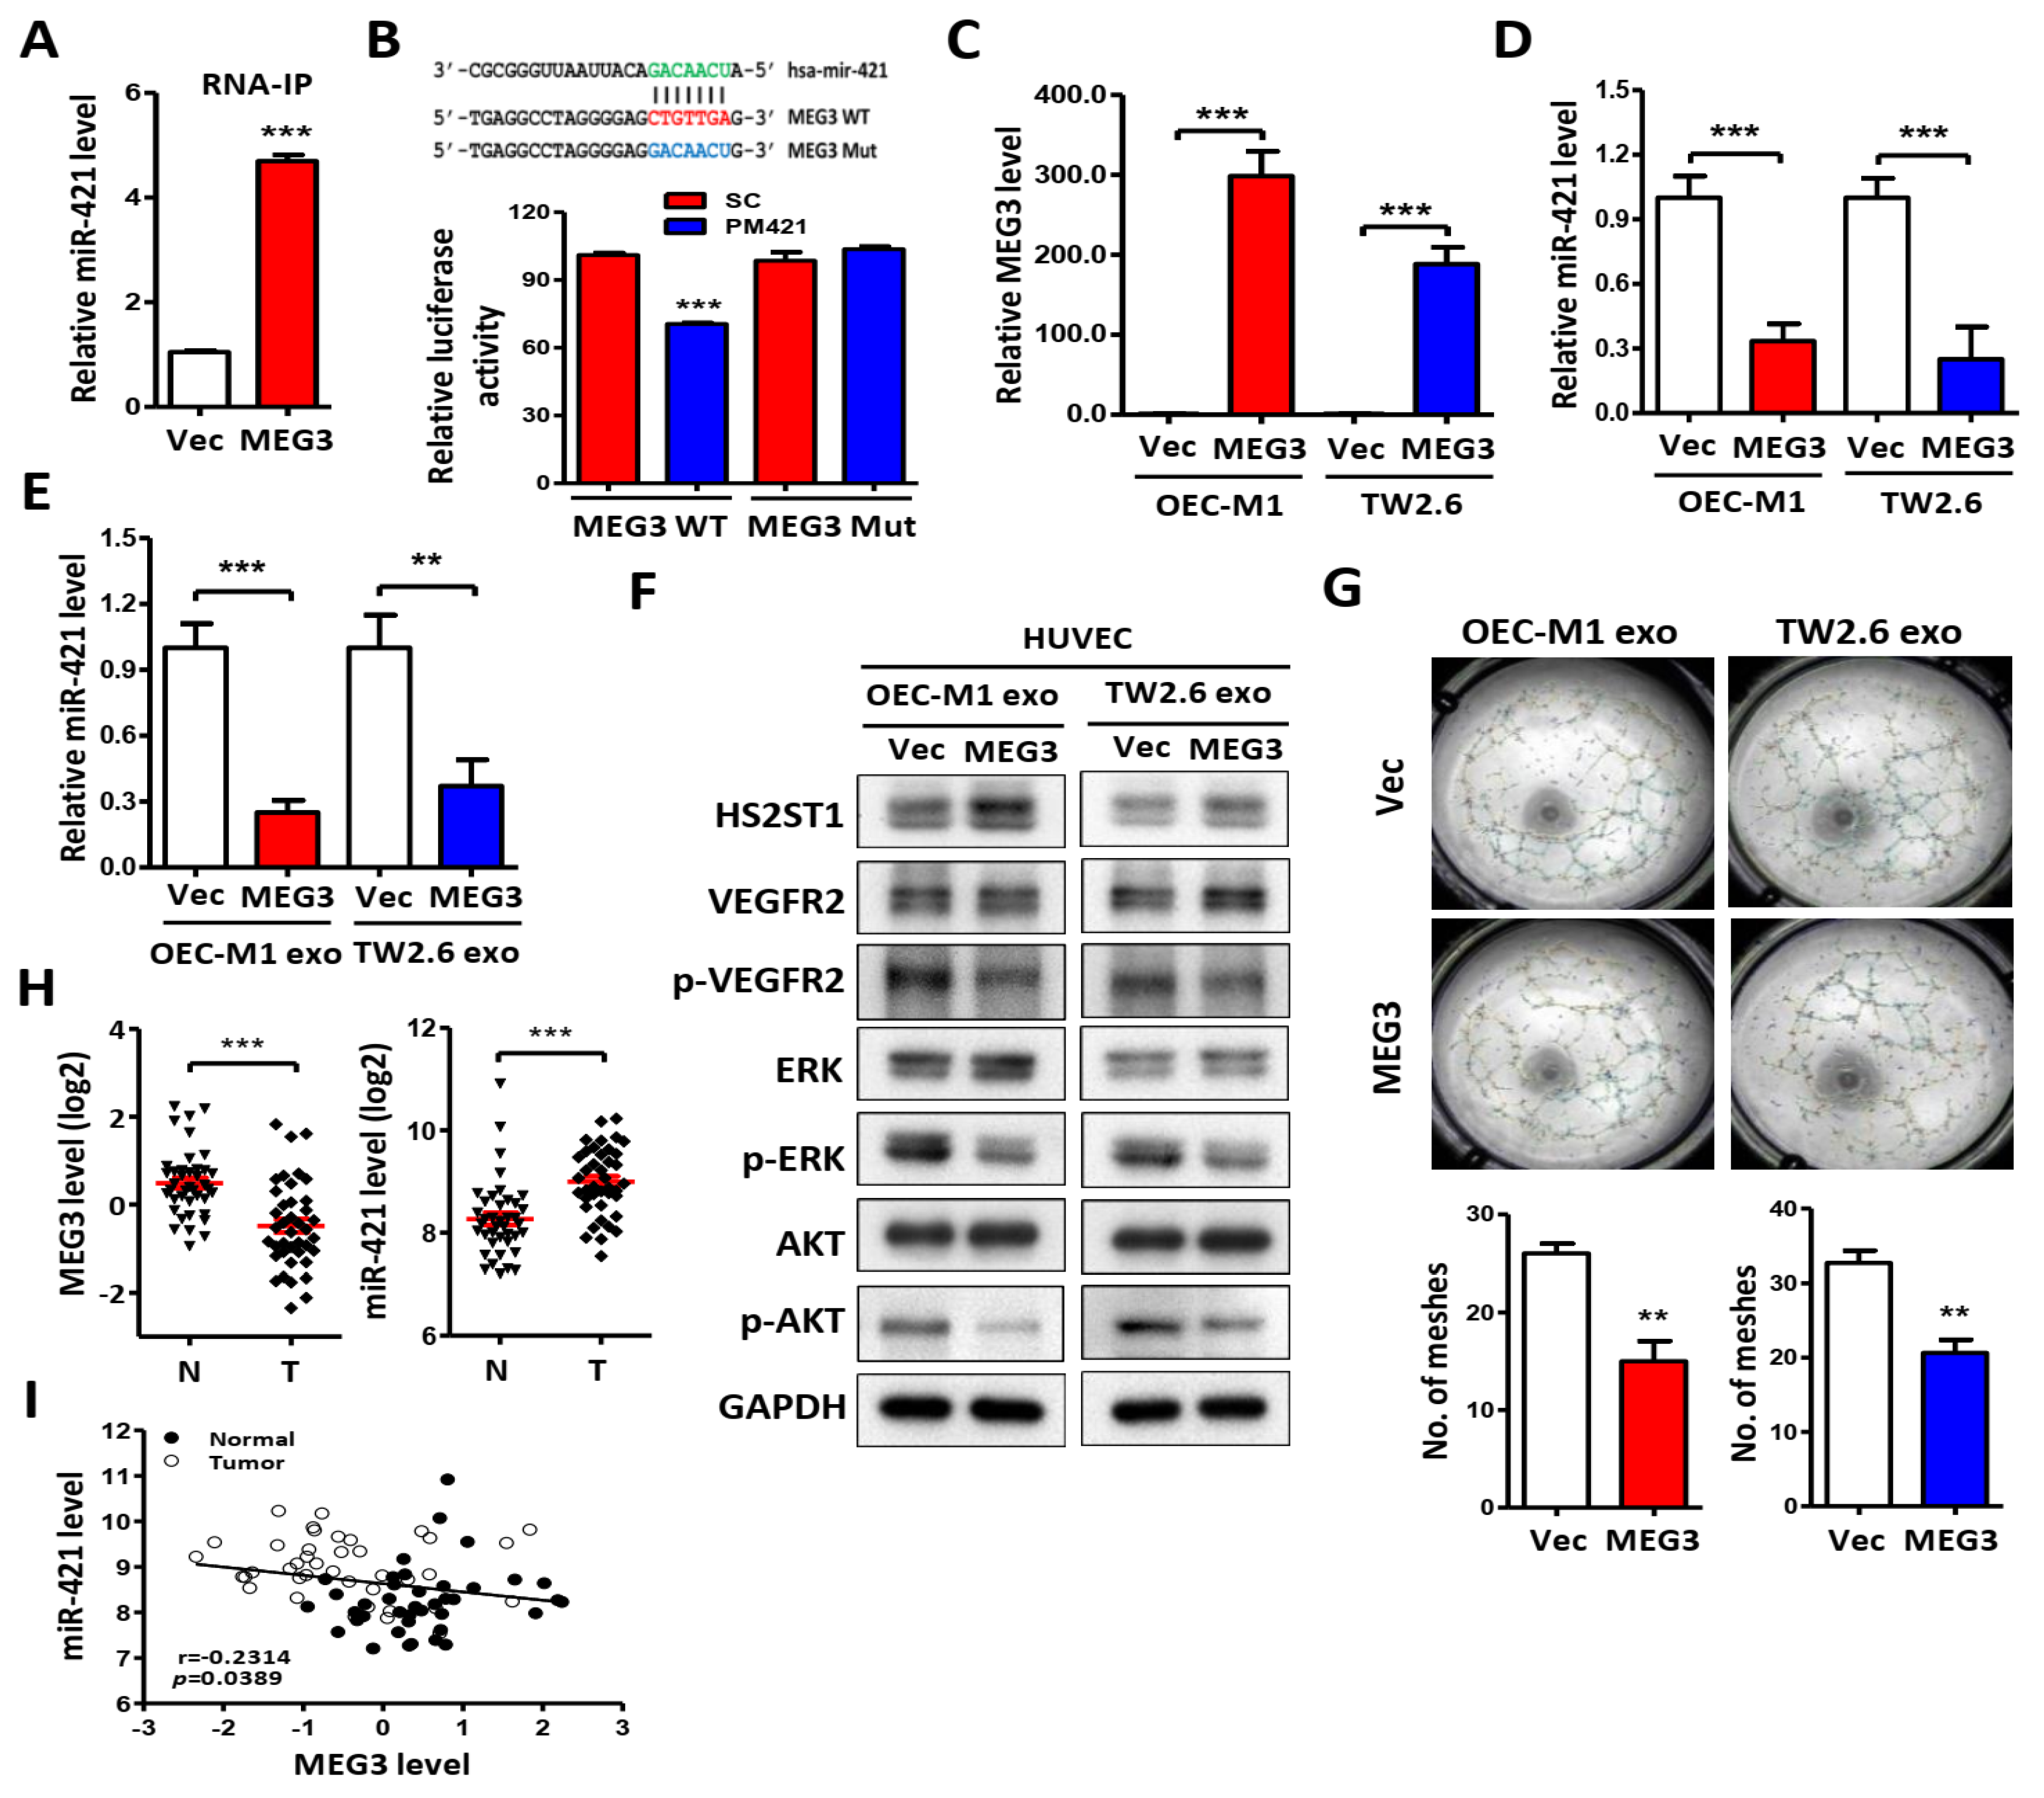
Figure 7.
Effects of exosomes uptake in HUVECs. (A) Images of exosome uptake at 2 h after dynasore treatment in HUVECs under a confocal microscope. Exosomes isolated from OEC-M1 were stained with PKH26 and added into the culture medium of dynasore-treated (20 or 40 μM) or untreated (Mock) HUVECs. As a negative control (NC), HUVECs were incubated with DMSO only. Scale bar: 50µm. (B) Exosome uptake was assessed by measuring PKH26 fluorescence intensity using a FACSCalibur cytometer. (C) Effect of exosome uptake on miR-421 level after dynasore treatment in HUVECs using qRT-PCR. (D) Effect of exosome uptake on protein level after dynasore treatment in HUVECs using western blot analysis. GAPDH was used as an internal control. (E) Effect of exosome uptake on tube formation at 6 h after dynasore treatment in HUVECs. Data are represented as mean ± SD; *p < 0.05; **p < 0.01; ***p < 0.001.
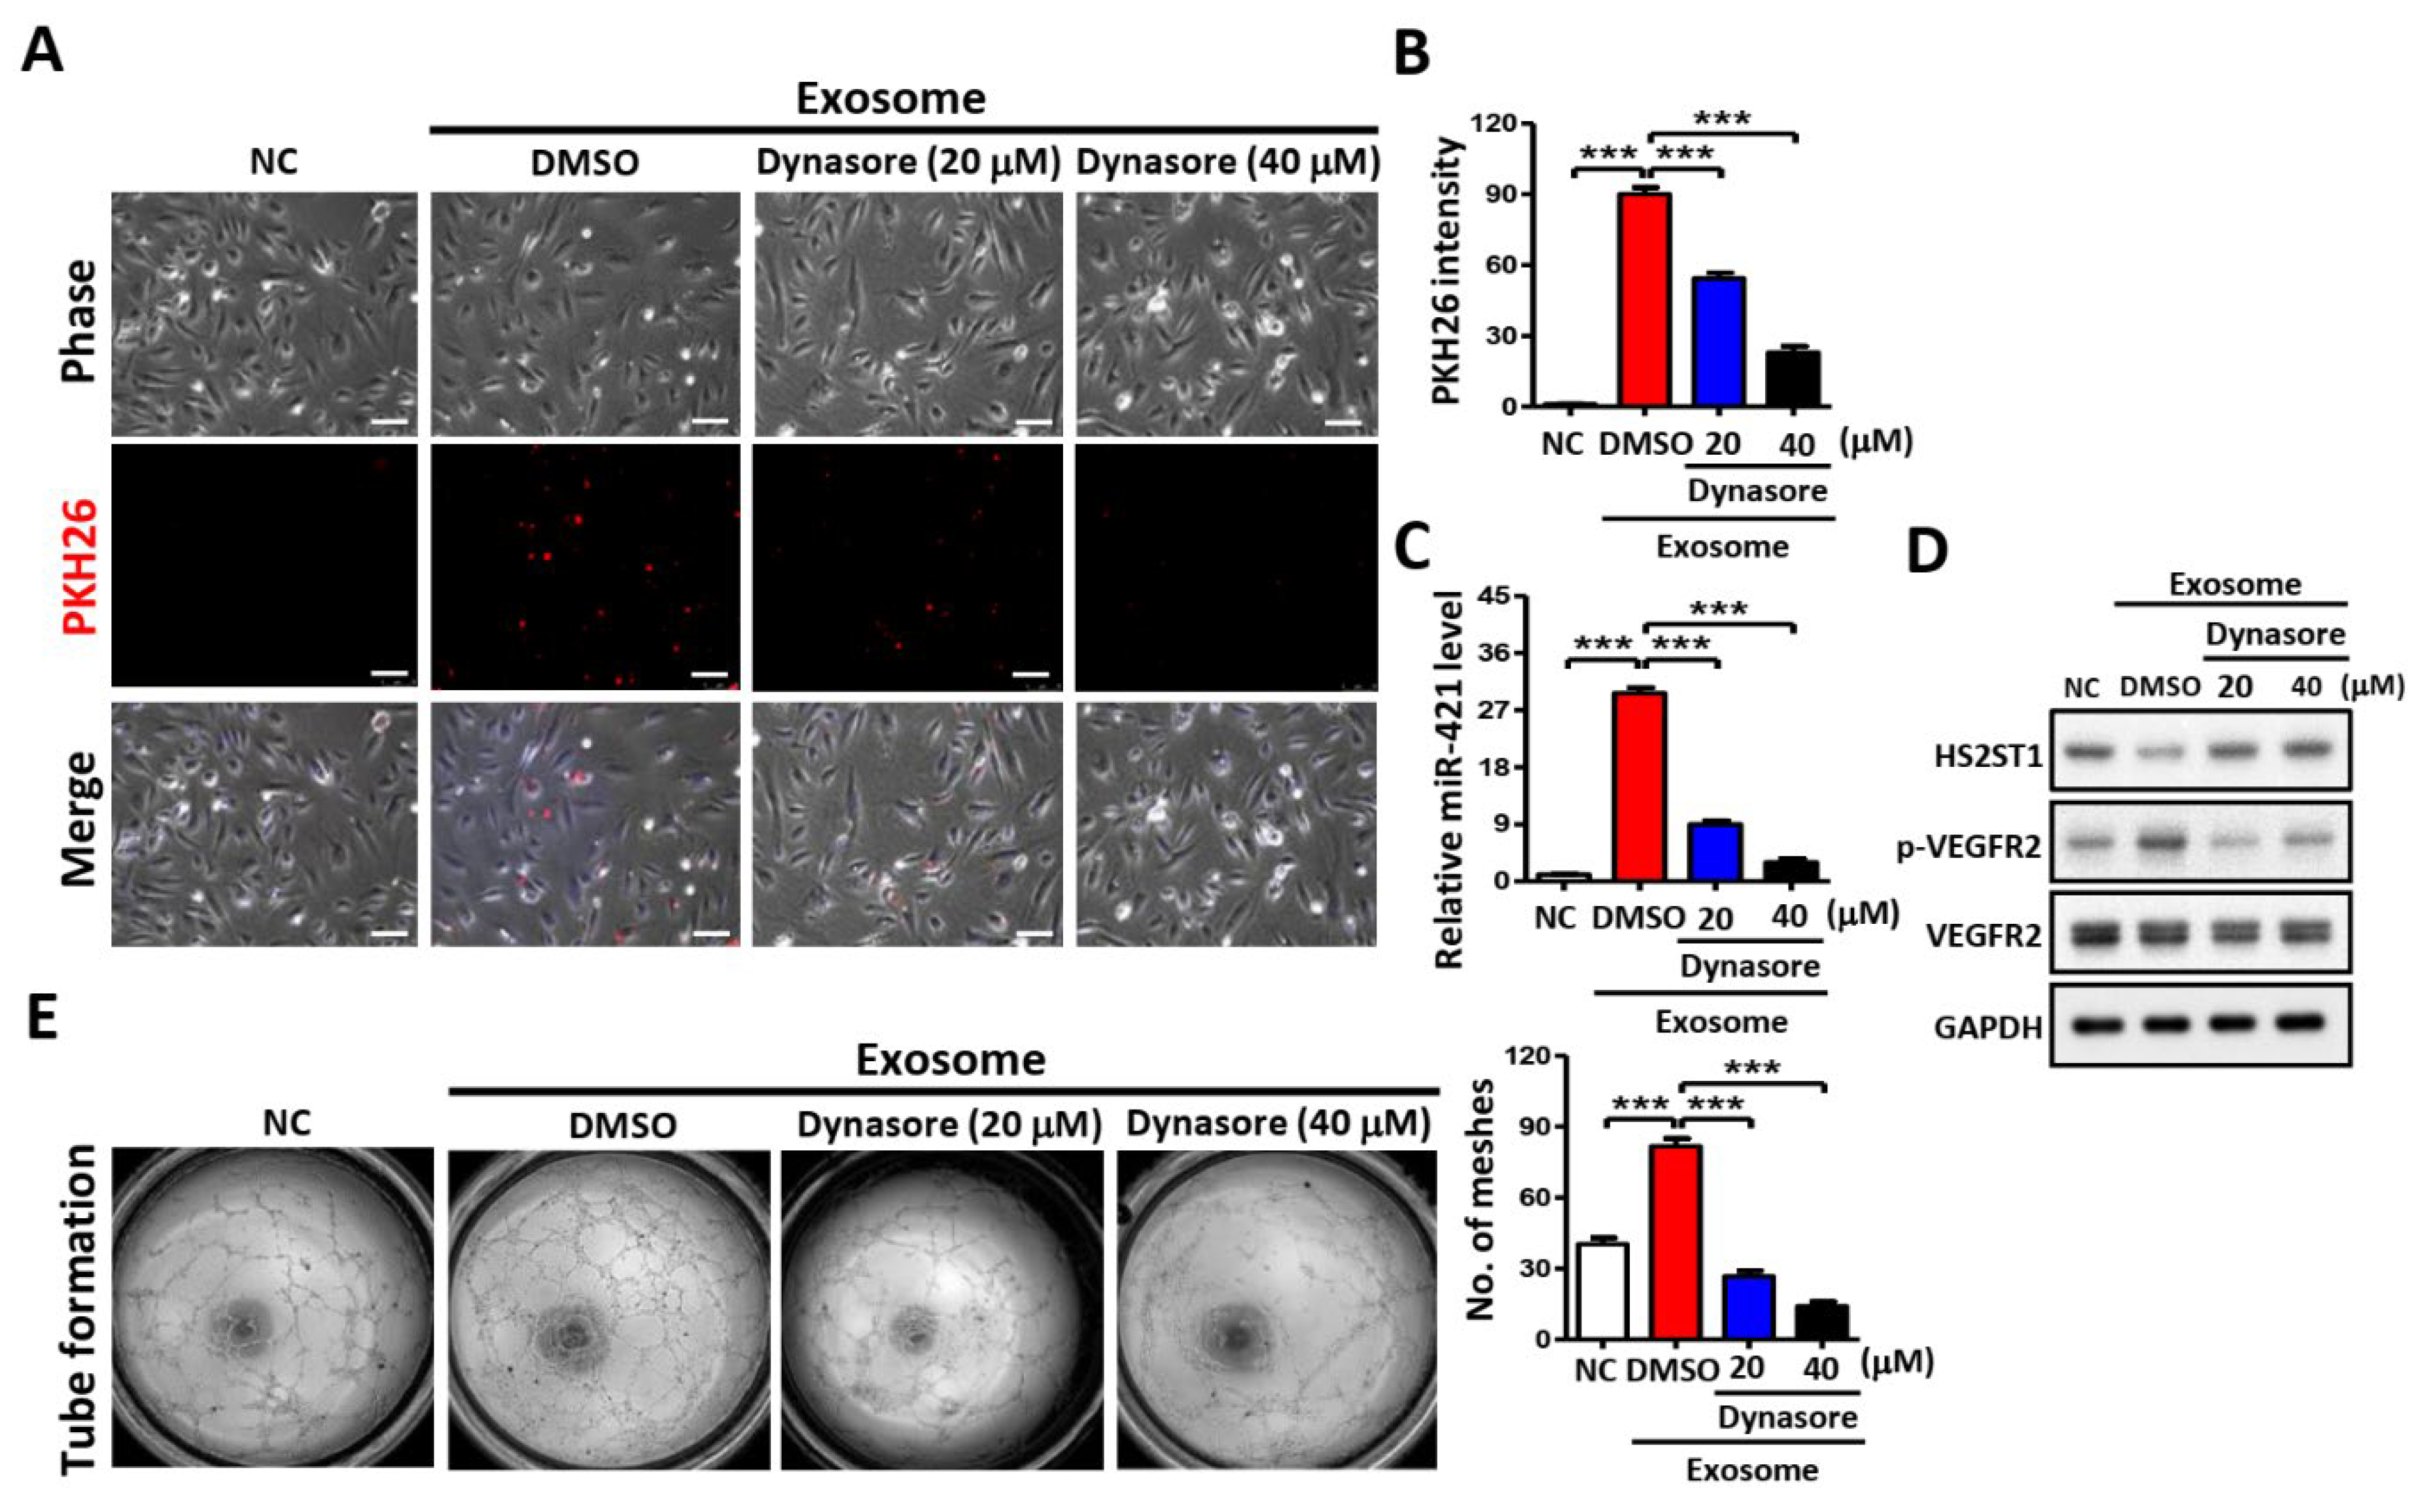
Figure 8.
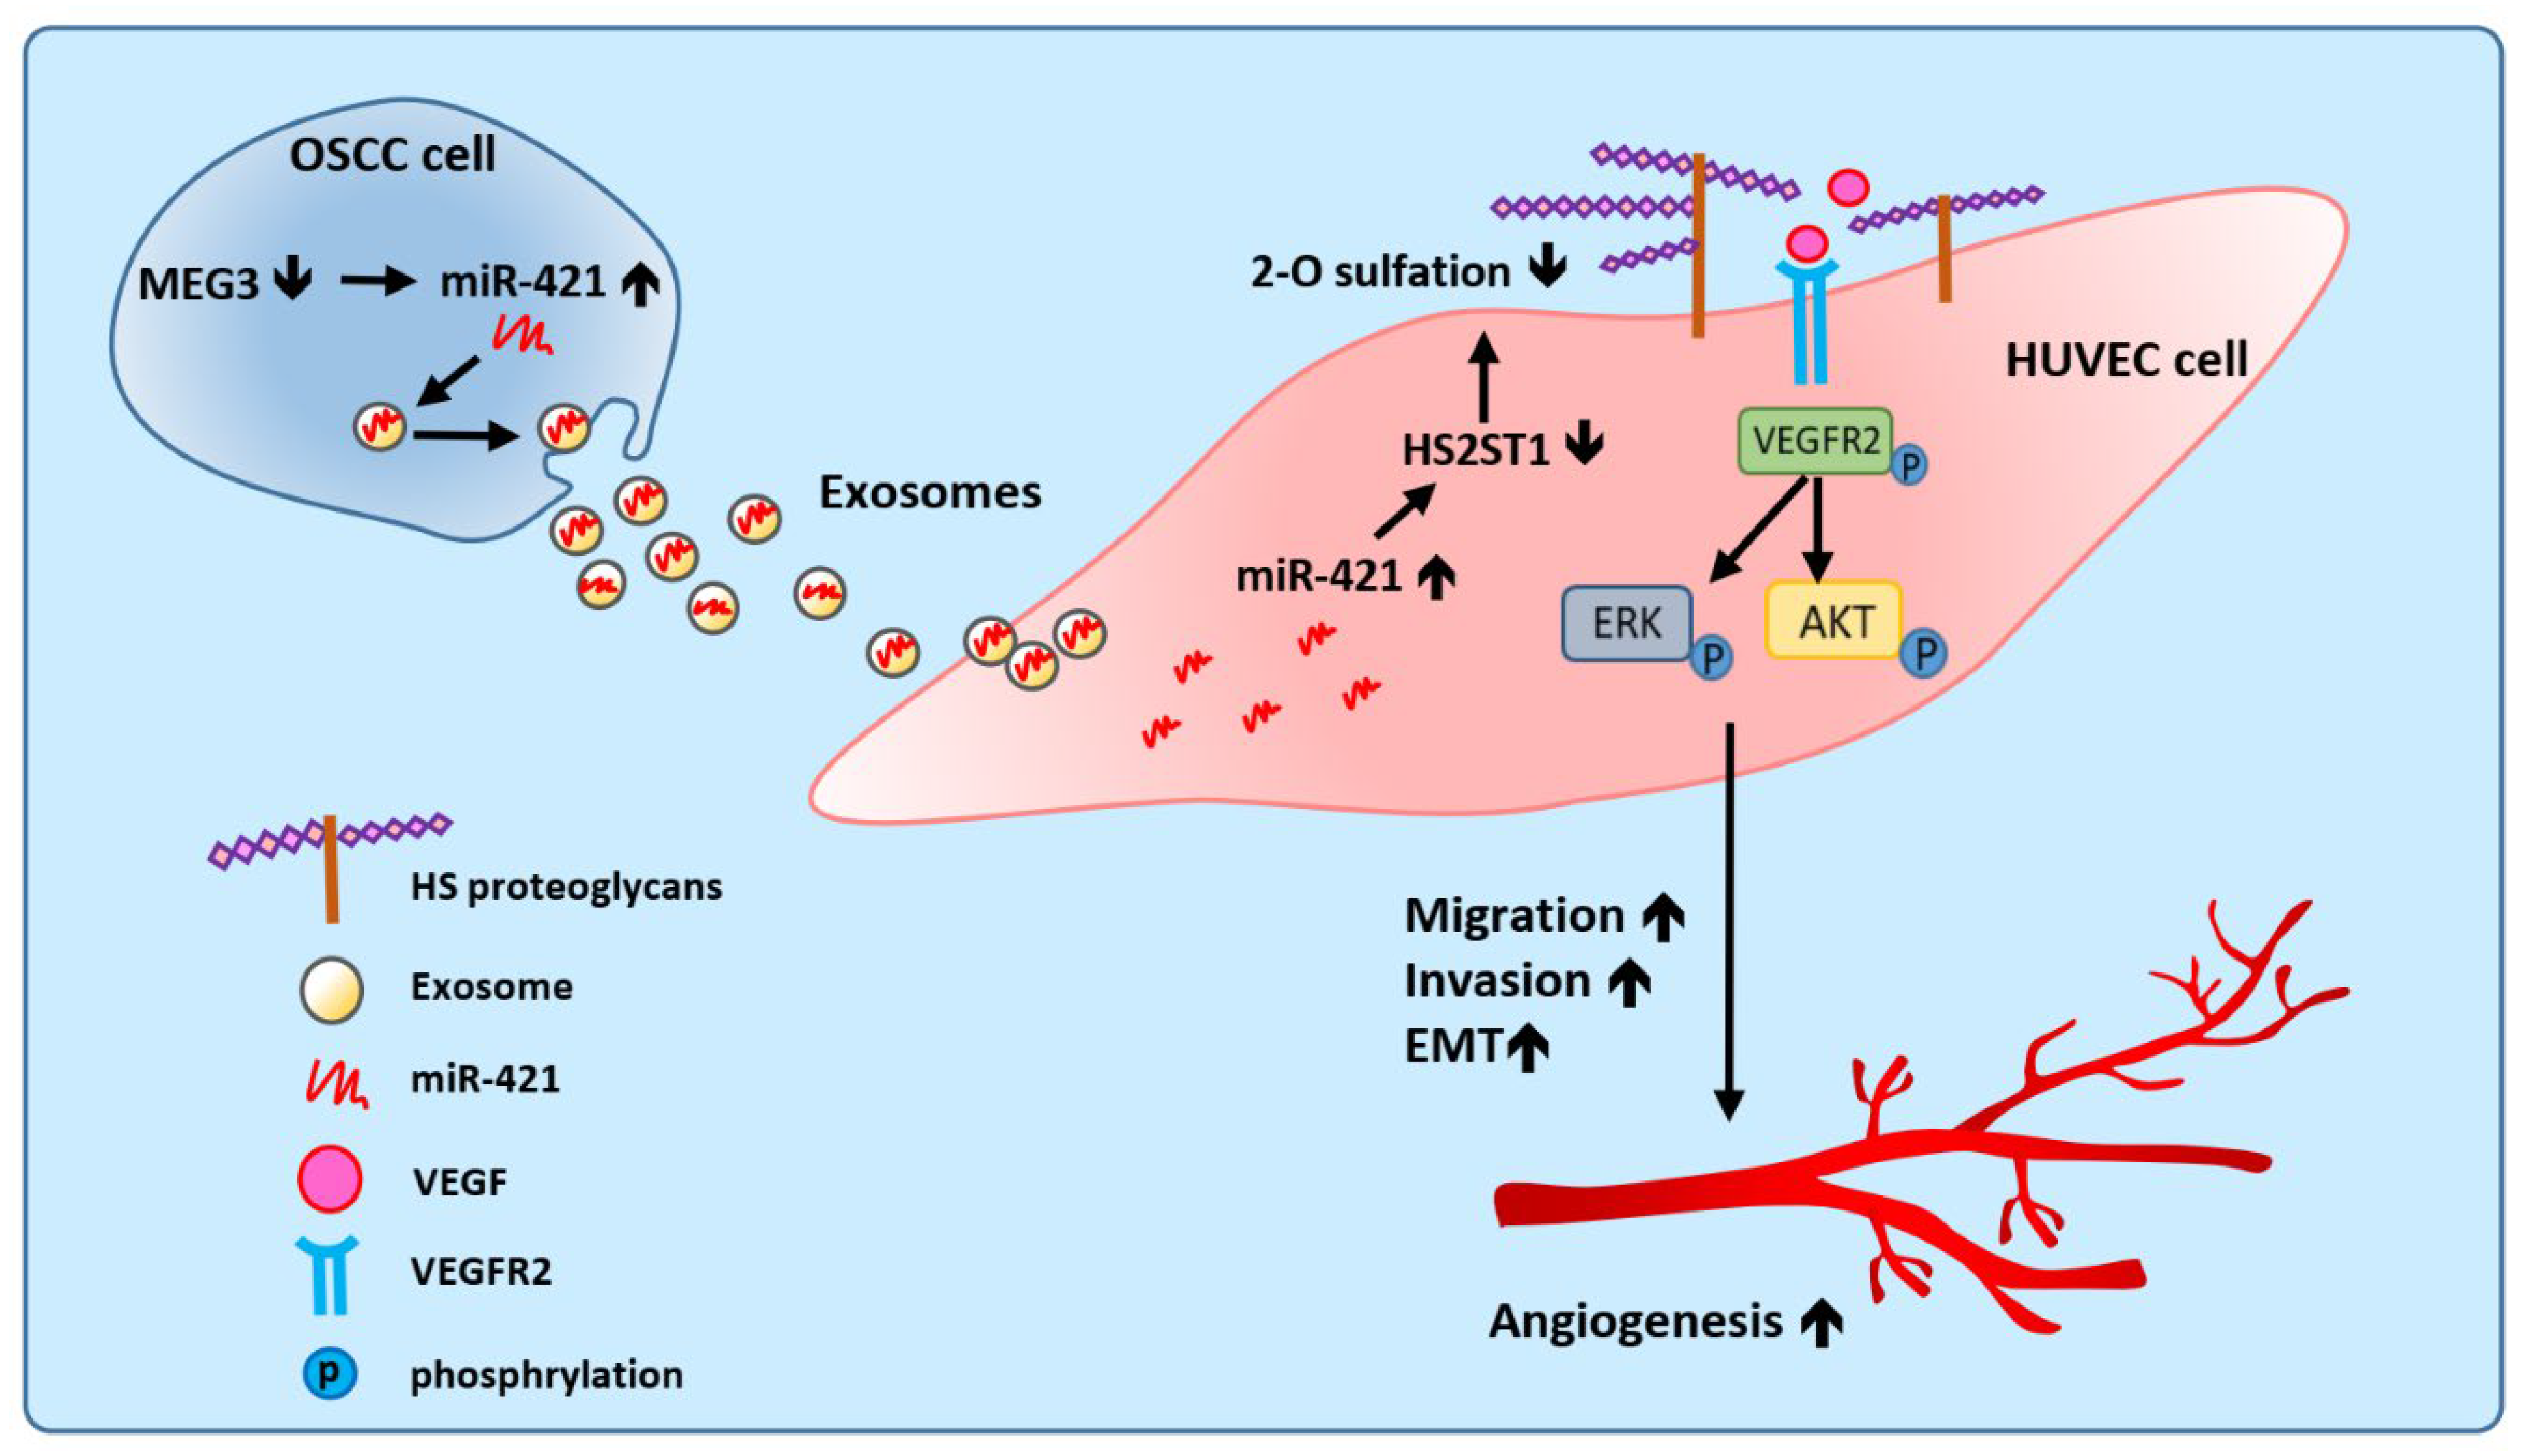
Proposed model illustrating the exosomal-miR-421 modulates angiogenesis in OSCC. Downregulated lncRNA MEG3 increases the amount of miR-421, which is then packaged in OSCC-derived exosomes and secreted into the tumor microenvironment. MiR-421-enriched exosomes are taken up by HUVEC cells to induce angiogenesis through targeting HS2ST1. Downregulation of HS2ST1 leads to decreased 2-O-sulfation of HSPG, thereby facilitating VEGF binding to VEGFR2, which then promotes EMT, migration, invasion and angiogenic potential of HUVEC cells.
Figure 8.
Proposed model illustrating the exosomal-miR-421 modulates angiogenesis in OSCC. Downregulated lncRNA MEG3 increases the amount of miR-421, which is then packaged in OSCC-derived exosomes and secreted into the tumor microenvironment. MiR-421-enriched exosomes are taken up by HUVEC cells to induce angiogenesis through targeting HS2ST1. Downregulation of HS2ST1 leads to decreased 2-O-sulfation of HSPG, thereby facilitating VEGF binding to VEGFR2, which then promotes EMT, migration, invasion and angiogenic potential of HUVEC cells.
Disclaimer/Publisher’s Note: The statements, opinions and data contained in all publications are solely those of the individual author(s) and contributor(s) and not of MDPI and/or the editor(s). MDPI and/or the editor(s) disclaim responsibility for any injury to people or property resulting from any ideas, methods, instructions or products referred to in the content. |
© 2024 by the authors. Licensee MDPI, Basel, Switzerland. This article is an open access article distributed under the terms and conditions of the Creative Commons Attribution (CC BY) license (https://creativecommons.org/licenses/by/4.0/).
Copyright: This open access article is published under a Creative Commons CC BY 4.0 license, which permit the free download, distribution, and reuse, provided that the author and preprint are cited in any reuse.


