
Submitted:
15 May 2024
Posted:
16 May 2024
You are already at the latest version
Abstract
We produced a recombinant eel luteinizing hormone (rec-eel LH) analog with high potency in Chinese hamster ovary DG44 (CHO DG44) cells. The eel LH mutant (LH-M), which had a linker comprising the equine chorionic gonadotropin (eCG) β-subunit carboxyl-terminal peptide (CTP) region (amino acids 115 to149), was inserted between the β-subunit and α-subunit of wild-type tethered eel LH (LH-wt). Monoclonal cells transfected with the eel LH-wt and eel LH-M plasmids were isolated from five and nine clones of CHO DG44 cells, respectively. The secreted quantities abruptly increased on day 3, with peak levels of 5,000–7,500 ng/mL on day 9. The molecular weight of eel LH-wt was 32–36 kDa while that of eel LH-M increased to approximately 38–44 kDa, indicating the detection of two bands. Treatment with peptide N-glycanase F decreased the molecular weight by approximately 8 kDa. The oligosaccharides at the eCG β-subunit O-linked glycosylation sites were appropriately modified post-translation. The EC50 value and maximal responsiveness of eel LH-M increased by approximately 2.90- and 1.29-fold, respectively, indicating that the mutant exhibited more potent biological activity than eel LH-wt. Phosphorylated extracellular regulated kinase (pERK1/2) activation resulted in a sharp peak 5 min after agonist treatment, with a rapid decrease thereafter. These results indicate that the new rec-eel LH analog which contains the eCG β-subunit CTP linker comprising O-linked glycosylation sites, had more potent activity than the wild-type in vitro. Taken together, this new eel LH analog can be produced in large quantities using a stable CHO DG44 cell system.
Keywords:
Eel LH-M
; Stable expression
; CHO DG44 cells
; cAMP response
; pERK1/2
1. Introduction
Luteinizing hormone (LH), a member of the glycoprotein hormone family, is composed of a common α-subunit and unique β-subunits [1,2]. Chorionic gonadotropin (CG) β-subunit is specifically secreted from the placenta of primates and horses during early pregnancy and evolved from the LH β-subunit gene [3]. Human CG (hCG) β-subunit and hLH β-subunit genes are found to differ; however, a single gene encodes both the CG β-subunit and LH β-subunit in horse [4,5,6,7,8,9]. These glycoproteins are secreted from the pituitary gland and control gonadal function in mammals and fish species [10,11]. Eel LH α- and β-molecules are bound together via noncovalently linked subunits, which comprise 93 and 116 amino acids, respectively. The eel α-subunit has two N-linked glycosylation sites at positions Asn56 and Asn79; these glycosylation sites are highly conserved. The LH β-subunit has one glycosylation site at Asn10, as found in most mammalians [12].
The oligosaccharide chains in LH, follicle-stimulating hormone (FSH), equine CG (eCG), and hCG are very important for cAMP/PKA signal transduction via receptors [13,14,15,16,17]. In fact, the glycosylation sites in eCG, eel FSH, and eel LH are suggested to be indispensable for biological activity through receptors in vitro and in vivo [11,18,19]. Rec-eel LH and FSH proteins are produced in the silkworm system; however, the Bombyx mori system does not have excellent biological activity for glycosylation, a post-translational modification, despite large quantities of rec-proteins [20,21]. Almost the same results are obtained in Drosophila S2 cells [22] and Pichia pastoris [23,24]. These glycoproteins can be produced in Chinese hamster ovary (CHO)-K1 and CHO-suspension (CHO-S) cells; however, they cannot be produced on large scale [2,18,19,25,26].
Owing to glycoprotein hormones, such as hCG, FSH, LH, and TSH, the CG β-subunit carboxy-terminal peptide (CTP) linker was found to induce substantially increased in vivo potency and circulatory half-lives [27,28,29,30,31,32]. Recently, eCTP linker attachments in tethered eel LH-wt and FSH-wt caused early secretion and signal transduction [25]. Remarkable results have been obtained in clinical trials with the hGH-MOD-4023 molecule, fused to hGH via the hCG β-subunit CTP linker (117-145 aa) [33,34,35,36].
Luteotropin/chorionic gonadotropin hormone receptor (LH/CGR) is a member of the superfamily of G protein-coupled receptors (GPCRs) and is involved in receptor-mediated responses, such as the cAMP response [37,38] and pERK1/2 activation [39,40,41]. Gαs proteins and β-arrestins are related to ERK signaling via two temporally distinct mechanisms: G protein-dependent mechanism, which is rapid in onset, and β-arrestin-dependent mechanism, which is slower in onset [42,43,44]. β-arrestins are involved in pERK1/2 with β-arrestin 1 and 2 in FSHR [45,46]. In terms of eel FSHR, pERK1/2 activation was found to be very fast, occurring 5 min after agonist stimulation [47,48]. Thus, eel LH should also be examined to elucidate its involvement in pERK1/2 activation and the cAMP signal response.
CHO DG44 cells are reported to be a good model for producing large quantities of rec-therapeutic proteins, such as erythropoietin [49], α-thrombin [50], alpha-1 antitrypsin [51], hFSH [52], hCG [53], and eCG [54,55]. Japanese eel is one of the most important fish species in East Asian countries. In general, the most common method for inducing maturation in female eels involves weekly injection of freeze-dried pituitaries from Pacific salmon (SPE) and carp (CPE) [12,20,22]. Notably, SPE treatment does not completely induce oocyte maturation and ovulation and is considered a complete artificial aquaculture system for hormone composition. Thus, CHO DG44 cells were selected to produce large quantities of eel LH-M. As a result, attaching an eCTP linker between the β-subunit and α-subunit was found to induce more potent biological activity and longer half-life.
Overall, a new potent hormone was found to be essential for artificial maturation, with rec-eel LH-M exhibiting a more potent biological activity in vitro. Based on our results, a new rec-eel LH-M protein was continuously produced using a mass system in CHO DG44 cells.
2. Materials and Methods
2.1. Materials
The oligonucleotides were synthesized by Genotech (Daejeon, Korea). The pGEM-T easy cloning vector was purchased from Promega (Madison, WI, USA). The pOptiVECTM-TOPO TA Cloning kit, CHO DG44 cells, CD DG44 medium, CD FortiCHOTM medium, CD OptiCHOTM medium, FreedomTM DG44 Kit, methotrexate (MTX) reagent, and cloning media were purchased from Life Technologies (Carlsbad, CA, USA). Freestyle MAX reagent and Lipofectamine-2000 were purchased from Invitrogen (Carlsbad, CA, USA). CHO-K1 cells and HEK 293 cells were obtained from the Korean Cell Line Bank (KCLB, Seoul, Korea). The mammalian expression vector, pCORON1000 SP VSV-G, was purchased from Amersham Biosciences (Piscataway, NJ, USA). CHO-S-SFM II medium, fetal bovine serum (FBS), Ham’s F-12 medium, and OptiMEM were purchased from Gibco (Grand Island, NY, USA). The monoclonal antibodies for western blotting and ELISA were produced in our laboratory [12] and labeled with horseradish peroxidase (HRP) by Medexx, Inc. (Seongnam, Korea). The PNGase F kit was purchased from New England Biolabs (Ipswich, MA, USA). The cAMP- homogeneous time-resolved fluorescence (HTRF) assay kit was purchased from Cisbio (Codolet, France). The Lumi-Light plus western blotting substrate was obtained from Roche Inc. (Pleasanton, CA, USA). The pERK1/2 antibody, total ERK1/2 antibody, and goat anti-mouse HRP-conjugated secondary antibody were purchased from Cell Signaling Technology (Beverly, MA, USA). SuperSignalTM West Pico PLUS Chemiluminescent substrate was purchased from Thermo Fisher Scientific Inc. (Waltham, MA, USA). DNA ligation reagents, endonucleases, polymerase chain reaction (PCR) reagents, and restriction enzymes were purchased from Takara Bio (Shiga, Japan). The QIAprep-Spin plasmid kit was purchased from Qiagen Inc. (Hilden, Germany), and disposable spinner flasks were purchased from Corning Inc. (Corning, NY, USA). Centriplus Centrifugal Filter Devices were purchased from Amicon Bio Separations (Billerica, MA, USA). All other reagents were purchased from Sigma-Aldrich (St. Louis, MO, USA).
2.2. Vector Construction of Eel LH-wt and LH-M
We constructed single chain eel LH-wt a with linked α-subunit without the signal sequence at the C-terminal region of the LH β-subunit, as described previously [11]. The LH-M mutant was also constructed by attaching an eCG β-subunit CTP region between the β-subunit and α-subunit via PCR, as described previously [25]. The full-length PCR products were ligated into the pGEMT-Easy vector. The full-length fragments of eel LH-wt and LH-M mutant were ligated into the pOptiVEC TOPO TA Cloning expression vector. Finally, the direction of insertion was confirmed via restriction enzyme cutting and sequencing for genetic verification. Figure 1 shows a schematic of eel LH-wt and the LH-M mutant model, which has eCTP between the β-subunit and α-subunit.
2.3. Transfection into CHO DG44 Cells
Expression plasmids were linearized via Pvu 1 restriction enzyme cut and then transfected into CHO DG44 cells using FreeStyleTM MAX reagent, according to the supplier’s protocol. Briefly, one day prior to transfection, CHO DG44 cells were passaged at a density of 3 × 10⁵ cells/mL. On the day of transfection, cell density was approximately 5 × 10⁵ cells/mL. For each transfection, 1.5 × 10⁷ of viable CHO DG44 cells were transfected into a new 125 mL spinner flask. Pre-warmed, complete CD DG44 medium was added to the flask to a final volume of 30 mL. The plasmid DNA (18 µg) and 15 µL of FreeStyleTM MAX Reagent were mixed with OptiPROTM SFM. The diluted samples were then incubated for 10 min at room temperature to induce complex formation. The DNA-FreeStyleTM MAX reagent complex was added dropwise to the cells, with slow swirling of the flask.
2.4. Single Cell Isolation and Production of the Rec-Eel LH-wt and LH-M Proteins
At 48 h after transfection, the cells were transferred into complete CD OptiCHOTM medium supplemented with 8 mM of l-glutamine. Fresh growth medium was replaced every 3–4 days for approximately 10–14 days. The cells were adapted for amplification by increasing the amount of MTX reagent. MTX-amplified cells were grown in fresh growth medium without 8 mM l-glutamine. On the day of cloning, the diluted cells were dispensed at 0.5-2 cells per well into a 96-well plate. After isolation, single-cell colonies were transferred to 24-well plates, 6-well plates, and T-25 flasks. Finally, the clones were expanded in 125 mL shaker flasks at 37 °C and 8% CO2, with shaking at 130–135 rpm. To confirm protein production, single-clone cells were cultured in 30 mL of fresh medium supplemented with 4 mM l-glutamine. The supernatant was collected and analyzed to determine the presence of the rec-LH-wt and LH-M proteins. Finally, the culture media were collected on days 9 post-seeding and centrifuged at 100,000 × g for 10 min at 4 °C to remove cell debris. The supernatant was collected and frozen at -80 °C.
2.5. Quantitation and Western Blotting of the rec-Eel LH Proteins
The collected proteins were quantified via double-sandwich enzyme-linked immunosorbent assay (ELISA) in plates coated with a monoclonal antibody, as described previously [11]. One hundred microliters of the medium were added to the plates, which were then incubated for 1–2 h at room temperature. Thereafter, HRP-conjugated anti-eel antibody was added for 1 h. The wells were washed 5 times and 100 μL of substrate solution (tetramethylbenzidine) was added to the wells for 20 min. The absorbance of each well was measured at 450 nm using a microplate reader (Cytation 3; BioTek, Winooski, VT, USA).
For western blot analysis, the collected sample (20 µL) was subjected to 12% sodium dodecyl sulfate poly-acrylamide gel electrophoresis (SDS-PAGE). The proteins were transferred onto a membrane, blocked with 5% skim milk, and then incubated with monoclonal antibody for overnight. After washing with TBS-T, the membrane was incubated with a HRP-conjugated anti-mouse secondary antibody for 2 h, followed by 2 mL of Lumi-Light substrate solution for 5 min. Detection was performed using an enhanced chemiluminescence system.
To enzymatically release N-linked oligosaccharides, modified glycans were removed from rec-proteins via treatment with the N-glycosylation enzyme. Briefly, the rec-protein (15 µg) was incubated for 1 h at 3 °C with PNGase F [1 µL enzymes (2.5 U/mL)/20 µL sample + 2 µL of 10 × Glycobuffer + 2 µL of 10% NP-40] after boiling at 100 °C for 10 min with 1 µL of 10 × Glycoprotein Denaturing Buffer. The samples were analyzed using SDS-PAGE followed by western blot analysis.
2.6. Analysis of cAMP Levels via Homogenous Time-Resolved Fluorescence Assays
cAMP accumulation in CHO-K1 cells expressing eel LH/CGR was measured using a cAMP Dynamics 2 competitive immunoassay kit. Briefly, rec-LH ligand (5 μL) was added to each well and incubated for 30 min. The cryptate-conjugated anti-cAMP monoclonal antibody and d2-labeled cAMP reagent were added to each well, then incubated for 1 h at room temperature. The compatible HTRF energy transfer (665 nm/620 nm) was measured using a TriStar2 S LB942 mi microplate reader (BERTHOLD Tech, Wildbad, Germany). The cAMP concentration for Delta F% values was calculated using the GraphPad Prism software (version 6.0; GraphPad Software Inc., La Jolla, CA, USA).
2.7. Phospho-ERK1/2 Time Course
The pCORON1000 SP VSV-G plasmid containing eel LHR was transfected into HEK293 cells. After 48 h, the cells were starved for at least 4–6 h and then treated with an agonist. Cells were lysed using RIPA buffer (Sigma-Aldrich, St. Louis, MO, USA). Equal amounts of cellular extracts were loaded onto 10% SDS-PAGE gels and transferred onto nitrocellulose membranes. pERK1/2 and total ERK1/2 were detected via immunoblotting using rabbit polyclonal anti-phospho-p44/42 MAPK (1:2,000) and anti-MAPK1/2 (1:3,000), respectively. The membranes were then incubated with an anti-rabbit secondary antibody. Chemiluminescence was detected using SuperSignalTM West Pico reagent, and phosphorylated ERK1/2 immunoblots were quantified via densitometry using Image-Lab (Bio-Rad, Hercules, CA, USA).
2.8. Data Analysis
Dose-response curves were generated for experiments performed in duplicate. GraphPad Prism 6.0 (San Diego, CA, USA) was used to analyze the cAMP response, EC50 values, and stimulation curves. Curves fitted in a single experiment were normalized to background signals measured in mock-transfected cells. The pERK1/2 values were calculated using GraFit Version 5 (Erithacus Software, Horley Surrey, UK). The results are expressed as mean ± standard error of the mean of three independent experiments.
3. Results
3.1. Isolation of Single Cells after Transfection
Transfected cells were selected at the first stage using CD-OptiCHO medium for approximately 2–3 weeks. The viability of cell transfected with eel LH-wt and eel LH-M decreased gradually to 36% and then continuously increased to 58%, 78%, and >90%. The selected cells were subjected to the second round of selection using the MTX reagent. Cell viability decreased to 40–50% due to the first treatment with 500 nM MTX. The lowest viability (16–31%) was obtained in 2 weeks via treatment with 500 nM MTX. Thereafter, a modest increase was recorded for another two weeks. The MTX concentration was increased by 2 µM to boost the gene copy number. However, cell viability did not decrease below 80%, indicating a slight decreased with recovery to over 90% in two weeks (data not shown). The MTX-selected cells were then isolated using complete cloning medium in 96-well plates. Finally, monoclonal cells expressing rec-eel LH-wt and eel LH-M were isolated from five and nine clones, respectively.
3.2. Secreted Quantity of the rec-eel LH-wt Protein
The quantity of the rec-eel LH-wt protein secreted from five clones were determined using ELISA. Supernatants were collected on days 1, 3, 5, 7, 9, and 11 post-cultivation. Rec-eel LH-wt was low on day 1 post-culture and started to increase on day 3. The concentrations gradually increased until the final supernatant was collected, as shown in Figure 2. The amount of rec-LH-wt ranged from 2,150 to 3,450 ng/mL on day 3. The expression levels increased to 3,578–4,625 ng/mL on day 5. High amounts of 7,346 ± 246 and 6,868 ± 298 ng/mL were detected in clones 2 and 4 on day 7, respectively. The secreted quantities of both clones were highest on days 7 and 9; however, high concentrations were consistently observed until day 11 for all clones. These results indicated that the expression level of eel LH-wt gradually increased with cultivation time, with optimal recovery on day 9 in CHO-DG44 cells.
3.3. Western Blotting for rec-eel LH-wt
The molecular weight of rec-eel LH-wt was determined via western blot analysis using the anti-eel glycoprotein hormone α-subunit monoclonal antibody, as described previously [12]. The collected supernatants (20 µL) were analyzed using western blotting. Specific bands were detected at 32–36 kDa in all samples (Figure 3) and weak bands were detected in all clones on day three. The band intensity steadily thickened, and the strongest signal was observed on days 7-9, with a slight decrease on day 11. According to the ELISA and western blot results, optimal recovery occurred on days 7 and 9.
3.4. Secreted Quantity of the rec-eel LH-M Protein
To analyze the quantity of secreted proteins in the nibe clones of the eel LH-M mutant, the supernatant was collected on days 1, 3, 5, 7, and 9 post-cultivation. The quantity of the rec-eel LH-M protein gradually increased as shown in Figure 4. Based on the clones, 543 to 2,847 ng/mL of the secreted protein was detected on day 1. The secreted pattern was almost the same as that detected in eel LH-wt. The secreted levels rapidly increased to 3,332–6,763 ng/mL on day 5 and reached 4,341 to 7,865 ng/mL on days 7 and 9. The expression was maintained until day 9. The highest expression level of 7,865 ± 278 ng/mL was obtained on days 7 in clone 9. The secreted quantities were high on days 7 and 9 post-cultivation in all clones.
3.5. Western Blotting for eel FSH-M
The eel LH-M protein was isolated nine clones. Briefly, 20 µL of supernatant was collected on day 9 for western blotting. Two specific bands were detected at 38–44 kDa as shown in Figure 5A. The molecular weight of rec-eel LH-M increased by approximately 6–8 kDa compared to that of eel LH-wt. The addition of the eCTP β-subunit linker plays a pivotal role in glycosylation. Thus, the secretion pattern was detected according to the culture time of clones 3 and 9, which indicated gradual increases in the band intensity (Figure 5B). Weak bands were detected on day 3, and strong signals were detected on days 7 and 9, indicating the strong detection of two specific bands.
3.6. Deglycosylation of rec-eel LH-wt and LH-M Proteins
The molecular weights of rec-eel LH-wt and the LH-M mutant were approximately 32–35 and 38–44 kDa, respectively, as shown in Figure 6. However, treatment of the rec-eel LH-wt with PNGase F reduced its molecular weight to approximately 24–28 kDa, indicating a decrease of approximately 8–9 kDa. To further characterize rec-eel LH-M, treatment with PNGase F enzyme markedly decreased the molecular weight to 32–36 kDa. The eCTP β-subunit linker region only has 35 amino acids, including 12 potential O-linked glycosylation sites. Therefore the 6–8 kDa increase in molecular weight indicates partially modification of additional oligosaccharides in the O-linked glycosylation sites. Thus, the carbohydrate content of rec-eel LH-wt and eel LH-M proteins from CHO DG44 cells was appropriately modified.
3.7. Biological Activities of the rec-eel LH-wt and LH-M Proteins
The in vitro biological activity was assessed using transfected CHO-K1 cells expressing the LH receptor. The potency of cAMP activation in rec-eel LH-wt and LH-M mutant is shown in Figure 7. The dose-response curve of the eel LH-M mutant slightly shifted to the left compared to that of eel LH-wt. Rec-eel LH-wt exhibited full biological activity, with an EC50 value of 138.8 ng/mL and Rmax of 49.0 ± 1.2 nM/104 cells. However, the biological activity of eel LH-M was higher than that of LH-wt, with an EC50 and Rmax values of 47.8 ng/mL and 63.4 ± 1.5 nM/104 cells (Table 1), indicating 2.9- and 1.29-fold increase, respectively. This increase enables the attachment of eel LH-M to the eCG β-subunit CTP linker containing approximately 12 O-linked glycosylation sites.
3.8. Phospho-ERK1/2 Activation
MAPK activation sharply increased (within 5 min) in HEK 293 cells transiently transfected to express eel LHR and stimulated with rec-eel LH and rec-eel LH-M (Figure 8). Rapid activation of pERK1/2 was observed at 5 min, which then decreased abruptly. After agonist stimulation, pERK1/2 activity was highest at 5 min and decreased to approximately 10% of the maximal level at 15 min and 30 min. No difference was observed between the eel LH-wt and LH-M groups. These results indicate that eel LH/CGR by a rec-LH agonist induces PKA-dependent pERK1/2 activation. However, the roles of PKA and PKC in pERK1/2 need to be elucidated.
4. Discussion
Based on the results of the present study, the attachment of an eCG β-subunit-CTP linker between β-subunit and α-subunit of tethered eel LH significantly increases the biological activity of cAMP responsiveness in vitro. Moreover, this new eel LH analog could be produced in large quantities using a stable CHO DG44 cell system. In cells expressing the eel LH receptor, eel LH-M displayed more potent activity in the PKA signal transduction pathway than of eel LH-wt. The eCG β-subunit CTP regions are essential in glycoprotein hormones to achieve early expression, a novel long-acting rec-protein hormone analog, and more potent biological activity.
In the present study, the highest secreted quantity of 5,000-7,500 ng/mL was obtained on day nine post-cultivation. The expression level increased by approximately 10–14-fold compared to the transient expression in CHO-K1 and CHO-S cells, as described previously [11,25]. However, these levels are markedly lower than those obtained in previous studies on human α-thrombin (1.5 g/L), human alpha-1 antitrypsin (1.05 g/L) by methotrexate (MTX) amplification [49,50,51]. Therefore, the rec-protein quantity in CHO DG44 cells may depend on the gene of interest. A strong band was also detected via western blotting, despite loading of only 20 µl supernatant.
Based on western blot analysis, the molecular weight of rec-eel LH-wt and LH-M were 32–36 kDa and 38–44 kDa, respectively. These results are consistent with those of a recent study, in which the same broad band was observed for eel LH-M transiently produced from CHO-S cells, indicating the detection of two specific bands [25]. Therefore, the dimeric eel LH α/β linked with a non-covalent bond from the eel pituitary was approximately 32–38 kDa [56]. Based on these results, broad bands are widely detected for eel LH-M; therefore, the increased molecular weight was due to attachment of the eCG β-subunit CTP linker. The molecular weight following PNGase F treatment clearly decreased by approximately 8 kDa. These results are almost consistent with those of previous studies, suggesting that the purified eel α-subunit from eel pituitary reacted with the 17 and 19 kDa proteins; however, the molecular weight decreased to 13 kDa owing to N-glycopeptidase F treatment [22].
In previous studies on hCTP and eCTP linker attachment in glycoprotein hormones, the molecular weight and biological activity of hFSH β-hCTP-α, hCTP-hGH-hCTP-hCTP, hTSH β-hCTP-α, [27,33,57], and eel FSH-M [25] were found to increase. These results are consistent with our findings as the molecular weight of eel LH-M increased by approximately 6–8 kDa. Therefore, the linker containing O-linked glycosylation sites increases the molecular weight, indicating higher PKA/cAMP responsiveness of rec-eel LH-M than eel LH-wt. However, the EC50 value and maximal cAMP responsiveness stimulation markedly decreased in the deglycosylated eel LH mutants in a dose-dependent manner in vitro [11]. Thus, the oligosaccharide chains of the glycoprotein hormones may contribute to the biological activity and molecular weight. hCTP-hGH-hCTP-hCTP was developed as a long-acting human GH for once-weekly administration to GH-deficient adults and children [33,36,58]. We suggest that the eCTP linker attachment contribute to the biological activity and long-acting functions of proteins in vivo.
The eCTP linker region contains 34 amino acids, several threonine/serine residues for potential post-phosphorylation, and approximately 12 O-linked glycosylation sites. The O-linked glycosylation induces a specific conformation. According to previous studies, the O-linked glycosylation sites in eCG and hCG play indispensable roles in the secretion of wild-type hormones into the cell supernatant, biological activity, and half-life [1,16,25,59]. However, these investigators also insisted that the hCG CTP regions are not important for receptor binding and signal transduction in vitro. Nevertheless, the CTP regions are dispensable for biological activity and half-life in vivo [59]. Deletion of the eCG β-subunit from the 34 amino acids, including the O-linked glycosylation sites, significantly delayed the secretion time in CHO-S cells [19]. Thus, attachment of the eCTP linker to the eel LH-M molecule may prolong the circulating half-life of the rec-protein. Therefore, the eel LH-M mutant with eCG β-subunit CTP linker plays a pivotal role in signal transduction through the receptors.
Phosphorylation of ERK1/2 proceeds via the sequential activation of three kinases, Raf1, MEK1, and ERK1/2 [60,61]. The intracellular signaling pathway is activated by LH and includes the Gs-mediated activation of adenylate cyclase, resulting in cAMP production and PKA activation in a cell-specific and G protein-dependent manner [62,63]. This ERK1/2-mediated regulatory process has been observed for many GPCRs that interact with β-arrestins, such as V2 vasopressin receptor [64], parathyroid hormone receptor [65], β2 adrenergic receptor [43], u-opioid receptor [66], neurotensin receptor 1 [44], glucagon-like peptide-1 receptor [67], and angiotensin II [68]. In the present study, pERK1/2 exhibited a peak response 5 min after agonist stimulation. These results are consistent with FSH- and hCG-stimulated pERK1/2 activation in a dose-dependent manner, peak observed at approximately 6 min [46,62]. Based on our results, pERK1/2 is activated in almost the same manner as most GPCRs. Taken together, stimulation of the eel LH/CGR-mediated signaling pathway leads to pERK1/2 activation. pERK1/2 activation by LH/CGR-mediated signaling must be further studied to determine whether a new pathway involving the phosphorylation of downstream effectors of the MAPK pathway exists.
5. Conclusions
Herein, rec-eel LH-M was found to exhibit more potent biological activity than eel LH-wt in cells expressing eel the LH/CG receptor. Single cells expressing rec-eel LH-wt and LH-M proteins were isolated from CHO DG44 cells. These cells secreted approximately 15-fold more protein than CHO-S cells. The molecular weight of rec-eel LH-M ranged from 38–44 kDa and two specific bands were detected. The cAMP responsiveness (EC50 value) in eel LH-M was increased by 2.90-fold, and the maximal responsiveness was 1.29-fold higher than that of eel LH-wt. Similar activation of pERK1/2 levels was recorded with a sharp peak at 5 min, followed by a rapid decline. These findings markedly important to the production of new potent analogs in large quantities using a stable CHO DG44 cell system. The eCTP linker containing 12 O-linked glycosylation sites needs to exhibit potent activity in vitro and is required for maximal cAMP responsiveness to enable efficient activation of the pERK1/2 signal transduction pathway.
Author Contributions
Methodology, M.B.; formal analysis, S.-G.K.; data curation, M.B. S.-P.H. and K.-S.M.; software, S.-H.P.; investigation, M.B.; writing—original draft preparation, B.M.; writing—review and editing, M.-H.K. and K.-S.M.; project administration, M.B., funding acquisition, M.-K.S. and S.-K.K. All authors have read and agreed to the published version of the manuscript.
Funding
This study was supported by a research grant from the National Institute of Fisheries Science (R2024050), Republic of Korea.
Conflicts of Interest
Author Myung-Hum Park was employed by the company TNT Research. The remaining authors declare that the research was conducted in the absence of any commercial or financial relationships that could be construed as a potential conflict of interest.
References
- Min, K.S.; Park, J.J.; Byambaragchaa, M.; Kang, M.H. Characterization of tethered equine chorionic gonadotropin and its deglycosylated mutants by ovulation stimulation in mice. BMC Biotechnol. 2019, 19, 60. [Google Scholar] [CrossRef] [PubMed]
- Min, K.S.; Park, J.J.; Lee, S.Y.; Byambragchaa, M.; Kang, MH. Comparative gene expression profiling of mouse ovaries upon stimulation with natural equine chorionic gonadotropin (N-eCG) and tethered recombinant-eCG (R-eCG). BMC Biotechnol. 2020, 20, 59. [Google Scholar] [CrossRef]
- Talmadge, K.; Vamvakopoulos, N.C.; Fiddes, J. Evolution of the genes for the β subunits of human chorionic gonadotropin and luteinizing hormone. Nature 1984, 307, 37–40. [Google Scholar] [CrossRef]
- Bousfield, G.R.; Sugino, H.; Ward, D. Structural studies on equine glycoprotein hormones: Amino acid sequence of equine lutropin β-subunit. J. Biol. Chem. 1985, 260, 9531–9533. [Google Scholar] [CrossRef] [PubMed]
- Crawford, R.J.; Tregear, G.W.; Niall, H.D. The nucleotide sequences of baboon chorionic gonadotropin β-subunit genes have diverged from the human. Gene 1986, 46, 161–169. [Google Scholar] [CrossRef] [PubMed]
- Sugino, H.; Bousefield, G.; Moore, W.T.; Ward, D.N. Structural studies on equine glycoprotein hormones: Amino acid sequence of equine chorionic gonadotropin β subunit. J. Biol. Chem. 1987, 262, 8603–8609. [Google Scholar] [CrossRef]
- Sherman, G.B.; Wolfe, M.W.; Farmerie, T.A.; Clay, C.M.; Threadgill, D.S.; Sharp, D.C.; Nilson, J.H. A single gene encodes the β-subunits of equine luteinizing hormone and chorionic gonadotropin. Mol. Endocrinol. 1992, 6, 951–959. [Google Scholar]
- Min, K.S.; Hattori, N.; Aikawa, J.I.; Shiota, K.; Ogawa, T. Site-directed mutagenesis of recombinant equine chorionic gonadotropin/luteinizing hormone: differential role of oligosaccharides in luteinizing hormone- and follicle-stimulating hormone-like activities. Endocrine J. 1996, 43, 585–593. [Google Scholar] [CrossRef] [PubMed]
- Min, K.S.; Hiyama, T.; Seong, H.W.; Hattori, N.; Tanaka, S.; Shiota, K. Biological activities of tethered equine chorionic gonadotropin (eCG) and its deglycosylated mutants. J. Reprod. Dev. 2004, 50, 297–304. [Google Scholar] [CrossRef] [PubMed]
- Pierce, J.C.; Parsons, T.F. Glycoprotein hormones: structure and function. Annu. Rev. Biochem. 1981, 50, 465–495. [Google Scholar] [CrossRef] [PubMed]
- Byambaragchaa, M.; Kim, D.J.; Kang, M.H.; Min, K.S. Site specificity of eel luteinizing hormone N-linked oligosaccharides in signal transduction. Gen. Comp. Endocrinol. 2018, 268, 50–56. [Google Scholar] [CrossRef] [PubMed]
- Kim, D.J.; Park, C.W.; Kim, D.W.; Park, H.K.; Byambaragchaa, M.; Lee, N.S.; Hong, S.M.; Kang, M.H.; Min, K.S. Production and characterization of monoclonal antibodies against recombinant tethered follicle-stimulating hormone from Japanese eel Anguilla japonica. Gen. Comp. Endocrinol. 2016, 233, 8–15. [Google Scholar] [CrossRef]
- Bishop, L.A.; Robertson, D.M.; Cahir, N.; Schofield, P.R. Specific roles for the asparagine-linked carbohydrate residues of recombinant human follicle stimulating hormone in receptor binding and signal transduction. Mol. Endocrinol. 1994, 8, 722–731. [Google Scholar] [PubMed]
- Flack, M.R.; Froehlich, J.; Bennet, A.P.; Anasti, J.; Nisula, B.C. Site-directed mutagenesis defines the individual roles of the glycosylation sites on follicle-stimulating hormone. J. Biol. Chem. 1994, 269, 14015–14020. [Google Scholar] [CrossRef] [PubMed]
- Valove, F.M.; Finch, C.; Anasti, J.N.; Froehlich, J.; Flack, M.R. Receptor binding and signal transduction are dissociable functions requires different sites on follicle-stimulating hormone. Endocrinology 1994, 135, 2657–2661. [Google Scholar] [CrossRef] [PubMed]
- Fares, F. The role of O-linked and N-linked oligosaccharides on the structure-function of glycoprotein hormones: Development of agonists and antagonists. Biochim. Biophys. Acta 2006, 1760, 560–567. [Google Scholar] [CrossRef] [PubMed]
- Boeta, M.; Zarco, L. Luteogenic and luterotropic effects of eCG during pregnancy in the mare. Anim. Reprod. Sci. 2012, 130, 57–62. [Google Scholar] [CrossRef] [PubMed]
- Kim, J.M.; Munkhuu, O.; Bambaragchaa, M.; Lee, B.I.; Kim, S.K.; Kang, M.H.; Kim, D.J.; Min, K.S. Site-specific roles of N-linked oligosaccharides in recombinant eel follicle-stimulating hormone for secretion and signal transduction. Gen. Comp. Endocrinol. 2019, 276, 37–44. [Google Scholar] [CrossRef] [PubMed]
- Lee, S.Y.; Byambaragchaa, M.; Kang, H.J.; Choi, S.H.; Kang, M.H.; Min, K.S. Specific roles of N- and O-linked oligosaccharide sites on biological activity of equine chorionic gonadotropin (eCG) in cells expressing rat luteinizing hormone/chorionic gonadotropin receptor (LH/CGR) and follicle-stimulating hormone receptor (FSHR). BMC Biotechnol. 2021, 21, 52. [Google Scholar] [CrossRef] [PubMed]
- Kobayashi, M.; Hayakawa, Y.; Park, W.; Banba, A.; Yoshizaki, G.; Kumamura, K.; Kagawa, H.; Nagaya, H.; Sohn, Y.C. Production of recombinant Japanese eel gonadotropins by baculovirus in silkworm larvae. Gen. Comp. Endocrinol. 2010, 167, 379–386. [Google Scholar] [CrossRef] [PubMed]
- Hong, S.M.; Choi, J.H.; Jo, S.J.; Min, K.S.; Kim, D.J.; Lee, J.M.; Kusakabe, T. Heterologous production and glycosylation of Japanese eel follitropin using silkworm. Biotechnol. Bioprocess Eng. 2019, 24, 745–753. [Google Scholar] [CrossRef]
- Kazeto, Y.; Kohara, M.; Miura, T.; Miura, C.; Yamaguchi, S.; Trant, J.M.; Adachi, S.; Yamaguchi, K. Japanese eel follicle-stimulating hormone (fsh) and luteinizing hormone (lh)): production of biologically active recombinant fsh and lh by Drosophila S2 cells and their differential actions on the reproductive biology. Biol. Reprod. 2008, 79, 938–946. [Google Scholar] [CrossRef] [PubMed]
- Kamei, H.; Ohira, T.; Yoshiura, Y.; Uchida, N.; Nagasawa, H.; Aida, K. Expression of a biologically active recombinant follicle stimulating hormone of Japanese eel Anguilla japonica using methylotropic yeast, Pichia pastoris. Gen. Comp. Endocrinol. 2003, 134, 244–254. [Google Scholar] [CrossRef] [PubMed]
- Ohta, T.; Miyake, H.; Miura, C.; Kamei, H.; Aida, K.; Miura, T. Follicle-stimulating hormone induces spermatogenesis mediated by androgen production in Japanese eel, Anguilla japonica. Biol. Reprod. 2007, 77, 970–977. [Google Scholar] [CrossRef] [PubMed]
- Byambaragchaa, M.; Kim, S.G.; Park, S.H.; Shin, M.G.; Kim, S.K.; Kang, M.H.; Min, K.S. Production of recombinant single-chain eel luteinizing hormone and follicle-stimulating hormone analogs in Chinese hamster ovary suspension cell culture. Curr. Issues Mol. Biol. 2024, 46, 542–556. [Google Scholar] [CrossRef] [PubMed]
- Byambaragchaa, M.; Park, A.; Gil, S.J.; Lee, H.W.; Ko, Y.J.; Choi, S.H.; Kang, M.H.; Min, K.S. Luteinizing hormone-like and follicle-stimulating hormone-like activities of equine chorionic gonadotropin β-subunit mutants in cells expressing rat luteinizing hormone/chorionic gonadotropin receptor and rat follicle-stimulating hormone receptor. Anim. Cells Syst. 2021, 25, 171–181. [Google Scholar] [CrossRef] [PubMed]
- Fares, F.; Suganuma, N.; Hishimori, K.; Lapolt, P.S.; Hsueh, A.J.W.; Boime, I. Design of a long-acting follitropin agonist by fusing the C-terminal sequence of the chorionic gonadotropin β subunit to the follitropin β subunit. Proc. Natl. Acad. Sci. USA 1992, 89, 4304–4308. [Google Scholar] [CrossRef] [PubMed]
- Furuhashi, M.; Shikone, T.; Fares, F.A.; Sugahara, T.; Hsueh, A.J.W.; Boime, I. Construction of gonadotropin analogs fusing the carboxylterminal peptide of the CGβ subunit to the common α-subunit: O-linked glycosylation and in vivo bioactivity of chimeric hCG. Mol. Endocrinol. 1995, 9, 54–63. [Google Scholar]
- Joshi, L.; Murata, Y.; Wondisford, F.E.; Szkudlinski, M.W.; Desai, R.; Weintraub, B.D. Recombinant thyrotropin containing a β-subunit chimera with the human chorionic gonadotropin-β carboxy terminal is biologically active with a prolonged plasma half-life: role of carbohydrate in bioactivity and metabolic clearance. Endocrinology 1994, 136, 3839–3848. [Google Scholar] [CrossRef] [PubMed]
- Sugahara, T.; Grootenhuis, P.D.J.; Sato, A.; Kudo, M.; Ben-Menahem, D.; Pixley, M.R.; Hsueh, A.J.W.; Boime, I. Expression of biological active fusion genes encoding the common α subunit and either the CGβ or FSHβ subunits: role of a linker sequence. Mol. Cell. Endocrinol. 1996, 125, 71–77. [Google Scholar] [CrossRef] [PubMed]
- Sugahara, T.; Sato, A.; Kudo, M.; Ben-Menahem, D.; Pixley, M.R.; Hsueh, A.J.W.; Boime, I. Expression of biological active fusion genes encoding the common α subunit and the follicle-stimulating hormone β subunits. J. Biol. Chem. 1996, 271, 10445–10448. [Google Scholar] [CrossRef] [PubMed]
- Fares, F.; Ganem, S.; Hajouj, T.; Agai, E. Development of a long-acting erythropoietin by fusing the carboxyl-terminal peptide of human chorionic gonadotropin β subunit to the coding sequence of human erythropoietin. Endocrinology 2007, 148, 5081–5087. [Google Scholar] [CrossRef] [PubMed]
- Fares, F.; Guy, R.; Bar-Ilan, A.; Felikman, Y.; Fima, E. Designing a long-acting human growth hormone (hGH) by fusing the carboxyl-terminal peptide of human chorionic gonadotropin β-subunit to the coding sequence of hGH. Endocrinology 2010, 151, 4410–4417. [Google Scholar] [CrossRef] [PubMed]
- Hershkovitz, O.; Bar-Ilan, A.; Guy, R.; Felikman, Y.; Moschcovich, L.; Hwa, V.; Rosenfeld, R.G.; Fima, E.; Hart, G. In vitro and in vivo characterization of MOD-4023, a long-acting carboxyl-terminal peptide (CTP)-modified human growth hormone. Mol. Pharmaceutics. 2016, 13, 631–639. [Google Scholar] [CrossRef] [PubMed]
- Strasburger, C.J.; Vanuga, P.; Payer, J.; Pfeifer, M.; Popovic, V.; Bajnok, L.; Goth, M.; Olsovska, V.; Trejbalova, L.; Vadasz, J.; Fima, E.; Koren, R.; Amitzi, L.; Bidlingmaier, M.; Hershkovitz, O.; Hart, G.; Biller, B.M.K. MOD-4023, a long-acting carboxyl-terminal peptide-modified human growth hormone: results of a Phase 2 study in growth hormone-deficient adults. European J. Endocrinol. 2017, 176, 283–294. [Google Scholar] [CrossRef] [PubMed]
- Zelinska, N.; Lotova, V.; Skorodok, J.; Maliesky, O.; Peterkova, V.; Samsonova, L.; Rosenfeld, R.G.; Zadik, Z.; Jaron-Mendelson, M.; Koren, R.; Amitzi, L.; Raduk, D.; Hershkovitz, O.; Hart, G. Long-acting C-terminal peptide-modified hGH (MOD-4023): results of a safety and dose-finding study in GHD children. J. Clin. Endocrinol. Metab. 2017, 102, 1578–1587. [Google Scholar] [CrossRef]
- Tao, Y.X.; Abell, A.N.; Liu, X.; Nakamura, K.; Segaloff, DL. Constitutive activation of G protein-coupled receptors as a result of selective substitution of a conserved leucine residue in transmembrane helix III. Mol. Endocrinol. 2000, 14, 1272–1282. [Google Scholar] [CrossRef] [PubMed]
- Bhaskaran, R.S.; Ascoli, M. The post-endocytotic fate of the gonadotropin receptors is an important determinant of the desensitization of gonadotropin responses. J. Mol. Endocrinol. 2005, 34, 447–457. [Google Scholar] [CrossRef]
- Martinelle, N.; Holst, M.; Soder, O.; Svechnikov, K. Extracellular signal-regulated kinases are involved in the acute activation of steroidogenesis in immature rat Leydig cells by human chorionic gonadotropin. Endocrinology 2004, 145, 4629–4639. [Google Scholar] [CrossRef] [PubMed]
- Tao, Y.X. Inactivation mutations of G protein-couped receptors and disease: Structure-function insights and therapeutic implications. Pharmacol. Ther. 2006, 111, 949–973. [Google Scholar] [CrossRef] [PubMed]
- Shiraishi, K.; Ascoli, M. Lutropin/choriogonadotropin stimulate the proliferation of primary cultures of rat Leydig cells through a pathway that involves activation of the extracellularly regulated kinase 1/2 cascade. Endocrinology 2007, 148, 3214–3225. [Google Scholar] [CrossRef] [PubMed]
- Shenoy, S.K.; Barak, L.S.; Xiao, K.; Ahn, S.; Berthouze, M.; Shukla, A.K.; Luttrell, L.M.; Lefkowitz, R.J. Ubiquitination of β-arrestin links seven-transmembrane receptor endocytosis and ERK activation. J. Biol. Chem. 2007, 282, 29549–29562. [Google Scholar] [CrossRef] [PubMed]
- Shenoy, S.K.; Draka, M.T.; Nelson, C.D.; Houtz, D.A.; Xiao, K.; Madabushi, S.; Reiter, E.; Premont, R.T.; Lichtarge, O.; Lefkowitz, R.J. β-arrestin-dependent, G protein-independent ERK1/2 activation by the β2 adrenergic receptor. J. Biol. Chem. 2006, 281, 1261–1273. [Google Scholar] [CrossRef] [PubMed]
- Slosky, L.M.; Bai, Y.; Toth, K.; Ray, C.; Rochelle, L.K.; Badea, A.; Chandrasekhar, R.; Pogorelov, V.M.; Abraham, D.M.; Atluri, N.; Peddibhotla, S.; Hedrick, M.P.; Hershberger, P.; Maloney, P.; Yuan, H.; Li, Z.; Wetsel, W.C.; Pinkerton, A.B.; Barak, L.S.; Caron, M.G. β-arrestin-biased allosteric modulated of NTSR1 selectively attenuates addictive behaviors. Cell 2020, 181, 1364–1379. [Google Scholar] [CrossRef]
- Kara, E.; Crepieux, P.; Gauthier, C.; Martinat, N.; Piketty, V.; Guillou, F.; Reiter, E. A phosphorylation cluster of five serine and threonine residues in the C-terminus of the follicle-stimulating hormone receptor is important for desensitization but not for β-arrestin-mediated ERK activation. Mol. Endocrinol. 2006, 20, 3014–3026. [Google Scholar] [CrossRef] [PubMed]
- Piketty, V.; Kara, E.; Guillou, F.; Reiter, E.; Crepiux. P. Follicle-stimulating hormone (FSH) activates extracellular signal-regulated kinase phosphorylation independently of beta-arrestin- and dynamin-mediated FSH receptor internalization. RBE. 2006, 4, 33.
- Banerjee, A.A.; Dupakuntla, M.; Pathak, B.R.; Mahale, S.D. FSH receptor-specific residues L501 and I505 in extracellular loop 2 are essential for its function. J. Mol. Endocrinol. 2015, 54, 193–204. [Google Scholar] [CrossRef] [PubMed]
- Banerjee, A.A.; Mahale, S.D. Extracellular loop 3 substitutions K589N and A590S in FSH receptor increase FSH-induced receptor internalization and along with S588T substitution exhibit impaired ERK1/2 phosphorylation. Arch. Biochem. Biophys. 2018, 659, 57–65. [Google Scholar] [CrossRef]
- Metta, M.K.; Kunaparaju, R.K.; Tantravaji, S. Rapid amplification system for recombinant protein production in Chinese hamster ovary (CHO) cells. Cell. Mol. Biol. 2016, 62, 101–106. [Google Scholar] [PubMed]
- Meta. A.; Hirashima, M.; Imamura, T.; Kawamura, R.; Yano, K.; Uehara, K.; Nakashima, T. High-yield preparation of recombinant human α-thrombin for therapeutic use. J. Biosci. Bioeng. 2015, 120, 432–437.
- Chin, C.L.; Chin, H.K.; Chin, C.S.H.; Lai, E.T.; Ng, S.K. Engineering selection stringency on expression vector for the production of recombinant human alpha 1-antitrypsin using Chinese hamster ovary cells. BMC Biotechnol. 2015, 15, 44. [Google Scholar] [CrossRef]
- Jazayeri, S.H.; Amiri-Yekta, A.; Gourabi, H.; Emami, B.A.; Halfinezhad, Z.; Abolghasemi, S.; Fatemi, N.; Daneshipour, A.; Ghahremani, M.H.; Sanati, M.H.; Khorramizadeh, M.R. Comparative assessment on the expression level of recombinant human follicle-stimulating hormone (FSH) in serum-containing versus protein-free culture media. Mol. Biotechnol. 2017, 59, 490–498. [Google Scholar] [CrossRef] [PubMed]
- Thennati, R.; Singh, S.K.; Nage, N.; Patel, Y.; Bose, S.K.; Burade, V.; Ranbhor, R.S. Analytical characterization of recombinant hCG and comparative studies with reference product. Biologics 2018, 12, 23–35. [Google Scholar] [CrossRef] [PubMed]
- Crispo, M.; Meikle, M.N.; Schlapp, G.; Menchaca, A. Ovarian superstimulatory response and embryo development using a new glycoprotein with eCG-like activity in mice. Theriogenology 2021, 164, 31–35. [Google Scholar] [CrossRef] [PubMed]
- Rodriguez, M.C.; Mussio, P.E.; Villarraza, J.; Tardivo, M.B.; Antuna, S.; Fontana, D.; Ceaglio, N.; Prieto, C. Physiochemical characterization of a recombinant eCG and comparative studies with PMSG commercial preparations. The Protein J, 2023, 42, 24–36.
- Kamei, H.; Kawazoe, I.; Kanekko, T.; Aida, K. Purification of follicle-stimulating hormone from immature Japanese eel Anguilla japonica, and its biochemical properties and steroidogenic activities. Gen. Comp. Endocrinol. 2005. 143, 257–256. [CrossRef]
- Fares, F.; Yamada, S.; Ben-Menahem, D.; Pixley, M.; Hsueh, A.J.W.; Boime, I. Conversion of thyrotropin heterodimer to a biologically active single-chain. Endocrinology 1998, 139, 2459–2468. [Google Scholar] [CrossRef]
- Kramer, W.G.; Jaron-Mendelson, M.; Koren, R.; Hershkovitz, O.; Hart, G. Pharmacokinetics, pharmacodynamics, and safety of a long-acting human growth hormone (MOD-4023) in healthy Japanese and Caucasian adults. Clin. Pharmacol. Drug Dev. 2018, 7, 554–563. [Google Scholar] [CrossRef] [PubMed]
- Matzuk, M.M.; Hsueh, A.J.; Lapolt, P.; Tsafriri, A.; Keene, J.L.; Boime, I. The biological role of the carboxyl-terminal extension of human chorionic gonadotropin beta-subunit. Endocrinology 1990, 126, 376–383. [Google Scholar] [CrossRef] [PubMed]
- Lefkowitz, R.J.; Shenoy, S.K. Transduction of receptor signals by β-arrestins. Science 2005, 308, 512–517. [Google Scholar] [CrossRef] [PubMed]
- Reiter, E.; Lefkowitz, R.J. GRKs and β-arrestins: roles in receptor silencing, trafficking and signaling. Trends Endocrinol. Metab. 2006, 17, 159–165. [Google Scholar] [CrossRef] [PubMed]
- Ascoli, M. Potential Leydig cell mitogenic signals generated by the wild-type and constitutively active mutants of the lutropin/choriogonadotropin receptor (LHR). Mol. Cell. Endocrinol. 2007, 260-262, 244–248.
- Shiraishi, K.; Ascoli, M. A co-coculture system reveals the involvement of intercellular pathways as mediators of the lutropin receptor (LHR)-stimulated ERK1/2 phosphorylation in Leydig cells. Exp. Cell Res. 2008, 314, 25–37. [Google Scholar] [CrossRef] [PubMed]
- Ren, X.R.; Reiter, E.; Ahn, S.; Kim, J.; Chen, W.; Lefkowitz, R.J. Different G protein-coupled receptor kinases govern G protein and β-arrestin-mediated signaling of V2 vasopressin receptor. Proc. Natl. Acad. Sci. USA 2005, 102, 1448–1453. [Google Scholar] [CrossRef] [PubMed]
- Gesty-Palmer, D.; Chen, M.; Reiter, E.; Ahn, S.; Nelson, C.D.; Wang, S.; Eckhardt, A.E.; Cowan, C.L.; Spurney, R.F.; Luttrell, L.M.; Lefkowitz, R.J. Distinct β-arrestin- and G protein-dependent pathways for parathyroid hormone receptor-mediated ERK1/2 activation. J. Biol. Chem. 2006, 281, 10856–10864. [Google Scholar] [CrossRef] [PubMed]
- Moller, T.C.; Pedersen, M.F.; van Senten, J.R.; Seiersen, S.D.; Mathiesen, J.M.; Bouvier, M.; Brauner-Osborne, H. Dissecting the roles of GRK2 and GRK3 in mu-opioid receptor internalization and β-arrestin2 recruitment using CRISPR/Cas9-edited HEK293 cells. Sci. Rep. 2020, 10, 173955. [Google Scholar] [CrossRef] [PubMed]
- Jones, B.; McGlone, E.R.; Fang, Z.; Pickford, P.; Correa, I.R.Jr.; Oishi, A.; Jockers, R.; Inoue, A.; Kumar, S.; Gorlitz, F.; Dunsby, C.; French, P.M.W.; Rutter, G.A.; Tan, T.; Bloom, S.R. Genetic and biased agonist-mediated reductions in β-arrestin recruitment prolong cAMP signaling at glucagon family receptors. J. Biol. Chem. 2021, 296, 100133. [Google Scholar] [CrossRef] [PubMed]
- Ahn, S.; Shenoy, K.K.; Wei, H.; Lefkowitz, R.J. Differential kinetic and spatial patterns of β-arrestin and G protein mediated ERK activation by the angiotensin II receptor. J. Biol. Chem. 2004, 279, 35518–35525. [Google Scholar] [CrossRef] [PubMed]
Figure 1.
Schematic of rec-eel LH-wt and eel LH-M. The tethered form of eel LH β/α-wt was engineered to contain the β-subunit and common α-subunit sequences. The eCG β-subunit carboxyl-terminal peptide linker was inserted between the β-subunit and α-subunit in the eel LH-M mutant using polymerase chain reaction. The eCG β-subunit CTP linker has 35 amino acids (115–149aa) and approximately 12 O-linked oligosaccharide sites. The numbers indicate the amino acids of the mature protein, except for the signal sequences. The encircled “N” denotes N-linked glycosylation sites at the eel LH β- and LH α-subunits, respectively. Green, FSH β; blue, α-subunit; and skyblue, eCG β-subunit CTP linker. eCTP β (115–149) represents the amino acid sequences of the eCG β-subunit CTP linker. Red in the eCTP β (115–149) denotes potential O-linked oligosaccharide sites.
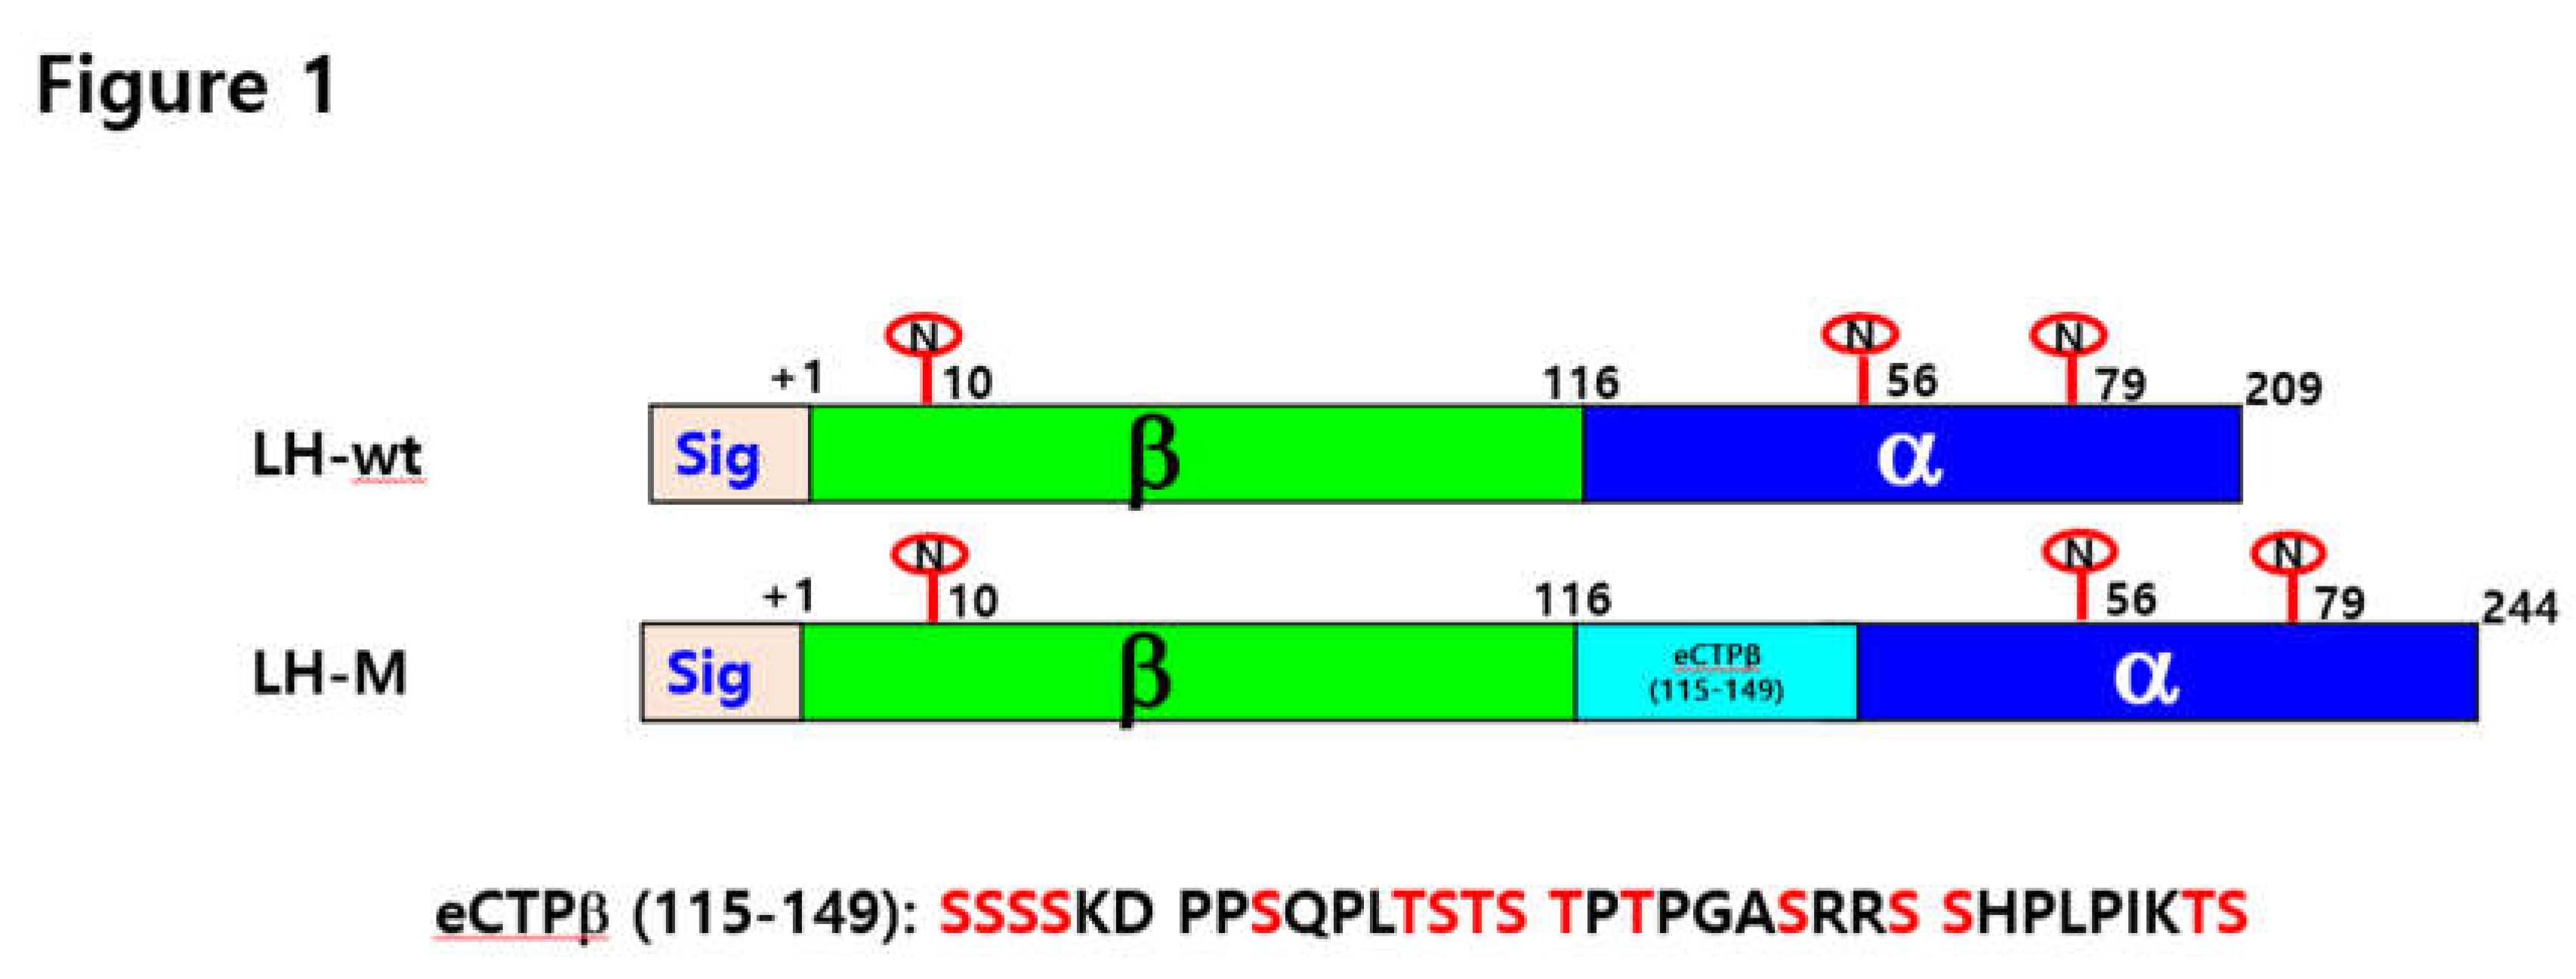
Figure 2.
Quantity of rec-eel LH-wt secreted from CHO DG44 cells based on the day of culture. Supernatant was collected on days 0, 1, 3, 5, 9, and 11 of culture. The expression levels of the rec-eel LH-wt protein was analyzed using a sandwich enzyme-linked immunosorbent assay, as described in the Methods section. Data for five clones are presented as representatives. Values are expressed as mean ± standard error of mean of at least three independent experiments.
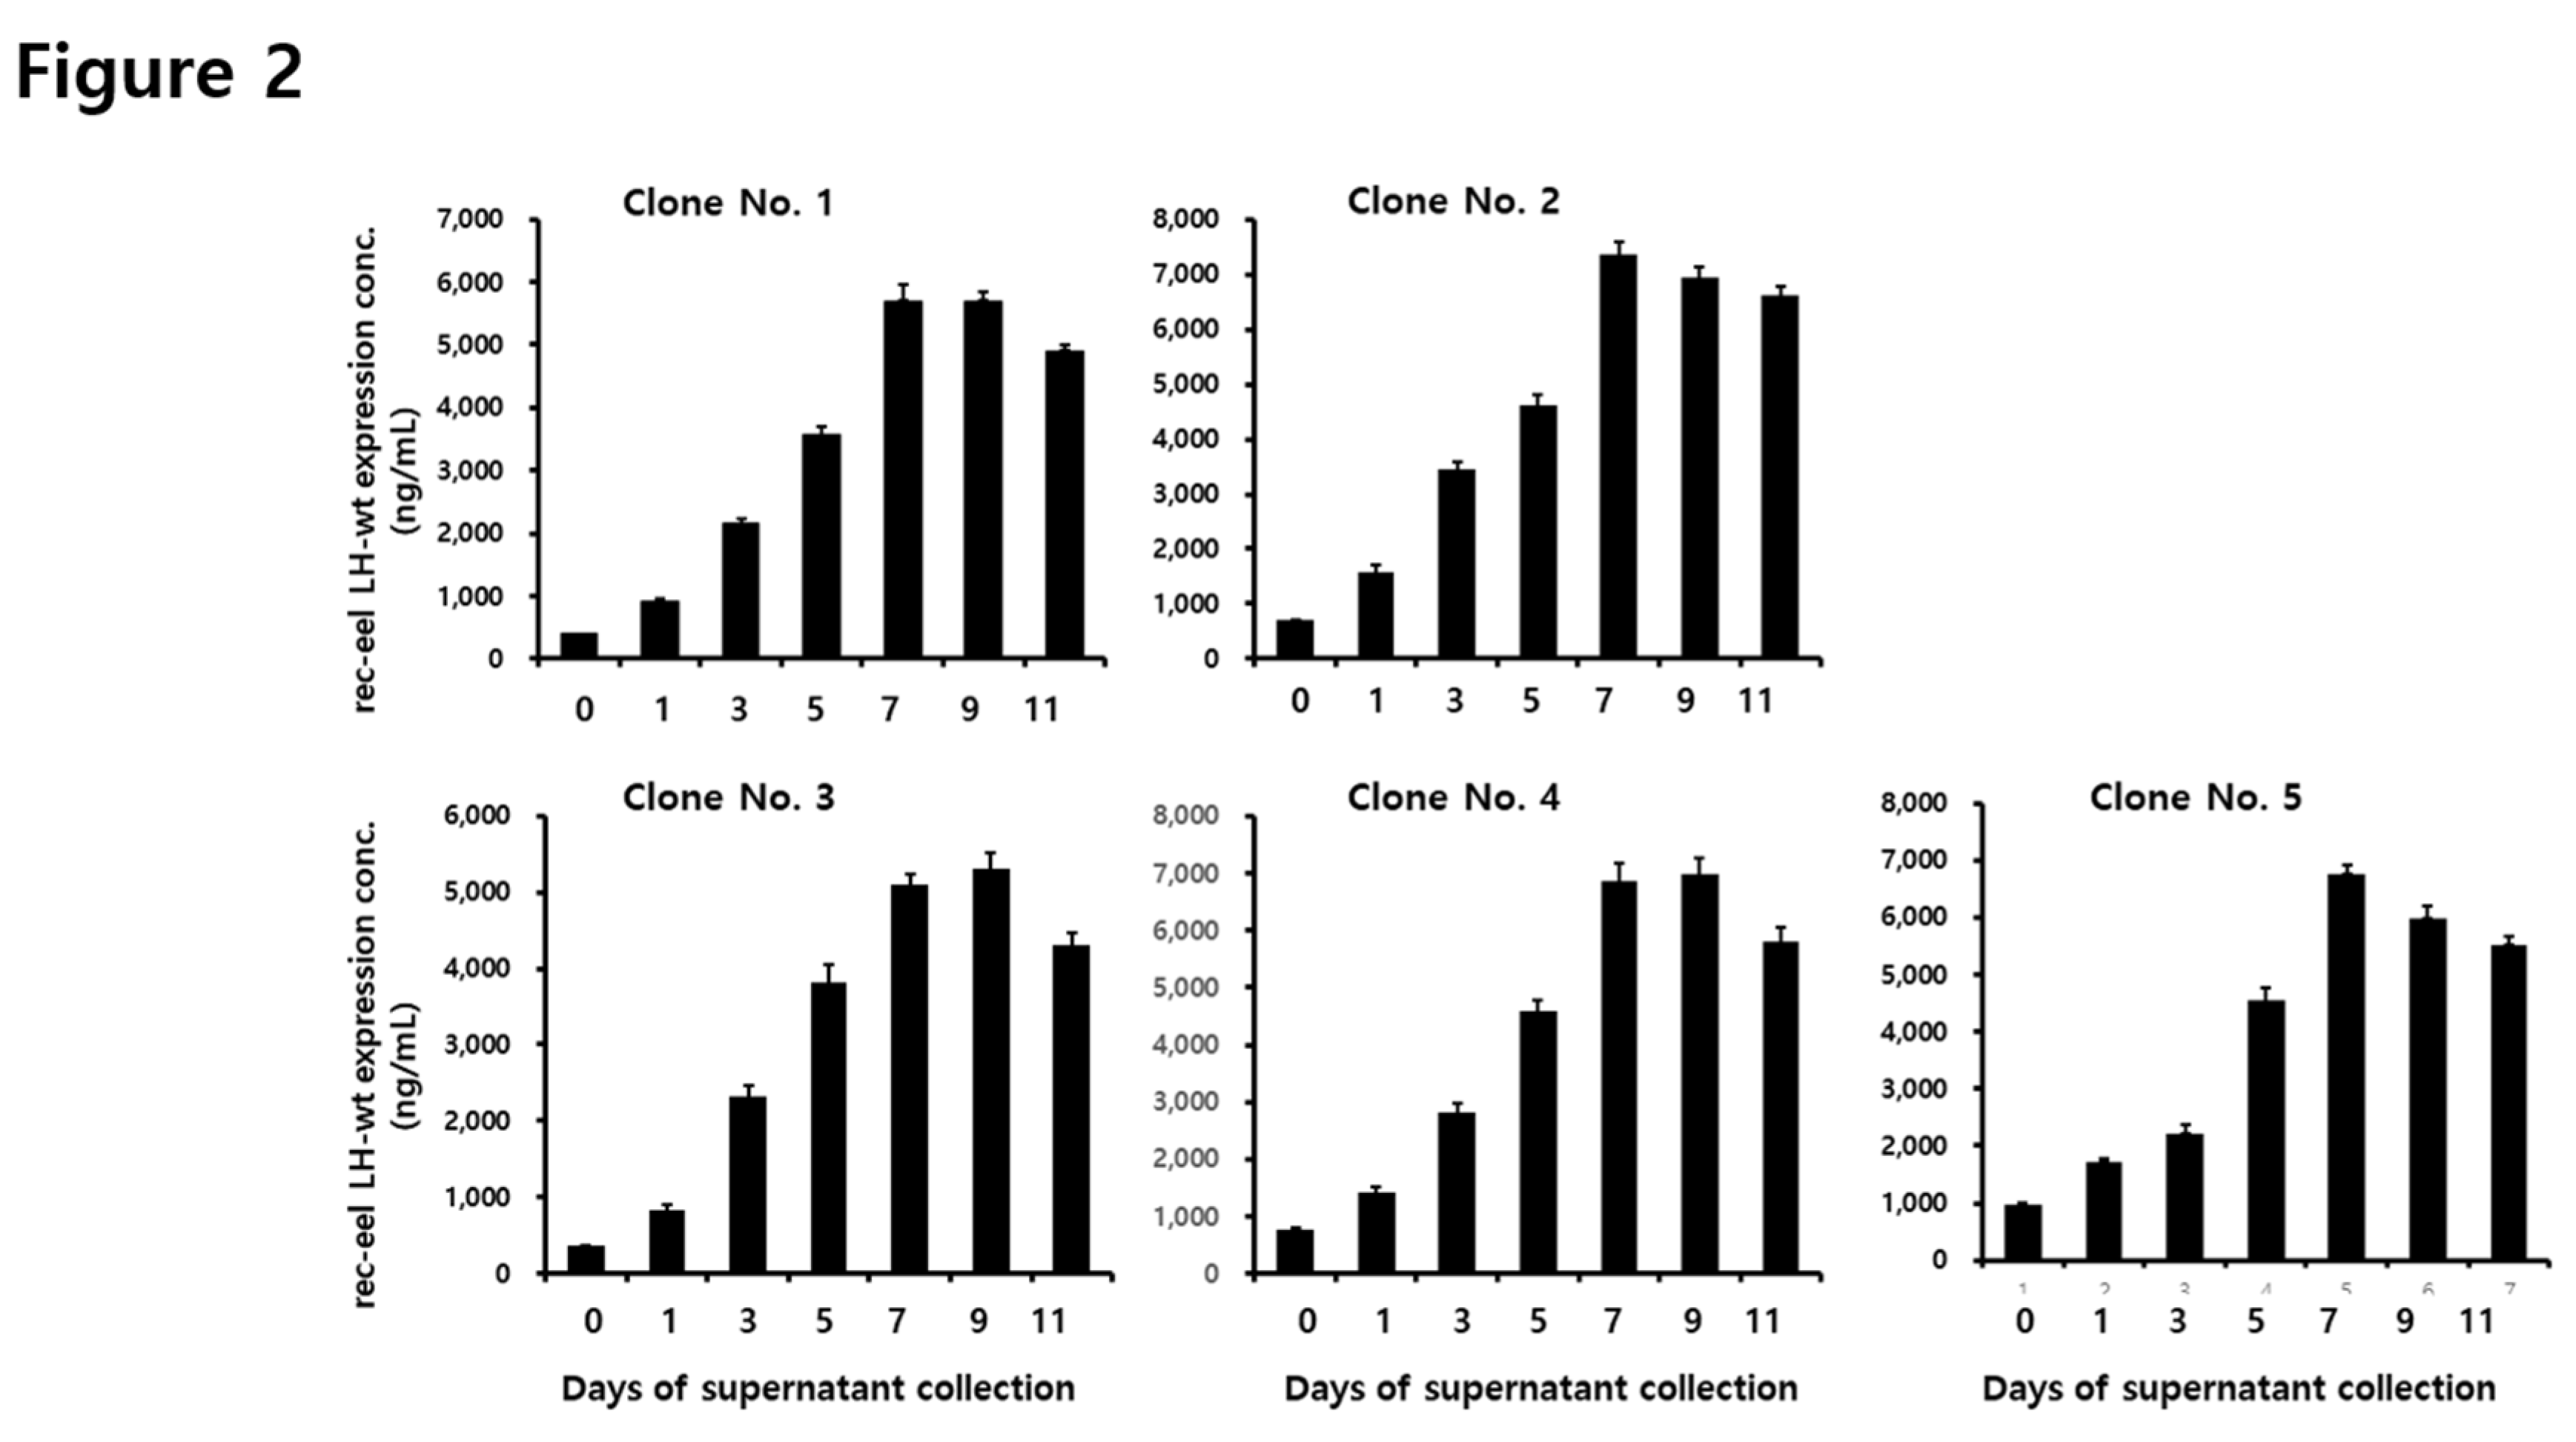
Figure 3.
Western blot analysis of the rec-eel LH-wt proteins produced from single cells. Supernatants from the 5 colonies were collected on the day of cultivation. Five colonies (eel LH-wt 1 to LH-wt 5) were selected and 20 μL of supernatant was used for sodium dodecyl sulfate-polyacrylamide gel electrophoresis. The proteins were then blotted onto a membrane and detected using a monoclonal antibody (anti-eel α-subunit) and HRP-conjugated goat anti-mouse IgG antibodies.
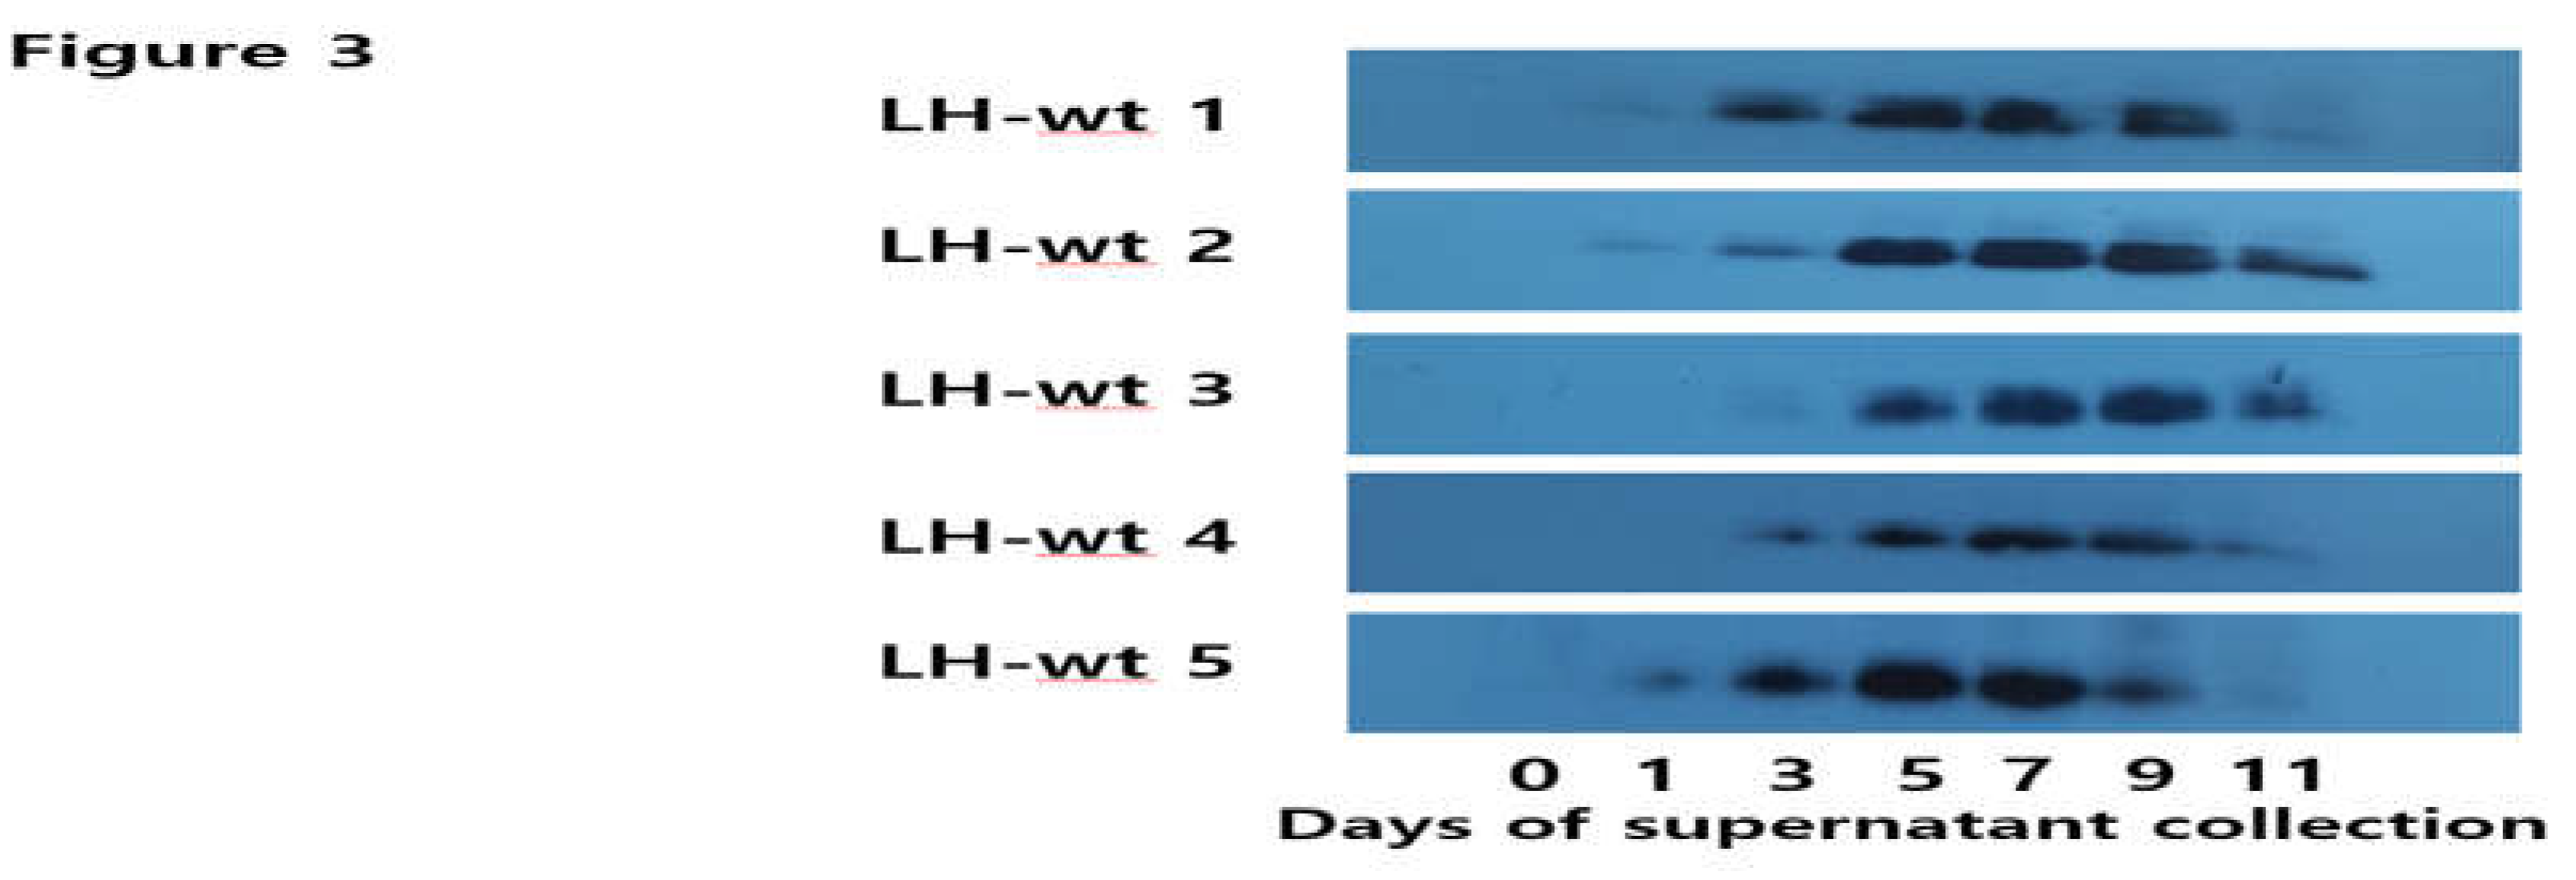
Figure 4.
Quantity of the rec-eel LH-M proteins secreted from CHO-DG44 cells on the day of culture. Supernatants were collected on days 0, 1, 3, 5, 7, and 9 post-cultivation. Nine clones were isolated, and their expression levels were determined in a time-dependent manner. The expression level was analyzed using a sandwich enzyme-linked immunosorbent assay, as described in the Methods section. Values are expressed as mean ± standard error of mean of at least three independent experiments.
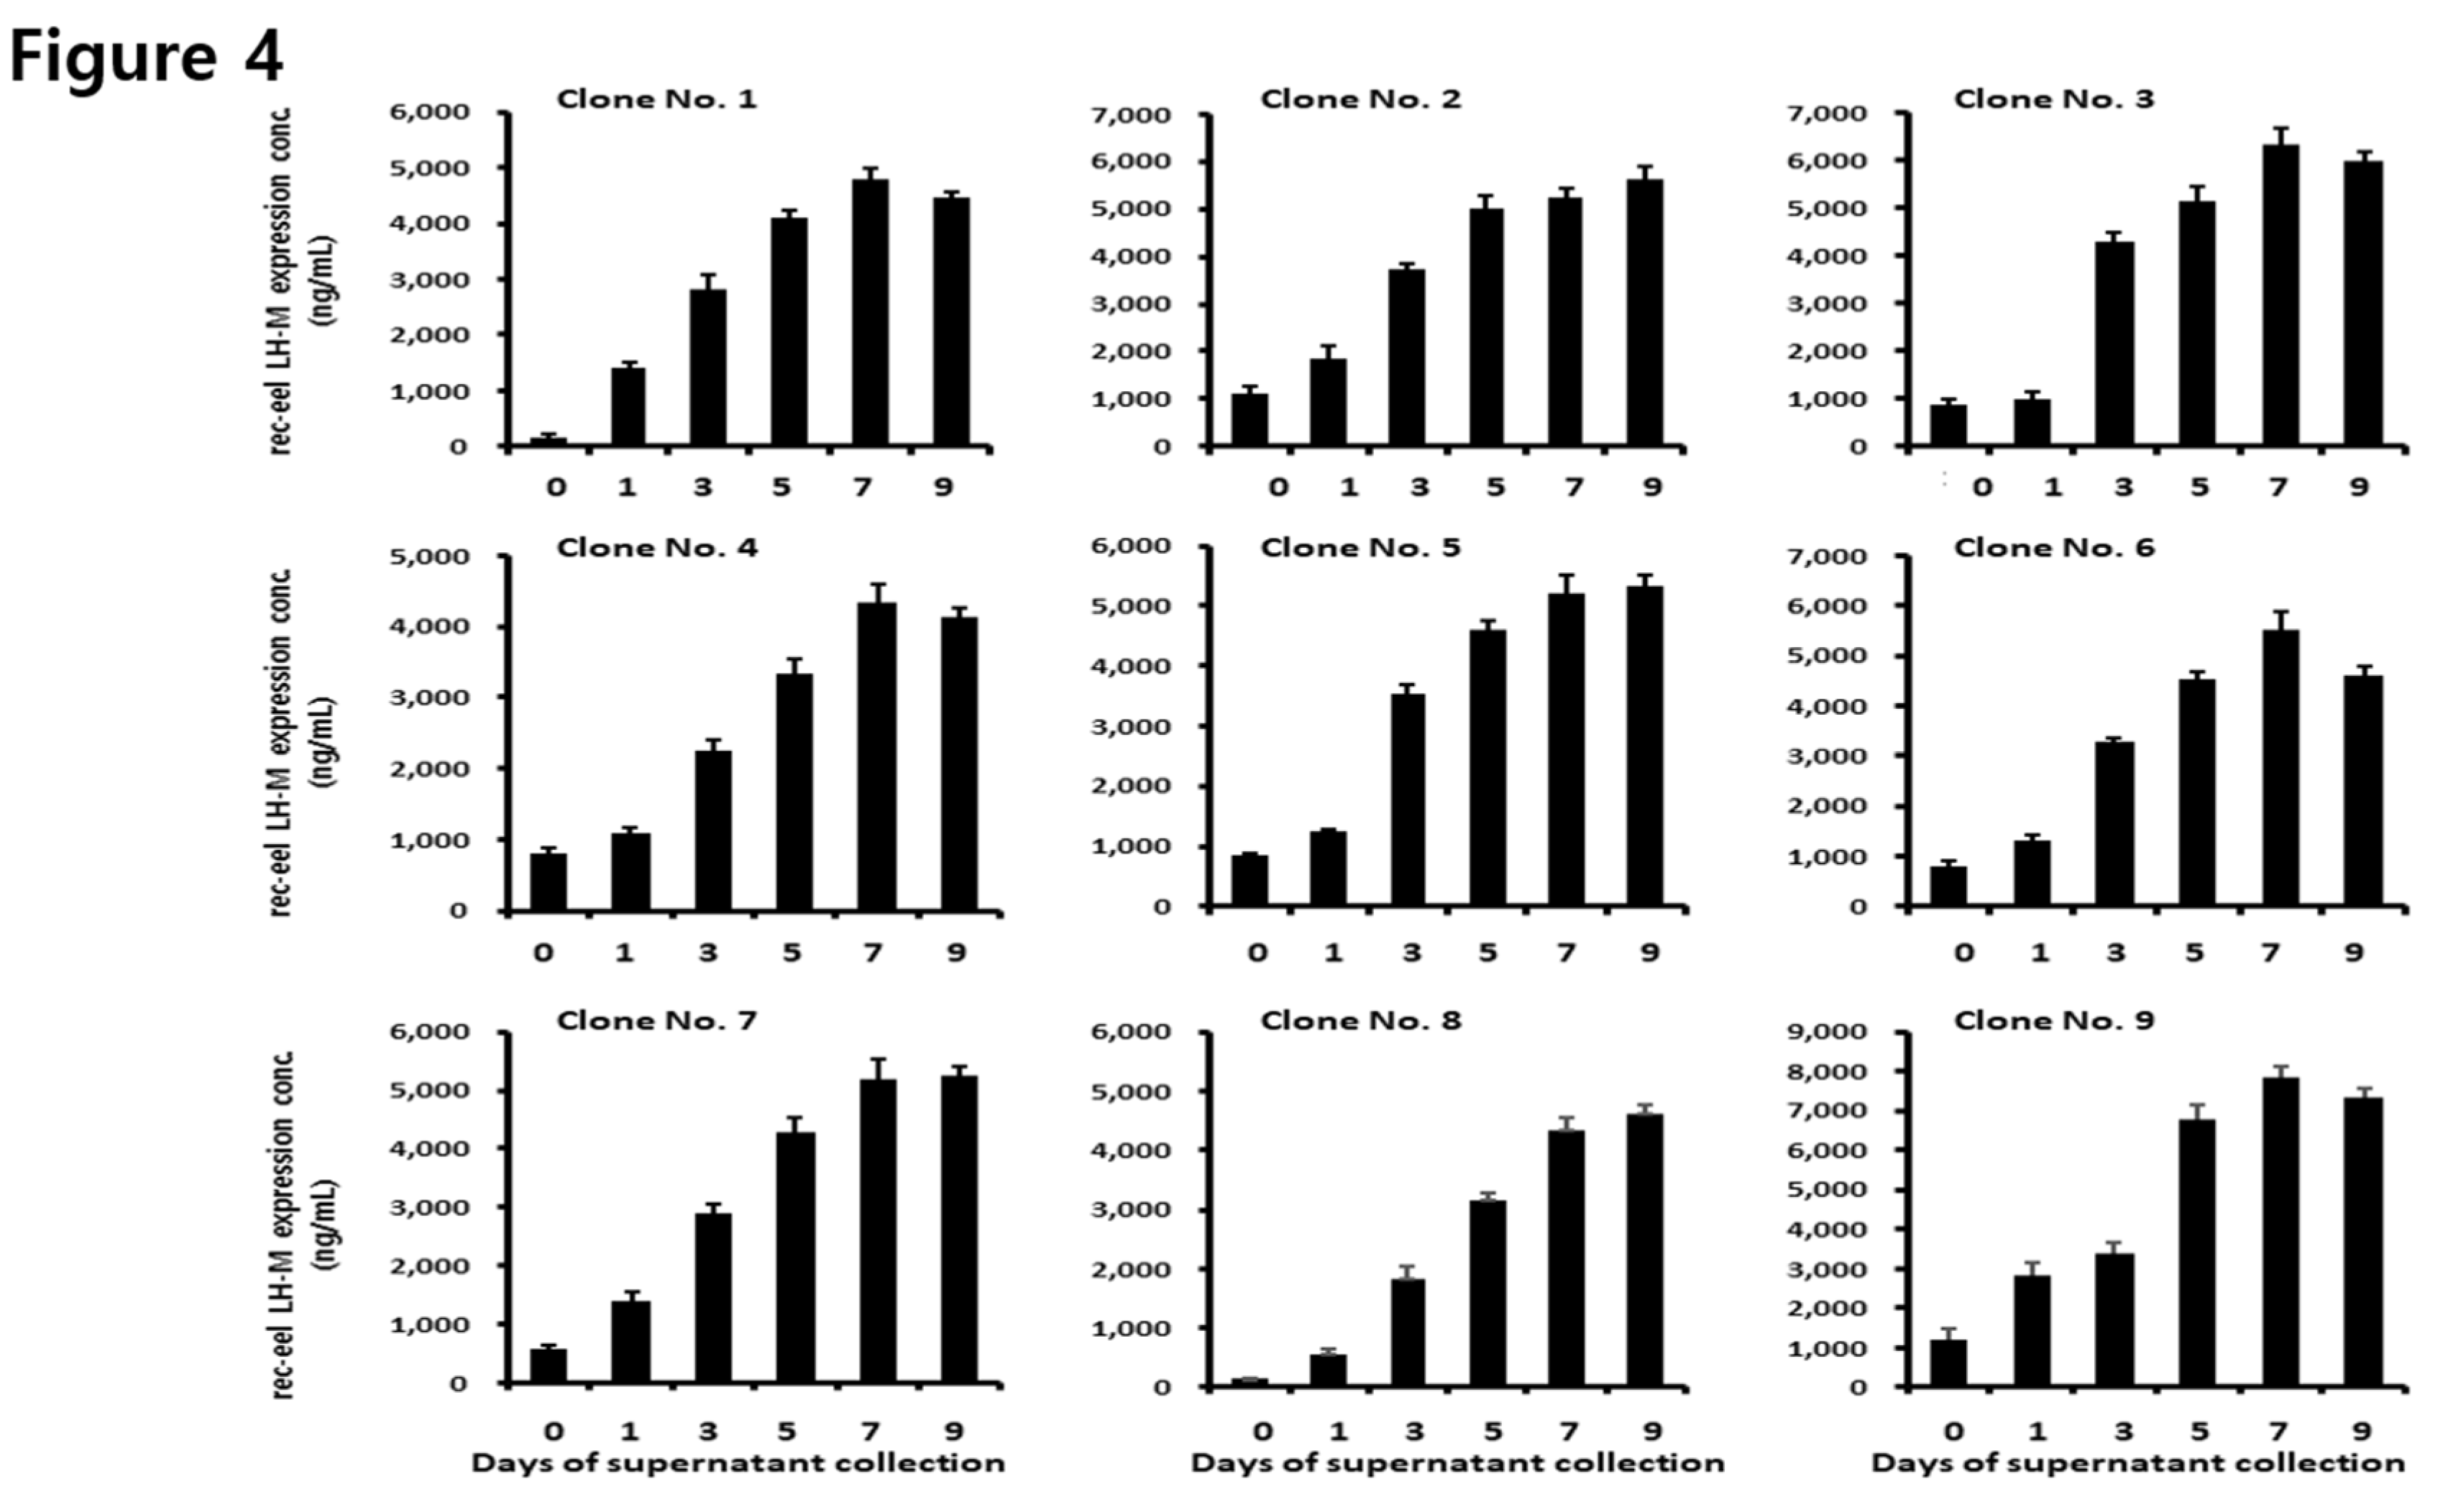
Figure 5.
Western blot analysis of the rec-eel LH-M proteins produced from monoclonal cells. Supernatants from nine colonies were collected on the day of cultivation. The samples were prepared for sodium dodecyl sulfate-polyacrylamide gel electrophoresis and membranes were detected using specific monoclonal antibodies (anti-eel α-subunit). (A) 20 μL of sample collected on day 9 was loaded into the wells. Two specific bands were detected in all samples. (B) Two colonies (eel LH-M 3 and LH-M 9) were selected for western blot analysis and 20 μL of the supernatant collected on the day of culture was used for western blot analysis.
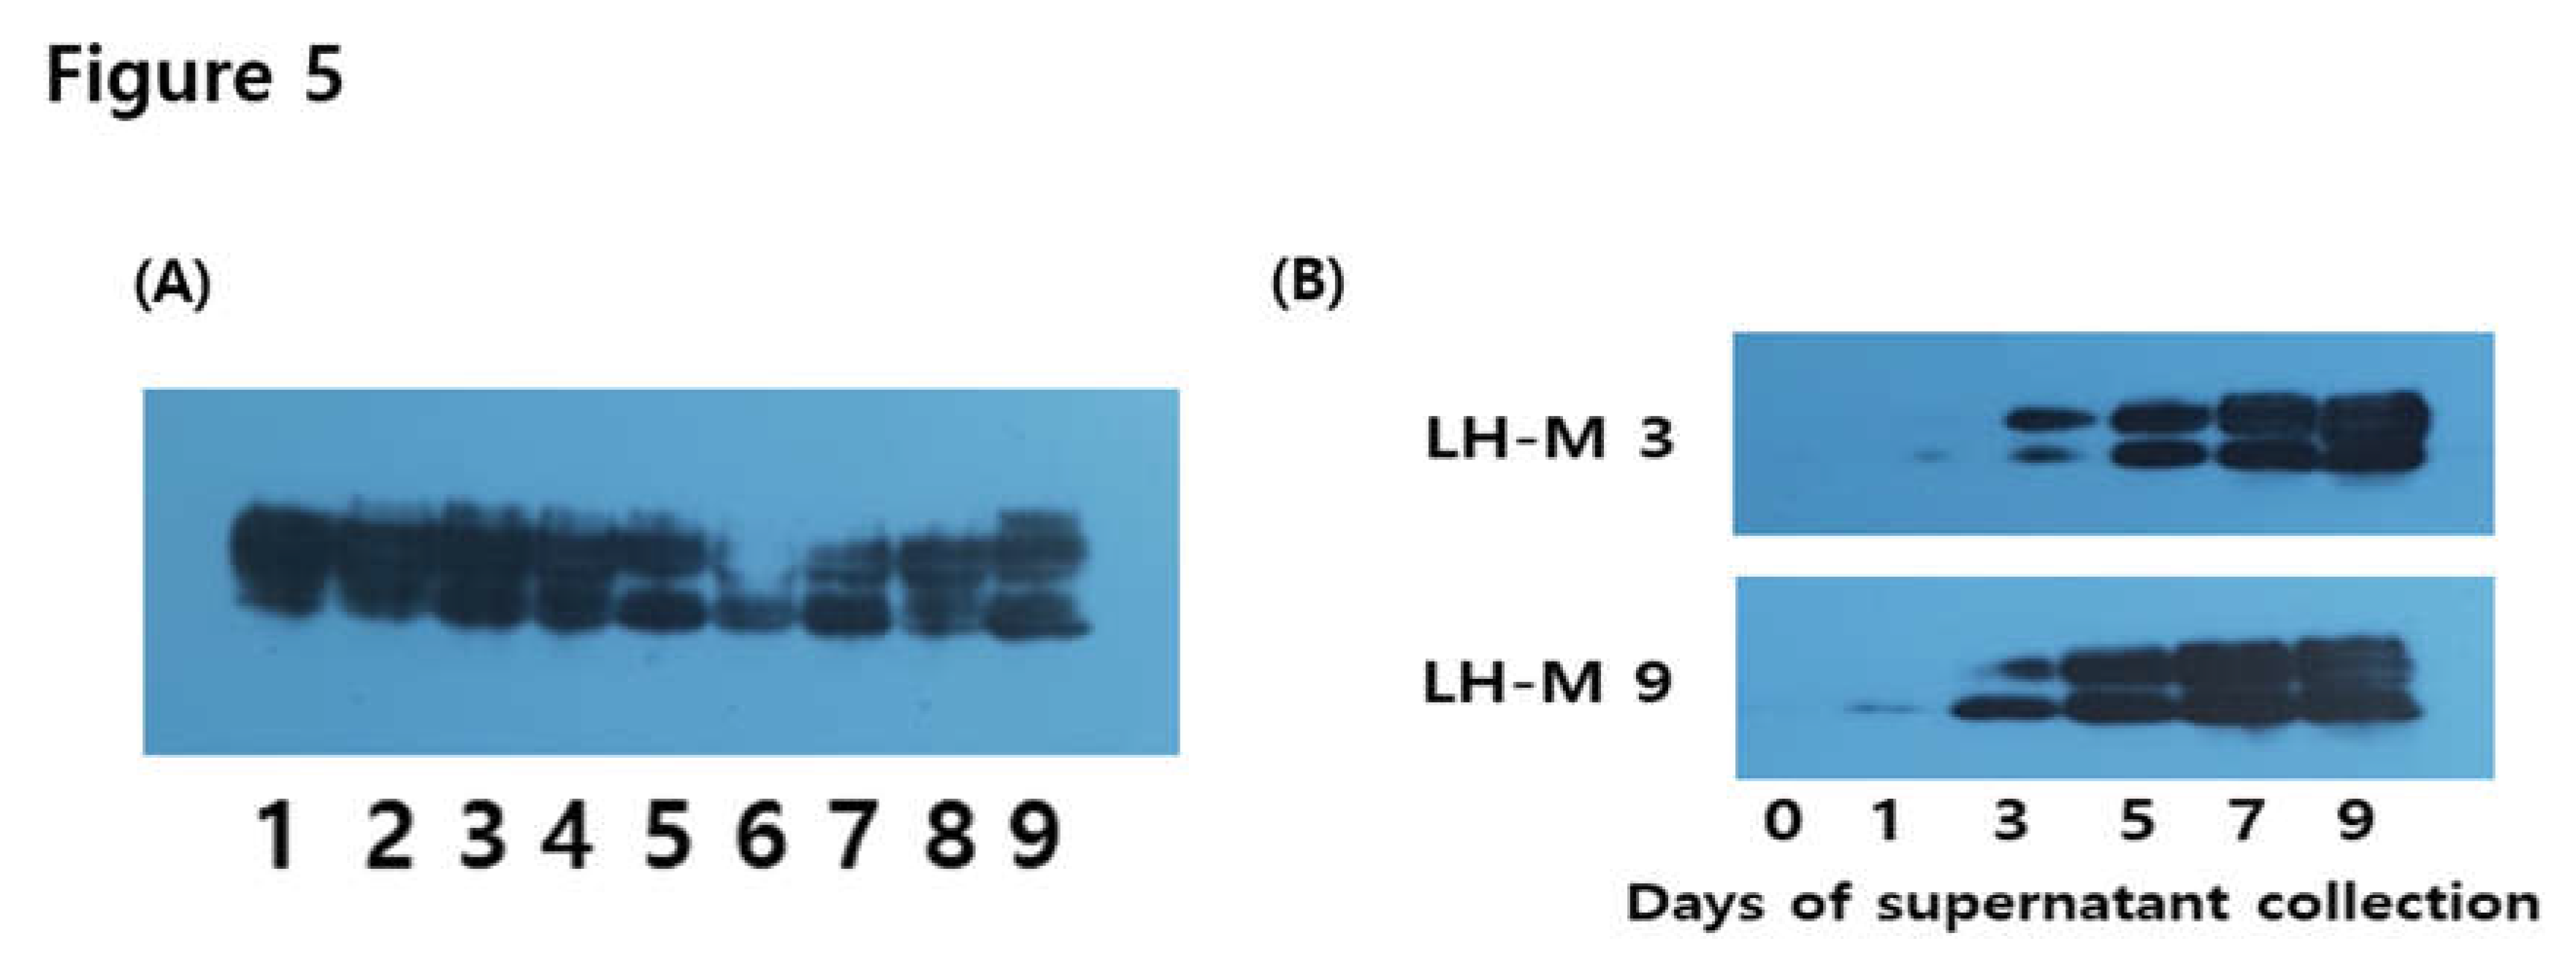
Figure 6.
Deglycosylation of the eel LH-wt and LH-M proteins. The proteins from eel LH-wt, LH-M 3, and LH-M 9 were treated with peptide-N-glycanase F to remove N-linked oligosaccharides and western blot analysis was performed. The molecular weights of the rec-eel LH-wt and LH-M proteins decreased by approximately 8–10 kDa.
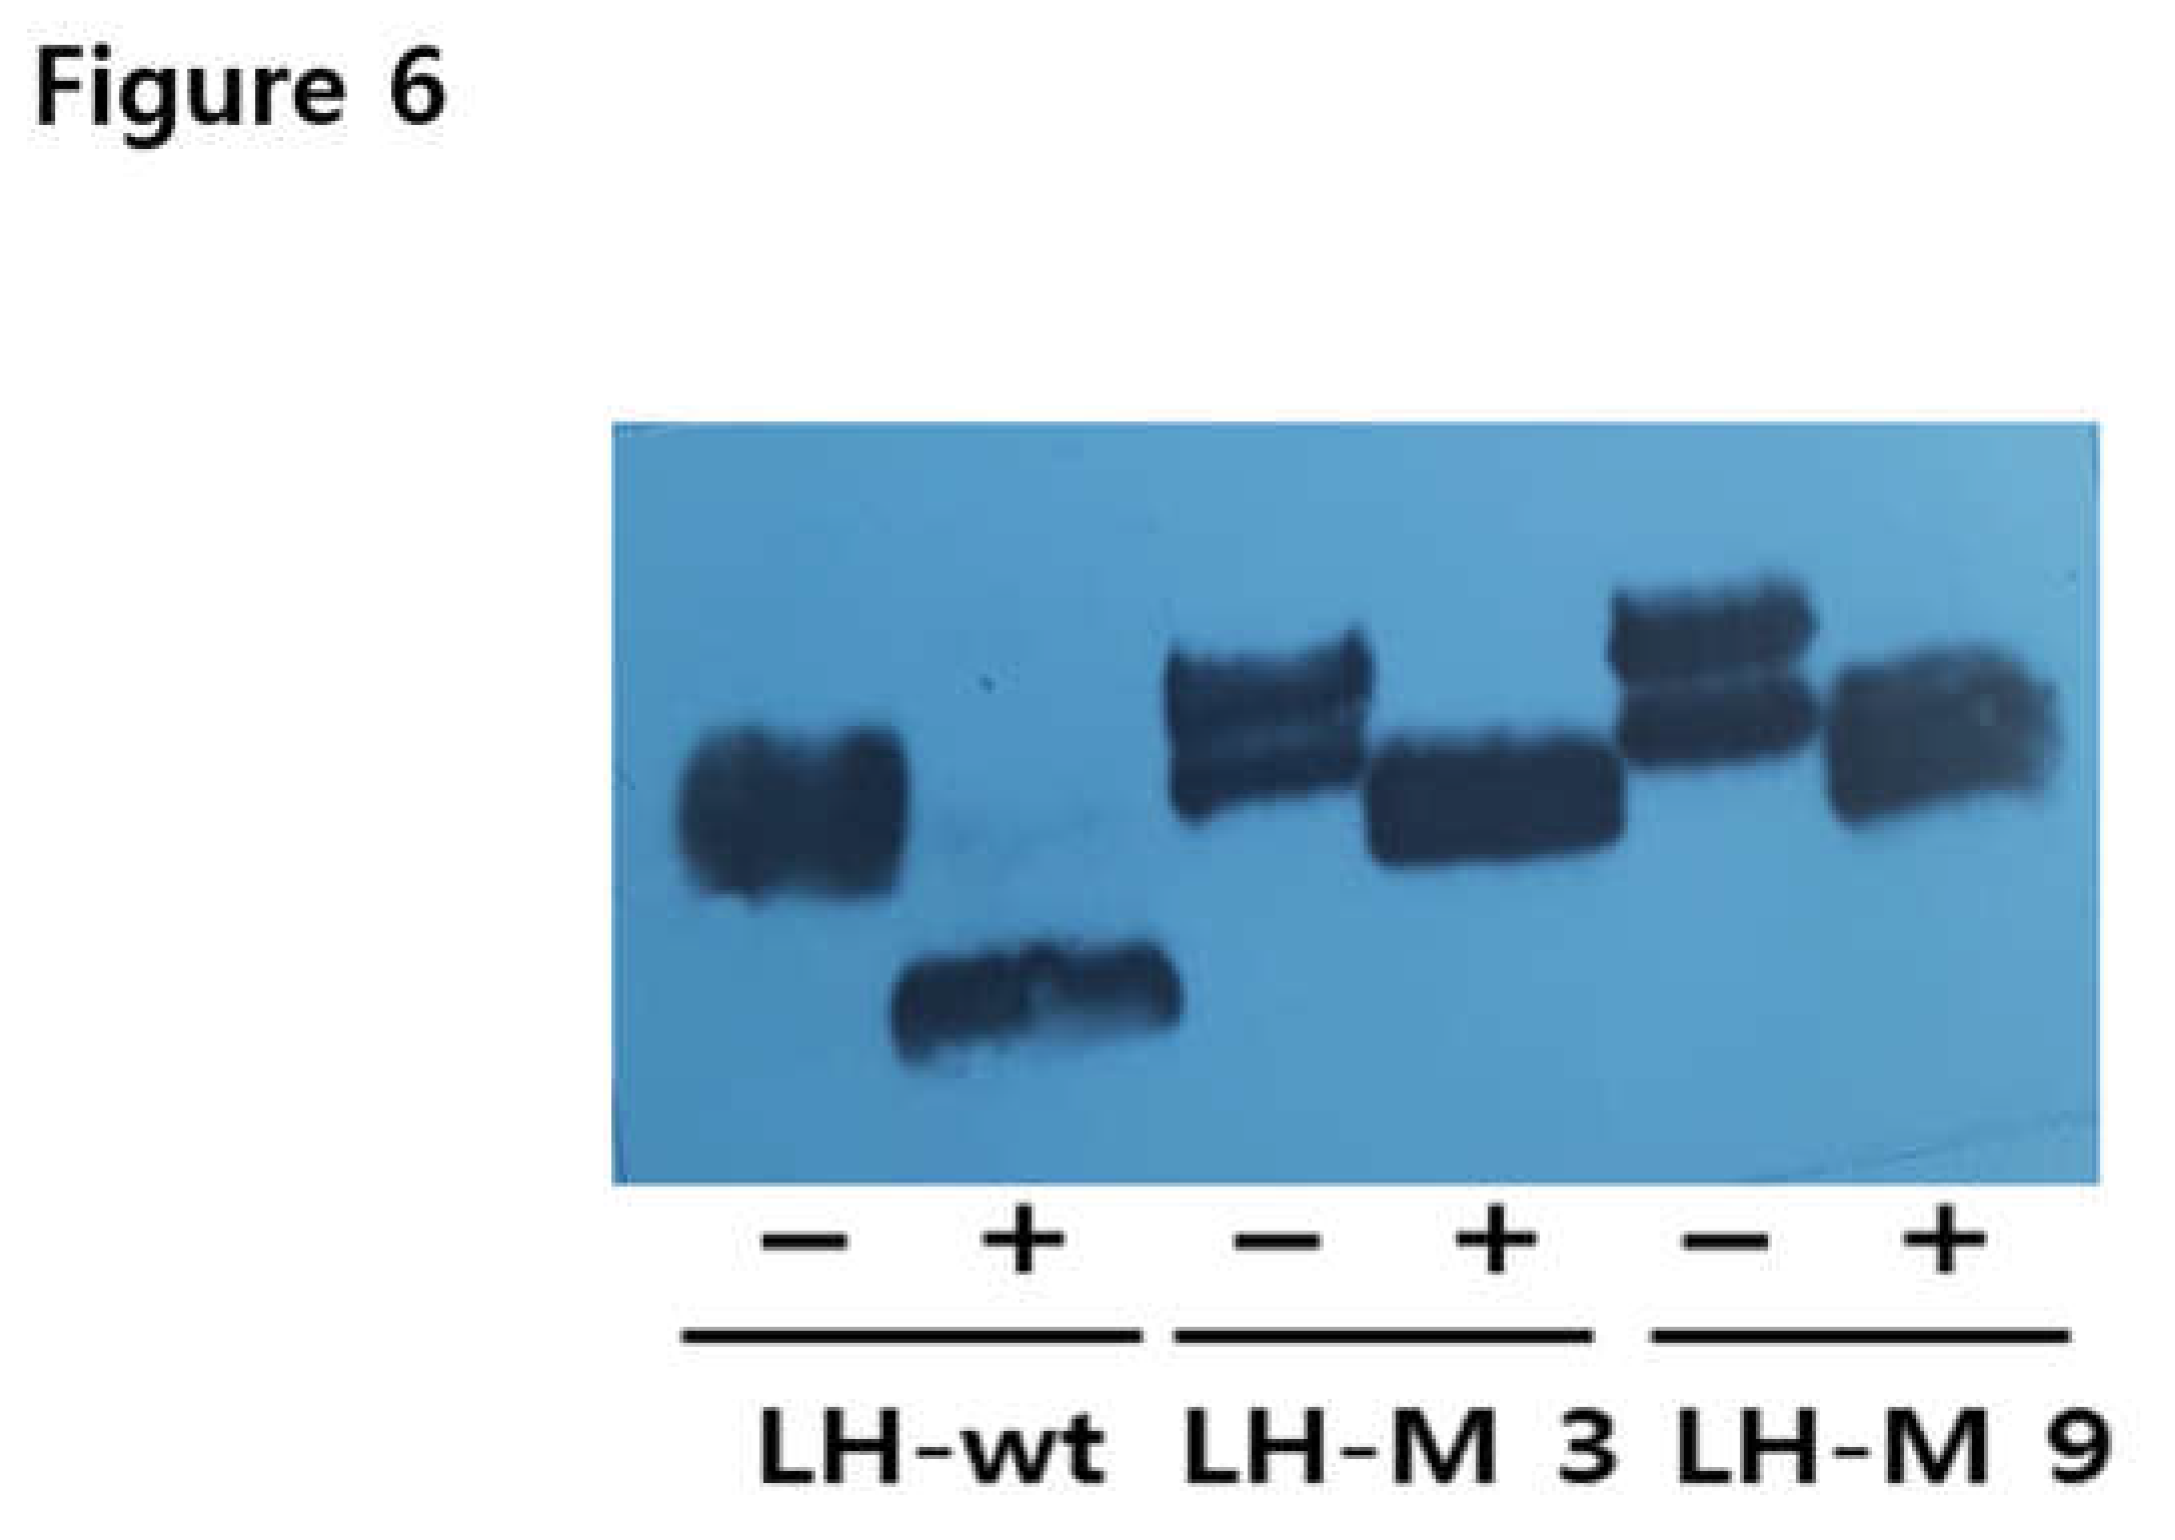
Figure 7.
Effect of the rec-eel LH-wt and LH-M proteins on cyclic adenine monophosphate (cAMP) production in cells expressing the eel luteinizing hormone receptor. CHO-K1 cells transiently transfected with eel LHR were seeded in 384-well plates (10,000 cells/well) at 24 h post-transfection. The cells were activated with the rec-eel LH-wt and LH-M proteins for 30 min at room temperature. cAMP production was detected using a homogeneous time-resolved fluorescence assay and presented as Delta F%. cAMP concentrations were calculated using GraphPad Prism software. Each data point represents mean ± standard error of mean of triplicate experiments. The mean data were fitted to an equation to derive a single-phase exponential decay curve.
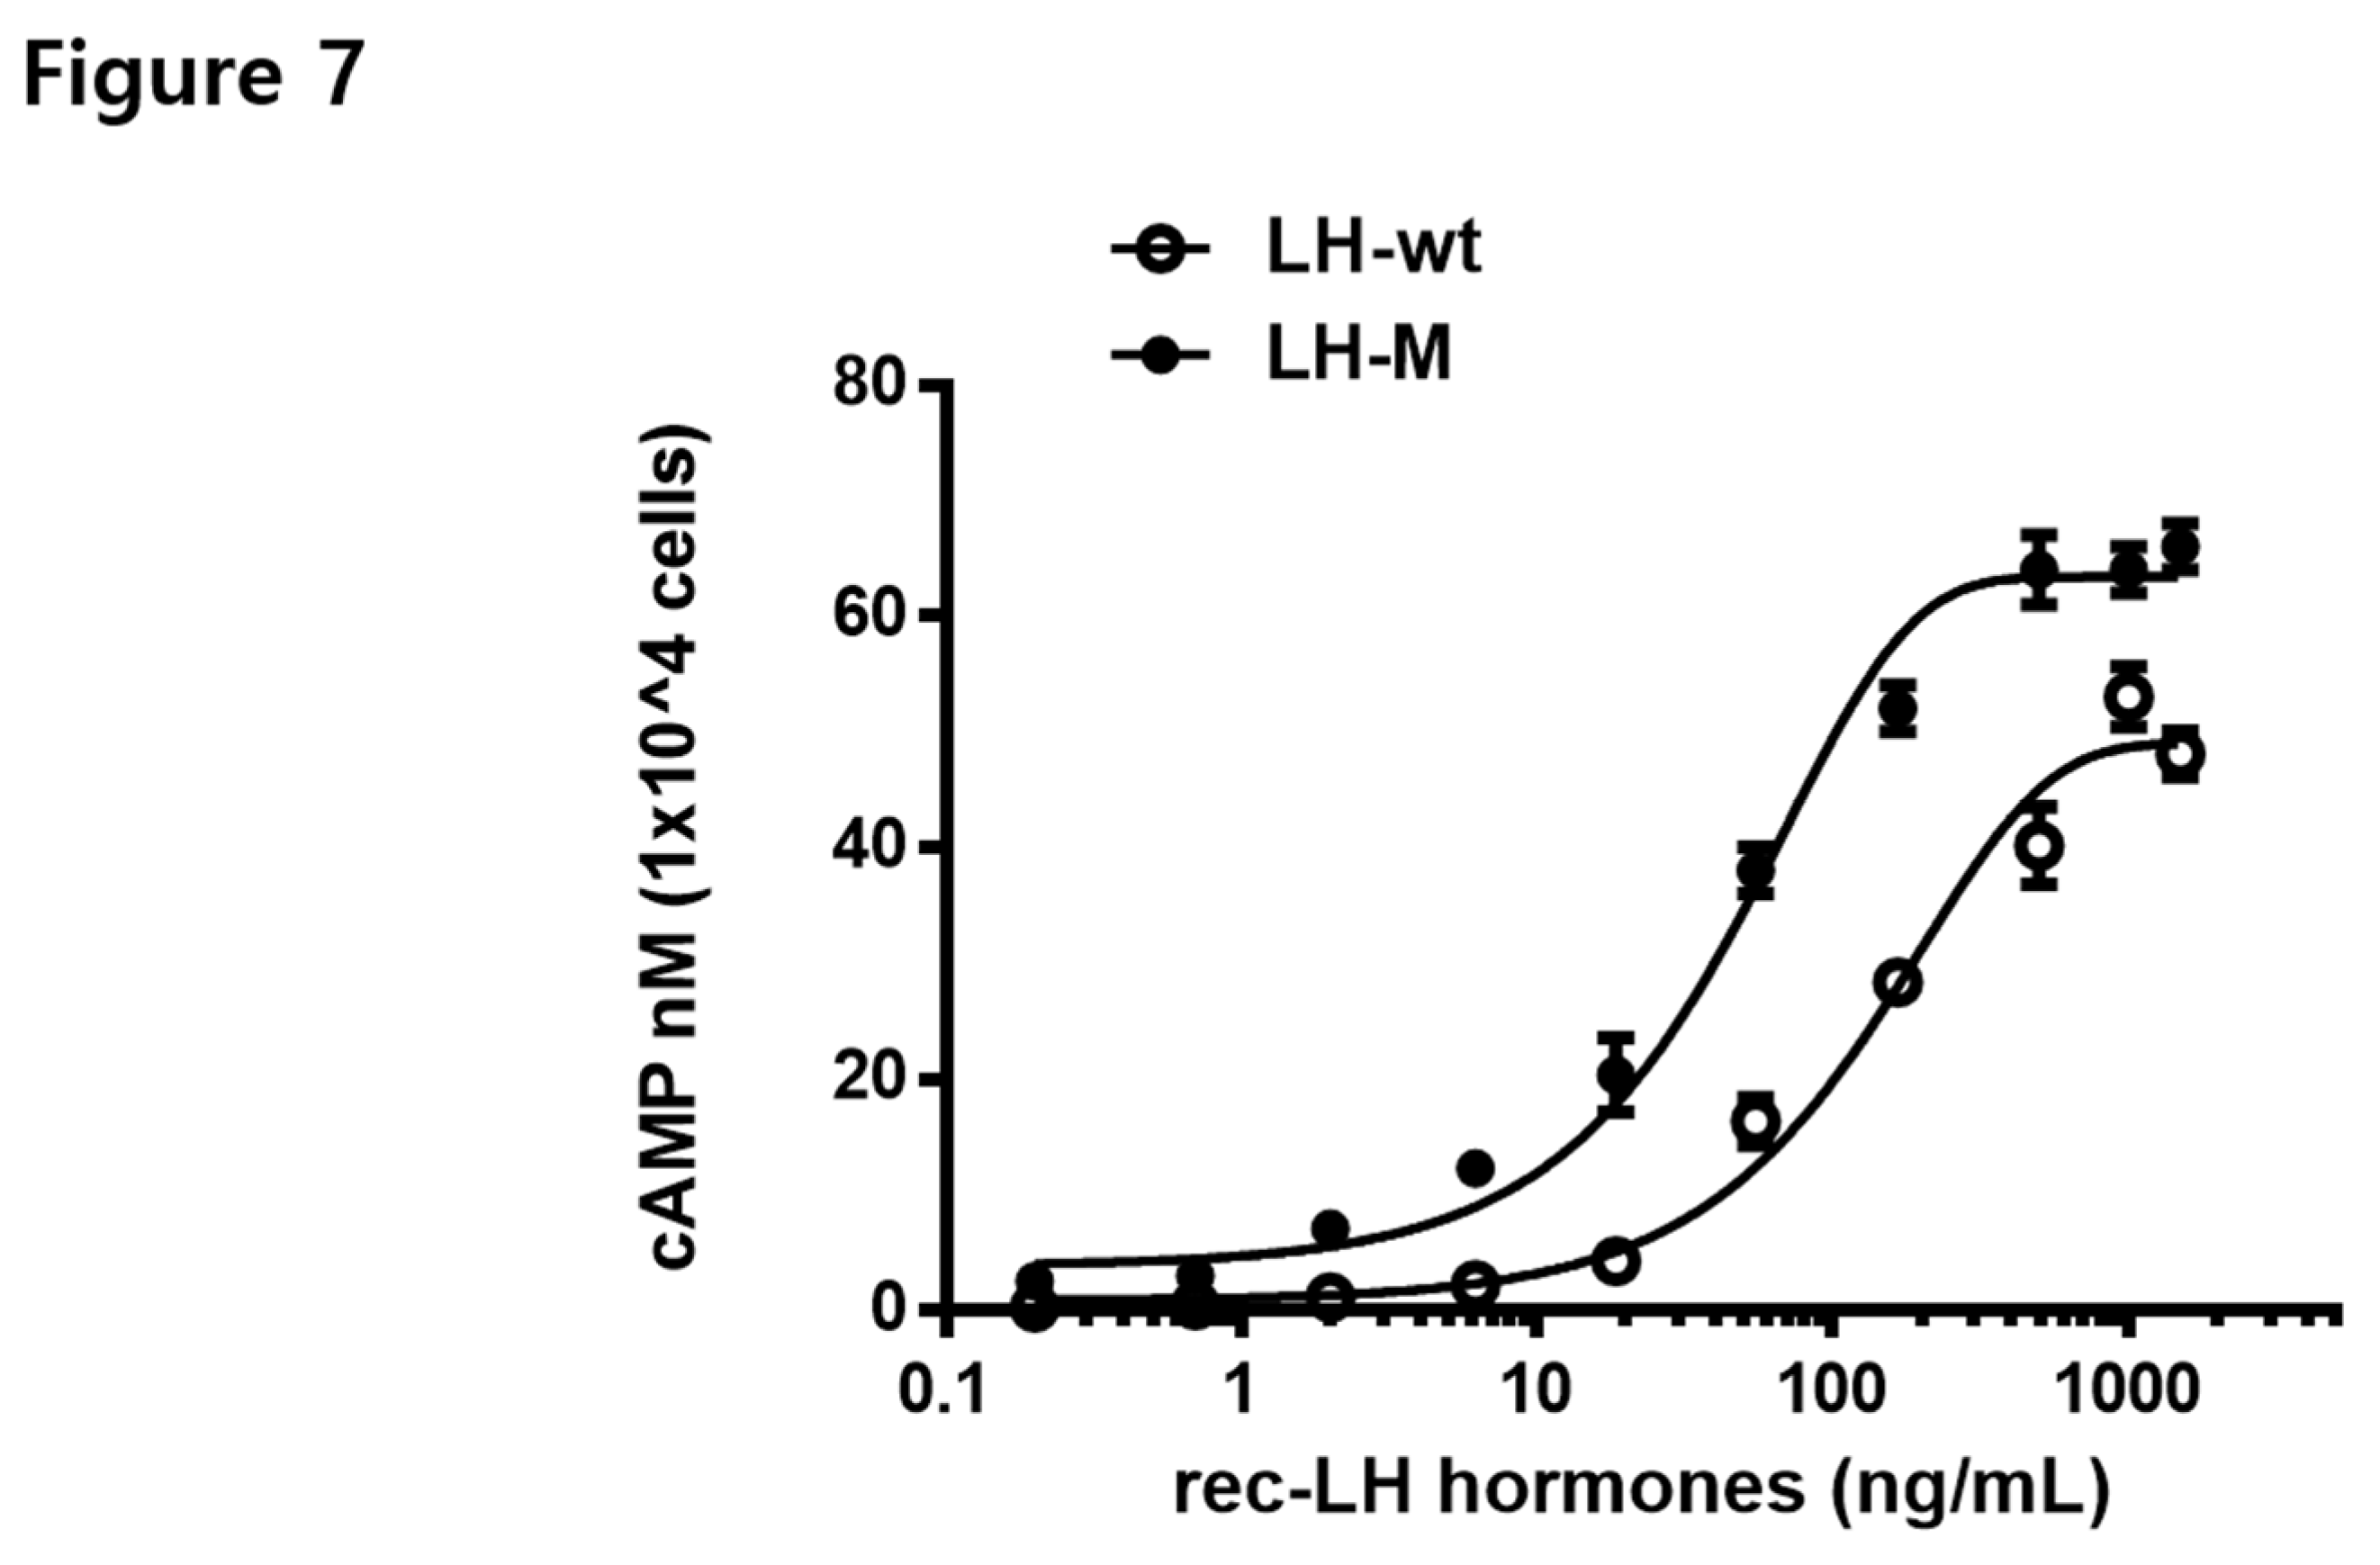
Figure 8.
pERK1/2 stimulated by the eel FSH receptor. The eel LH receptor was transiently transfected into HEK293 cells, which were starved for 4–6 h and then stimulated with 400 ng/mL agonist for the indicated times. Whole cell lysates were analyzed to determine the levels of pERK1/2 and total ERK. Twenty micrograms of protein were loaded into each sample lane. (A) Western blot results. (B) Western blot results normalized as maximal response % (100% for eel LH-wt at 5 min). The pERK1/2 band was quantified via densitometry, and pERK1/2 was normalized to the level of total ERK. Representative data are shown, and the graphs contain the mean ± SE values of three independent experiments. No significant differences were observed between the curves of the eel LH-wt- and LH-M-treated samples.
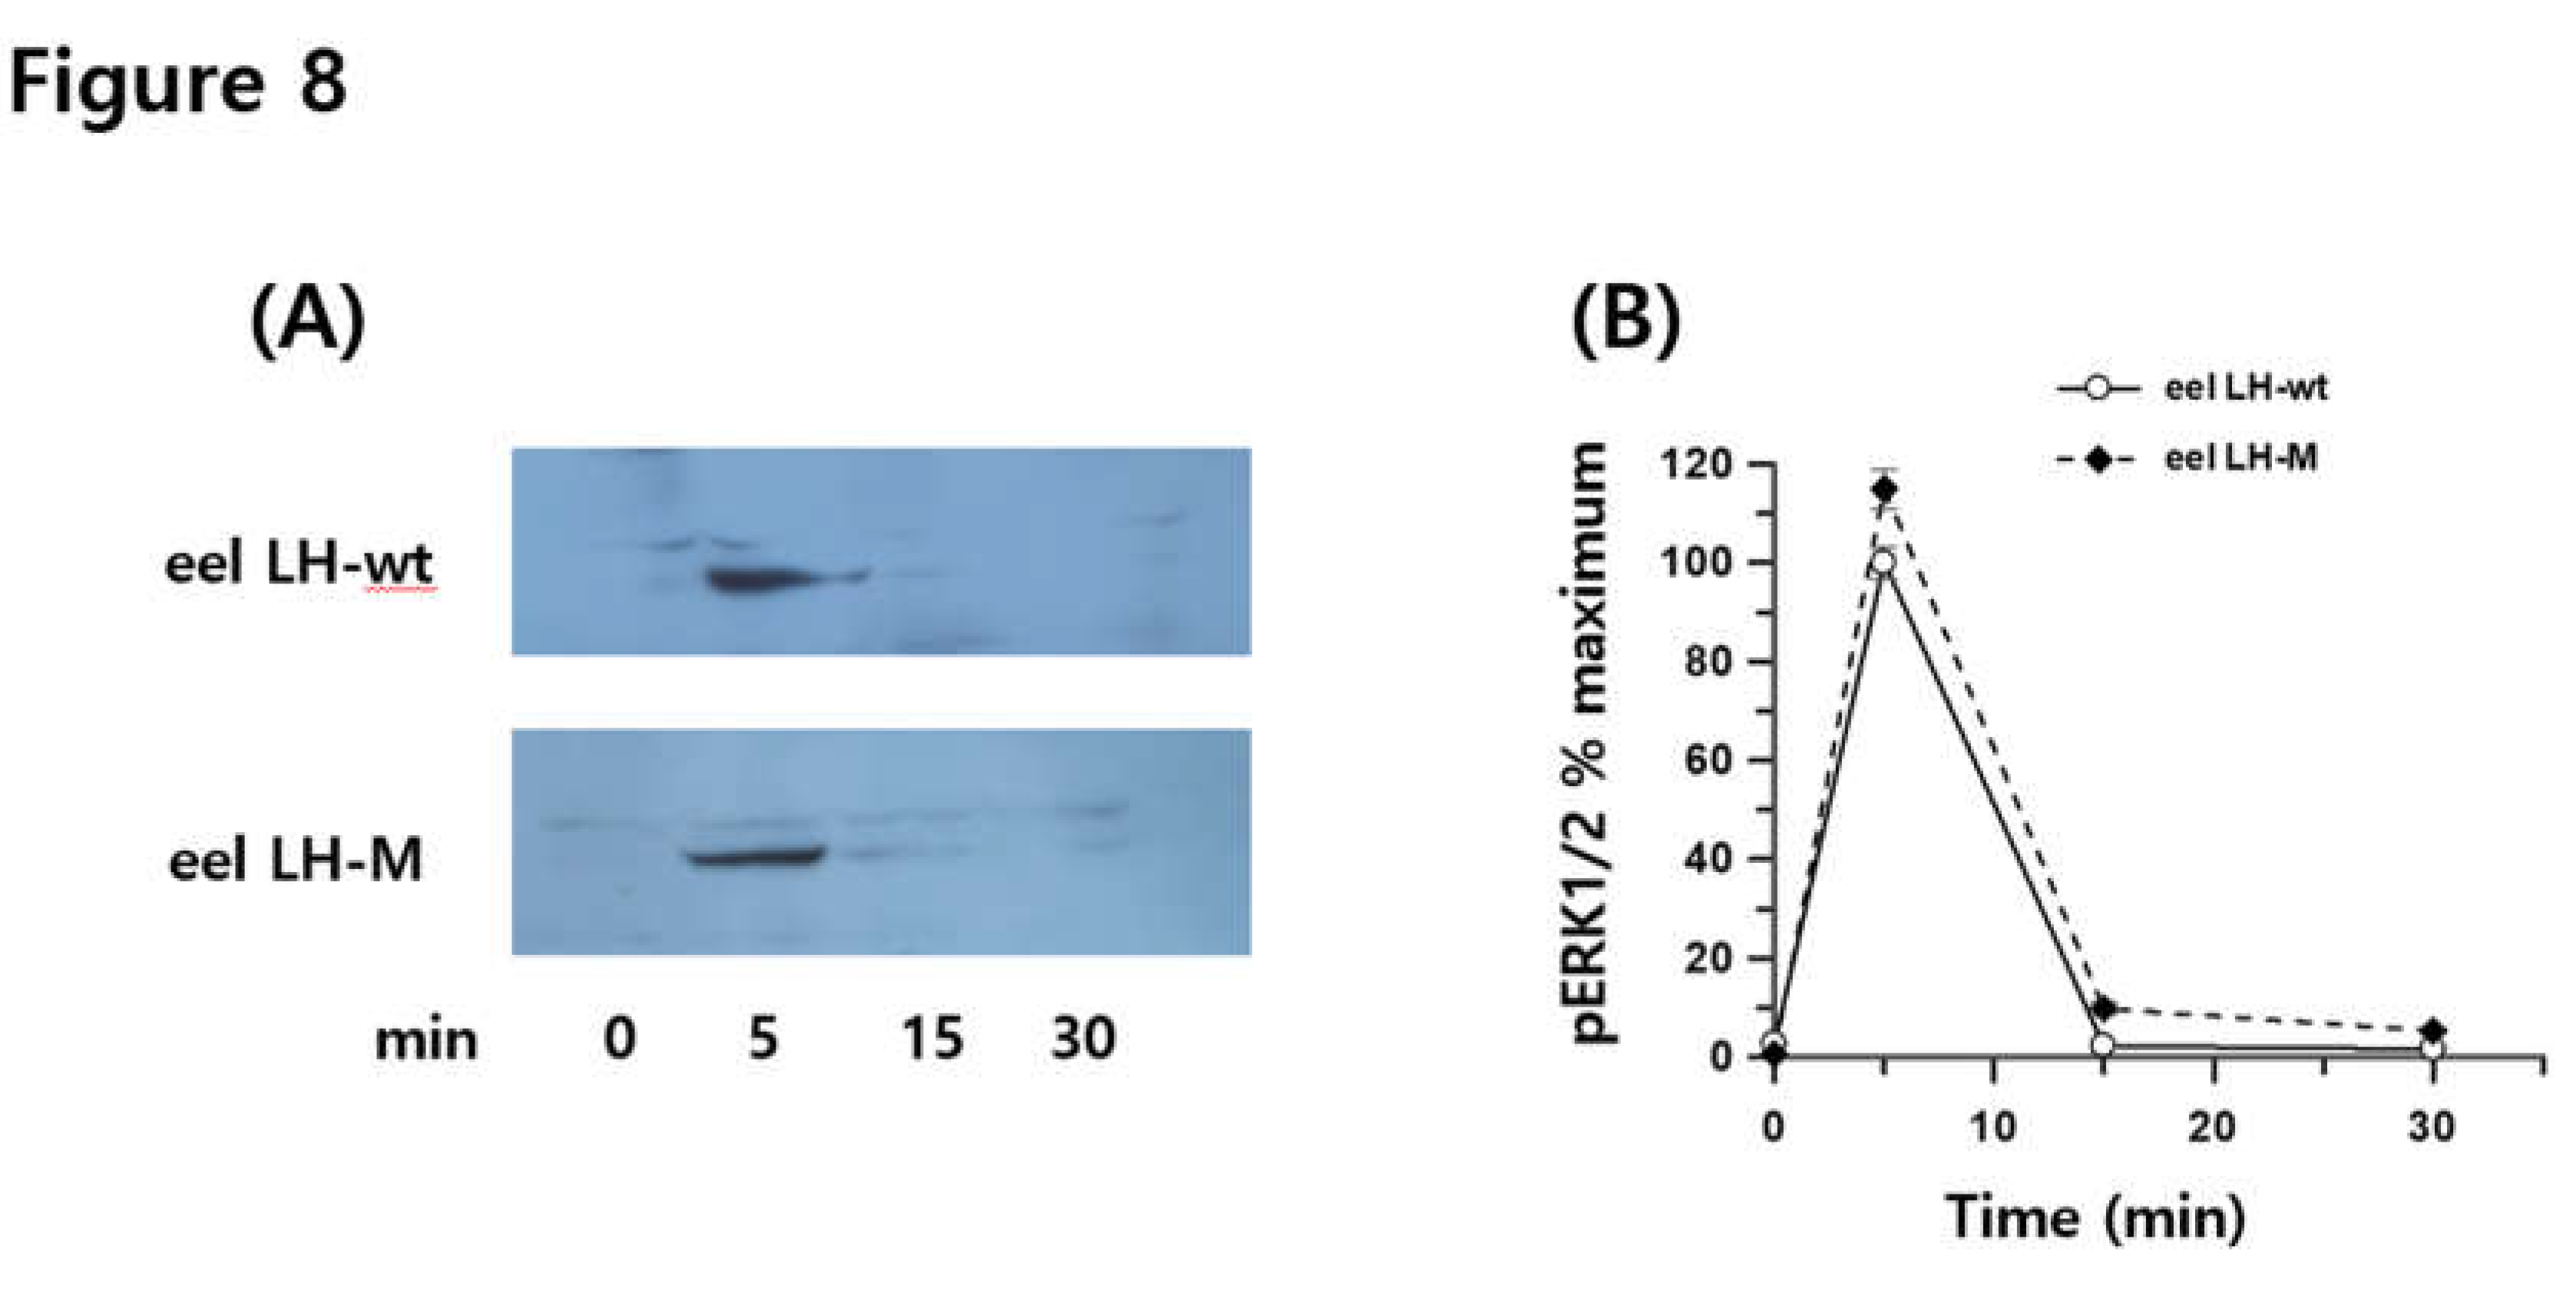

Table 1.
Bioactivity of rec-eel LH proteins in cells expressing eel LH receptor.
|
rec-LH hormones |
cAMP responses | |||||
| Basala (nM / 104 cells) |
Log (EC50) (ng/mL) |
Rmaxb (nM / 104 cells) |
||||
| LH-wt | 0.9 ± 0.5 |
138.8 (116.6 to 171.4)c |
49.0 ± 1.2 |
|||
| LH-M | 2.1 ± 0.8 |
47.8 (40.1 to 57.4) |
63.4 ± 1.5 |
|||
Values are the means ± SEM of triplicate experiments. Log (EC50) values were determined from the concentration-response curves from in vitro bioassays. a Basal cAMP level average without agonist treatment. b Rmax average cAMP level/104 cells. c Geometric mean (95% confidence intervals) of at least three experiments.
Disclaimer/Publisher’s Note: The statements, opinions and data contained in all publications are solely those of the individual author(s) and contributor(s) and not of MDPI and/or the editor(s). MDPI and/or the editor(s) disclaim responsibility for any injury to people or property resulting from any ideas, methods, instructions or products referred to in the content. |
© 2024 by the authors. Licensee MDPI, Basel, Switzerland. This article is an open access article distributed under the terms and conditions of the Creative Commons Attribution (CC BY) license (http://creativecommons.org/licenses/by/4.0/).
Copyright: This open access article is published under a Creative Commons CC BY 4.0 license, which permit the free download, distribution, and reuse, provided that the author and preprint are cited in any reuse.


