

Submitted:
15 May 2024
Posted:
16 May 2024
You are already at the latest version
Abstract
This article focuses on generating an alternative in order to identify traffic officers during driving. This research employed the latest You Only Look Once (YOLO) model, using a six-phase methodology: data collection, data preparation involving resizing and labeling, implementation of various filters to avoid overfitting, model training, prediction evaluation, and result interpretation. The YOLO model was applied across three iterations using a dataset of 1862 images. To enhance training efficiency and detection speed, the graphics processing unit (GPU) acceleration was utilized, further enhancing the experimental process. The results of this study revealed that the YOLOv8x variant produced the most promising results. This proposed model attained a remarkable F1 score of 0.95, bolstered by a confidence score of 0.631, with the potential for an increase to 0.80 in confidence without significantly compromising the F1-score. These findings are poised to make a substantial contribution to the broader research landscape, particularly in advancing the effectiveness of detection models for traffic officers.
Keywords:
Autonomous vehicle
; Object Detection
; YOLO
; Convolutional Neural Networks
; Traffic Officers
; Artificial Intelligence
1. Introduction
Autonomous vehicles (AV) are a contemporary technological innovation that, despite significant progress, remains a work in progress. These vehicles leverage a suite of multisensory devices to emulate human behavior driving. Components such as LiDAR, ultrasonics, cameras, and radars contribute to their sensory capabilities [1,2,3,4,5].
AVs often denoted as self-driving cars, employ advanced technology to navigate autonomously without human intervention [6,7]. This is achieved by integrating multisensory devices that mimic human behavior. These sensors detect the environment where the AV operates, transmitting this information to a central computer, which then processes the data to make informed driving decisions. However, despite their technological advancements, AVs are not infallible, primarily due to the need for further research to address various real-world scenarios that can arise during regular driving conditions.
Artificial intelligence (AI), as a sophisticated technology, has showcased its effectiveness, especially in domains that require meticulous attention to detail, as shown in [5,8]. The primary goal of AI is to create systems capable of replicating human-like intelligence to perform tasks, solve intricate problems, and make autonomous decisions. AI has made notable advancements in critical sectors like medicine, where precision is crucial to minimizing patient risks. AI encompasses diverse techniques that serve as a foundational pillar for today’s technological progress [9]. Its integration into autonomous vehicles holds immense promise due to its exceptional precision.
One of the prominent challenges in the development of computer vision systems for autonomous vehicles is the accurate detection and recognition of objects during automated driving. Specifically, this challenge is to identify and interpret various gestures made by traffic agents correctly. Several approaches have been employed for this purpose, including recurrent neural networks (RNNs) with attention models, temporal convolutional networks (TCNs), and graph-based networks (GCNs) [10,11,12].
However, these technological solutions encounter difficulties in correctly distinguishing traffic officers, often confusing them with pedestrians and making attempts to evade them, rather than halting the vehicle and complying with traffic directives. A recent incident reported in [13], which took place in California, exemplifies this issue. The incident involved an AV experiencing a malfunction in its headlights, resulting in law enforcement officers attempting to pull the vehicle over. Regrettably, the vehicle failed to recognize the presence of the law enforcement officers, leading to a failure in adhering to their authority. This failure posed a potential risk to the safety of the officers involved. These incidents emphasize the urgent need to develop a precise and reliable model that can proficiently detect and identify law enforcement officers, enhancing the safety and functionality of autonomous vehicles.
In response to a series of concerning incidents and a lack of comprehensive information, we recognized the pressing need to enhance object detection in AVs [14]. To face this challenge, a computer vision model has been developed. The modern landscape of computer vision offers a diverse array of models and algorithms, presenting us with numerous options. After careful consideration, the YOLO model was chosen in this research due to its versatility and we particularly focused on its latest version, YOLOv8 [15]. In the experimental phase, the models of versions 3, 5 and 8 of YOLO were compared, carefully examining their behavior, results, accuracy and training time. To address the entire problem of object detection, various object detection models in each version of YOLO will be considered. The approach in this article was structured into six phases to establish a robust methodology for tackling the detection problem.
In the initial phase, we curated a unique dataset since a suitable dataset wasn’t readily available. This dataset consists of images capturing traffic officers in diverse scenarios, encompassing daylight, rainy conditions, and evenings. Subsequently, during the second phase, we performed image annotation using the Roboflow platform to delineate the presence of traffic officers [16]. All images were resized uniformly to ensure compatibility with YOLO models in the third phase. Filtering mechanisms were also implemented during this phase to mitigate the risk of overfitting in the YOLO models. The fourth phase involved the training of the YOLO models, employing GPU acceleration to expedite the training process and accommodate the larger YOLO model variants available in these versions. In the fifth phase, we conducted an exhaustive evaluation of the predictions generated by each model, facilitating a comprehensive analysis of their performance. Finally, in the sixth phase, we carefully examined all models to determine the one that exhibited the most promising results. This structured approach allowed us to make informed decisions regarding the most effective model for improved object detection in AVs.
1.1. Contributions of the Study
The principal objective is the integration of a computer vision model into autonomous vehicles, allowing the vehicle’s onboard computer to respond appropriately upon detecting the presence of a traffic officer, thus enhancing the vehicle’s interaction with human traffic regulators and ensuring safer and more efficient traffic.
The contributions of this proposal are the following:
- We have developed a series of YOLO models characterized by their exceptional precision scores in the detection of traffic officers. These models are poised for integration into AVs, thereby augmenting the capabilities of these vehicles to effectively navigate real-world scenarios.
- To evaluate the performance and behavior of these models, we have devised a comprehensive 6-phase methodology. This approach aids us in identifying the most suitable model for deployment within AVs, ensuring optimal functionality and safety in practical applications.
The research methodology employed in this study is structured as follows: Section 2 offers an overview of related works in the field, where a summary of YOLO versions, datasets, hardware, and mean Average Precision (mAP); Section 3 delves into the methodology utilized to derive the optimal model, outlining the algorithms employed for result calculation; In Section 4, the obtained model results are comprehensively analyzed, particularly with respect to their performance under specific parameter conditions; Lastly, Section 5 presents the conclusive findings and insights derived from this research.
2. Related Work
Within the domain of computer vision and object detection, YOLO models have gained notable attention and recognition for their exceptional real-time processing capabilities and precision. This section provides an in-depth exploration of the significant contributions and progress within the realm of YOLO models. It highlights pivotal studies, methodologies, and applications that have profoundly impacted the contemporary landscape of object detection techniques (Table 1).
In a study presented in [17], a comprehensive comparative analysis was conducted to discern the most efficient object detection model. This evaluation focused on two prominent models: Faster R-CNN and YOLOv3. The training dataset was meticulously curated from video content sourced from YouTube, comprising 126 videos and generating a rich repository of 33,978 frames. Subsequently, manual annotation was performed using the Roboflow tool, meticulously refining the dataset to include 1,115 images by removing extraneous frames.
The outcomes of this experimentation were enlightening. The Faster R-CNN model demonstrated remarkable precision, achieving a perfect precision rate of 100% for the "accident" class and an impressive 98.5% precision rate for the "fall down" class. This showcased the model’s exceptional precision capabilities. However, what set YOLOv3 apart was its superior (mAP) score, emphasizing its effectiveness in handling diverse object detection challenges. Additionally, YOLOv3 showcased swift detection capabilities, achieving an impressive processing rate of 51 frames per second, highlighting its potential for real-time applications and fast-paced scenarios. These findings underscore the need to carefully weigh precision against processing speed when choosing an object detection model for specific use cases.
In a significant study, denoted as [18], the central objective was the development of an advanced pedestrian detection and counting model. The research employed the YOLOv3 model as the fundamental framework, a choice well-regarded for its real-time object detection capabilities. The training phase of this model was meticulously curated, drawing upon the richness of two diverse datasets: the INRIA dataset and the ShanhaiTech dataset.
The integration of these datasets was a key aspect, resulting in a robust dataset comprising a total of 1,416 instances of individuals. This amalgamation provided a diverse and comprehensive collection of pedestrian data, enriching the model’s ability to generalize across various scenarios.
The study’s findings were highly notable, showcasing the model’s effectiveness in pedestrian detection. When evaluated against the INRIA dataset, the model demonstrated an impressive accuracy level of 96.1%. This underscored the model’s precision and reliability in detecting pedestrians accurately. Moreover, when benchmarked against the ShanhaiTech dataset, the model achieved a commendable accuracy rating of 87.3%, further illustrating its versatility and adaptability across different datasets and environments.
In the study [19], a novel approach is introduced to enhance an object detection model, leveraging the yolov5 model as its foundational architecture. The principal objective of this endeavor was to craft a model that can seamlessly integrate with embedded systems, exhibiting real-time proficiency in detecting diverse objects, including electric bikes, helmets, and license plates. The research embarked on a multi-faceted journey, beginning with the amalgamation of the shufflenetv2 and GhostNet architectures. This strategic fusion resulted in a notable reduction in the overall parameter count, effectively rendering the model suitable for deployment on resource-constrained devices and mobile platforms endowed with limited memory and computational capabilities. The findings of this inquiry were compelling, attaining precision metrics of 97.8% for detecting riders, 89.6% for identifying the absence of helmets, 97% for license plate recognition, and 92.6% for helmet detection. A notable supplementary achievement emerged in the form of significantly enhanced FPS performance for the yolov5 model, surging to an impressive 66.7%.
The study referenced as [20] delves into the application of the yolov5 model to enhance the efficacy of traffic officer interventions in detecting traffic violations. To achieve this, a substantial dataset was meticulously collected and subsequently uploaded to MakeSense.ai. The dataset was thoughtfully annotated, encompassing five distinct classes: "no helmet," "with helmet," "triple riding," "phone usage," and "no phone usage”. With the dataset fully prepared, the researchers opted for the precision-recall curve as a pivotal metric for quantifying the model’s performance. This comprehensive evaluation yielded a series of commendable scores for the diverse classes, including 0.811 for "with helmet," 0.708 for "without helmet," 0.745 for "phone usage," an impressive 0.995 for "no phone usage," and again, a high 0.995 for "triple riding." The findings underscore the potential of the yolov5 model to significantly enhance the capabilities of traffic officers in identifying and addressing traffic violations. This research provides a valuable contribution to the field of traffic management and safety, offering a precise and reliable tool for real-world applications in traffic enforcement scenarios.
The study [21] presents a comprehensive investigation into the augmentation of the yolo v5 model by incorporating it as a foundational architecture for integration with other models, thereby optimizing its suitability for deployment on embedded systems. The primary objective of this endeavor centers on facilitating the detection of vehicles and pedestrians, particularly utilizing infrared images, given their historically diminished recognition rates. Notably, the research focuses on implementing this model on the NVIDIA Xavier NX embedded system. This investigation uses the FLIR ADAS22 dataset, comprising a sizable collection of 9214 thermal images. The outcomes of this research underscore commendable achievements. Although the modified yolo v5 model’s results fall slightly short of the performance of the original yolov5 model, the research excels in its ability to address a persistent challenge: augmenting the FPS rate for deployment on embedded systems. Quantitative evaluation of the models’ detection prowess reveals a marginal disparity in mAP. The standalone yolov5 model attains a mAP of 88.49, whereas the configuration featuring the yolov5 backbone achieves a slightly reduced mAP of 85.63.
In [22], the focus was addressed to critical safety concern of in-flight system failures in UAVs within urban environments. They devised a comprehensive safety framework comprising three pivotal tasks: monitoring UAV health, identifying secure landing spots in case of failure, and navigating the UAV to the identified safe landing location. Their focus was on the second task, which involved investigating the feasibility of leveraging object detection methods to pinpoint safe landing spots during in-flight malfunctions. They examined various iterations of the YOLO object detection method (YOLOv3, YOLOv4, and YOLOv5l) and found that YOLOv5l demonstrated remarkable precision (0.707) and recall (0.611), with a noteworthy mAP of 0.633. They further evaluated these algorithms using Nvidia Jetson Xavier NX modules for real-time landing spot detection, with YOLOv3 emerging as the fastest while maintaining precision. This research underscores the potential of these algorithms to enhance UAV safety protocols in urban environments, particularly during emergency situations.
In the study [23], the researchers harnessed the cutting-edge capabilities of the YOLO v8 model for advancing the domain of object detection. Specifically, their focus was directed towards the detection of elbow osteochondritis dissecans (OCD) by employing ultrasound images. This innovative application assumes significance as early detection of such conditions holds pivotal implications for ensuring successful conservative treatments. The training of this specialized model was accomplished utilizing an extensive dataset comprising 2430 images. The outcomes of this investigative work unveil compelling results. The achieved metrics underscore the model’s remarkable performance: an accuracy of 0.998, a recall of 0.9975, a precision score of 1.00, and an impressive f-measure of 0.9987. Furthermore, the researchers conducted a nuanced exploration employing two variants of the yolo v8 model: the nano and medium configurations. This systematic comparison resulted in the determination of mAP scores of 0.994 and 0.995, respectively.
In study [15], a comprehensive endeavor was undertaken to tackle the pervasive challenge of parking time violations in Thailand by harnessing the potent capabilities of the YOLOv8 object detection model. To amass the requisite training dataset, a meticulous process was employed involving the deployment of closed-circuit television (CCTV) surveillance cameras positioned at four distinct locations. These cameras diligently captured real-world scenarios, yielding video footage operating at a fluid 15-30 frames per second and boasting a resolution of 1080P. To accurately trace the movements of vehicles within the captured scenes, sophisticated DeepSOR/OC-SORT tracking algorithms were employed, allowing for robust vehicle tracking and object association. The efficacy of the research was validated through a multifaceted evaluation, incorporating crucial metrics to gauge performance. The Multiple Object Tracking Algorithm (MOTA) and mAP metric, a pivotal indicator of the tracking algorithm’s ability to follow the trajectories of multiple objects consistently and accurately over time. The research findings revealed noteworthy performance achievements for the YOLOv8 model combined with the DeepSOR/OC-SORT tracking methodologies. Specifically, when coupled with the DeepSORT tracking algorithm, the YOLOv8 model demonstrated MOTA scores of 0.90, 0.96, 1.00, and 1.00 for the respective locations, indicative of the system’s commendable tracking precision. Meanwhile, for the YOLOv8 model paired with the OC-SORT tracking technique, MOTA scores were observed as 0.83, 0.00, 0.76, and 1.00 for the respective locations, signifying the model’s ability to effectively track objects even under varied conditions.
3. Methodology
3.1. Model Selection
YOLO is a model that uses convolutional neural networks in which it primary task is to detect multiple objects and predict classes and identify their locations. The manner in which this model functions is by applying single neural networks and divides the image that is uses in its input into grid cells, resulting in a production of cell probabilities. From the production of these probabilities predict boxes are generated and this model chooses the highest probability and surrounds the image. Given its high use in real world scenarios there models have been chosen from this YOLO model.
3.1.1. YOLO v3
YOLOv3 at its core, employs a deep neural network that is represented graphically in Figure 1. This neural network is known as Darknet-53, consisting of 53 convolutional layers. For the task of object detection, this architecture incorporates two sets of these 53 layers, resulting in a total of 106 layers. Detection occurs within specific layers, specifically at positions 82, 94, and 106 within this network. YOLOv3 integrates key architectural components such as residual blocks, skip connections, up-sampling, batch normalization, and the application of leaky ReLU activation functions in each convolutional layer. Notably, YOLOv3 deviates from traditional approaches by forgoing pooling layers in favor of additional convolutional layers.
This design choice minimizes the risk of losing low-level spatial features, rendering YOLOv3 exceptionally well-suited for detecting small objects. A distinctive aspect of YOLOv3 is its utilization of three different detection layers, corresponding to three different strides: 13, 16, and 8. These strides effectively resize the input image, with layer 82 producing a 13x13 grid for detecting large objects, layer 94 generating a 26x26 grid for medium-sized object detection, and layer 106 yielding a 52x52 grid tailored for detecting small objects. The localization and classification of objects are facilitated by anchor boxes, enabling the model to determine the optimal bounding boxes for detected objects. Ultimately, YOLOv3 delivers a final image with the objects successfully identified and localized.
3.1.2. YOLOv5
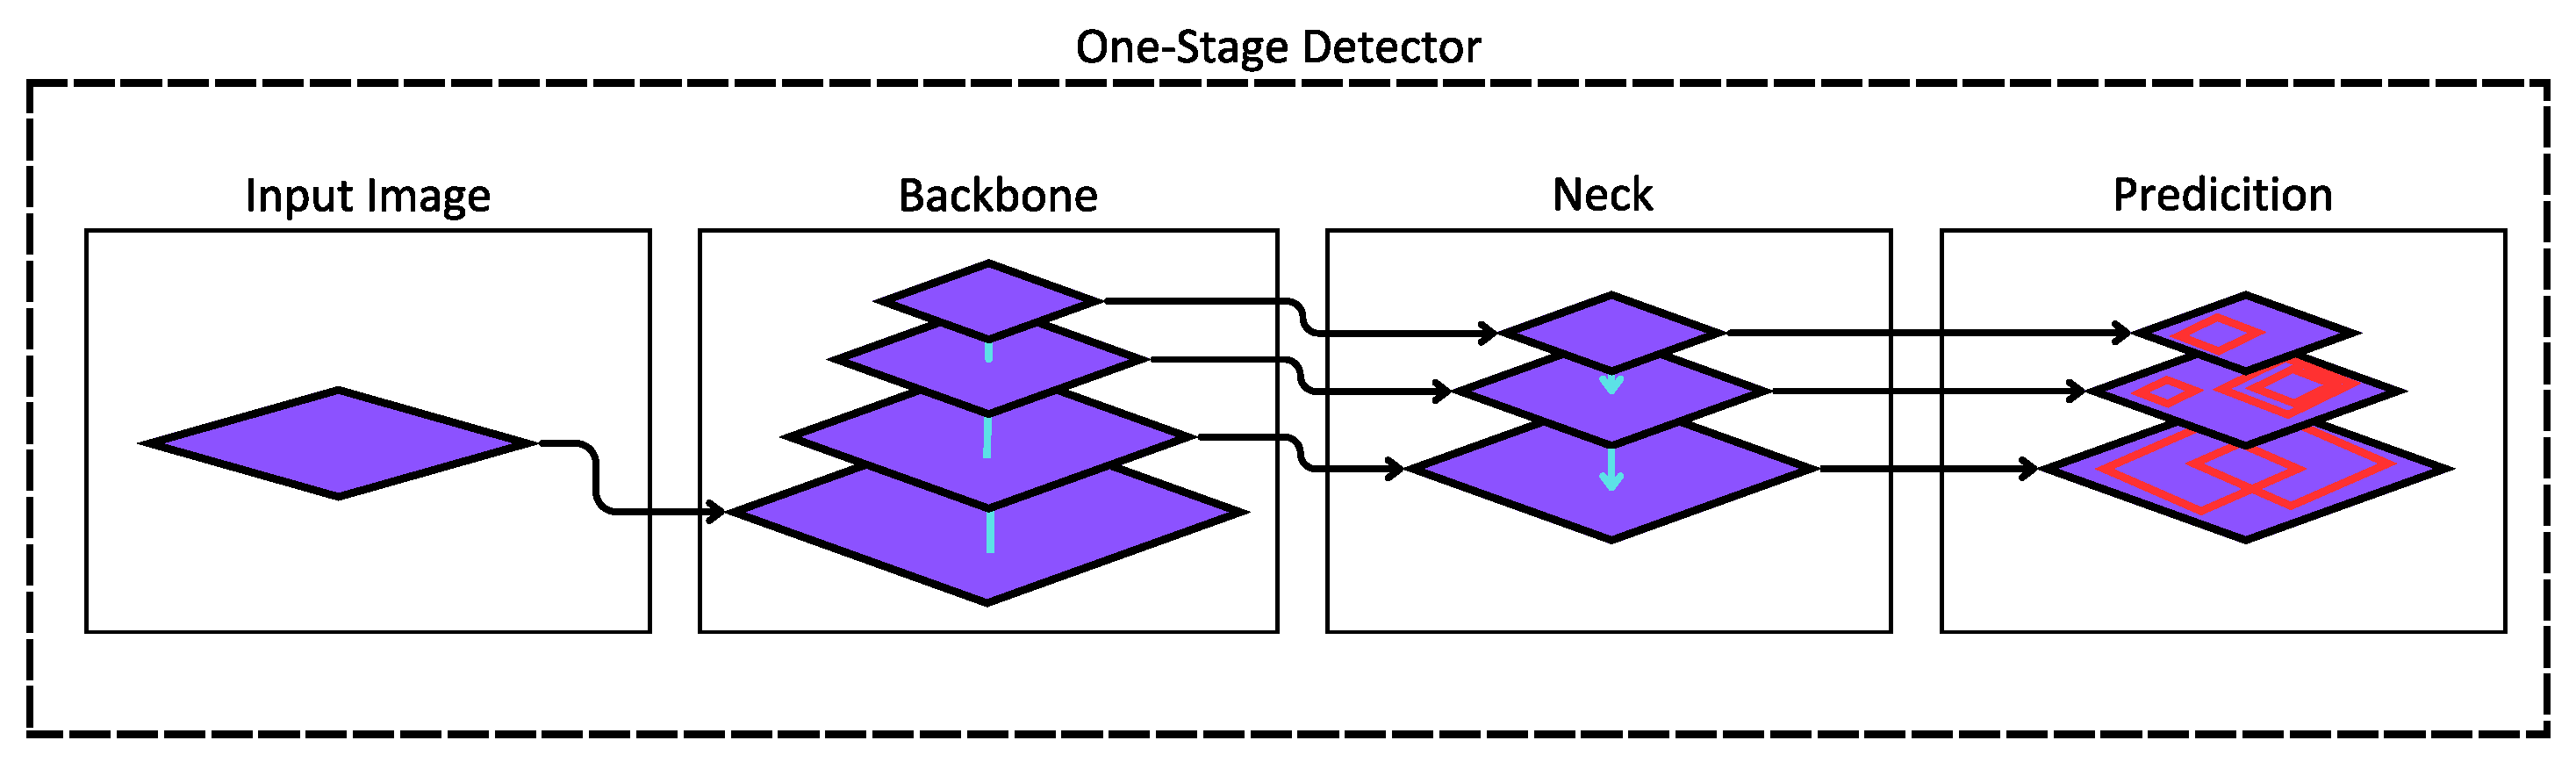
In the YOLOv5 model, the architectural foundation closely resembles its predecessor, particularly in the realm of object detection. YOLO, is a single-stage object detector, characterized by a three-component architecture comprising the backbone, neck, and head as represented in Figure 2.
- Backbone: This component is equipped with pre-trained networks designed to extract essential features from input images. In the case of YOLOv5, the chosen backbone is the CSP-Darknet53. This configuration involves convolutional layers comprised of both residual and dense blocks, strategically engineered to enhance the flow of information within the network and alleviate the issue of vanishing gradients.
- Neck: The neck component plays a crucial role in feature extraction and pyramidal scaling to effectively handle objects of varying sizes and scales. YOLOv5 employs the Path Aggregation Network (PANet) within the neck, which optimizes information flow and aids in precise pixel localization, particularly when engaged in mask prediction tasks. Furthermore, the SPP component within the neck enhances feature aggregation, ensuring a consistent output length without sacrificing information throughput.
- Head/Prediction: A similar dynamic to that of YOLOv4 and YOLOv3 is maintained in the main component of YOLOv5. This entails the utilization of three prediction layers that play a pivotal role in determining bounding boxes and object identification. These prediction layers are instrumental in detecting and characterizing objects within the input data.
Figure 2.
One-Stage architecture detector for YOLO version 5.
3.1.3. YOLOv8
In the YOLOv8 architectural framework, a noteworthy departure from its predecessor is observed. In this section, we shall provide a succinct elucidation of this architectural evolution, noting that there exists no official documentation precisely mirroring the structure of this model. Taking for granted in the codebase provided by Ultralytics, we discern two pivotal components at the heart of this architecture [24]: the backbone and the head which can be compared to the architecture that found in Figure 1.The backbone of YOLOv8 retains a familiar convolutional layer composition, albeit with a distinctive augmentation. It incorporates Spatial Pixel Pair Features (SPPF) to harness spatial contextual information and spectral insights. This augmentation distinguishes it from its forebear, enhancing its ability to process and interpret complex data patterns.
Notably, YOLOv8 amalgamates the neck and head components into a single cohesive process. In this unified approach, it mirrors the behavior of its predecessor by employing detection layers for object detection. This amalgamation represents a strategic refinement in the model’s overall architecture, potentially streamlining the object detection process. While the official documentation for YOLOv8 may be absent, insights drawn from the Ultralytics codebase shed light on these architectural nuances, offering valuable context for understanding the model’s innovative design.
3.2. Proposed Methodology
In this section, we delineate our methodology which can also be observed in Figure 3, this methodology is made up of six phases, along with a comprehensive discussion of the metrics employed to validate the efficacy of our model.
3.2.1. Phase 1: Dataset Collection
In this initial phase, the approach of this investigastion was to assemble a dataset comprising images of traffic officers in Ecuador, specifically within the city of Cuenca. A total of 931 images were meticulously captured, encompassing various weather conditions, including rainy, cloudy, sunny, and night scenarios. This diversity in weather conditions was intentionally incorporated to enable the model to learn object detection under varied environmental conditions. An example of these images can be observed in Figure 4.
3.2.2. Phase 2: Data Preparation
Following dataset collection, we leveraged an online platform for image annotation, a crucial yet time-consuming step. Accurate labeling is imperative to ensure proper model training. Subsequently, we standardized the image sizes to eliminate potential input issues for the model.
3.2.3. Phase 3: Augmentation and Filter Application
To mitigate potential model overfitting due to the limited dataset size, data augmentation techniques were implemented. In particular, these duplicate images and multiple filters are duplicated. the chosen filters encompass Gaussian blur, mimicking occasional image blurriness often observed in moving vehicle cameras, and noise filters, introducing pixel-level alterations to challenge the model. The data separation for model training is outlined in Table 2.
3.2.4. Phase 4: Model Selection and Training
In Phase 4, three specific YOLO models were selected from Ultralytics: YOLOv3, YOLOv5, and YOLOv8. YOLOv3 and YOLOv5, renowned for their suitability in embedded systems, were chosen. Additionally, YOLOv8, a recent release with limited prior experimentation, was included. We experimented with various model versions, including nano, small, medium, large, and x-large, each differing in complexity and processing capacity. Detailed characteristics and hyperparameter tuning parameters for each model are presented in Table 3. Hardware specifications used for training are listed in Table 4.
3.2.5. Quality Measurements
It is essential to emphasize the significance of analyzing and interpreting our results. To this end, various quality assessment metrics were incorporated, sourced from [8,25] as reference criteria for evaluating the effectiveness of the implemented techniques.
- Precision: Refers to the spread of values obtained from magnitude measurements. Precision is inversely proportional to dispersion, meaning that if precision is high, dispersion is minimal.
- Recall: Also known as the true positive rate. It represents the quantity of positives identified correctly.
- F1: This metric represents a summary of both precision and recall in a single metric.
3.2.6. Phase 5: Evaluation and Results
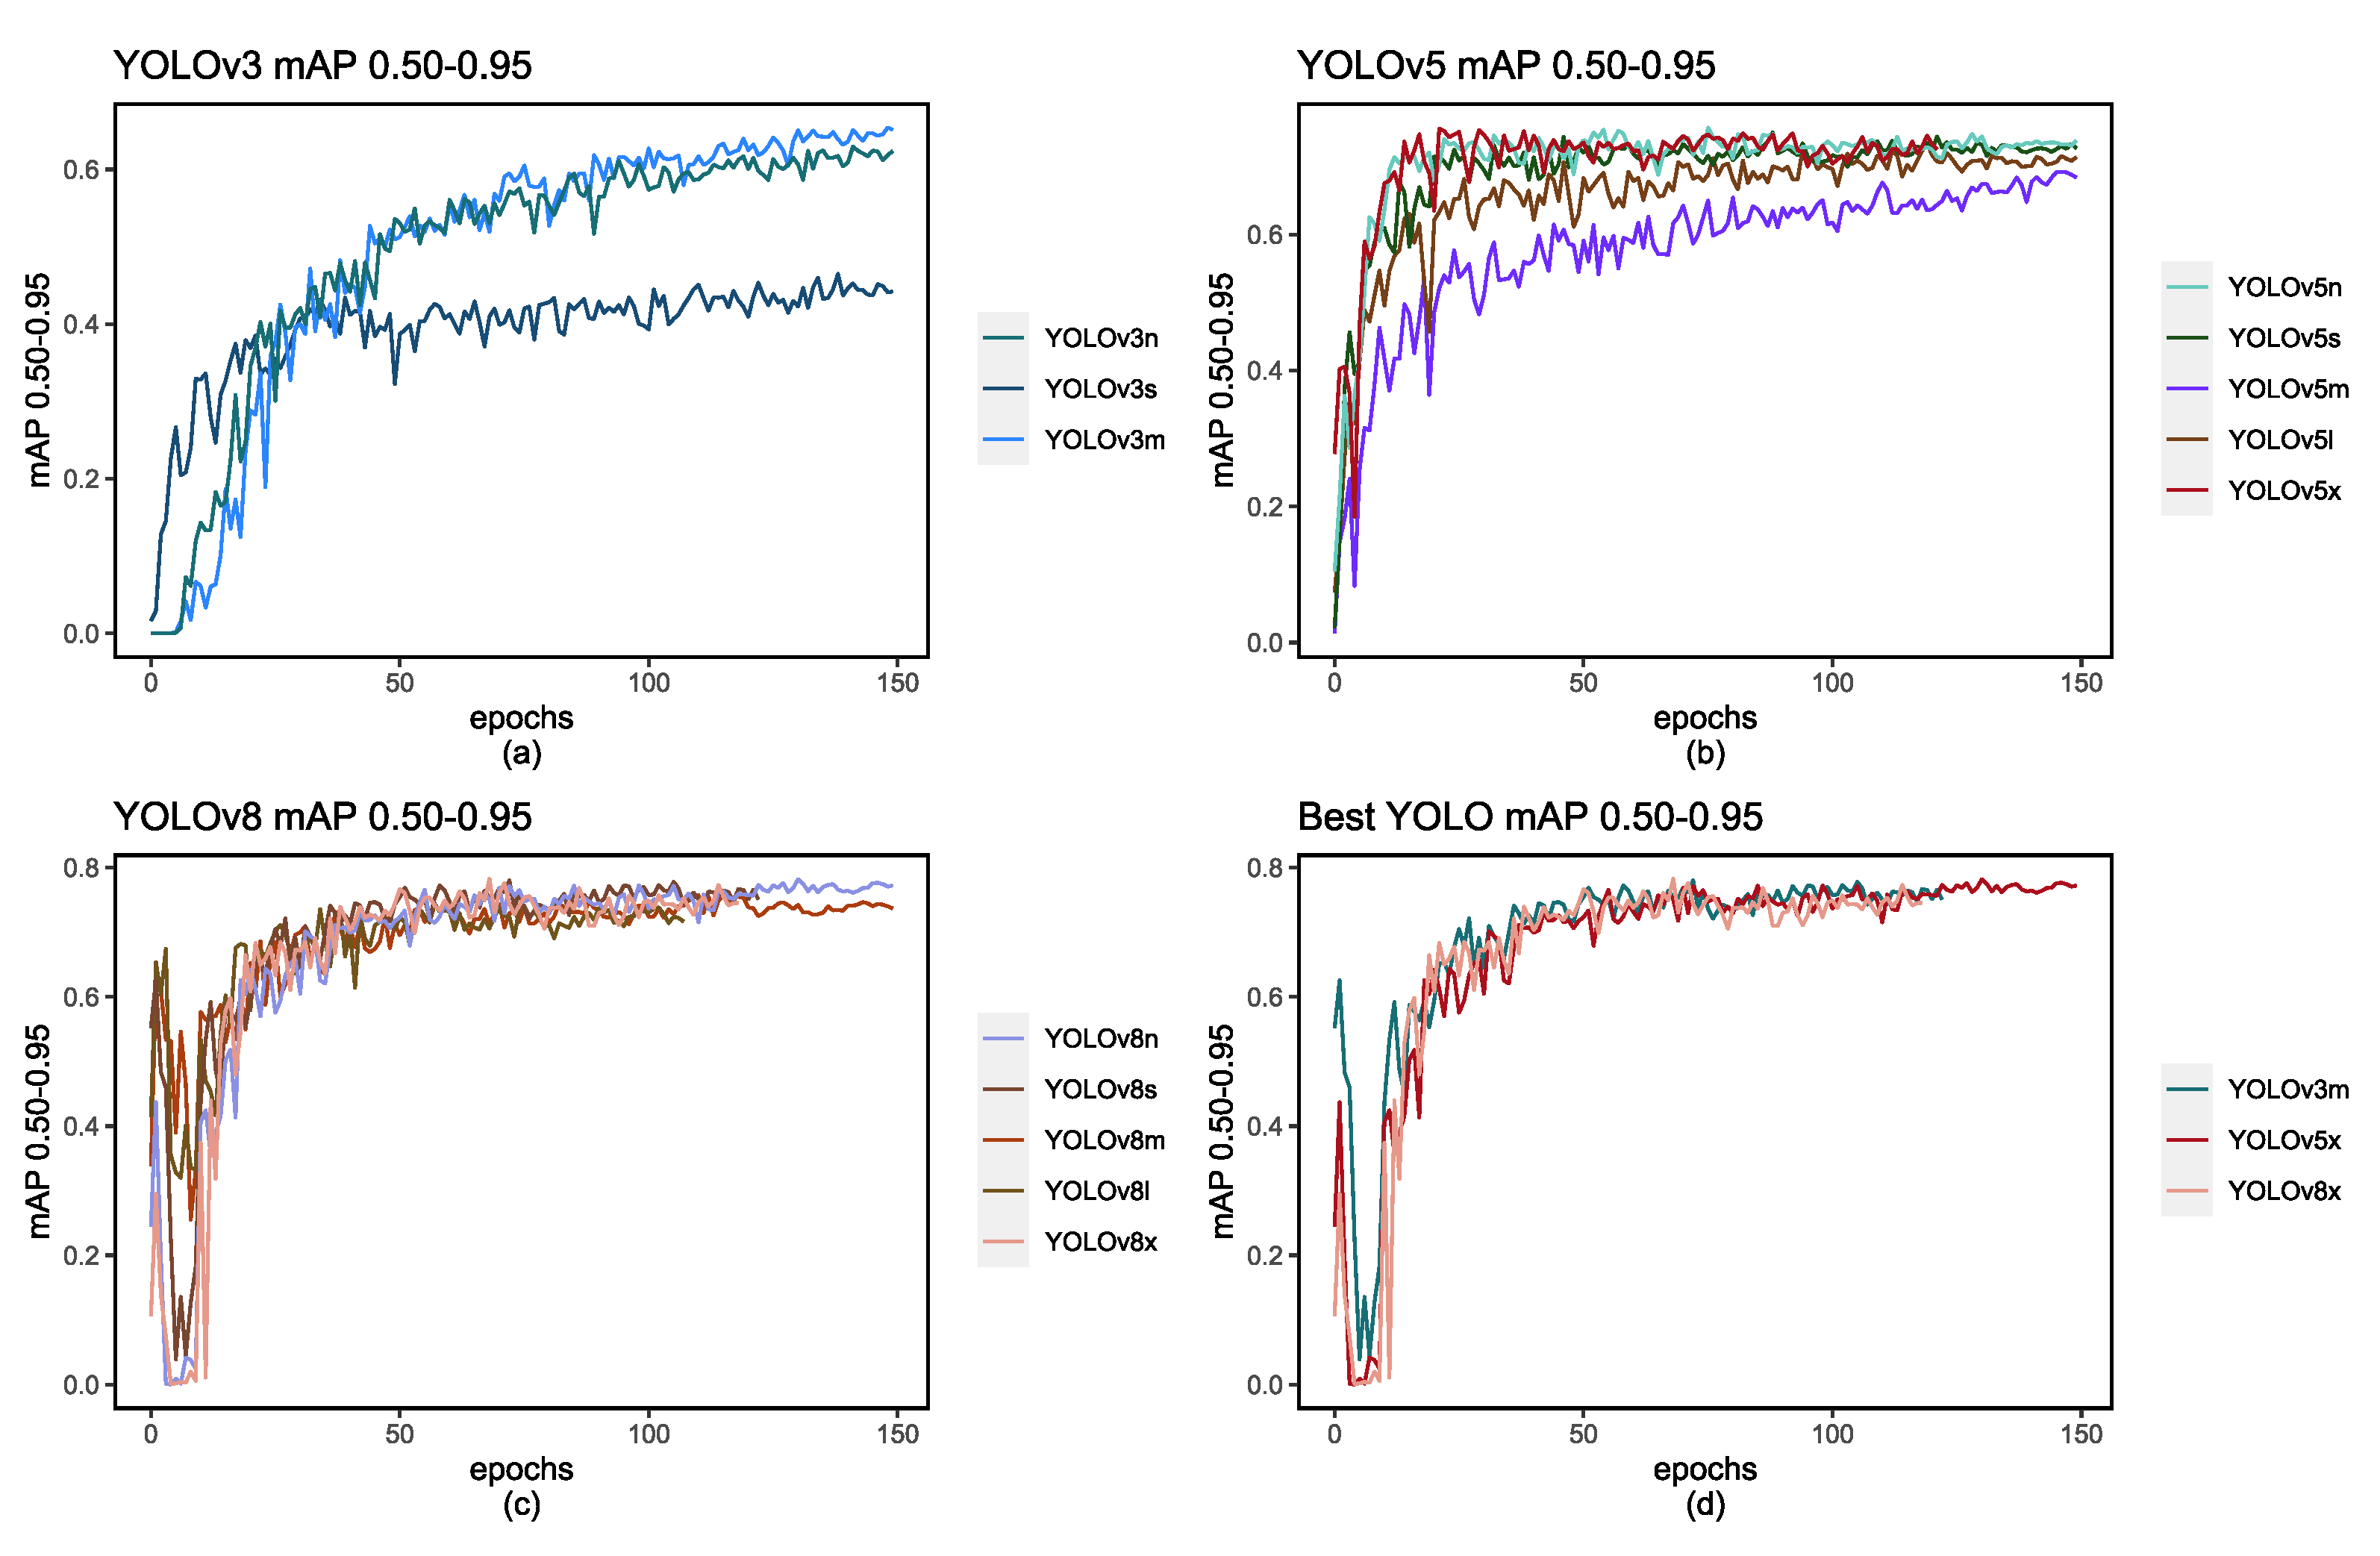
The YOLO model allows us not only to use the f1-Score, precision and recall score but also the mAP score. The calculation of mAP assumes paramount significance in the evaluation of YOLO models due to its capacity to provide a holistic assessment of the model’s object detection capabilities. In contrast to single-point metrics that gauge performance at a specific threshold, mAP takes into account multiple thresholds, typically spanning the range from 0.50 to 0.95 or beyond. This multi-threshold approach effectively captures the delicate balance between precision and recall, offering insights into how the model performs across diverse scenarios. To facilitate a comprehensive understanding of the model’s evolution, we have presented Figure 8 and Figure 9, depicting how these values evolve with each epoch, mirroring the dynamic progression of precision and recall.
Once these metrics have been clarified, in order to discuss the results of our models presented in Table 5. It is possible to observe them a notable augmentation in the F1 score as the complexity of model versions increases, and simultaneously, the training times are meticulously recorded within the same table. This data underscores a clear correlation between the size of the model and the duration required for training.
Interestingly, it is worth noting that while the highest F1 scores are associated with lower confidence scores, the YOLOv8 model exhibits a notably stable curve which can be observed in Figure 5. This stability affords us the flexibility to potentially increase our confidence score to a modest 0.80 without significantly compromising our F1 score. In doing so, we would still maintain a value exceeding 0.90. In contrast, such an adjustment in YOLOv5 and YOLOv3 would precipitate a more pronounced deterioration in the F1 score. As a result, YOLOv8x emerges as a favorable choice due to its combination of high precision, F1 score, and efficient training time.
Another crucial metric for comparison is the Precision-Recall curve, which provides insights into the behavior of these models. These curves are depicted in Figure 6. and Figure 7. and show how each model’s scores evolve with each epoch. Additionally, in Table 5, we have recorded the highest scores achieved for each metric.
Figure 5.
Figures (a), (b), and (c) depict the highest-performing models for each respective YOLO version: YOLOv3m, YOLOv5x, and YOLOv8x.
Figure 5.
Figures (a), (b), and (c) depict the highest-performing models for each respective YOLO version: YOLOv3m, YOLOv5x, and YOLOv8x.
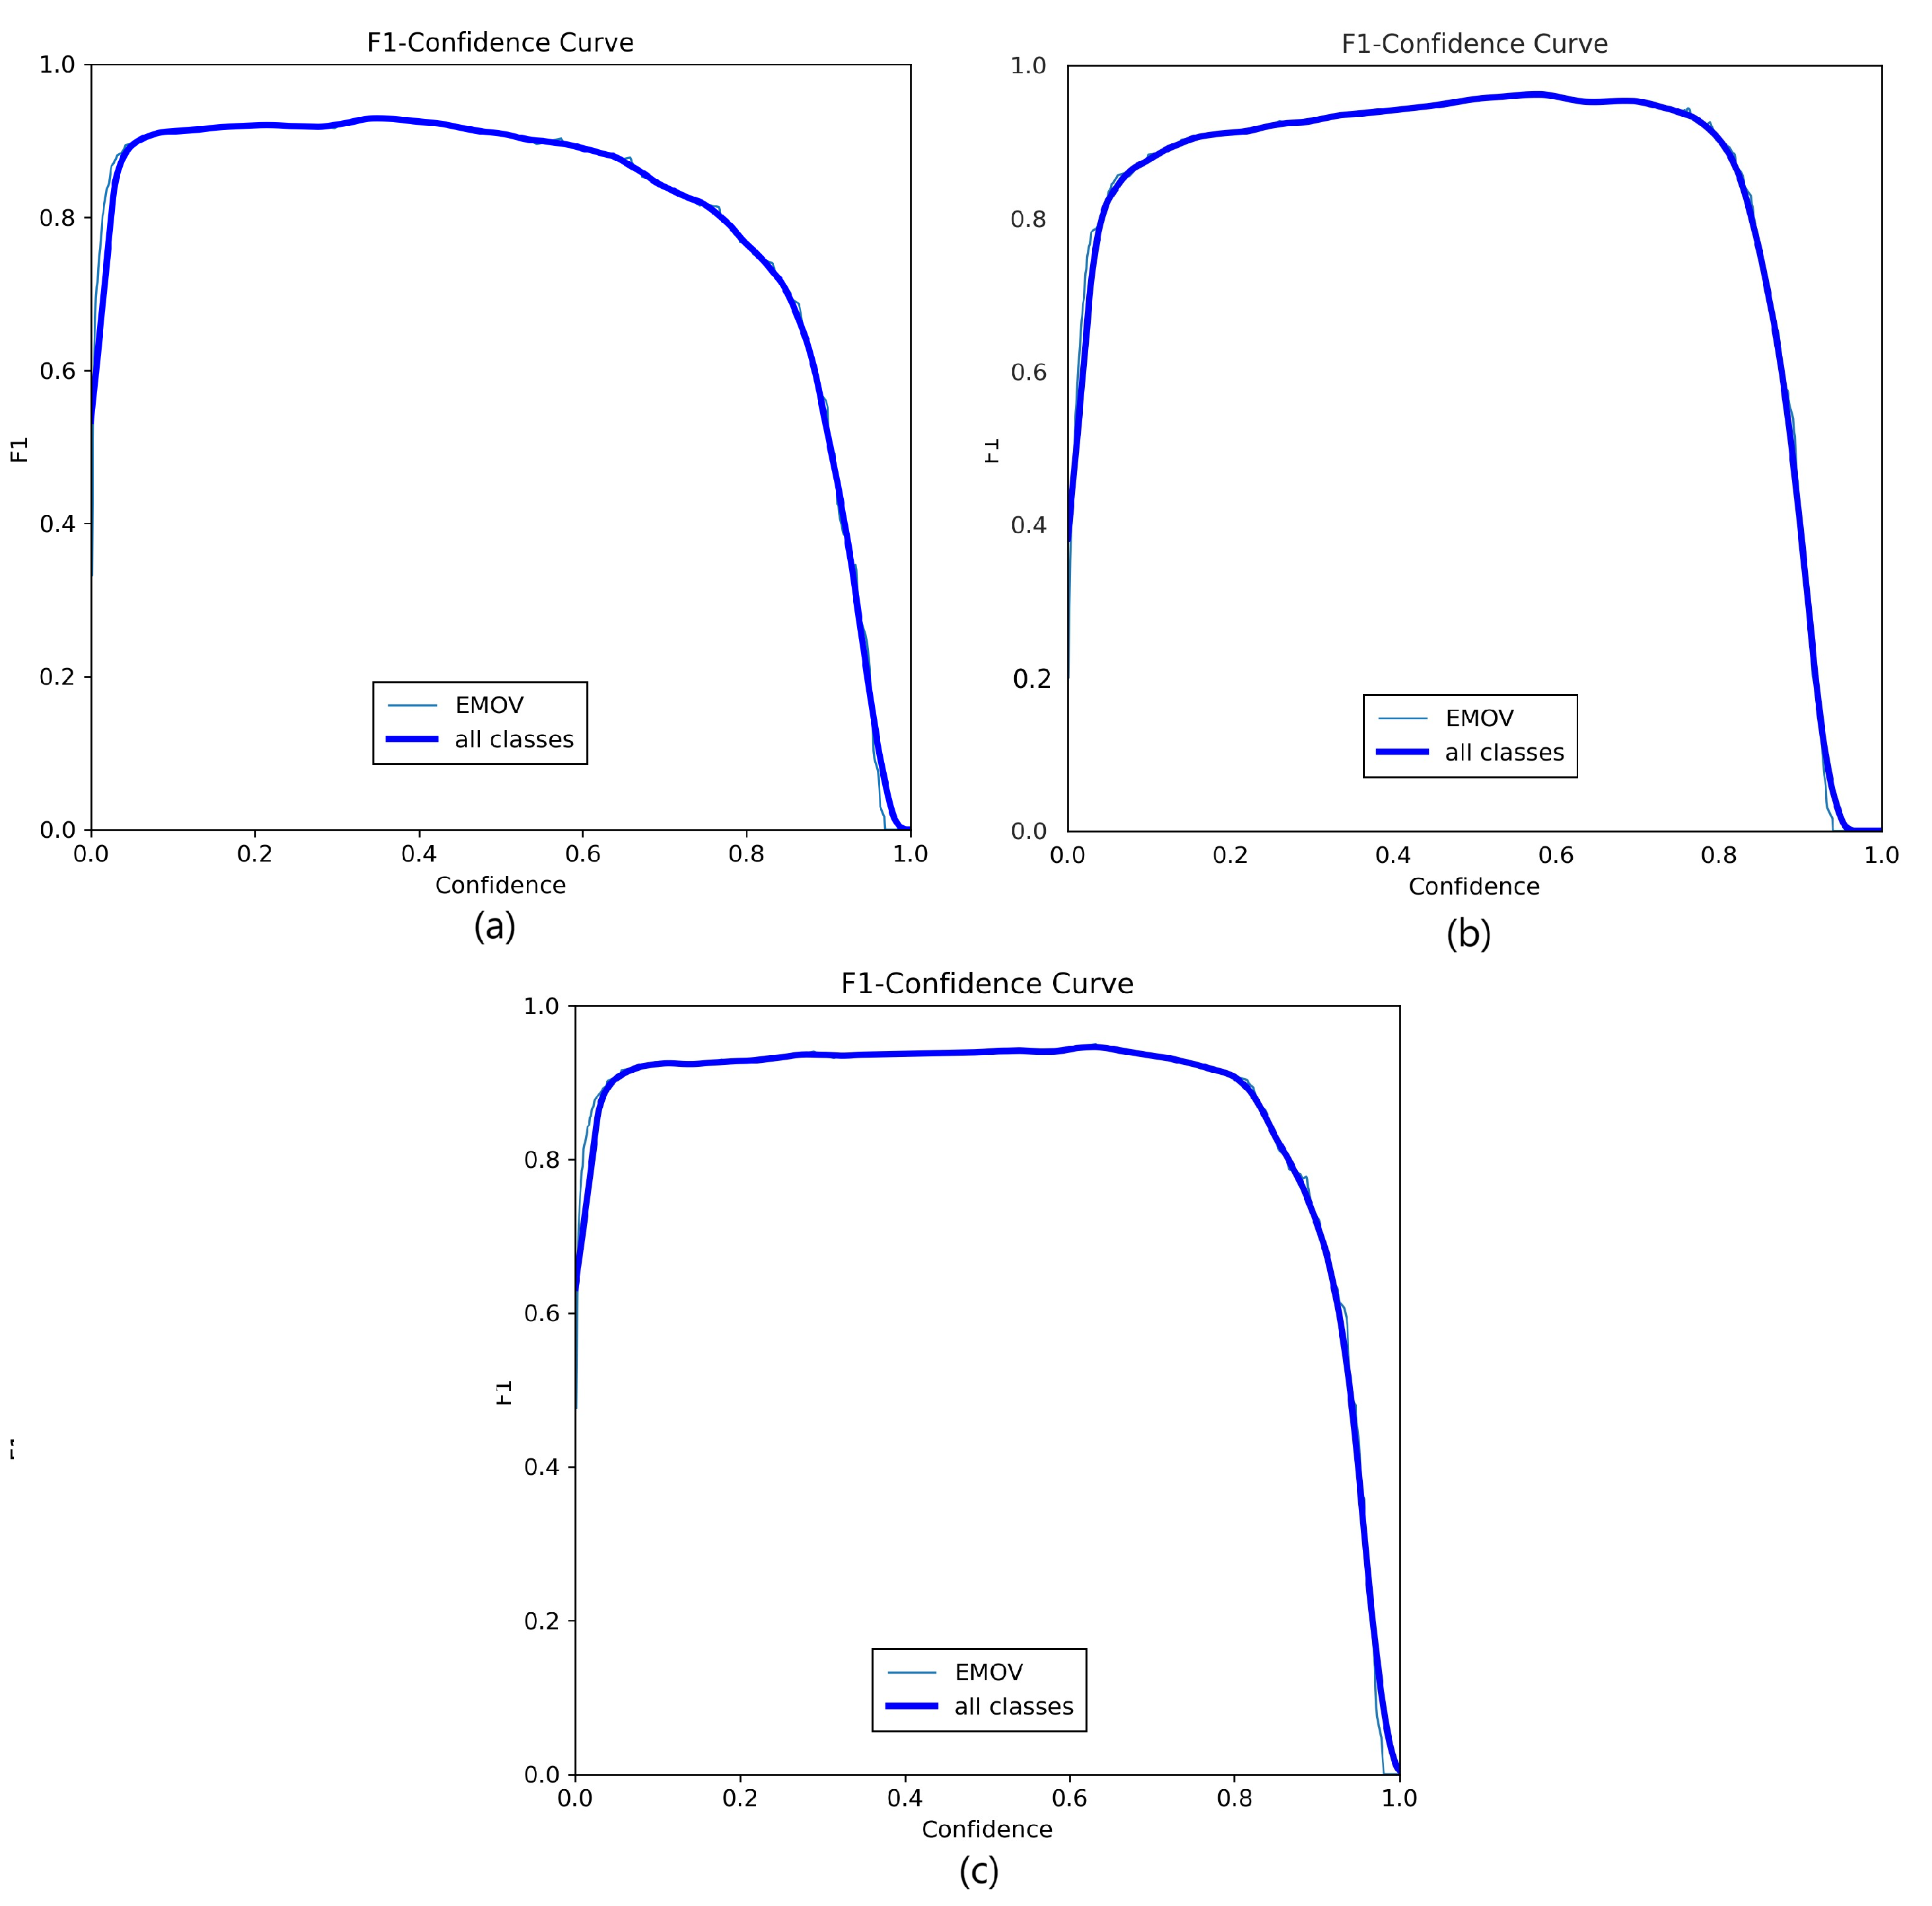
Figure 6.
Figures (a), (b), and (c) depict the precision score with each epoch, and figure (d) depicts the highest-performing models for each respective YOLO version: YOLOv3m, YOLOv5x, and YOLOv8x.
Figure 6.
Figures (a), (b), and (c) depict the precision score with each epoch, and figure (d) depicts the highest-performing models for each respective YOLO version: YOLOv3m, YOLOv5x, and YOLOv8x.
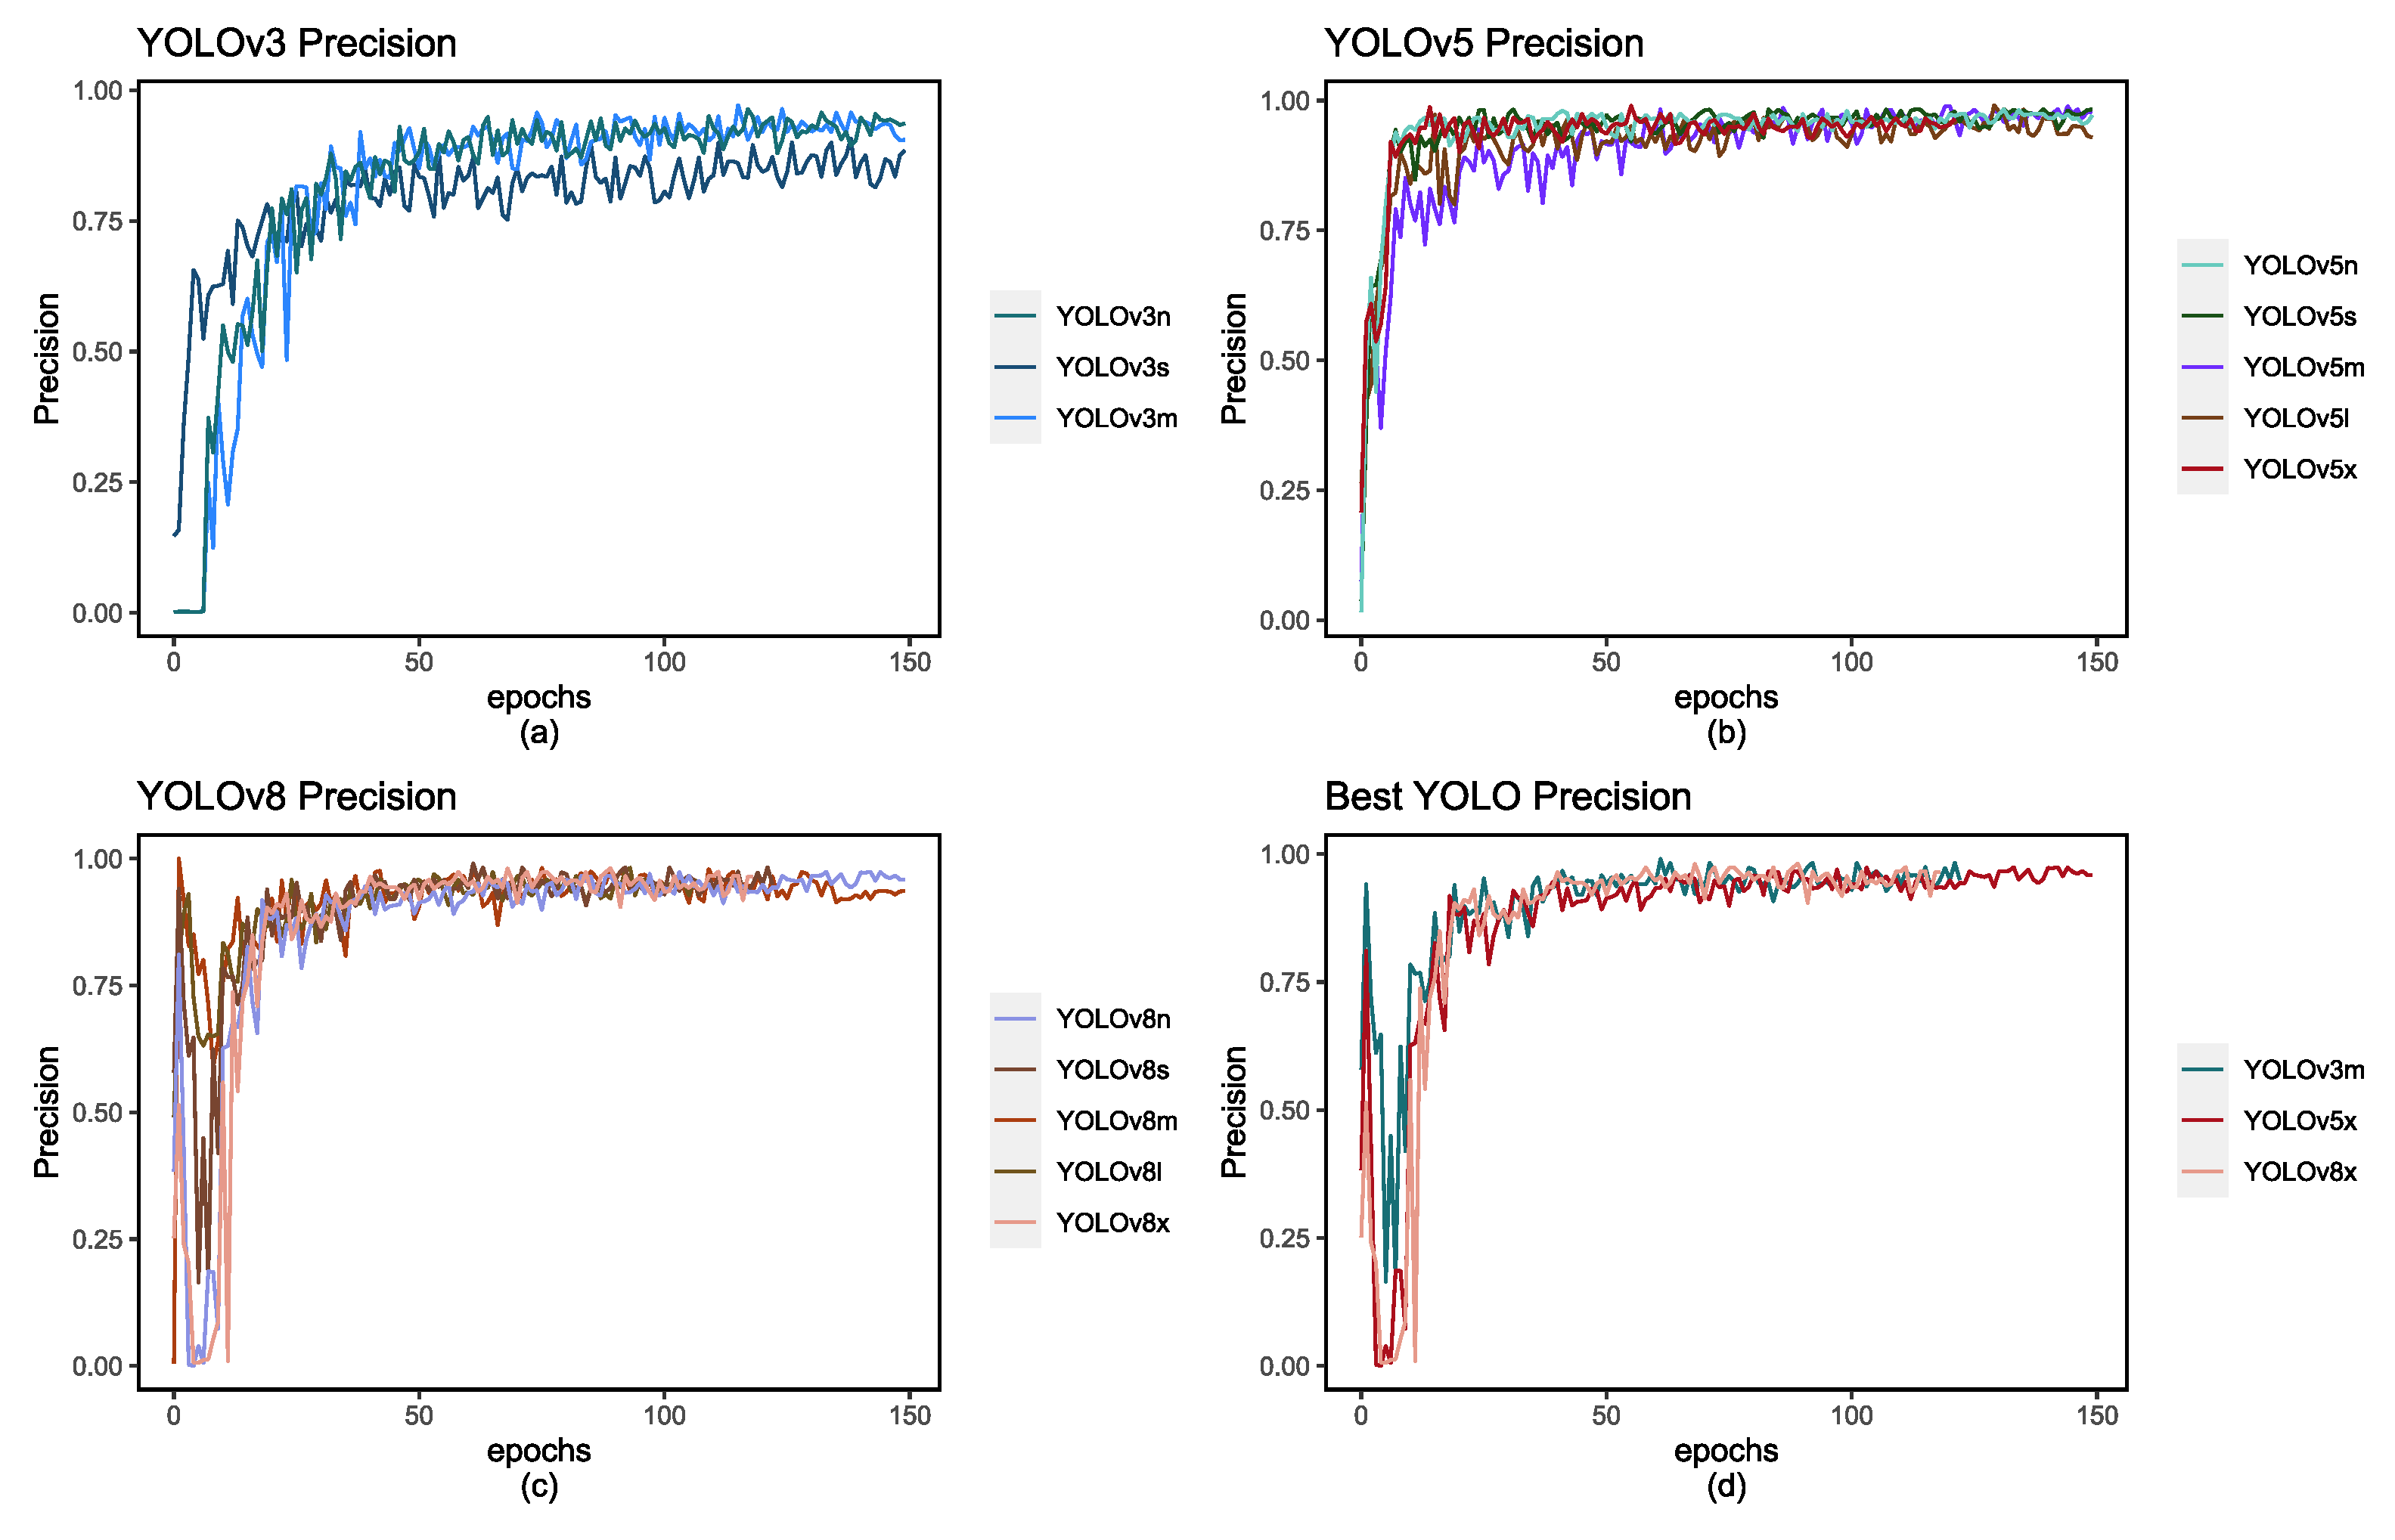
Figure 7.
Figures (a), (b), and (c) depict the recall score with each epoch, and figure (d) depicts the highest-performing models for each respective YOLO version: YOLOv3m, YOLOv5x, and YOLOv8x.
Figure 7.
Figures (a), (b), and (c) depict the recall score with each epoch, and figure (d) depicts the highest-performing models for each respective YOLO version: YOLOv3m, YOLOv5x, and YOLOv8x.
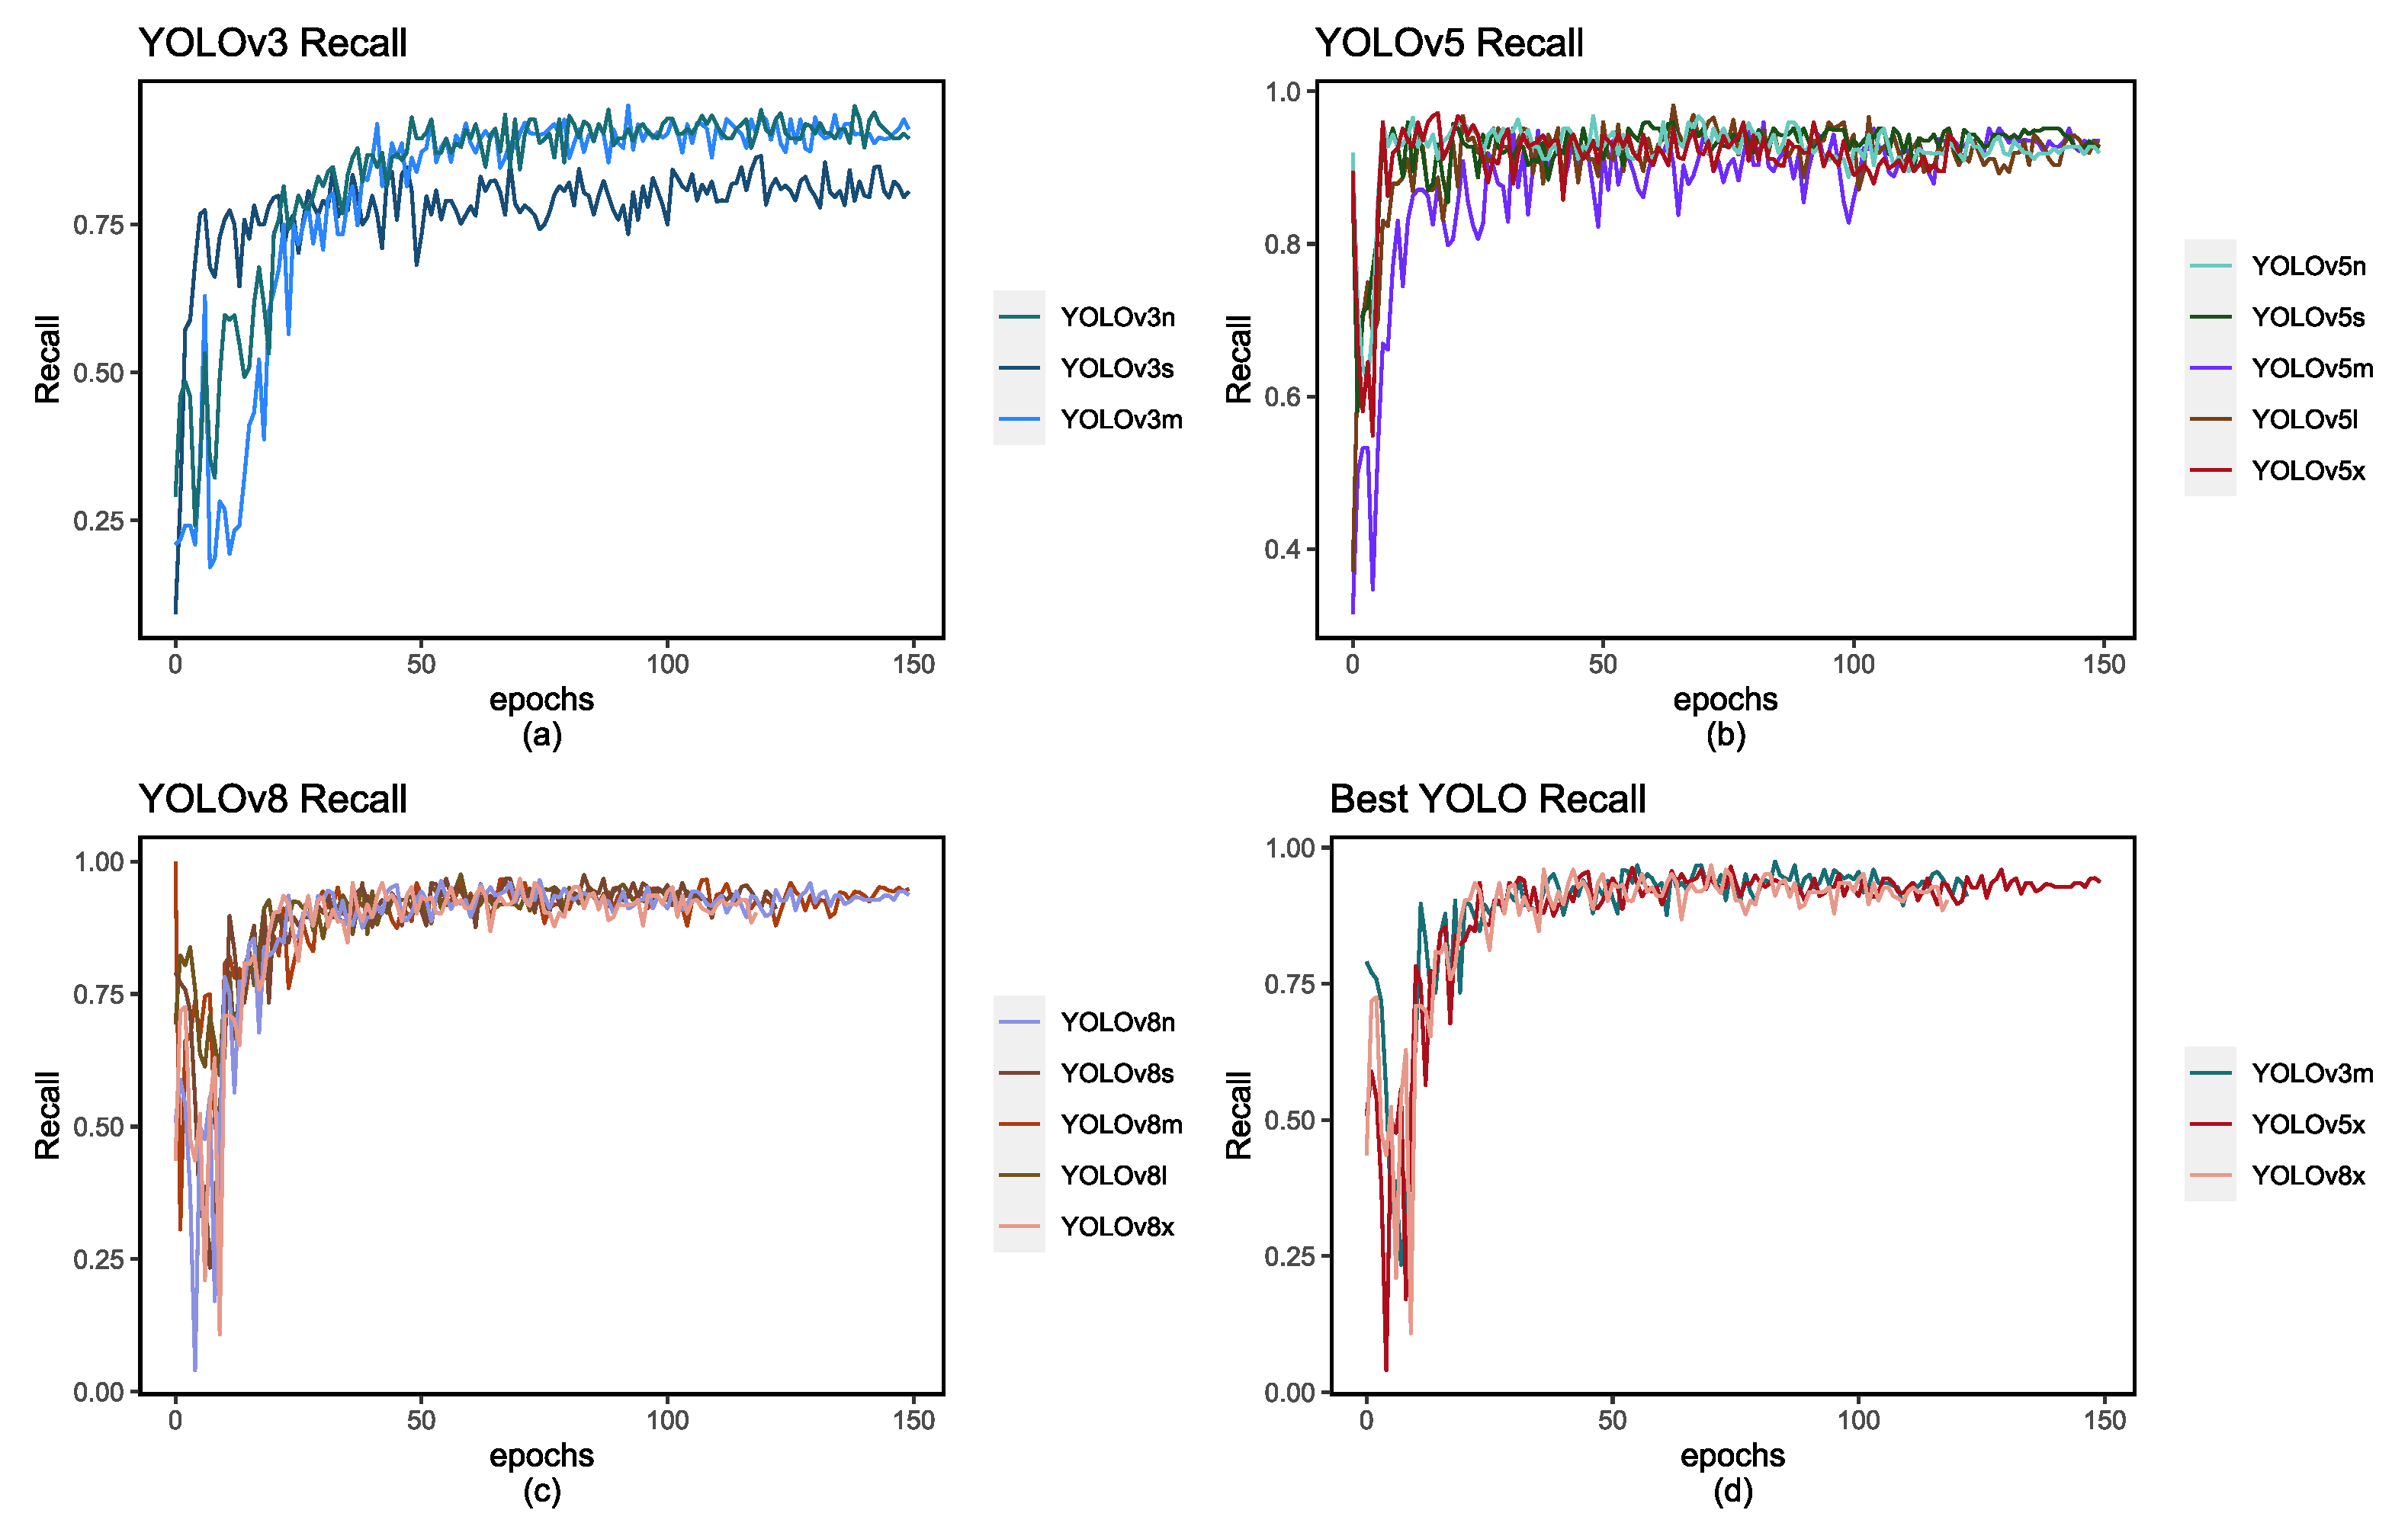
Figure 8.
Figures (a), (b), and (c) represent the mAP score with each epoch, and figure (d) depicts the highest-performing models for each respective YOLO.
Figure 8.
Figures (a), (b), and (c) represent the mAP score with each epoch, and figure (d) depicts the highest-performing models for each respective YOLO.
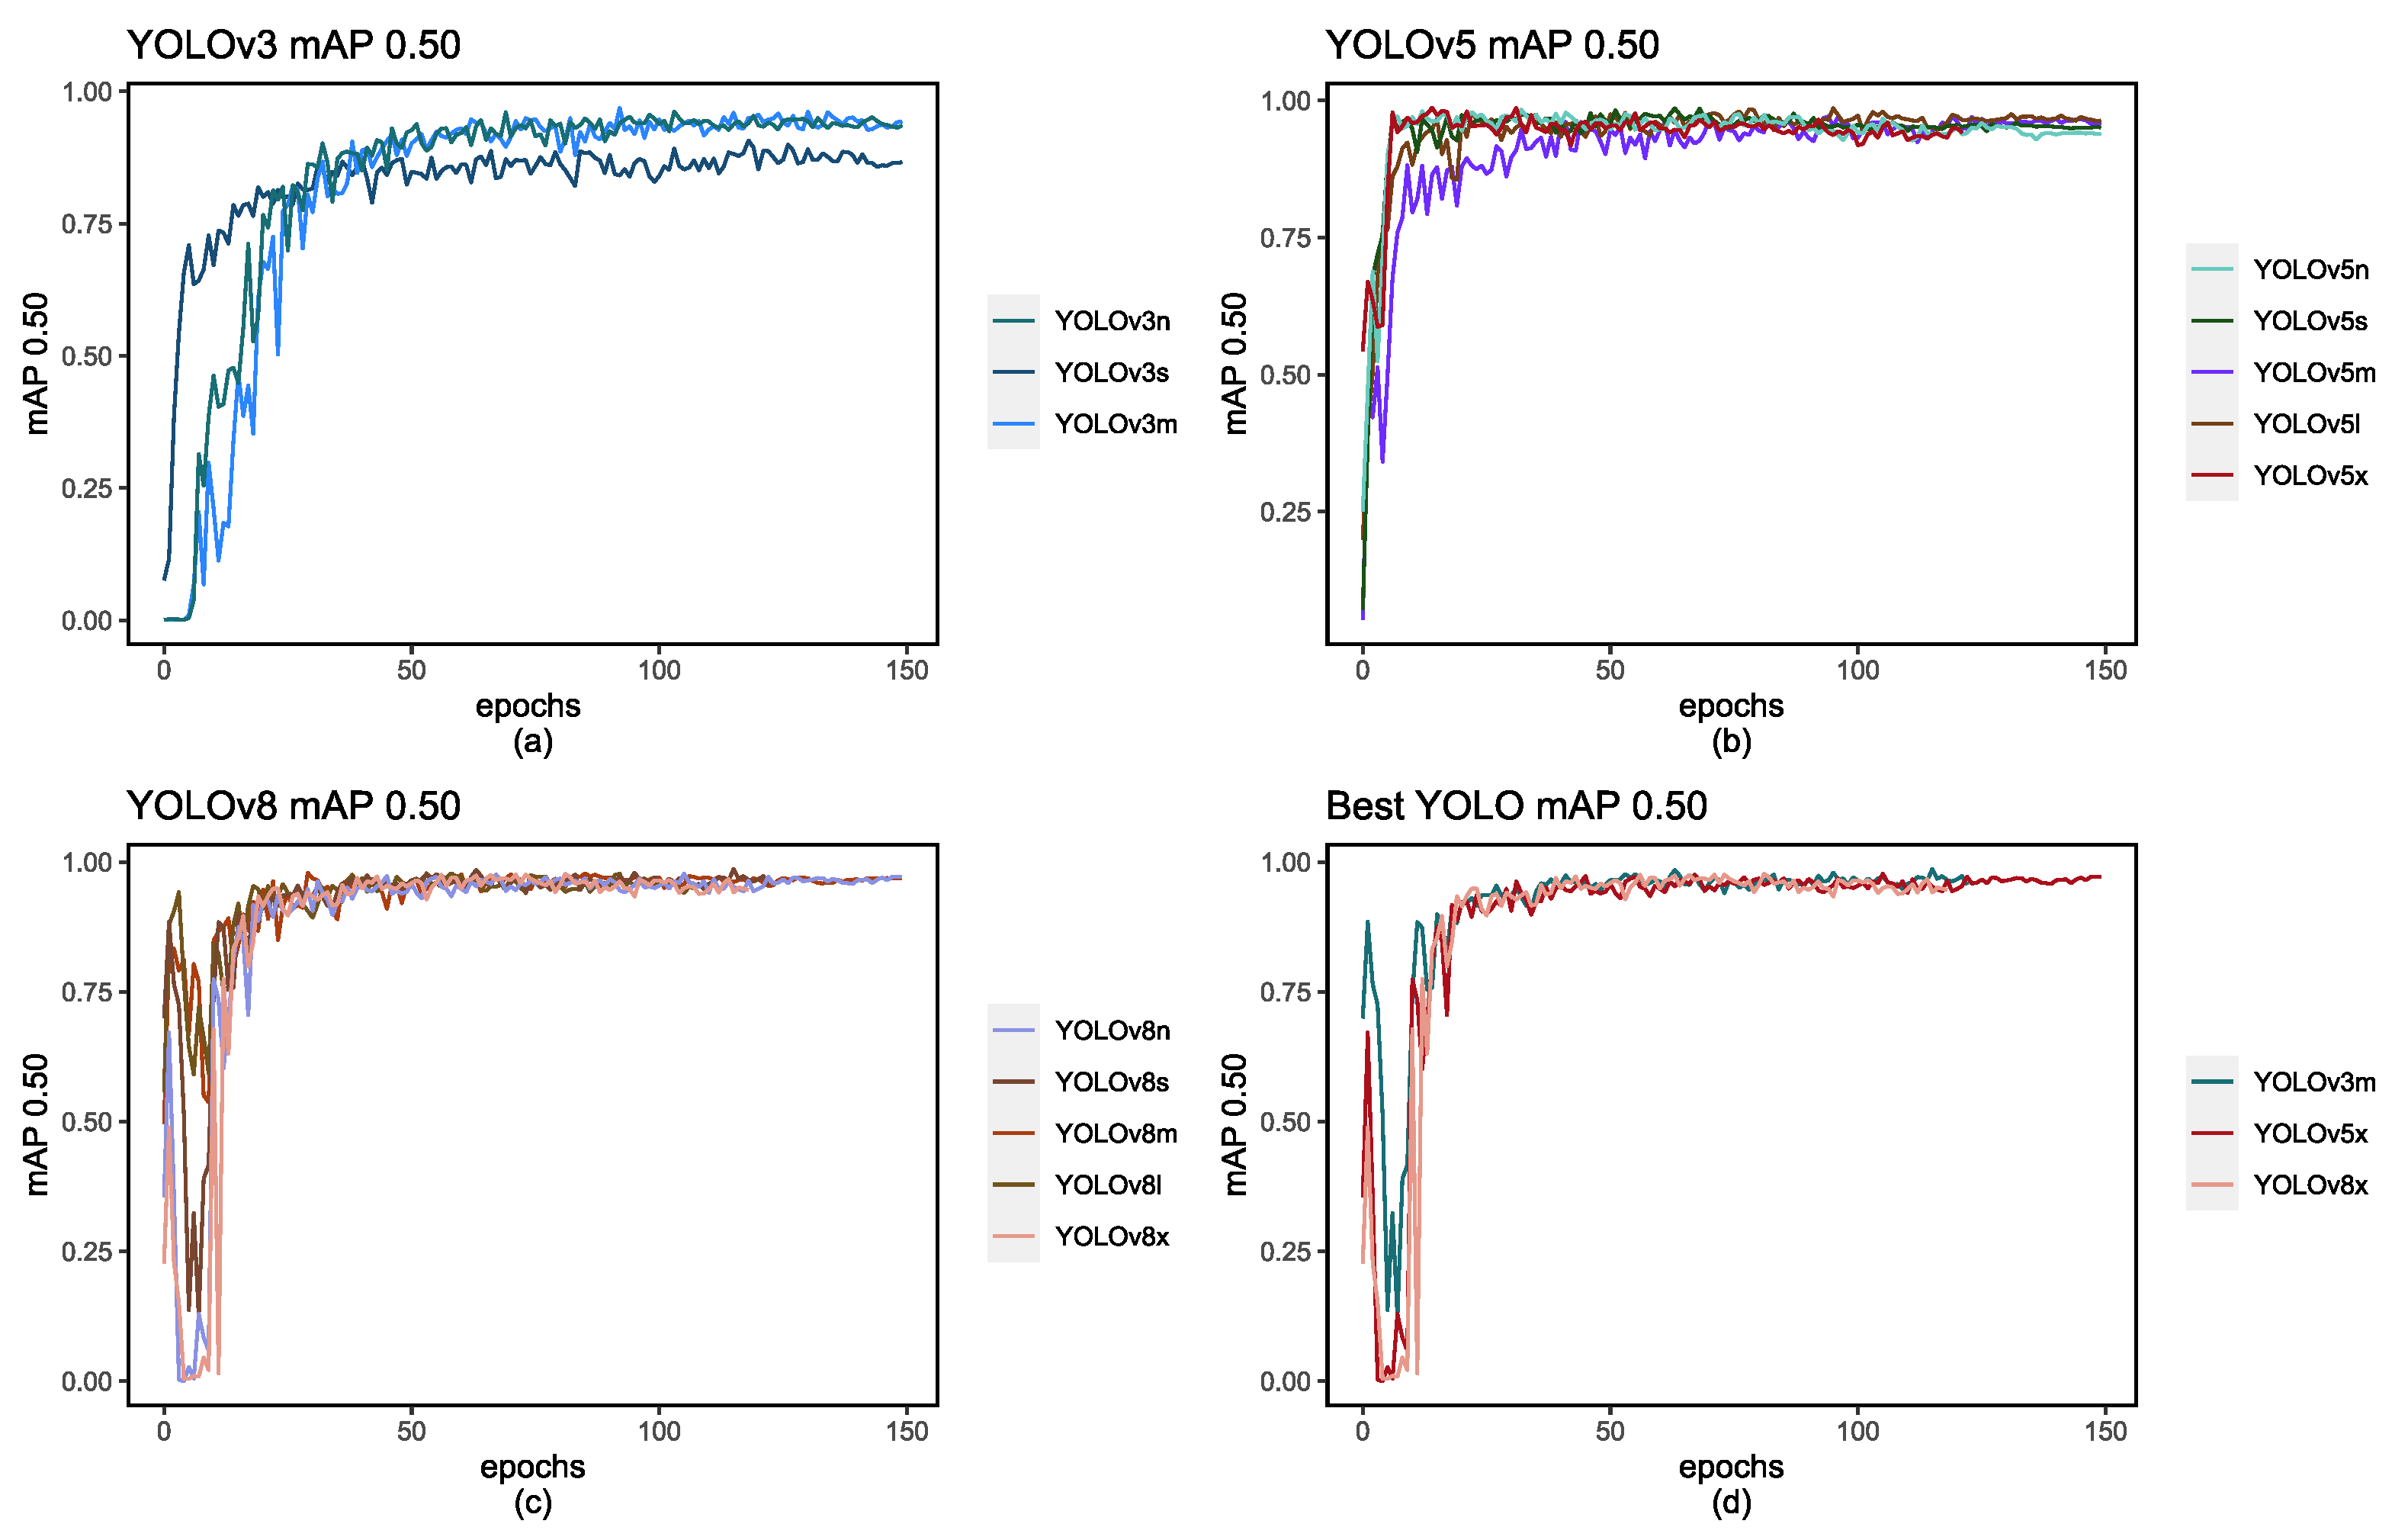
Figure 9.
Figures (a), (b), and (c) represent the mAP score of 0.50-0.95 with each epoch and figure (d) depicts the highest-performing models for each respective YOLO version.
Figure 9.
Figures (a), (b), and (c) represent the mAP score of 0.50-0.95 with each epoch and figure (d) depicts the highest-performing models for each respective YOLO version.
3.2.7. Phase 6: Behavior Analysis
Building on the promising results from Phase 5, we conducted multiple tests, as depicted in Figure 10, to verify the performance of YOLOv5 and YOLOv8. YOLOv3 demonstrated suboptimal F1 scores and object detection capabilities, particularly for real-world scenarios such as those in Autonomous vehicles. These results have led us to favor YOLOv5 and YOLOv8 models for our intended application, with YOLOv8x emerging as a particularly strong candidate. These findings underscore the model’s potential suitability for real-world scenarios, including automated vehicle applications.
4. Results and Discussion
Taking into account the advantage of the knowledge obtained from the Figure 5, Figure 6, Figure 7, Figure 8, Figure 9, Figure 10, and the data presented in Table 5, it becomes clear that the preeminent choice among YOLO models is YOLOv8x. This determination is predicated on a multifaceted analysis of several key factors that collectively affirm the superiority of this particular model.
First and foremost, the stability exhibited by the f1-Curve emerges as a pivotal consideration. While evaluating YOLO models, particularly in scenarios where real-world applications demand a high degree of confidence in object detection, it’s customary to focus solely on the highest score achieved. However, a deeper examination reveals that some other YOLO models may indeed attain commendably high scores, yet they often fail when it comes to maintaining the stability of their confidence scores. This is where YOLOv8x sets itself apart, offering a consistent and stable curve in its confidence score distribution. This invaluable characteristic empowers the YOLOv8x model to utilize higher confidence thresholds without detrimentally impacting the f1-score, thus enhancing the overall reliability of object detection.
A further salient factor of consideration lies in the precision and recall scores, metrics that furnish a measure of certainty regarding object detection performance. Precision, for instance, gauges the model’s proficiency in making accurate positive predictions, which correspond to true positives. On the other hand, recall quantifies the model’s efficacy in identifying a substantial portion of the objects of interest within images or video frames. These metrics are of paramount importance, especially in applications where high precision and recall are prerequisites for reliable object detection and avoidance of false positives or missed detections.
Moreover, the mAP scores hold significant sway in assessing model performance. A comparative analysis with related works reveals that our trained models have yielded exceptionally favorable results, often surpassing the performance benchmarks set by previously trained models. What’s notable is that the utilization of mAP scores in the range of 0.50 to 0.95 is relatively rare in research due to the inherent difficulty of achieving high values within this range. In our specific study, our models consistently achieved a mAP score exceeding 0.60, thus instilling a high degree of confidence in the robustness and efficacy of our object detection models.
It is worth acknowledging that the successful execution of this research endeavor was made possible by the availability of the advanced hardware resources mentioned earlier. These resources, characterized by their substantial computational capacity and efficient processing capabilities, were pivotal in expediting the training of our models. This dramatic reduction in training time, from potentially days or weeks to mere minutes and hours, underscores the transformative impact of cutting-edge hardware resources on the field of computer vision and deep learning research. This, in turn, accelerates progress and innovation in autonomous systems and object detection, ultimately leading to safer and more reliable real-world applications.
5. Conclusion
In summary, our investigation has identified the model for object detection, specifically YOLOv8x. This model has demonstrated outstanding detection performance, given different real world scenarios. Such capabilities make this model particularly valuable for the detection of traffic officers, especially within the context of Autonomous vehicles.
To provide an overview of our results, we evaluated three YOLO models (versions 3, 5, and 8), and within each version, we considered various iterations. This extensive experimentation was facilitated by meeting the necessary requirements for deploying these models. Notably, data collection proved to be the most time-consuming aspect of our research, as it entailed pioneering efforts in this field.
Our comprehensive 6-phase methodology revealed that the larger versions of each YOLO variant consistently delivered the most promising results. Employing various evaluation metrics, these models exhibited robust performance across multiple dimensions. This is of utmost importance, especially when real-time detection of traffic officers is a critical requirement for potential deployment in Autonomous vehicles. YOLOv8x achieved an impressive F1-score of 0.95 and a confidence score of 0.631. Importantly, this confidence score can be adjusted to 0.80 without significantly compromising the F1-score, distinguishing it from other models that experience more pronounced performance degradation under such adjustments.
In conclusion, our study aims to enhance the capabilities of Autonomous vehicles to navigate complex situations and make informed decisions when encountering traffic officers, thereby advancing the field of autonomous transportation systems.
Author Contributions
Conceptualization, methodology, software, validation, investigation: J.P.O, D.D., P.I., and J.D.V; formal analysis, D.D, P.I., J.P.O., and J.D.V.; writing-original draft preparation, D.D. and P.I.; writing-review and editing J.P.O., D.D., P.I. and J.D.V.; resource management, J.D.V.; supervision, J.D.V. and J.P.O.; dataset collection and data Preparation, J.P.O.; All authors have read and agreed to the published version of the manuscript.
Funding
This research received support from the GIIT at the Polytechnic Salesian University of Cuenca, Ecuador.
Data Availability Statement
The labeled images utilized to substantiate the findings of this study can be obtained upon request from the corresponding authors.
Acknowledgments
The authors are thankful to the project: "Desarrollo de Estrategias de Movilidad Inteligente, Sostenible y Aceptación Social de Vehículos Autónomos en la Ciudad de Cuenca, Empleando Técnicas de Inteligencia Artificial y Realidad Virtual en Plataformas de Software y Hardware Especializados" of the Transport Engineering Research Group (GIIT) of the Universidad Politecnica Salesiana for providing the data used in this document.
Conflicts of Interest
The authors declare no conflict of interest.
Abbreviations
The following abbreviations are used in this manuscript:
| AI | Artificial Intelligence |
| AV | Autonomous Vehicle |
| CCTV | Closed-Circuit Television |
| FPS | Frames Per Second |
| GCN | Graph-Based Networks |
| GPU | Graphics Processing Unit |
| LiDAR | Light Detection and Ranging |
| mAP | mean Average Precision |
| MOTA | Multiple Object Tracking Accuracy |
| OCD | Osteochondritis Dissecans |
| PANet | Path Aggregation Network |
| RNN | Recurrent Neural Network |
| SPP | Spatial Pyramid Pooling |
| SPPF | Spatial Pixel Pair Features |
| TCN | Temporal Convolutional Network |
| UAV | Unmanned Aerial Vehicle |
| YOLO | You Only Look Once |
References
- Yeong, D.J.; Velasco-Hernandez, G.; Barry, J.; Walsh, J. Sensor and Sensor Fusion Technology in Autonomous Vehicles: A Review. Sensors 2021, 21. [Google Scholar] [CrossRef] [PubMed]
- Vargas, J.; Alsweiss, S.; Toker, O.; Razdan, R.; Santos, J. An Overview of Autonomous Vehicles Sensors and Their Vulnerability to Weather Conditions. Sensors 2021, 21. [Google Scholar] [CrossRef] [PubMed]
- Peng, L.; Wang, H.; Li, J. Uncertainty Evaluation of Object Detection Algorithms for Autonomous Vehicles. Automotive Innovation 2021, 4, 241–252. [Google Scholar] [CrossRef]
- Vargas, J.; Alsweiss, S.; Toker, O.; Razdan, R.; Santos, J. An Overview of Autonomous Vehicles Sensors and Their Vulnerability to Weather Conditions. Sensors 2021, 21. [Google Scholar] [CrossRef] [PubMed]
- Parekh, D.; Poddar, N.; Rajpurkar, A.; Chahal, M.; Kumar, N.; Joshi, G.P.; Cho, W. A Review on Autonomous Vehicles: Progress, Methods and Challenges. Electronics 2022, 11. [Google Scholar] [CrossRef]
- Gupta, A.; Anpalagan, A.; Guan, L.; Khwaja, A.S. Deep learning for object detection and scene perception in self-driving cars: Survey, challenges, and open issues. Array 2021, 10, 100057. [Google Scholar] [CrossRef]
- Stockem Novo, A.; Hürten, C.; Baumann, R.; Sieberg, P. Self-evaluation of automated vehicles based on physics, state-of-the-art motion prediction and user experience. Scientific Reports 2023, 13, 12692. [Google Scholar] [CrossRef] [PubMed]
- Idrovo-Berrezueta, P.; Dutan-Sanchez, D.; Hurtado-Ortiz, R.; Robles-Bykbaev, V. Data Analysis Architecture using Techniques of Machine Learning for the Prediction of the Quality of Blood Fonations against the Hepatitis C Virus. 2022 IEEE International Autumn Meeting on Power, Electronics and Computing (ROPEC); IEEE: Ixtapa, Mexico, 2022; pp. 1–7. [Google Scholar] [CrossRef]
- Idrovo-Berrezueta, P.; Dutan-Sanchez, D.; Robles-Bykbaev, V. Comparison of Transfer Learning vs. Hyperparameter Tuning to Improve Neural Networks Precision in the Early Detection of Pneumonia in Chest X-Rays. In Information Technology and Systems; Rocha, A., Ferras, C., Ibarra, W., Eds.; Springer International Publishing: Cham, 2023; Vol. 691, pp. 263–272.Series Title: Lecture Notes in Networks and Systems. [Google Scholar] [CrossRef]
- He, J.; Zhang, C.; He, X.; Dong, R. Visual Recognition of traffic police gestures with convolutional pose machine and handcrafted features. Neurocomputing 2020, 390, 248–259. [Google Scholar] [CrossRef]
- Mishra, A.; Kim, J.; Cha, J.; Kim, D.; Kim, S. Authorized Traffic Controller Hand Gesture Recognition for Situation-Aware Autonomous Driving. Sensors 2021, 21. [Google Scholar] [CrossRef] [PubMed]
- Wiederer, J.; Bouazizi, A.; Kressel, U.; Belagiannis, V. Traffic Control Gesture Recognition for Autonomous Vehicles. 2020 IEEE/RSJ International Conference on Intelligent Robots and Systems (IROS), 2020, pp. 10676–10683. [CrossRef]
- Self-driving car stopped by San Francisco police, 2022.
- Public perceptions of autonomous vehicle safety: An international comparison, 2020. Publisher: Elsevier. [CrossRef]
- Sharma, N.; Baral, S.; Paing, M.P.; Chawuthai, R. Parking Time Violation Tracking Using YOLOv8 and Tracking Algorithms. Sensors 2023, 23, 5843. [Google Scholar] [CrossRef] [PubMed]
- Roboflow. Everything you need to build and deploy computer vision models. https://roboflow.com/. [Accessed 25-08-2023].
- Yasamorn, A.; Wongcharoen, A.; Joochim, C. Object Detection of Pedestrian Crossing Accident Using Deep Convolutional Neural Networks. 2022 Research, Invention, and Innovation Congress: Innovative Electricals and Electronics (RI2C); IEEE: Bangkok, Thailand, 2022; pp. 297–303. [Google Scholar] [CrossRef]
- Menon, A.; Omman, B.; S, A. Pedestrian Counting Using Yolo V3. 2021 International Conference on Innovative Trends in Information Technology (ICITIIT); IEEE: Kottayam, India, 2021; pp. 1–9. [Google Scholar] [CrossRef]
- Wei, C.; Tan, Z.; Qing, Q.; Zeng, R.; Wen, G. Fast Helmet and License Plate Detection Based on Lightweight YOLOv5. Sensors 2023, 23, 4335. [Google Scholar] [CrossRef] [PubMed]
- Avupati, S.L.; Harshitha, A.; Jeedigunta, S.P.; Sai Chikitha Chowdary, D.; Pushpa, B. Traffic Rules Violation Detection using YOLO and HAAR Cascade. 2023 9th International Conference on Advanced Computing and Communication Systems (ICACCS); IEEE: Coimbatore, India, 2023; pp. 1159–1163. [Google Scholar] [CrossRef]
- Wang, J.; Song, Q.; Hou, M.; Jin, G. Infrared Image Object Detection of Vehicle and Person Based on Improved YOLOv5. In Web and Big Data. APWeb-WAIM 2022 International Workshops; Yang, S.; Islam, S., Eds.; Springer Nature Singapore: Singapore, 2023. Vol. 1784, pp.175–187. Series Title: Communications in Computerand Information Science. [CrossRef]
- Nepal, U.; Eslamiat, H. Comparing YOLOv3, YOLOv4 and YOLOv5 for Autonomous Landing Spot Detection in Faulty UAVs. Sensors 2022, 22, 464. [Google Scholar] [CrossRef] [PubMed]
- Inui, A.; Mifune, Y.; Nishimoto, H.; Mukohara, S.; Fukuda, S.; Kato, T.; Furukawa, T.; Tanaka, S.; Kusunose, M.; Takigami, S.; Ehara, Y.; Kuroda, R. Detection of Elbow OCD in the Ultrasound Image by Artificial Intelligence Using YOLOv8. Applied Sciences 2023, 13, 7623. [Google Scholar] [CrossRef]
- GitHub - ultralytics/ultralytics: NEW - YOLOv8 in PyTorch > ONNX > OpenVINO > CoreML > TFLite — github.com. https://github.com/ultralytics/ultralytics. [Accessed 25-09-2023].
- Mota-Delfin, C.; López-Canteñs, G.D.J.; López-Cruz, I.L.; Romantchik-Kriuchkova, E.; Olguín-Rojas, J.C. Detection and Counting of Corn Plants in the Presence of Weeds with Convolutional Neural Networks. Remote Sensing 2022, 14, 4892. [Google Scholar] [CrossRef]
Figure 1.
One-Stage architecture detector for YOLO versions 3, and 8.
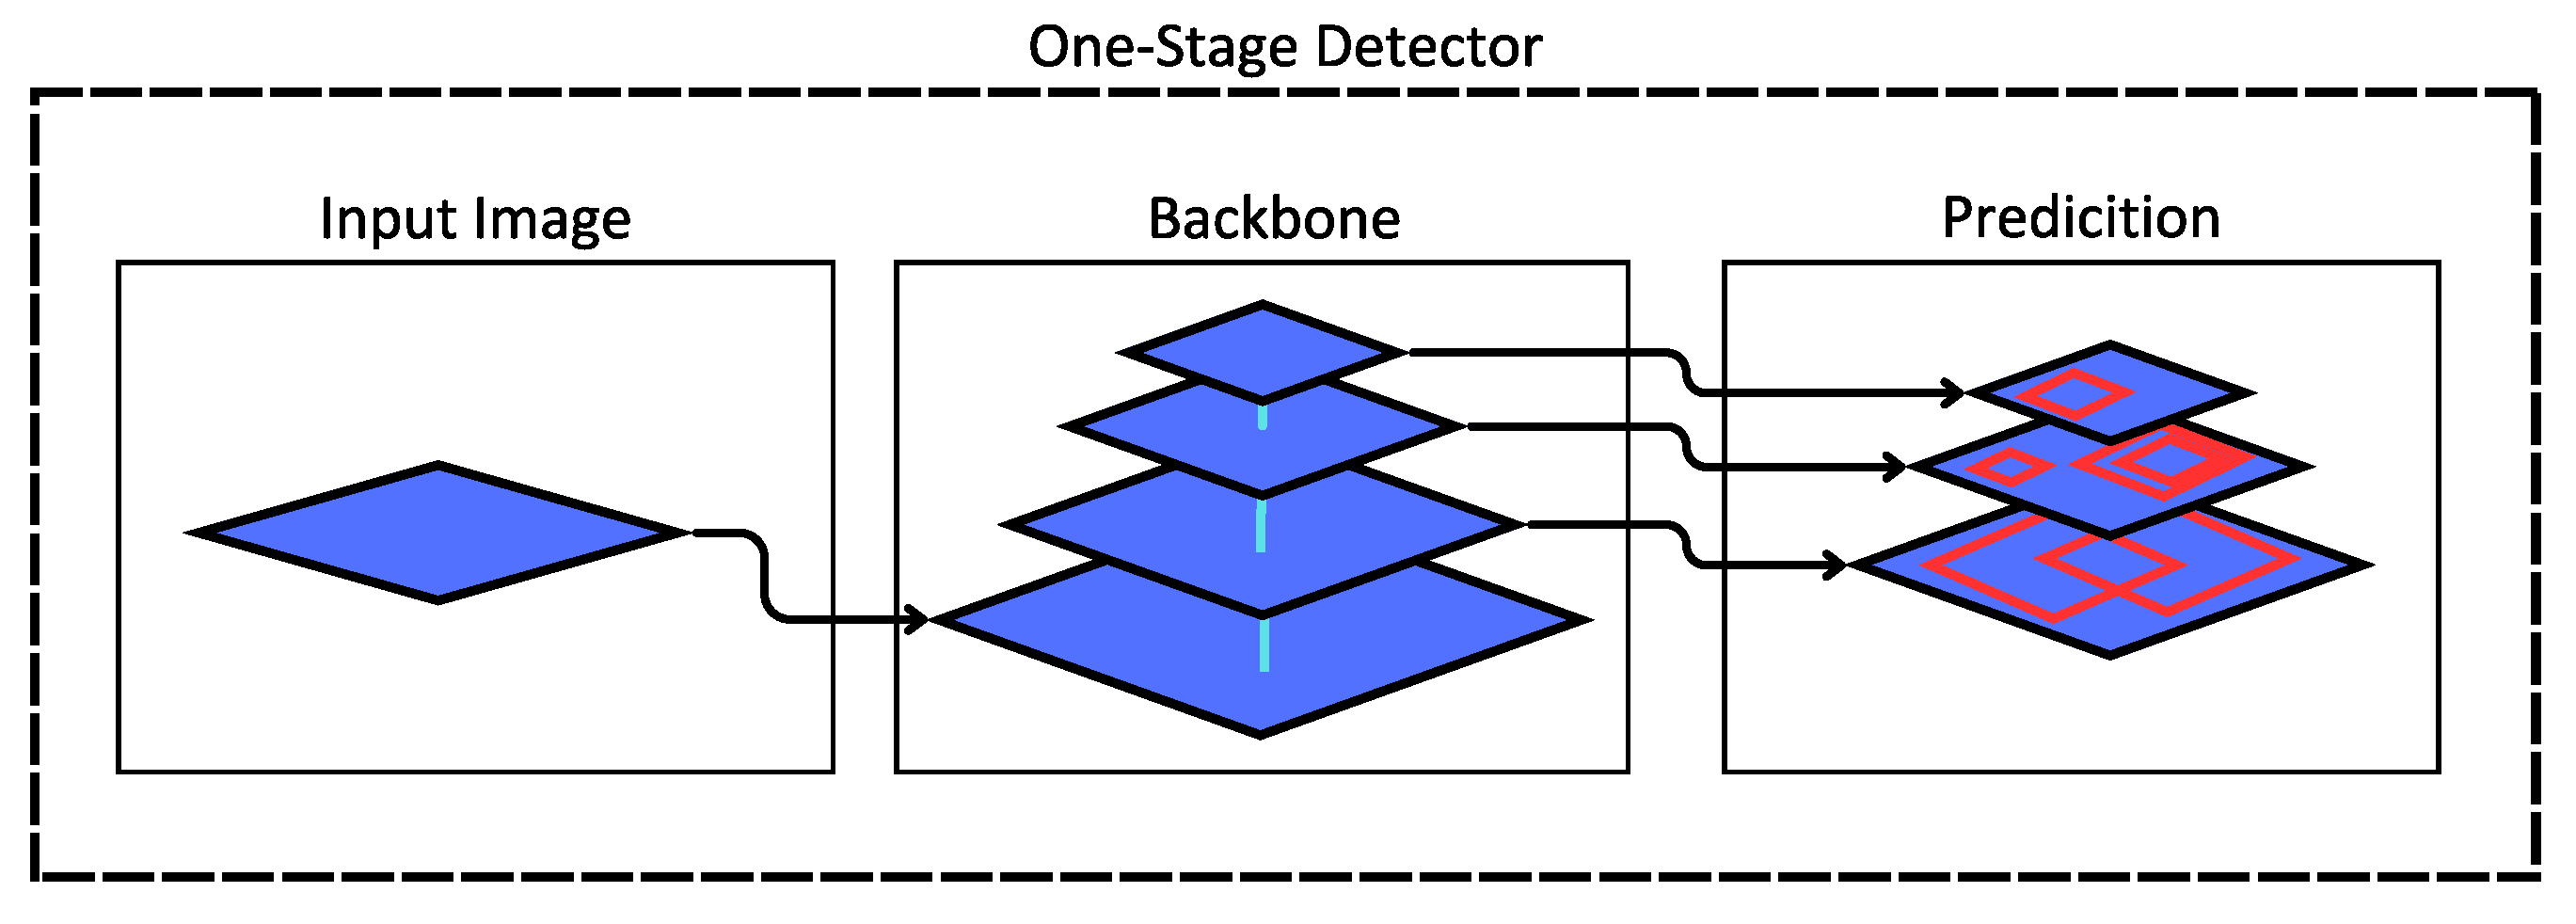
Figure 3.
Six-Phase Proposed Methodology in Visual Context.
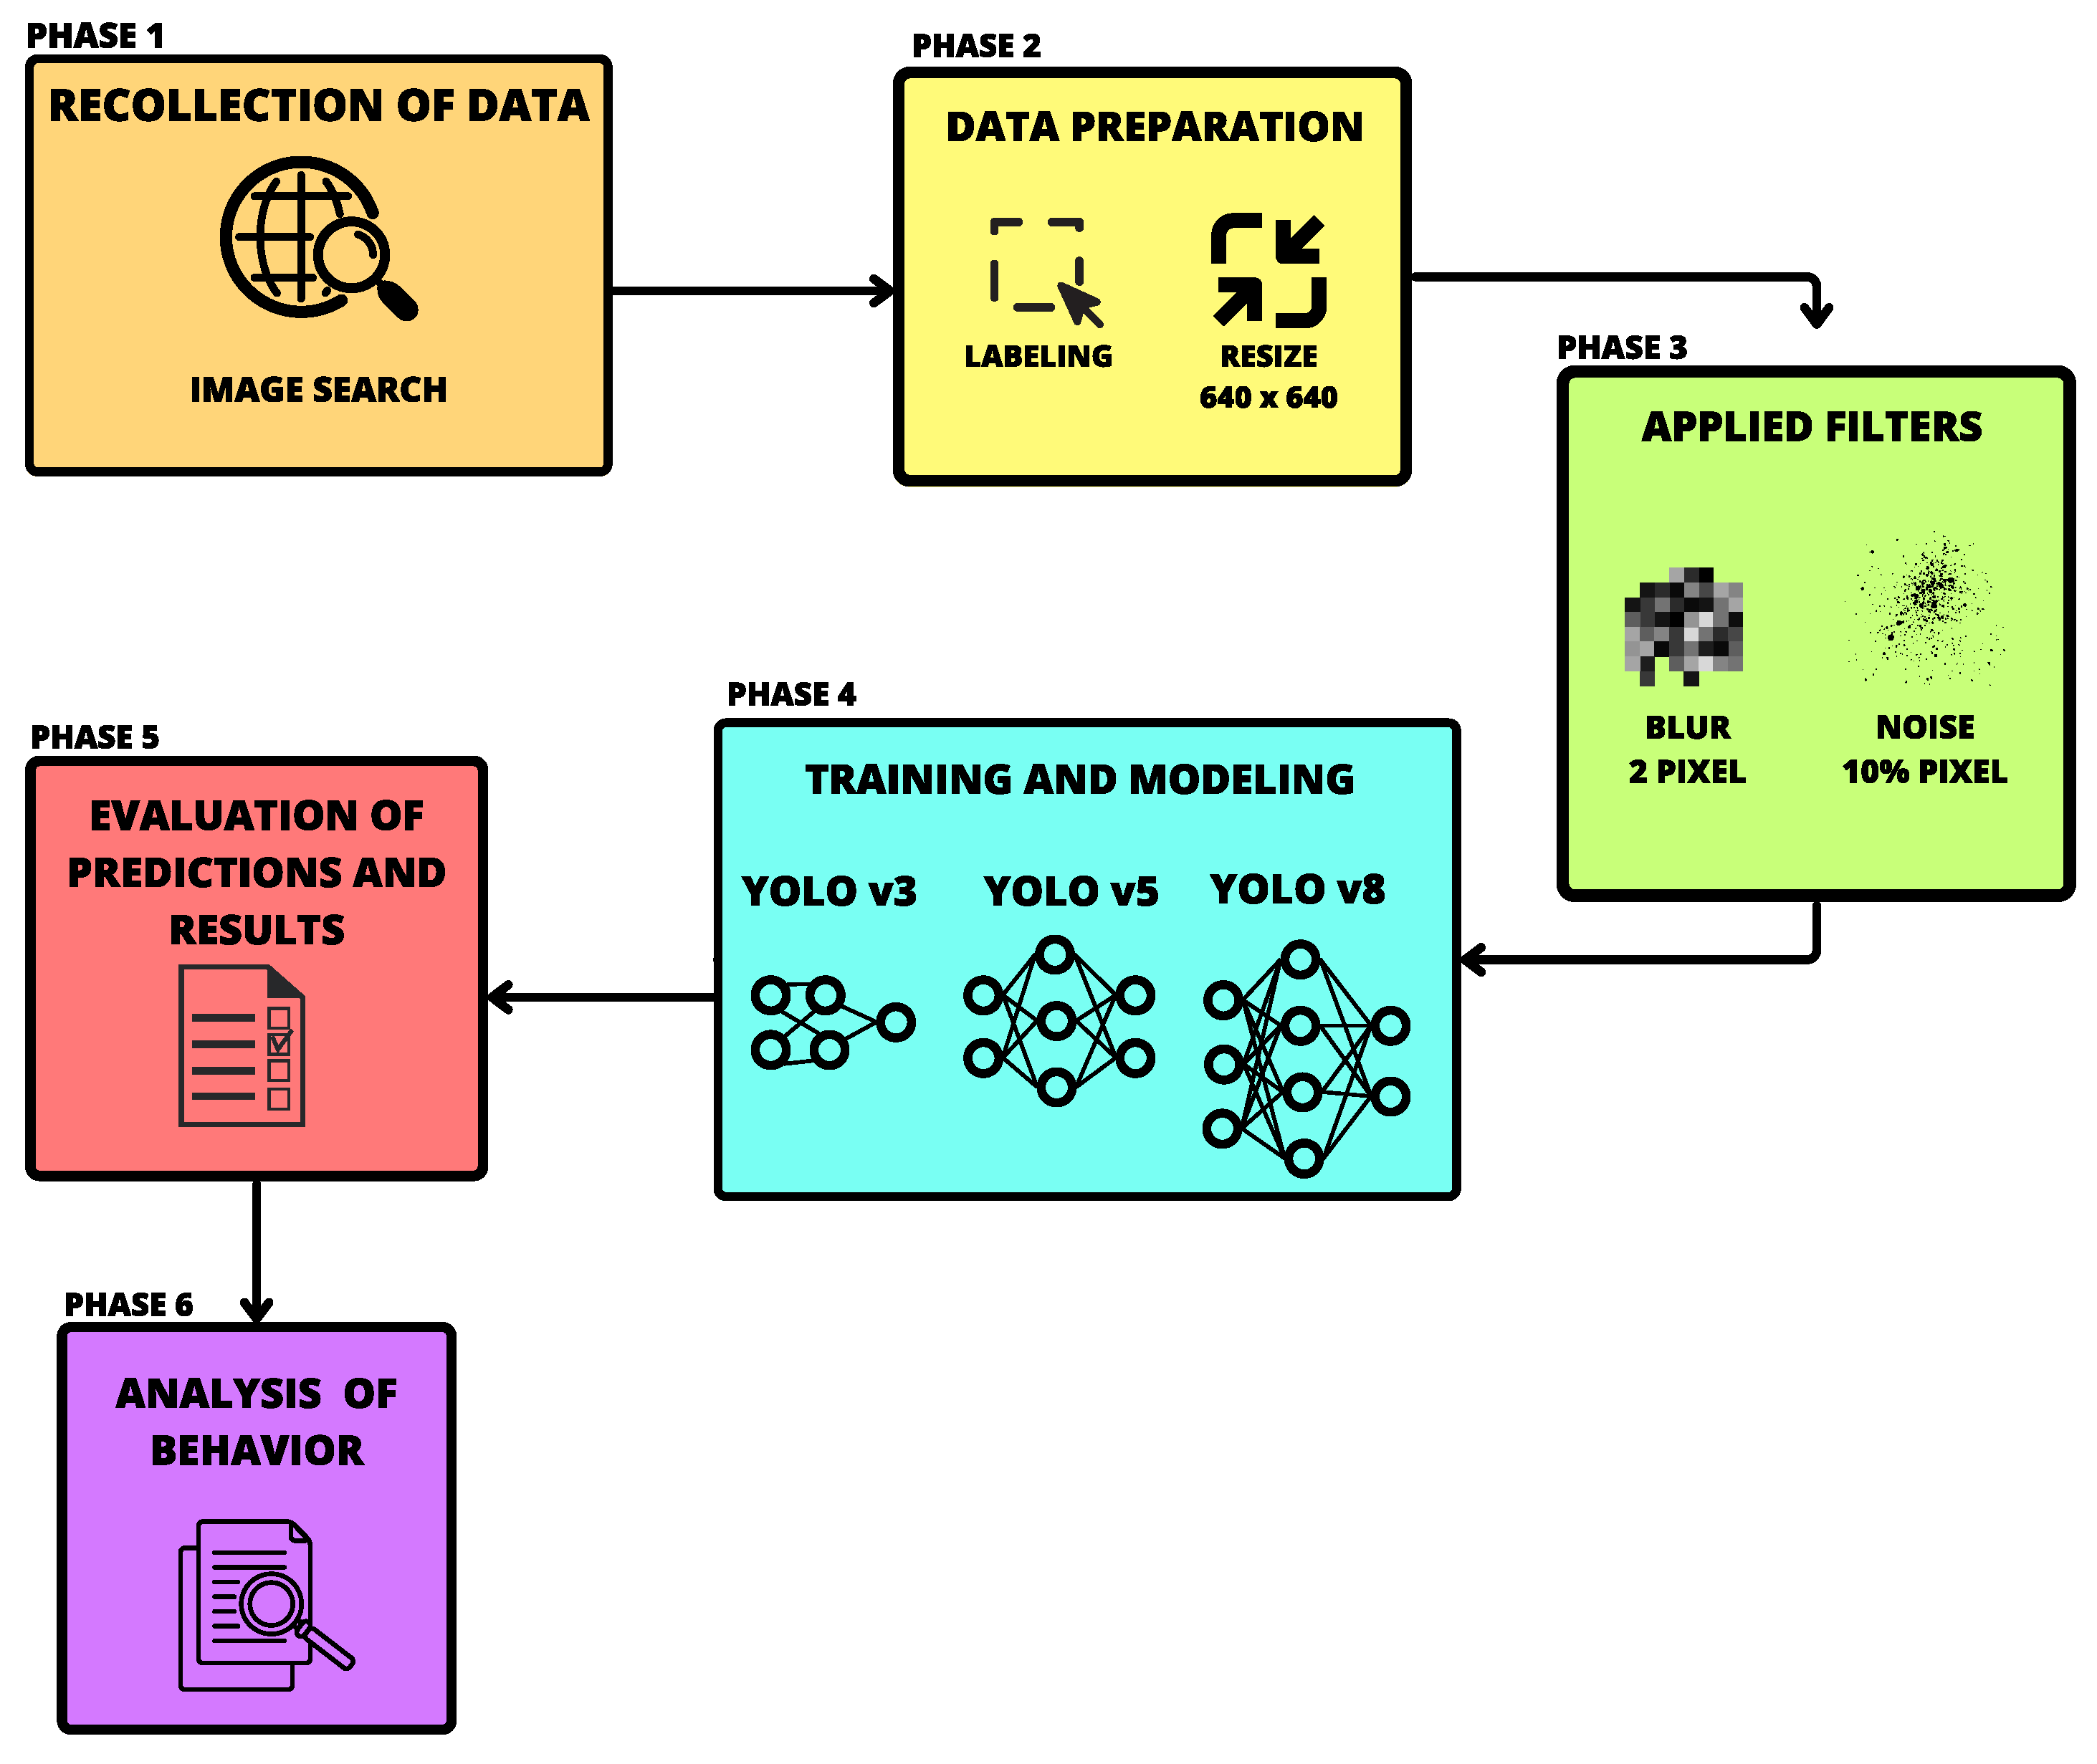
Figure 4.
Visual Depictions: Night (Left), Sunshine (Middle), and Rain (Rainy)
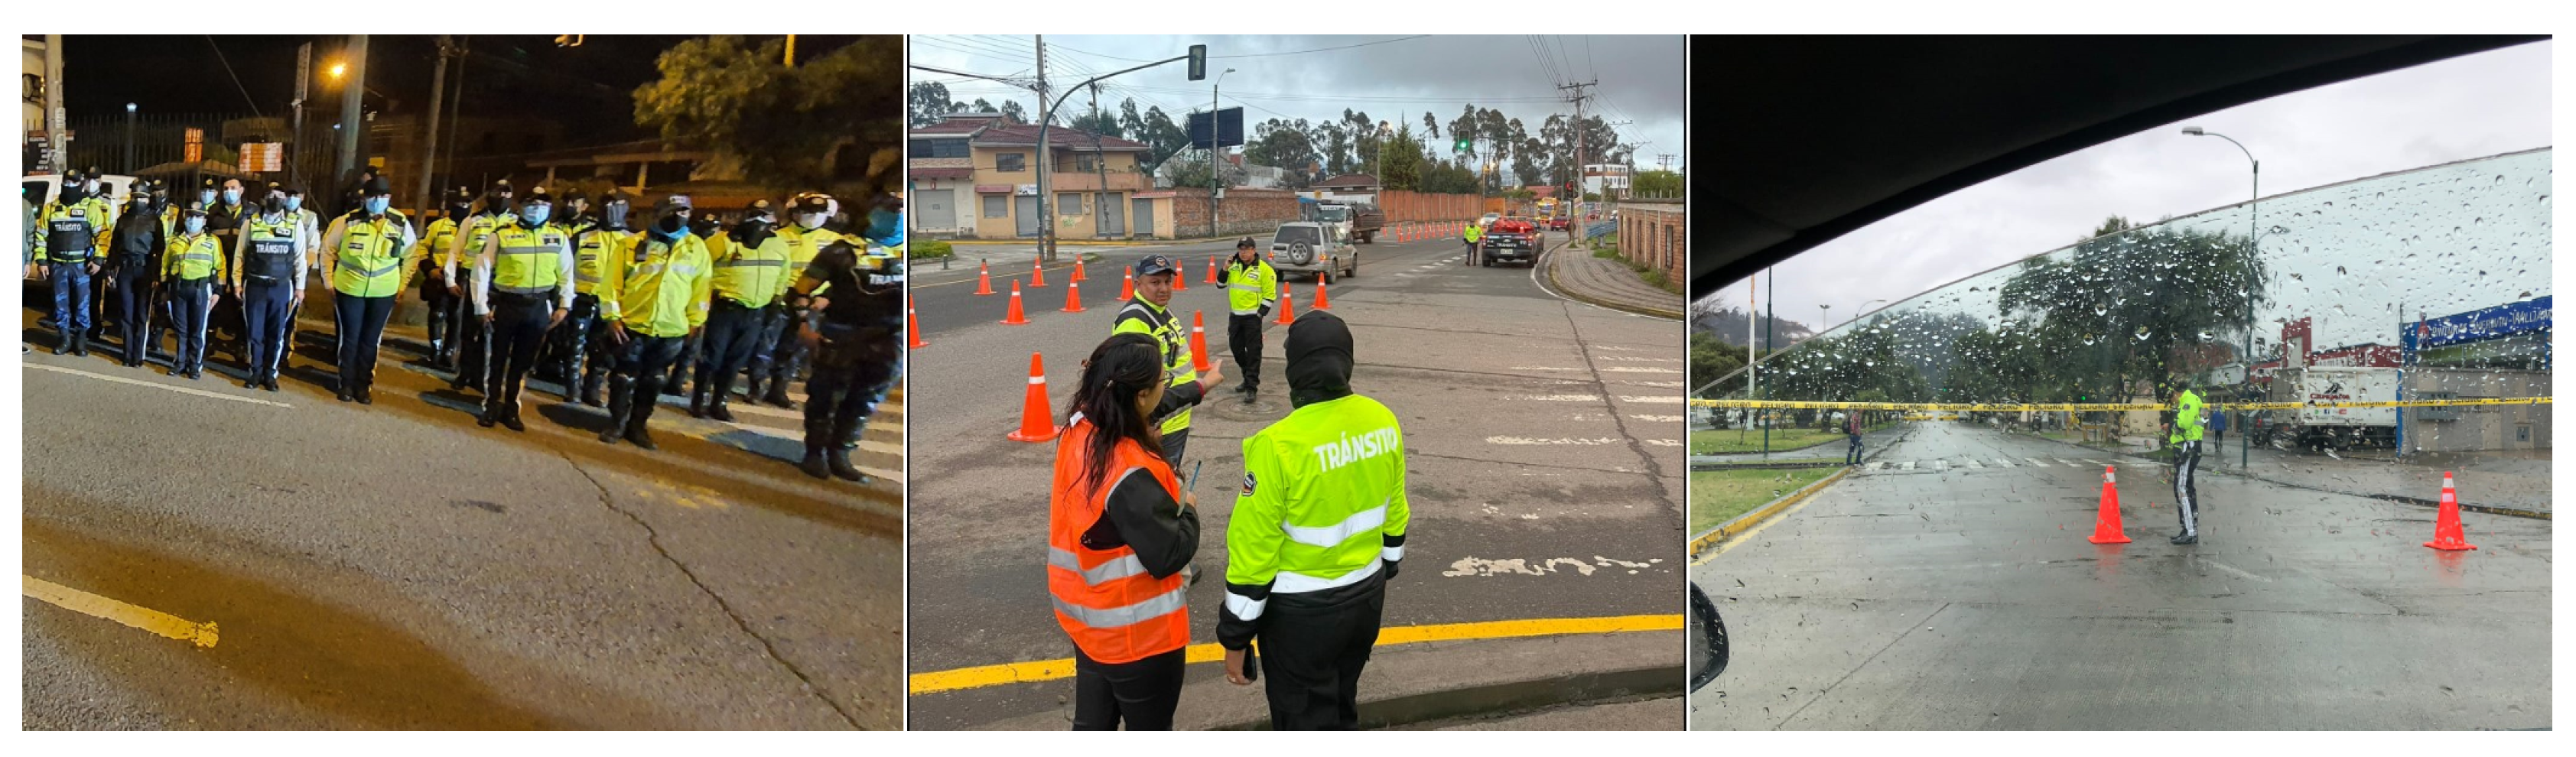
Figure 10.
Figures (a), (b), and (c) depict the predictions for each respective YOLO version: YOLOv3m, YOLOv5x, and YOLOv8x.
Figure 10.
Figures (a), (b), and (c) depict the predictions for each respective YOLO version: YOLOv3m, YOLOv5x, and YOLOv8x.
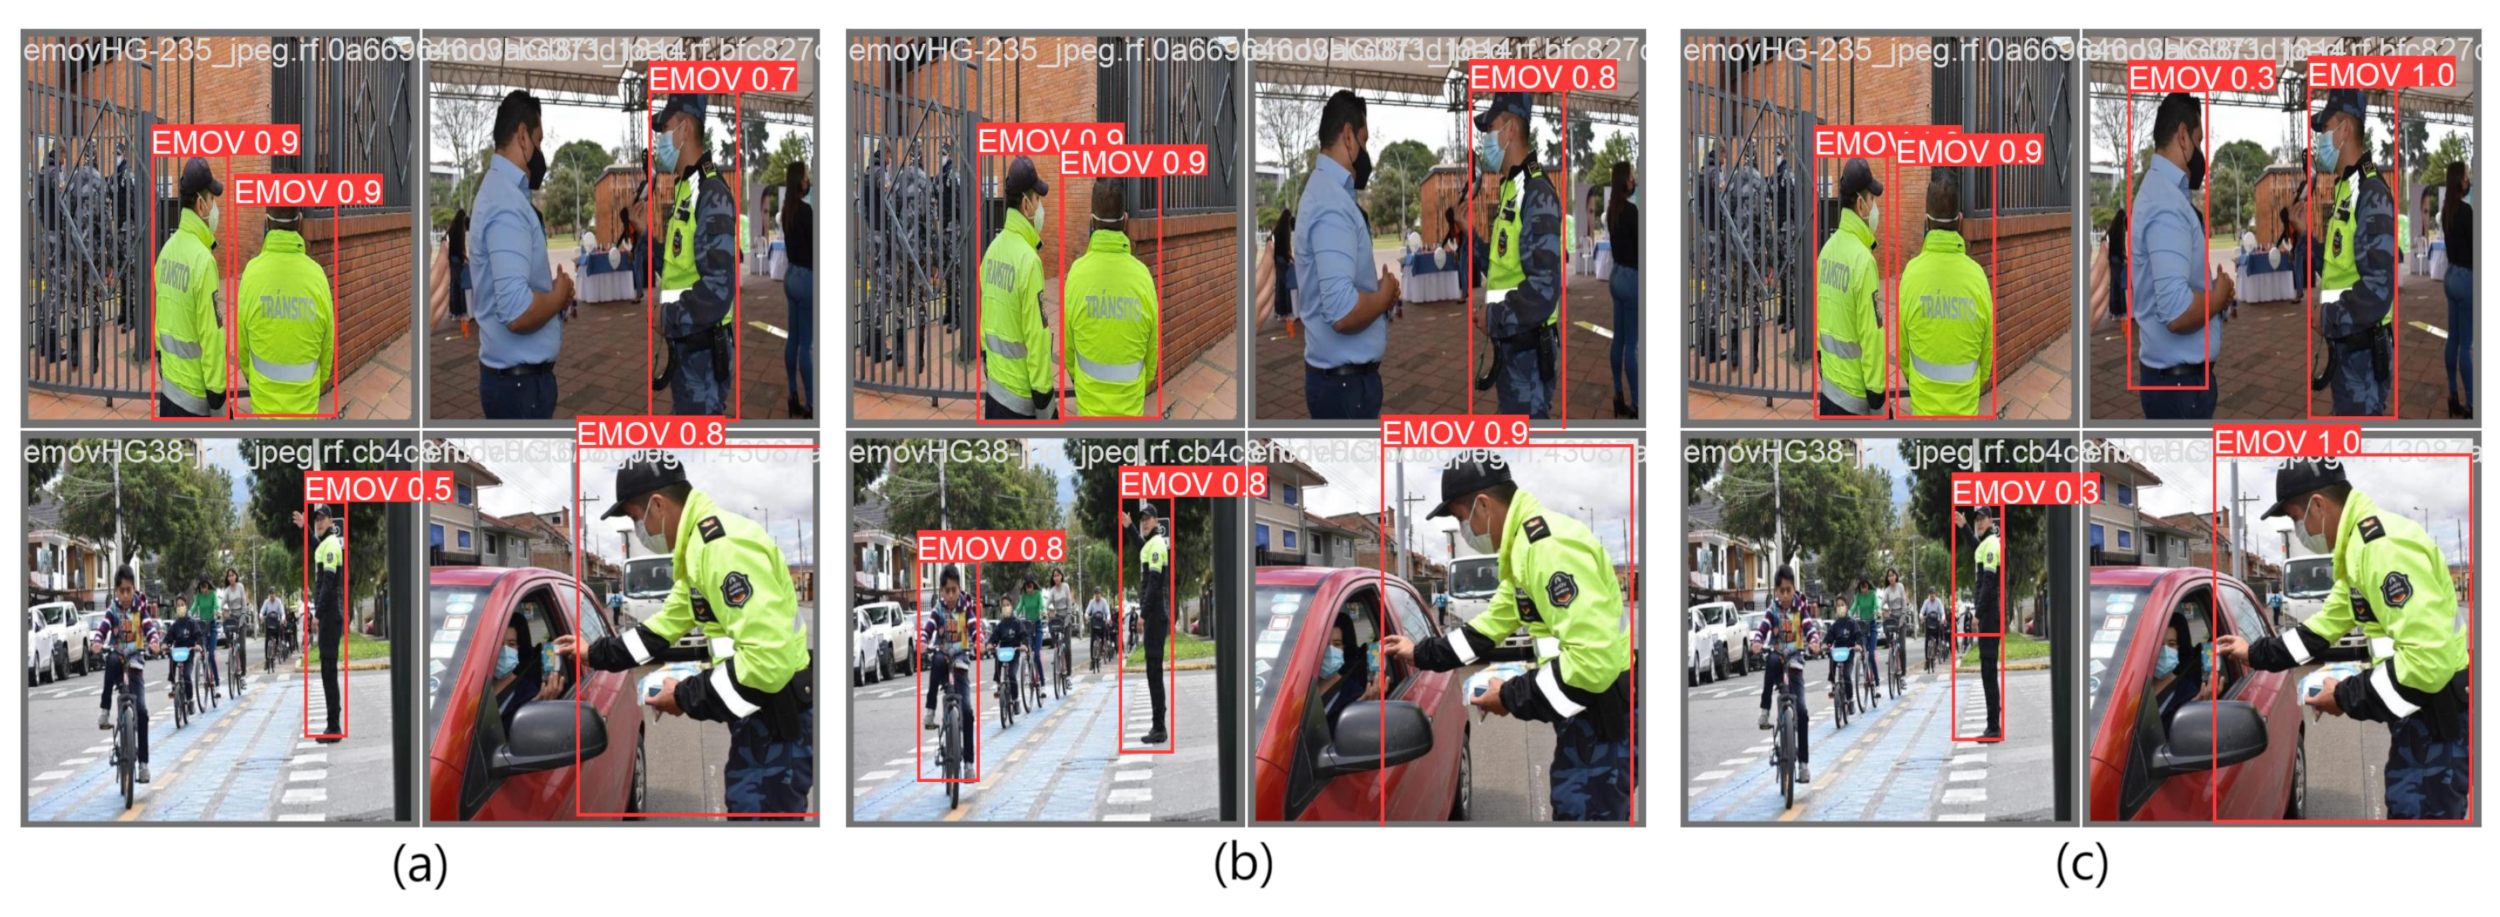

Table 1.
Overview of Training Procedures in Related works
| YOLO version | Ref. | Graphics card NVIDIA | Dataset detection objective | Precision | Recall | mAP 0.50 |
|---|---|---|---|---|---|---|
| YOLO v3 | [17] | T4 (16GB) | Pedestrian Crossing | 0.979 | - | 0.559 |
| [18] | GetForce 920MX | Pedestrian | 0.954 | 0.93 | 0.933 | |
| YOLO v5 | [19] | GeForce RTX 3080 Ti | Electric bikes, helmets, and license plates | - | - | 0.870 |
| [20] | - | Traffic violations | - | - | 0.995 | |
| [21] | Xavier NX | Vehicles and pedestrians | - | - | 0.884 | |
| [22] | GeForce RTX 2070 SUPER | Landing spot | 0.707 | 0.611 | 0.633 | |
| YOLO v8 | [23] | GeForce RTX 3050 | Elbow osteochondritis dissecans | 0.991 | 0.9975 | 0.787 |
| [15] | Quadro P4000 | Parking time violations | - | - | 0.539 |
Table 2.
Dataset Details
| Images | Train | Validate | Test |
|---|---|---|---|
| 1862 | 1734 | 81 | 47 |
Table 3.
HyperParameter Tunning Details
| Version | Parameters |
|---|---|
| YOLO v3 | learning_rate = 0.01, momentum = 0.937, weight_decay = 0.0005, warmup_epochs = 3.0 |
| YOLO v5 | learning_rate = 0.01, momentum = 0.937, weight_decay = 0.0005, warmup_epochs = 3.0 |
| YOLO v8 | learning_rate = 0.01, momentum = 0.937, weight_decay = 0.0005, warmup_epochs = 3.0 |
Table 4.
Hardware Details
| GPU | CPU | Memory |
|---|---|---|
| Nvidia A100 SXM4 120 GB | 16 | 32 GB |
Table 5.
Comparative Analysis of YOLO Models: F1-Score, Confidence Score, Time, Precision, Recall, mAP 0.50, and mAP 0.50-0.95
Table 5.
Comparative Analysis of YOLO Models: F1-Score, Confidence Score, Time, Precision, Recall, mAP 0.50, and mAP 0.50-0.95
| Model | Version | F1-Score | Confidence Score | Training Time (Hours) | Precision | Recall | mAP 0.50 | mAP 0.50-0.95 |
|---|---|---|---|---|---|---|---|---|
| YOLO v3 | Tiny | 0.85 | 0.320 | 0.380 | 0.907 | 0.866 | 0.906 | 0.464 |
| Small | 0.91 | 0.237 | 0.601 | 0.971 | 0.951 | 0.968 | 0.654 | |
| Medium | 0.93 | 0.349 | 0.605 | 0.964 | 0.950 | 0.961 | 0.629 | |
| YOLO v5 | Nano | 0.95 | 0.248 | 0.381 | 0.989 | 0.959 | 0.971 | 0.691 |
| Small | 0.95 | 0.103 | 0.383 | 0.991 | 0.982 | 0.985 | 0.734 | |
| Medium | 0.95 | 0.179 | 0.411 | 0.983 | 0.959 | 0.985 | 0.750 | |
| Large | 0.95 | 0.356 | 0.810 | 0.982 | 0.967 | 0.983 | 0.757 | |
| X-Large | 0.96 | 0.577 | 0.823 | 0.990 | 0.971 | 0.986 | 0.755 | |
| YOLO v8 | Nano | 0.93 | 0.332 | 0.265 | 1.0 | 1.0 | 0.979 | 0.758 |
| Small | 0.95 | 0.402 | 0.211 | 0.982 | 0.975 | 0.978 | 0.743 | |
| Medium | 0.96 | 0.402 | 0.345 | 0.991 | 0.974 | 0.986 | 0.780 | |
| Large | 0.94 | 0.442 | 0.510 | 0.974 | 0.965 | 0.977 | 0.782 | |
| X-Large | 0.95 | 0.631 | 0.533 | 0.981 | 0.967 | 0.977 | 0.782 |
Disclaimer/Publisher’s Note: The statements, opinions and data contained in all publications are solely those of the individual author(s) and contributor(s) and not of MDPI and/or the editor(s). MDPI and/or the editor(s) disclaim responsibility for any injury to people or property resulting from any ideas, methods, instructions or products referred to in the content. |
© 2024 by the authors. Licensee MDPI, Basel, Switzerland. This article is an open access article distributed under the terms and conditions of the Creative Commons Attribution (CC BY) license (http://creativecommons.org/licenses/by/4.0/).
Copyright: This open access article is published under a Creative Commons CC BY 4.0 license, which permit the free download, distribution, and reuse, provided that the author and preprint are cited in any reuse.


