
Submitted:
14 May 2024
Posted:
15 May 2024
You are already at the latest version
Abstract
The knowledge of the precise anatomy and dimensions of the pulp chamber in the different teeth allows the odontologist to perform correct diagnosis, as well as treatment planning and moni-toring. The clinical practice has introduced cone-beam computed tomography (CB-CT) as a method to evaluate the morphology and dimensions of the pulp chamber. Nevertheless, micro-computed tomography (micro-CT) is regarded as the gold standard in approaching those topics. Here we have designed an algorithm that takes as input DICOM images from in vivo CB-CT of permanent molars to determine the accuracy CB-CT for evaluation of pulp chamber volume. The values were compared with those from in vivo CB-CT (rough and expert manipulated) and ex vivo micro-CT. The relative errors obtained with the volume calculated by the algorithm vs. the volume measured by micro-CT do not exceed 5.7%; also, no significant differences were found between algorithm volumes vs. manipulated CB-CT volumes while all volumes were different from those obtained with automatic CB-CT software. These data demonstrate that volume algorithm CB-CT based may be a reliable technique for evaluation of the pulp chamber volume in permanent molars and can be useful in the diagnosis of pulp diseases, as well as in the planning and monitoring of their treatments.
Keywords:
Cone beam computed tomography
; Computed micro-tomography
; Dental pulp chamber volume
; medical image
; algorithm
1. Introduction
Cone beam computed tomography (CB-CT) has been introduced succesfully in daily clinical practice. Small-field CB-CT allows to obtain teeth three-dimensional images of good quality without overlapping neighboring anatomical structures. This, associated with low radiation levels, has made CB-CT an image technique routinely used in diagnosis and planning of dental treatments ([1,2,3]). One of the applications of CBCT is the measurement of the pulp chamber from DICOM images. However, the values acquired show slight discrepancies with those obtained by micro-computed tomography (micro-CT). Micro-CT is currently regarded as the gold standard technique for assessing pulp chamber volume ([4,5,6,7,8]). In addition, several factors limit the use of micro-CT in daily dental practice, including the high price of data analysis equipment and software, the time required for digital scanning and reconstruction, the volume limitations it can analyze, and the high doses of radiation needed ([1,5,9]).
Therefore, the availability of reliable tools to measure the volume of the pulp chamber from CBCT images, obtaining values as close as possible to those obtained by micro-CT, could be of great interest in daily clinical practice. Some studies are available that corroborate its accuracy and reproducibility de estos estudios comprativos ([10,11]).
Therefore, the aim of this work was to design a simple algorithm capable of calculating the volume of the pulp chamber from DICOM images obtained with CB-CT. The results obtained show that its application allows to obtain values almost identical to the real values of micro-CT. This is a validation of a method, not a quantitative study of a large series of samples.
This study was designed to validate volume of the pulp chamber obtained using CB-CT in vivo (PromaxR 3D Max CBCT) by comparing it with those obtained using micro-CT ex vivo. Dental treatments involving dental chamber are becoming personalized and the same tooth differs from one patient to another ([12]). Thus, the exact knowledge of the anatomy a volume of the dental chamber is essential to achieve successful treatments.
2. Materials and Methods
Five permanent molars, corresponding to 5 subjects (3 females and 2 males), with ages ranging between 59 and 66 years, were analyzed. Teeth used in the study were programmed for exodontia due to different odontological treatments and were free of pulp camber damage. This is the reason why the pulp was intact and free of damage despite the age of the patients. It should be considered that teeth with caries suffer retraction of the pulp chamber, decreasing the volume of the pulp chamber. Likewise, restorations of decayed teeth produce artifacts in the images that prevent the volume from being correctly assessed.
Pieces were collected under written informed consent and obtained in accordance with Spanish legislation (RD 1301/2006; Law 14/2007; RD 1716/2011; Order ECC/1404/2013). Before exodontia CB-CT images were obtained using a tomographic equipment ProMax3DMid ProFace, with a voltage of 120kV and a tube current of 5mA, except for the tooth identified as 5, which were 90kV and 10mA. For the analysis of DICOM (digital imaging and communication in medicine) images, the software used was Planmeca Romexis 6.2.1.25. Briefly, measurements were made as it follows: the axial and transverse axes were oriented according to the direction of the tooth. The tool "Measure a cube" was used to trace the area that covered the pulp chamber in the 3 visions: axial, panoramic and sagittal/orthoradial. Selecting a point inside the cube belonging to the pulp chamber as the reference density for the "3D Growth Region" tool with the preset "Root Cavity" adjusting the threshold favorably (Figure 1 a-d).
After exodontia teeth were preserved in physiological saline solution at 4o C until use for micro-CT study, which was carried out at Centro Nacional de Investigacion sobre la Evolucion Humana (CENIEH; Burgos, Spain). The images were obtained with V | Tome | X s 240 de GE Sensing Inspection Technologies Phoenix X-Ray and for the analysis of the images, the software Dragonfly was used. The pulp canal was deleted from the rest of the tooth by adjusting the histogram. Once the pulp canals were isolated, a box was defined that corresponded to the region of the pulp chamber (Figure 1e-i). The software itself has a function that directly provides the volume value of the selected region (connected components; Figure 1i).
To calculate the pulp chamber volume, 300 DICOM images for each of the 5 samples, corresponding to different axial planes, were available. Nevertheless, only the images corresponding to the pulp chamber were selected, resulting in a reduction of 14/300 for sample 1, 16/300 for sample 2, 9/300 for sample 3, 16/300 for sample 4, and 12/300 for sample 5. The selection was based on a meticulous visual analysis of each image by two experts, who established the initial and final planes containing parts of the pulp chamber. The image chosen as the initial one was the closest to the pulp canals among those that contain the pulp chamber, and the rest were selected in an ascending order. On the other hand, the voxel size varied for each sample, with a side length of 0.25 mm for the first three samples, 0.2 mm for the fourth sample, and 0.15 mm for the fifth sample.
3. Design of the algorithm
The effectiveness of image segmentation algorithms can vary depending on a range of factors, such as image complexity, image quality, the type of features being sought, noise present in the image, and the required accuracy for the specific task. In this case, a simple algorithm has been implemented to detect pixels belonging to the pulp chamber. Like any other image segmentation algorithm, it is based on the discontinuity or similarity between the gray levels of neighboring pixels, allowing it to locate changes in the gray level of adjacent pixels. This algorithm can find isolated pixels, detect edges, and divide the image into zones that have similar gray values based on a certain threshold.
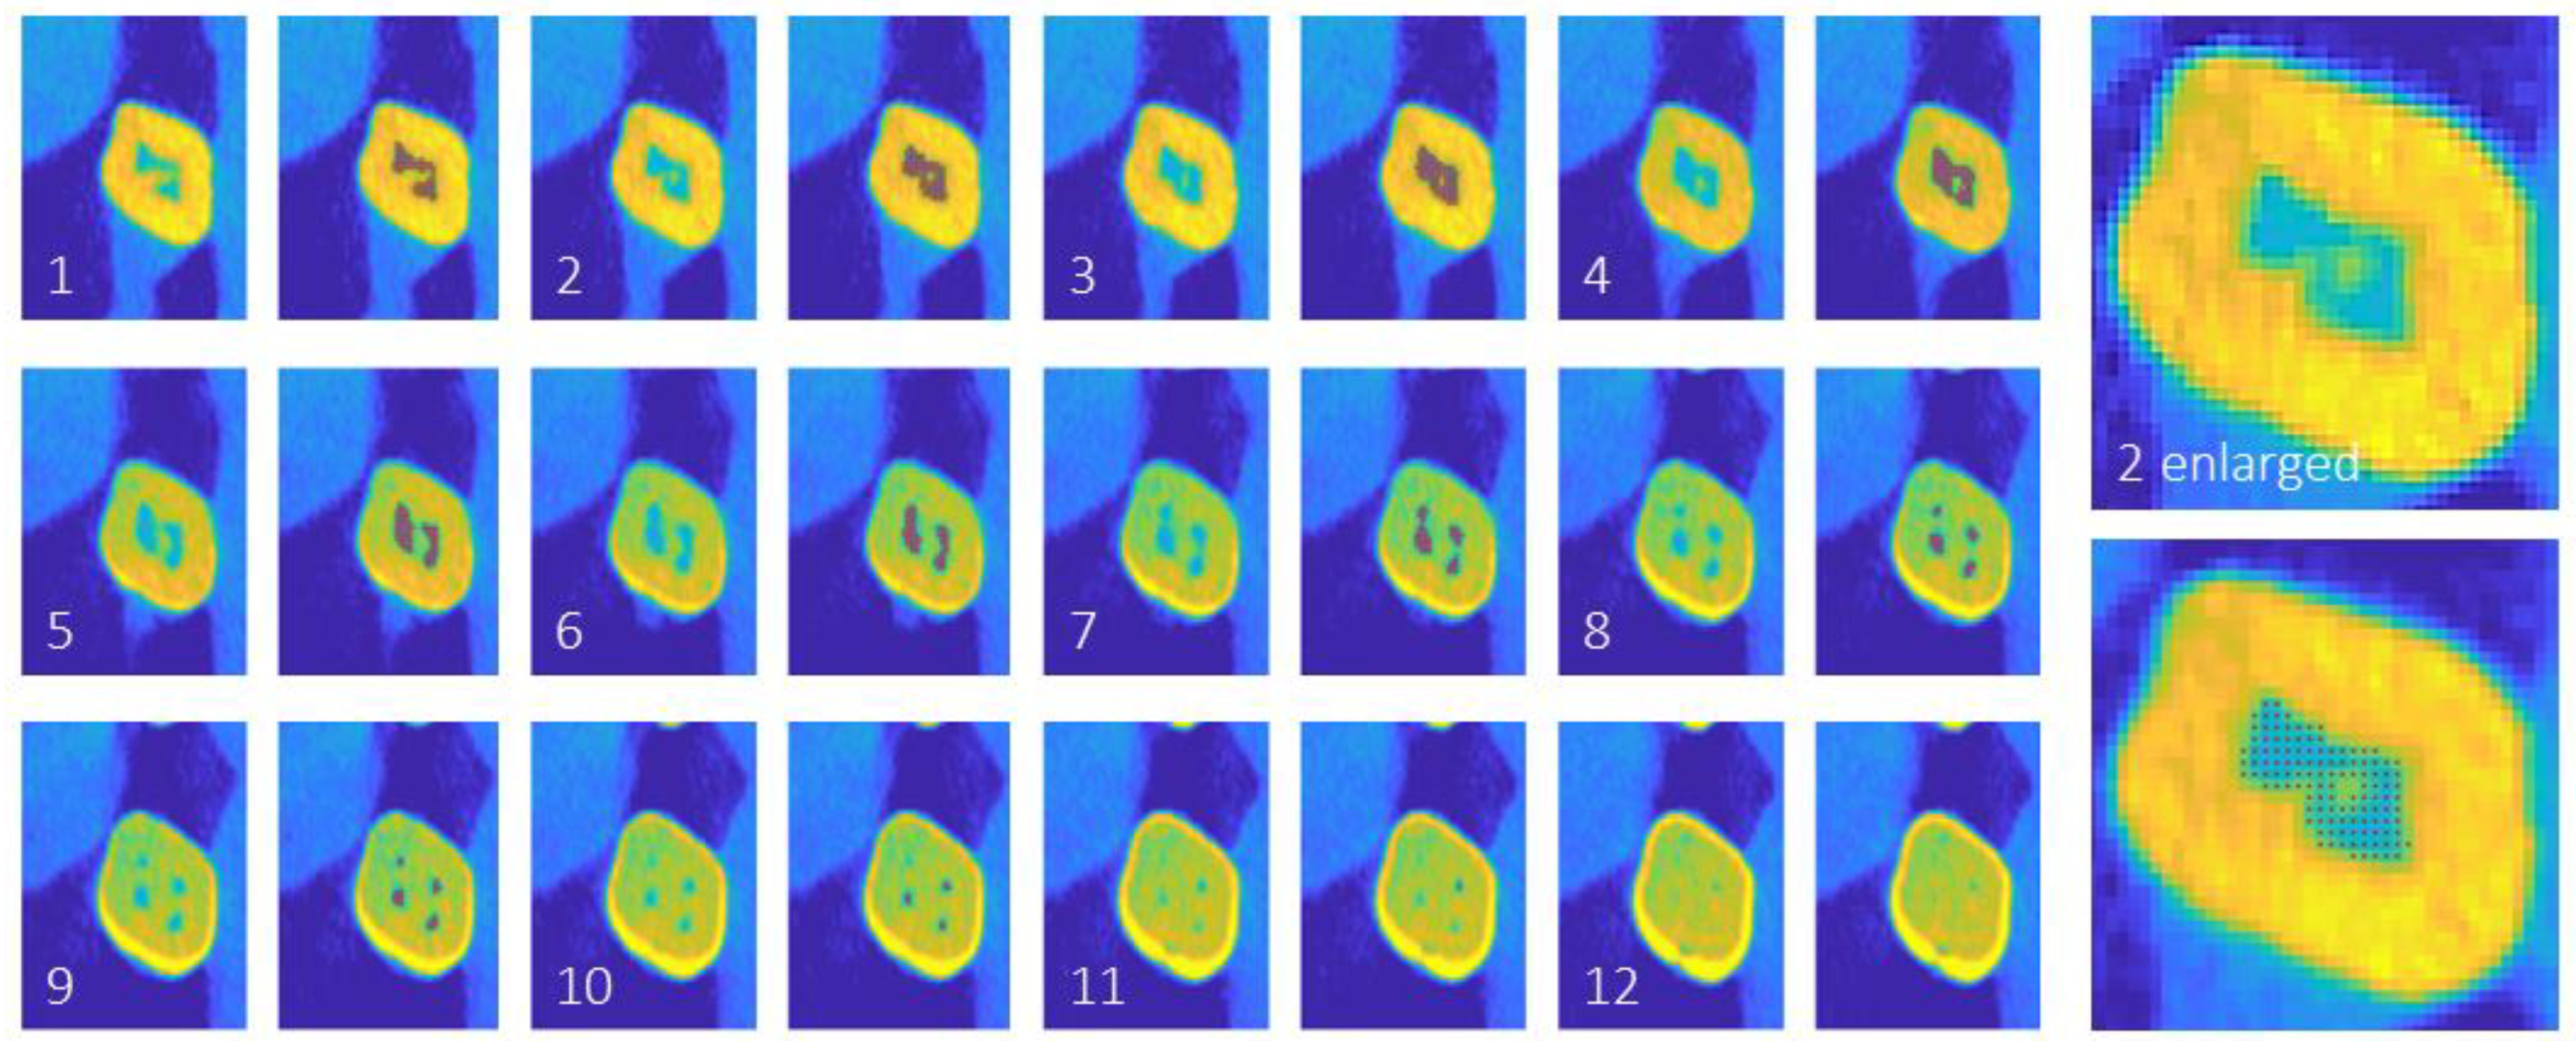
Figure 2.
CB-CT images corresponding to the molar identified as sample 2. Axial images and area occupied by the pulp chamber (highlighted with red dots). In this sample the algorithm values match those of micro-CT.
Figure 2.
CB-CT images corresponding to the molar identified as sample 2. Axial images and area occupied by the pulp chamber (highlighted with red dots). In this sample the algorithm values match those of micro-CT.
3.1. Preliminaries
The images used in this study are matrices in which each element corresponds to a position in the image (pixel). The value of each matrix element is determined by the color of the corresponding pixel. Since the images being used are in gray scale, each image is determined by a single matrix. Once the images are uploaded, an automatic check is performed to determine if the image has borders, and if so, they are not considered in the execution of the algorithm. This way, unnecessary calculations are avoided without preprocessing the images in the dataset.
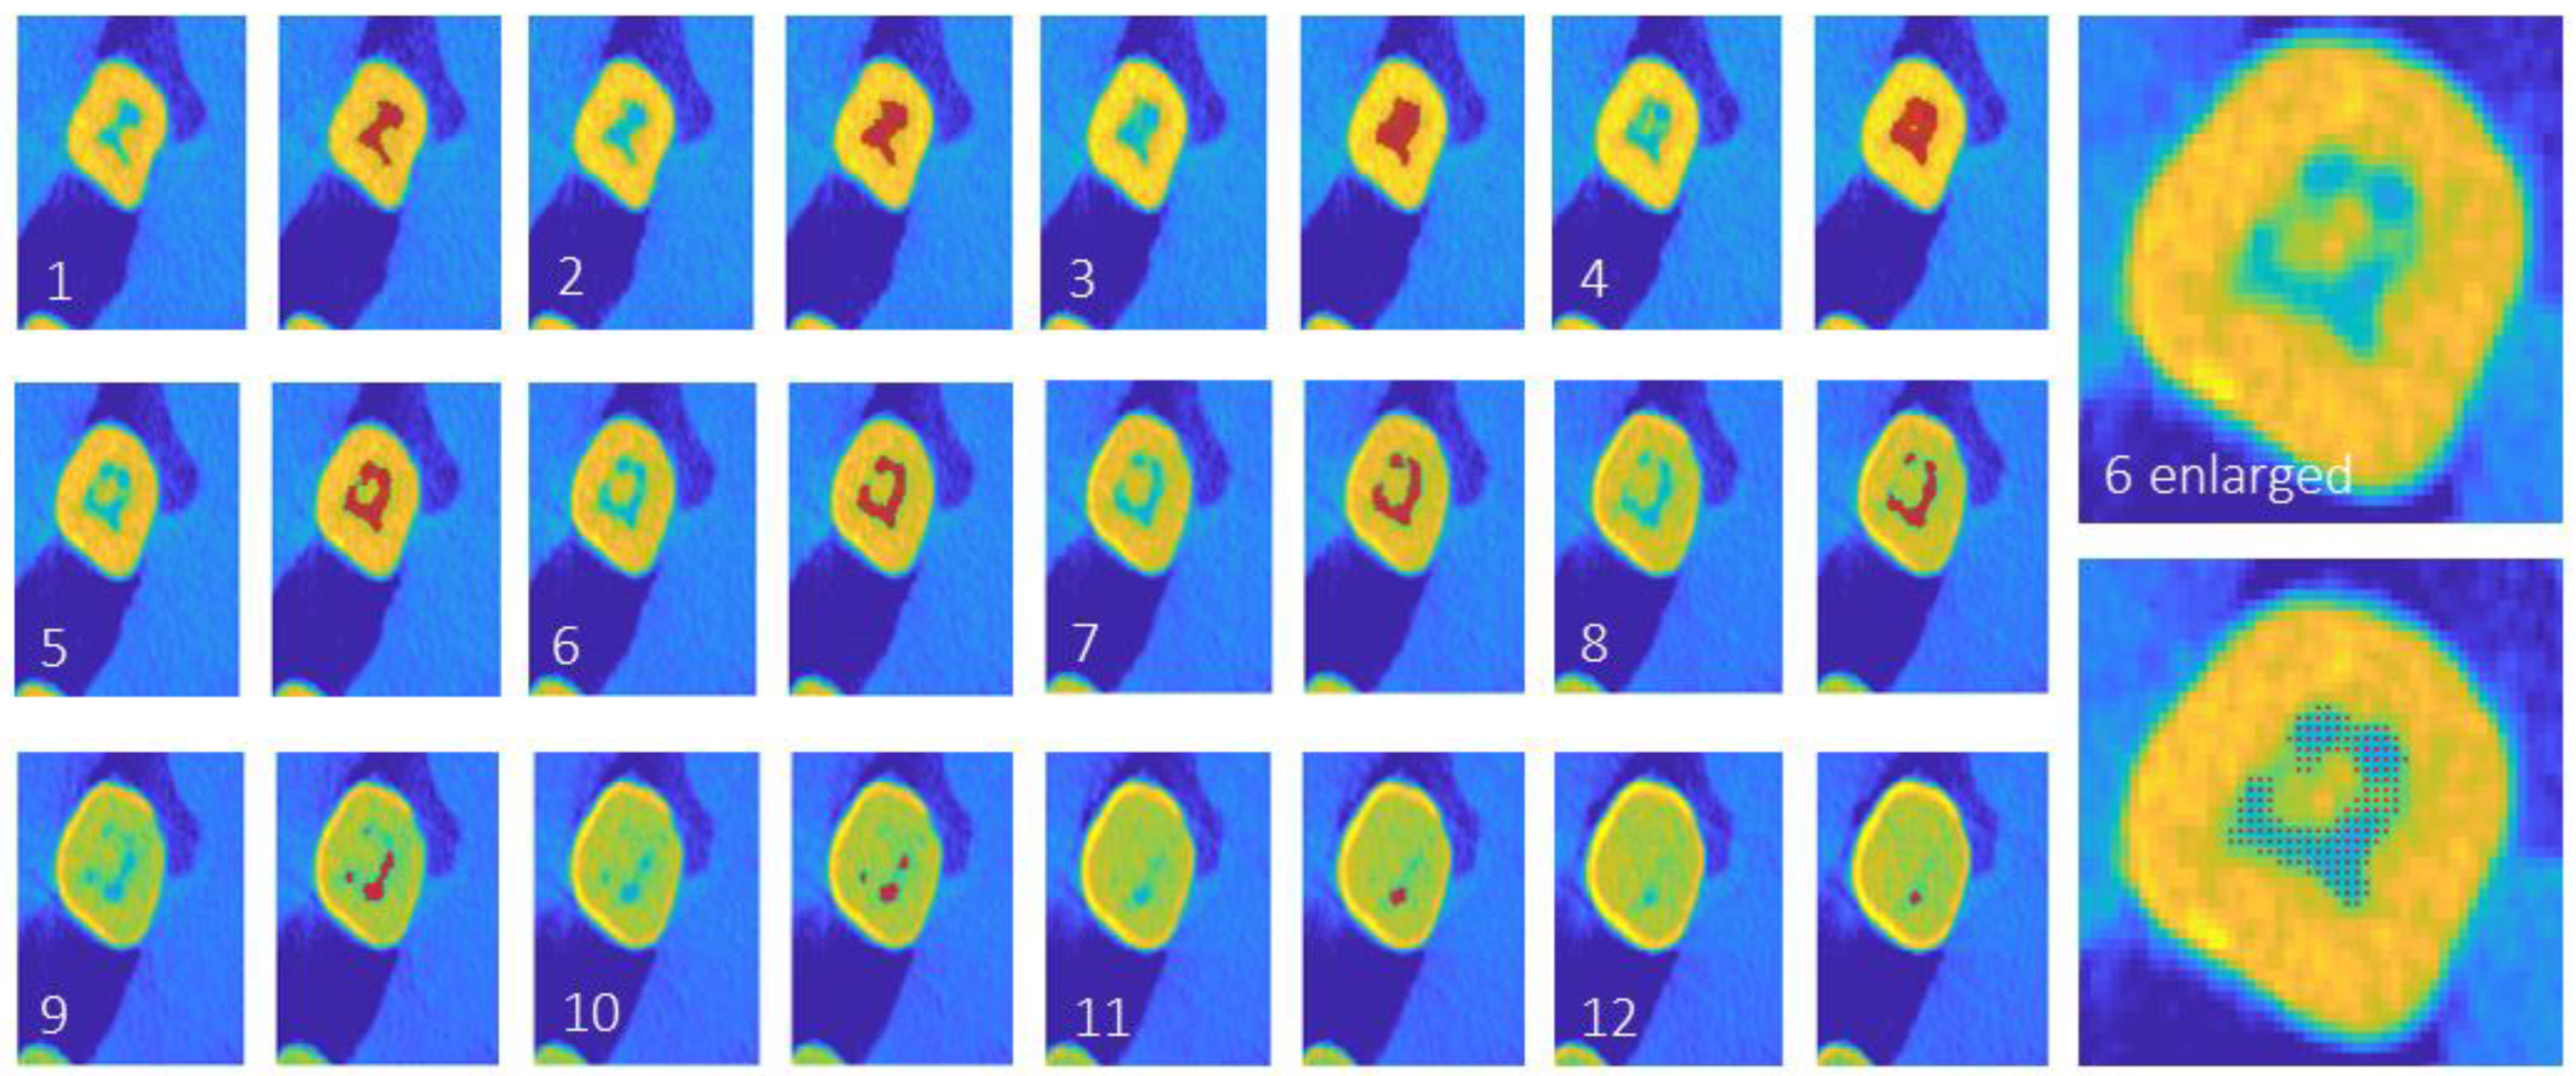
Figure 3.
CB-CT images corresponding to the molar identified as sample 5. Axial images and area occupied by the pulp chamber (highlighted with red dots). In this sample the algorithm values were very different from those of micro-CT.
Figure 3.
CB-CT images corresponding to the molar identified as sample 5. Axial images and area occupied by the pulp chamber (highlighted with red dots). In this sample the algorithm values were very different from those of micro-CT.
Defining the application d as follows:
where = (), = () ∈ , then (, ) is a metric space.
Given α ∈ N, on a set A ∈ (Z), the equivalence relation is defined:
Given two elements C1, C2 ∈ M2xN (Z), the distance between them is defined as:
where ()∈ C1 and () ∈ C2.
3.2. Algorithm description
The main flowchart of the following algorithm is described in the Figure 4. It consists of three phases, which are explained below:
- 1.
-
Input elements:
- Pixel matrix set: Each matrix corresponds to the image associated with a cross-section of the pulp chamber, in ascending order of height. It is understood that the first image corresponds to the first plane of the pulp chamber that does not include the molar canals.
- Pixel dimension: For each set of images, the unit of distance is the measurement of the pixel side. In turn, the inter-planar distance corresponds to the height of the pixel. For the sets considered, we work with cubic pixels (voxel).
- First surface point: To allow the detection of the pixels of the pulp chamber surface in the first matrix, it is necessary to consider a pixel belonging to it. If this pixel is not provided by the user, a pixel is taken automatically in the manner indicated below.
- Control parameter k (threshold): In the images considered, there is a color difference between pixels that belong to the bony surface of the tooth and those that do not. The control parameter k makes it possible to establish a prior separation between the elements of the pixel matrix that potentially belong to the pulp chamber and those that do not.
- 2.
- Determination of the surface matrix:
Starting from the pixel matrix I of each plane, a new matrix M (surface matrix) is constructed such that:
- 3.
- Calculation of pixel surfaces:
Given a non-zero element a of matrix M of coordinates (a1, a2), we define the equivalence class with representative a as ∈ M / (i, j) () ∧ . Each of the equivalence classes is called a surface.
In the first step of the algorithm a pixel of the pulp chamber is required. The first image, which is being worked with in the first step, is pointed out by an expert and is the closest to the molar canals. To pick up the pixel belonging to the pulp chamber automatically, a pixel from the center of the image is selected first. If the pixel value is greater than the threshold value, it is considered to belong to the pulp chamber and the algorithm is started. If the selected pixel does not exceed the threshold value, the next closest pixel to the center of the image, not previously considered, is taken and the process is repeated.
Since the first image is the one closest to the molar canals, we are under the assumption that all pixels in the pulp chamber, in that plane, belong to the same equivalence class.
To separate each of the equivalence classes, we start by taking a non-zero element in M (pixel), of coordinates P, from which a set S is defined, and this element is equated to zero in M. Subsequently, it is checked if exits the elements in M whose coordinates P′ fulfill
d(P,P′) ≤ 2 and verify that are not null. If so, they are introduced into S and the process is repeated for these new elements.
Once no more elements are added to S, the surface is considered complete and a new non-zero element is taken in M. The algorithm ends when there are no more non-zero elements in M to add to an equivalence class.
At the end of the process, we have a separation of M into its different surfaces. The flowchart for this phase is shown in Figure 5.
- 4.
- Identification of the pulp chamber.
If it is the first image, only that surface containing the first surface point given as input parameter is retained. If it is a subsequent image, surfaces far from those obtained in the previous iteration are eliminated. If denotes the j-th surface in the i image, then:
At the end of each iteration, if new pixels associated with the pulp chamber have been obtained and if there are still images of the input set to be evaluated, we proceed to work with the next matrix. Otherwise, the volume calculation is performed.
3.3. Volume calculation
The surface area of each pixel is the square of its side. Therefore, the value of the pulp
chamber image area corresponding to each plane is the total number of pixels a signed to the pulp chamber multiplied by the individual surface area of the pixels.
For the calculation of the pulp chamber volume, two approaches are considered. In one case, the areas of the lower planes are taken and multiplied by the value of the distance between images (planes). In the other, the areas of the upper planes are multiplied by the distance between images.
Thus, considering a total of N images, in each case N - 1 volume values are obtained, one for each interplanar distance, the corresponding approximation being the sum of the calculated volumes. In this way, the two approximations of the volume are the extremes of an interval whose central value is the value of the volume considered, and the radius is the uncertainty in the measurement.
To attempt to estimate the algorithm's complexity, a study of its runtime was conducted under average conditions. For this purpose, the set of images associated with one of the samples is taken as representative and resized, while maintaining their aspect ratio, to sizes two, three, four, and five times the original size. To study the average runtime, one hundred measurements are taken for each group of images corresponding to a size. Through least-squares adjustment, cubic growth is obtained (Figure 6).
Considering that the images processed in this case have a size smaller than 100x100 pixels, the average execution times obtained are just a few seconds. Thus, the functionality of the algorithm is proven as it does not require waiting times to verify if the result is satisfactory. On the other hand, the observed behavior with the increase in the number of pixels allows understanding the scalability of the algorithm to images with higher resolutions.
The average times were measured on a LAPTOP -AA7B78L5 Intel (R) Core (TM) i7-7500U CPU @ 2.70 GHz 2.90 GHz, with 8 GB RAM.
4. Results
The results with each method used in the study were obtained independently and by different analyzers and were supervised by two experts with extensive clinical experience to ensure the effectiveness of the procedure. The volumes of the pulp chamber according to the different methods used in the study are in Table 1. The data obtained with micro-CT were established as ideal and "true volumes", because to the high resolution of the images that were acquired due to the high dose of radiation used; those results were the most reliable.
The values obtained for samples 1, 2 and 4 were quite similar (Figure 2), while those for samples 3 and 5 were almost double (Figure 3). The range of the values was completely suitable and normal and was independent of the maxilla and place. From the CB-CT images manipulated by the specialist (CB-CT set threshold) the values were like those obtained by micro-CT except for samples 4 and 5 which were considerably lower. However, the volumes obtained with CB-CT automatic threshold were always much lower than those of micro-CT and CB-CT set threshold, except for sample 3. The volumes generated by the mathematical formula resulted reliable in 4 of the 5 samples analyzed, with an error of 3.65 % on average, and matched those obtained with micro-CT. Only in the sample number 5 the results calculated by algorithm clearly differed from those obtained with micro-CT.
From the point of view of the algorithm, it can only be said that the method of detection of the pulp chamber is performed automatically using as data the distance between planes, the initial plane, and the control parameter k. For the algorithm to work, it is also necessary to know the location of a pixel belonging to the pulp chamber of the first image, which can be given by the user or, otherwise, the central value of the image is taken. Based on this data, the pulp chamber is automatically detected, in the planes where it exists, and the corresponding volume. Therefore, from the perspective of the algorithm, there are no differences between sample 5 and the others (Figure 3), so it does not allow to justify the discrepancy between the volume provided by the micro-CT and the calculated.
Several authors have calculated the pulp chamber volume for different reasons and using different methods: measuring the volume of the pulp cavity from cone beam computed tomography (CBCT) images by comparing them with the micro-CT reference standard, using the results of different radiological units and comparing the 3D reconstructions using statistical methods ([13]); understanding internal anatomy relationships before undertaking endodontic therapy using artificial intelligence techniques by training the U-Net network for automatic pulp segmentation ([14,15]); for the estimation of human age by statistical methods ([16,17]). The results obtained by the segmentation algorithm developed in this work, from the axial CT images, are comparable to those obtained in other works and easily reproducible, the only condition being that the first plane containing parts of the pulp cavity must be pointed out by an expert.
4. Discussion
The anatomy of teeth has been extensively studied and globally it is well known. However, there are some aspects that deserve to be re-analyzed considering technologies recently introduced in dentistry. That is the case of the pulp chamber since the precisely knowing of its anatomy and dimensions (especially the volume) may allow a correct diagnosis, treatment planning, and monitoring ([18]).
The present study was designed to validate the use of CB-CT for evaluation of the human pulp chamber volume using molars as a model comparing the results of in vivo CBCT images, raw, and after manipulation by two trained experts and after applying an algorithm, with ex vivo micro-CT images. We choose molars because the wide size of the chamber (see [19]). The anatomy and dimensions of the pulp chamber has interest for several branches of dentistry. It is key for diagnostic and treatment in the field of endodontics ([20,21]), to estimate age ([22,23]), in preparing 3D scaffolds tissue engineering for regeneration of the dental pulp ([24]), and for generating images in dentistry for preclinical teaching and training of endodontic postgraduates ([25,26]).
An algorithm was developed to automatically calculate the volume of the pulp chamber based on DICOM CB-CT images currently used in dental clinics.
The results demonstrate that the values of the pulp chamber volume obtained from in vivo CB-CT images differ from those obtained from ex vivo images of micro-CT of the same teeth. Nevertheless, the values approached those from CB-CT viewer-set threshold and were almost superimposable when CB-CT images are processed using the algorithm (relative errors obtained with the algorithm do not exceed 5.7 %). Therefore, results suggest that in vivo CB-CT achieves high precision and reproducibility for evaluation of pulp camber volume when submitted to viewer-set threshold. The discrepancies between pulp chamber volume values from in vivo CB-CT and ex vivo micro-CT images may be explained, at least in part, to the fact that CB-CT volumetric measurements are more imprecise due to superimposed structures ([2]). It must be added that measurements were obtained using only Promax 3D Max CB-CT unit, and that the results could be different when using other brands. On the other hand, the Romexis Planmeca software offers a tool for pulp volume measurement. The data obtained were also included in the study, making a difference.
The automatic volumes generated by the viewer with an automatic threshold, and those obtained varying the threshold by trained experts largely differed. The data obtained by a threshold fit is much closer to the micro-CT data. Therefore, the automatic tool of the Romexis Planmeca viewer is not initially reliable for calculation of dental pulp volume.
For samples 1 to 4, a voltage of 120 kV and a current of 5 mA were used because the scanner is made for a larger piece of the jaw, while 90 kV and 10 mA were used in the image acquisition for sample 5 because the scanner has been made on a smaller piece of jaw, indicating a larger number of X-rays but with lower power. This difference in parameters is attributed to the adjustment for smaller scanner volumes. Additionally, the voxel side size has also varied from 0.25 mm in the first three samples to 0.2 mm in the fourth sample and 0.15 mm in the fifth sample. As this is a modifiable parameter influencing measurement precision ([27,28]), it could be one of the causes of the significant difference between the volume result obtained by micro-CT and the rest of the methods.
If volume calculations for the pulp chamber of sample 5 are made with the proposed algorithm and a voxel side size of 0.2 mm, a volume of 11.06±0.52 mm^3 is obtained. However, if a voxel side size of 0.25 mm is used, the volume becomes 21.61±1.01 mm^3. These results indicate the substantial influence of this parameter on pulp chamber volume measurement. Furthermore, when modifying the threshold of CB-CT images, the values of the volumes obtained are quite like those of micro-CT, and the modification was carried out by trained experts, indicating that dental pulp volume values depend on the operator. Analyzing micro-CT images in sample 5 reveals multiple pulp calcifications that could impact results depending on the technique used. However, there are also calcifications in sample number 3, and the results of micro-CT and the algorithm align. Currently, we cannot satisfactorily explain the reason for such discrepancies.
To the best of our knowledge, this is the first study applying an algorithm associated with in vivo CB-CT to calculate dental pulp chamber volume and comparing the results with ex vivo micro-CT. Nevertheless, the results should be interpreted with caution due to the sample size and differences between maxillary and mandibular molars (see [19]). Additional studies are needed to explore other brands of CB-CT and different dental groups. In our laboratory, studies are ongoing to definitively validate CB-CT for volume measurements in different teeth using various CB-CT devices.
Voxel size is another parameter that is modifiable, and which influences measurement accuracy ([27,28]). On the other hand, the values of the volumes obtained by modifying the threshold of the CB-CT images are quite like those of micro-CT and the modification was made by trained experts, which shows that the values of the volumes of the dental pulp are manipulator-dependent. During the study all parameters remained unchanged, and yet remarkable discrepancies were found between the values obtained by the algorithm and the micro-CT in sample number 5. The only parameter that differs between sample 5 and the others is the KV and mA used for image acquisition. When analyzing the micro-CT images in sample 5 there are multiple pulp calcification that could alter the results based on the technique used. However, there are also calcification in sample number 3 and the results of micro-CT and algorithm match. At present, we cannot satisfactorily explain the reason for such discrepancies. To the best of our knowledge, this is the first study apply and algorithm associated to in vivo CB-CT to calculate dental pulp chamber volume and compare the results with ex vivo micro-CT. Nevertheless, the results should be taken with caution because the sample size and the differences between maxillary and jaws molars (see [19]). Furthers studies are necessary to using other brands of CB-CT and other dental groups. Studies are in progress in our laboratory to definitively validate CB-CT for volume measurements in different teeth and using different CB-CT devices.
Note: Once the paper has been accepted, the algorithm's software will be available to the entire scientific community.
References
- Domark, J.D., Hatton, J.F., Benison, R.P., Hildebolt, C.F. An ex vivo comparison of digital radiography and cone-beam and micro computed tomography in the detection of the number of canals in the mesiobuccal roots of maxillary molars. J. Endod. 2013, 39, 901–905. [CrossRef]
- Fokas, G., Vaughn, V.M., Scarfe, W.C., Bornstein, M.M. Accuracy of linear measurements on CBCT images related to presurgical implant treatment planning: A systematic review. Clin Oral Impl Res. 2018, 29 (16), 393–415. [CrossRef]
- Asif, A., Jeevanandan, G., Govindaraju, L., Vignesh, R., G. Subramanian, E.M. Comparative Evaluation of Extrusion of Apical Debris in Primary Anterior Teeth using Two Different Rotary Systems and Hand Files: An In Vitro Study. Contemporary Clinical Dentistry 2019, 10 (3), 512–516. [CrossRef]
- Nielsen, R.B., Alyassin, A.M., Peters, D.D., Carnes, D.L., Lancaster, J. Microcomputed tomography: An advanced system for detailed endodontic research. J. Endod. 1995, 21, 561-568. [CrossRef]
- Rhodes, J.S., Ford, T.R., Lynch, J.A., Liepins, P.J., Curtis, R.V. Micro-computed tomography: A new tool for experimental endodontology. Int Endod J. 1999, 32, 165-70. [CrossRef]
- Park, J.W., Lee, J.K., Ha, B.H., Choi, J.H., Perinpanayagam, H. Three-dimensional analysis of maxillary first molar mesiobuccal root canal configuration and curvature using microcomputed tomography. Oral Surg Oral Med Oral Pathol Oral Radiol Endod. 2009, 108, 437-42. [CrossRef]
- Barsness, S.A., Bowles, W.R., Fok, A., McClanahan, S.B., Harris, S.P. An anatomical investigation of the mandibular second molar using micro-computed tomography. Surg Radiol Anat. 2015, 37, 267-72. [CrossRef]
- De-Deus, G., Belladonna, F.G., Cavalcante, D.M., Simoes-Carvalho, M., Silva, E.J.N.L., Carvalhal, J.C.A., Zamolyi, R.Q., Lopes, R.T., Versiani, M.A., Dummer, P.M.H., Zehnder, M. Contrast-enhanced micro-CT to assess dental pulp tissue debridement in root canals of extracted teeth: A series of cascading experiments towards method validation. Int Endod J. 2021, 54 (2), 279-293. [CrossRef]
- Michetti, J., Maret, D., Mallet, J.P., Diemer, F. Validation of cone beam computed tomography as a tool to explore root canal anatomy. J. Endod. 2010, 36, 1187-1190. [CrossRef]
- Maddalone. M., Cittrio, C., Pellegatta, A., Gagliani, M., Karanxha, L., Del Fabbro, M. Cone-beam computed tomography accuracy in pulp chamber size evaluation: An ex vivo study. Aust Endod J. 2020, 46, 88–93. [CrossRef]
- Barbosa, M.G., Franco, A., de Oliveira, R.D.B., Mamani, M.P., Junqueira, J.L.C., Soares M.Q.S. Pulp volume quantification methods in cone-beam computed tomography for age estimation: A critical review and meta-analysis. J Forensic Sci. 2023, 68, 743–56. [CrossRef]
- Schwendicke, F., Samek, W., Krois, J. Artificial Intelligence in Dentistry: Chances and Challenges. J. Dent. Res. 2020, 99 (7), 769-74.
- Esteves Carneiro, A.L., Spin-Neto, R., Rabelo Mina Zambrana, N.R., Rabelo Mina Zambrana, J., Richarte de Andrade Salgado, D.M., Costa, C. Quantitative and qualitative comparisons of pulp cavity volumes produced by cone beam computed tomography and micro-computed tomography through semiautomatic segmentation:An ex vivo investigation. Oral Surg Oral Med Oral PatholOral Radiol. 2023, 135 (3), 433-443.
- Duan, W., Chen, Y., Zhang, Q., Lin, X., Yang, X. Refined tooth and pulp segmentation using U- Net in CBCT image. Dentomaxillofac. Radiol. 2021, 50 (6), 20200251.
- Lin, X., Fu, Y., Ren, G., Yang, X., Duan, W., Chen, Y., Zhang, Q. Micro-Computed Tomography-Guided Artificial Intelligence for Pulp Cavity and Tooth Segmentation on Cone-beam Computed Tomography. J Endod. 2021, 47 (12), 1933-1941. [CrossRef]
- Ge, Z.P., Ma, R.H., Li, G., Zhang, J.Z., Ma, X.C. Age estimation based on pulp chamber volume of first molars from cone-beam computed tomography images. Forensic Sci Int. 2015, 253:133, e1-7. [CrossRef]
- Elgazzar, F.M., Elboraey, M.O., El-Sarnagawy, G.N. The accuracy of age estimation from pulp chamber/crown volume ratio of canines obtained by cone beam computed tomography images: An Egyptian study. Egypt J Forensic Sci 2020, 10 (40). [CrossRef]
- Liu, Y., Olszewski, R., Alexandroni, E.S., Enciso, R., Xu, T., Mah, J.K. The validity of in vivo tooth volume determinations from cone-beam computed tomography. Angle Orthod. 2010, 80, 160-166. [CrossRef]
- Dieguez-Perez, M., Ticona-Flores, J.M. Three-Dimensional Analysis of the Pulp Chamber and Coronal Tooth of Primary Molars: An In Vitro Study. Int J Environ Res Public Health 2022, 19(15), 9279. [CrossRef]
- Van der Meer, W.J., Vissink, A., Ng, Y.L., Gulabivala, K. 3D Computer aided treatment planning in endodontics. J. Dent., 45, 67-72. [CrossRef]
- Ahmed, H.M.A., Ibrahim, N., Mohamad, N.S., Nambiar, P., Muhammad, R.F., Yusoff, M., Dummer, P.M.H. Application of a new system for classifying root and canal anatomy in studies involving micro-computed tomography and cone beam computed tomography: Explanation and elaboration. Int Endod J., 2021 54, 1056-1082. [CrossRef]
- Molina, A., Bravo, M., Fonseca, G.M., Marquez-Grant, N., Martin de Las Heras, S. Dental age estimation based on pulp chamber/crown volume ratio measured on CBCT images in a Spanish population. Int. J. Legal Med., 2021 135(1), 359-364. [CrossRef]
- Zheng, Q., Ge, Z., Du, H., Li G., 2021. Age estimation based on 3D pulp chamber segmentation of first molars from cone-beam- computed tomography by integrated deep learning and level set. Int. J. Legal Med., 2021 135, 365-373. [CrossRef]
- Hadjichristou, C., About, I., Koidis, P., Bakopoulou, A. Advanced in Vitro Experimental Models for Tissue Engineering-based Reconstruction of a 3D Dentin/pulp Complex: A Literature Review. Stem Cell Rev. Rep., 2021 17, 785-802. [CrossRef]
- Hohne, C., Schmitter, M., 2019. 3D Printed Teeth for the Preclinical Education of Dental Students. J. Dent. Educ., 2019 83 (9), 1100-6. [CrossRef]
- Hohne, C., Schwarzbauer, R., Schmitter, M., 2020. Introduction of a new teaching concept for crown preparation with 3D printed teeth. Eur J Dent Educ., 2020 24 (3), 526-534. [CrossRef]
- Maret, D., Telmon, N., Peters, O.A., Lepage, B., Treil, J., Inglese, J.M., Peyre, A., Kahn, J.L., Sixou, M. Effect of voxel size on the accuracy of 3D reconstructions with cone beam CT. Dentomaxillofac Radiol., 2012 41, 649-655. [CrossRef]
- Maret, D., Peters, O.A., Galibourg, A. Dumoncel, J., Esclassan, R., Kahn, J.L., Sixou, M., Telmon, N. Comparison of the accuracy of 3-dimensional cone-beam computed tomography and micro-computed tomography reconstructions by using different voxel sizes. J Endod., 2014 40, 1321-1326. [CrossRef]
Figure 1.
- CB-CT and micro-CT images of the molar identified as sample 2 (corresponding to a female 62 years old). CB-CT reconstruction (a,b) and sagittal (c) and axial (d) images. Micro-CT sagittal images (e,f) and pulp reconstructions (g,h). i corresponds to isolated and enlarged h.
Figure 1.
- CB-CT and micro-CT images of the molar identified as sample 2 (corresponding to a female 62 years old). CB-CT reconstruction (a,b) and sagittal (c) and axial (d) images. Micro-CT sagittal images (e,f) and pulp reconstructions (g,h). i corresponds to isolated and enlarged h.
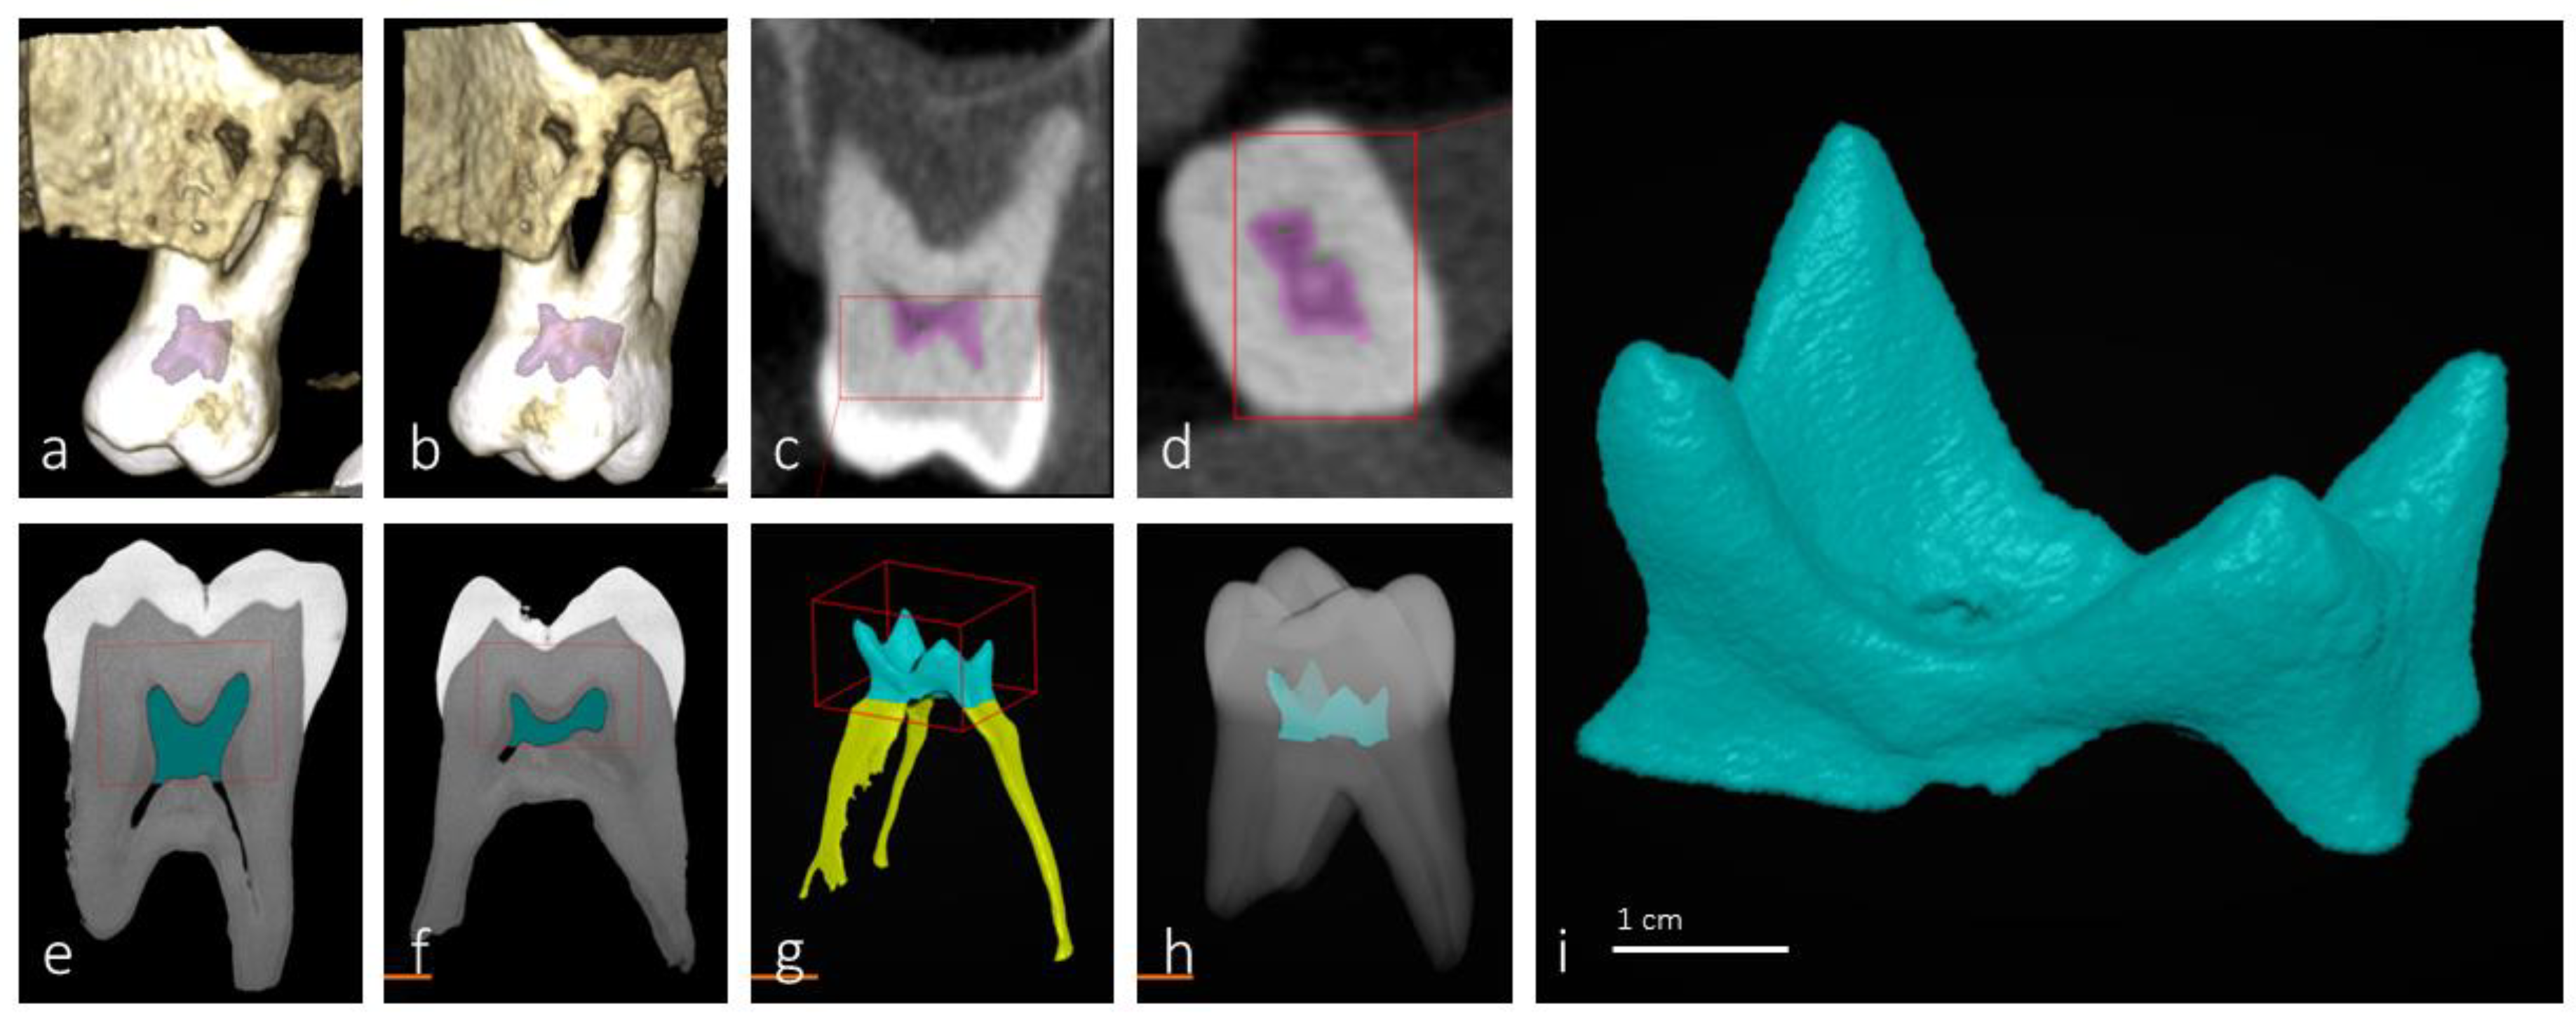
Figure 4.
Main flowchart of the pulp chamber surface point detection algorithm.
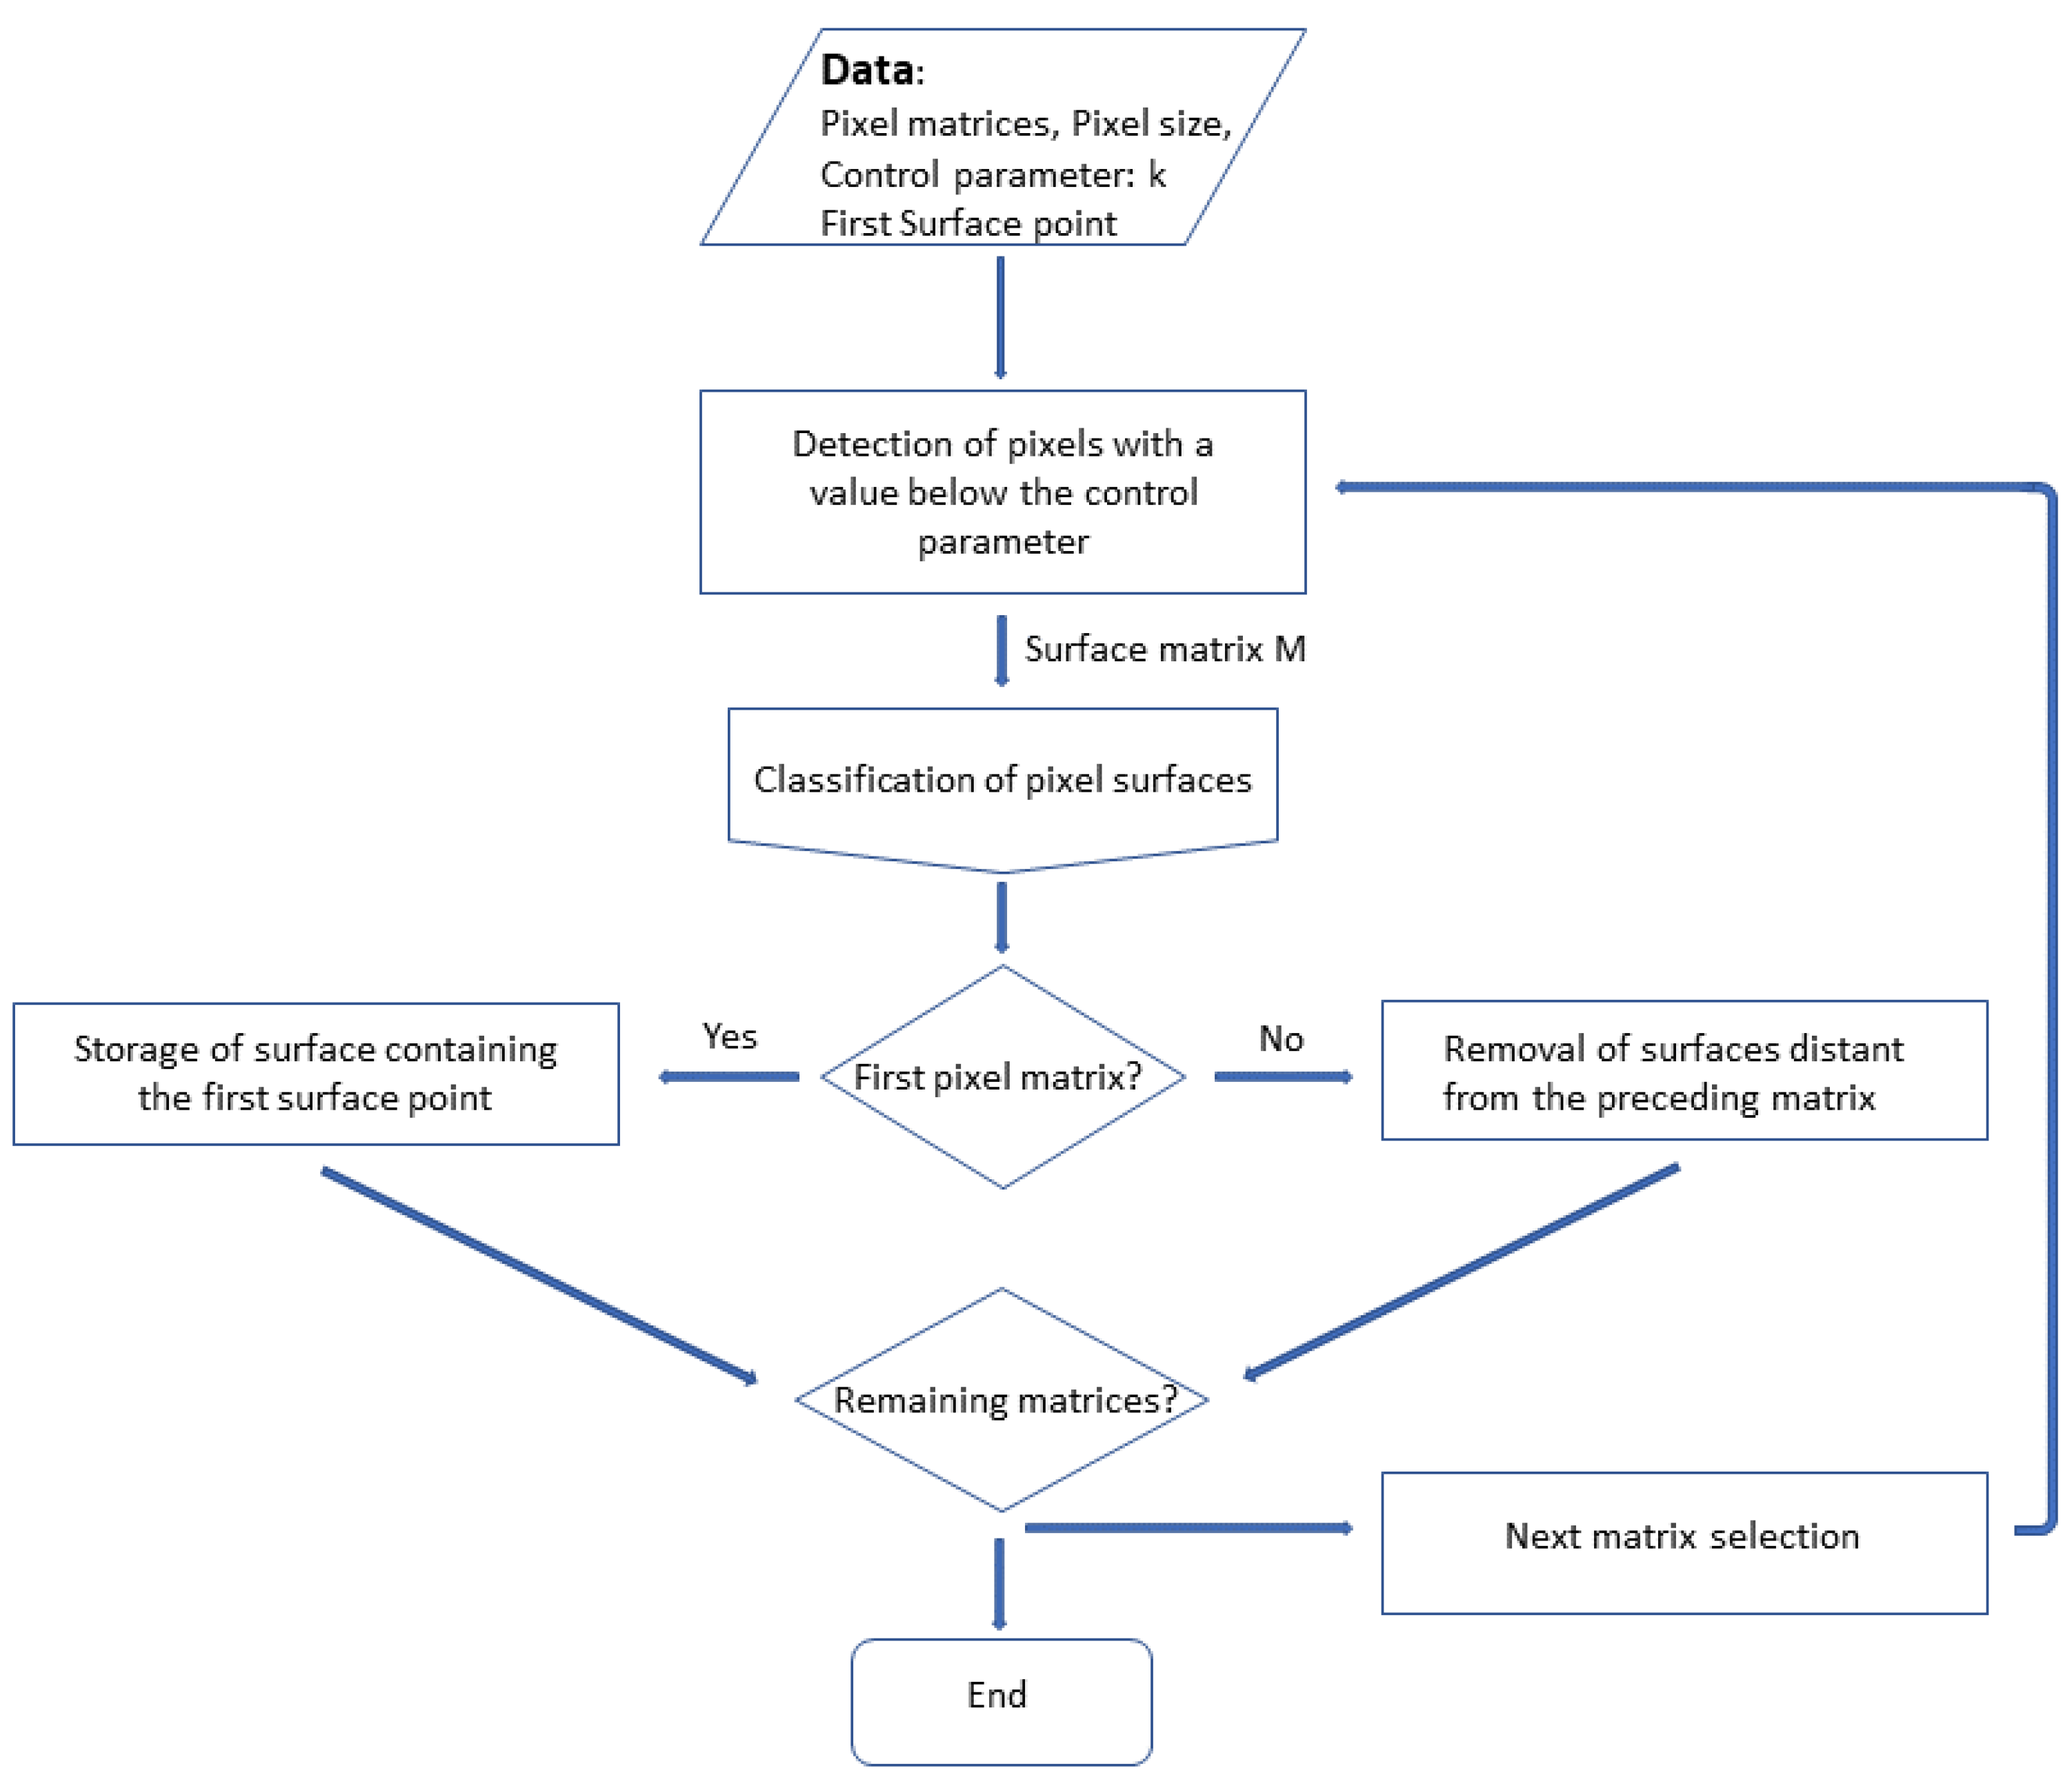
Figure 5.
Main flowchart for calculation of pixel surfaces.
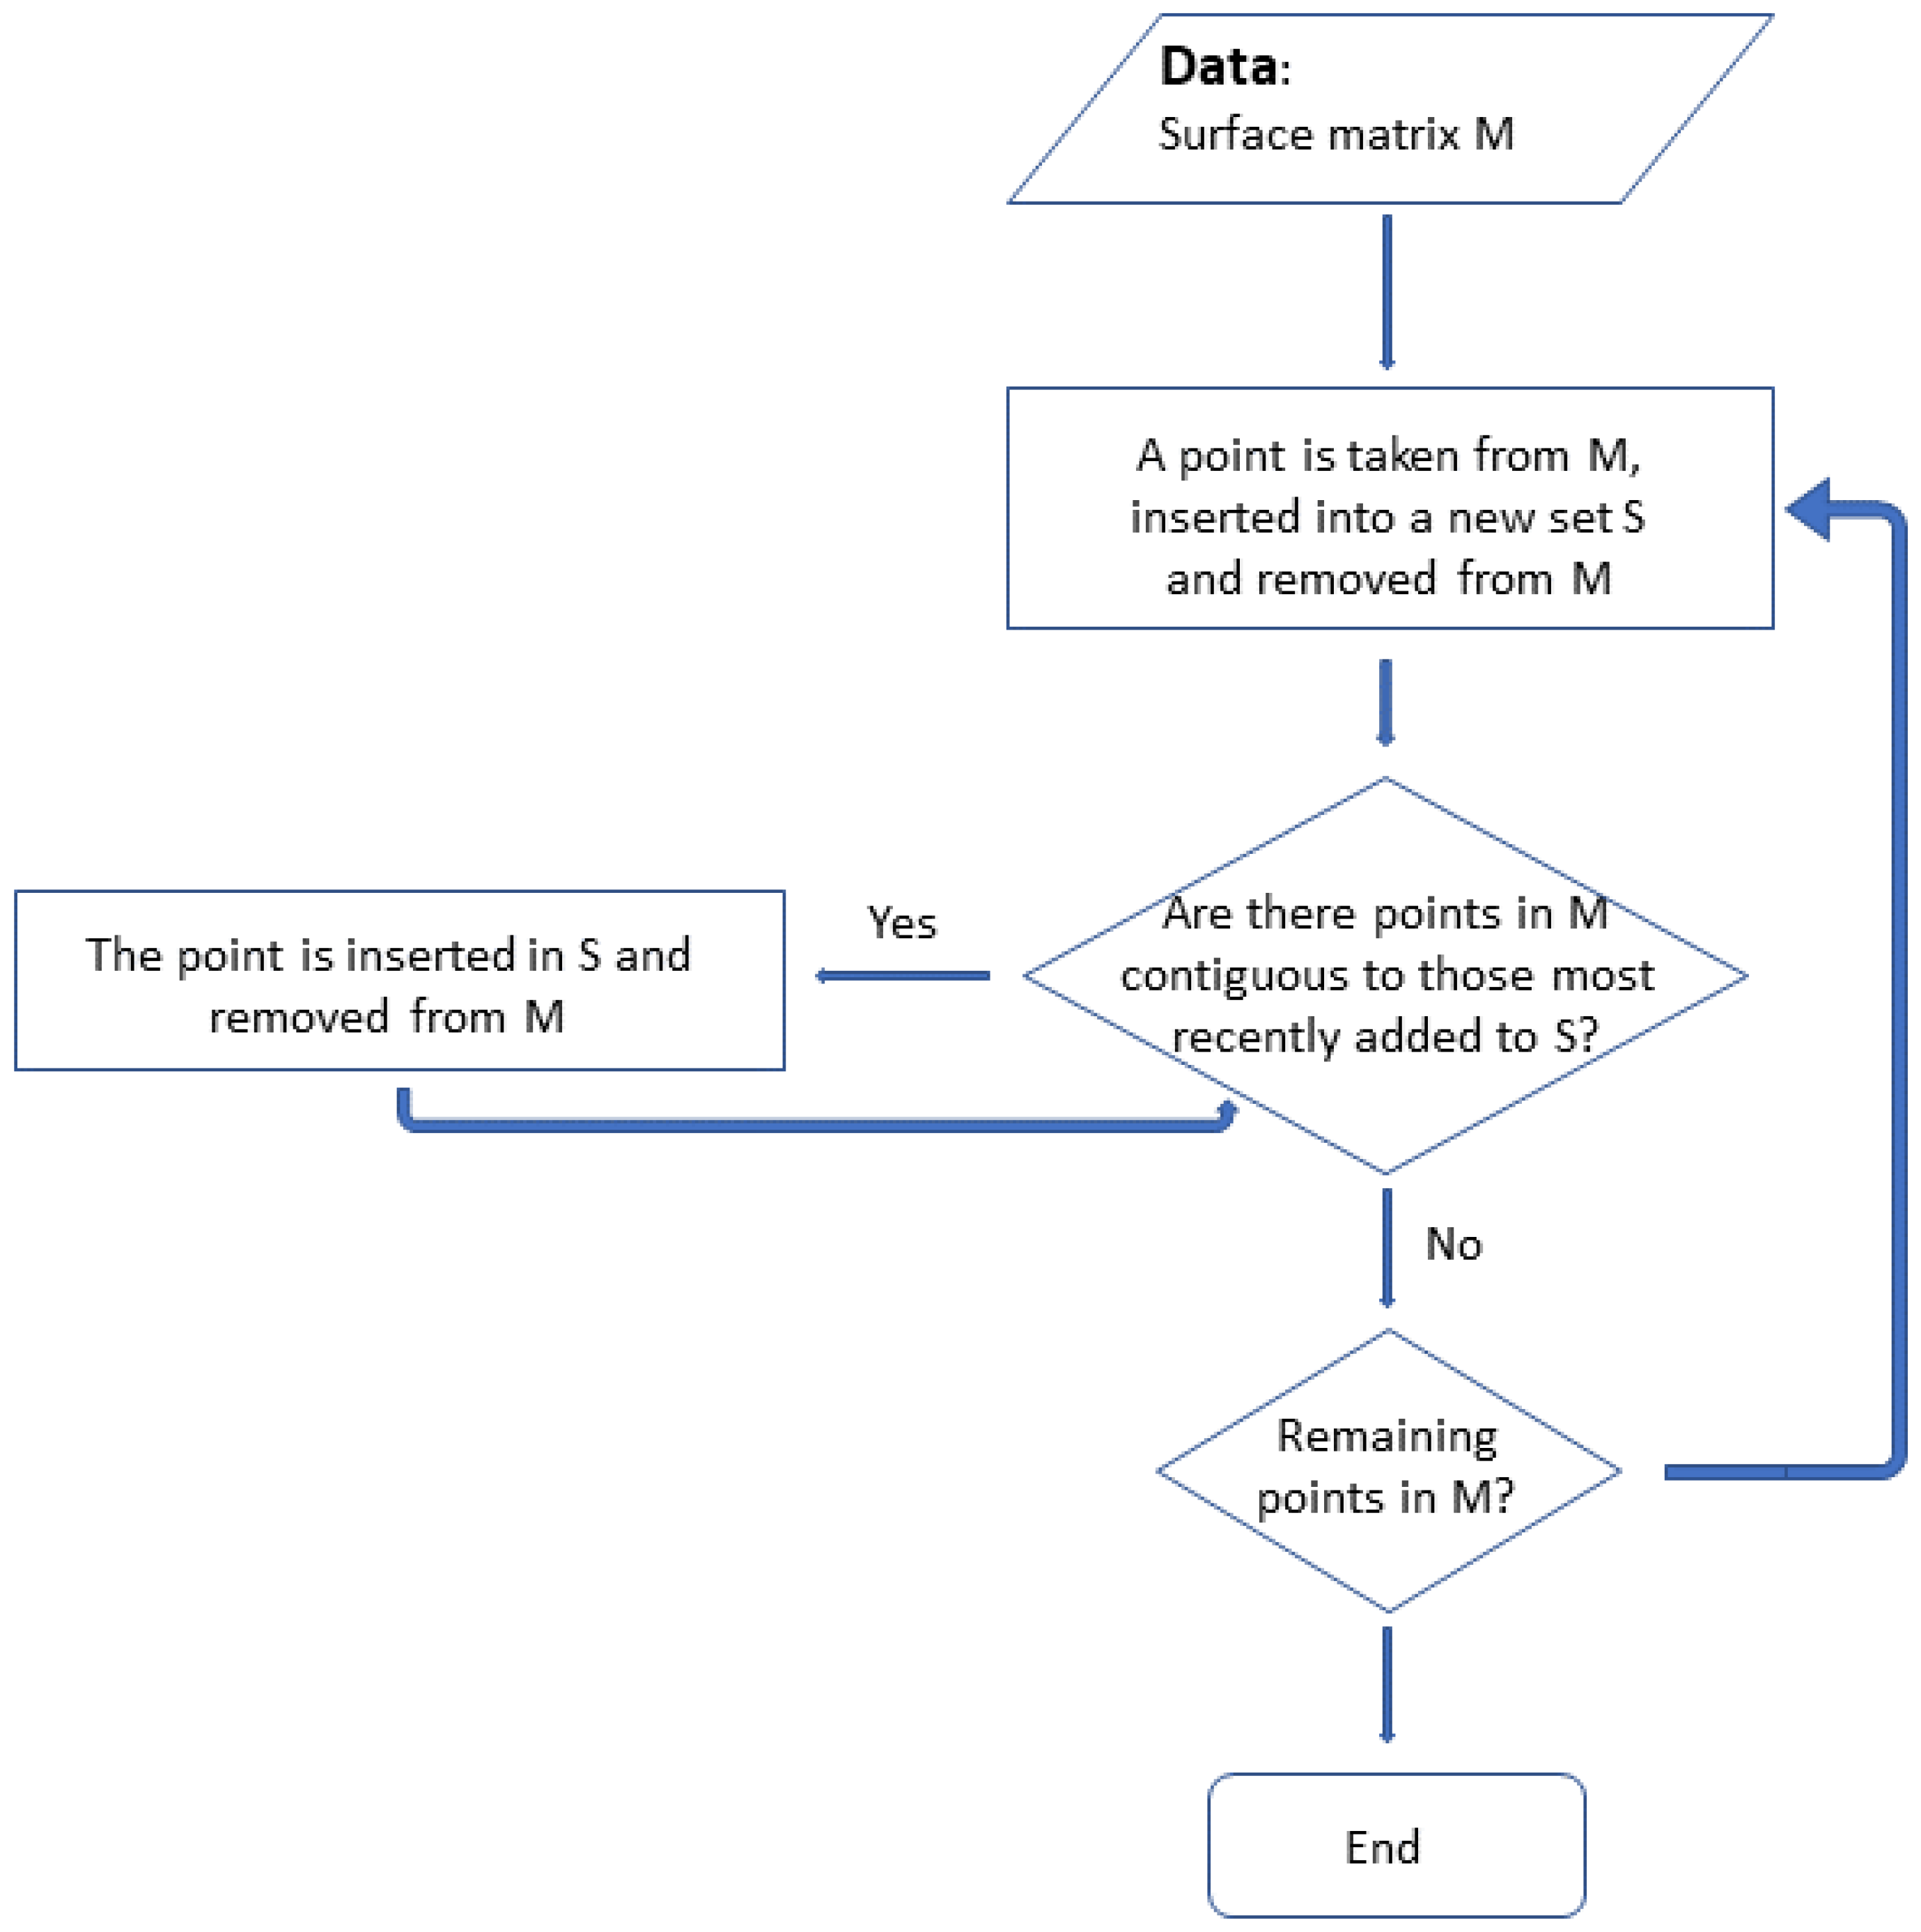
Figure 6.
Average execution time as a function of the length of the image side.
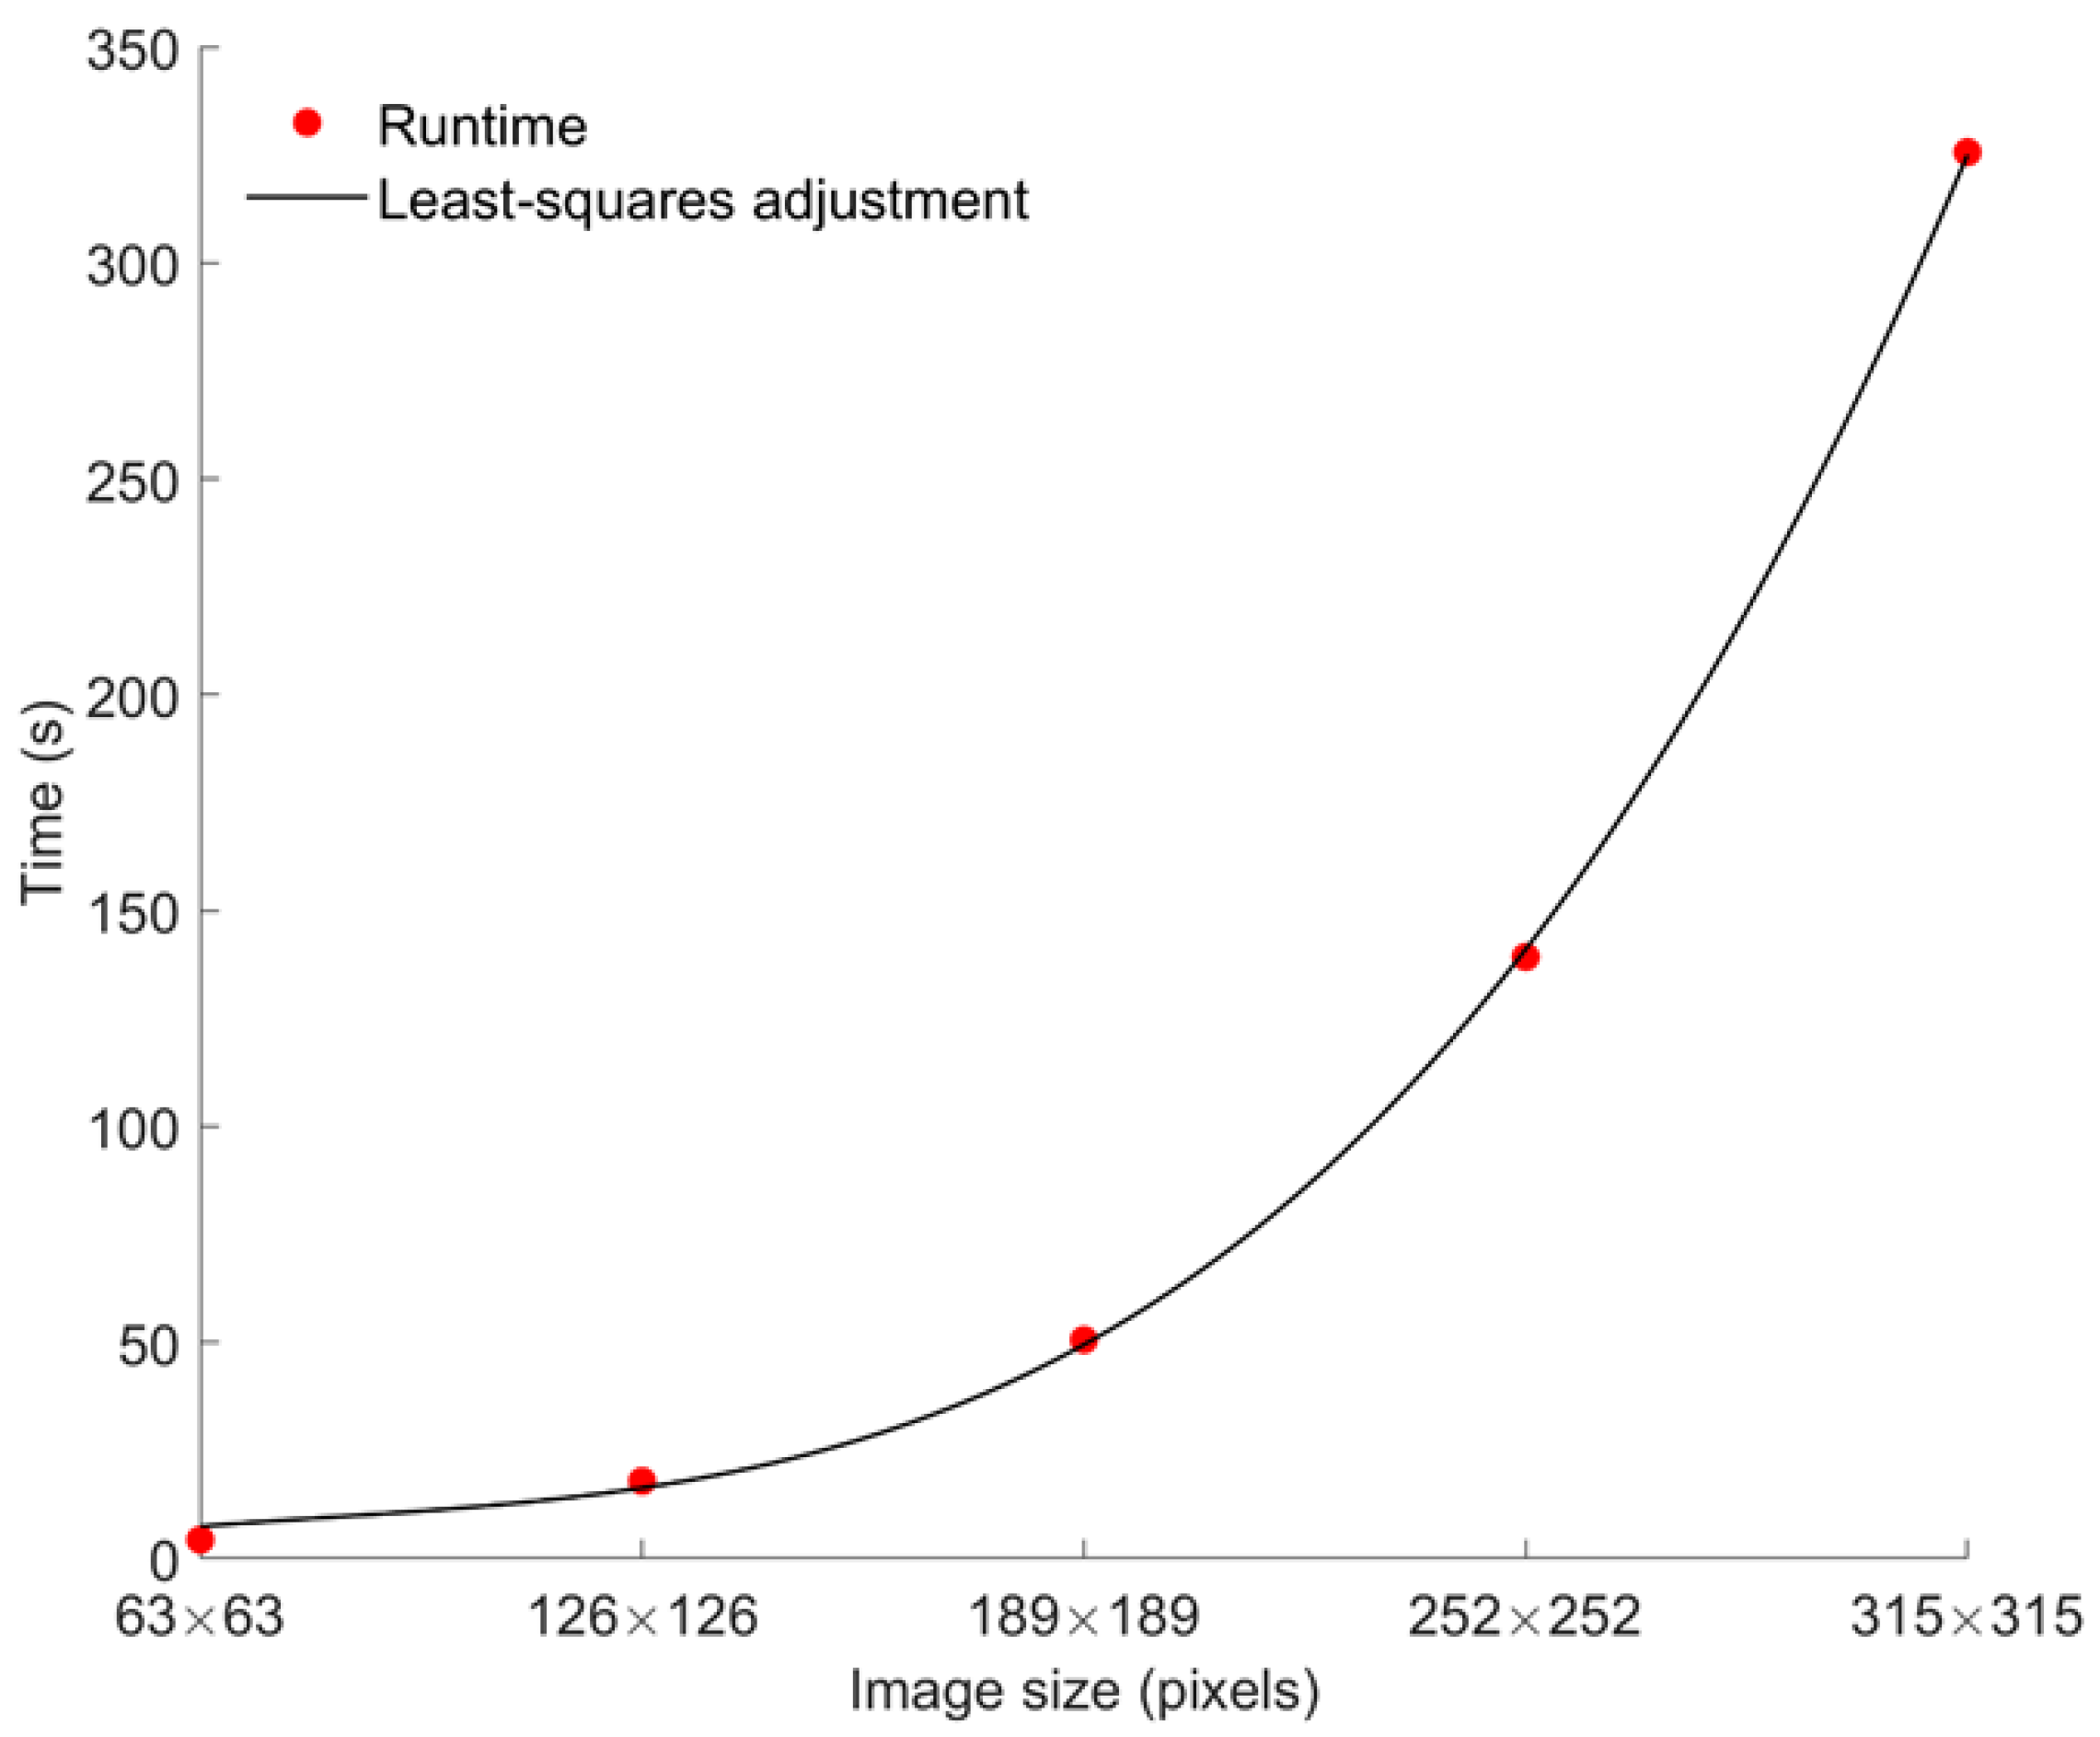

Table 1.
Comparative volumes obtained with the different used methods. 1: first; 2: second; M: molar. U: upper maxillary; L: lower maxillary. Software automatic threshold: 300.
Table 1.
Comparative volumes obtained with the different used methods. 1: first; 2: second; M: molar. U: upper maxillary; L: lower maxillary. Software automatic threshold: 300.
| Micro-CT (mm3) |
CB-CT Viewer (mm3) Set Threshold |
CB-CT Viewer (mm3) Automatic threshold |
CB-CT Algorithm |
|
|---|---|---|---|---|
|
Sample 1 2MU |
11.13 | 11 | 7 | |
|
Sample 2 1MU |
11.79 | 13 | 8 | |
|
Sample 3 2ML |
24.36 | 25 | 21 | |
|
Sample 4 1MU |
14.1 | 9 | 4 | |
|
Sample 5 2MU |
21.4 | 14 | 5 |
Disclaimer/Publisher’s Note: The statements, opinions and data contained in all publications are solely those of the individual author(s) and contributor(s) and not of MDPI and/or the editor(s). MDPI and/or the editor(s) disclaim responsibility for any injury to people or property resulting from any ideas, methods, instructions or products referred to in the content. |
© 2024 by the authors. Licensee MDPI, Basel, Switzerland. This article is an open access article distributed under the terms and conditions of the Creative Commons Attribution (CC BY) license (http://creativecommons.org/licenses/by/4.0/).
Copyright: This open access article is published under a Creative Commons CC BY 4.0 license, which permit the free download, distribution, and reuse, provided that the author and preprint are cited in any reuse.


