
Submitted:
11 May 2024
Posted:
13 May 2024
You are already at the latest version
Abstract
In recent years, the rapid expansion of urban areas has led to changes in land use, a reduction in pervious surfaces, and a disturbance in the balance between surface waters and groundwater. These urban changes, combined with inadequate drainage systems and misdirection of runoff, have resulted in severe urban floods, causing numerous fatalities and damage to urban areas. As a result, investigating the effects of flood occurrences and determining proper mitigation measures to reduce flood damage is essential. This paper aims to establish a novel economic-hydrologic model to evaluate the efficacy of Low-impact Development (LID) measures in urban Bronx River catchment, NYC. The model examines reduced peak discharge of flood and imposed damage. Initially, the EPA’s SWMM is used to simulate urban flooding based on recent extreme events. LID scenarios are then implemented, including individual and combined scenarios, to mitigate the adverse impacts of flood occurrences of high to low frequency. By means of the HEC-GeoRAS tool, highly detailed flood inundation maps are generated and seamlessly incorporated into the flood damage estimation model, namely HAZUS, to obtain estimates of the potential damage caused by floods. Using the reduced monetary damages and the implementation cost of LID measures, the benefit-to-cost (BC) ratio is then calculated. Findings indicated that the combined LID scenario is the most effective approach in peak flow reduction. Moreover, Permeable pavement outperforms infiltration trench, bio retention cell, and rain barrel in terms of benefit-to-cost ratio, with rain barrel showing the lowest ratio. The proposed evaluation system for LID measures, with a focus on flood damage reduction as a key benefit, provides valuable insights for identifying optimal scenarios and facilitating informed decision-making.
Keywords:
Hydrologic-economic model
; Sensitivity analysis
; Low impact development scenarios
; Urban flood management
; Bronx River catchment
1. Introduction
In recent decades, climatic change that cause to shift in precipitation magnitude and pattern, also human pressures and the related land use changes on catchment systems have led to reduce the water permeability in ground, which consequently causes the increase of runoff volume and peak flow, and the related flood events especially in urban catchments (Karamouz et al., 2010; Zhang et al., 2017; Li et al., 2019). Flooding is a prevalent natural disaster on a global scale, accounting for approximately one-third of all such incidents worldwide. Of particular concern is urban flooding, which poses a significant challenge in numerous regions across the globe. Over the course of the last twenty years, a staggering number of individuals, exceeding 1.81 billion people, which amounts to nearly 22 percent of the global population, have been affected by flooding. The consequences of these flood events have been devastating, with estimated casualties and damages surpassing a staggering 1 trillion US dollars over the past four decades. (UNDRR, 2020; Munich, 2020; McDermott, 2022). Furthermore, projections and forecasts of future trends and changes suggest that an even larger number of people and valuable assets will be at risk of flooding in the coming decades (Jongman et al., 2012; Bodoque et al., 2023). Regionally, based on recent reports from the National Weather Service (NWS), floods in the United States resulted in an average annual toll of 85 human fatalities and $7.95 billion in damages over a span of approximately 30 years (1980-2013) (National Weather Service, 2017). The high costs associated with flooding events can be attributed to the complex interplay between natural, social, and political factors. In the United States, the presence of residential and commercial activities along coastlines and floodplain regions has significantly increased human exposure to flood hazards (Sadiq et al., 2019). To effectively address and mitigate the severe impact of floods, particularly in high-risk areas, it is crucial to implement urban flood risk management strategies. Key to successful flood risk management is the implementation of comprehensive and reliable flood risk assessments, encompassing the concepts of flooding hazard, flooding exposure, and vulnerability (UNISDR, 2015; Bernhofen et al., 2022).
The assessment of flood risk has primarily relied on three methodological approaches: historical disaster statistics, index system, and scenario simulation (Benito et al., 2014; Wang et al., 2018; Yang et al., 2018; Jia et al., 2022). The historical disaster statistics method, which includes techniques such as Euclidean Distance, Manhattan Distance, Bayesian networks, and Markov models, requires a large dataset of flood disaster events to effectively forecast the risk of future floods. The assessment results obtained using this method are consistent with the trend of risk evolution, but the accuracy of the historical data is crucial (Peng and Zhang, 2012; Wang et al., 2018). The index system method is used to evaluate flood risk by creating an index system that corresponds to flooding disasters and determining the index weight using subjective and objective weighting methods, such as Analytic Hierarchy Process (AHP), Entropy, and CRiteria Importance Through Intercriteria Correlation (CRITIC). This approach standardizes regional data and calculates the risk value for that region (Kabenge et al., 2017; Liu et al., 2019; Wu et al., 2020). The scenario simulation method uses meteorological and hydrological data to simulate various scenarios for each study area using models like Storm Water Management Model (SWMM) and other scenario simulation models. This approach provides a comprehensive analysis of the development trends of flood disasters and can identify weaknesses in risk prevention and control measures (Kim et al., 2007). The accuracy of the scenario simulation method is high, making it a valuable tool for flood risk assessment.
Morrison et al. (2018) classified two contrasting approaches to flood risk management: the traditional protective approach and the adaptive approach. The protective approach focuses on mitigating risks through engineered physical infrastructure (e.g., grey infrastructure) and regulations, while the adaptive approach emphasizes flood resilience through flexible Nature-Based Solutions (NBS) in high-risk areas (Van Wesen et al., 2014; Lechowska, 2022). The FRM approach has evolved from a single structural approach to a combined strategy that incorporates flood source management and NBS. This shift reflects a growing recognition of the importance of natural systems in flood risk mitigation (Dadson et al., 2017). NBS strategies for reducing flood hazards include a range of measures such as leaky dams, distributed flood reservoirs, soil management practices, and Low Impact Development (LID) scenarios. These strategies aim to slow and store floodwaters, reducing the flood peak and mitigating the impact of flooding (Reaney, 2022).
In recent years, there has been growing interest among researchers, planners, and decision-makers in the use of Low Impact Development (LID) scenarios as a green infrastructure approach to managing stormwater runoff in urban catchments (Baek et al., 2015). LID scenarios are distributed management practices that mimic natural hydrology and enhance infiltration and detention in urban areas, differing from traditional structural alternatives (Ahiablame and Shakya, 2016; Eckart et al., 2017; Hua et al., 2020). The primary goal of implementing LID scenarios is to reduce flood impacts and floodplain areas in high-risk flooding regions at the urban catchment scale (Hu et al., 2017). These scenarios also aim to preserve natural hydrologic conditions and provide opportunities for aquifer recharge, thus contributing to sustainable water resources management (Azimvand et al., 2019). However, the implementation of LID scenarios can be complex, time-consuming, and costly, requiring expertise and sufficient financial resources, which may be lacking in smaller urban watersheds (Martin-Mikle et al., 2015). While LID scenarios can have positive hydrologic impacts in large catchments, their application may be limited by space constraints in advanced urban catchments (Bae and Lee, 2020). The suitability of LID scenarios depends on the specific project goals and spatial conditions, which vary across urban catchments (Li et al., 2020). In recent years, there has been a significant amount of global research focused on flood risk assessment and management, with particular emphasis on the use of Low Impact Development (LID) techniques in urban catchments. Table 1 summarizes the recent studies conducted in various regions across the world, regarding the analysis of LIDs’ application for flood risk management.
Previous research on flood risk management has emphasized the importance of integrating hydrological and economic considerations to effectively address the growing threat of floods. This involves minimizing floodplain area, as well as reducing potential human casualties and financial losses. However, the existing body of literature on LID strategies in urban areas lacks a comprehensive framework for assessing their effectiveness in reducing flood damage. This paper introduces a novel and systematic approach that combines hydrological, hydraulic, and risk analyses to evaluate the efficacy of LID measures. The proposed framework is applied to the urban catchment of the Bronx River in New York City, aiming to identify the most optimal configuration of LIDs. The objective is to determine whether these measures, either individually or in combination, can effectively mitigate peak flowrates, reduce flood volumes, and minimize associated damages. To assess the overall benefits, we consider the reduction in flood damage alongside the implementation costs of LIDs. Finally, we present a comparative analysis of different LID configurations based on their benefit-to-cost ratio.
2. Methods and Materials
This study analyzes the efficacy of the LID scenarios on inland flood risk management in the Bronx River catchment in the New York with respect to the final monetary risk. The proposed workflow of the proposed hydrologic-economic model is outlined in Figure 1:
2.1. Study Area
New York City is the most densely populated city in the United States, which is widely recognized as the hub of global trade, tourism, economy, and technology (Blake et al., 2000). It boasts one of the largest natural harbors in the world that comprised of five boroughs. The Bronx, located north of Manhattan and Queens and south of Westchester County, is the northernmost of these boroughs. The study site’s geographical coordinates span from 40° 48' to 41° N and 73° 44' to 73° 53' W. The Bronx River originates from Westchester and flows through the Bronx, discharging into the East River and ultimately into Long Island Sound.
The impact of urbanization on the Bronx River catchment is a significant concern. Accordingly, the impervious surfaces, including structures, transportation infrastructure, and pavements, cover 20.3% of the catchment area, serving as an important index for assessing the urbanization impact on flow (Zahmatkesh, 2014). Furthermore, channel relocation and reservoir construction has altered the natural hydrologic function of the catchment. The area is now home to three large reservoirs —Kensico, White Plains, and Grassy Sprain— which divert the river’s flow. The Kensico, located upstream of the Bronx River, is a vital component of New York City’s water supply system, providing approximately 85% of drinking water for residents of Westchester and New York (Zahmatkesh, 2014). The three reservoirs, with capacities of 116, 0.35, and 3.6 Billion Liters, respectively, control approximately 13.7 km2 of the Bronx River drainage area and supply drinking water to local residents (Pirnie, 1975). The Bronx River catchment, including its sub-catchments, synoptic and hydrometric stations, and land use patterns, is depicted in Figure 2, as reported in previous works (WCDP, 2005; Zahmatkesh, 2014; NCDC, 2022; NWIS, 2022).
The Bronx River is the primary branch of flow in the catchment and spans a length of 39 km, with channel width varying from 5~30 m in Westchester and 30~250 m in the Bronx. Channel length and slope also vary across the catchment, ranging from 100~11,923 m and 0.2~20%, respectively (Zahmatkesh, 2014). Recent years have seen the maximum precipitation in the Bronx catchment, and the present study analyzes the four most severe extreme events, which the first three events were selected for the calibration and the fourth one for validation, as shown in Table 2:
2.2. Rainfall-Runoff Modeling
This study employed the widely used SWMM (V5.1) rainfall-runoff model, which has been extensively utilized in various research endeavors (Jiang et al., 2015; Xiao et al., 2019; Zhang et al., 2022). The SWMM, developed by the United States Environmental Protection Agency (EPA), is specifically designed for the analysis of urban drainage systems and the assessment of runoff resulting from rainfall events (www.epa.gov). As a dynamic model, the SWMM enables the simulation of rainfall-runoff processes, making it suitable for evaluating both individual and continuous rainfall events in urban contexts. The hydrological component of the SWMM model examines sub-catchments, incorporating precipitation data and simulating evaporation and infiltration losses to generate runoff. On the other hand, the hydraulic module facilitates the movement of runoff through a network of pipes, channels, storage treatment devices, pumps, and regulators until it reaches the final catchment point. The SWMM offers a range of applications, including the analyses, design and evaluation of drainage system components, the mapping of floodplains in natural channel systems, and the assessment of Low Impact Development (LID) controls (Rossman, 2015; Aziz et al., 2022).
The SWMM model utilizes the continuity equation and Manning equation in each sub-catchment to determine the flowrate, considering water volume over the sub-catchment (), area of sub-catchment (), net precipitation (), Manning roughness coefficient (), cross-sectional area (), flow hydraulic radius (), and sub-catchment slope (). Furthermore, for flood routing, the SWMM solves the Saint-Venant equations consisting the simultaneous mass conservation and momentum equations based on the spatial and temporal changes of flow velocity () and flow depth () (Hossain et al., 2019; Koc et al., 2021).
In the SWMM software, separate roughness coefficient values are required for pervious and impervious areas. In this study, the developed areas were assumed to be impervious, while the remaining areas were initially considered pervious. Accordingly, in order to determine the roughness coefficient values for each sub-catchment, the HEC-RAS model manual was utilized (Brunner, 2016). The values for pervious and impervious areas were calculated, separately. The initial Manning roughness coefficient values were obtained from the Multi-Resolution Land Characteristics (MRLC) consortium (www.mrcl.gov/viewer), using the land use maps’ data (Multi-Resolution Land Characteristics Consortium, 2022). By employing the ArcGIS software, the land use patterns of each sub-catchment were separated, enabling the calculation of the area for each land use category. To determine the corresponding weight of each roughness coefficient, the land use area was multiplied by its corresponding roughness value. The sum of these coefficient values was divided by the total area of the sub-catchment.
Moreover, the sub-catchment characteristics, including area, width, slope, impermeable area percentage, and channel properties such as length, cross-section, roughness coefficient, and other relevant data like node elevation and water reservoirs, were obtained from Zahmatkesh (2014) and used to run the SWMM software.
2.2.1. Calibration Performance Assessment
Commonly used statistical measure for assessing the performance of hydrological models include the Nash-Sutcliffe Efficiency (NSE), and the Root Mean Squared Error (RMSE) (Ekmekcioğlu et al., 2021; Gao et al., 2023). Accordingly, in this study, these criteria were employed for model calibration and validation, as indicated by Eqs. (1), and (2):
where, is the simulated flowrate and is the observational flowrate at the time , is the average of observational flowrate and is the number of data. The can assume positive or negative values, with the ideal state being a unit value. A positive value signifies that the simulated data outperforms the average of the observational data. Conversely, a negative value indicates a lack of consistency between the model output and the inherent characteristics of the system being studied. Typically, a minimum acceptable value is set at 0.5, and as the value approaches unity, it indicates a higher level of accuracy in the simulation. Thus, a closer approximation to unity signifies an enhanced accuracy in representing the observational data through the model simulation.
Additionally, as the RMSE value decreases, the disparity between the observational data and simulated values diminishes, resulting in an improved simulation accuracy of the model. The RMSE serves as a measure of the overall goodness-of-fit between the model’s simulated values and the observational data.
2.2.2. Calibration Parameters
In the model calibration step, the five most commonly used parameters were considered, including the slope (), the Manning roughness coefficient for impervious area (), the Manning roughness coefficient for pervious area (), the percentage of impervious area (), and the Soil Conservation Service Curve Number () (Xue et al., 2020; Zakizadeh et al., 2022). The slope of catchment and sub-catchments depends on the topography related to the height at several points and the length of the channels in different sub-catchments. The Manning roughness coefficient, which represents the energy losses and channel bed resistance along the water flow, depends on the roughness and material of channel bed, irregularity of cross-section, land cover, shape of the flow line, and obstacles on the flow. The Manning roughness coefficient is considered for the two parts of pervious areas and impervious areas, separately. The percentage of impervious area depends on the type of Land Use-Land Cover (LU-LC) and the soil type of catchment in several regions and sub-catchments. Also, the curve number is function of the hydrological characteristics including the soil type of the catchment area in terms of permeability and moisture content, as well as the land cover of the sub-catchment. The most frequently used and important calibration parameters for the SWMM simulation model and the related range have been presented in Table 3:
2.3. Design Rainfall
Design rainfalls are essential for planning and evaluating how to drain stormwater, which they indicate the estimated stormwater volume (Liu et al., 2017). They are counted as rainfall intensity patterns with a determined return period. Accordingly, the design of stormwater drainage system depends on the design rainfalls and the relevant return period, which are chosen based on the catchment type or the rules of the state water authorities (Wittmanová et al., 2021). The design rainfalls depend on rainfall intensity peak value and its position during the rainfall event. Therefore, the time of concentration and the rainstorm hyetograph should be determined.
2.3.1. Time of Concentration
The time of concentration is a crucial factor when calculating runoff. It refers to the duration that is needed for traveling runoff from the hydrologically farthest distance point to the catchment outlet, also the time from the excess rainfall to the inflection point where the descent begins (NRCS, 2008; Mirmohammad Sadeghi and Nabavianpoor, 2019). The most severe flooding occurs when the rainfall duration matches the time of concentration for a particular catchment area. Each catchment has its own unique time of concentration and it will change based on the catchment slope and the earth character. Therefore, when estimating flood volume in different catchments, it is necessary to determine the maximum rainfall intensity for durations that align with the respective catchment’s time of concentration (Alamri et al., 2023).
Depending on geometric properties of catchments and hydraulic characteristics of flows, there are several methodologies for calculating the time of concentration (Almeida et al., 2021; Singh, 2023). Watt & Chow (1985) developed an empirical formula (Eq. 3) for calculating the lag time, using data from 44 catchments in the United States and Canada (Watt and Chow, 1985; Evangelista et al., 2023). This equation takes into account the length of the main channel () in meter and the average slope of the main channel (). It was developed for catchments with areas ranging from 0.01 to 5840 km2 and the slopes ranging from 0.00121 to 0.0978. This formula was applied to the Bronx catchment to calculate its lag time () in hour:
Also, according to recommendation of the Soil Conservation Service and Natural Resources Conservation System (SCS, 1975; NRCS, 2010), the time of concentration () was estimated by Eq. (4):
2.3.2. Temporal Pattern of the Rainstorm
The temporal pattern of a rainstorm is defined based on the design of rainstorm hyetograph, which aims to make the design outcomes match the real rainfall pattern in a local storm. Accordingly, the classical methodologies are used, which apply the IDF curve as well as the rainstorm intensity formula, and include the Chicago rainstorm method (Keifer and Chu, 1957) that is related to the Intensity-Duration-Frequency (IDF) curve and rainstorm intensity equation; The Principle of Statistics (P&C) method that is also called the order-average hyetograph (Pilgrim and Cordey, 1975); and the triangular-shaped hyetograph (Yen and Chow, 1980). Furthermore, the recent modern methods that consider the unsteady flow analysis, are also developed for creating rainstorm hyetograph (Lin and Wu, 2007; Lee and Ho, 2008; Kottegoda et al., 2014; Wang et al., 2018; Liao et al., 2019). One of the most frequently used methods for designing rainfall hyetograph, is the synthetic block rainfalls method. This is a type of model that matches with natural rain event and changes in intensity while distribute over time. It is efficient for more precise calculations that is considered for surface runoff formation and changing flow in the inlets. The intensity profile includes a rising part, where the rainfall increases; a peak part, where the rainfall has highest value; and a falling part, where the rainfall slowly decreases. In the alternating synthetic block method, one of the easy ways to generate a rainfall hyetograph is to use the IDF curves (Urcikán and Rusnák, 2004). Accordingly, the entire duration time () is considered using the time of concentration () and the designed rainfall hyetograph from this method specifies the rainfall depth at consecutive or different times with time intervals () for the entire duration time of the storm (). Therefore, after selecting the design return period, the relevant intensity is extracted from the IDF curve for several time intervals. These blocks are then arranged in such a way that the maximum rainfall height occurs in the middle of the entire duration time (), and the other blocks are arranged in ascending and descending orders above and below the central block, respectively. The resulting hydrograph represents rainfall with a specific return period and , or any rainfall duration shorter than (Garcia-Bartual and Andres-Domenech, 2017; Krvavica and Rubinic, 2020). In this study, by using the rainfall data from the WESTCHESTER CO AIRPORT station and its IDF curves for the return periods of 2, 5, 10, 25, 50, 100, and 500 years, the rainfall intensities were obtained and then the rainfalls were estimated using the alternating block method for the entire duration time of the storm.
2.4. Floodplain determination
After determining the rainfall values for the return periods of 2, 5, 10, 25, 50, 100, and 500 years, the SWMM model was used to calculate the flowrate of the Bronx River for the related return periods. Also, the floodplain region was determined for each return period using the ArcGIS software, along with the HEC-GeoRAS and HEC-RAS models. Accordingly, first a one-meter Digital Elevation Model map (DEM) was imported into the ArcGIS. Then, a TIN-based layer was created from the DEM map using the HEC-GeoRAS model and the flow lines, boundary lines, cross sections, obstacles, and ineffective flow boundaries were digitized. After assigning Manning’s coefficient to the cross-sectional area, all the necessary data were transferred to the HEC-RAS model. The peak flow was considered for each return period as the most critical scenario and introduced to the HEC-RAS as the flow discharge. Furthermore, the required information was extracted from the HEC-RAS output and re-introduced to the ArcGIS. Finally, according to the input data, the floodplain region for each return period was obtained.
2.5. Low Impact Development (LID) Scenarios
The use of LID techniques has become increasingly widespread in the design of surface water and flood management systems, particularly in urban catchments, to progressively reduce the hydrological and peripheral impacts of construction and development in urban areas. In this study, four of the most effective low impact developments (LIDs) in reducing stormwater runoff were examined, which include rain barrels, infiltration trenches, permeable pavements, and bio-retention systems, which represented in Figure 3 (Vo et al., 2020; Jemberie and Melesse, 2021; Li et al., 2023):
In this study, five LID scenarios were employed for the return periods of 2, 5, 10, 25, 50, 100, and 500 years, in order to analyze their hydrologic-economic performance for mitigating the hazardous impacts of the extreme rainfall events in the Bronx River catchment. The scenarios included the four LIDs (rain barrels, infiltration trenches, permeable pavements, and bio-retention cells) and a scenario with several combinations of the four LIDs, which the combined scenario could cause the reduction of peak flow and flood volume based on the increase of permeability percentage in the four LIDs. For the combined scenario, in each of the aforementioned return period, several cases of changes in increase percentage of using each single LID and simultaneous decrease percentage of using the other single LIDs in the impermeable areas of the Bronx River catchment was investigated, which each case includes 10%, 20%, and 30% increase in employing each single LID in the impermeable areas equally, while the other LIDs were decreased to the same extent. The result of each case was analyzed hydrologically and economically.
2.6. Flood Hazard Analysis
The intensity of floods is influenced by factors such as depth, velocity, and duration time. Flood vulnerability refers to the physical, social, economic, and environmental factors that increase a community’s susceptibility to its impacts. Assessing the vulnerability of communities and infrastructure when floods happen is crucial to understand potential damage and destruction (Karamouz et al., 2016; Baky et al., 2020; Tocchi et al., 2023).
Urban floods have significant economic consequences, both directly and indirectly. This is due to factors such as high population density, extensive impervious areas, blocked drainage systems, and the high value of urban infrastructure and assets. Proper and optimal land use planning plays a pivotal role in controlling and, in some cases, preventing initial damage caused by urban floods, thereby reducing potential secondary losses (Tingsanchali et al., 2012).
The total amount of damage is determined by Eq. (5), which depends on the type of approach and data selected (Greek, 2005):
where is the damage, denotes the value associated with the damaged entity, while represents the susceptibility factor expressed as a percentage. The variable corresponds to the numerator indicating the number of elements within a given area that are susceptible to flood hazard, with a total of possible states. Similarly, represents the numerator for the specific item containing the intended element, with possible states (Messner et al., 2006).
Using the flood plains obtained for each scenario, the damage of Bronx County was calculated using the HAZUS 5.1 by FEMA, which provides standardized tools and data for estimating hazards due to earthquakes, floods, tsunamis, and hurricanes (Amini et al., 2023; Lawson and Rajan, 2023; Ulza et al., 2023). The use of HAZUS software in assessing flood damage in Bronx County involves several steps and capabilities. Initially, the necessary data specific to Bronx County is obtained from the software's website and imported into HAZUS. This data serves as the foundation for the subsequent analysis. Within HAZUS, the floodplain layer is introduced as a critical component representing the extent and depth of flooding. Once the model is executed, HAZUS generates valuable insights and estimates regarding the potential damages. The software's capabilities enable the assessment of various aspects, including economic losses, structural damages, and social outcomes. Among the capabilities of HAZUS software one could refer to the historical and scenario-based modelling of economic losses, structural damages and social outcomes due to historical events and planning scenarios. The comprehensive and transparent nature of HAZUS, along with its ability to model different scenarios and assess a wide range of impacts, makes it a valuable tool for flood risk assessment and management (Sieg et al., 2023; Schumann and Chini, 2023).
3. Results and Discussion
3.1. Calibration and Validation
By adjusting the four parameters of imperviousness, CN, slope, and roughness we identified the optimal conditions. This led to the determination of less-biased simulated discharges compared to the observational, as depicted in Figure 4. The evaluation coefficients, namely NS (Nash-Sutcliffe), and RMSE (Root Mean Squared Error) were within the expected or commonly accepted ranges. Table 4 presents the values of the NS and RMSE for the calibrated model for the three historical events. The NS values range from 0.51 to 0.82, while the RMSE values range from 2.75 to 5.68. Notably, the second event demonstrates the highest level of agreement with the observational data. Ultimately, the simulation was conducted with a 10% increase in roughness, 20% decrease in slope, 20% decrease in imperviousness, and 10% reduction in CN value. The results, illustrated in Figure 4, demonstrate a close match between observational and simulated discharge values, indicating acceptable calibration of the catchment.
3.2. Impact of Single and Combined LIDs
Following the calibration of the model, an investigation was conducted to assess the effects of five different LIDs, both in individual and combined configurations, on the downstream flowrate of the Bronx River catchment. Considering the first event, the runoff results obtained from the SWMM model are presented in Figure 5. The analysis of the simulated peak flowrates reveals notable reductions when implementing different low impact developments (LIDs) within the Bronx River catchment. Specifically, individually implementing the bio-retention cell (BC), permeable pavement (PP), and infiltration trench (IT) LIDs resulted in a peak flow reduction of approximately 20%. The implementation of rain barrel (RB) LIDs yielded a more significant reduction of around 60%. However, the most substantial reduction, amounting to an 80% decrease in peak flow, was observed when combining all the LIDs.
3.3. Impacts of Combined LID Measure on Design Runoff
The design rainfall, determined using the alternating block method, was incorporated into the SWMM software to simulate runoff for each scenario. Figure 6 visually represents the percentage of flowrate reduction within the combined LID configuration when we increase the coverage area of one LID while keeping the other LID constant. In the research conducted by Zahmatkesh in 2014, an integrated approach to LID strategies was implemented, wherein three distinct LID methodologies were amalgamated. Each watershed unit was assigned specific allotments for the deployment of these LID types. For instance, in scenarios where all three LID types were utilized, a balanced allocation of 33.33% of the watershed area was designated for permeable pavement, bioretention cells, and rainwater barrel, respectively. Herein, four types of LID were employed, resulting in a 25% allocation of watershed area to each LID type when used simultaneously. By adjusting the allocation percentages for each LID type and simultaneously reducing the allocation for other LID types, we aimed to estimate the extent of inundation and the subsequent flood damage. For example, increasing the area allocated to permeable pavement by 10% while reducing the allocation for other LID types would lead to 35% of the area designated for permeable pavement, and approximately 21.66% for each of the other LID types. As depicted in Figure 6, a notable decrease in flowrate can be observed when permeable pavement is employed as a primary LID in the combined scenario, whereas an increase in coverage areas for other LIDs alone does not yield substantial flowrate reduction. Notably, the maximum reduction in flowrate achieved through the use of permeable pavement reached approximately 57% for a two-year rainstorm. This underscores the effectiveness of pervious pavement in mitigating flowrates. Expanding the area covered by other methods while holding the total LID coverage constant led to a decrease in the reduction of flowrate, mainly due to less coverage of permeable pavement. It is worth mentioning that as the return period of floods increased, the reduction in flowrate diminished. Particularly for the 500-year return period, the reduction was minimal, except for the case of permeable pavement, which remained effective even in major flooding events.
3.4. Flood Inundation Mapping
To generate the floodplain, the peak flowrates obtained for each return period were incorporated into the HEC-RAS hydraulic model. This model is specifically designed for analyzing river hydraulics and floodplain mapping. By inputting the peak flowrates into HEC-RAS, the hydraulic behavior of the river system was simulated, allowing for the determination of flood extents. To further process and visualize the floodplain, the HEC-GeoRAS extension within the GIS environment was utilized. HEC-GeoRAS is a powerful tool that integrates HEC-RAS outputs with GIS functionalities. The obtained floodplain is shown in Figure 7. In this figure, we have zoomed in on the specific area of interest to enhance the visualization of differences. The map shows that the area of inundation for a 100-year rainstorm is approximately 0.48 km2. For shorter return periods, the inundation area is smaller. As shown in Table 5, when LIDs are employed, the inundation area decreases by approximately 2.5% for BC, IT, and RB LIDs with a 10% increase scenario, while it decreases by up to 5% for PP with a 30% increase scenario. Notably, increasing LID coverage for LIDs other than PP results in a slight increase in the inundation extent.
3.5. Risk Estimation
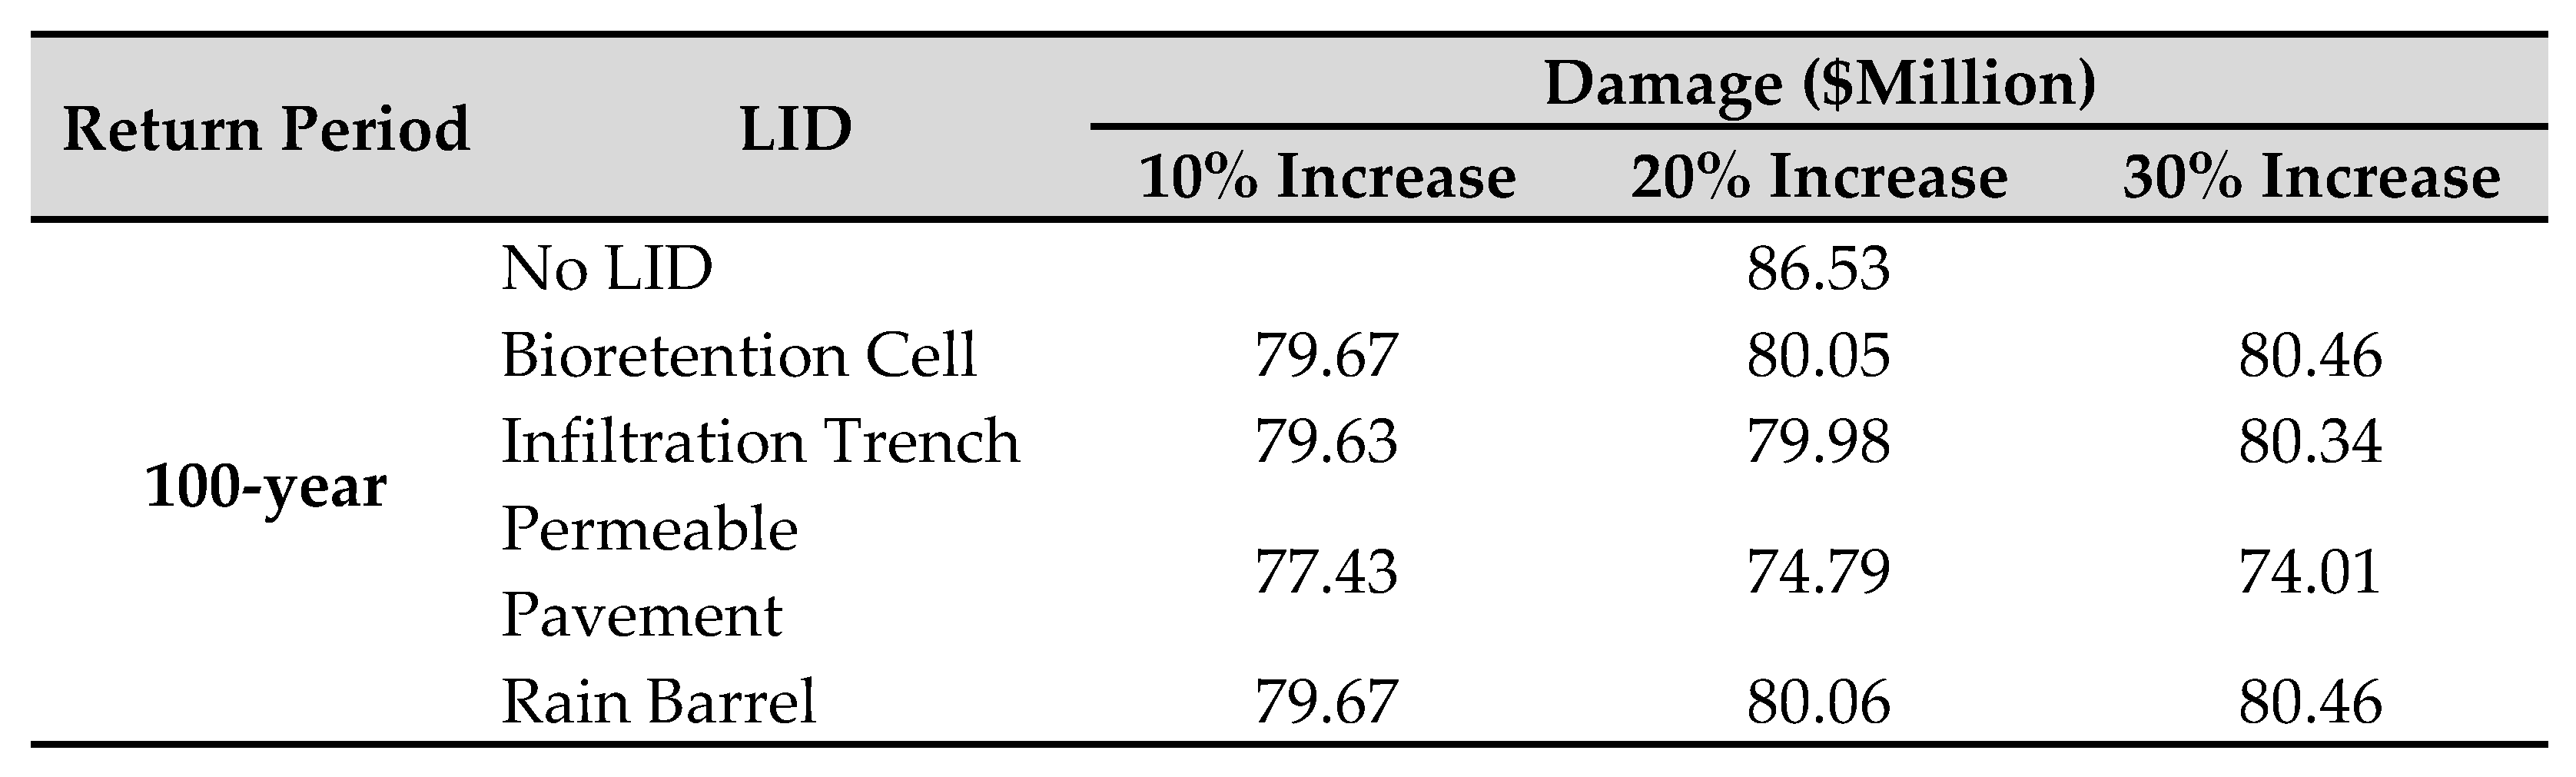
Following the integration of the flood depth layer into the HAZUS software, the assessment of damage for the specific area of interest was conducted. This evaluation encompassed the section starting from the location where the runoff measurement was performed and extended downstream within the catchment. Table 6 presents the flood damage for a 100-year rainstorm resulting from the combined LIDs with 10, 20, and 30% increase scenario for each LID measure. The damage is quantified in terms of monetary losses, with the No-LID scenario serving as the baseline. As shown in the table, the flood damage for the No-LID scenario is approximately 86.53 million dollars. However, the implementation of PP with a 30% increase scenario results in a significant reduction in flood damage, with a decrease of 14% compared to the baseline, translating to a reduction of 74.01 million dollars. This reduction is greater than the reduction in inundation extent (5%) which highlights the importance of considering even small reductions in inundation extent, as they can have a substantial impact on monetary losses.
By comparing the use of LIDs to scenarios where LIDs were not implemented, the extent of damage reduction was quantified. Figure 8 provides evidence that the implementation of pervious pavement to reduce impervious areas results in a significant decrease in damage, specifically around 37% during two-year rainstorm events. Notably, it is observed that even a relatively lower percentage increase in pervious pavement coverage would have yielded at least a 30% reduction in damage. Furthermore, the relationship between the return period and damage reduction is evident, as the reduction in damage becomes less pronounced as the return period increases. In fact, the reduction in damage approaches zero during 500-year flood events. While the variation pattern remains consistent across different return periods for the other LIDs, the impact of increasing coverage is not as distinct.
Upon calculating the costs associated with the implementation of the utilized LIDs within the catchment, it becomes possible to compute the benefit-to-cost ratio values. This calculation involves dividing the difference in damage resulting from the presence or absence of LIDs by the corresponding costs of the LIDs. The resulting benefit-to-cost ratio values are depicted in Figure 9, which provides a quantitative measure of the economic efficiency and effectiveness of implementing LIDs within the catchment. The findings suggest that the design of LIDs is more effective for shorter return periods, in particular 2-year events, while the incremental benefit of incorporating them for longer return periods is comparatively marginal. The implementation of permeable pavement has yielded a superior benefit-to-cost (BC) ratio (>0.3) compared to other LIDs in the combined scenario. Although the BC ratio is less than unity, it is important to note that the present study only considered specific benefits (as reduced flood damage) related to buildings, transportation, existing assets, and businesses. Other factors such as groundwater recharge, urban beautification, and other similar aspects were not taken into account. Therefore, it is possible that the calculated BC values might be underestimated due to the exclusion of these additional benefits. Furthermore, it is worth mentioning that the damages and benefits were calculated solely at the point of runoff measurement, without considering areas upstream of this point. Taking into account the broader impact and benefits throughout the catchment, it is likely that the overall benefit would be significant.
4. Discussion
In light of the calibration findings for the three events, modifications in land use and physiographic parameters, specifically a 20% reduction in impervious surfaces, a 10% decrease in the curve number, a 10% increase in surface roughness, and a 20% decrease in slope, are observed to induce a proportionate decrease in simulated discharge. Moreover, these adjustments contribute to the optimal alignment between simulated discharge and observed discharge. Drawing from the findings of Appollonio et al. (2016), alterations in land use and the expanding catchment area have been observed to correlate with a reduction in runoff. This trend in land use changes and its consequent impact on hydrological runoff aligns with the conclusions reported by Dimitriou and Zacharias (2010). Their study highlights the adverse effects of land use changes on the hydrological equilibrium of Lake Trichonida in Greece. In line with our findings, Deng et al. (2015) identified significant adverse effects of land use alterations on surface runoff, presenting substantial spatiotemporal variability within the Heihe River Basin of China from 2000 to 2010. Moreover, Hasan et al. (2017) determined a notable contraction, approximately 35%, in surface water runoff across Bangladesh during the same period due to land use transformations driven by rapid population expansion. Additionally, Bai et al. (2019) assessed the impacts of land use shifts on water-related resources in Kentucky, USA.
As suggested in this study, permeable pavement is the most effective LID measure. This result is in line with the Ahiablame and Shakya (2016), who reported up to 40% and 47% reduction in average annual runoff due to individual use of permeable pavement and combined practices of LID measures, respectively. These results are also in line with Tredway and Havlick's (2017) findings, showing an 18.8% reduction in Colorado flood risk using permeable pavement alone and a 32.7% reduction when combining LIDs. Mao et al. (2017) found that the multi-types of LIDs which contain green roofs, biological retention, porous pavements, were the most cost-effective solution to achieve control goals. Huang et al. (2018) observed a reduction in flood peaks of 29.8% at the local scale and 23.49% at the sub-catchment scale in Taipei, Taiwan, through the integration of pervious pavement, bioretention cells, infiltration trenches, and rain barrels. Similarly, Ghodsi et al. (2020) reported an 18% decrease in flood volume in Northeastern Tehran, Iran, through the combined implementation of LID measures. In terms of the flood inundation area, Hu et al. (2017a) achieved a 17% decrease in Nanjing, China, through the implementation of a combined LID scenario. Li et al. (2020) found that LID practices, including bioretention, grass swale, and permeable pavement, showed good performance on urban storm mitigation at watershed scale under different rainfall scenarios. They showed that PP had highest hydrological performance but lowest cost-effectiveness among the three single LID facilities. This is because LID hydrological performance is highly related with implementation areas and locations. We should note that in a built-up watershed, the available locations and areas are always limited. It can be concluded that at the watershed scale, high hydrological performance does not mean high cost-effectiveness for LID facilities.
Therefore, practical and economic considerations should be taken into account to strategically select and determine reasonable LID implementation levels. One approach to determine the cost-effectiveness of LID measures is to determine the life cycle cost (LCC) which is the total cost of a system over its life span. This cost may include construction fee, salvage value, design fee, present value, operation and maintenance fee, and years of service. Utilizing this approach, Li et al. (2017) found for a case study in China that the priority is given to grass swale, bio retention and permeable pavement, respectively. They considered the overall performance of the LID measures as the percentage of peak flow reduction per million dollars, excluding the impact of implementation area. As found by Li et al., (2020) and Hu et al. (2017b), PP had lowest cost-effectiveness but highest hydrological performance. They found that grass swale is the highest cost-effective way to reduce runoff and pollutants in a highly urbanized area.
In accordance with existing literature, our findings align with the notion that LID facilities demonstrate enhanced cost-effectiveness when deployed during shorter and smaller rainfall events. The changes in the reduction ratio of flood volume under different storms indicate that flood mitigation performance of LID facilities decreased with the increase of rainfall amounts (Hu et al., 2019; Li et al., 2020). However, several studies (Mei et al., 2018; Qin et al., 2013) have reported notable discrepancies in the reduction ratios of peak flow and surface runoff across various storm events. These variations can be attributed to two primary factors. Firstly, distinct distribution patterns play a role in influencing the reduction ratios. Secondly, the rainfall intensities need to be compared against the capacity of the drainage system to effectively manage the runoff.
It is important to acknowledge that the findings of LID facilities demonstrating superior hydrological performance and cost-effectiveness, as highlighted in this case study, may not be directly transferable to other regions with distinct characteristics. However, the proposed evaluation system for LID facilities, which incorporates flood damage reduction as a key benefit, holds value in identifying the most favorable scenario, allowing for a comprehensive analysis that can guide decision-making processes effectively.
5. Conclusions
Low Impact Development (LID) is essential in mitigating flood damage as it incorporates sustainable stormwater management practices that are designed to alleviate the impact of heavy rainfall events. This paper specifically focused on flood hazard mitigation in the Bronx Watershed of New York City through the implementation of LID measures. This paper makes a significant contribution by incorporating data from diverse sources and implementing an integrated framework that combines SWMM, HEC-RAS, and HAZUS to estimate the monetary damages associated with flood risks. Furthermore, leveraging rough estimates of the LID expenses, this study quantified the benefit-to-cost ratio, which provides valuable insights for the practical implementation of LID measures.
The results demonstrated that the combined implementation of LIDs yielded the greatest reduction in flowrates, highlighting their potential in mitigating flood hazards. Among the different scenarios examined, the introduction of permeable pavements emerged as the most effective LID solution, displaying significant reductions in flowrates and hazards, as well as the highest benefit-to-cost ratio. While the benefit-to-cost ratio calculated in this analysis was found to be less than unity, indicating that the costs of implementing LIDs exceeded the benefits, it is crucial to consider the broader perspective. The focus of this study was on the economic benefits (in terms of reduced flood damages) derived from buildings, transportation, existing assets, and businesses. However, numerous other factors can contribute to the overall benefits of LIDs, such as the increase in groundwater table, water storage in LIDs for rainwater harvesting, reduction in pollutant infiltration to groundwater, mitigation of surface runoff pollution, savings in water treatment and separation costs, reduction in thermal pollution, and the aesthetic enhancement of urban catchments.
Taking into account the significant reduction in flowrates and the mitigation of hazards achieved through LID implementation, the use of low impact developments in the Bronx Watershed is deemed highly efficient. Future research endeavors can explore several areas, including the integration of meteorological and climatic forecasting models with land use prediction and flood forecasting models, enabling more accurate LID scenario simulations. Comprehensive economic, social, and environmental multi-criteria analyses should be conducted to select the optimal LID scenario for urban catchment management. Qualitative analyses of various surface water and groundwater pollutants under LID scenarios, as well as the classification and analysis of uncertainties in urban flood management simulations and the assessment of flood hazards and risks, are also essential directions for future investigations. Finally, conducting a thorough economic analysis that considers additional economic components such as social and environmental factors will provide a more comprehensive understanding of the benefit-to-cost ratio associated with LID scenarios.
Author Contributions
All authors have contributed to the manuscript conception and design. Accordingly, conceptualization, data curation, investigation, methodology, and writing the first draft were performed by Mohammad Reza Goli Hossein Abad and the complete modified version of paper were provided by Reza Javidi Sabbaghian and Mohammad Fereshtehpour. Also, project administration, formal analysis, investigation, methodology, supervision, writing-original draft, writing-review and editing were implemented by Reza Javidi Sabbaghian. Moreover, formal analysis, investigation, methodology, supervision, writing-original draft, writing-review and editing were accomplished by Mohammad Fereshtehpour. All authors read and approved the final manuscript.
Funding
The authors declare that no funding was received during the preparation of this manuscript.
Availability of data and materials
The data will be available from the corresponding author upon reasonable request.
Competing interests
The authors have no relevant financial or non-financial interests to disclose.
Ethical Approval
Submission of this article implies that this manuscript has not been published previously, that it is not under consideration for publication elsewhere, that its publication is approved by all authors and that, if accepted, it will not be published elsewhere in the same form, without the written consent of the copyright holder.
Consent to participate
The authors have consented to the submission of this manuscript to this journal.
Consent to publish
The authors have consented to the publishing of this manuscript to this journal.
References
- Ahiablame L, Shakya R (2016) Modeling flood reduction effects of low impact development at a watershed scale. J Environ Manage 171:81-91. [CrossRef]
- Alamri N, Afolabi K, Ewea H, Elfeki A (2023) Evaluation of the time of concentration models for enhanced peak flood estimation in arid regions. Sustainability 15(3):1987. [CrossRef]
- Almeida AK, de Almeida IK, Guarienti JA et al (2022) The time of concentration application in studies around the world: a review. Environ Sci Pollut R 29:8126-8172. [CrossRef]
- Amini M, Figueira SA, Cox DT, Barbosa AR (2023) Model-data validation and uncertainty quantification of the IN-CORE and HAZUS-MH damage models for buildings impacted by Hurricane Ian (2022) at Fort Myers Beach, Florida. In: proceedings of American Society of Civil Engineering (ASCE) Inspire, pp 777-784. [CrossRef]
- Apollonio C, Balacco G, Novelli A, Tarantino E, Piccinni AF (2016) Land use change impact on flooding areas: The case study of Cervaro Basin (Italy). Sustainability 8:996. [CrossRef]
- Ayda BA, Goshime DW, Muluneh M, Ayalew AT (2024) Urban storm water management under various runoff conditions for Arba Minch Town of Southern Ethiopia. Nat Hazard Res. [CrossRef]
- Azimvand AA, Ardeshir A, Safehian M (2019) Evaluating the best managerial solutions for the urban floods using the low impact development approach. In: proceedings of 6th National Conference on the Applied Research in Civil Engineering, Architecture and Urban Management.
- Aziz MA, Moniruzzaman M, Tripathi A et al (2022) Delineating flood zones upon employing synthetic aperture data for the 2020 flood in Bangladesh. Earth Syst Environ 6:733-743. [CrossRef]
- Bae C, Lee DK (2020) Effects of low-impact development practices for flood events at the catchment scale in a highly developed urban area. Int J Disast Risk Re 44:101412. [CrossRef]
- Baek SS, Choi DH, Hung JW et al (2015) Optimizing low impact development (LID) for stormwater runoff treatment in urban area, Korea: Experimental and modeling approach. Water Res 86:122-131. [CrossRef]
- Baek SS, Ligaray M, Pyo J et al (2020) A novel water quality module of the SWMM model for assessing low impact development (LID) in urban watersheds. J Hydrol 586:124886. [CrossRef]
- Bai Y, Ochudho TO, Yang J (2019) Impact of land use and climate change on water-related ecosystem services in Kentucky, USA. Ecol Indic 102:51-64. [CrossRef]
- Baky MAA, Islam M, Paul S (2020) Flood hazard, vulnerability and risk assessment for different land use classes using a flow model. Earth Syst Environ 4:225-244. [CrossRef]
- Benito G, Lang M, Barriendos M et al (2004) Use of systematic, palaeoflood and historical data for the improvement of flood risk estimation. Review of scientific methods. Nat Hazards 31:623-643. [CrossRef]
- Bernhofen MV, Cooper S, Trigg M et al (2022) The role of global data sets for riverine flood risk management at national scales. Water Resour Res 58:1-25. [CrossRef]
- Blake R, Khanbilvardi R, Rosenzweig C (2000) Climate change impacts on New York City’s water supply system. J Am Water Resour Ass 36(2):279-292. [CrossRef]
- Bodoque JM, Esteban-Muñoz Á, Ballesteros-Cánovas JA (2023) Overlooking probabilistic mapping renders urban flood risk management inequitable. Commun Earth Environ 4: 279. [CrossRef]
- Brunner GW (2016) HEC-RAS River Analysis System Hydraulic Reference Manual Version 5. U.S.
- Cipolla SS, Maglionico M, Stojkov I (2016) A long-term hydrological modelling of an extensive green roof by means of SWMM. Ecol Eng 95:876-887. [CrossRef]
- Dadson SJ, Hall JW, Murgatroyd A (2017) A restatement of the natural science evidence concerning catchment-based 'natural' flood management in the UK. Proc Math Phys Eng Sci 473:20160706. [CrossRef]
- Deng X, Shi Q, Zhang Q, Shi C, Yin F (2015) Impacts of land use and land cover changes on surface energy and water balance in the Heihe River Basin of China, 2000–2010. Phys Chem Earth 79-82:2-10. [CrossRef]
- Dimitriou E, Zacharias I (2010) Identifying microclimatic, hydrologic and land use impacts on a protected wetland area by using statistical models and GIS techniques. Math Comput Model 51(3):200-205. [CrossRef]
- Eckart K, McPhee Z, Bolisetti T (2017) Performance and implementation of low impact development–A review. Sci Total Environ 607-608:413-432. [CrossRef]
- Ekmekcioğlu Ö, Yılmaz M, Özger M, Tosunoğlu F (2021) Investigation of the low impact development strategies for highly urbanized area via auto-calibrated Storm Water Management Model (SWMM). Water Sci Technol 84(9):2194-2213. [CrossRef]
- Evangelista G, Woods R, Claps P (2023) Dimensional analysis of literature formulas to estimate the characteristic flood response time in ungauged basins: A velocity-based approach. J Hydrol 627(B):130409. [CrossRef]
- Fava MC, Macedo MBd, Buarque ACS et al (2022) Linking urban floods to citizen science and low impact development in poorly gauged basins under climate changes for dynamic resilience evaluation. Water 14(9):1467. [CrossRef]
- Gao J, Liang J, Lu Y et al (2023) Automatic SWMM parameter calibration method based on the differential evolution and Bayesian optimization algorithm. Water 15(20):3582. [CrossRef]
- García-Bartual RA, Andrés-Doménech IA (2017) A two-parameter design storm for Mediterranean convective rainfall. Hydrol. Earth Syst Sci 21(5):2377-2387. [CrossRef]
- Ghodsi SH, Zahmatkesh Z, Goharian E, Kerachian R, Zhu Z (2020) Optimal design oflow impact development practices in response to climate change. J Hydrol 580:124266. [CrossRef]
- Greek D (2005) Flood Management and Drainage Strategy. Australia.
- Hadi Pour S, Abd Wahab AK, Shahid S et al (2020) Low impact development techniques to mitigate the impacts of climate-change-induced urban floods: Current trends, issues and challenges. Sustain Cities Soc 62:102373. [CrossRef]
- Hasan SS, Deng X, Li Z, Chen D (2017) Projections of future land use in Bangladesh under the background of baseline, ecological protection and economic development. Sustainability. 9:505. [CrossRef]
- Hossain S, Hewa GA, Wella-Hewage S (2019) A comparison of continuous and event-based rainfall–runoff (RR) modelling using EPA-SWMM. Water 11(3):611. [CrossRef]
- Hu M, Sayama T, Zhang X et al (2017a) Evaluation of low impact development approach for mitigating flood inundation at a watershed scale in China. J Environ Manage 193:430-438. [CrossRef]
- Hu M, Sayama T, Duan W, Takara K, He B, Luo P (2017b) Assessment of hydrological extremes in the Kamo River Basin, Japan. Hydrolog Sci J 62(8):1255-1265. [CrossRef]
- Hu M, Zhang X, Li Y, Yang H, Tanaka K (2019) Flood mitigation performance of low impact development technologies under different storms for retrofitting an urbanized area. J Clean Prod 222:373-380. [CrossRef]
- Hua P, Yang W, Qi X et al (2020) Evaluating the effect of urban flooding reduction strategies in response to design rainfall and low impact development. J Clean Prod 242:118515. [CrossRef]
- Huang CL, Hsu NS, Liu HJ, Huang YH (2018) Optimization of low impactdevelopment layout designs for megacity flood mitigation. J Hydrol 564:542-558. [CrossRef]
- Jemberie MA, Melesse AM (2021) Urban flood management through urban land use optimization using LID techniques, City of Addis Ababa, Ethiopia. Water 13(13):1721. [CrossRef]
- Jia H, Chen F, Pan D et al (2022) Flood risk management in the Yangtze River basin —Comparison of 1998 and 2020 events. Int J Disast Risk Re 68:102724. [CrossRef]
- Jiang L, Chen Y, Wang H (2015) Urban flood simulation based on the SWMM model. Proc. IAHS 368:186-191. [CrossRef]
- Jongman B, Ward PJ, Aerts JCJH (2012) Global exposure to river and coastal flooding: long term trends and changes. Global Environ Chang 22(4):823-835. [CrossRef]
- Kabenge M, Elaru J, Wang H et al (2017) Characterizing flood hazard risk in data-scarce areas, using a remote sensing and GIS-based flood hazard index. Nat Hazards 89:1369-1387. [CrossRef]
- Karamouz M, Moridi A, Nazif S (2010) Urban water engineering and management. CRC Press, Taylor and Francis Group, New York.
- Karamouz M, Fereshtehpour M, Ahmadvand F, Zahmatkesh Z (2016) Coastal flood damage estimator: An alternative to FEMA’s HAZUS platform. J Irrig Drain E 142(6):04016016. [CrossRef]
- Keifer CJ, Chu HH (1957) Synthetic storm pattern for drainage design. J Hydr Eng Div 83(4):1-25. [CrossRef]
- Kim KU, Park SW, Shin SH et al (2007) Construction of a real-time urban inundation analysis system based on UIS using SWMM. In: Proceedings of 5th International Conference on Software Engineering Research, Management and Applications. Busan, South Korea, pp 38-43. [CrossRef]
- Kim J, Choi S, Joo J (2017) EPA SWMM-LID modeling for low impact development. Korean Society of Hazard Mitigation 17(2):415-424. [CrossRef]
- Koc K, Ekmekcioğlu Ö, Özger M (2021) An integrated framework for the comprehensive evaluation of low impact development strategies. J Environ Manage 2941:113023. [CrossRef]
- Kottegoda NT, Natale L, Raiteri E (2014) Monte Carlo simulation of rainfall hyetographs for analysis and design. J Hydrol 519(7):1-11. [CrossRef]
- Krvavica N, Rubinić J (2020) Evaluation of design storms and critical rainfall durations for flood prediction in partially urbanized catchments. Water 12(7):2044. [CrossRef]
- Lawson CT, Rajan KS (2023) Unmanned aircraft systems (UAS): Applications and Integration into hazard mitigation planning. J Homel Secur Emerg 20(3). [CrossRef]
- Lawyer C, Davani HT, Goharian E (2024) Coalitional game Theory for Stormwater Management and Green Infrastructure Practices. J Water Res Pl 150(1). [CrossRef]
- Lechowska E (2022) Approaches in research on flood risk perception and their importance in flood risk management: A review. Nat Hazards 111:2343-2378. [CrossRef]
- Lee KT, Ho JY (2008) Design hyetograph for typhoon rainstorms in Taiwan. J Hydrol Eng 13:647-651. [CrossRef]
- Li J, Deng C, Li Y, Li Y, Song J (2017) Comprehensive benefit evaluation system for low-impact development of urban stormwater management measures. Water Resour Manag 31:4745-4758. [CrossRef]
- Li C, Peng C, Chiang PC et al (2019) Mechanisms and applications of green infrastructure practices for storm water control: A review. J Hydrol 568:626-637. [CrossRef]
- Li Y, Huang JJ, Hu M et al (2020) Design of low impact development in the urban context considering hydrological performance and life-cycle cost. J Flood Risk Manag 13:1-15. [CrossRef]
- Li C, Zhang Y, Wang C et al (2023) Stormwater and flood simulation of sponge city and LID mitigation benefit assessment. Environ Sci Pollut R. [CrossRef]
- Liao DQ, Zhu HN, Zhou J et al (2019) Study of the natural rainstorm moving regularity method for hyetograph design. Theor Appl Climatol 138(4):1311-1321. [CrossRef]
- Lin GF, Wu MC (2007) A SOM-based approach to estimating design hyetographs of ungauged sites. J Hydrol 339(3-4):216-226. [CrossRef]
- Liu Y, Engel BA, Collingsworth PD, Pijanowski BC (2017) Efficient urban runoff quantity and quality modelling using SWMM model and field data in an urban watershed of Tehran Metropolis. Sustainability 14(3):1086. [CrossRef]
- Liu Y, You M, Zhu J et al (2019) Integrated risk assessment for agricultural drought and flood disasters based on entropy information diffusion theory in the middle and lower reaches of the Yangtze River, China. Int J Disast Risk Re 38:101194. [CrossRef]
- Mao X, Jia H, Shaw LY (2017) Assessing the ecological benefits of aggregate LID-BMPs through modelling. Ecol Model 353:139-149. [CrossRef]
- Martin-Mikle CJ, De Beurs KM, Julian JP, Mayer PM (2015) Identifying priority sites for low impact development (LID) in a mixed-use watershed. Landscape Urban Plan 140:29-41. [CrossRef]
- McDermott TKJ (2022) Global exposure to flood risk and poverty. Nat Commun 13:3529. [CrossRef]
- Messner F, Penning-Rowsell E, Green G et al (2006) Guidelines for Socio-Economic Flood Damage Evaluation. Flood Site Project Report.
- Mei C, Liu J, Wang H, Yang Z, Ding X, Shao W (2018) Integrated assessments of green infrastructure for flood mitigation to support robust decision-making for sponge city construction in an urbanized watershed. Sci Total Environ 639:1394-1407. [CrossRef]
- Mirmohammad Sadeghi SO, Nabavipour M (2019) Optimization of runoff coefficient and concentration time in estimating flood discharge values by SCS method (Case study: Catchment Basin of Kohanrood River). Iranian Journal of Watershed Management Science 13(47):18-28. http://jwmsei.ir/article-1-824-en.html.
- Morrison A, Westbrook CJ, Noble BF (2018) A review of the flood risk management governance and resilience literature. J Flood Risk Manag 11:291-304. [CrossRef]
- Multi-Resolution Land Characteristics (MRLC) Consortium (2022) http://www.mrlc.gov/ (accessed 1 March 2023).
- Munich RE (2020) Risks From Floods, Storm Surges and Flash Floods [Online]. http://www.munichre.com/en/risks/natural-disasters-losses-are-trending-upwards/floods and-flash-floods-underestimated-natural-hazards.html (accessed 1 March 2023).
- National Resources Conservation Service (NRCS) (2008) Web Soil Survey. Data from survey from November 12, 2008. http://websoilsurvey.nrcs.usda.gov/app/WebSoilSUrvey.aspx.
- Natural Resources Conservation Service (NRCS) (2010) Part 630 Hydrology National Engineering Handbook, Chapter 15, Time of Concentration, United States Department of Agriculture.
- National Water Information System (NWIS) (2022) Available from: https://waterdata.usgs.gov/ny/nwis/uv?county_cd=36005&index_pmcode_00060=1&group_key=county_cd&sitefile_output_format=rdb_file&column_name=agency_cd&column_name=site_no&column_name=station_nm&range_selection=days&period=7&begin_date=2021-08-26&end_date=2021-09-02&format=html_table&date_format=YYYY-MM.
- National Weather Service (NWS) (2017) Billion-Dollar Weather and Climate Disasters. http//www.ncdc.noaa.gov/billions/events/US/1980-2017 (accessed 1 March 2023).
- Peng M, Zhang LM (2012) Analysis of human risks due to dam-break floods—part 1: A new model based on Bayesian networks. Nat Hazards 64:903-933. [CrossRef]
- Pilgrim DH, Cordery I (1975) Rainfall temporal patterns for design floods. J Hydr Div 101(1):81-95. [CrossRef]
- Pirnie M (1975) Storm drainage and flood control needs Bronx River Basin. Westchester County, New York.
- Qin HP, Li ZX, Fu G (2013) The effects of low impact development on urban flooding under different rainfall characteristics. J Environ Manage 129:577-585. [CrossRef]
- Reaney SM (2022) Spatial targeting of nature-based solutions for flood risk management within river catchments. J Flood Risk Manag 15:1-12. [CrossRef]
- Rossman LA (2015) Storm Water Management Model User's Manual Version 5.1. U.S. Environmental Protection Agency, Cincinnati, OH.
- Sadiq AA, Tyler J, Noonan DS (2019) A review of community flood risk management studies in the United States. Int J Disast Risk Re 41:101327. [CrossRef]
- Schumann ZD, Chini CM (2023) Component assessment of the electric transmission grid to hurricanes. Earth’s Future 11(11):e2023EF003525. [CrossRef]
- Sieg T, Kienzler S, Rözer V et al (2023) Toward an adequate level of detail in flood risk assessments. J Flood Risk Manag 16(3):e12889. [CrossRef]
- Singh VP (2023) A note on the time of concentration. J Hydrol Eng 28(12). [CrossRef]
- Soil Conservation Service (SCS) (1975) Investigation of Soil Conservation Service Urban Hydrology Techniques. U.S. Army Corps of Engineers Hydrologic Engineering Center.
- The United States National Climatic Data Center (NCDC) (2022) https://www.ncdc.noaa.gov/cdo-web/datasets/LCD/stations/WBAN:94745/detail (accessed 1 March 2023).
- Tingsanchali T (2012) Urban flood disaster management. Procedia Engineer 32:25-37. [CrossRef]
- Tocchi G, Ottonelli D, Rebora N, Polese M (2023) Multi-risk assessment in the Veneto Region: An approach to rank seismic and flood risk. Sustainability 15(16):12458. [CrossRef]
- Tredway JC, Havlick DG (2017) Assessing the Potential of Low-Impact Development Techniques on Runoff and Streamflow in the Templeton Gap Watershed, Colorado.Prof Geogr 69:372-382. [CrossRef]
- Tsihrintzis V, Hamid R (1998) Runoff quality prediction from small urban catchments using SWMM. Hydrol Process 12(2):311-329. [CrossRef]
- Uchiyama S, Bhattacharya Y, Nakamura H (2022) Efficacy analysis of urban planning scenarios for flood mitigation with low impact development technologies using SWMM: A case study in Saitama City, Japan. In: Proceedings of IOP Conference Series: Earth and Environmental Science 973(1):012012. [CrossRef]
- Ulza A, Idris Y, Asyifa CN, Irvansyah R (2023) Closing the resilience gap: A preliminary study on establishing the national fragility curve catalog for multi-hazard assessment in Indonesia. In: Proceedings of the 15th of Aceh International Workshop and Expo on Sustainable Tsunami Disaster Recovery. [CrossRef]
- UNDRR (2020) Human Cost of Disasters: An Overview of the Last 20 Years 2000–2019. United Nations for Disaster Risk Reduction (UNISDR).
- UNISDR (2015) Sendai Framework for Disaster Risk Reduction 2015–2030. United Nations Headquarters (UN).
- Urcikán P, Rusnák D (2004) Stokovanie a čistenie odpadových vôd. Stokovanie I. Navrhovanie stokových sietí. (Bratislava: Slovenská technická univerzita v Bratislave) p.324 ISBN 80-227-2136-0.
- Van Westen CJ, Jetten V, Sliuzas R et al (2014) Caribbean Handbook on Risk Management National Scale Landslide Susceptibility Assessment for Saint Vincent. World Bank, United States, District of Columbia.
- Vo NDP, Huynh TTT, Vo TD (2020) Potential Application of LID Techniques to Reduce Urban Flooding in Different Rainfall Pattern, Case Study for Quy Nhon, Vietnam. In: Gourbesville P, Caignaert G (eds) Advances in Hydroinformatics. Springer Water. Springer, Singapore. [CrossRef]
- Wang C, Wu J, Wang X et al (2018) Application of the hidden Markov model in a dynamic risk assessment of rainstorms in Dalian, China. Stoch Env Res Risk A 32:2045-2056. [CrossRef]
- Wang A, Qu N, Chen Y et al (2018) A 60-minute design rainstorm for the urban area of Yangpu district, Shanghai, China. Water 10:312. [CrossRef]
- Wang Y, Liu G, Guo E, Yun X (2018) Quantitative agricultural flood risk assessment using vulnerability surface and copula functions. Water-Sui 10(9):1229. [CrossRef]
- Watt WE, Chow KCA (1985) A general expression for basin lag time. Can J Civil Eng 12(2). [CrossRef]
- Westchester County Department of Planning (WCDP) (2005) Bronx River Watershed Impervious Surface Methodology. Provided to CWP.
- Wittmanová R, Marko I, Šutúš M, Stanko Š (2021) Development of Design Rainfalls: A Review. In: Proceedings of IOP Conference Series: Materials Science and Engineering. High Tatras, Slovakia, pp 1-6. [CrossRef]
- Wu HW, Zhen J, Zhang J (2020) Urban rail transit operation safety evaluation based on an improved CRITIC method and cloud model. J Rail Trans Plan Manag 16:100206. [CrossRef]
- www.epa.gov (accessed 1 March 2023).
- www.mrcl.gov/viewer (accessed 1 March 2023).
- Xiao D, Chen M, Lu Y et al (2019) Research on the construction method of the service-oriented web-SWMM System. ISPRS Int Geo-Inf 8(6):268. [CrossRef]
- Xue F, Tian J, Wang W et al (2020) Parameter calibration of SWMM model based on optimization algorithm. Computers, Materials & Continua. 65(3):2189-2199. [CrossRef]
- Yang W, Xu K, Lian J et al (2018) Integrated flood vulnerability assessment approach based on TOPSIS and Shannon entropy methods. Ecol Indic 89:269-280. [CrossRef]
- Yen BC, Chow VT (1980) Design hyetographs for small drainage structures. J Hydr Div 106(6):1055-1076. [CrossRef]
- Zahmatkesh Z (2014) Presenting a Benchmark for Flood-Resilient Cities. University of Tehran Press, Tehran.
- Zakizadeh F, Moghaddam Nia A, Salajegheh A et al (2022) Efficient urban runoff quantity and quality modelling using SWMM model and field data in an urban watershed of Tehran Metropolis. Sustainability 14(3):1086. [CrossRef]
- Zhang J, Wu J, Hua P et al (2017) The influence of land use on source apportionment and risk assessment of polycyclic aromatic hydrocarbons in road-deposited sediment. Environ Pollut 229:705-714. [CrossRef]
- Zhang K, Chui FTM, Yang Y (2018) Simulating the hydrological performance of low impact development in shallow groundwater via a modified SWMM. J Hydrol 566:313-331. [CrossRef]
- Zhang Z, Hu W, Wang W et al (2022) The hydrological effect and uncertainty assessment by runoff indicators based on SWMM for various LID facilities. J Hydrol 613(A):128418. [CrossRef]
Figure 1.
The proposed hydrologic-economic modelling process for urban flood risk management.
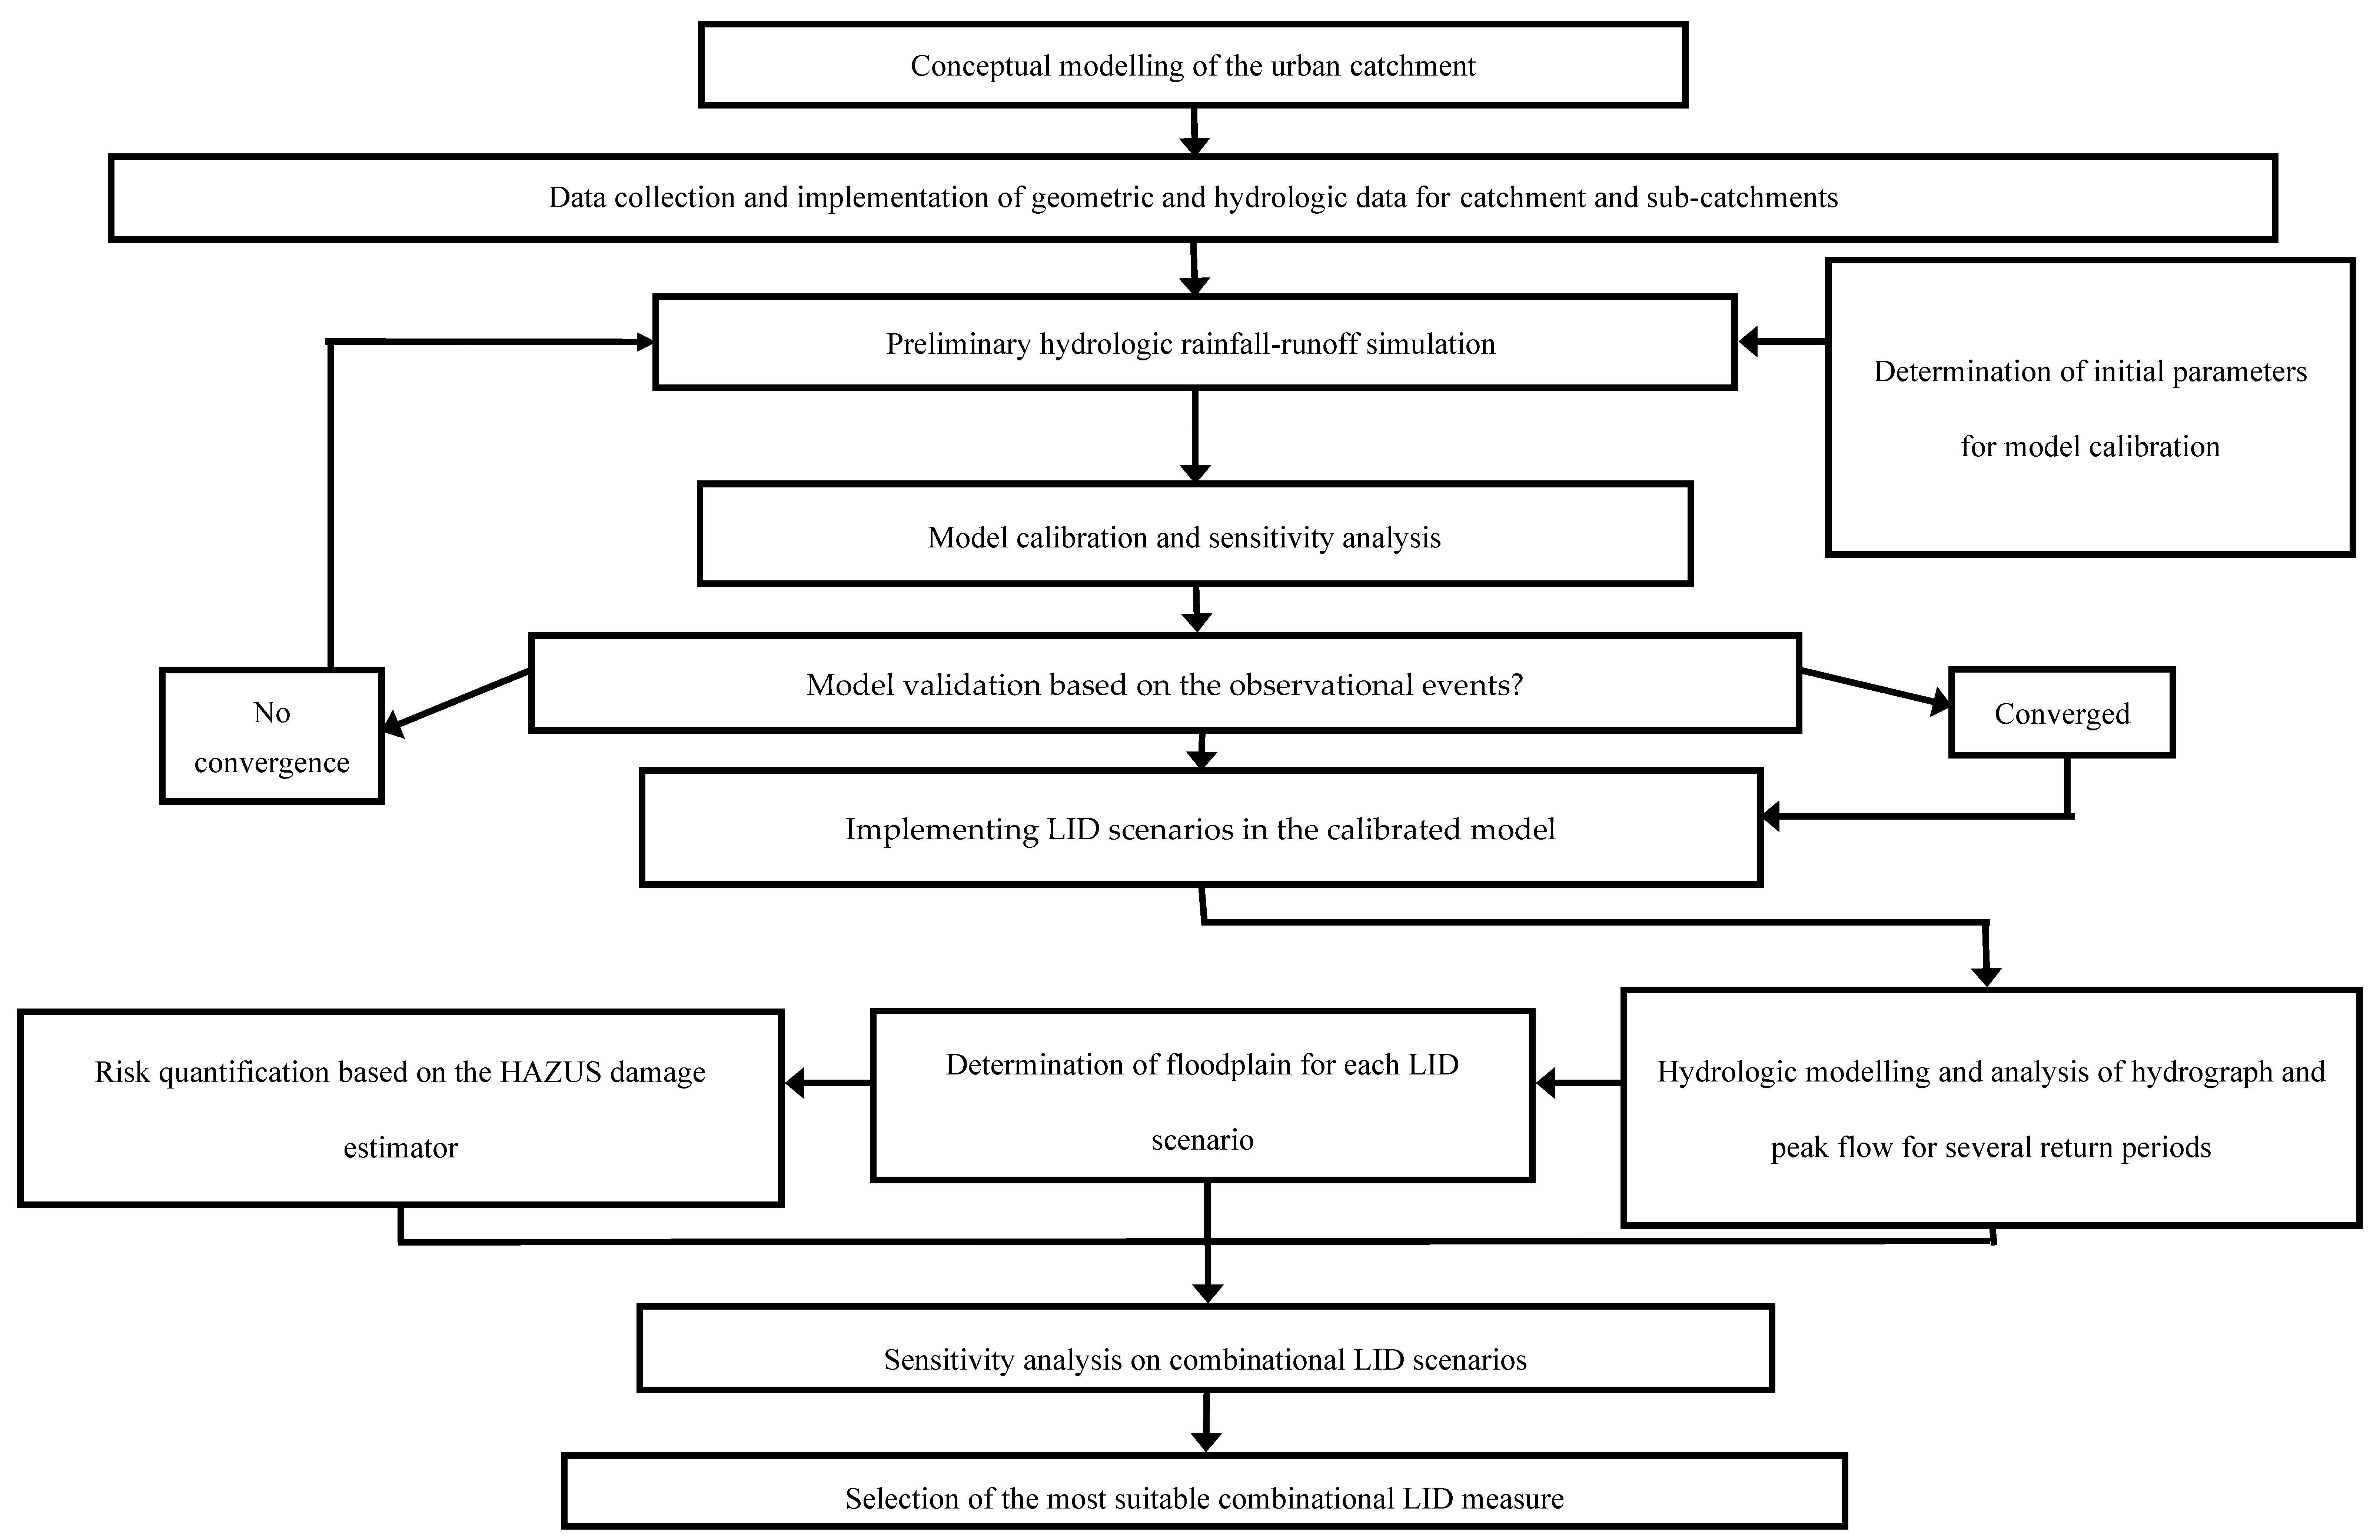
Figure 2.
The Location of Bronx River catchment in New York in United States and its sub-catchments with synoptic and hydrometric stations and land use patterns.
Figure 2.
The Location of Bronx River catchment in New York in United States and its sub-catchments with synoptic and hydrometric stations and land use patterns.
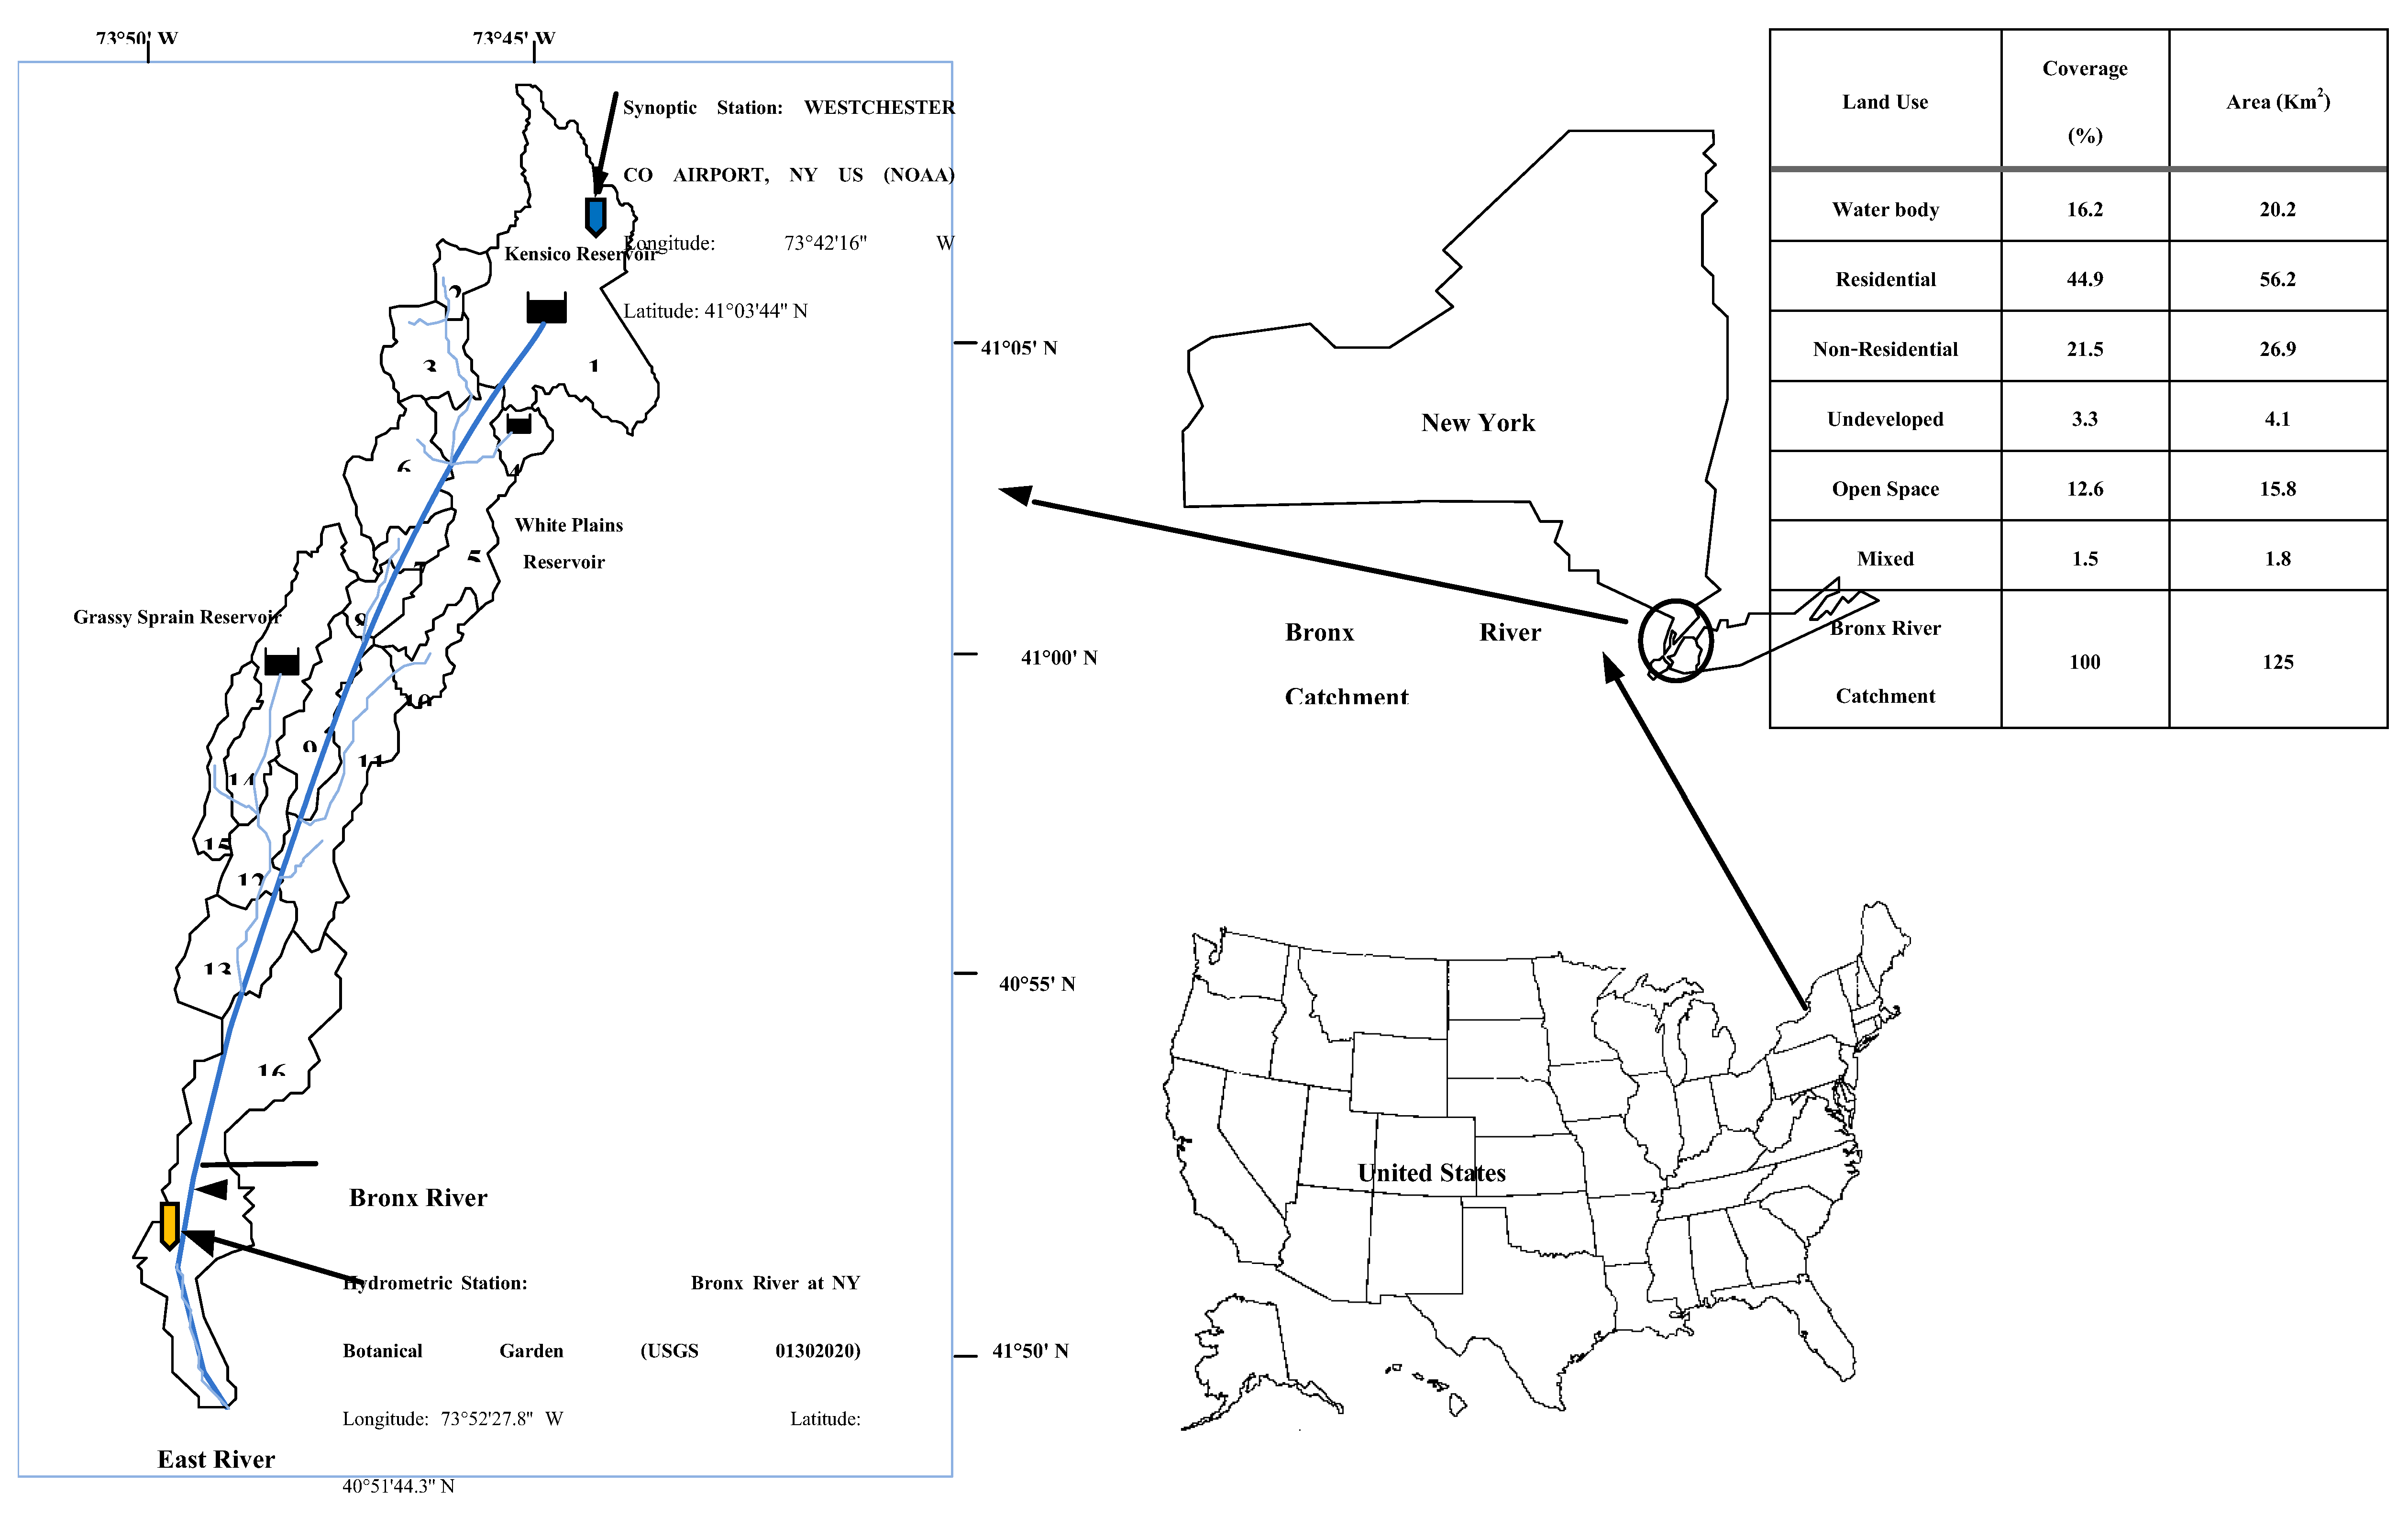
Figure 3.
Four employed LIDs: Rain Barrel, Infiltration Trench, Permeable Pavement, Bio-Retention Cell.
Figure 3.
Four employed LIDs: Rain Barrel, Infiltration Trench, Permeable Pavement, Bio-Retention Cell.
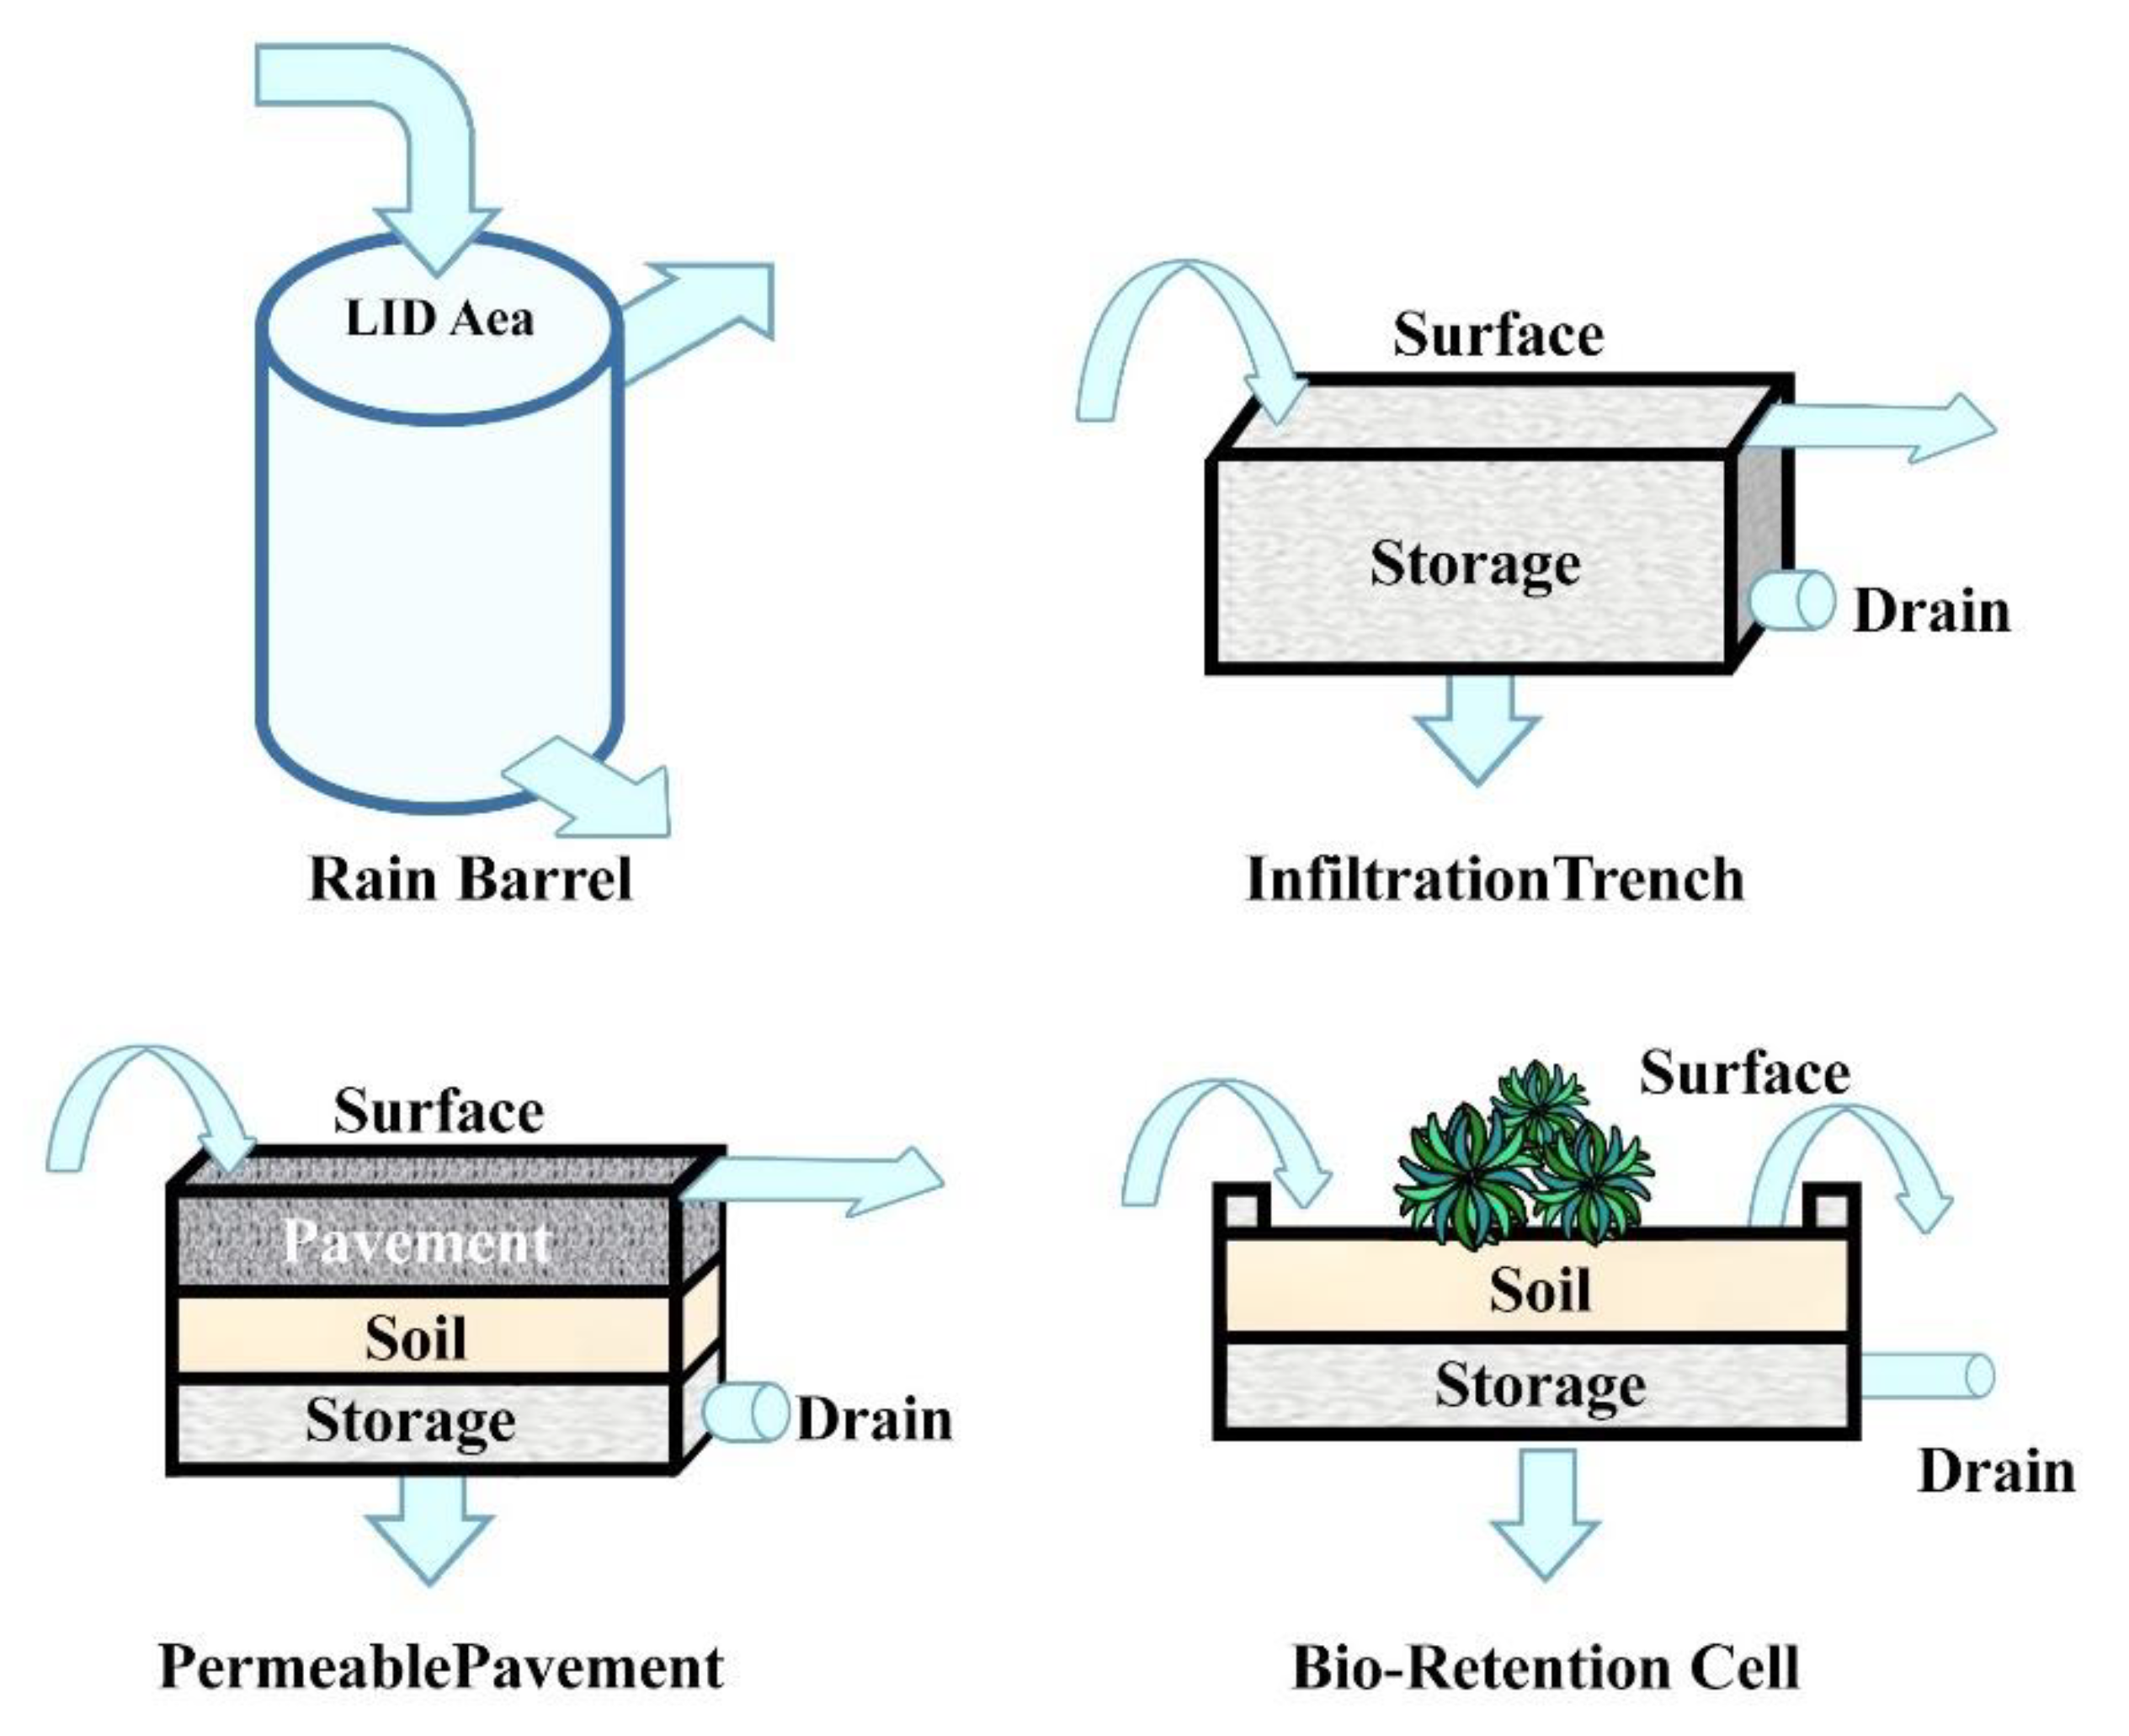
Figure 4.
Calibration results showing the observational and simulated hydrographs for the four events.
Figure 4.
Calibration results showing the observational and simulated hydrographs for the four events.
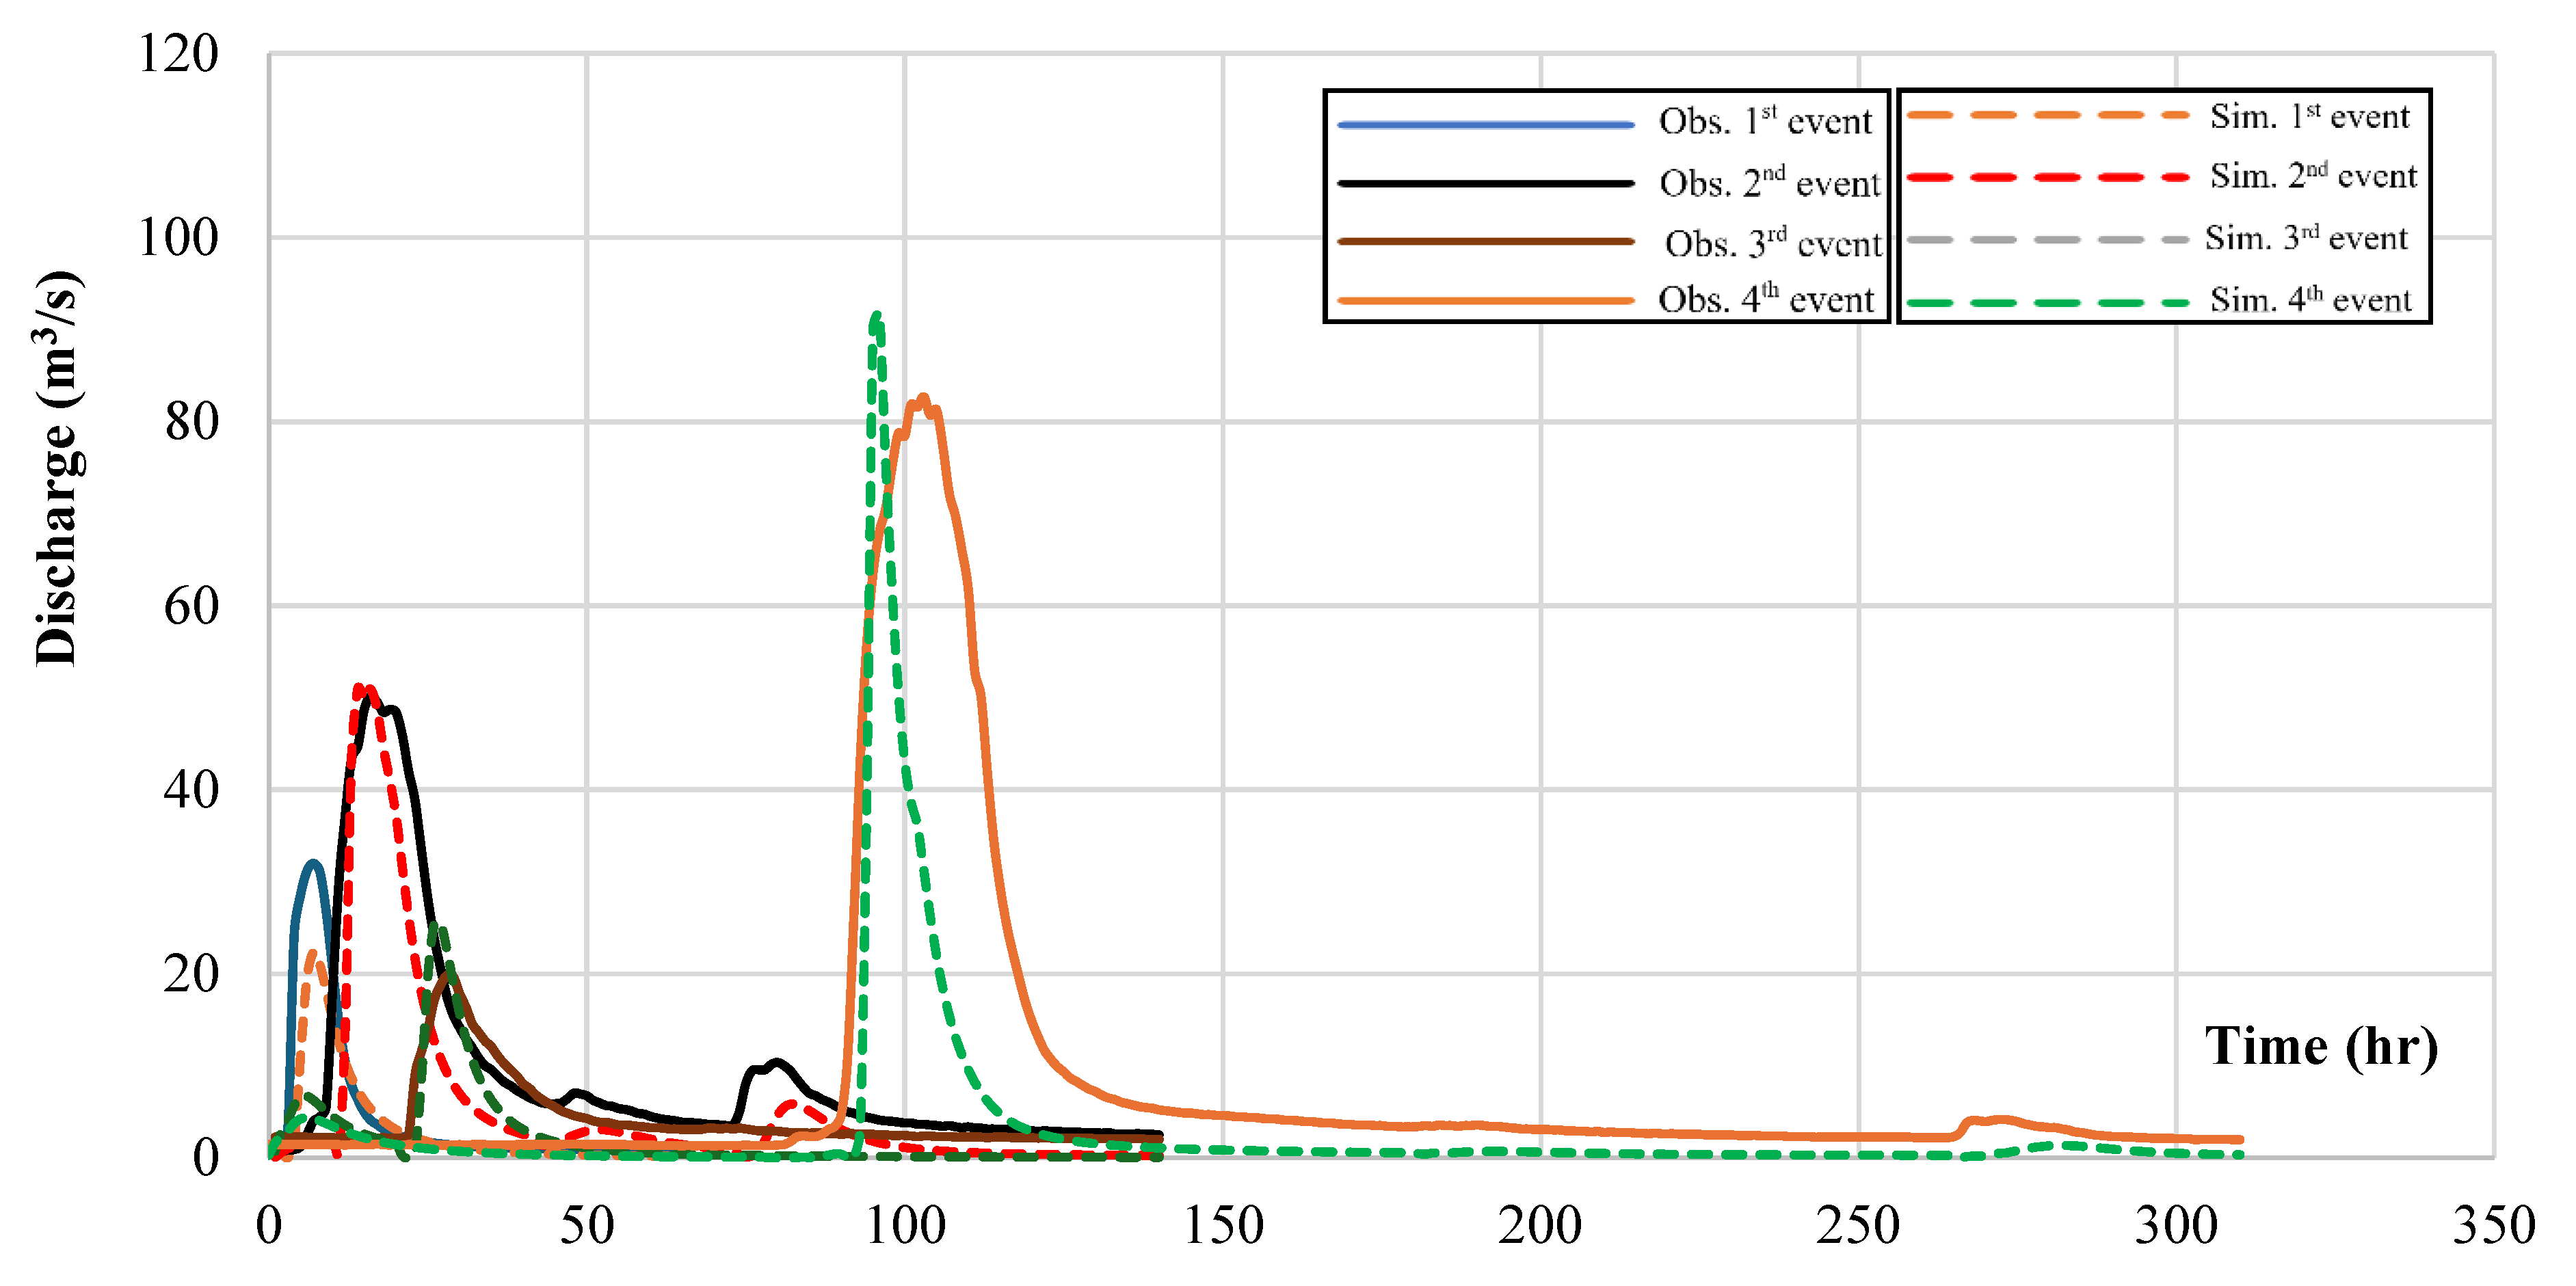
Figure 5.
Hydrographs corresponding to use of individual and combined LIDs for the 1st event. Baseline discharge refers to the simulated runoff using the calibrated model without LID measures.
Figure 5.
Hydrographs corresponding to use of individual and combined LIDs for the 1st event. Baseline discharge refers to the simulated runoff using the calibrated model without LID measures.
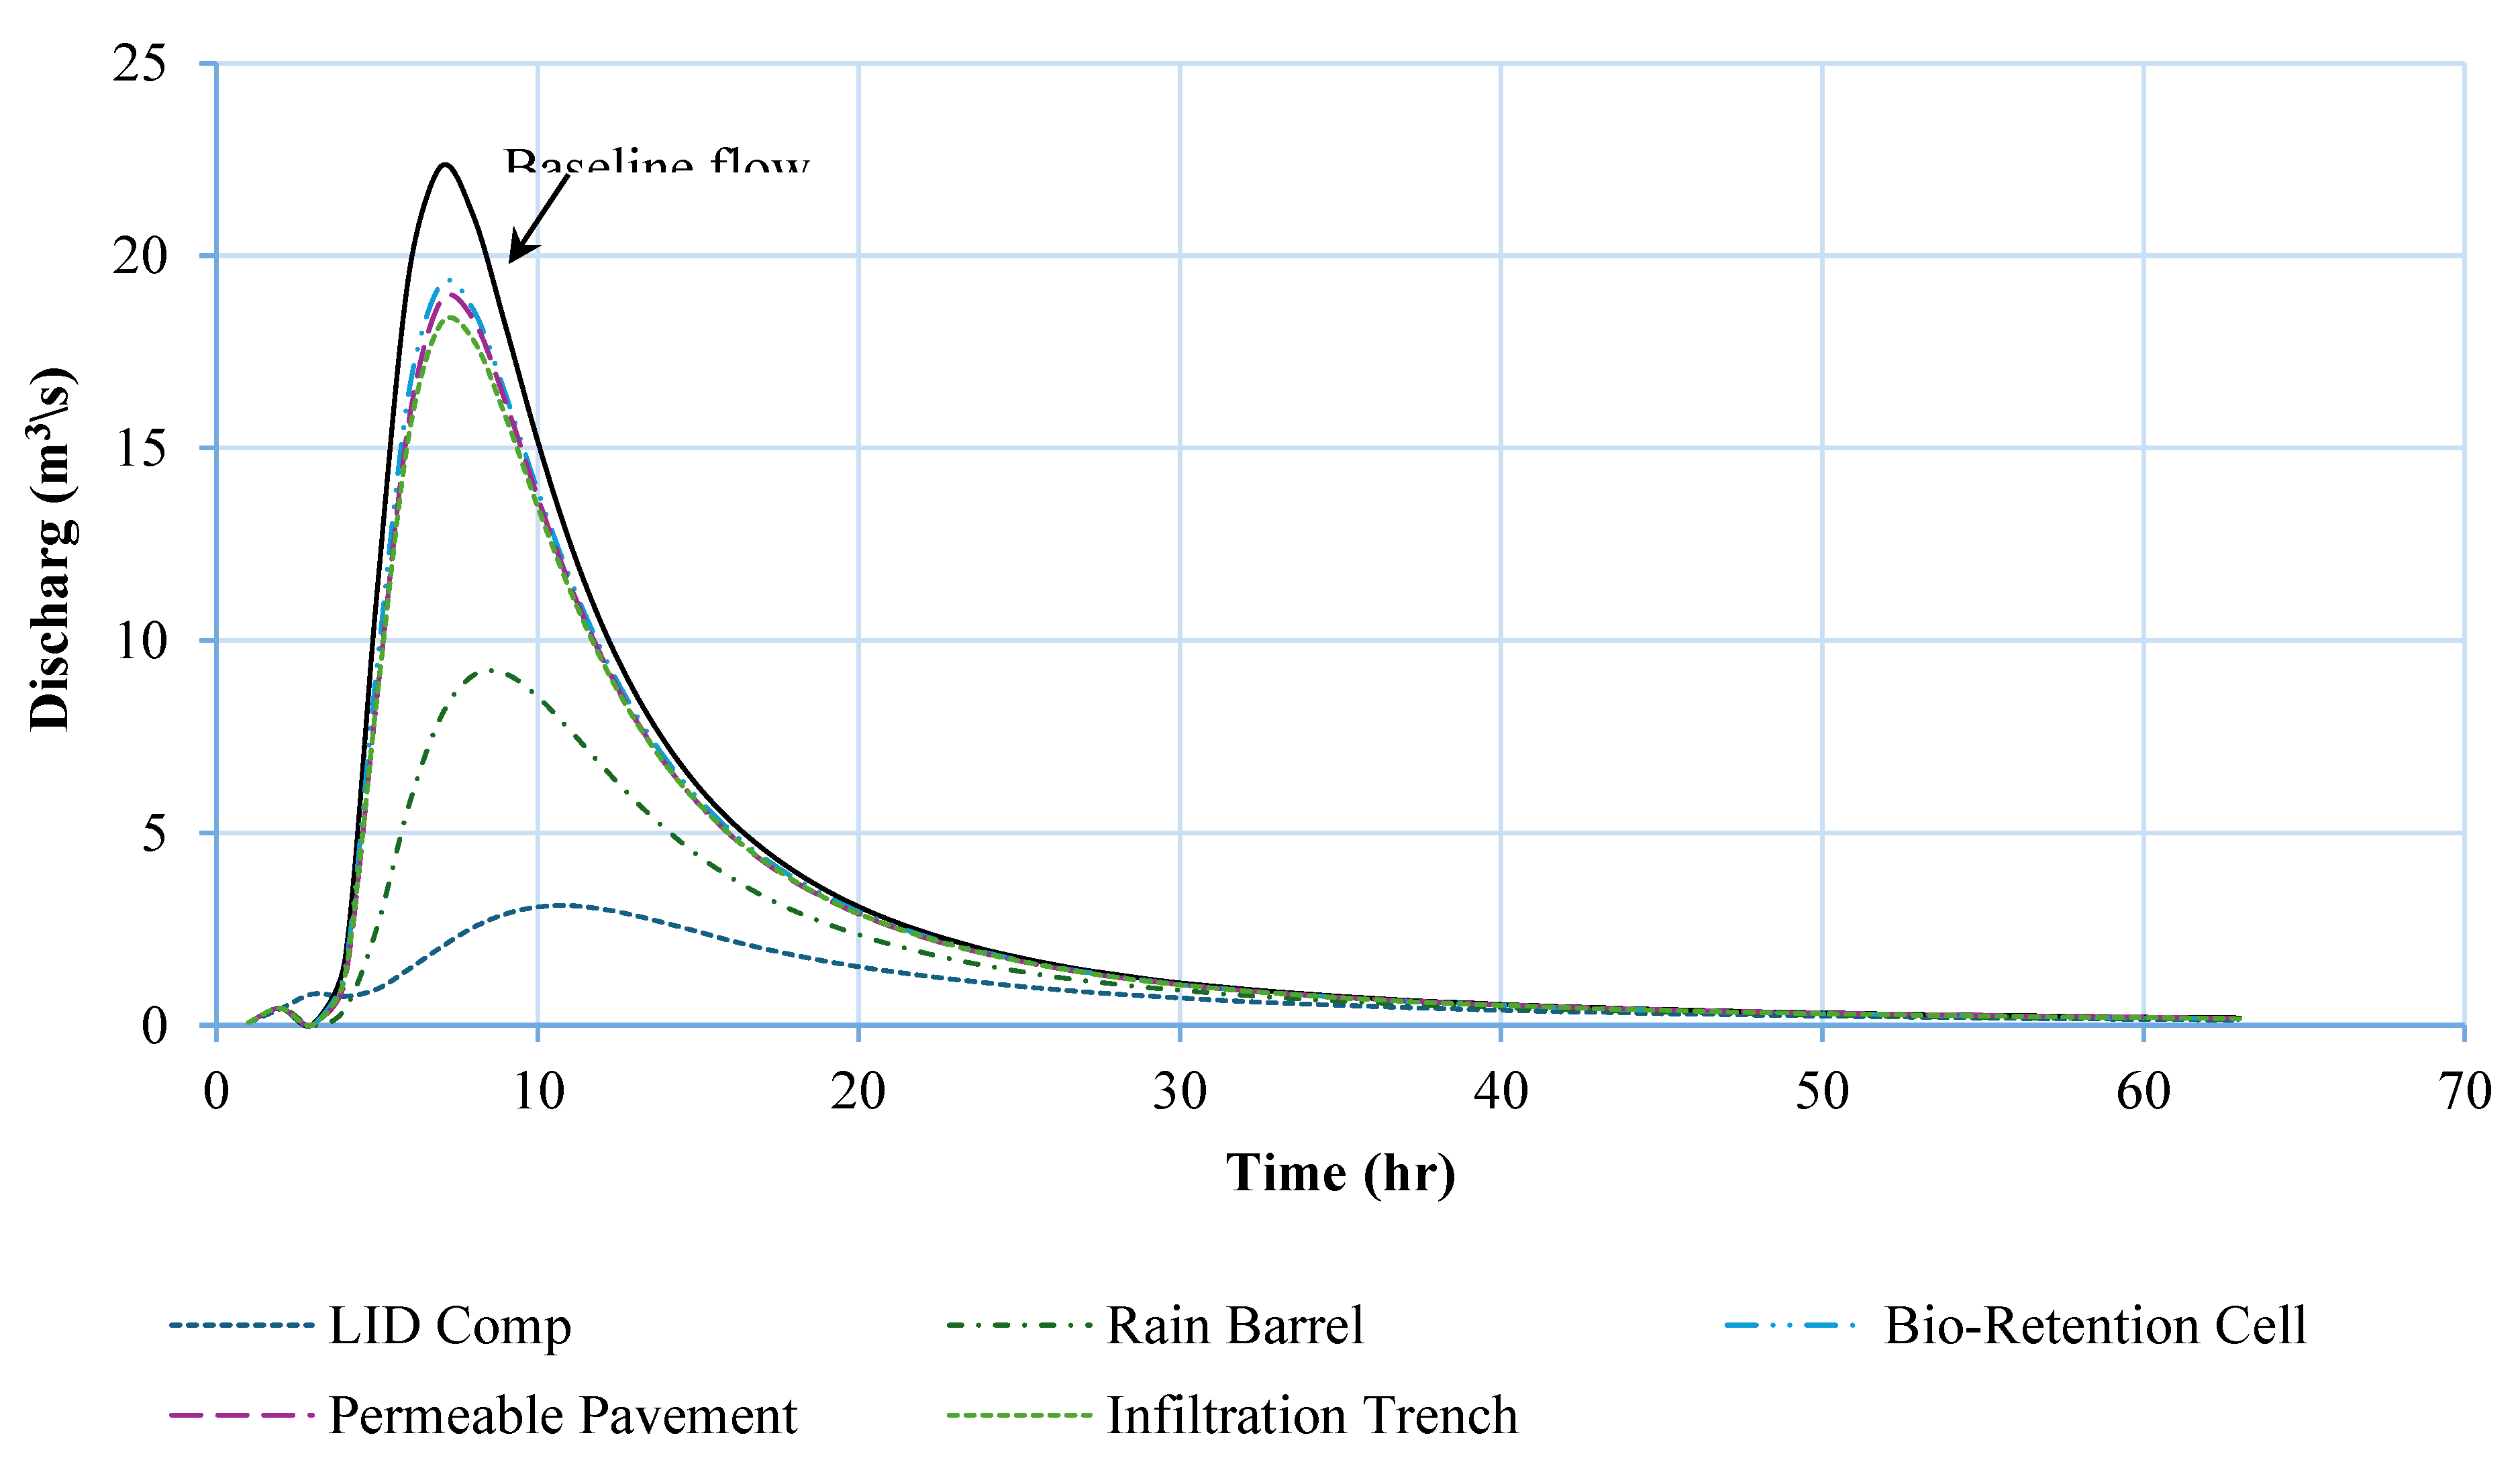
Figure 6.
Flowrate reduction (%) due to low impact development scenarios [BC: Bioretention Cell, IT: Infiltration Trench, PP: Permeable Pavement, RB: Rain Barrel].
Figure 6.
Flowrate reduction (%) due to low impact development scenarios [BC: Bioretention Cell, IT: Infiltration Trench, PP: Permeable Pavement, RB: Rain Barrel].
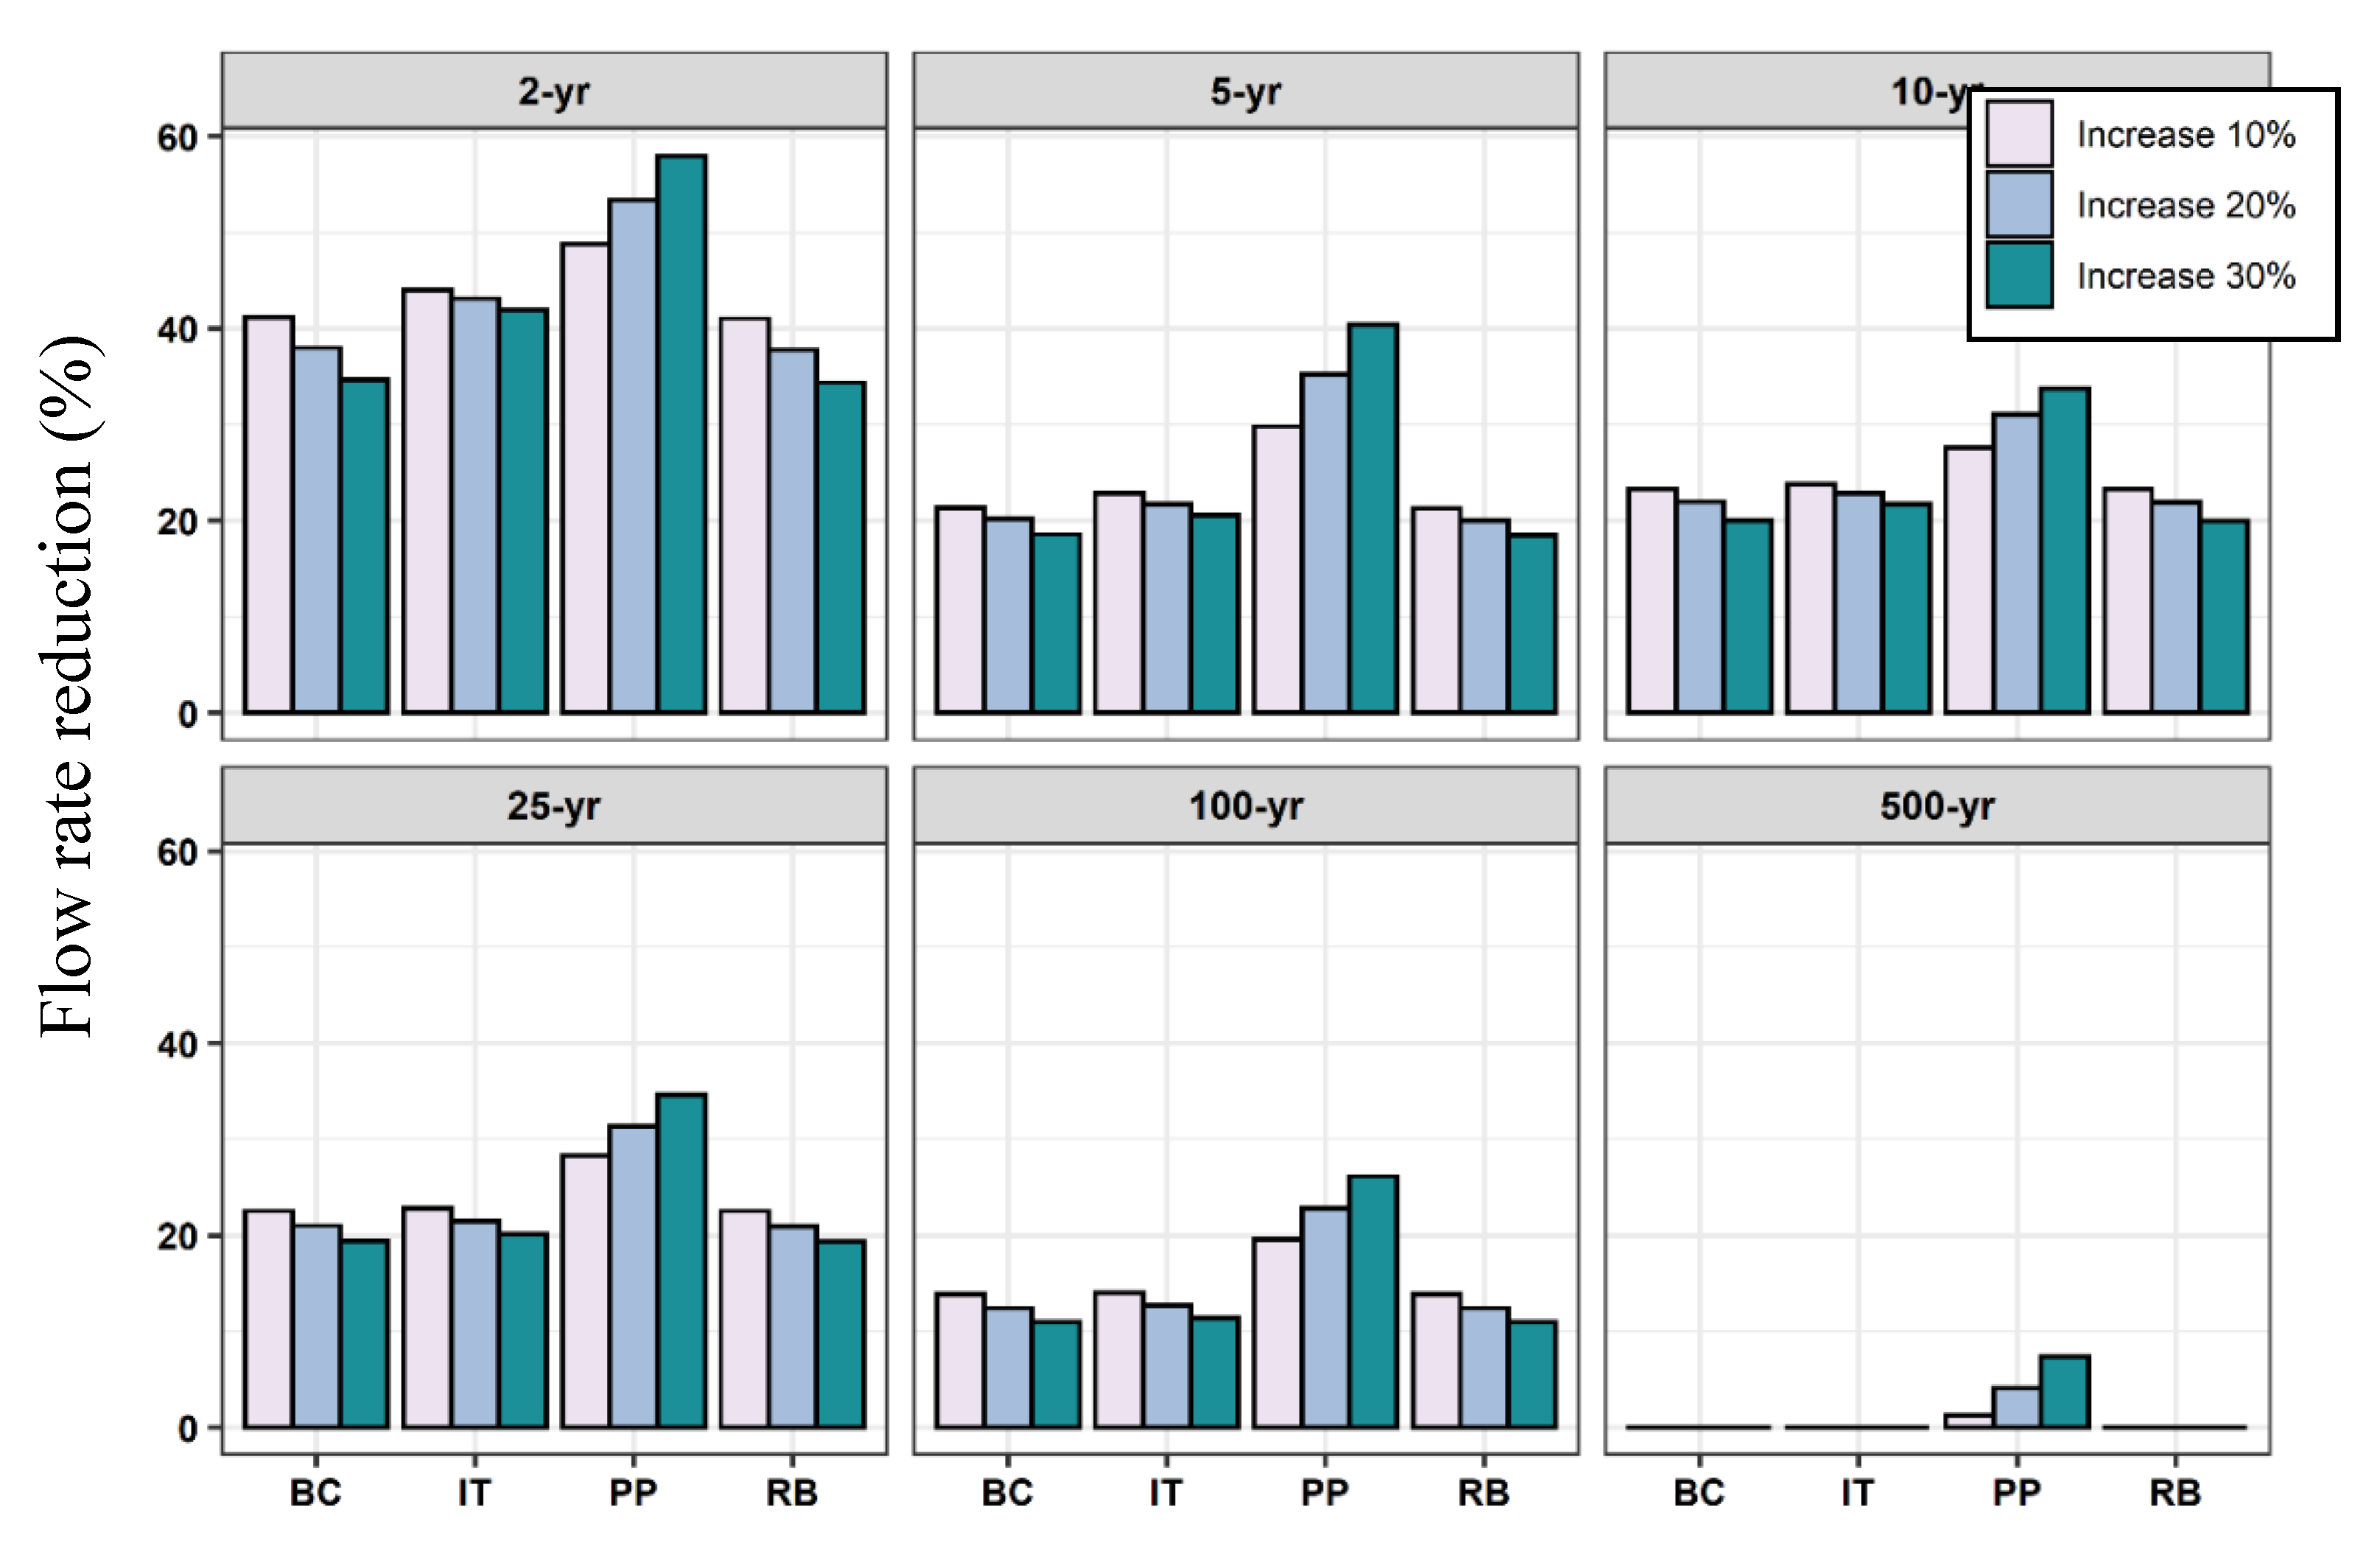
Figure 7.
A snapshot of flood inundation for different return periods for the current state (the scenario without LID) and the total inundation extent (in km2).
Figure 7.
A snapshot of flood inundation for different return periods for the current state (the scenario without LID) and the total inundation extent (in km2).
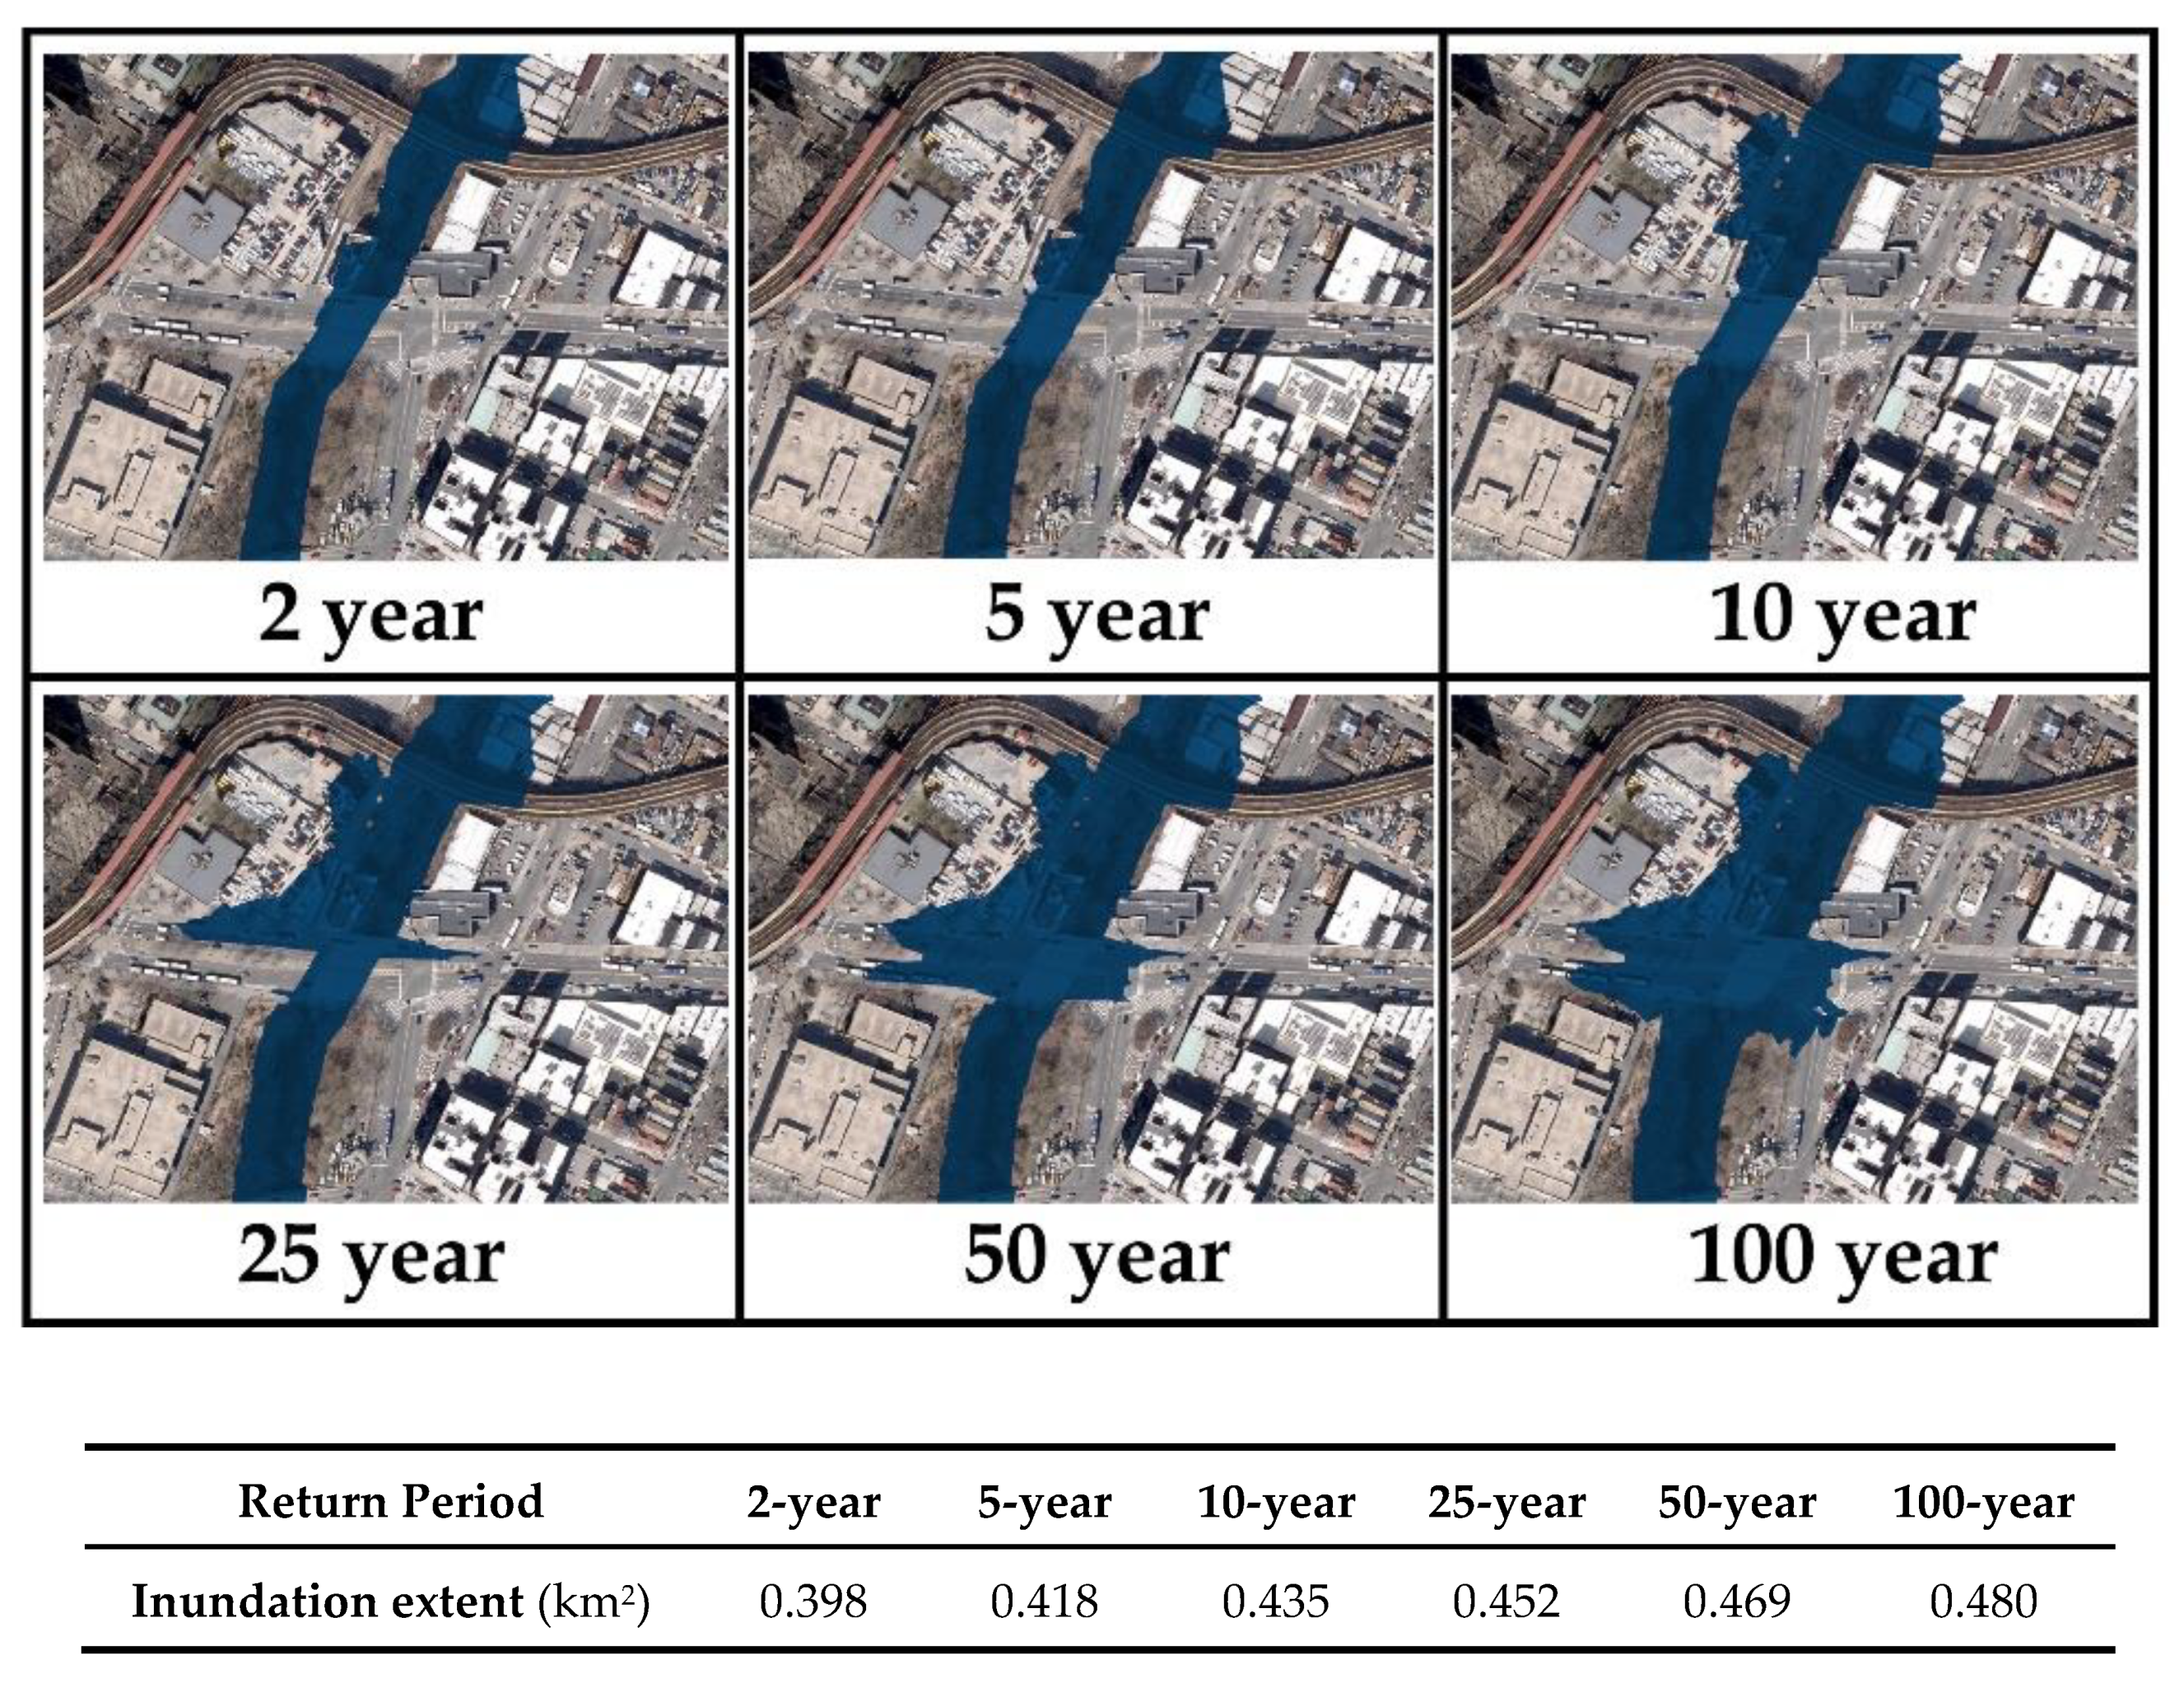
Figure 8.
Reduction in the damage (%) due to LID scenarios.
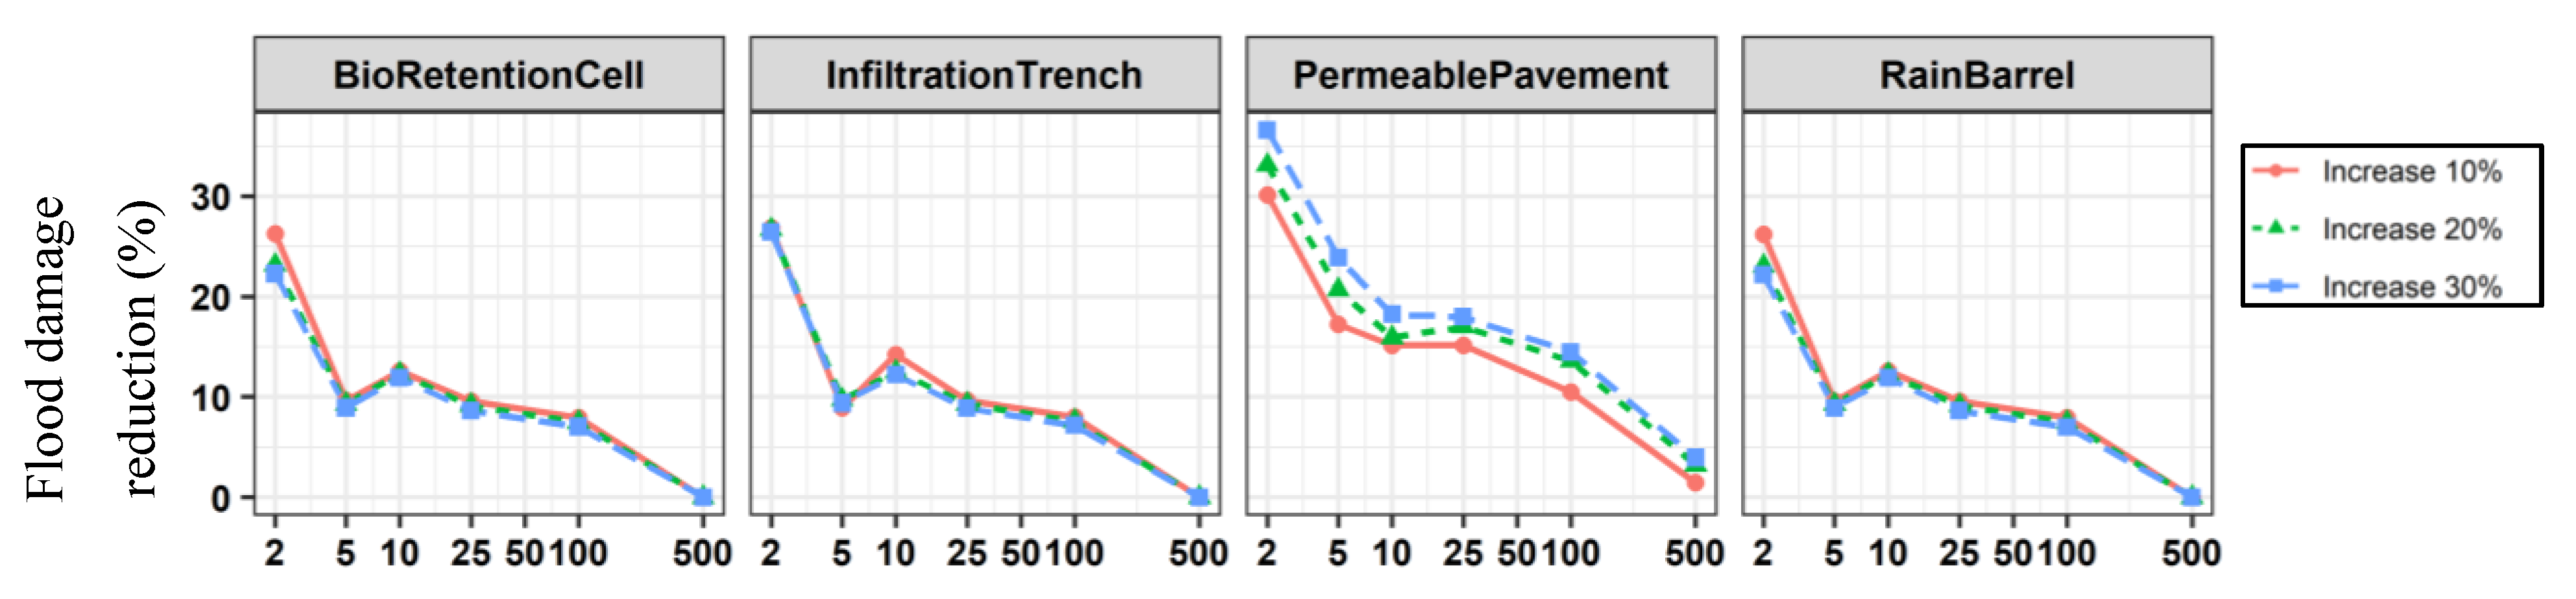
Figure 9.
Benefit-to-cost ratios in the low impact scenarios.
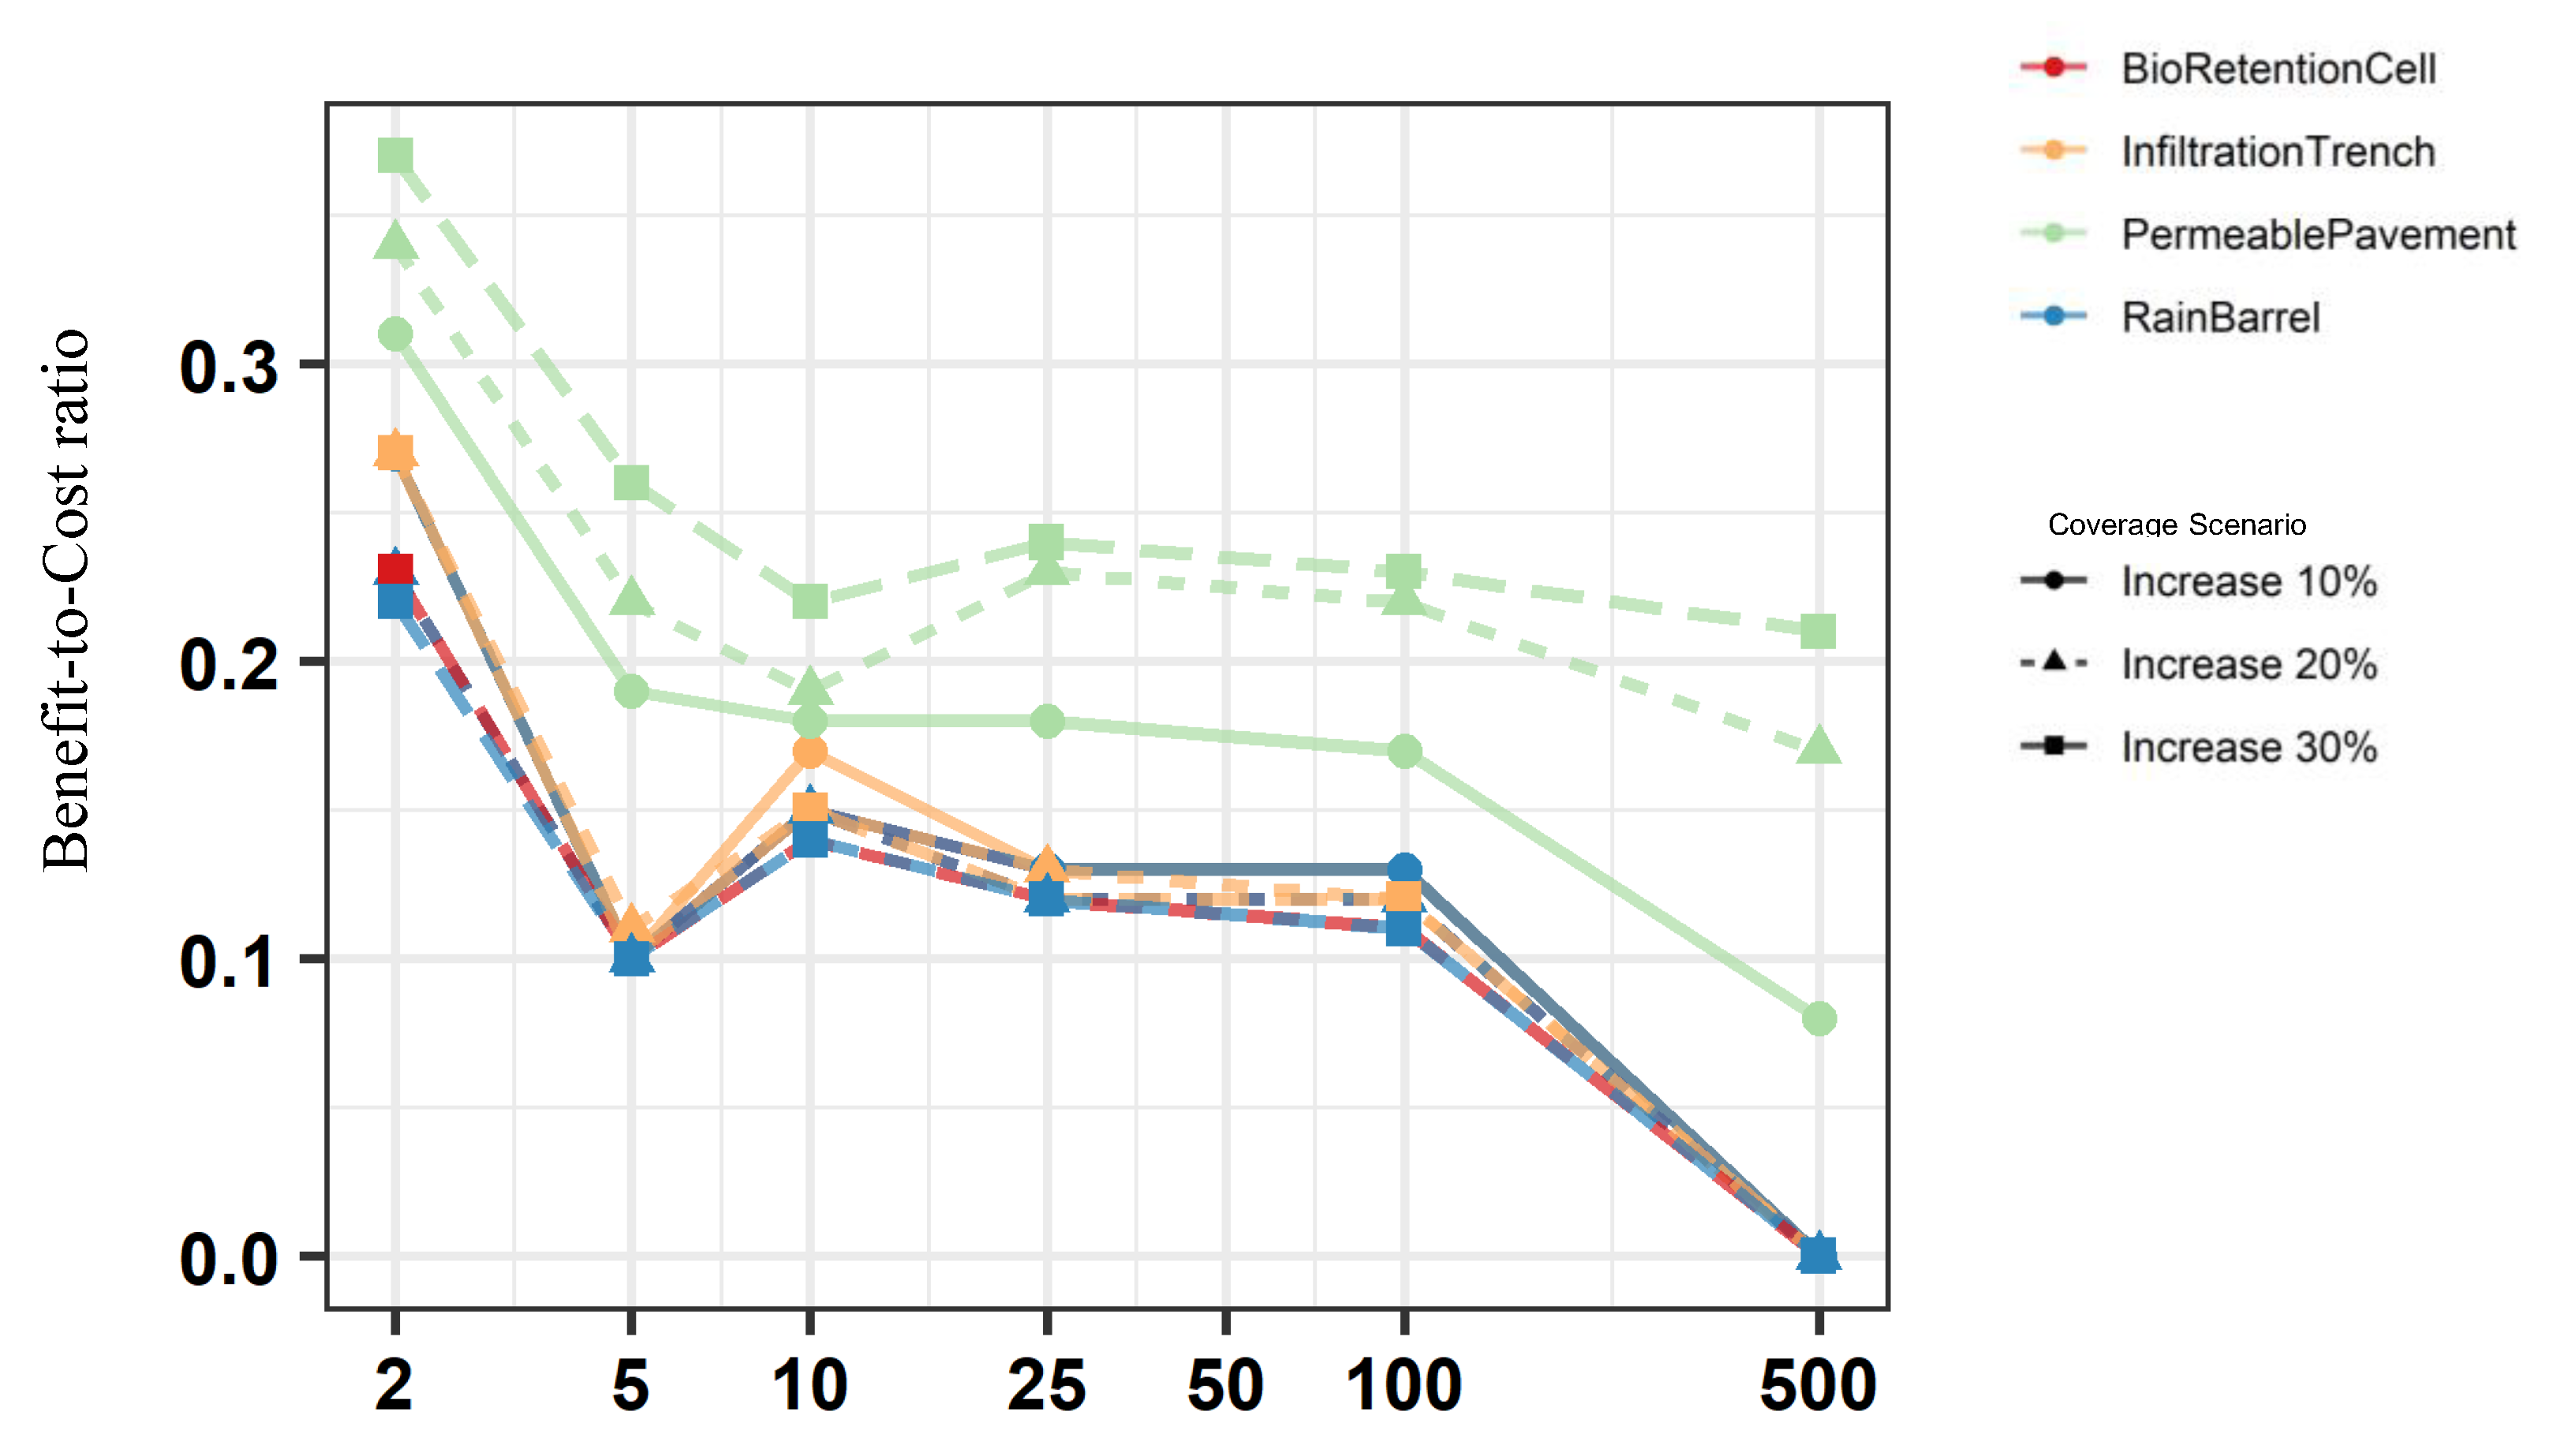

Table 1.
A summary of the recent studies on the application of LIDs for flood risk management.
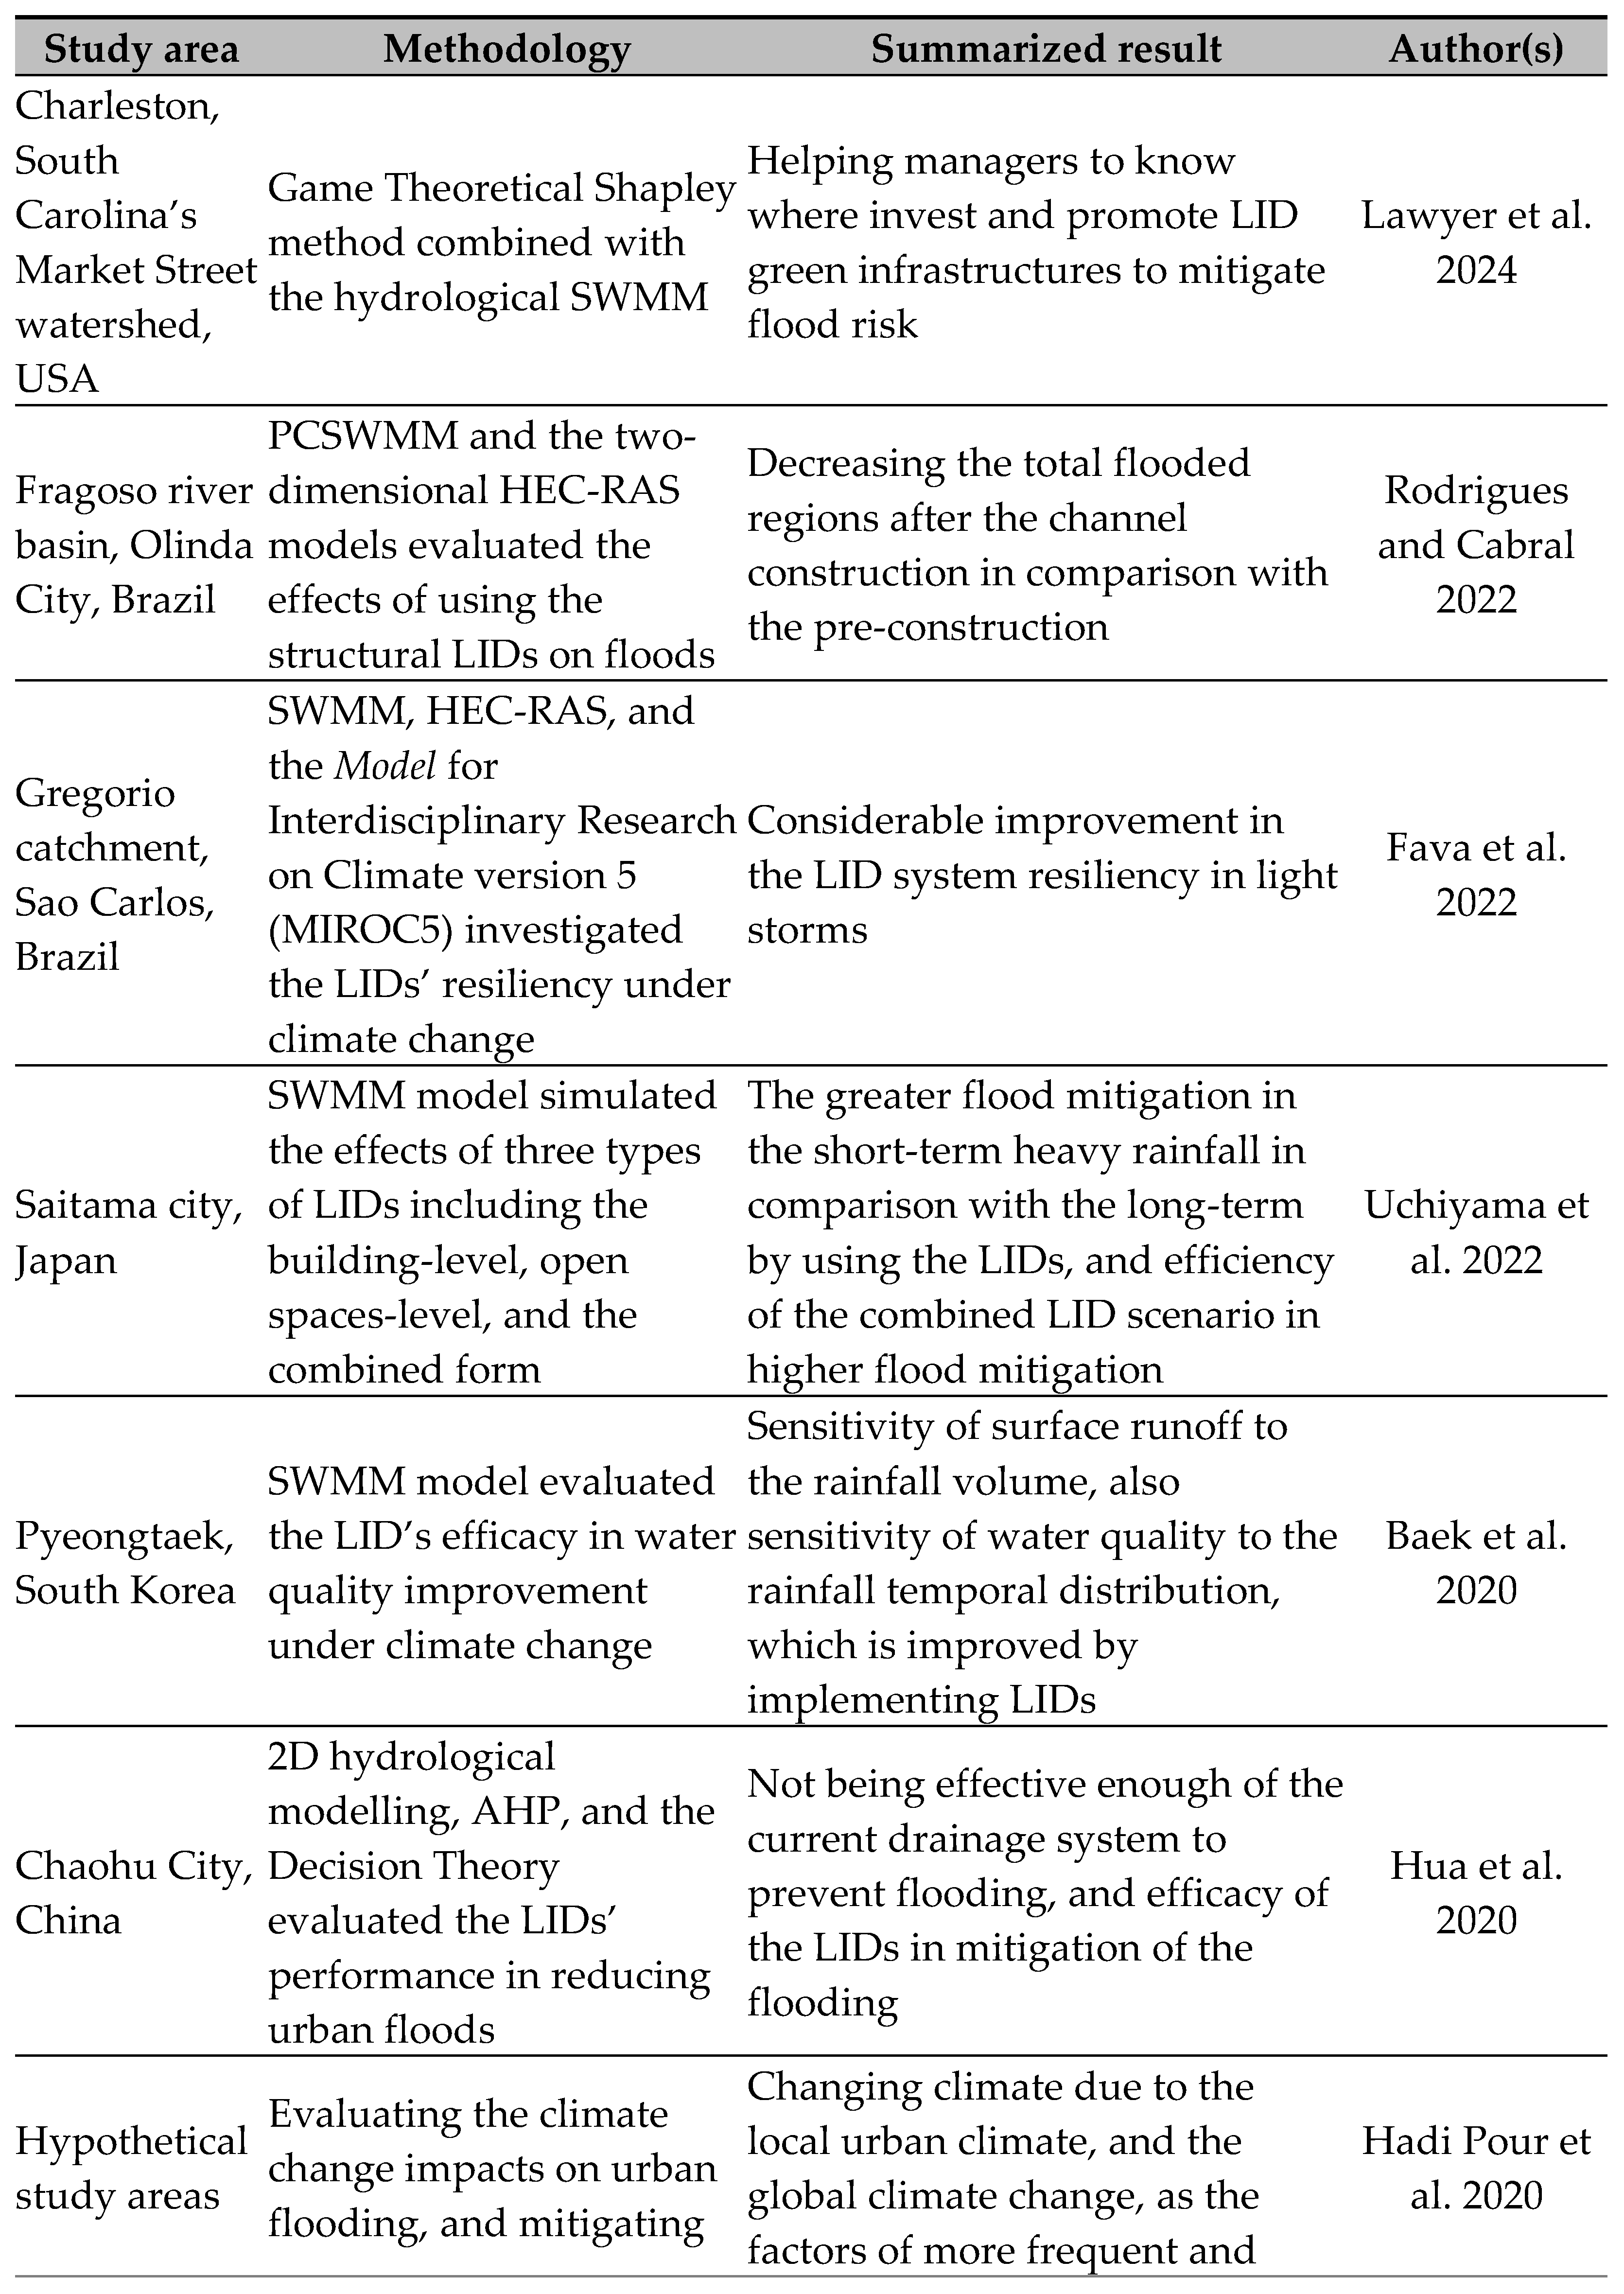
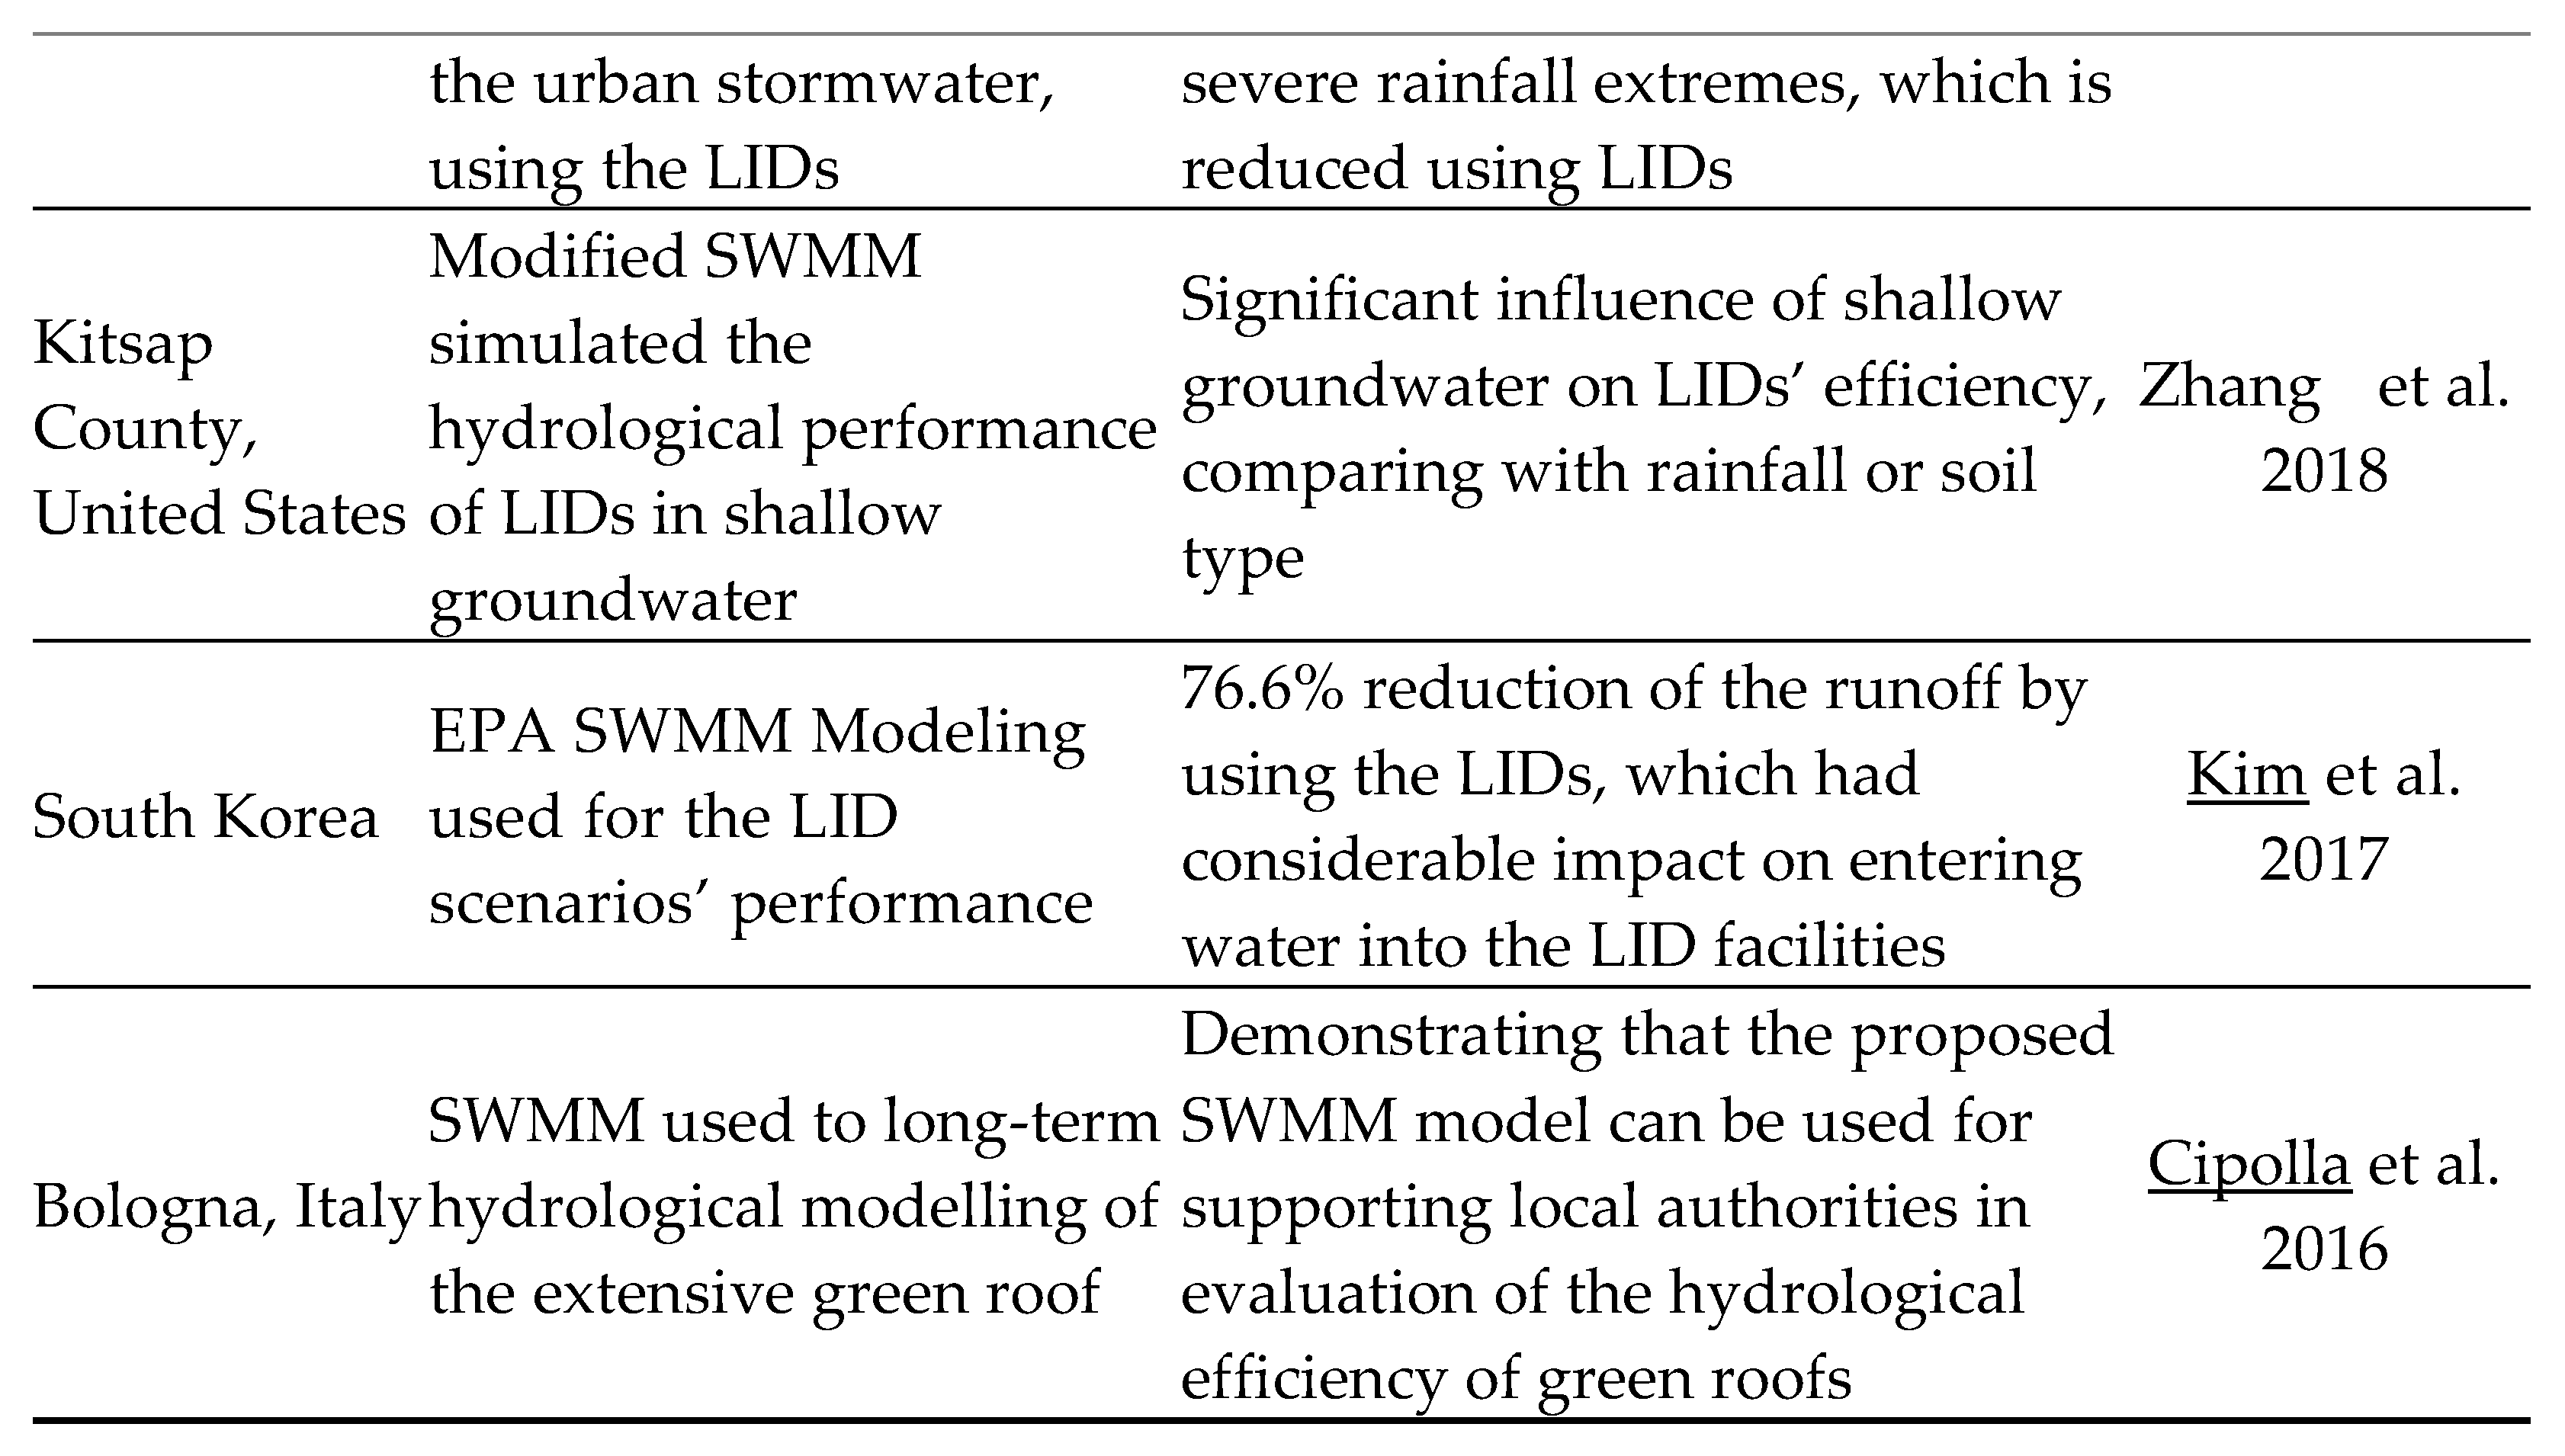
Table 2.
The selected most severe recent events in the Bronx River catchment and the related properties.
Table 2.
The selected most severe recent events in the Bronx River catchment and the related properties.
Table 3.
The most important calibration parameters of the SWMM simulation model and the related ranges (Tsihrintzis and Hamid, 1998; Zakizadeh et al., 2022; Gao et al., 2023; Ayda et al., 2024).
Table 3.
The most important calibration parameters of the SWMM simulation model and the related ranges (Tsihrintzis and Hamid, 1998; Zakizadeh et al., 2022; Gao et al., 2023; Ayda et al., 2024).
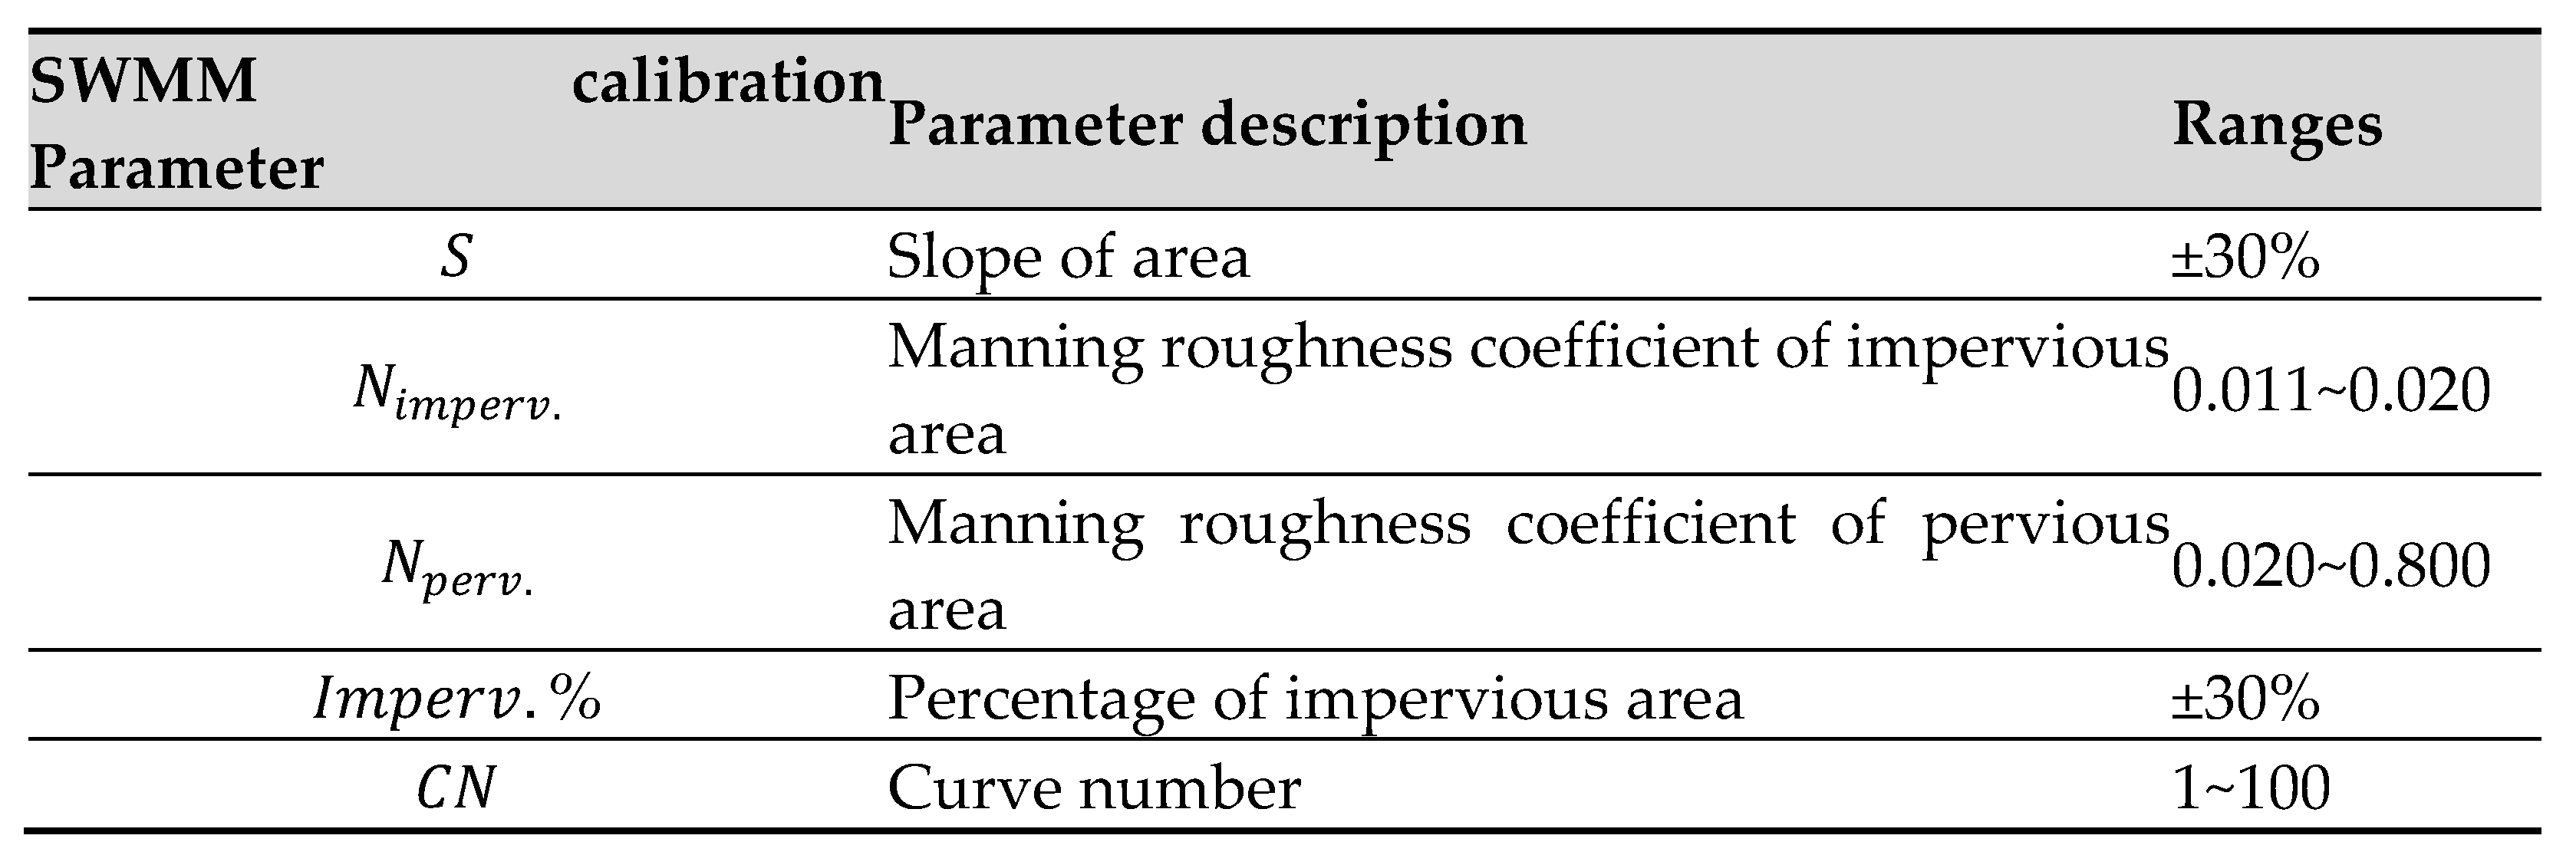
Table 4.
The most important performance criteria of the calibrated model for the three historical events.
Table 4.
The most important performance criteria of the calibrated model for the three historical events.
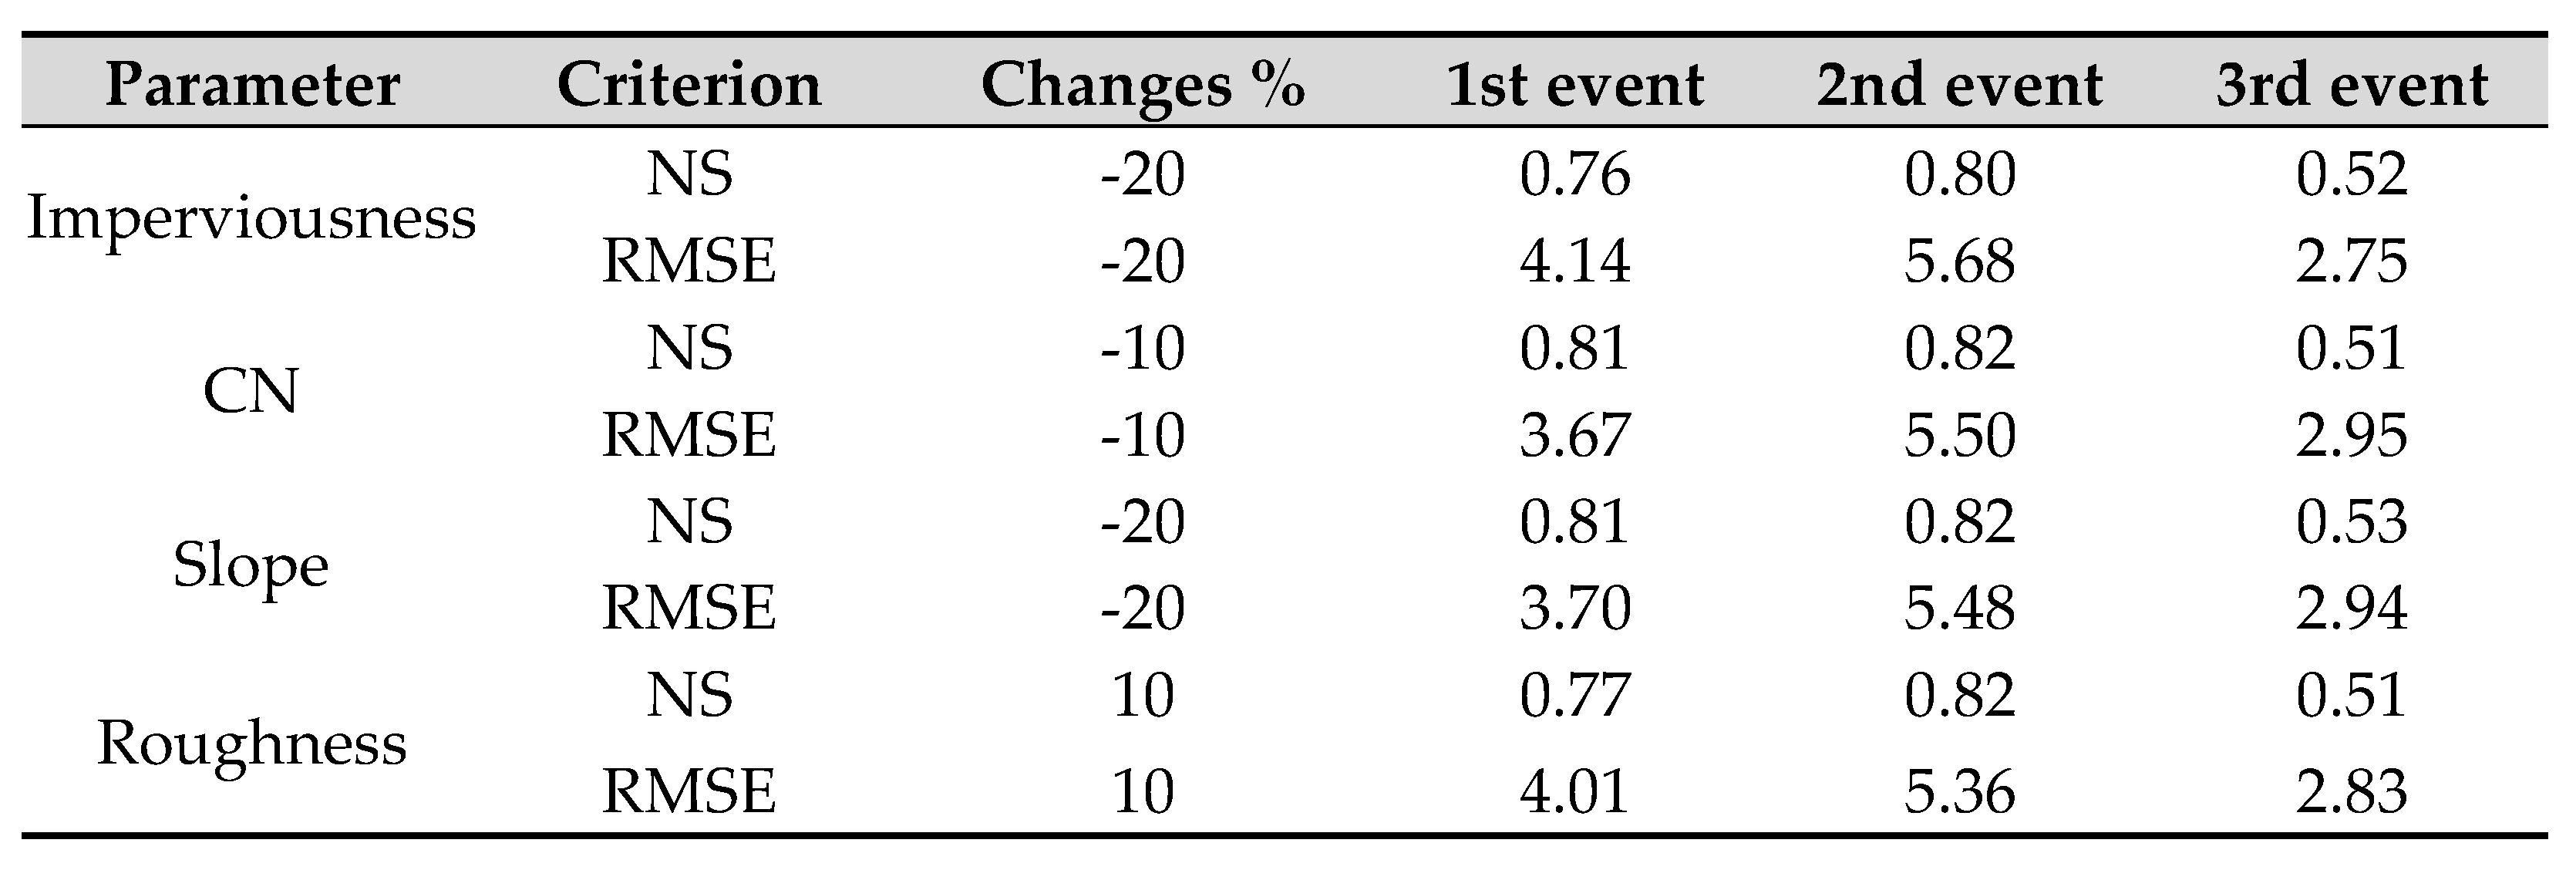
Table 5.
Flood inundation area (in km2) for a 100-year rainfall event resulting from the combined LIDs with 10, 20, and 30% increase scenario for each LID.
Table 5.
Flood inundation area (in km2) for a 100-year rainfall event resulting from the combined LIDs with 10, 20, and 30% increase scenario for each LID.
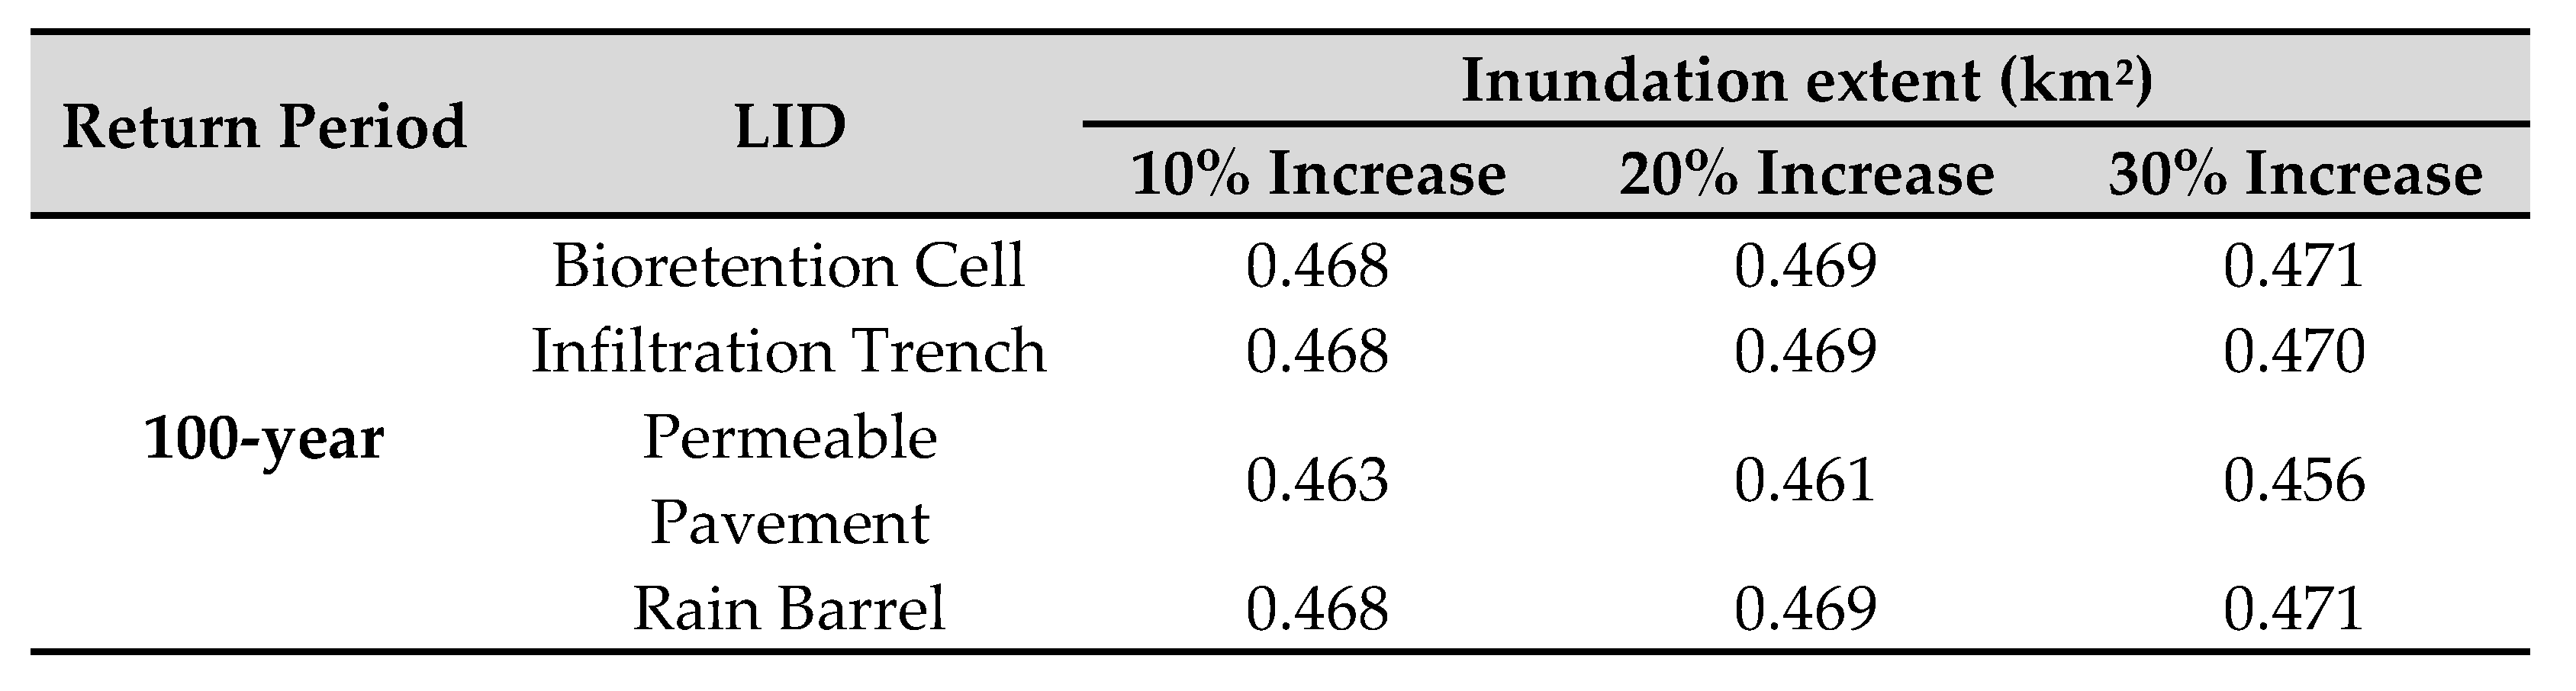
Table 6.
Flood damage ($Million) for a 100-year rainfall event resulting from the combined LIDs with 10, 20, and 30% increase scenario for each LID.
Table 6.
Flood damage ($Million) for a 100-year rainfall event resulting from the combined LIDs with 10, 20, and 30% increase scenario for each LID.
Disclaimer/Publisher’s Note: The statements, opinions and data contained in all publications are solely those of the individual author(s) and contributor(s) and not of MDPI and/or the editor(s). MDPI and/or the editor(s) disclaim responsibility for any injury to people or property resulting from any ideas, methods, instructions or products referred to in the content. |
© 2024 by the authors. Licensee MDPI, Basel, Switzerland. This article is an open access article distributed under the terms and conditions of the Creative Commons Attribution (CC BY) license (http://creativecommons.org/licenses/by/4.0/).
Copyright: This open access article is published under a Creative Commons CC BY 4.0 license, which permit the free download, distribution, and reuse, provided that the author and preprint are cited in any reuse.


