
Submitted:
09 May 2024
Posted:
10 May 2024
You are already at the latest version
Abstract
A beverage made from a combination of Agave sap (AS) and prickly pear juice (PPJ) was ana-lyzed for its nutrients, bioactive and potentially health-promoting compounds. The beverage was evaluated for its ability to act as an antioxidant, regulate glycemic properties, and undergo gut bacterial fermentation in vitro. The major mono- and oligosaccharides present in the beverage were galacturonic acid (217.74±13.46 mg/100 mL), rhamnose (227.00±1.58 mg/100 mL), and fructose (158.16±8.86 mg/mL). The main phenolic compounds identified were protocatechuic acid (440.31±3.06 mg/100 mL) and catechin (359.72±7.56 mg/100 mL). It was observed that the beverage had a low glycemic index (
Keywords:
Agave atrovirens
; Opuntia spp.
; cactus pear
; agave sap
; colonic fermentation
; carbohydrates
; phenolic compounds
; short-chain fatty acids
1. Introduction
The functional food and beverage market has grown due to increased consumer awareness of health and wellness. Beverages made from combinations of fruit juices and other foods are considered reliable sources of many biologically active compounds that can help maintain an active and healthy lifestyle, with ingredients focused on immunity such as prebiotics, antioxidants, and “superfruits” (Nazir et al., 2019). An important aspect of functional food development is the use of regional underutilized or neglected food resources to support food chain systems, promote sustainable development, conserve natural resources, and protect biodiversity (Li & Siddique, 2020). Agave and Opuntia are unique resources found in xeric regions of Mexico and around the world.
One of the most rapidly evolving areas of functional food production is that which focuses on modulating the gut fermentation microbiota and promoting colonic health. The gut fermentation microbiota refers to the millions of microorganisms that symbiotically inhabit the human body and play a critical role in human health and disease (Ursell et al., 2014). A considerable proportion of bacterial metabolic processes that are beneficial to the host are involved in the extraction of energy through the fermentation of food waste (dietary fiber), particularly carbohydrates that are not digested in the upper gastrointestinal tract (Van Loo et al., 1999). Bacterial gut fermentation of dietary fiber induces several changes in the metabolic environment of the intestinal lumen that may be beneficial to health; these changes include a decrease in pH, softening of feces, and defense against pathogens (Tungland, 2018; B. Wang et al., 2017).
The fermentation of dietary fiber produces short-chain fatty acids (SCFA), including acetic, propionic, and butyric acids (Baxter et al., 2019). These SCFA have several beneficial effects on the body and are responsible for most of the health benefits associated with fiber intake. They are rapidly absorbed in the colon and play a critical role in regulating gut motility, inflammation, and glucose levels (Cani et al., 2013). Diverse types of dietary fiber have varying effects on various parts of the intestine, and it is important for prebiotics to stimulate bacterial activity consistently throughout the colon. Rapid fermentation is necessary because most absorption occurs in the proximal colon, but sustained fermentation is also beneficial in the distal region (Wang et al., 2019). To achieve this, prebiotic blends, or products with multiple sources of prebiotics can be used to modulate the microbiota and address the limitations of a single type of prebiotic (Alvarado-Jasso et al., 2020).
Two traditional Mexican products that have potential in functional foods due to their prebiotic properties are Agave sap (AS) and prickly pear juice (PPJ). AS is a thick, sweet, and whitish liquid extracted from plants of the genus Agave (Asparagaceae), specifically species such as A. americana, A. atrovirens, A. hookerii, A. inaequidens, A. mapisaga, A. marmorata, and A. salmiana (Ortiz-Basurto et al., 2008). AS is traditionally consumed either fresh or fermented to produce a mildly alcoholic beverage called “pulque”. This beverage is composed of sugars, including fructooligosaccharides, which are considered bioactive compounds. These compounds are known for their proven activity as soluble and prebiotic fibers, as well as immunomodulators (Moreno-Vilet et al., 2016).
Prickly pears are the fruits of plants belonging to the genus Opuntia (Cactaceae) The most commonly cultivated species in Mexico for fruit production include O. albicarpa, O. amyclaea, O. cochenillifera, O. ficus-indica, O. hyptiacantha, O. megacantha, O. robusta and O. streptacantha (Márquez-Berber et al., 2012). Opuntia is a genus that is known for its diverse profile of bioactive compounds, with kaempferol, isorhamnetin, and quercetin being the main flavonoids found across its species (Daniloski et al., 2022). In addition, it has a high content of pectins and pectic polymers that are rich in galacturonic acid, as well as residues of rhamnose, xylose, galactose, and arabinose. These compounds have prebiotic properties and are associated with different linkages between the residues (Ondarza, 2016).
The combination of AS and PPJ, each with its own bioactive compounds, can improve their functional properties compared to their separate use. The aim of this research was to evaluate the effect of composition of a beverage made from AS and PPJ, it’s in vitro antioxidant capacity, the in vitro gut fermentation of the indigestible fraction of the beverage (dietary fiber) and consequently the production of short-chain fatty acids.
2. Results
2.1. Composition of AS, PPJ, and the Beverage
Table 1 shows the proximal composition of AS, PPJ, and the beverage. AS had a higher moisture content than the other samples, and PPJ had a slightly higher ash content, but the difference was not statistically significant (p>0.05). Protein content was not significantly different among the three products.
2.1.1. HPLC Quantification of Monomers and Oligomers of the Carbohydrates of AS, PPJ and the Beverage
Table 2 shows the results of HPLC quantification of different monomers and oligomers of carbohydrates. The main carbohydrates found in AS were mannose, rhamnose, fructose and galacturonic acid, with no detection of galactose. PPJ had higher amounts of galacturonic acid, rhamnose, glucose and galactose, with no detection of mannose. AS contained statistically (p<0.05) higher amounts of nystose and fructose than PPJ. In PPJ, nystose, glucose, galacturonic acid and rhamnose were significantly higher (p<0.05). The combined beverage showed significant differences in all the disaccharides and monosaccharides quantified compared to its individual ingredients.
2.1.2. Content of Total Bioactive Compounds in AS, PPJ and Beverage
Table 3 shows the data on the bioactive compounds in the beverage, assessed as total phenolic content (TPC) and flavonoids. It is worth noting that the TPC content in the beverage increased significantly due to the contribution of PPJ. The same trend was observed in the flavonoid content of the beverage. PPJ had significantly higher levels of catechin (flavonoid) and protocatechuic acid (phenolic acid), except for gallic acid (phenolic acid), which did not differ significantly among samples, and myricetin (flavonoid), which was not detectable in PPJ. Furthermore, the beverage composed of AS and PPJ showed statistically significant differences (p<0.05) compared to PPJ in terms of catechin, protocatechuic acid and myricetin. Finally, the content of ascorbic acid (vitamin C) was similar in all three products.
2.2. Potential Health-Promoting Compounds of AS, PPJ, and the Combined Beverage
2.2.1. Antioxidant Capacity
An antioxidant is a molecule that is stable enough to donate an electron or proton to a free radical and neutralize it (Gupta, 2015). Table 4 presents the results of determining the iron chelation capacity (PFRAP) and antioxidant capacity measured by superoxide anion scavenging activity (SASA) and 2,2-azinobis (3-ethylbenzothiazoline-6-sulfonic acid) (ABTS) methods. All the determinations showed statistically significant differences among the samples. AS showed the lowest antioxidant capacity, while PPJ presented the highest value.
2.2.2. Glycemic Regulatory Properties
Table 5 presents the functional properties of the glycemic index, as well as the in vitro inhibition of α-amylase and α-glucosidase. The glycemic index values of the samples in this study were below 40%, which classifies them as low glycemic index foods (Atkinson et al., 2008), with statistically significant differences among samples (p>0.05). The AS and the beverage demonstrated an inhibitory effect on α-glucosidase activity, but none of the samples showed an inhibitory effect on the amylase activity.
2.3. In Vitro Gut Fermentation
The fermentation was conducted successfully, with all vials staying in anaerobic conditions and metabolically active as determined by the resazurin dye.
2.3.1. Gas Production
Figure 1 depicts the volume of gas produced by the microbiota during in vitro fermentation. The maximum gas production for PPJ occurred at 8 h, followed by a decrease associated with the complete fermentation of the substrate. The volume of gas in the fermentation of PPJ was similar to the negative control (Supplementary Figure SF1). The beverage also had the maximum volume of gas produced at 8 h with values similar to PPJ. During the first 4 h of fermentation of all substrates, gas production was low and increased at similar levels after this period, with no significant differences between substrates (p<0.05). However, after 8 h, the gas production of AS increased significantly up to 24 h. In comparison, the gas production in PPJ and the beverage decreased at 12 h. The gas volumes kept lower values until the end of fermentation with no significant differences between PPJ and the beverage. This trend of a maximum value and a later decrease concerns the positive and negative controls (Supplementary Figure SF1). The positive control reached a maximum point at 12 h with a later decrease. On the other hand, the negative control maintained low gas volumes similar to those of PPJ.
2.3.2. Variation of pH
Figure 2 shows the changes in pH that occur during the fermentation of AS, PPJ, and the beverage. Because of the production of SCFA, the pH of the colon increased from 6.0 in the cecum to 6.7 in the distal colon. A further reduction in gut pH may be linked to inflammatory bowel diseases (Qelliny et al., 2019).
The pH levels in the samples remained stable at the beginning of the fermentation process, with no significant differences between them (p<0.05). However, after two hours, there was a slight increase. At 4 h, the pH decreased to values below 7, and there were no significant differences between the substrates. The lowest pH values were recorded at 8 h, with a significant difference between the AS substrate and the PPJ and beverage substrates. At 12 h, the pH stabilized, with a significant difference between the AS substrate and the other substrates. At the end of the fermentation process, all substrates had similar pH values, with minimal changes between 12 and 24 h. Although the PPJ substrate had a higher pH tendency than the AS substrate, it was still lower than the pH of the harmful control fermentation (Supplementary Figure SF2). The minimum pH at 8 h, followed by stabilization, was consistent with the positive control pH.
In order to have a trend in the behavior of the AS, PPJ samples and the beverage during fermentation, Figure 3 shows this trend after linearizing the data. The results showed that the pH of the medium decreased for all substrates, which was confirmed by the negative slope obtained for each. The substrate AS had the most significant pH decrease in the shortest time, indicating that it was easily fermentable. However, the combination of AS and PPJ in the beverage did not alter the fermentation characteristics of either one independently. It is expected that r2 will not be very high, since neither bacterial growth nor the accumulation of its metabolites follows linear growth.
2.3.3. Short-Chain Fatty Acid Production
The changes in SCFA (acetate, propionate, butyrate, and valerate), during in vitro gut fermentation process are shown in Figure 4, while Supplementary Table ST2 shows the total amount of SCFA produced and the molar ratios after 24 h of in vitro gut fermentation for AS, PPJ, and the beverage. The initial concentration of SCFA is related to the other fermentation by-products present in the donors’ feces. The production of SCFA increased over time during the in vitro fermentation. The variation in SCFA production is due to the unique chemical properties of each compound and its compatibility with the bacteria present in the gut microbiota (Chen et al., 2016), excessive gas production during the fermentation of prebiotics is considered undesirable. Regarding the fermentation process, the continuous increase in gas production during the fermentation of AS shown in the analysis can be attributed to the fermentation of carbohydrates (Macfarlane & McBain, 1999).
The concentration of acetate increased steadily from the start of fermentation up to 4 h without any differences between the substrates. At 8 h, the fermentation reached maximum concentration with significant differences observed in PPJ and the beverage. The production of acetate peaked at 12 h in both PPJ and the beverage, and there were no significant differences between the substrates. However, between 12 and 24 h, the acetate concentration decreased across all substrates. Notably fermentation in the beverage significantly differed from AS and PPJ during this time.
The concentration of propionate steadily increased from the start of fermentation up to 24 h in all substrates. Between 4 and 12 h, the AS fermentation produced more propionate than PPJ and the beverage, and there were significant differences. By the 24 h mark, the propionate concentration in the beverage surpassed that of AS and PPJ, demonstrating a significant difference. This highlights an interaction in the combination of AS and PPJ. Notably, propionate was the third SCFA produced in all substrates.
Butyrate was not initially present, but its production began 4 h after fermentation of the substrates. It continued up to 8 h in AS, PPJ, and the beverage, with no significant differences in concentration. At 12 h, the production increased, with AS showing the highest accumulation values of butyrate, significantly different from the other substrates. The production continued for up to 24 h, with significant differences between all the substrates. AS had the highest production, followed by the beverage and PPJ.
Isobutyrate and isovalerate were not quantifiable at any fermentation time. The molar ratios of all SCFA produced in the in vitro gut fermentation of AS, PPJ, and the beverage after 24 h were shown in Supplementary Table ST2. AS fermentation produced the highest propionate and significantly higher amounts of acetate and butyrate. On the other hand, the fermentation of PPJ presented the highest propionate ratio of all substrates but with no significant differences. The fermentation process of the beverage showed butyrate and propionate increases like those of AS. Still, the acetate molar ratio was similar to PPJ and significantly different from AS.
3. Discussion
3.1. Composition of AS, PPJ, and the Beverage
Table 1 shows that ash content was the highest in PPJ. According to Díaz-Medina et al. (2007), prickly pears are rich in essential elements such as potassium, calcium and magnesium, and contain trace minerals such as manganese and copper. These minerals are essential for various cellular processes that are critical for overall health, cardiovascular and metabolic well-being, and endogenous antioxidant mechanisms (Dubey et al., 2020; Mohammadifard et al., 2019).
3.1.2. HPLC Quantification of Monomers and Oligomers of the Carbohydrates of AS, PPJ and the Beverage
The concentration for monosaccharides, such as glucose, fructose, galactose, rhamnose, arabinose and galacturonic acid found in this study are consistent with those reported by El Kossori et al. (1998) and Habibi et al. (2004). These compounds are responsible for the sweet taste of AS, PPJ, and the beverage derived from them. Besides these, other carbohydrate monomers are found in AS, such as nystose (Santos-Zea et al., 2016). In PPJ, galacturonic acid, mannose, and galactose are present. Notably, the combined beverage has less galacturonic acid than PPJ.
AS and PPJ are known for their unique properties. AS contains fructooligosaccharides, which are derived from the crassulacean acid metabolism. These fructooligosaccharides accumulate highly branched fructans called agavins, which serve as reserve carbohydrates (Moreno-Vilet et al., 2016). Prickly pears and the cladodes of Opuntia are also compelling due to their accumulation of pectic substances and mucilage (Ondarza, 2016). Both AS and PPJ are rich in carbohydrates, making them a good source of soluble fiber. This fiber classifies them as prebiotics, which are non-digestible food ingredients that have a beneficial effect on the host by selectively stimulating the growth or activity of specific bacteria in the colon. Thus, dietary fiber interventions may provide a solution in reducing the societal burden of gut diseases, such as obesity, metabolic syndrome, enhances the host’s health and well-being (Gibson et al., 2017). This is due to the microbiota that is favored by the consumption of dietary fiber. Cronin and Joyce, (2021) reported that insulin consumption causes an increase the abundance of Bifidobacterium bifidum and Faecalibacterium prausnitzii.
3.1.3. Content of Total Bioactive Compounds in AS, PPJ and Beverage
Phenolic compounds are of great scientific interest due to their diverse biological activities and potential functional properties. They are widely available and present in our diet. The most well-known and widely distributed phenolic compounds include anthocyanins, coumarins, flavonoids, and phenolic acids (Das et al., 2019). Phenolic compounds play a critical role in mitigating oxidative stress, reducing cellular damage caused by free radicals, enhancing the body’s redox defense mechanisms, and reducing the risk of developing diseases associated with free radical damage. Such diseases include inflammation, cancer, cardiovascular disease, and neurodegenerative disorders. The presence of phenolic compounds is also a significant factor in the growing demand for these substances (Shahidi et al., 2018).
As shown in Table 2, AS, PPJ, and the beverage all contain significant amounts of total phenols (TPC) and flavonoids, with PPJ having higher levels. Several specific compounds were identified in the experimental AS samples, such as ascorbic acid, catechin, protocatechuic acid, and myricetin, which together contribute to a total quantified content (79.97±6.79 mg gallic acid equivalents per 100 mL). These results indicate the presence of significant antioxidant and bioactive compounds in AS, highlighting their potential for various health-related applications, as phenolic compounds have been reported to have diverse anti-inflammatory and protective effects (Kashyap et al., 2022; Song et al., 2020).
The analysis of PPJ has revealed a rich variety and concentration of phenolic compounds (62.415±0.24 mg GAE per 100 mL). The flavonoid content, which is measured at 15.92±1.85 mg CE per 100 ml, supports the presence of flavonoids such as quercetin and kaempferol. The presence of significant amounts of catechin (63.53±3.20 mg CE per 100 mL), protocatechuic acid (84.43±0.75 mg per 100 mL) and gallic acid (1.23±0.02 mg per 100 mL) confirms the diversity of phenolic compounds. Although myricetin was not detected, the total quantified phenolic and antioxidant compounds of 153.78±4.1 mg per 100 mL highlight the potential health benefits of PPJ. These findings underscore its role as a valuable natural product with antioxidant and health-promoting properties. El-Haway et al., (2020) reported that the prickly pear exhibited a rich array of chemical constituents, including steroidal saponins, flavonoids, homo-isoflavones, cinnamic acid derivatives, and fatty acids, providing valuable insights into their metabolic composition. They found all tested extracts exhibited substantial antioxidant activities in vitro and neuroprotective potential in AlCl3 induced Alzheimer’s condition.
Marquez-Lemus et al., 2022 have shown that red and purple varieties of prickly pear have significantly higher total phenolic content (TPC) than lighter colored varieties such as white and yellow, and mention that the flavonoid content in PPJ is similar to that found in certain Mexican prickly pear varieties (Chavez-Santoscoy et al., 2009). However, the composition and relative proportions of different flavonoids can vary significantly depending on the specific variety being studied. In this work, the analysis revealed the presence of primary flavonoids such as quercetin, iso-rhamnetin, kaempferol, myricetin and luteolin.
Phenolic compounds are of particular interest as possible functional ingredients due to their ubiquitous availability, abundant resources in our diet, and diverse biological activities (Das et al., 2019). Protocatechuic acid and catechin were the major phenolic compounds in AS and PPJ. Protocatechuic acid is a primary metabolite in the configuration of complex polyphenols. Interestingly, the beverage presents a combination of the phenolic compounds found in AS and PPJ, making it possible to say that it can be offered as a functional drink, which will help to control diet-related diseases.
3.2. Potential Health-Promoting Compounds of AS, PPJ, and the Combined Beverage
3.2.1. Antioxidant Capacity
The evaluation of antioxidants often involves multiple assays using different methods. In this case, this included ABTS and PFRAP assays based on electron transfer, the SASA method based on hydrogen atom transfer, and PFRAP based on transition metal chelation (Gupta, 2015; Perron & Brumaghim, 2009). Significant differences in antioxidant and iron chelation capacities among the samples are shown in Table 4.
The variation in antioxidant capacity values observed in AS can be attributed to the inherent variability in sap samples influenced by climatic conditions, as AS is collected outdoors and environmental factors such as rain or drought can significantly affect the concentration of antioxidant compounds. For instance, Romero-López et al. (2015) reported an antioxidant capacity of 8.88 μmol TE in AS using the ABTS method, while other samples of AS yielded values ranging from 8.5 to 10.7 mg TE (Ramírez-Cuellar et al., 2018).
The incorporation foods rich in antioxidants, such as PPJ and beverage, offers numerous health benefits, including reduced risk of chronic diseases and improved well-being by neutralizing harmful free radicals, thereby reducing oxidative stress (Islam & Kabir, 2019; Khouloud et al., 2018; Lobo et al., 2010). Although human studies do not show a clear increase in serum antioxidant capacity, significant differences are found in parameters related to oxidative stress. Research consistently indicates that consuming vegetable and fruit juices is associated with a decreased incidence of chronic diseases due to the high bio-accessibility of bioactive compounds, particularly phenolic compounds (Islam & Kabir, 2019; Palafox-Carlos et al., 2011). The different measurements carried out in this research provide a broader picture of the antioxidant capacity of the combined beverage and its components to combat oxidative stress through different chemical mechanisms.
3.2.2. Glycemic Regulatory Properties
Inhibiting α-amylase, a key enzyme in starch and glycogen digestion, is increasingly acknowledged as a therapeutic approach for managing conditions associated with carbohydrate uptake dysfunction, such as diabetes, obesity, dental caries, and periodontal diseases (Aleixandre et al., 2022; Virgen-Carrillo et al., 2022). This strategy, when combined with a low glycemic index diet, can significantly aid in regulating blood glucose levels. Among the array of metabolites found in plant foods, dietary polyphenols stand out for their therapeutic potential in the prevention and management of diabetes. This recognition stems from their capacity to safeguard pancreatic cells against glucose toxicity, their anti-inflammatory and antioxidant attributes, and their ability to suppress digestive enzymes while inhibiting starch digestion (Liu et al., 2014; Tveter et al., 2020).
In this study, it was investigated the inhibitory potential of AS, PPJ, and beverage on α-amylase and α-glucosidase enzyme activity. No inhibitory effects were observed on α-amylase. However, in the α-glucosidase enzyme inhibition assay, AS and beverage demonstrated significant inhibition. Previous studies have reported inhibitory activity of different Agave syrups, with values of 21.19% and 24.8% for A. atrovirens var. pulquero (Cerda, 2011), as well as inhibition by prickly pear products (Gómez-Maqueo et al., 2019; Park et al., 2021). α-Glucosidase inhibitors play a key role in attenuating intestinal carbohydrate absorption and mitigating postprandial glucose spikes. Although they do not completely inhibit carbohydrate absorption, they significantly contribute to the reduction of postprandial insulin and glucose peaks (Adisakwattana et al., 2012; Alongi et al., 2021).
The identification of inhibitory activity in AS but not in PPJ suggests that metabolites differentially present in AS may generate this activity. Of all the metabolites screened, only myricetin was identified as differentially present in AS. Myricetin was reported to have significant inhibitory effects in a dose-dependent manner with an IC50 of 41.14 ± 2.52 against α-glucosidase (Mi et al., 2021). Molecular docking analyses showed that myricetin formed nine hydrogen bonds with α-glucosidase. In a study of α-glucosidase inhibition with various flavonoids, including myricetin, quercetin, and catechins, myricetin showed the highest inhibitory activity along with catechins. Both myricetin and catechin are reported to be competitive inhibitors that bind to the active site of the enzyme through hydrogen bonding (Fu et al., 2021).
Carbohydrase inhibition by plant foods has been attributed to various plant metabolites, including phenols, saponins, fatty acids, sterols, triterpenes, alkaloids, anthraquinones, and tannins, which may contribute to α-glucosidase inhibition (Meza & Valdés, 2015). The present study provides further evidence of the potential of plant metabolites to inhibit α-glucosidase activity, as evidenced by the significant inhibitory effects of AS and beverage. Interestingly, while no inhibitory effects on α-amylase were observed, the selective identification of myricetin in AS suggests its specific role in α-glucosidase inhibition. The inhibitory effects of myricetin, together with its ability to form hydrogen bonds with α-glucosidase, highlight its potential as a competitive inhibitor. These findings contribute to our understanding of the therapeutic potential of plant-derived compounds in the management of conditions associated with carbohydrate uptake dysfunction, such as diabetes and obesity.
The results of this work are important because patients with type 2 diabetes have an inadequate insulin response after a meal, leading to challenges in glucose regulation. Therefore, slowing glucose absorption is important to normalize the pancreatic insulin response and mitigate postprandial hyperglycemia, a condition strongly associated with cardiovascular mortality (Ross et al., 2004),
2.3.4. Bioactive Compounds Interaction
In the present study, several bioactive compounds were quantified, including ascorbic acid and protocatechuic acid, both of which contain two hydroxyl groups (-OH), and catechin, gallic acid, and myricetin, which contain three hydroxyl groups. Despite the expectation of a stronger correlation between gallic acid and myricetin due to their similar number of hydroxyl groups, no significant trends were observed. In addition to hydroxyl groups, it is important to consider the concentrations of each ingredient in the beverage. This comprehensive assessment suggests a potential synergistic effect between all antioxidant compounds present (Aleixandre et al., 2022).
Multivariate Pearson correlation analysis via HPLC (see Supplementary Table ST1) indicates significant positive correlations between total phenolic content (TPC) and flavonoid content, PFRAP, SASA, and ABTS. Flavonoid content also demonstrates positive correlations with PFRAP, SASA, and ABTS, with SASA exhibiting the highest linear correlation (R2 = 0.973) with flavonoids. Furthermore, PFRAP shows positive correlations with SASA and ABTS, while SASA exhibits a negative correlation with ABTS. The reducing power of extracts from prickly pear pulp is statistically linked to phenolic compound concentration. Conversely, AS displays comparatively lower antioxidant capacity, suggesting a potential need for additional dietary supplementation for enhanced antioxidant protection. However, combining PPJ and AS offers an alternative to mitigate AS’s low antioxidant capacity. This effect could be mediated by modulation of antioxidant enzyme activities and high total phenolic content. The beverage with AS and PPJ could then be used as a dietary supplement to improve oxidative status.
3.3. In Vitro Gut Fermentation
3.3.1. Gas Production
The microbiota, including saccharolytic species, produce gases such as carbon dioxide, methane, and hydrogen as by-products of their metabolic activities (Deehan et al., 2017). This gas production is particularly high when rapidly fermentable dietary fibers are consumed, leading to gastrointestinal symptoms such as increased flatulence and bloating (Chen et al., 2016). Therefore, excessive gas production during prebiotic fermentation is considered undesirable. The continuous increase in gas production during the fermentation of AS up to 24 h (Figure 1) can be attributed to the fermentation of small intestinal undigested carbohydrates such as oligosaccharides, sugars, and galacturonic acid as reported by Macfarlane & McBain, (1999). The continuous and steady gas production during fermentation of AS for 24 h is more advantageous than other fructose polymers which show exaggerated gas production in the first few hours of fermentation. The amount and structure of oligosaccharides in agave could be induced to increase gas production compared to other fructose polymers.
Meanwhile, the fermentation of PPJ and the resulting beverage showed a pattern of gas production with maximum output occurring around 8 h, followed by a decline as the substrates fully ferment. This could be due to the trapping of molecules in the food matrix, which affects the digestibility and fermentability of PPJ and beverage. This occurs due to the physical obstruction of molecules, preventing them from reaching the active site of enzymes (Magallanes-Cruz et al., 2017). The pectic substances and mucilage characteristics unique to the genus Opuntia may contribute to gas production patterns. For beverage fermentation, a reduction in gas production is usually desirable if it does not interfere with the production of other important by-products such as SCFA.
3.3.2. Variation of pH
The changes that occurred during fermentation of AS, PPJ and beverage it can see in Figure 2. The inicial pH was similar for the three samples with a slight increase at 2 h, followed by a drop at 4 h of fermentation. Within the first 4 hours of gut fermentation of pectic polysaccharides, a rapid change in pH occurs, as reported by Cantu-Jungles et al. (2019) and Gulfi et al. (2005, 2006). The maximum drop was at 8h with statistical differences between AS, PPJ and beverage (p< 0.05), at 12 h, the pH had stabilized across all substrates. This pH pattern was similar to the positive control (Supplementary Figure SF2).
AS contains carbohydrates with low DP, typically consisting of 2 to 9 monomers (Peralta-García et al., 2020), the short size of these molecules is expected to facilitate fermentation. During the fermentation process of AS, the pH levels were observed to be the lowest at the 8 h mark, suggesting a continuous fermentation process lasting more than 12 hours. This sustained fermentation can be beneficial for the distal colon. The fermentation of substrate in the gut result in a reduction of pH, which has a positive impact on gut health. Lower pH levels in the colon have been shown to reduce the formation of secondary bile acids, while also increasing the availability of calcium (Wong et al., 2006) and providing other beneficial physiological effects as reduction of inflammation, especially when combined with probiotics (Astó et al., 2019). The fructan fractions possess prebiotic activities and have beneficial effects via inhibition of intestinal pathogen growth. García-Gamboa et al., (2020) reported that fructans with low moleular weight significant increases in Lactobacillus spp., Clostridium spp., and Salmonella spp. (p < 0.05) were observed on day 4 of administration in the transverse colon section whereas by day 9 of administration, Lactobacillus spp. had increased in the ascending colon, Bifidobacterium spp. had increased in the descending colon, and Salmonella spp. had decreased in the transverse.
The pH changes observed are linked to the specific SCFA produced during gut fermentation, with each SCFA having a distinct and variable impact on pH values. For example, the SCFA acetate has the lowest pKa value of 4.75, followed by valerate (4.80), butyrate (4.81), and propionate (4.88) (Schönfeld & Wojtczak, 2016).
3.3.3. Short-chain fatty acid production
In relation to the production of SCFA during the fermentation of AS, PPJ and the combined beverage it is important to note that acetate was consistently generated across all the substrates examined. This observation is supported by the well-known link between acetate production and the fermentation of sugars such as glucose, galactose, mannose, and xylose (Wang et al., 2019). The samples analyzed were expected to exhibit acetate production derived from the bacterial fermentation of the glucose, galactose, and xylose monomers identified and quantified in the samples (Table 6). Acetate is a primary fermentation product for many anaerobic bacteria in the intestine, and thus, various dietary factors can influence acetate production by the gut microbiota (Louis & Flint, 2017). Acetate can enter the portal circulation and seems to play a role in lipid and cholesterol synthesis in the liver, as well as providing energy through the oxidation of residual acetate in muscle cells, which can improve overall gut health (Wong et al., 2006).
Propionate production is primarily linked to the fermentation of fructose, arabinose, and other ketoses (Wang et al., 2019). As shown in Figure 4, the total production of propionate in the fermentation of AS and the beverage is higher as compared to the fermentation of PPJ. Regarding the total output, the propionate was expected to be higher, as the FOS fermentation allows its depolymerization to increase the content of fructose monomers present in nystose, ketose, and sucrose. Louis & Flint, (2017) provided an overview of the metabolic pathways utilized by gut microbes to produce propionate from dietary carbohydrates. The dominant bacterial species detected in fecal samples of human subjects were the phylum of Firmicutes, families Lachnospiraceae, Ruminococcaceae and Erysipelotrichaceae.
The liver plays a crucial role in the metabolism of propionate, which is associated with numerous health benefits, including immune system support, cholesterol metabolism, satiety regulation, and gut function (Macfarlane & Macfarlane, 2012). Previous studies have found that inulin and FOS fermentation produce higher amounts of propionate with higher polymerization (Hernot et al., 2009; Van De Wiele et al., 2007). Agave fructans with higher DP have been shown to produce lower amounts of propionate than FOS (Hernot et al., 2009). Propionate concentration in fructans fermentation is lower than acetate and butyrate, with comparable results for Agave fructans.
The most important SCFA produced in AS, PPJ and beverage was butyrate. This strongly suggests that butyrate production is mainly determined by the supply of non-digestible carbohydrates, as reported by Louis & Flint (2017). The production of SCFA can be used to predict the fermentation profile of different fermentable products or ingredients. Hernot et al. (2009) found a higher proportion of butyrate for medium-chain FOS with molar ratios of 55:15:30 and inulin with 45:13:42 at 12 h. Stewart et al. (2008) reported even higher proportions of butyrate for different FOS and inulin substrates with molar ratios ranging from 58-63:7–8:29-35 for FOS and 58-67:7–10:24-35 for inulin substrates. These ratios indicate that all substrates favored butyrate production over propionate, like the molar ratios found in the fermentation of AS, PPJ, and the beverage (Supplementary Table ST2). The production of SCFA can be used to predict the fermentation profile of different fermentable products or ingredients.
Gut bacteria that degrade dietary fiber target specific bonds in certain types of polymers, but these primary degraders are not themselves butyrate producers (Cockburn & Koropatkin, 2016). The activities of secondary bacterial fermenters become essential to stimulate butyrate production. Louis & Flint, (2017) reported that butyrate production used succinate pathway, with dominant bacterial species as Bacteroides uniformis, Bacteroides vulgatus, Prevotela copri, Alistipis putredunis. Butyrate is an essential energy source for the gut mucosa that helps protect against colorectal cancer and has several physiological effects related to inflammation, the immune system, oxidative stress, gut barrier function, satiety, and insulin sensitivity (Macfarlane & Macfarlane, 2012; Wong et al., 2006).
During the fermentation of branched chain amino acids by certain genera such as Bac-teroides and Clostridium, valeric acid, isovaleric acid, and isobutyrate, collectively referred to as branched chain SCFA (BSCFA), are synthesized (Aguirre et al., 2016; Smith & Macfarlane, 1998). However, the concentrations of isobutyrate and isovalerate remained undetectable throughout the duration of the fermentation process in AS, PPJ and beverage. Finally, it is important remark that carbohydrate fermentation could be a beneficial process in the large gut, because the growth of saccharolytic bacteria stimulates their requirements for toxic products associated with putrefaction, for incorporation into cellular proteins, thereby protecting the host
4. Materials and Methods
4.1. Collection
The sap of Agave atrovirens was collected in a town of Michoacán, Mexico. It was then filtered and packaged in 250 mL sterilized glass-topped metal bottles. The sap was pasteurized at 121°C and 15 psi for 10 min to prevent its characteristic spontaneous fermentation.
The juice was made using Opuntia sp. fruits, commonly known as “red cactus pear,” purchased from local market in Mexico City. The fruits were washed and peeled, and the juice was obtained by putting the pulp in an industrial fruit pulper (Bertuzzi, Milan, Italy). The beverage, which was a combination of pasteurized AS and PPJ, was formulated using an optimized recipe of 60% pasteurized AS and 40% PPJ. The AS, PPJ, and the combined beverage were pasteurized at 91°C for 7 min. All the tests were carried out on the pasteurized AS, PPJ, and the formulated beverage.
4.2. Composition
The proximal composition of AS, PPJ and the beverage was determined using the AACC (2000) methods for moisture content (44 - 15), protein content (46 - 13), and ashes (08 - 01).
4.3. Free Carbohydrate Quantification
The samples underwent centrifugation (using Velocity14 centrifuge, Metrix, México) at 4025 ×g for 5 min. The resulting supernatant was collected and filtered (Millex® 0.2 μm nylon filters, Millipore Corporation, USA). High-resolution liquid chromatography (HPLC) was used to quantify free carbohydrates according to the manufacturer’s application notes (Ball et al., 2011). The chromatographic equipment consisted of a quaternary pump 1200 Infinity System (Agilent, USA) and a refractive index detector (RID, 1260, Agilent, USA). For the detection of nystose, ketose, saccharose, glucose, and fructose, a Hamilton Ca column (7.8 x 305 mm, 8 79436, USA) was used. The mobile phase was water at a flow rate of 0.4 mL/min, with an injection volume of 10 μL, column temperature of 85 °C, and detector temperature of 55 °C. To detect glucuronic acid, galacturonic acid, mannose, galactose, xylose, and rhamnose, an Agilent Hi-Plex column H (7.7x300 mm, 8 μm, PL1170 - 6830, US) was used. The mobile phase was H2SO4 (0.01 M) at a flow rate of 0.4 mL/min, an injection volume of 10 μL, and the column and detector temperature were 55 °C. Carbohydrates were identified and quantified using a standard curve prepared in advance with each of the selected carbohydrates (Supplementary Material 1) (Ball et al., 2011).
4.4. Bioactive Compounds Analysis of AS, PPJ and the Beverage
For determination of bioactive compounds, of AS, PPJ and the beverage the samples were centrifuged at 4025 ×g (centrifuge Velocity14, Metrix, México) for 5 min, and the supernatant was collected and filtered (Millex®, 0.2 μm nylon filters, Millipore Corporation, USA).
4.4.1. Total Phenolic Compounds and Flavonoids
The total phenolic compounds (TPC) were measured using the Folin–Ciocalteau method, while the flavonoid content was assessed using the aluminum chloride colorimetric assay (Kurdyukov et al., 2021). All spectrophotometric analyses were carried out using a microplate reader Multiskan Go (Thermo, USA). To quantify TPC, a standard curve was created with gallic acid, with five calibration points ranging from 0.02 to 0.14 mg gallic acid/mL. The formula used for the curve was y = 11.824x – 0.0296, with an R² value of 0.99. The results were reported as mg gallic acid equivalents/mL (AGE/mL) (Ruiz Canizales et al., 2019). The flavonoids quantification was made using a standard curve prepared with quercetin with five calibration points of 0, 50, 100, 150, 200, 250, and 300 µg of quercetin/mL (y = 0.0045x + 00.085; R² = 0.99). The results were reported as µg of quercetin equivalents/mL (QE/mL) (Villamarín-Gallegos et al., 2020).
4.4.2. Individual Bioactive Compounds Identification and Quantification
Bioactive compounds were identified and quantified by high-performance liquid chromatography (HPLC). The chromatographic system utilized a quaternary pump (1200 Infinity System, Agilent, USA) along with a diode-array detector (DAD, 1260, Agilent, USA) and a ZORBAX Eclipse Plus C18 column (4.6x250 mm, 5 μm, 959990 - 902, US). The column and detector were both set to a working temperature of 35°C. The mobile phase consisted of phosphoric acid 0.5% (A) and methanol (B) in a 40:60 ratio, with an isocratic flow rate of 1 mL/min (Mothibedi, 2013). Quantification of the bioactive compounds (rutin, gallic acid, catechin, caffeic acid, quercetin, p-coumaric acid, pelargonidin, ferulic acid, protocatechuic acid, ascorbic acid, myricetin, and chlorogenic acid) was accomplished using standard curves that had been previously prepared with each of the selected analytical standards (Supplementary Material 1).
4.5. Health-Related Biofunctionality
4.5.1. Antioxidant Capacity
The AS, PPJ, and beverage samples were pasteurized and then centrifuged at 4025 ×g (centrifuge Velocity14, Metrix, México). The liquid portion (supernatant) was collected and tested for ABTS radical scavenging activity using the method described by Leite et al. (2011). The results were expressed in mM Trolox equivalents (TE)/mL based on a Trolox calibration curve with six points ranging from 0 to 250 mM Trolox. The calibration curve equation was y = - 0.0025x + 0.703, with an R² value of 0.99. Additionally, the samples were tested for Superoxide Anion Scavenging Activity (SASA) using the method by Udenigwe et al. (2009) and for the iron chelation capacity with the Potassium Ferricyanide Reducing Power Assay (PFRAP) using the method by Oyaizu (1986). The results of these tests were presented as a percentage of change in absorbance compared to a solution of gallic acid (0.05 M).
4.5.2. Glycemic Index
The glycemic index was determined by the method of Goñi et al. (1997) with some modifications. 10 mg of lyophilized sample was mixed with 2 mL HCl-KCl buffer (pH 1.5) and 0.04 mL pepsin solution. The mixture was then incubated in a shaking water bath (Dual Action Shaker and Water bath, PolyScience, USA) at 40°C for 1 h. After a period of incubation, a mixture of 5 mL Tris-maleate buffer (pH 6.9) and 1 mL α-amylase solution was added to the sample. The resulting solution was then incubated at 37°C for 180 minutes. At 30-minute intervals, 0.5 mL aliquots were taken from the mixture, and the reaction was stopped by subjecting the samples to a thermal shock at 100 °C. The concentration of released glucose was measured using a glucose oxidase-peroxidase kit (GAGO20, Sigma-Aldrich Inc.). The in vitro digestion kinetics were determined according to the method of González-Vázquez et al. (2022).
4.5.3. Enzymatic Inhibition of Carbohydrases
The enzymatic inhibition of two carbohydrases by the AS, PPJ, and the beverage was performed with the original samples and with aqueous and ethereal extracts of the samples. To obtain the extracts of the samples, a volume of 50 mL was measured and deposited in an amber container with an equal volume of ether. It was left for 20 hours in agitation, then it was placed in a separation funnel obtaining the aqueous phase. The ethereal phase was deposited in an amber container and a volume of 50 mL of distilled water was added to the ethereal extracts and placed in an extraction hood until the ether evaporated. Finally, the extracts (ethereal, aqueous) and original samples were subjected to centrifugation at 1792 ×g (centrifuge Velocity14, rotor 13, 10 cm radius, Metrix, México) for 10 minutes and recovering the supernatant for use in enzyme inhibition tests.
To determine the enzymatic inhibition of α-amylase 250 µL of the filtered samples and 250 µL of a solution of α-amylase (0.5 mg/mL) in sodium phosphate buffer (0.02 M, pH 6.9) were added and incubated at 25 °C for 10 min. Subsequently, 250 µL of 1% of starch solution in sodium phosphate buffer (0.02 M, pH 6.9) was added and subsequently incubated at 25 °C for 10 min, and finally, 500 µL of dinitro salicylic acid reagent was added. The reaction mixture was diluted with 5 mL of distilled water, and the absorbance was read at 540 nm in a microplate reader (Multiskan Go, Thermo Fisher Scientific, USA) (Adisakwattana et al., 2012). To determine the enzymatic inhibition of α-glucosidase directly in a 96-well microplate, 50 µL of sample and 100 µL of α-glucosidase solution (67 U) prepared in phosphate buffer (0.1 M pH 6.9) were incubated at 25 °C for 10 min. Subsequently, 100 µL of a 0.1 M solution of 4-Nitrophenyl-β-D- glucopyranoside diluted in phosphate buffer (0.1 M pH 6.9) was added and incubated at 25 °C for 30 min. The absorbance was read at 405 nm at the beginning and at the end of the 30 min incubation (Multiskan Go, Thermo Fisher Scientific, USA) (Yuan et al., 2012).
4.6. In Vitro Gut Fermentation
Undigestible residue obtention: In the simulation of intestinal fermentation, foods must be digested to ensure that the microbiota use the materials that would reach the colon, rather than the free carbohydrates in the raw material. The AS, PPJ, and the combined beverage were obtained according to the standardized protocol developed by the INFOGEST research network (Brodkorb et al., 2019). The protocol consists of simulating the digestive process by adding salts and enzymes characteristic of oral, gastrointestinal, and duodenal digestion. In the simulation of gut fermentation, foods must undergo digestion to ensure that the microbiota is using the materials that would reach the colon and not the free carbohydrates in the raw material. The AS, PPJ, and the combined beverage was obtained following the standardized protocol developed by the INFOGEST research network (Brodkorb et al., 2019). The protocol consists of simulating the digestive process through the addition of salts and enzymes characteristic of the oral, gastric, and duodenal digestion (KCl, NaHCO3, MgCl2 (H20)6, CaCl2 2(H2O), NaCl, NaOH [Merck, Darmstadt, He, Germany]; KH2PO4, HCl [J.T.Baker, Radnor, PA, USA]; human salivary α-amylase, porcine pepsin, and porcine pancreatin [Sigma-Aldrich, St. Louis, MO, USA]; bovine bile [BioBasic, Markham, ON, Canada]), at 37°C during orbital agitation at 100 rpm in an incubator shaker (Barnstead Lab-line, Model SHKA4000, Dubuque, IA, USA).
The chyle obtained from all simulated digestions was placed in a beaker with dialysis tubes with a nominal pore size cutoff of 12,000 Da (Sigma-Aldrich) filled with 1M NaHCO3 to filter out the low molecular weight molecules that could be absorbed during the digestion process. The lyophilized residue on the beakers after dialysis is considered the non-digestible residue. The in vitro gut fermentation set-up, preparation of the medium, inoculum, and sample, treatment followed the method of Goñi & Martín-Carrón (1998).
Fermentation medium: 2.5 g/L tryptone, 125 µl/L micro-mineral solution, 250 mL/ macro-mineral solution, 250 mL/L reducing solution, and 1.25 mL/L of a 1 g/L resazurin solution prepared in distilled water were added in strict order. The micromineral solution contained 132 g/L CaCl2 2(H2O), 100 g/L MnCl2 4(H2O), 10 g/L CoCl2 6(H2O), and 80 g/L FeCl3 6(H2O) (Sigma-Aldrich). The micro-mineral solution was prepared in a 4 g/L (NH4)HCO3 buffer solution and 35 g/L NaHCO3 (Sigma-Aldrich). The macro-mineral solution contained 5.7 g/L Na2HPO4, 6.2 g/L KH2PO4, and 0.6 g/L MgSO4 7(H2O) in distilled water. The reducing solution was prepared immediately before use and consisted of 6.25 g/L anhydrous L-cysteine, 6.25 g/L Na2S 9(H2O), and 40 mL/L of 1M NaOH (Sigma-Aldrich). The resazurin solution is a pH indicator, so the final fermentation medium is blue.
The fermentation medium was placed in serum-type reaction vials (Supleco, Bellefonte, PA, USA) with a rubber septum. Each vial had two outlets to which three-way valves were attached to bubble CO2 through one and add the fermentation medium through the other. First, 8.33 mL of reducing solution was added to each se-rum vial and placed in a water bath at 100°C for 15 minutes with the valves open. CO2 was then bubbled into the fermentation medium through one of the valves until the medium turned pink (reduced).
Bacterial inoculum: The human gut bacteria were obtained from the feces of six adult volunteers (25-30 years old). The volunteers were well defined as “apparently healthy” by a physician and a nutritionist. The volunteers were of average weight (Body Mass Index between 18.5-22.9), were not currently receiving any pharmacological or nutritional treatment, had not changed bowel habits, and had not taken any antibiotics in the month preceding the fecal donation.
Donors collected their feces and transferred it to CO2-filled bags to avoid contamination with another type of body fluid (blood or urine). The feces were exposed to CO2 immediately upon arrival at the laboratory, and equal proportions of feces from each donor were mixed and homogenized according to the recommendation for pooled feces (Aguirre et al., 2014). The pooled feces were homogenized with the sterilized fermentation medium at a ratio of 10% (fw/v) for 3 min. The mixture was then filtered (1 mm mesh) before immediate use. The filtrate was considered as bacterial inoculum.
Fermentation: 100 mg (dw) of AS, PPJ, and the beverage (substrates) were placed in serum vials (50 mL capacity, Supleco) with 8 mL of fermentation medium and 2 mL of inoculum. Vials were sealed, CO2 was bubbled, and the valves were closed and placed in a 37°C shaking bath at 100 rpm (Dual Action Shaker and Water bath, PolyScience, Niles, IL, USA).
4.6.1. Quantification of Fermentation by-Products
AS, PPJ, and beverage fermentation kinetics were monitored at 0, 2, 4, 8, 12, and 24 h. Lactulose was used as a positive control and vials of fermentation medium and inoculum without substrate were used as negative controls.
Gas production: Syringes of different volumes (1, 3, and 10 mL) were fitted to the three-way valve; the valve was opened slowly, and the displacement of the plunger was recorded.
pH variations: The rubber septum was removed, the fermented contents were transferred to centrifuge tubes, and the pH of the fermentation medium was measured (HI 2210 pH Meter, Hanna Instruments, Carrollton, TX, USA). To determine the rate of fermentation according to the decrease in pH, the pH values at different fermentation times were fitted to a linear regression model (pH/time) with the data of the first 8 hours.
Sample preparation: After measuring pH, the fermentation was stopped by adding 2.5 mL of 1M NaOH to the centrifuge tubes with the fermented substrates of AS, PPJ, and the beverage. Samples were centrifuged at 2500×g (Z 36 HK centrifuge, rotor 220.78 V21, Hermle Labortechnik, Wehingen, BW, Germany) for 10 min at 4°C and filtered through 0.45 μm cellulose filters (Thermo Fisher Scientific, Waltham, MA, USA) to obtain at least 3 mL of supernatant. In microcentrifuge tubes, 400 μL of filtered supernatant were mixed with 100 μL of internal standard (50 μmol/mL 2-methylvaleric acid solution [Sigma-Aldrich]), 10 μL of formic acid (Sigma-Aldrich), and 490 μL of Milli-Q water, and were centrifuged again at 12000×g for 15 min at 4°C (rotor 221.28 V21, Z 36 HK centrifuge). After the centrifugation, 700 μL of the supernatant was taken into chromatograph vials (Perkin-Elmer, Waltham, MA, USA).
SCFA quantification was performed following the methodology of Saura-Calixto et al. (2000 with a gas chromatograph Clarus 500/580 (Perkin-Elmer) equipped with a capillary column CARBOWAX (30 m, capillary 25.0 µm x 0.32 mm) and a flame ionization detector. The detector temperature started at 95°C and was maintained for 2 min, then increased to 180°C at a rate of 20°C/min. Helium was the mobile phase at a flow rate of 1 mL/min as the initial temperature of 95°C was maintained for 2 min, then raised at 10 °C/min up to 250 °C. The quantification was made by interpolating standard curves previously prepared with each of the selected standards with five calibration points of 1.00, 2.50, 5.00, 10.0, and 20.0 µmol/mL (Supplementary Material 1).
4.7. Statistical Analysis
Results are presented as mean±SD (standard deviation), n = 3. A one-way analysis of variance and Tukey’s multiple comparison tests was applied with a significance level of ≤0.05 when differences between groups were found. OpenLab software was used to extract the chromatograms and find the area values under each chromatogram’s curve. SIGMAPLOT software was used to calculate the area under the hydrolysis curve. The correlation between the glycemic index, the content of bioactive compounds, and the antioxidant capacity determinations were obtained using the Pearson correlation test (p<0.01). The slopes of the linearization of the pH variation were compared with one another, and the departure from linearity was evaluated. Prism® software version 8 (GraphPad Software, La Jolla, CA, USA) was used for data visualization and statistical treatment.
5. Conclusions
The combination of AS and PPJ in one beverage has been shown to have antioxidant properties through various mechanisms. This makes it a potential natural beverage for managing oxidative stress in chronic diseases. The content of bioactive compounds in the beverage shows a direct relationship with its antioxidant capacity. These include hydrogen and electron donation. In addition, the beverage has demonstrated a low glycemic index and glycemic regulatory properties. The fermentation of PPJ produces lower concentrations of SCFA. However, in combination with AS, they are complementary. This results in lower gas volumes compared to AS alone and higher total SCFA concentrations compared to PPJ alone. The combination of ingredients creates a beverage that is consistent with the all-natural and minimally processed functional food trends. Finally it is important remark that carbohydrate fermentation could be a beneficial process in the large gut.
Supplementary Materials
The following supporting information can be downloaded at: www.mdpi.com/xxx/s1, Supplementary Table ST1: Correlation analysis; Supplementary material 2: Standard curves for chromatographic identification and quantification; Supplementary Figure SF1: Gas production during in vitro gut fermentation in positive (lactulose) and negative control (blank); Supplementary Figure SF2: pH changes during in vitro gut fermentation in positive (lactulose) and negative control (blank); Supplementary Figure SF3: SCFA production during the in vitro fermentation process of positive and negative control. Values are means±standard deviation. Supplementary Table ST2: Total production of SCFA (µmol/mL) and molar ratios (% of total SCFA produced) after 24 hours of in vitro gut fermentation.
Author Contributions
Luisa Fernanda Duque-Buitrago: Methodology, Investigation, Formal Analysis, Data Curation, Writing - Original Draft. Iraham Enrique Solórzano-Lugo: Investigation, Writing - Original Draft. Marcela González-Vázquez: Methodology, Investigation, Supervision., Georgina Calderón-Domínguez: Resources, Supervision. Maria Antonia Hernandez-Aguirre: Methodology, Supervision, Project Administration. Perla Osorio-Diaz: Methodology, Resources, Project Administration. Verónica Loera-Castañeda, Cristian Jiménez Martínez: Writing - Review & Editing. Rosalva Mora-Escobedo: Conceptualization, Writing - Original Draft, Supervision, Resources.
Funding
This research was supported by grants from Instituto Politécnico Nacional through SIP-COFAA-EDI-IPN with the financial support from “PROYECTOS DE DESARROLLO TECNOLÓGICO O INNOVACIÓN EN EL IPN 2022”.
Institutional Review Board Statement
The researchers followed good clinical practices while conducting the study, ensuring the privacy of any sensitive data of the volunteers. Furthermore, the samples collected were not associated with the identity of the volunteers. The donor recruitment process and the feces collection were carried out under the supervision of the bioethics committee of the Centro de Desarrollo de Productos Bióticos, and the research protocol was approved in the dictate 2021/05 CEI-CEPROBI. The study was conducted in accordance with the Declaration of Helsinki.
Informed Consent Statement
Informed consent was obtained from all subjects involved in the study.
Data Availability Statement
Data will be made available on request.
Acknowledgments
Funding: The Instituto Politécnico Nacional supported this work through Secretaría de Investigación y Posgrado with financial support from “Proyectos de desarrollo tecno-lógico o innovación en el IPN 2022”. LFDB expresses its appreciation for the doctoral scholarship provided by CONACYT and other financial support from BEIFI-IPN. It is important to note that the funding source did not play any role in the study design, data collection, analysis, interpretation, report writing, or publication submission. Additionally, the beverage used in the study was produced at the Fruit and Vegetable Plant of the Department of Biochemical Engineering at the Escuela Nacional de Ciencias Biológicas of the Instituto Politécnico Nacional.
Conflicts of Interest
The authors declare no conflict of interest.
References
- AACC. (2000). Approved methods of the American Association of Cereal Chemists. Minneapolis, USA. In Approved methods of the American Association of Cereal Chemists: Vols. I–II (10th ed.).
- Adisakwattana, S. , Ruengsamran, T., Kampa, P., & Sompong, W. (2012). In vitro inhibitory effects of plant-based foods and their combinations on intestinal α-glucosidase and pancreatic α-amylase. BMC Complementary and Alternative Medicine. [CrossRef]
- Aguirre, M. , Ramiro-Garcia, J., Koenen, M. E., & Venema, K. (2014). To pool or not to pool? Impact of the use of individual and pooled fecal samples for in vitro fermentation studies. Journal of Microbiological Methods. [CrossRef]
- Aleixandre, A. , Gil, J. V., Sineiro, J., & Rosell, C. M. (2022). Understanding phenolic acids inhibition of α-amylase and α-glucosidase and influence of reaction conditions. Food Chemistry. [CrossRef]
- Alongi, M. , Frías Celayeta, J. M., Vriz, R., Kinsella, G. K., Rulikowska, A., & Anese, M. (2021). In vitro digestion nullified the differences triggered by roasting in phenolic composition and α-glucosidase inhibitory capacity of coffee. Food Chemistry, 20 May 1282. [Google Scholar] [CrossRef]
- Alvarado-Jasso, G. M. , Camacho-Díaz, B. H., Arenas Ocampo, M. L., Jiménez-Ferrer, J. E., Mora-Escobedo, R., & Osorio-Díaz, P. (2020). Prebiotic effects of a mixture of agavins and green banana flour in a mouse model of obesity. Journal of Functional Foods. [CrossRef]
- Astó, E. , Méndez, I., Rodríguez-Prado, M., Cuñé, J., Espadaler, J., & Farran-Codina, A. (2019). Effect of the degree of polymerization of fructans on ex vivo fermented human gut microbiome. Nutrients. [CrossRef]
- Atkinson, F. S. , Brand-Miller, J. C., Foster-Powell, K., Buyken, A. E., Goletzke, J., & Brand-Miller, J. C. (2008). International tables of glycemic index and glycemic load values: 2008. Diabetes Care, 2283. [Google Scholar] [CrossRef]
- Ball, S. , Bullock, S., Lloyd, L., Mapp, K., & Ewen, A. (2011). Analysis of carbohydrates, alcohols, and organic acids by Ion-Exchange Chromatography. Agilent Hi-Plex Columns Applications Compendium, Agilent Technologies.
- Brodkorb, A. , Egger, L., Alminger, M., Alvito, P., Assunção, R., Ballance, S., Bohn, T., Bourlieu-Lacanal, C., Boutrou, R., Carrière, F., Clemente, A., Corredig, M., Dupont, D., Dufour, C., Edwards, C., Golding, M., Karakaya, S., Kirkhus, B., Le Feunteun, S., … Recio, I. (2019). INFOGEST static in vitro simulation of gastrointestinal food digestion. Nature Protocols, 1014. [Google Scholar] [CrossRef]
- Cani, P. D. , Everard, A., & Duparc, T. (2013). Gut microbiota, enteroendocrine functions and metabolism. In Current Opinion in Pharmacology (Vol. 13, Issue 6, pp. 935–940). [CrossRef]
- Cerda, K. (2011). Evaluación del contenido de fenólicos, actividad antioxidante y efectos antidiabéticos de extractos de jarabes de agave (A. atrovirens Karw). Director.
- Cha, M. N. , Jun, H. Il, Lee, W. J., Kim, M. J., Kim, M. K., & Kim, Y. S. (2013). Chemical composition and antioxidant activity of Korean cactus (Opuntia humifusa) fruit. S. ( 22(2), 523–529. [CrossRef]
- Chavez-Santoscoy, R. A. , Gutierrez-Uribe, J. A., Serna-Saldivar, S. O., & Serna-Saldívar, S. O. (2009). Phenolic composition, antioxidant capacity and in vitro cancer cell cytotoxicity of nine prickly pear (Opuntia spp.) juices. Plant Foods for Human Nutrition. [CrossRef]
- Chen, G. , Li, C., & Chen, K. (2016). Fructooligosaccharides: A review on their mechanisms of action and effects. Studies in Natural Products Chemistry. [CrossRef]
- Cockburn, D. W. , & Koropatkin, N. M. (2016). Polysaccharide Degradation by the Intestinal Microbiota and Its Influence on Human Health and Disease. In Journal of Molecular Biology (Vol. 428, Issue 16, pp. 3230–3252). [CrossRef]
- Cronin, P. , & Joyce, S. A. (2021). Dietary fibre modulates the gut microbiota. Nutrients. [CrossRef]
- Daniloski, D. , D’Cunha, N. M., Speer, H., McKune, A. J., Alexopoulos, N., Panagiotakos, D. B., Petkoska, A. T., & Naumovski, N. (2022). Recent developments on Opuntia spp., their bioactive composition, nutritional values, and health effects. Food Bioscience, 1016. [Google Scholar] [CrossRef]
- Das, A. B. , Goud, V. V., & Das, C. (2019). Phenolic Compounds as Functional Ingredients in Drinks. In Value-Added Ingredients and Enrichments of Drinks (Issue 1). Elsevier Inc. [CrossRef]
- Deehan, E. C. , Duar, R. M., Armet, A. M., Perez-Muñoz, M. E., Jin, M., & Walter, J. (2017). Modulation of the gastrointestinal microbiome with nondigestible fermentable carbohydrates to improve human health. ( 5(5), 1–24. [CrossRef] [PubMed]
- Díaz Medina, E. M. , Rodríguez Rodríguez, E. M., & Díaz Romero, C. (2007). Chemical characterization of Opuntia dillenii and Opuntia ficus indica fruits. Food Chemistry. [CrossRef]
- Dubey, P. , Thakur, V., & Chattopadhyay, M. (2020). Role of minerals and trace elements in diabetes and insulin resistance. In Nutrients (Vol. 12, Issue 6, pp. 1–17). Nutrients. [CrossRef]
- El-Hawary, S. S. , El-Kammar, H. A., Farag, M. A., Saleh, D. O., & El Dine, R. S. (2020). Metabolomic profiling of five Agave leaf taxa via UHPLC/PDA/ESI-MS inrelation to their anti-inflammatory, immunomodulatory and ulceroprotective activities. Steroids. [CrossRef]
- El Kossori, R. L. , Villaume, C., El Boustani, E., Sauvaire, Y., & Méjean, L. (1998). Composition of pulp, skin and seeds of prickly pears fruit (Opuntia ficus indica sp.). ( 52(3), 263–270. [CrossRef] [PubMed]
- Fu, M. , Shen, W., Gao, W., Namujia, L., Yang, X., Cao, J., & Sun, L. (2021). Essential moieties of myricetins, quercetins and catechins for binding and inhibitory activity against α-Glucosidase. Bioorganic Chemistry. [CrossRef]
- García-Gamboa, R. , Gradilla-Hernández, M. S., Ortiz-Basurto, R. I., García-Reyes, R. A., & González-Avila, M. (2020). Assessment of intermediate-and long-chains agave fructan fermentation on the growth of intestinal bacteria cultured in a gastrointestinal tract. Revista Mexicana de Ingeniera Quimica. [CrossRef]
- Gómez-Maqueo, A. , García-Cayuela, T., Fernández-López, R., Welti-Chanes, J., & Cano, M. P. (2019). Inhibitory potential of prickly pears and their isolated bioactives against digestive enzymes linked to type 2 diabetes and inflammatory response. P. ( 99(14), 6380–6391. [CrossRef] [PubMed]
- Goñi, I. , Garcia-Alonso, A., & Saura-Calixto, F. (1997). A starch hydrolysis procedure to estimate glycemic index. ( 17(3), 427–437. [CrossRef]
- Goñi, I. , & Martín-Carrón, N. (1998). In vitro fermentation and hydration properties of commercial diatary fiber-rich supplements. Nutrition Research, 1077. [Google Scholar]
- González-Vázquez, M. , Calderón-Domínguez, G., Mora-Escobedo, R., Salgado-Cruz, M. P., Arreguín-Centeno, J. H., & Monterrubio-López, R. (2022). Polysaccharides of nutritional interest in jicama (Pachyrhizus erosus) during root development. Food Science and Nutrition, 1158. [Google Scholar] [CrossRef]
- Gulfi, M. , Arrigoni, E., & Amadò, R. (2005). Influence of structure on in vitro fermentability of commercial pectins and partially hydrolysed pectin preparations. ( 59(2), 247–255. [CrossRef]
- Gulfi, M. , Arrigoni, E., & Amadò, R. (2006). The chemical characteristics of apple pectin influence its fermentability in vitro. LWT - Food Science and Technology. [CrossRef]
- Gupta, D. (2015). Methods for determination of antioxidant capacity: A review. International Journal of Pharmaceutical Sciences and Research. [CrossRef]
- Habibi, Y. , Heyraud, A., Mahrouz, M., & Vignon, M. R. (2004). Structural features of pectic polysaccharides from the skin of Opuntia ficus-indica prickly pear fruits. Carbohydrate Research, 1127. [Google Scholar] [CrossRef]
- Hernot, D. C. , Boileau, T. W., Bauer, L. L., Middelbos, I. S., Murphy, M. R., Swanson, K. S., & Fahey, G. C. (2009). In vitro fermentation profiles, gas production rates, and microbiota modulation as affected by certain fructans, galactooligosaccharides, and polydextrose. C. ( 57(4), 1354–1361. [CrossRef] [PubMed]
- Islam, J. , & Kabir, Y. (2019). Effects and mechanisms of antioxidant-rich functional drinks on disease prevention. In Functional and Medicinal Drinks: Volume 11: The Science of Drinks. Elsevier Inc. [CrossRef]
- Kashyap, P. , Riar, C. S., & Jindal, N. (2022). Effect of extraction methods and simulated in vitro gastrointestinal digestion on phenolic compound profile, bio-accessibility, and antioxidant activity of Meghalayan cherry (Prunus nepalensis) pomace extracts. Lwt. [CrossRef]
- Kaur, A. , Rose, D. J., Rumpagaporn, P., Patterson, J. A., & Hamaker, B. R. (2011). In Vitro Batch Fecal Fermentation Comparison of Gas and Short-Chain Fatty Acid Production Using “Slowly Fermentable” Dietary Fibers. Journal of Food Science. [CrossRef]
- Khouloud, A. , Abedelmalek, S., Chtourou, H., & Souissi, N. (2018). The effect of Opuntia ficus-indica juice supplementation on oxidative stress, cardiovascular parameters, and biochemical markers following yo-yo Intermittent recovery test. Food Science and Nutrition. [CrossRef]
- Leite, A. V. , Malta, L. G., Riccio, M. F., Eberlin, M. N., Pastore, G. M., & Maróstica Júnior, M. R. (2011). Antioxidant potential of rat plasma by administration of freeze-dried jaboticaba peel (Myrciaria jaboticaba Vell Berg). Journal of Agricultural and Food Chemistry, 2283. [Google Scholar] [CrossRef]
- Li, X. , & Siddique, K. H. M. (2020). Future Smart Food: harnessing the potential of neglected and underutilized species for Zero Hunger. Maternal and Child Nutrition. [CrossRef]
- Liu, Y. J. , Zhan, J., Liu, X. L., Wang, Y., Ji, J., & He, Q. Q. (2014). Dietary flavonoids intake and risk of type 2 diabetes: A meta-analysis of prospective cohort studies. Clinical Nutrition. [CrossRef]
- Lobo, V. , Patil, A., Phatak, A., & Chandra, N. (2010). Free radicals, antioxidants and functional foods: Impact on human health. Pharmacognosy Reviews. [CrossRef]
- Louis, P. , & Flint, H. J. (2017). Formation of propionate and butyrate by the human colonic microbiota. J. ( 19(1), 29–41. [CrossRef] [PubMed]
- Macfarlane, G. T. , & Macfarlane, S. (2012). Bacteria, colonic fermentation, and gastrointestinal health. ( 95(1), 50–60. [CrossRef] [PubMed]
- Macfarlane, G. T. , & McBain, A. J. (1999). The Human Colonic Microbiota. In Colonic Microbiota, Nutrition and Health (pp. 1–25). [CrossRef]
- Magallanes-Cruz, P. A. , Flores-Silva, P. C., & Bello-Perez, L. A. (2017). Starch Structure Influences Its Digestibility: A Review. In Journal of Food Science (Vol. 82, Issue 9, pp. 2016–2023). [CrossRef]
- Márquez-Berber, S. R. , Torcuato-Calderón, C., Almaguer-Vargas, G., Colinas-León, M. T., & Gardezi, A. K. (2012). El sistema productivo del nopal tunero (Opuntia albicarpa y O. megacantha) en axapusco, Estado de México. Problemática y alternativas. Revista Chapingo, Serie Horticultura.
- Meza, D. L. M. , & Valdés, R. M. (2015). Inhibición in vitro de las enzimas alfa-amilasa y lipasa pancreática por fracciones fenólicas de extractos etanólicos de hojas de Yacón (Smallanthus sonchifolius Poepp. & Endl). Avances En Quimica.
- Mi, S. , Liu, J., Liu, X., Fu, Y., Yi, J., & Cai, S. (2021). Inhibitory Effects of Myricetrin and Dihydromyricetin toward α -Glucosidase and Pancreatic Lipase with Molecular Docking Analyses and Their Interaction. Journal of Food Quality. [CrossRef]
- Mohammadifard, N. , Humphries, K. H., Gotay, C., Mena-Sánchez, G., Salas-Salvadó, J., Esmaillzadeh, A., Ignaszewski, A., & Sarrafzadegan, N. (2019). Trace minerals intake: Risks and benefits for cardiovascular health. Critical Reviews in Food Science and Nutrition, 1346. [Google Scholar] [CrossRef]
- Moreno-Vilet, L. , Camacho-Ruiz, R. M., & Portales-Pérez, D. P. (2016). Prebiotic Agave Fructans and Immune Aspects. In Probiotics, Prebiotics, and Synbiotics: Bioactive Foods in Health Promotion. Elsevier Inc. [CrossRef]
- Moro Cantu-Jungles, T. , do Nascimento, G. E., Zhang, X., Iacomini, M., Cordeiro, L. M. C., & Hamaker, B. R. (2019). Soluble xyloglucan generates bigger bacterial community shifts than pectic polymers during in vitro fecal fermentation. Carbohydrate Polymers. [CrossRef]
- Mothibedi, K. (2013). A study of electrospun nanofibers and diatomaceous earth materials for the extraction of alkaloids, flavonoids and aromatic amines in various matrices.
- Nazir, M. , Arif, S., Khan, R. S., Nazir, W., Khalid, N., & Maqsood, S. (2019). Opportunities and challenges for functional and medicinal drinks: Current and future trends. Trends in Food Science and Technology, 20 May. [CrossRef]
- Ondarza, M. A. (2016). Cactus Mucilages : Nutritional, Health Benefits and Clinical Trials. Journal of Medical and Biological Science Research.
- Ortiz-Basurto, R. I. , Pourcelly, G., Doco, T., Williams, P., Dormer, M., & Belleville, M. P. (2008). Analysis of the main components of the aguamiel produced by the maguey-pulquero (Agave mapisaga) throughout the harvest period. Journal of Agricultural and Food Chemistry, 3687. [Google Scholar] [CrossRef]
- Oyaizu, M. (1986). Studies on products of browning reaction. Antioxidative activities of products of browning reaction prepared from glucosamine. The Japanese Journal of Nutrition and Dietetics. [CrossRef]
- Palafox-Carlos, H. , Ayala-Zavala, J. F., & González-Aguilar, G. A. (2011). The Role of Dietary Fiber in the Bioaccessibility and Bioavailability of Fruit and Vegetable Antioxidants. Journal of Food Science. [CrossRef]
- Park, S. H. , Jeong, B. G., Song, W., Jung, J., & Chun, J. (2021). Enhancement of functional and sensory properties of eastern prickly pear (Opuntia humifusa) by fermentation with yuza peel and guava leaf. Food Bioscience, 20 December. [CrossRef]
- Peralta-García, I. , González-Muñoz, F., Elena, R. A. M., Sánchez-Flores, A., & López Munguía, A. (2020). Evolution of fructans in aguamiel (agave sap) suring the plant production lifetime. ( 7(October), 1–15. [CrossRef] [PubMed]
- Perron, N. R. , & Brumaghim, J. L. (2009). A review of the antioxidant mechanisms of polyphenol compounds related to iron binding. L. ( 53(2), 75–100. [CrossRef] [PubMed]
- Qelliny, M. , Aly, U., Elgarhy, O., & Khaled, K. (2019). Colon Drug Delivery Systems for the Treatment of Inflammatory Bowel Disease. ( 2(4), 164–184. [CrossRef]
- Ramírez-Cuellar, L. I. , Alfaro-Rodríguez, C., Ramos-Muñoz, L. G., Hernández -Castañeda, V. N., & Carranza-Concha, J. (2018). Capacidad antioxidante, fenoles totales y análisis microbiológico del Aguamiel. Investigación y Desarrollo En Ciencia y Tecnologia de Alimentos.
- Romero-López, M. R. , Osorio-Díaz, P., Flores-Morales, A., Robledo, N., & Mora-Escobedo, R. (2015). Chemical composition, antioxidant capacity and prebiotic effect of aguamiel (Agave atrovirens) during in vitro fermentation. Revista Mexicana de Ingeniera Quimica.
- Ross, S. A. , Gulve, E. A., & Wang, M. (2004). Chemistry and biochemistry of type 2 diabetes. ( 104(3), 1255–1282. [CrossRef] [PubMed]
- Ruiz Canizales, J. , Heredia, J. B., Domínguez Avila, J. A., Madera Santana, T. J., Villegas Ochoa, M. A., Robles Sánchez, R. M., & González Aguilar, G. A. (2019). Microencapsulation of blue maize (Zea mays L.) polyphenols in two matrices: their stability during storage and in vitro digestion release. Journal of Food Measurement and Characterization. [CrossRef]
- Santos-Zea, L. , Leal-Díaz, A. M., Jacobo-Velázquez, D. A., Rodríguez-Rodríguez, J., García-Lara, S., & Gutiérrez-Uribe, J. A. (2016). Characterization of concentrated agave saps and storage effects on browning, antioxidant capacity and amino acid content. Journal of Food Composition and Analysis. [CrossRef]
- Saura-Calixto, F. , Garcia-Alonso, A., Goni, I., & Bravo, L. (2000). In vitro determination of the indigestible fraction in foods: An alternative to dietary fiber analysis. Journal of Agricultural and Food Chemistry, 3347. [Google Scholar] [CrossRef]
- Schönfeld, P. , & Wojtczak, L. (2016). Short- and medium-chain fatty acids in energy metabolism: The cellular perspective. In Journal of Lipid Research (Vol. 57, Issue 6, pp. 943–954). [CrossRef]
- Shahidi, F. , Chandrasekara, A., & Zhong, Y. (2018). Bioactive phytochemicals in vegetables. Handbook of Vegetables and Vegetable Processing: Second Edition. [CrossRef]
- Song, J. , He, Y., Luo, C., Feng, B., Ran, F., Xu, H., Ci, Z., Xu, R., Han, L., & Zhang, D. (2020). New progress in the pharmacology of protocatechuic acid: A compound ingested in daily foods and herbs frequently and heavily. In Pharmacological Research (Vol. 161). [CrossRef]
- Tungland, B. (2018). Short-Chain Fatty Acid Production and Functional Aspects on Host Metabolism. In Human Microbiota in Health and Disease. Elsevier Inc. [CrossRef]
- Tveter, K. M. , Villa-Rodriguez, J. A., Cabales, A. J., Zhang, L., Bawagan, F. G., Duran, R. M., & Roopchand, D. E. (2020). Polyphenol-induced improvements in glucose metabolism are associated with bile acid signaling to intestinal farnesoid X receptor. BMJ Open Diabetes Research and Care. [CrossRef]
- Udenigwe, C. C. , Lu, Y. L., Han, C. H., Hou, W. C., & Aluko, R. E. (2009). Flaxseed protein-derived peptide fractions: Antioxidant properties and inhibition of lipopolysaccharide-induced nitric oxide production in murine macrophages. Food Chemistry. [CrossRef]
- Ursell, L. K. , Haiser, H. J., Van Treuren, W., Garg, N., Reddivari, L., Vanamala, J., Dorrestein, P. C., Turnbaugh, P. J., & Knight, R. (2014). The intestinal metabolome: An intersection between microbiota and host. Gastroenterology, 1476. [Google Scholar] [CrossRef]
- Van De Wiele, T. , Boon, N., Possemiers, S., Jacobs, H., & Verstraete, W. (2007). Inulin-type fructans of longer degree of polymerization exert more pronounced in vitro prebiotic effects. Journal of Applied Microbiology. [CrossRef]
- Van Loo, J. , Cummings, J., Delzenne, N., Englyst, H., Franck, A., Hopkins, M., Kok, N., Macfarlane, G. T., Newton, D., Quigley, M., Roberfroid, M., Van Vliet, T., & Van Den Heuvel, E. (1999). Functional food properties of non-digestible oligosaccharides: A consensus report from the ENDO project (DGXII AIRII-CT94-1095). British Journal of Nutrition. [CrossRef]
- Villamarín-Gallegos, D. , Oviedo-Pereira, D. G., Evangelista-Lozano, S., Sepúlveda-Jiménez, G., Molina-Torres, J., & Rodríguez-Monroy, M. (2020). Trichoderma asperellum, an inoculant for the production of steviol glycosides in Stevia rebaudiana Bertoni plants micropropagated in a temporary immersion bioreactor. Revista Mexicana de Ingeniera Quimica, 1161. [Google Scholar] [CrossRef]
- Virgen-Carrillo, C. A. , Valdés Miramontes, E. H., Fonseca Hernández, D., Luna-Vital, D. A., & Mojica, L. (2022). West Mexico Berries Modulate α-Amylase, α-Glucosidase and Pancreatic Lipase Using In Vitro and In Silico Approaches. Pharmaceuticals. [CrossRef]
- Wang, B. , Yao, M., Lv, L., Ling, Z., & Li, L. (2017). The human microbiota in health and disease. ( 3(1), 71–82. [CrossRef] [PubMed]
- Wang, M. , Wichienchot, S., He, X., Fu, X., Huang, Q., & Zhang, B. (2019). In vitro colonic fermentation of dietary fibers: Fermentation rate, short-chain fatty acid production and changes in microbiota. In Trends in Food Science and Technology (Vol. 88, Issue 18, pp. 1–9). Elsevier. 20 November. [CrossRef]
- Wong, J. M. W. , De Souza, R., Kendall, C. W. C., Emam, A., & Jenkins, D. J. A. (2006). Colonic health: fermentation and short chain fatty acids. Journal of Clinical Gastroenterology. [CrossRef]
- Yao, C. K. , Muir, J. G., & Gibson, P. R. (2016). Review article: Insights into colonic protein fermentation, its modulation and potential health implications. Alimentary Pharmacology and Therapeutics. [CrossRef]
- Yuan, T. , Wan, C., Liu, K., & Seeram, N. P. (2012). New maplexins F-I and phenolic glycosides from red maple (Acer rubrum) bark. Tetrahedron. [CrossRef]
Figure 1.
Gas production during in vitro gut fermentation. Presented values are means and standard deviation from three replicates. Different letters (a, b, c) show significant differences between substrates at the same time points (p ≤ 0.05). AS = Agave sap; PPJ = prickly pear juice; B = beverage.
Figure 1.
Gas production during in vitro gut fermentation. Presented values are means and standard deviation from three replicates. Different letters (a, b, c) show significant differences between substrates at the same time points (p ≤ 0.05). AS = Agave sap; PPJ = prickly pear juice; B = beverage.
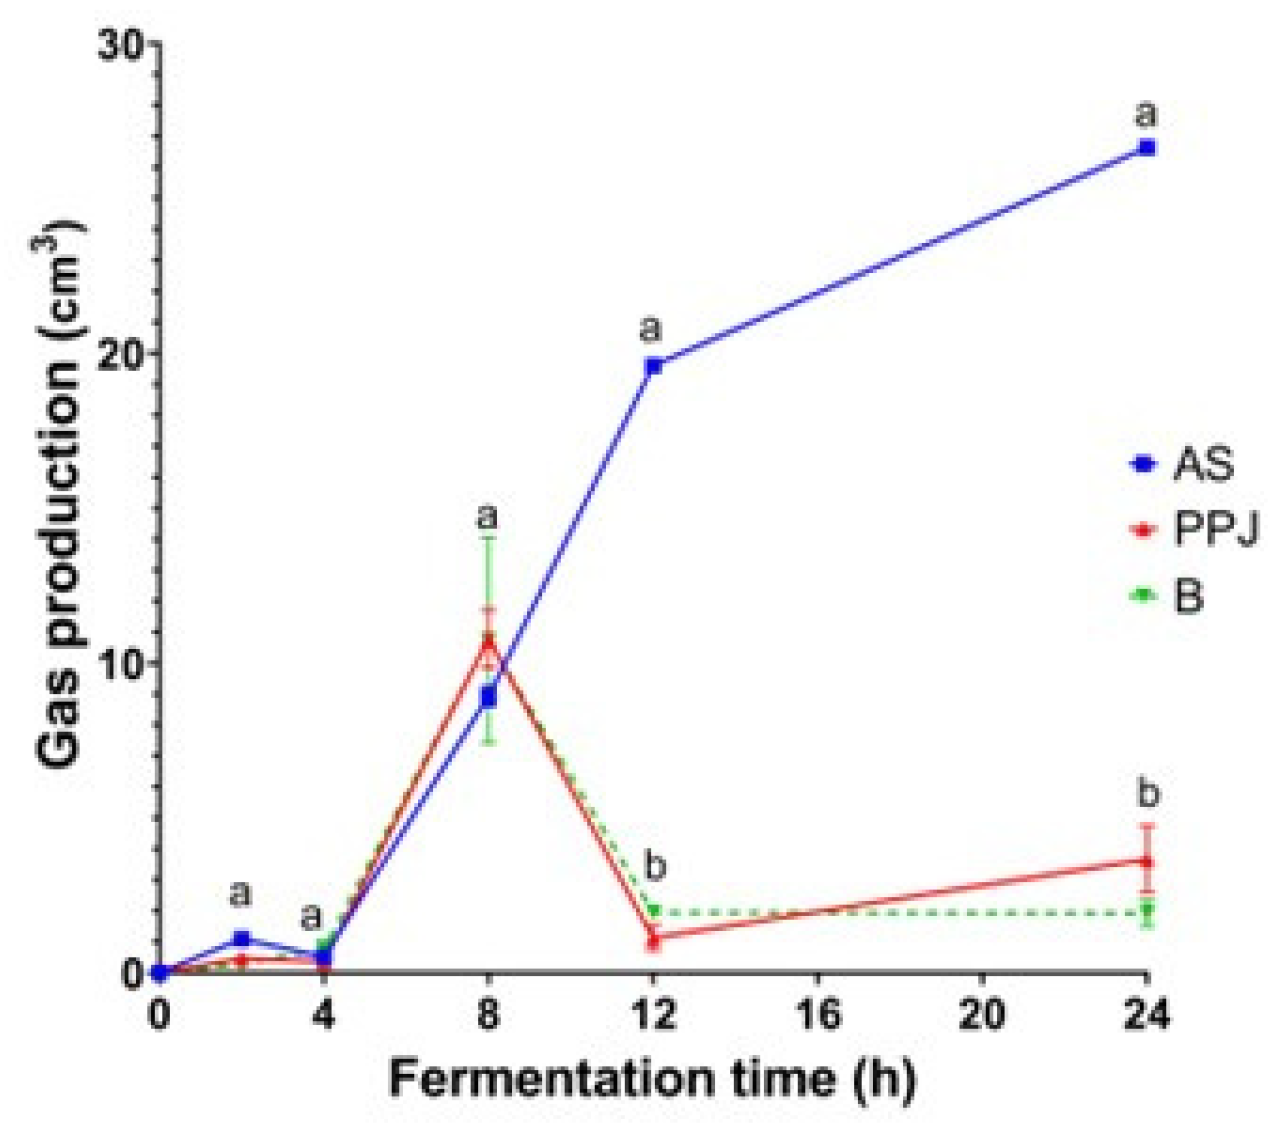
Figure 2.
pH changes during in vitro gut fermentation. Presented values are means and standard deviation from three replicates. Different letters (a, b, c) show significant differences among substrates at the same time points (p ≤ 0.05). AS = Agave sap; PPJ = prickly pear juice; B = beverage.
Figure 2.
pH changes during in vitro gut fermentation. Presented values are means and standard deviation from three replicates. Different letters (a, b, c) show significant differences among substrates at the same time points (p ≤ 0.05). AS = Agave sap; PPJ = prickly pear juice; B = beverage.
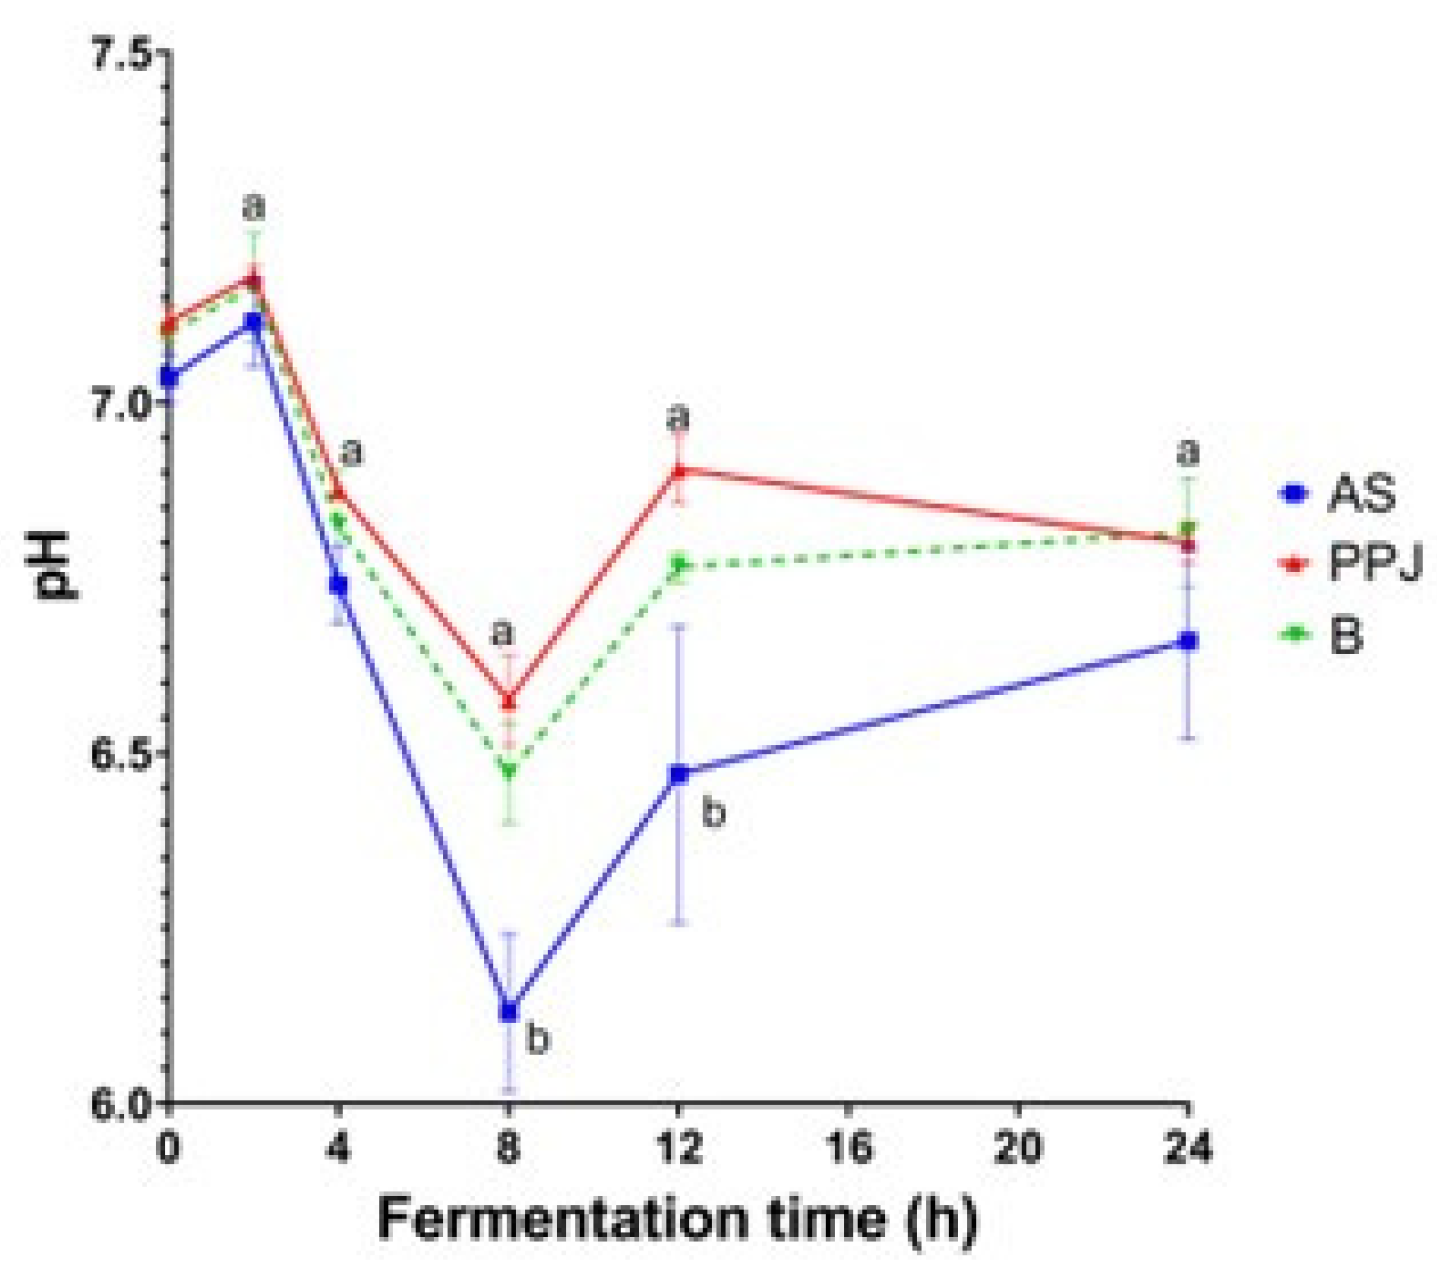
Figure 3.
pH/Fermentation rate time (h) change and fit a linear regression model, where X is the slope of a linear equation. AS = Agave sap; PPJ = prickly pear juice; B = beverage.
Figure 3.
pH/Fermentation rate time (h) change and fit a linear regression model, where X is the slope of a linear equation. AS = Agave sap; PPJ = prickly pear juice; B = beverage.
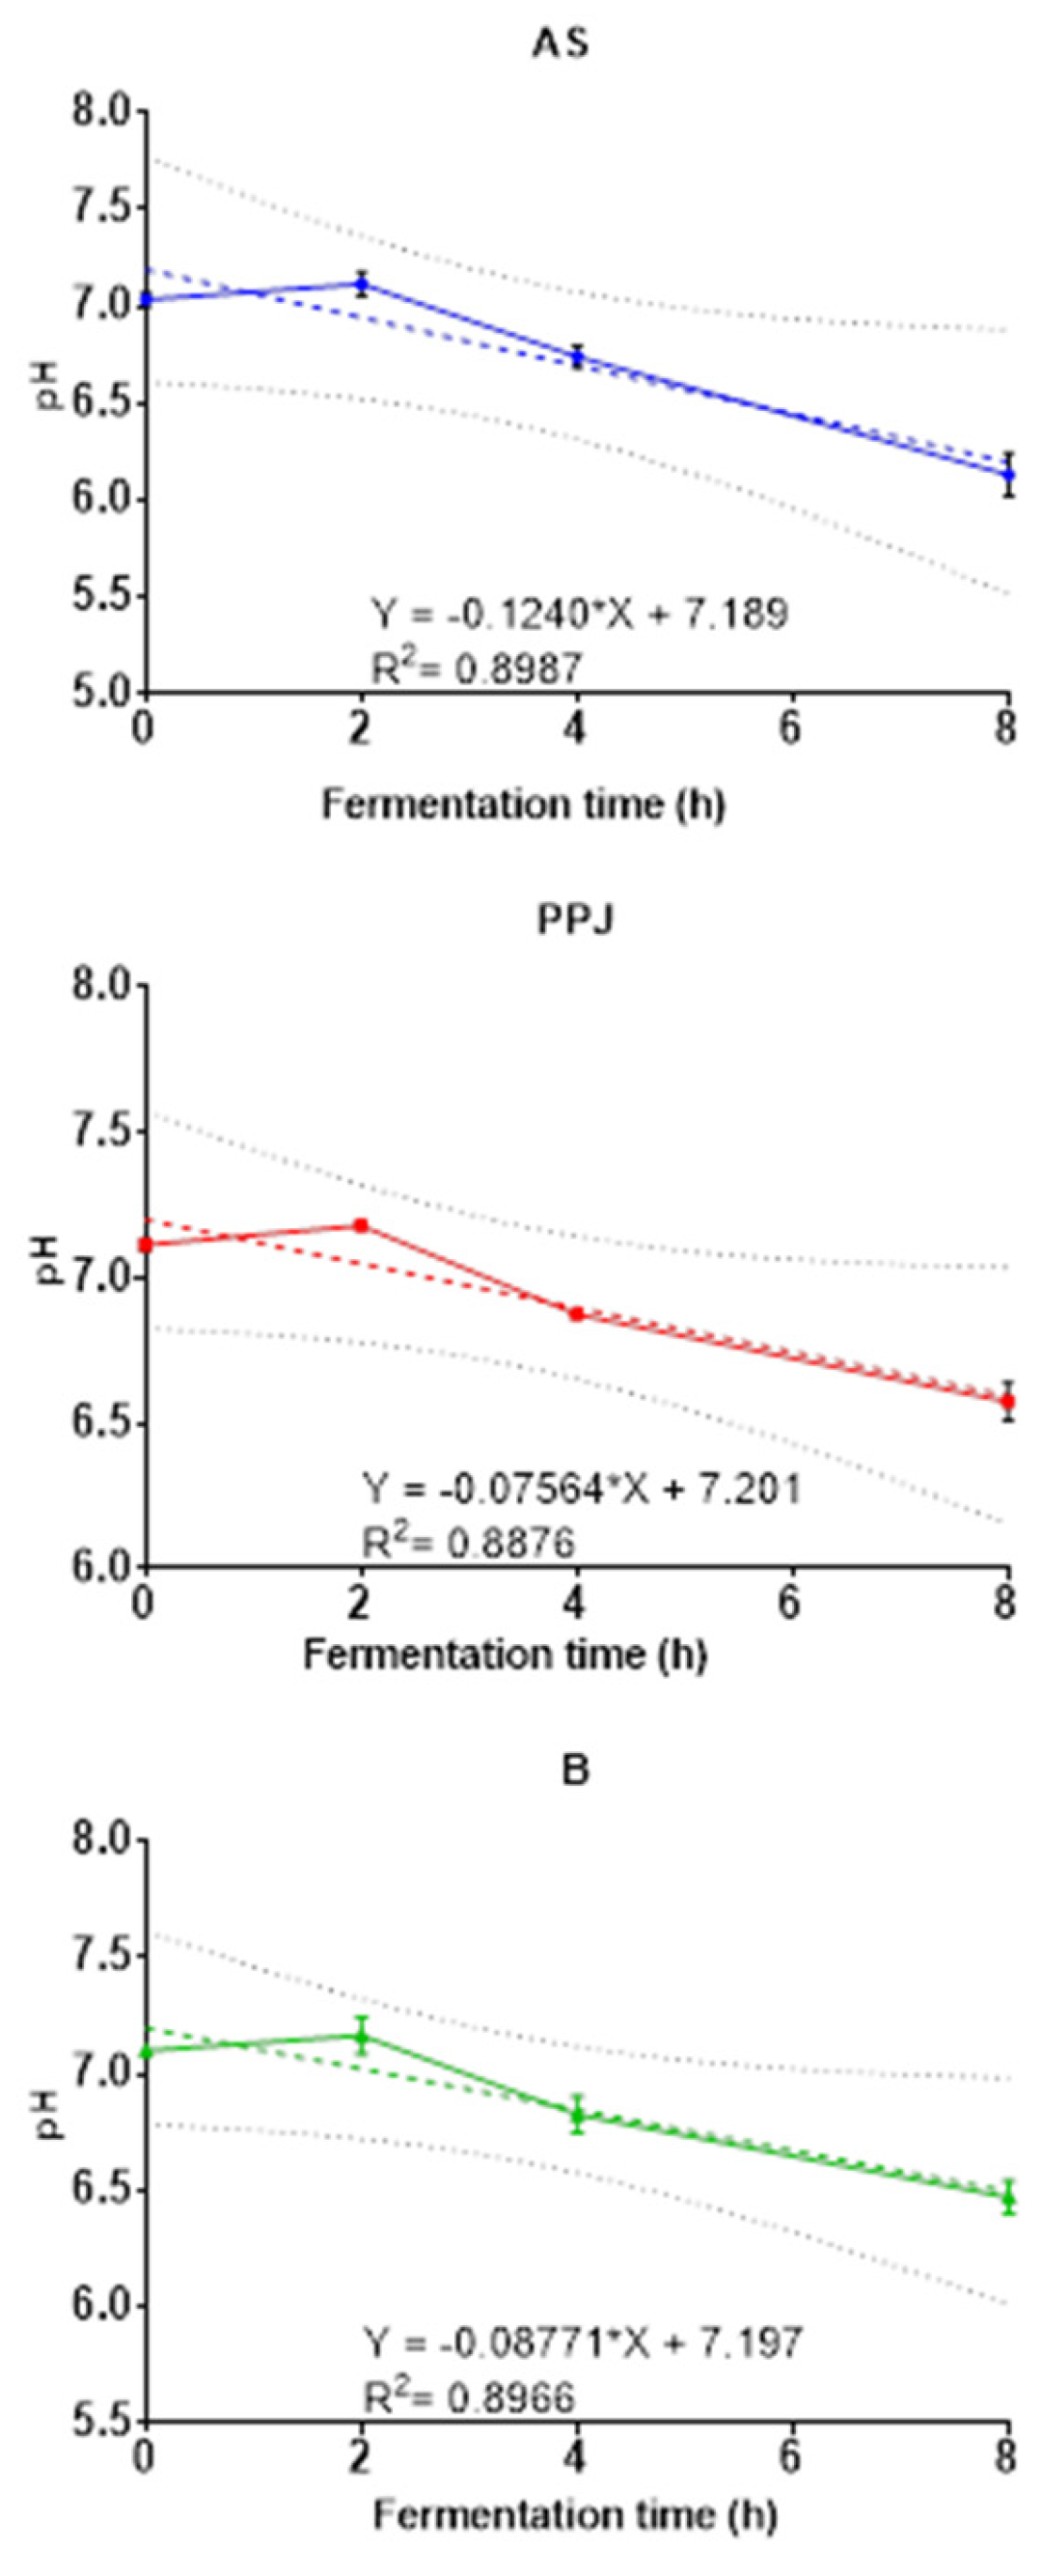
Figure 4.
SCFA production during the in vitro fermentation process. Presented values are means and standard deviation from three replicates. Different letters (a, b, c) show significant differences between substrates at the same time points (p ≤ 0.05). AS = Agave sap; PPJ = prickly pear juice; B = Beverage.
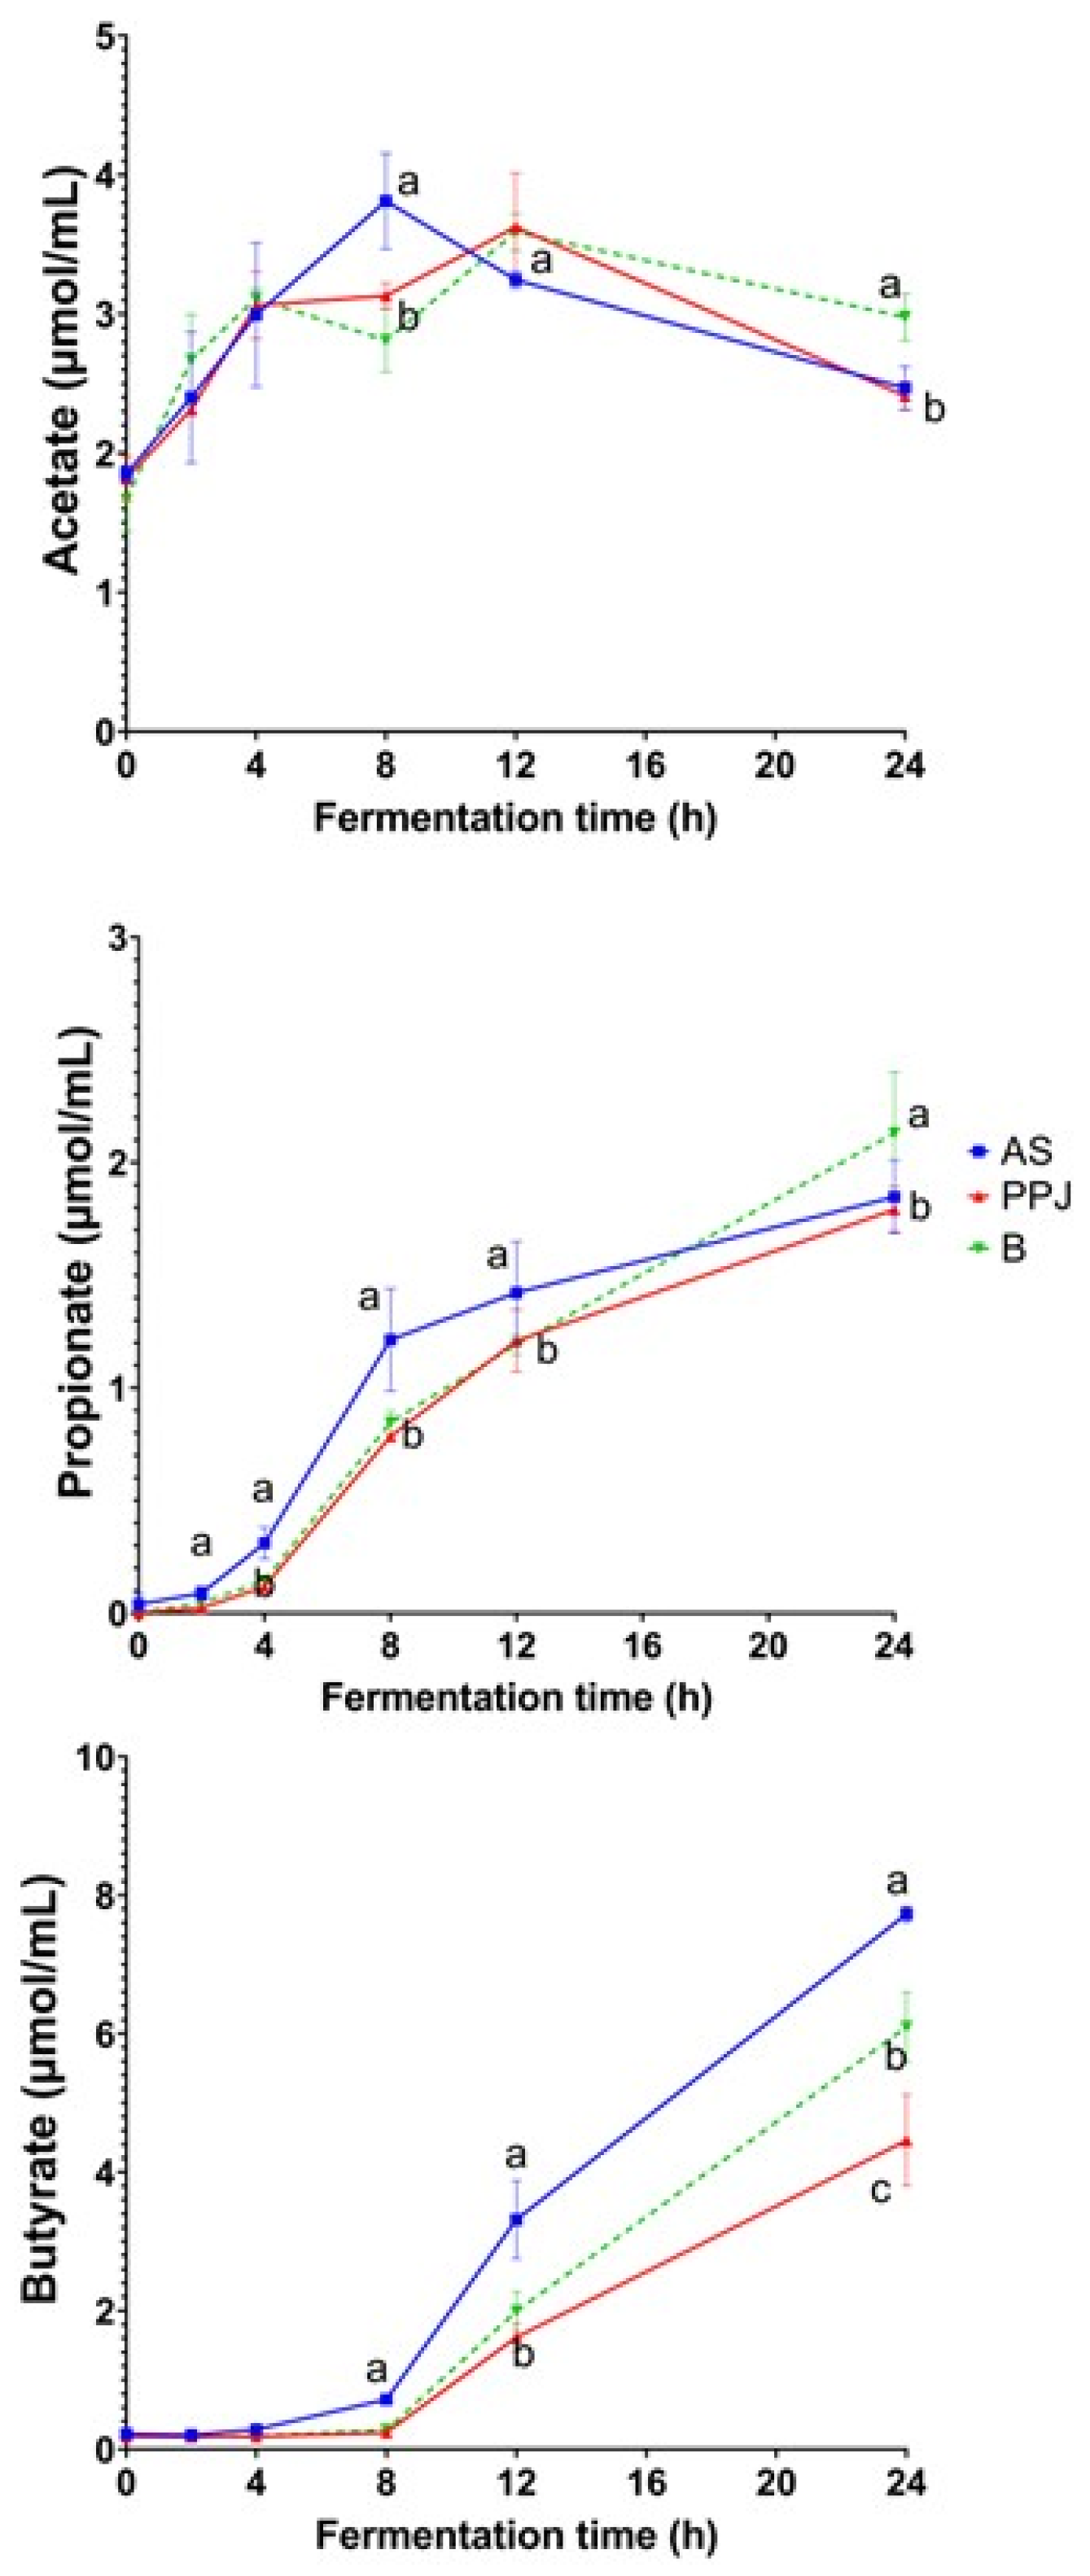

Table 1.
Composition of Agave sap (AS), prickly pear juice (PPJ), and the beverage.
| Component (g/100 mL) | AS | PPJ | Beverage |
| Moisture | 90.04±0.11a | 87.53±0.08c | 89.80±0.09b |
| Ash | 0.13±0.03a | 0.30±0.06a | 0.18±0.04a |
| Protein | 0.25±0.25a | 0.21±0.15a | 0.26±0.18a |
Mean values of three replicates ± SD. Different letters in the row indicate significant statistical differences according to Tukey’s multiple comparison tests with a significance level of 0.05.
Table 2.
Quantification of free carbohydrates in Agave sap (AS), prickly pear juice (PPJ), and the beverage using HPLC.
Table 2.
Quantification of free carbohydrates in Agave sap (AS), prickly pear juice (PPJ), and the beverage using HPLC.
| Carbohydrate (mg/100 mL) | AS | PPJ | Beverage |
| Nystose | 78.52±3.93a | 52.57±1.88b | 72.98±3.83a |
| Kestose | 44.8±2.24a | 33.45±1.67c | 39.26±1.96b |
| Sucrose | 74.43±2.62a | 71.51±3.29a | 70.08±3.50a |
| Glucose | 43.46±2.17c | 226.27±4.09a | 142.15±5.67b |
| Fructose | 191.43±9.65a | 103.26±2.36c | 158.16±8.86b |
| Galacturonic acid | 113.08±6.43c | 411.96±1.91a | 217.74±13.46b |
| Mannose | 238.54±13.63a | - | 151.28±2.04b |
| Galactose | - | 192.24±4.63a | 100.85±1.15b |
| Rhamnose | 222.53+10.87b | 274.09±4.84a | 227.00±1.58b |
| Total quantified | 1006.79±25.29c | 1365.35±29.51a | 1179.50±77.84b |
Mean values of three replicates ± SD. Different letters in the row indicate significant statistical differences according to Tukey’s multiple comparison tests with a significance level of 0.05.
Table 3.
Content of bioactive compounds in Agave sap (AS), prickly pear juice (PPJ), and the beverage.
Table 3.
Content of bioactive compounds in Agave sap (AS), prickly pear juice (PPJ), and the beverage.
| AS | PPJ | Beverage | |
| TPC (GAE) | 22.95±1.29c | 62.415±0.24a | 48.179±0.42b |
| Flavonoids (QE) | 1.33±0.18c | 15.92±1.85a | 7.52±0.10b |
| Catechin (mg/100 mL) | 30.00±1.40c | 63.53±3.20a | 46.05±2.16b |
| Protocatechuic acid (mg/100 mL) | 33.89±0.36c | 84.43±0.75a | 55.03±0.39b |
| Gallic acid (mg/100 mL) | 1.31±0.09 | 1.23±0.02a | 1.58±0.05a |
| Myricetin (mg/100 mL) | 10.28±4.86a | - | 4.70±1.20a |
| Total quantified (mg/100 mL) | 79.97±6.79c | 153.78±4.1a | 112.56±3.88b |
| Ascorbic acid (mg/100 mL) | 4.49±0.08a | 4.59±0.13a | 5.20±0.08a |
Total bioactive compounds expressed in mg Gallic acid equivalents (GAE) per 100 mL, while flavonoids expressed in mg quercetin equivalents (QE) per 100 mL. The mean values of three replicates were calculated ± SD. In case of significant statistical differences, different letters in the row were used to indicate them, according to Tukey’s multiple comparison tests, with a significance level of 0.05.
Table 4.
Antioxidant and iron chelation capacity of Agave sap (AS), prickly pear juice (PPJ), and the beverage.
Table 4.
Antioxidant and iron chelation capacity of Agave sap (AS), prickly pear juice (PPJ), and the beverage.
| Method | AS | PPJ | Beverage |
| PFRAP (%) | 96.05±0.26c | 88.04±0.99a | 95.29±0.11b |
| SASA (%) | 10.34±0.16c | 15.63±0.52a | 13.47±0.30b |
| ABTS (TE) | 873.33±70.24c | 2853.33±23.01a | 2000.00±55.34b |
Values reported in percent antioxidant capacity (%) of each test using 0.5 M gallic acid as standard for PFRAP and SASA methods and in mmol Trolox equivalents/mL (TE) of sample for the ABTS method. Mean values of three replicates ± SD. Different letters in the row indicate significant statistical differences according to Tukey’s multiple comparison tests with a significance level 0.05.
Table 5.
Estimated glycemic index, α-amylase, and α-glucosidase inhibition activity of Agave sap (AS), prickly pear juice (PPJ), and the beverage.
Table 5.
Estimated glycemic index, α-amylase, and α-glucosidase inhibition activity of Agave sap (AS), prickly pear juice (PPJ), and the beverage.
| Glycemic index | |||
| AS | PPJ | Beverage | |
| 37.35±0.42a | 30.04±0.44b | 26.39±0.19c | |
| Enzymatic inhibition (%) | |||
| α-amylase | - | NA | - |
| α-glucosidase | 93.92±6.44b | NA | 95.56±3.09a |
Mean values of three replicates ± SD. NA= no activity. Different letters in the row indicate significant statistical differences according to Tukey’s multiple comparison tests with a significance level of 0.05.
Disclaimer/Publisher’s Note: The statements, opinions and data contained in all publications are solely those of the individual author(s) and contributor(s) and not of MDPI and/or the editor(s). MDPI and/or the editor(s) disclaim responsibility for any injury to people or property resulting from any ideas, methods, instructions or products referred to in the content. |
© 2024 by the authors. Licensee MDPI, Basel, Switzerland. This article is an open access article distributed under the terms and conditions of the Creative Commons Attribution (CC BY) license (https://creativecommons.org/licenses/by/4.0/).
Copyright: This open access article is published under a Creative Commons CC BY 4.0 license, which permit the free download, distribution, and reuse, provided that the author and preprint are cited in any reuse.


