Submitted:
09 May 2024
Posted:
10 May 2024
You are already at the latest version
Abstract
This study examines the effects of the δ phase and annealing twins on the hardness, Charpy impact toughness, and tensile properties of Inconel 718 fabricated using L-PBF. Two heat treatment methods, involving solid solution and precipitation hardening, were utilized. The δ phase was formed through solid solution heat treatment at 980C for 1 hour while annealing twins were generated at 1100C for 3 hours. After precipitation hardening, specimens with a higher concentration of precipitates exhibited increased ultimate tensile strength (13%), yield strength (27%), and hardness (12%) compared to those with annealing twins. This can be attributed to the smaller grain size, subgrains, and δ precipitates, which contribute to the differences in mechanical strength. On the contrary, specimens with annealing twins showed significantly higher impact toughness (4 times) and ductility (twice) than those with δ precipitates. This is caused by the formation of precipitates, which serve as sites for void formation and crack propagation, leading to a decrease in plasticity due to lattice mismatches with the matrix. Microstructural, compositional, phase, crystallographic, and fractographic analyzes were performed using OM, SEM, TEM and XRD techniques to identify the factors responsible for the variations in the measurements. The results demonstrate that the heat treatment method involving annealing twins significantly improves the ductility of Inconel 718 while maintaining the required mechanical strength.
Keywords:
L-PBF
; Inconel 718
; microstructure
; heat treatment
; mechanical strength
; microscopy
1. Introduction
Inconel 718 (IN718), which is a well-known nickel-based superalloy, is widely recognized for its ability to maintain excellent mechanical properties at high temperatures as high as 650 °C [1,2]. Other applications include pulp and paper mills, marine architecture, electronic components, metal processing mills, and pollution control equipment [3]. IN718 exhibits excellent weldability due to its slow precipitation kinetics [4] and has become one of the most fabricated alloys using additively manufacturing (AM) techniques. Among the many AM methods, laser metal powder bed fusion (L-PBF) is the most widely employed for studying IN718 as it offers several advantages, such as the ability to print very complex parts with high precision and a low level of porosity.
IN718 is a face-centered cubic, austenite (γ) solid supersaturated solution matrix rich in Ni, Cr, and Fe. The microstructure of the as-printed (AP) L-PBF-IN718 consists mainly of columnar and irregularly shaped grains, which in turn contain columnar and cellular subgrains. Several studies show that the average size of the subgrains is about 500 nm. In addition to networks of dislocations, the subgrain boundaries of the AP IN718 are rich in primary phases mainly Laves and carbides. Niobium is highly susceptible to segregation which tends to form such undesirable phases during printing/solidification. Laves is a brittle intermetallic compound (Ni, Cr, Fe) (Nb, Mo, Ti) [5] with higher concentrations of Nb, Mo, and Ti than the concentration in the γ matrix [6]. The AP IN718 has been proven to be stronger in mechanical strength than its conventional counterparts due to the residual stresses accumulated by dislocation networks and primary phases. However, further enhancement of the mechanical properties of AP IN718 is needed to meet overall requirements and tailor the properties of the alloy to a specific application.
The strengthening of Inconel is typically achieved through a two-step post-fabrication heat treatment process, which involves solid solution heat treatment (ST) and aging. This process results in the precipitation of two major strengthening phases, namely the γ″ and γ′ phases, which create coherency strain in the matrix. Both phases have the same formulation, Ni3M. The γ″ phase has a D022 body-centered tetragonal unit cell (Ni3Nb), while the γ′ phase has a primitive cubic L12-ordered intermetallic structure (Ni3(Nb, Ti, Al)). The γ″ precipitates are coherent ellipsoidal disks with a {100} habit plane, with a major axis approximately 4-5 times larger than its minor axis. On the other hand, the γ′ precipitates are circular discs and smaller in size compared to the γ″ precipitates. Previous research has shown that the presence of γ″ and γ′ phases can increase the hardness of AM-fabricated IN718 by 30-48% [7] depending on the specific heat treatment conditions.
The other important phase often precipitated in IN718 is the δ phase, which is in equilibrium compared to the metastable γ′′ phase. The δ phase has an orthorhombic (D0a) crystal structure with a similar stoichiometry of Ni3Nb as that of γ′′. The δ-phase precipitates between about 700°C and its solvus temperature (≅1000°C) [8]. In conventional IN718, the δ phase is formed as a transformation of the metastable γ′′ phase at intermediate temperatures (below 900°C) [9,10,11]. A complete transformation of the γ′′ phase to the δ phase may also occur during service in the case of an abnormal rise in temperature or stress [12]. The δ phase nucleates along the grain boundaries and twin boundaries at relatively lower temperatures and in the core of the grains at higher temperatures [13], owing to the concentration of Nb. Particularly, δ nucleates at dislocation sites above 950°C on the grain boundaries, and at dislocation sites between 900 and 950°C [9]. This usually occurs when the aging time is higher than 100 hours at temperatures closer to 1000 °C [14]. Complete dissolution of the δ phase occurs above 1020°C [15].
The role of δ phase in IN718 is controversial in the literature. Depending on its morphology, size, quantity, and distribution, it can have detrimental or beneficial effects. A coarser and large quantity of δ precipitates can reduce the strength of IN718 due to its orthorhombic crystal structure, which is incoherent with the FCC γ matrix. In addition, the precipitation of δ phase depletes Nb from the matrix, which could otherwise be used for the precipitation of the main strengthening phase, γ′′. In particular, δ phase adversely affects the plasticity of IN718. The report by Amderson and co-workers [16] shows that a high amount of δ precipitates in wrought IN718 can affect the formability of the material as it reduces the movement of grain boundaries by suppressing the relaxation of stress concentrations at the interfaces between the δ phase and the matrix. Specifically, the effect of the δ phase on formidability is significant when the number of intragranular precipitates exceeds the number of intergranular precipitates [16]. Similarly, a larger volume fraction of needle-shaped δ precipitates in wrought and cast IN718 decreases ductility, mainly due to the high interfacial energy and incoherency of the δ phase with the matrix [9,17]. However, the needle-shaped δ precipitates pin the grain boundaries and impede grain growth and grain boundary sliding during service at high temperatures. The δ phase precipitates in an acicular shape in IN718 between 815 °C and 980°C. Moreover, the δ phase has detrimental effects on the rupture life of IN718, especially in its plate-like morphology as they are preferential sites for cavity growth [18].
On the positive side, as several studies [7] have shown that δ precipitates can increase the hardness and tensile strength of IN718 by impeding dislocation motion. Additionally, controlled precipitation of the δ phase has been claimed to have other beneficial effects, such as stabilizing grain size and improving stress rupture properties due to its orthorhombic D0a structure. In fact, the formation of moderate amounts of δ precipitates with appropriate morphology along grain boundaries has been found to enhance the notch sensitivity of these boundaries in IN718 [19]. This is because the rod-like δ precipitates act as barriers, preventing grain growth and ultimately improving the mechanical strength of the material. [2,19,20].
Furthermore, as one of the recent studies on AM-based materials [20] showed improved mechanical strength at higher temperatures can be achieved by controlling the precipitation of the δ phase. According to Gao and co-workers [20], excessive precipitation of the δ phase has detrimental effects at high temperatures as they become sites for dislocation piling up leading to high stress that initiates microcracking and reduces tensile strength. However, by designing heat treatment schemes that control the distribution of δ phase, mechanical properties of L-PBF-fabricated IN718 were found to be improved during high-temperature evaluation. In the heat treatment scheme, which they [20] call double solution treatment and aging (ST at 1080 °C+980°C+ aging), rod-like δ precipitates were formed mainly across the grain boundaries. The amount of the δ precipitates observed was much less than those solution heat treated at 980°C and aged. Their findings show that the short rod-shaped δ phase increases tensile strength measured at high temperatures (650 °C) by hindering dislocation movement during the tensile test. However, the elongation is lower than the other heat treatment schemes. The specimen ST at 980°C showed lower tensile strength than the double solid solution heat-treated case. In the former, a larger number of acicular δ phases was assumed to be accountable for the lower tensile strength. Nevertheless, the tensile strength of the specimen treated with double solution treatment was nearly the same as that of a single ST specimen, but with better ductility.
IN718 exhibits a strain and δ precipitation free microstructure if heat treated at or close to 1100°C for a hold time of 3 hours or longer [21]. At and closer to this temperature, IN718 develops annealing twins which are believed to improve ductility while maintaining mechanical strength. In their heat treatment regime for L-PBF-IN718 which involves ST at 1150 °C for 2 hours and aging at 700 °C for 12 hours, Li et al. [22] demonstrated a 41% increase in ductility compared to the traditional heat treatment regime (1065 °C for 1.5 hours + 760 °C for 10 hours + 650 °C for 8 hours).without significant effects on the ultimate tensile strength (UTS). In addition to contributions from the annealing twins, in the enhanced heat treatment scheme, which they call novel heat treatment (NHT), Li and his co-workers observed more circular γ′′ precipitates with a size of 30-35 nm and a length-to-thickness ratio of 1-3. The design of NHT was based on the TTT diagram of IN718, which reveals precipitation of both γ′ and γ′′ at a single aging temperature of 700 °C. The combined effects of tiny hardening precipitates and annealing twins resulted in a maximum UTS and ductility of 1320 MPa and 24%, respectively. Improved ductility was also demonstrated for specimens that evolved annealing twins in other studies for IN718 [2], for Ag-8Au-3Pd wire [23], and for the austenitic alloy (Fe-10Mn-4Al-0.3C) [24].
After reviewing the literature on the advantages and disadvantages of the topic, this study aims to analyse the effects of the δ phase and annealing twins on the tensile properties and hardness of L-PBF-produced IN718. Additionally, the Charpy impact toughness, which has not been extensively studied, will also be examined. The δ phase and annealing twins will be generated through solid solution heat treatments at 980°C and 1100°C, respectively. In the latter instance, precipitation hardening was carried out at a single temperature of 700°C for 12 hours [22]. The specific goal of this work is to better understand impact toughness in different solid solution heat treatment conditions. Part of the research for this study was derived from thesis projects completed by the second through fifth co-authors at the University of Stavanger in 2021–2022.
2. Materials and Experimental Methods
2.1. Materials
IN718 parts were fabricated for various tests, including, tensile, hardness, Charpy impact toughness and microstructure characterization. The parts were made from pre-alloyed powder precursors provided by Aidro (Milano, Italy) and produced using a single laser L-PBF (EOS M290) machine. The initial powder’s nominal chemical composition, adapted from the ASTM F3055-14a standard, is listed in Table 1. The printing parameters were adjusted to achieve an energy density of 58 J/mm3, following the manufacturer’s recommendation. The laser scanning direction was set to rotate by 50º after each layer (40 µm) during printing. The number and dimensions of specimens were determined according to the DNVGL-ST-B203 standard. For the tensile tests, the specimens were fabricated based on their building orientation, either X (x-direction), Y (y-direction), or Z (z-direction, or in a vertical orientation).
To analyze hardness, microstructure, and porosity, a cube measuring 20x20x20 mm was printed for each case. For the impact notch toughness tests, specimens were printed with standard dimensions of 50x10x10 mm, as outlined in ISO 148-1:2016. Three specimens were printed for each of the building orientations (X, Y, and Z) to measure impact toughness and tensile properties.
2.2. Heat Treatment
Two sets of the as-printed specimens were subjected to heat treatment, specifically solid solution and precipitation hardening in order to achieve the desired microstructure and mechanical properties. Prior to aging, the specimens underwent solid solution heat treatment (ST) at 980°C for 1 hour, following the standard for the conventional IN718 (AMS 5662). The other set was subjected to ST at 1100°C for 3 hours, based on the optimal ST heat treatment determined in our previous report [21]. Based on the qualitative and quantitative analysis for a hold time between 1 h and 24 h at ST temperature of 1100°C, the generation of annealing twins became nearly optimum for a hold time of about 3 h [21]. Longer hold times may cause grain coarsening, which is inversely related to twin density. ST at this temperature ensures a nearly strain-free microstructure and a high density of annealing twins.
The heat treatments were conducted using a Nabertherm furnace equipped with a K-type thermocouple. For the ST specimens, the furnace was first stabilized to the desired temperature before introducing the specimens to prevent any unwanted phase transformations at lower temperatures. After the hold time, the specimens were cooled in ambient air. The precipitation of the hardening phases in the ST specimen at 980°C was achieved through two successive heat treatment steps, similar to those used for conventionally fabricated IN718. The furnace was preheated to the aging temperature before introducing the ST specimens. The aging treatment was then carried out at 720 °C for 8 hours, followed by cooling to 650°C and holding for an additional 8 hours. Once the holding period was complete, the specimens were removed from the furnace and cooled in air. The second set of the ST specimens at 1100°C were aged at 700 °C for 12 hours based on the scheme described elsewhere [22]. A schematic of the heat treatment profile is shown in Figure 1. From this point on, the two sets of specimens will be referred to as S980 and S1100.
2.3. Tensile, Impact, and Hardness Testing
For the tensile tests, specimens were prepared according to ASTM E8 standards using a Computer Numerical Control (CNC) machine. The procedures outlined in [25] were followed for preparing the specimens. The tensile test was conducted using an Instron 5985 universal tensile testing machine (Norwood, US) with a maximum loading capacity of 250 kN at a strain rate of 0.00025 s-1 at room temperature. The load rate was initially set to 0.015 mm/mm/min up until a strain of 0.2% was reached and the yield strength was recorded. After that, the machine was adjusted to a rate of 0.01 mm/mm/min and maintained until the specimen fractured.
Charpy impact toughness testing was performed using a Charpy V-notch test system (CNC Mzak Vertical Center, Smart 430 A) at room temperature according to the standard ISO 148-1:2016. The notches for the x- and y-oriented specimens were machined parallel to the build direction, whereas the notches of the z-built specimens were pointing perpendicular to the building direction (BD) following DNVGL-ST-B203 specification. A CNC machine was used for grinding the notches.
The hardness test was measured using a Vickers NOVA 330 testing machine with a 10 kg HV force for a dwell time of 10 s. The surfaces of the specimens were fine-polished according to the requirements for Vickers hardness testing. The hardness measurements were conducted on the three surfaces sectioned from the cubic parts (one normal and the other two parallel to the BD). The interval between adjacent indentations was 1 mm, with the closest indentation to the edge being approximately 3 mm. The average hardness was calculated from more than 10 measurements for each specimen.
2.4. Characterization of Microstructure
The microstructure, composition, and fracture surfaces of the specimens were analyzed using Scanning Electron Microscopy (SEM), Gemini SUPRA 35VP (Carl Zeiss, Jena, Germany) equipped with EDAX Energy Dispersive X-ray Spectroscopy (EDS). The crystallographic orientation was studied using Electron Back Scattered Diffraction (EBSD) equipped on the SEM with a TSL-OIM orientation imaging microscope system. To observe the melt pool morphology, the microstructure of the specimens sectioned from the specimens was analyzed using light Optical Microscopy (OM, Olympus GX53). Specimen preparation for microstructure analysis involved mechanical grinding, fine polishing, and ultra-polishing with OP-S colloidal silica. For observation with OM, the specimens were electro-etched with Struers Lectropol-5 (Struers, Ballerup, Denmark) at 5 V for 5-10 s in a 10% aqueous oxalic acid solution. Phases and lattice defects were further examined using Transmission Electron Microscopy (TEM) on a JEOL- 2100 (LaB6 filament) (JEOL, Tokyo, Japan) operating at 200 kV. Thin foils for TEM analysis were prepared by first mechanically thinning them to a thickness of about 100 μm, followed by punching 3-mm disks from the thin foils. Finally, the disks were electropolished using a dual jet polishing system Struers TENUPOL-5 (Struers, Ballerup, Denmark) operated at 15 V and -30 °C in an electrolyte solution of 80% methanol and 20% perchloric acid. X-Ray Diffraction (XRD) was also employed to study phases and texture. X-ray diffractograms were recorded with a Bruker D8 diffractometer using CuKα radiation (λ = 1.54060 Å). The 2θ range was from 35° to 100° at a step of 0.02° and a time step of 20 s.
3. Experimental Results
3.1. Microstructure cand Phases
Microstructure
The optical microscopy images showing the overall microstructure of the specimens are presented in Figure 2. As shown in (a) and (b), the scan tracks that characterize the as-printed specimen survived the heat treatment at 980°C and retained nearly their original features on the surfaces normal and parallel to the BD for S980. As reported elsewhere [6,7], 980°C is not high enough to eliminate the melt pools and sub-grain boundaries of the L-PBF-manufactured IN718. On the other hand, compared to S980, S1100 exhibits a recrystallized microstructure with a high density of annealing twins as displayed in Figure 2c.
The δ Precipitates
At 980°C, the ST of IN718 is known to form δ precipitates of varying sizes depending on the hold time. In this study, δ precipitates were observed in the matrix, across the grain boundaries and subgrain boundaries as shown in Figure 3. The precipitates that lie along the grain boundaries (Figure 3a,d) are larger than those within the grains. The coarser and irregularly shaped particles are undissolved Laves phase. According to Radavich [26], the amount of Nb required for the precipitation of δ phase is 6-8 wt.% whereas 10-12 wt.% is required for the Laves phase. However, the amount Nb required for δ phase precipitation may vary depending on the amount of Nb present. Similarly, nucleation of γ″ requires at least 4 wt.% of Nb, whereas γ′ can be formed with Nb concentration lower than 4 wt.%. EDS elemental analysis of most of the lager particles along the grain boundaries in Figure 3 a,c contain 10-15 wt.% of Nb, suggesting the presence of Laves phase. On the other hand, the rod-like precipitates containing 6-9 wt.% Nb are most likely corresponding to the δ phase. Figure 3b shows the precipitation of the δ phase across columnar subgrain boundaries, as indicated by yellow arrows, whereas (d) presents the morphology of the precipitates.
Two types of δ morphologies can be identified from the SEM images shown in Figure 3: needle-like and plate-like precipitates. The former is clearly visible in the non-etched specimens (Figure 3a), while the latter is shown in Figure 3d. The plate-like precipitates are oriented in different directions, with some perpendicular to each other. Additionally, the size of the δ precipitates along the grain boundaries is larger than those in the core of the grains. Qualitatively, the volume fraction of plate-like precipitates is greater than that of needle-like precipitates.
The TEM images in Figure 5 reveal the presence of intragranular δ precipitates, which are also confirmed by the SEM images in Figure 3b. These precipitates are mostly oriented at a specific angle with the subgrain boundaries. The subgrain boundaries of the as-printed IN718 are well known to be enriched in Laves phases, which contain high concentration of Nb. However, the Laves phase was only partially dissolved because the ST temperature of 980°C was not high enough. This resulted in poor diffusivity of Nb, leading to localized areas with high Nb concentrations that promote the nucleation and precipitation of δ phase near the Laves phase sites.
This finding is consistent with our previous study [21], which demonstrated the nucleation of needle-like δ phase along the subgrain boundaries in a specimen aged directly (760°C/10h + 620°C/10h). Thus, the subgrain boundaries are the primary locations for the initiation of δ phase nucleation. Upon heating to 980°C, the δ precipitates became coarser, as shown in Figure 5. As recrystallization progresses, the δ precipitates become more intergranular. The precipitation kinetics, volume fraction, and size of the δ phase are all enhanced with longer hold times [10,14], Moreover, the plate-like δ phase is considered more detrimental than the spheroidal type, because it serves as a preferred site for cavity growth [18].
On the other hand, the ST temperature of 1100°C for S1100 is higher than the dissolution temperature of the δ phase (980–1020 °C). This means that at 1100°C, the δ phase and other major phases such as Laves, carbides and nitrides are partially or fully dissolved into the matrix. The higher mobility of the Nb atoms at this temperature could also contribute to the dissolution of these phases. In addition, grain boundary migration and increase in vacancy concentration at 1100°C may lead to the coarsening of the grains.
The Annealing Twins
The microstructure of S1100 appears to be strain-free in the as-ST state due to a nearly complete recrystallization. To better visualize the grain structures, a typical EBSD quality image map of S980 and S1100 for the surfaces parallel to the BD is presented in Figure 6. Similar to the as-printed morphology, the S980 (a) grains appear more columnar and elongated in the BD direction. On the other hand, the grains of S1100 (b) are more equiaxed and coarsened. Furthermore, a high density of annealing twins has developed in S1100 as shown in Figure 6b. To clearly show the extent of the twins, red lines are used to mark the twin boundaries and black lines are used for the grain boundaries in the images. These twins were identified as CSL Ʃ3 grain boundaries by TSL-OIM. In contrast, there are very few annealing twins observed in S980, as shown in Figure 6a.
The average grain size, calculated using the intercept technique, was found to be 48.9 ±2 µm for S1100 (excluding twins) and 17.5 ± 12.5 µm for S980. The coarsening of S1100 is not unexpected, as the two specimens experienced different levels of recrystallization. Due to the low solidification temperature, the grain morphology of S980 is identical to that of the as-printed specimen [7]. As shown in Figure 5, most of the subgrains still exist after solidification at 980°C for 1hour. However, the subgrain boundaries have coarsened and the dislocation networks entangled at the subgrain boundaries have become entangled, resulting in the partial dissolution of Laves particles. This indicates that the specimen is in a state of recovery at this temperature.
Identification of δ Phase with Electron Diffraction
The orientation relation between the D0a structure of the δ phase and the matrix (γ phase) reported in the literature [10] shows that {111}γ//<010>δ and <110>γ//[100]δ are oriented in the same direction. From this relationship, it can be deduced that the δ phase forms with its a-axes along any one of the close-packed directions of the FCC lattice. Thus, twelve variants of the δ precipitates can be formed with four distinct habit planes in the γ matrix. The crystallographic relationships and nomenclatures of these variants can be found in the literature [14]. Figure 7 shows some of these variants with a relationship of <110>FCC//[100]D0a compared to the simulated diffraction pattern shown in [14].
When the matrix was oriented along <110> zone axis, the γ′′ phase consisted of different variants, as indicated by Sundararaman and colleagues’ simulated diffraction pattern[14]. A TEM image in the [001] orientation is shown in Figure 7c. In the [001] orientation, the strengthening precipitates γ′′ and γ′ are known to nucleate. As previously described [27,28], only a few of the superlattice reflections are shared between the γ′′ and γ′ precipitates. These are {100}γ′- and {002}γ′′-type reflections that overlap in the <001>γ orientation. The dark field image corresponding to the overlapped reflection is indicated by a circle in the inserted SAD pattern in Figure 7d clearly displays the ellipsoidal-shaped γ′′ precipitates.
Phase Identification with X-ray Diffraction
X-ray diffraction technique was used to study the phases and texture of the samples. The diffractograms of S980 and S1100 are displayed in Figure 8. Following the indexing approach of Nunes et al. [29], the X-ray diffractogram confirms the presence of δ, γ′′, and MC (M stands for metals and C for carbon) phases in addition to γ (austenite) phases in S980, as shown in the figure. However, the S1100 diffractogram (shown in Figure 8c,d) mainly displays the FCC (γ) phase and a hint of the γ′′ phase with peaks of low Miller indices. The relative intensities of the peaks indicate the texturization of the specimens. To confirm this, we have used the formulations and descriptions implemented by Nikolic and colleagues [30] to calculate the “Texture Coefficient” (TC) and “Relative Texture Coefficient” (RTC) for identifying the texture. These coefficients were calculated using the intensities (cps) of the first four diffraction peaks, (111), (200), (220,) and (311) planes, which correspond to the FCC phase and the standard TC values of Ag obtained from the literature. The obtained numerical confirm that the {111} planes of the S980 crystals are preferentially oriented with respect to the surface of the specimen. Conversely, S1100 exhibits the (200) plane as the preferred orientation, indicating a rotation of the crystals after high-temperature ST.
3.2. Hardness
The hardness measurements on the surfaces oriented in three orthogonal directions are shown in Figure 9. The results show slight differences across the three surfaces of S980 due to anisotropy in the microstructure. The highest value measured for S980 is on the surface normal to the BD (S1). This could be due to the higher density of grain boundaries compared to the surfaces parallel to the BD. However, the differences observed in hardness among the specimens of S1100 are not significant. This indicates nearly complete recrystallization at 1100°C resulting in equiaxed grains. Among the two sets of specimens, S980 is harder in all specimens than the corresponding hardness of S1100 by 53 HV (12.4%), 48 HV (11.2%), and 35 HV (8.1%), for S1, S2, and S3, respectively.
The superiority of the S980 in hardness over the S1100 can be due to several reasons. The average grain size is 17.5 µm for S980 and 48.9 µm for S1100. The grain boundary density per unit area is higher in S980 than in S1100 which induces more barriers to dislocation gliding and reinforces hardness. Following the Hall-Petch law (σ = σ0 + Κd-1/2 , where σ is the elastic limit, d is the grain size, σ0 and K are constants) [31], the smaller the average grain size, the stronger the metal becomes due to increased resistance to dislocation motion. Another factor contributing to the higher hardness of S980 is the presence of δ precipitates that act as barriers to dislocation gliding. It is important to note that the main hardness precipitate in IN718 is the γ′′ phase in the aged IN718.
3.3. Tensile Properties
Figure 10 shows the tensile properties of the two sets of specimens. As shown in the figure, specimen ST at a lower temperature (980°C) exhibits the highest tensile strength of all the specimens, irrespective of the building orientation compared with that of S1100. Figure 11 shows bar graphs comparing the average values of UTS, 0.2% YS, and elongation of the two specimens. These measurements show that the horizontally built specimens are generally stronger than the vertically built specimens. Mechanical anisotropy can be explained by the layer-by-layer manufacturing of parts printed using the LPB-F system [32,33,34]. The tensile strength was weaker when the thickness layers were oriented normal to the applied stress than when they were oriented parallel to the direction of the applied stress. The accumulated stresses were assumed to be the main cause of the weaker strength of the Z-built specimens compared with the horizontally built specimens. Vertically built specimens have numerous defects, such as microsegregation, oxidation, inclusions, and unmelted powders or pores, caused by a considerable number of thermal stresses that were accumulated during the fast solidification process compared with horizontally built specimens [32,33] due to a higher number of thickness layers.
Numerically, the average UTS of S980 was 1442, 1501, and 1327 MPa for the X, Y, and Z-built specimens, respectively. Similarly, the 0.2% YS values for the X, Y, and Z specimens were 1184, 1247, and 1093 MPa, respectively. Likewise, the UTS values for the S1100 specimen were 1324, 1308, and 1287 MPa for the three orientations. For the X, Y, and Z specimens, the 0.2% YS values are 1010, 983, and 1122 MPa, respectively. S980 exhibits a higher tensile strength than the corresponding values of S1100. For the X, Y, and Z orientations, the tensile strength of S980 exceeds S1100 by 118 (8%), 193 (13%), and 40 (3%) MPa. Similarly, S980 has a higher YS of 174 (17%) for X and 264 (27%) MPa for Y. For the Z-built specimens, the average yield strength of S980 is slightly lower than that of S1100 by 29 MPa (3%). Additionally, S980 exhibits lower ductility than S1100 in all the specimens. This is consistent with previous reports, for example, [2]. The elongation of specimens ST at 1100°C is twice as high (26% vs. 12%) as that of specimens ST at 980°C for the horizontally (Y) built cases. Whereas the vertically built S1100 shows an improvement of about 17% compared to the S980.
The main strengthening mechanism is thought to be the high-stress accumulation due to the hardening precipitates (γ′′), grain boundaries, subgrain boundaries, and δ phase in S980. In tests conducted at room temperature, metals' hardness, tensile strength, and yield strength typically decrease linearly with increasing grain size, in accordance with the Hall-Petch strength-grain size relationship. Grain boundary and subgrain boundary densities per unit area increase with decreasing grain size, hence impeding dislocation gliding. However, as this study also shows, ductility improves with increasing grain size. With a bigger average grain size, S1100's ductility is noticeably superior to S980's. In addition to the low ST temperature of S980, the δ phase inhibits grain growth and contributes to strength. The role of the δ phase as a grain inhibitor in the current study is considered insignificant as the low ST temperature did not promote grain growth.
3.4. Charpy Impact Toughness
To assess the energy absorbed, both sets of specimens in three different building orientations were tested for Charpy V-notch impact toughness, and the results are shown in Figure 12. In all cases, S1100 showed higher impact toughness than the corresponding S980 specimens. The horizontal specimens of S1100 exhibited an impact toughness almost four times higher, whereas the vertical specimens showed about 2.5 times higher toughness than their S980 counterparts. The differences are significant, and S980 exhibits very poor impact toughness, which could be below an acceptable level.
The energy absorbed under impact by S1100 is higher compared to that reported in the literature for L-PBF-IN718 optimized by post-fabrication processes. A typical example is the work of Niekter and his co-workers [35], who studied mechanical properties after heat treatments and the HIP process. They obtained a maximum impact toughness of 53.7 J at room temperature after the HIP (1121°C/4h, 100 MPa) and heat treatment (1025°C/1h + 760°C/5h). This value is lower than the lowest average energy (56 J), measured from the current work for S1100. The heat treatment regime (1100°C/1h + aging) of the current work thus demonstrates optimum impact toughness.
3.5. Fracture Analysis
It is worth figuring out the causes of the variations in the mechanical properties between S980 and S1100 specimens through fracture analysis. SEM observation reveals that the fracture surfaces of specimens from Charpy impact toughness and tensile tests are very similar, predominantly ductile. The typical fracture surfaces of the tensile tests are shown in Figure 13, which displays examples of the fracture surfaces of the specimens built in the Y-direction for both S980 and S1100. Secondary microcracks observed in S980-Y are shown in Figure 13a at low magnification. A similar image is shown in (c) for S1100-Y. Additionally, there are faceted and non-faceted coalescence features in S980.
The fracture surface of S1100 mainly exhibits dimples, as shown in Figure 13d. The microcracks observed in specimens of S980 are along the grain boundaries and are intergranular type microcracks. The voids might be initiated at the interface between the δ precipitates and the γ matrix due to a misfit at the interfaces. As indicated in Figure 13, most of the microcracks are intergranular at the interfaces and rich in larger δ precipitates. The grain boundaries are more prone to crack initiation sites due to weak cohesion at the interface (grain boundaries). This is demonstrated in the etched specimens that exhibit crack-like openings along the grain boundaries that are rich in δ precipitates, as shown in Figure 4. As illustrated in the images, the δ precipitates formed along the grain boundaries are coarser and share larger interfaces with the γ grain boundaries compared to those δ precipitates in the matrix. The opening/microcracks occurred due to the etching process involving the removal of a larger amount of γ constituents that were weakly bonded to the δ precipitates. It is an indication of the ease of initiation of microcracks, mainly along the grain boundaries during plastic deformation.
The study by Zhu et al. [36] indicates that in the vicinity of the δ phase are the void initiation and propagation sites. The voids are believed to be initiated by the stress concentration from the accumulated dislocation during plastic deformation. Zhu and co-workers further argued that as the plastic deformation continued, the stress value at the site of the δ phase could exceed its strength or the strength of the interface between the γ matrix and the δ precipitates, which caused the formation of voids. Because of this, the location of the δ precipitates is regarded as the void initiation site. The low ductility of S980 is also associated with the voids, which become microcracks through the process of coalescing of neighboring voids. The propagation of microcracks then leads to an early tensile failure since they cannot withstand plastic deformation any longer.
Examples of fracture surfaces from the impact test are shown in Figure 14. The left column in the figure presents examples of fracture surfaces of S980 for X-, Y-, and Z-built specimens. Similarly, the images shown in the right column display some representative examples for S1100. As shown in the images, all the specimens of S980 exhibit intergranular type microcracks and a considerable number of faceted cleavages. Similar features are observed in S1100, but in lower quantities. Examples of microcracks in S1100 for Z-built specimens are shown in Figure 14f. High magnification images (not shown) exhibit dimple fracture morphology, which generally suggests ductility. On the other hand, in addition to cleavages, S980 exhibits ridge features on the fracture surfaces, which may suggest the extent of the stress.
4. Discussions
4.1. Effects of δ Precipitates
The tensile strength and hardness of specimens with a significant volume fraction of δ precipitates (S980) are higher compared to those without δ precipitates (S1100). Similar to the γ'' and γ' phases, the δ phase impedes dislocation gliding, resulting in local accumulation near the precipitates during plastic deformation. It is believed that δ phase acts as a hardening precipitate with a pinning effect. The influence of the δ phase on the mechanical properties of IN718 is supported by earlier research, as this study presents. Literature [37,38] also suggests that needle-like δ precipitates along grain boundaries hinder grain growth and improve mechanical strength. It is worth noting that most of the precipitates along grain boundaries in this study have a needle-like morphology.
However, the ductility of S980 is affected by the incoherent interface between the δ phase and the γ matrix. The lattice parameters of the δ phase in IN718 as reported in the literature [10], are: ‘a’ = 0.512 nm, ‘b’ = 0.423 nm, and ‘c’ = 0.455 nm, while the corresponding lattice parameter of the austenite matrix is approximately 0.360 nm. The poor lattice mismatch between the δ phase and the γ phase (matrix) results in a large distortion strain energy, creating sites for void nucleation and crack propagation within the grains [36,39]. As shown in Figure 4, the intergranular δ precipitates form a weak bond with the matrix on either side of the grain boundaries. This weak bond may guide the propagation of the cracks, particularly under stress conditions, potentially explaining the shorter plastic deformation and premature tensile/impact failure observed in S980.
4.2. Effects of Annealing Twins
The grains of the specimens ST at 1100°C exhibited significant growth, accompanied by a high density of annealing twins, as shown in Figure 6 and Figure 2. This contrasts with the specimens ST at 980°C. The high ductility to fracture of S1100 (26%) is attributed to the presence of a high density of annealing twins. This finding is consistent with a recent study in the literature, which also demonstrated improved mechanical properties in L-PBF-IN718. For instance, Li and colleagues [22] observed a UTS, 0.2%YS, and elongation of 1320 MPa, 1070 MPa, and 24%, respectively, in the NHT regime, which also exhibited a high density of annealing twins. Our current results show a UTS of 1324 MPa, a 0.2%YS of 1010 MPa, and an elongation to fracture of 26%. However, the yield strength in our study (1010 MPa) is slightly lower than that reported in previous study. The main difference between these two works is the ST temperature. The current work prefers a lower ST temperature of 1100°C compared to the work of Li and co-workers which used a temperature of 1150 °C. The grain size of the current work (S1100) is 48.9 µm, while the grain size of the previous work (NHT) is 65 µm [22]. However, comparing the grain size between the two works is not a fair comparison due to potential variations in experimental conditions, such as fabrication methods. As mentioned earlier, the aging temperature was kept the same in both works in order to specifically investigate the effects of the ST temperature (1100°C vs. 1150 °C). It is worth noting significant improvement in plasticity achieved by adjusting the ST temperature, which results in the formation of annealing twins, although this comes at the expense of slightly lower strength compared to the traditional heat treatment method.
Twin boundaries have been found to be effective barriers to the motion of dislocations, resulting in improved ductility and strength [22,40,41,42,43]. In a study by Schneider et al [40], the pile-up of dislocations across twin boundaries was observed in a plasticity-strained (3.5%) medium-entropy alloy of CrCoNi using STEM images. The authors also noted a comparable strength of twin boundaries to grain boundaries and a significant contribution of twins to the yield strength. A similar observation was reported in a study by [41] which used a TEM-tomography system to view dislocation-twin boundary interactions in pure Ti. These studies suggest that twin boundaries can also absorb and transmit dislocations, similar to grain boundaries. Additionally, as Li and colleagues [22] have argued, twin boundaries can serve as free sites for dislocation storage. The accumulation of dislocations at twin boundaries can promote elongation during plastic deformation.
Furthermore, numerous other reports, including theoretical and experimental studies [44,45,46] have demonstrated the positive impact of the nano-scale twins on the plasticity of ductile materials by providing significant resistance to crack propagation. High Resolution Transmission Electron Microscopy (HRTEM) investigations have revealed that when cracks interact with twin boundaries, the crack path is deflected, resulting in considerable resistance to crack growth, and blunting of crack tips [45]. In a study conducted by Liu and colleagues [45] the interactions between cracks and twin boundaries were examined on an Ag film using HRTEM. Their findings indicate that dislocations are transmitted across coherent twin boundaries when the stress exceeds a certain threshold. Therefore, broader twins are considered effective blunting agents, weakening the progression of cracks, and enhancing the fracture resistance of nano-twinned materials. In conclusion, twins can serve as effective barriers to dislocation gliding and as blunting agents for microcracks, ultimately, leading to improved ductility of IN718.
5. Conclusions and Prospects
The current study investigated the effects of the δ phase and annealing twins on the tensile properties, hardness, and Charpy impact toughness of L-PBF-fabricated IN718, following different heat treatment schemes. The main results of the study are as follows:
- ✓
- The nucleation of the δ phase primarily begins along the subgrain boundaries, which are enriched in Nb. However, due to the presence of partially dissolved or undissolved Laves, the Nb concentration in the matrix is below the necessary level for δ phase nucleation.
- ✓
- Specimens with δ precipitates (S980) demonstrate higher ultimate tensile strength (13%), yield strength (27%), and hardness (12%) compared to specimens with annealing twins (S1100). The smaller grain size, subgrains, and δ precipitates are mainly responsible for the increased mechanical strength of S980.
- ✓
- In contrast, the specimens with annealing twins exhibited significantly higher impact toughness (up to four times) and ductility (twice) compared to specimens with δ precipitates. The low ductility and impact toughness of S980 may be attributed to lattice mismatch between the δ phase and the γ phase (matrix), as the δ precipitates act as sites for void nucleation and crack propagation, negatively affecting plasticity. Twin boundaries can effectively blunt cracks, thereby resisting fracture and resulting in improved plasticity of IN718.
- ✓
- The heat treatment regime, S1100 (1100°C/3h + 700°C/12h) generally showed, optimized tensile strength (1324 MPa) and ductility (26%). These values are equivalent to or better than the corresponding values obtained from the conventional and AM-IN718 processes which undergo similar post-processing steps.
- ✓
- The impact toughness of 56-64 J is one of the highest values reported in the literature for optimized AM-based post-processed IN718.
- ✓
- High temperature testing is crucial in order to assess the impact of δ precipitates and microstructure variations on the mechanical properties at or near the service temperature of IN718.
Funding
This research received no external funding.
Acknowledgements
The authors would like to thank AIDRO for production and Kongsberg Maritime AS for providing the specimens. Johan Andreas Håland Thorkaas and Emil Mannes Surnevik are acknowledged for their support in the labs.
References
- Donachie, M.J. and S.J. Donachie, Superalloys: a technical guide. 2002: ASM international.
- Qi, H., M. Azer, and A. Ritter. Studies of standard heat treatment effects on microstructure and mechanical properties of laser net shape manufactured INCONEL 718. Metallurgical and Materials Transactions A, 2009, 40, 2410–2422. [CrossRef]
- Sanchez, S.; et al. Powder Bed Fusion of nickel-based superalloys: A review. International Journal of Machine Tools and Manufacture 2021, 165, 103729. [Google Scholar] [CrossRef]
- Robert, E. Schafrik, D.D. Ward, and J.R. Groh, Application of Alloy 718 in GE Aircraft Engines: Past, Present and Next Five Years. Superalloys, 2001, 1-11.
- J.F., R. The physical metallurgy of cast and wrought alloy 718. Superalloys 718 – Metallurgy and Applications, TMS, 1989; Pittsburgh, USA.
- Tucho, W.M.; et al. Microstructure and hardness studies of Inconel 718 manufactured by selective laser melting before and after solution heat treatment. Materials Science and Engineering: A, 2017, 689, 220–232. [Google Scholar] [CrossRef]
- Tucho, W.M. and V. Hansen. Characterization of SLM-fabricated Inconel 718 after solid solution and precipitation hardening heat treatments. Journal of Materials Science, 2019, 54, 823–839. [CrossRef]
- Azadian, S., L.-Y. Wei, and R. Warren, Delta phase precipitation in Inconel 718. Materials Characterization 2004, 53, 7–16. [CrossRef]
- Wei, X.-p.; et al. Strain-induced precipitation behavior of δ phase in Inconel 718 alloy. Journal of Iron and Steel Research, International, 2014, 21, 375–381. [Google Scholar] [CrossRef]
- Sundararaman, M., P. Mukhopadhyay, and S. Banerjee, Precipitation of the δ-Ni3Nb phase in two nickel base superalloys. Metallurgical Transactions A, 1988, 19, 453–465. [CrossRef]
- Andrieu, E.; et al. Influence of Compositional Modifications on Thermal Stability of Alloy 1994, 718, 695–710. 718.
- Dong, J.-x.; et al. Tem Study on Microstructure Behavior of Alloy 718 After Long Time Exposure at High Temperatures. Superalloys, 1994, 649-658.
- I., K., Precipitation in the Fe-Ni-Cr-Nb system. J Iron Steel Inst, 1969, 207, 7.
- Sundararaman, M.; et al. Evolution of δ Phase Microstructure in Alloy 2012, 718, 737–750. 718.
- Li, J.; et al. Microstructural evolution and mechanical properties of IN718 alloy fabricated by selective laser melting following different heat treatments. Journal of Alloys and Compounds 2019, 772, 861–870. [Google Scholar] [CrossRef]
- Anderson, M.; et al. δ Phase precipitation in Inconel 718 and associated mechanical properties. Materials Science and Engineering: A. 2017, 679, 48–55. [Google Scholar] [CrossRef]
- Kuo, Y.-L., S. Horikawa, and K. Kakehi, The effect of interdendritic δ phase on the mechanical properties of alloy 718 built up by additive manufacturing. Materials & Design, 2017, 116, 411–418.
- Desvallees, Y.; et al. Delta phase in Inconel 718: mechanical properties and forging process requirements. Superalloys 1994, 281–291. [Google Scholar]
- Liu, F.; et al. Effect of intermediate heat treatment temperature on microstructure and notch sensitivity of laser solid formed Inconel 718 superalloy. Journal of Wuhan University of Technology-Mater. Sci. Ed., 2011, 26, 908–913. [Google Scholar] [CrossRef]
- Gao, Y.; et al. Effect of δ phase on high temperature mechanical performances of Inconel 718 fabricated with SLM process. Materials Science and Engineering: A, 2019, 767, 138327. [Google Scholar] [CrossRef]
- Tucho, W.M. and V. Hansen, Studies of post-fabrication heat treatment of L-PBF-Inconel 718: effects of hold time on microstructure, annealing twins, and hardness. Metals 2021, 11, 266. [CrossRef]
- Li, X.; et al. Improved plasticity of Inconel 718 superalloy fabricated by selective laser melting through a novel heat treatment process. Materials & Design, 2019, 180, 107915. [Google Scholar]
- Chuang, T.-H.; et al. Effects of Annealing Twins on the Grain Growth and Mechanical Properties of Ag-8Au-3Pd Bonding Wires. Journal of Electronic Materials, 2012, 41, 3215–3222. [Google Scholar] [CrossRef]
- Li, C.; et al. The annealing twins of Fe-20Mn-4Al-0. 3C austenitic steels during symmetric and asymmetric hot rolling. Metals 2018, 8, 882. [Google Scholar]
- Tucho, W.M. , et al. Comparative Studies of Mechanical Properties and Microstructure of LPBF-Fabricated Virgin and Reused 316L Stainless Steel. Analytical and Experimental Methods in Mechanical and Civil Engineering, Cham: Springer Nature Switzerland. 2024. [Google Scholar]
- Radavich, J.F. , THE PHYSICAL METALLURGY OF CAST AND WROUGHT ALLOY 718. Superalloys, 2004: p. 229-240.
- Paulonis, D.F., J. M. Oblak, and D.S. Duvall, Pricipitation in Nickel-base alooy 718. 1969: Defense Technical Information Center.
- Hong, S.J., W.P. Chen, and T.W. Wang, A diffraction study of the γ″ phase in Inconel 718 superalloy. Metallurgical and Materials Transactions A, 2001, 32, 1887–1901. [CrossRef]
- Nunes, R.M.; et al. Delta Phase Characterization in Inconel 718 Alloys Through X-ray Diffraction. Isij International, 2015, 55, 2450–2454. [Google Scholar] [CrossRef]
- Nikolic, D.N. , et al. Correlation between crystal orientation and morphology of electrolytically produced powder particles: Analysis of the limiting cases, 2018. [Google Scholar]
- Hansen, N. , Hall–Petch relation and boundary strengthening. Scripta materialia, 2004, 51, 801–806. [Google Scholar] [CrossRef]
- Yadroitsev, I.; et al. Strategy of manufacturing components with designed internal structure by selective laser melting of metallic powder. Applied Surface Science, 2007, 254, 980–983. [Google Scholar] [CrossRef]
- Mertens, A.; et al. Mechanical properties of alloy Ti-6Al-4V and of stainless steel 316L processed by Selective Laser Melting: Influence of out-of-equilibrium microstructures. Powder Metallurgy, 2014, 57, 184–189. [Google Scholar] [CrossRef]
- Röttger, A.; et al. Microstructure and mechanical properties of 316L austenitic stainless steel processed by different SLM devices. The International Journal of Advanced Manufacturing Technology, 2020, 108, 769–783. [Google Scholar] [CrossRef]
- Neikter, M.; et al. Tailored ductility and strength for enhanced impact toughness of laser powder fusion built Alloy 718. Journal of Alloys and Compounds, 2021, 884, 161374. [Google Scholar] [CrossRef]
- Zhu, Q.; et al. Effect of the δ Phase on the Tensile Properties of a Nickel-Based Superalloy. Metals, 2019, 9, 1153. [Google Scholar] [CrossRef]
- Yu, X.; et al. Influence of post-heat-treatment on the microstructure and fracture toughness properties of Inconel 718 fabricated with laser directed energy deposition additive manufacturing. Materials Science and Engineering: A, 2020, 798, 140092. [Google Scholar] [CrossRef]
- Li, P.; et al. Effect of post-heat treatment on the microstructure and mechanical properties of laser metal deposition Inconel 718. Journal of Mechanical Science and Technology, 2021, 35, 2871–2878. [Google Scholar] [CrossRef]
- Sreekanth, S.; et al. Effect of process parameters and heat treatments on delta-phase precipitation in directed energy deposited alloy 718. Welding in the World, 2022, 66, 863–877. [Google Scholar] [CrossRef]
- Schneider, M.; et al. Analysis of strengthening due to grain boundaries and annealing twin boundaries in the CrCoNi medium-entropy alloy. International Journal of Plasticity, 2020, 124, 155–169. [Google Scholar] [CrossRef]
- Liu, G.S.; et al. Electron tomography of dislocation structures. Materials Characterization, 2014, 87, 1–11. [Google Scholar] [CrossRef]
- Wang, J. and X. Zhang, Twinning effects on strength and plasticity of metallic materials. Mrs Bulletin, 2016, 41, 274–281. [Google Scholar]
- Lim, L., C. and R. Raj, INTERACTION BETWEEN LATTICE AND GRAIN BOUNDARY DISLOCATIONS AND THEIR ROLE IN MECHANICAL PROPERTIES OF INTERFACES. J. Phys. Colloques, 1985; 46, C4-58–C4-595.
- Neogi, A. and R. Janisch, Twin-boundary assisted crack tip plasticity and toughening in lamellar γ-TiAl. Acta Materialia 2021, 213, 116924. [CrossRef]
- Liu, L.; et al. Atomistic observation of a crack tip approaching coherent twin boundaries. Scientific Reports, 2014, 4, 4397. [Google Scholar] [CrossRef] [PubMed]
- Kim, S.-W.; et al. In situ observations of crack arrest and bridging by nanoscale twins in copper thin films. Acta Materialia, 2012, 60, 2959–2972. [Google Scholar] [CrossRef]
Figure 1.
Schematics of heat treatment regimes of S980 and S1100.
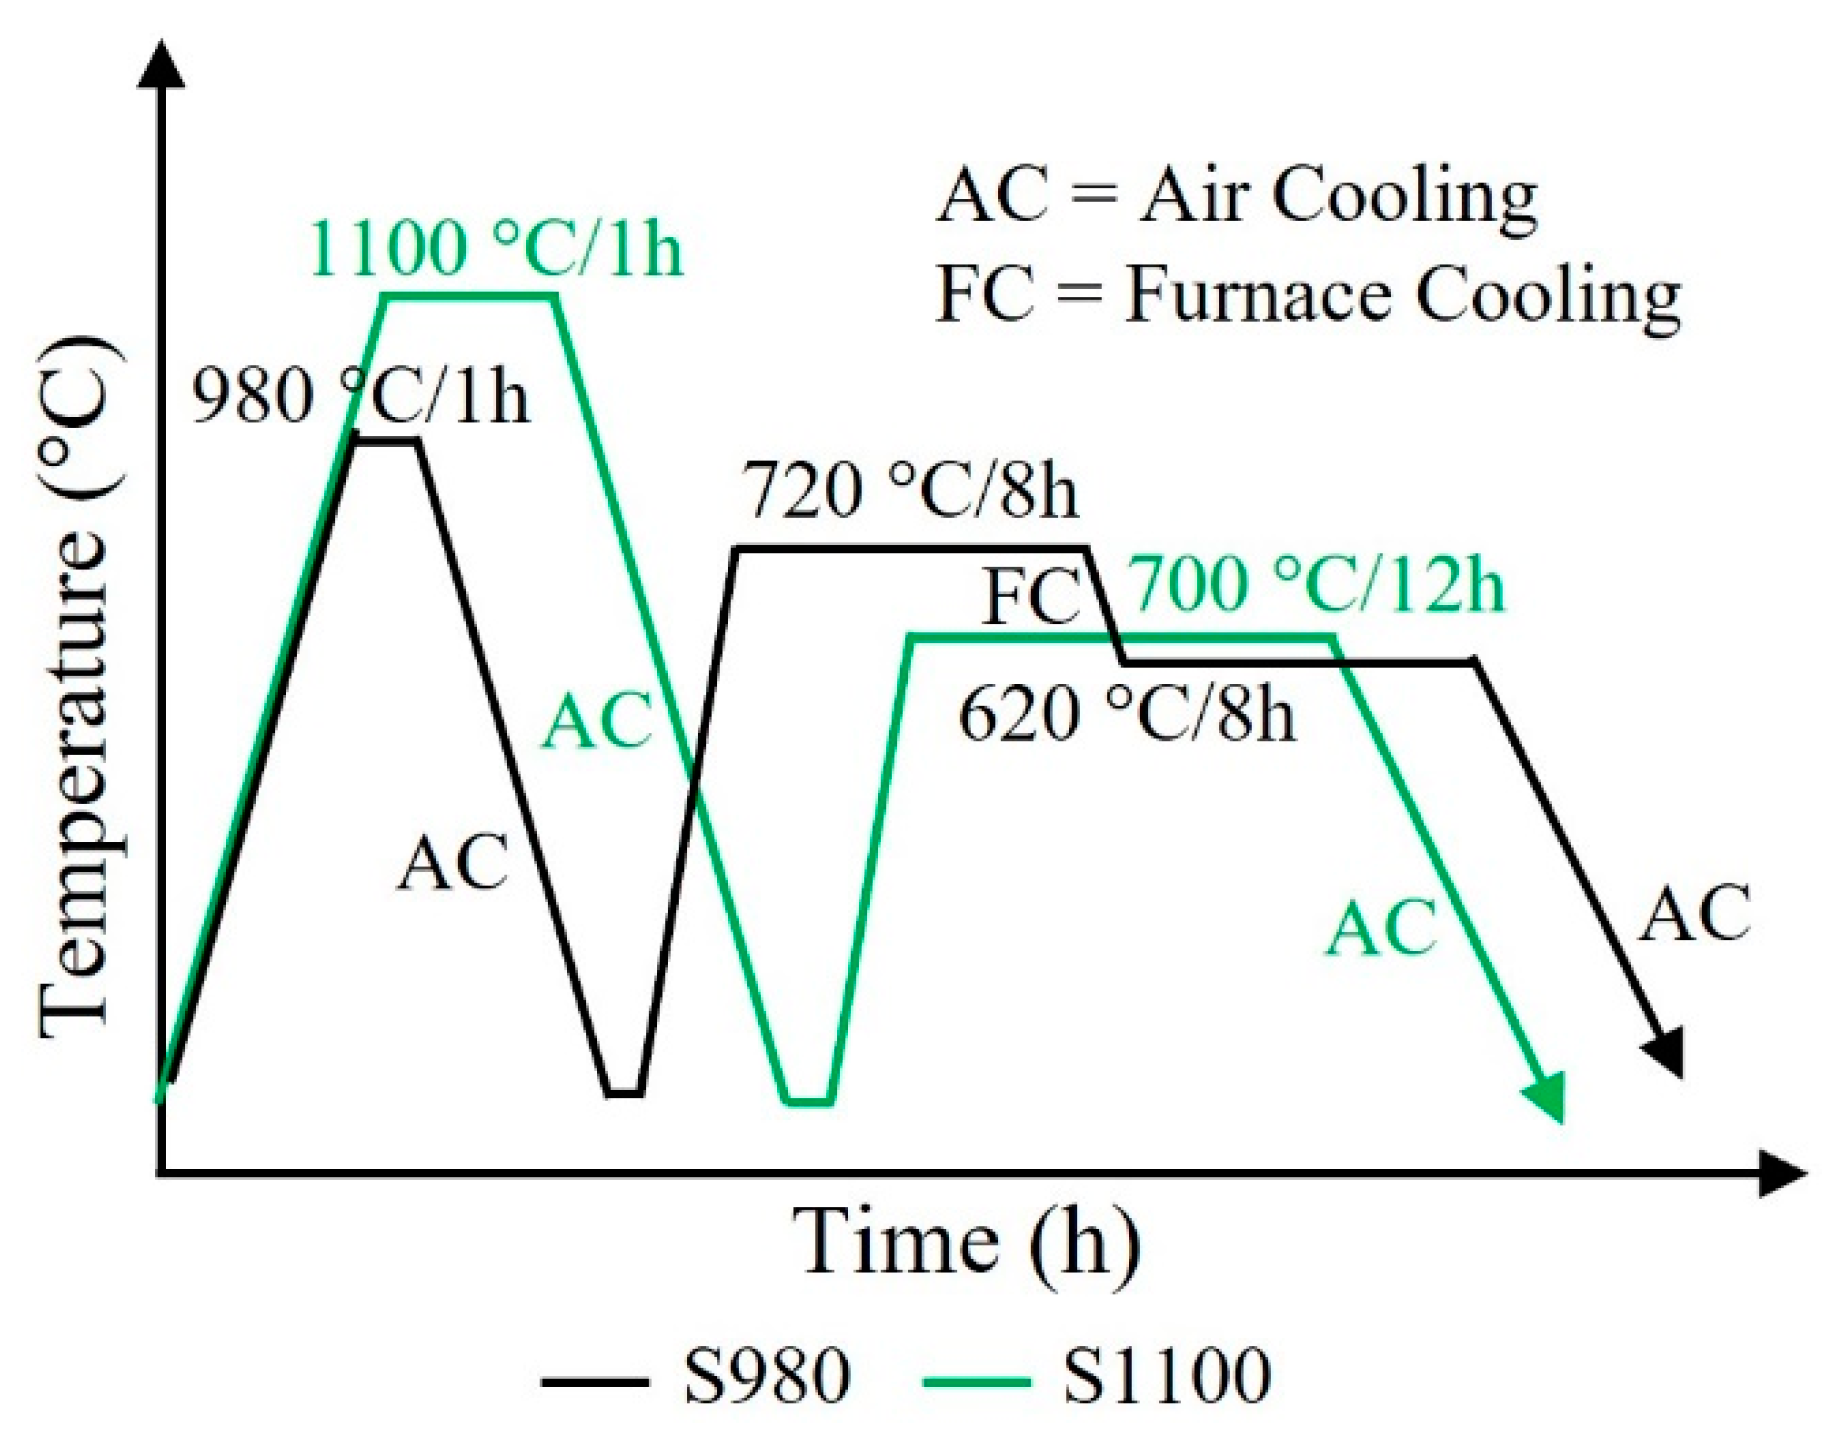
Figure 2.
Optical microscopy images of S980 etched with Oxalic 10%, 5V for 10 s (a) normal (parallel to the scan plane) (b) and parallel (normal to the scan plane) to the BD. The yellow curvatures in (b) show some of the fusion lines that persisted after the ST at 980°C for 1 h. In (a) the scan tracks are also seen clearly. (c) shows the recrystallized microstructure of S1100.
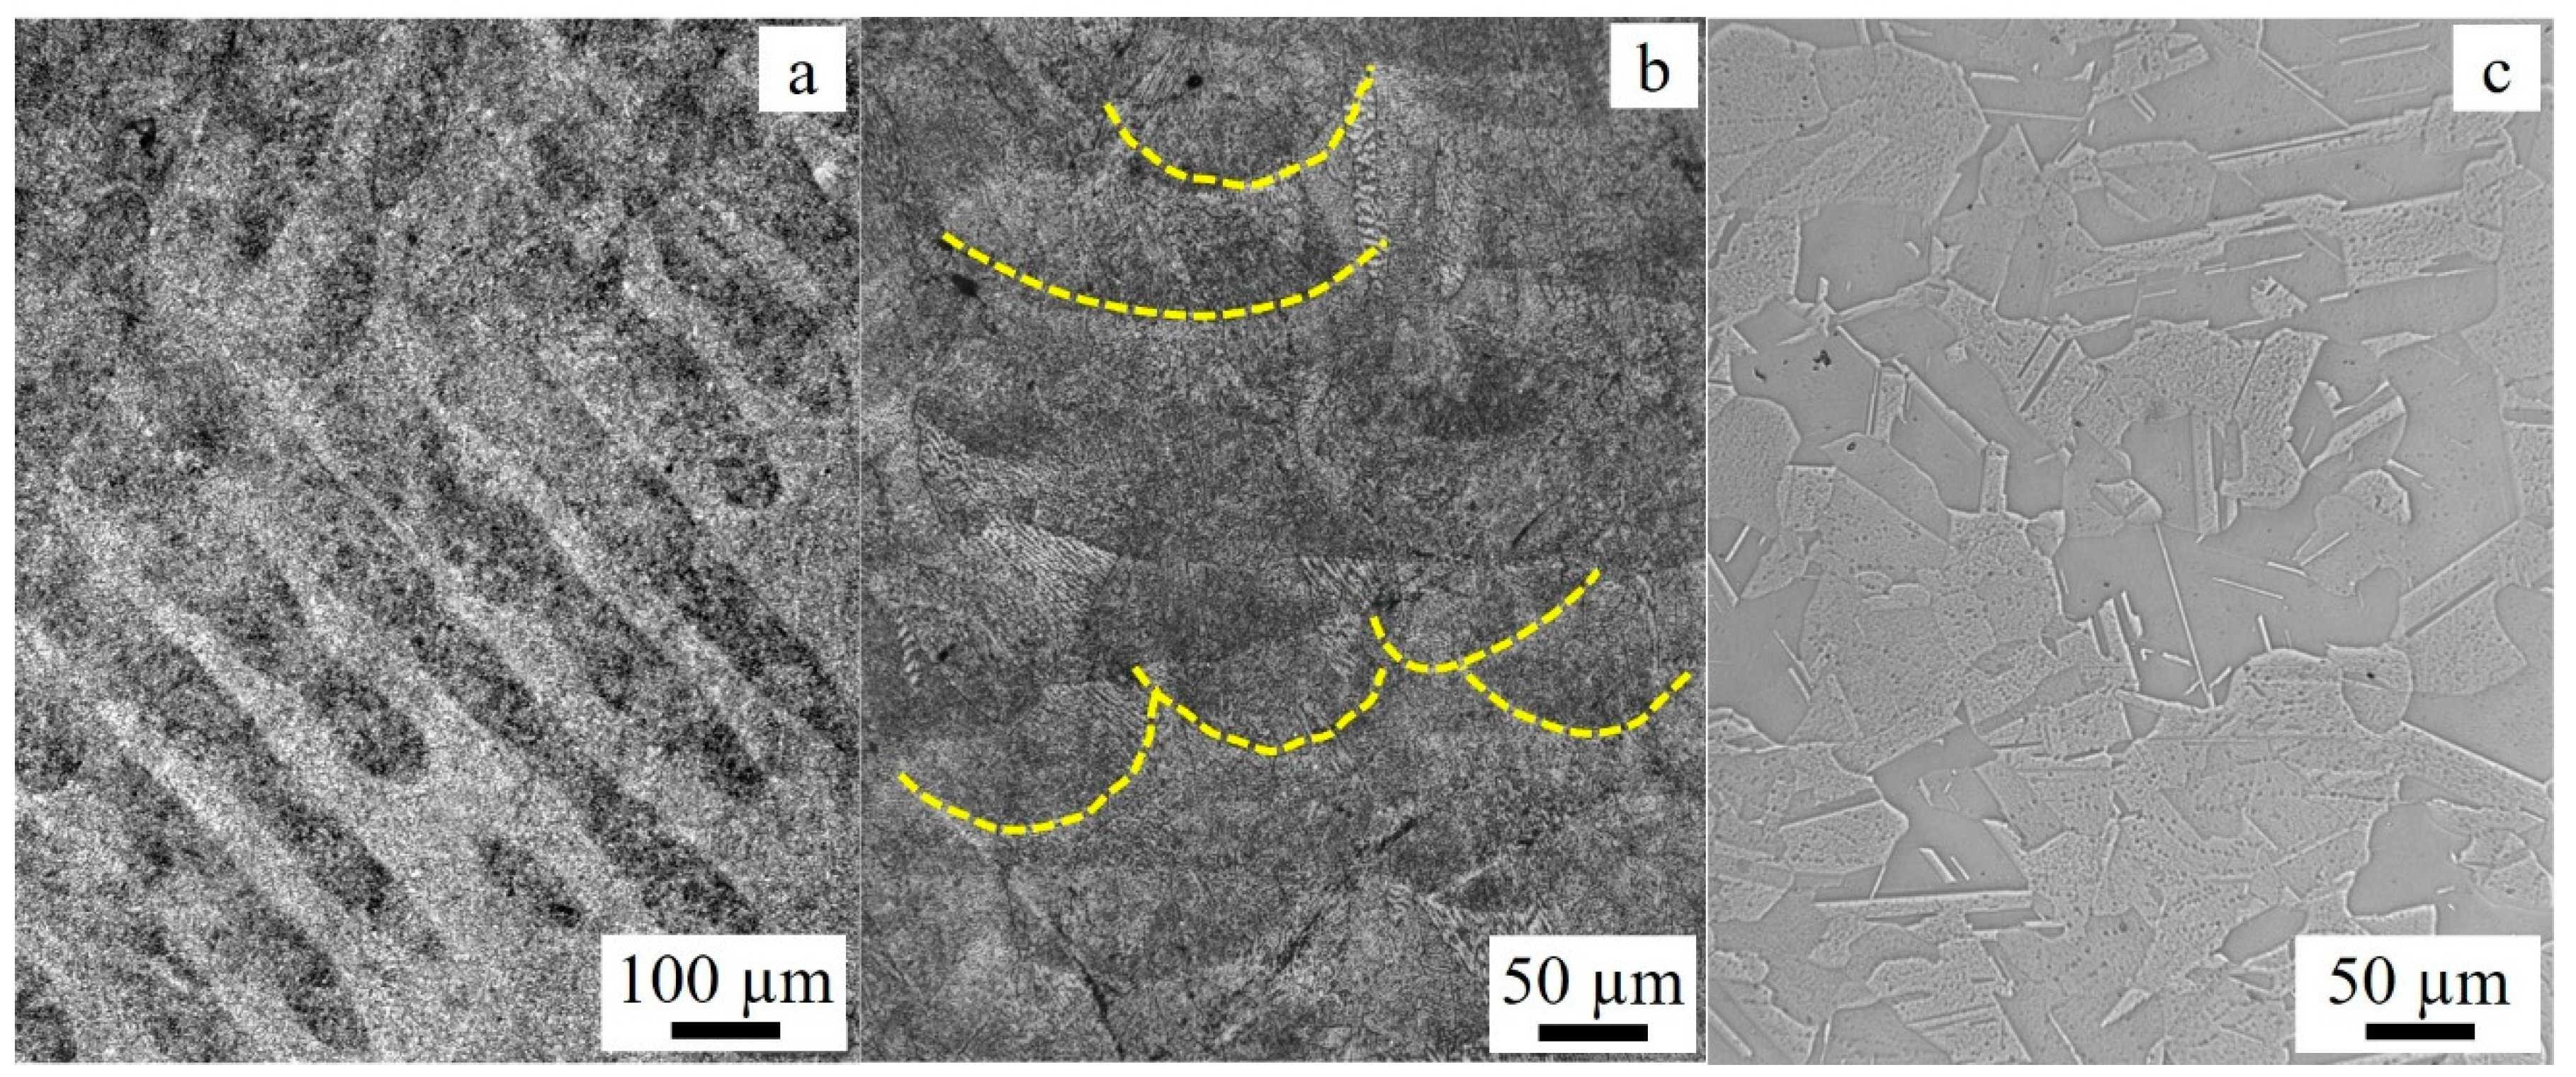
Figure 3.
Microstructure of S980: (a) & (b) unetched, and (c) & (d) etched with Oxalic 10%, 5V, 10-20 s to reveal the morphology of the δ phase. The white arrow in (b) is pointing to a grain boundary, whereas the yellow arrows are indicating subgrain boundaries. Most of the large precipitates seen along the grain boundaries in (a) and (c) are Laves.
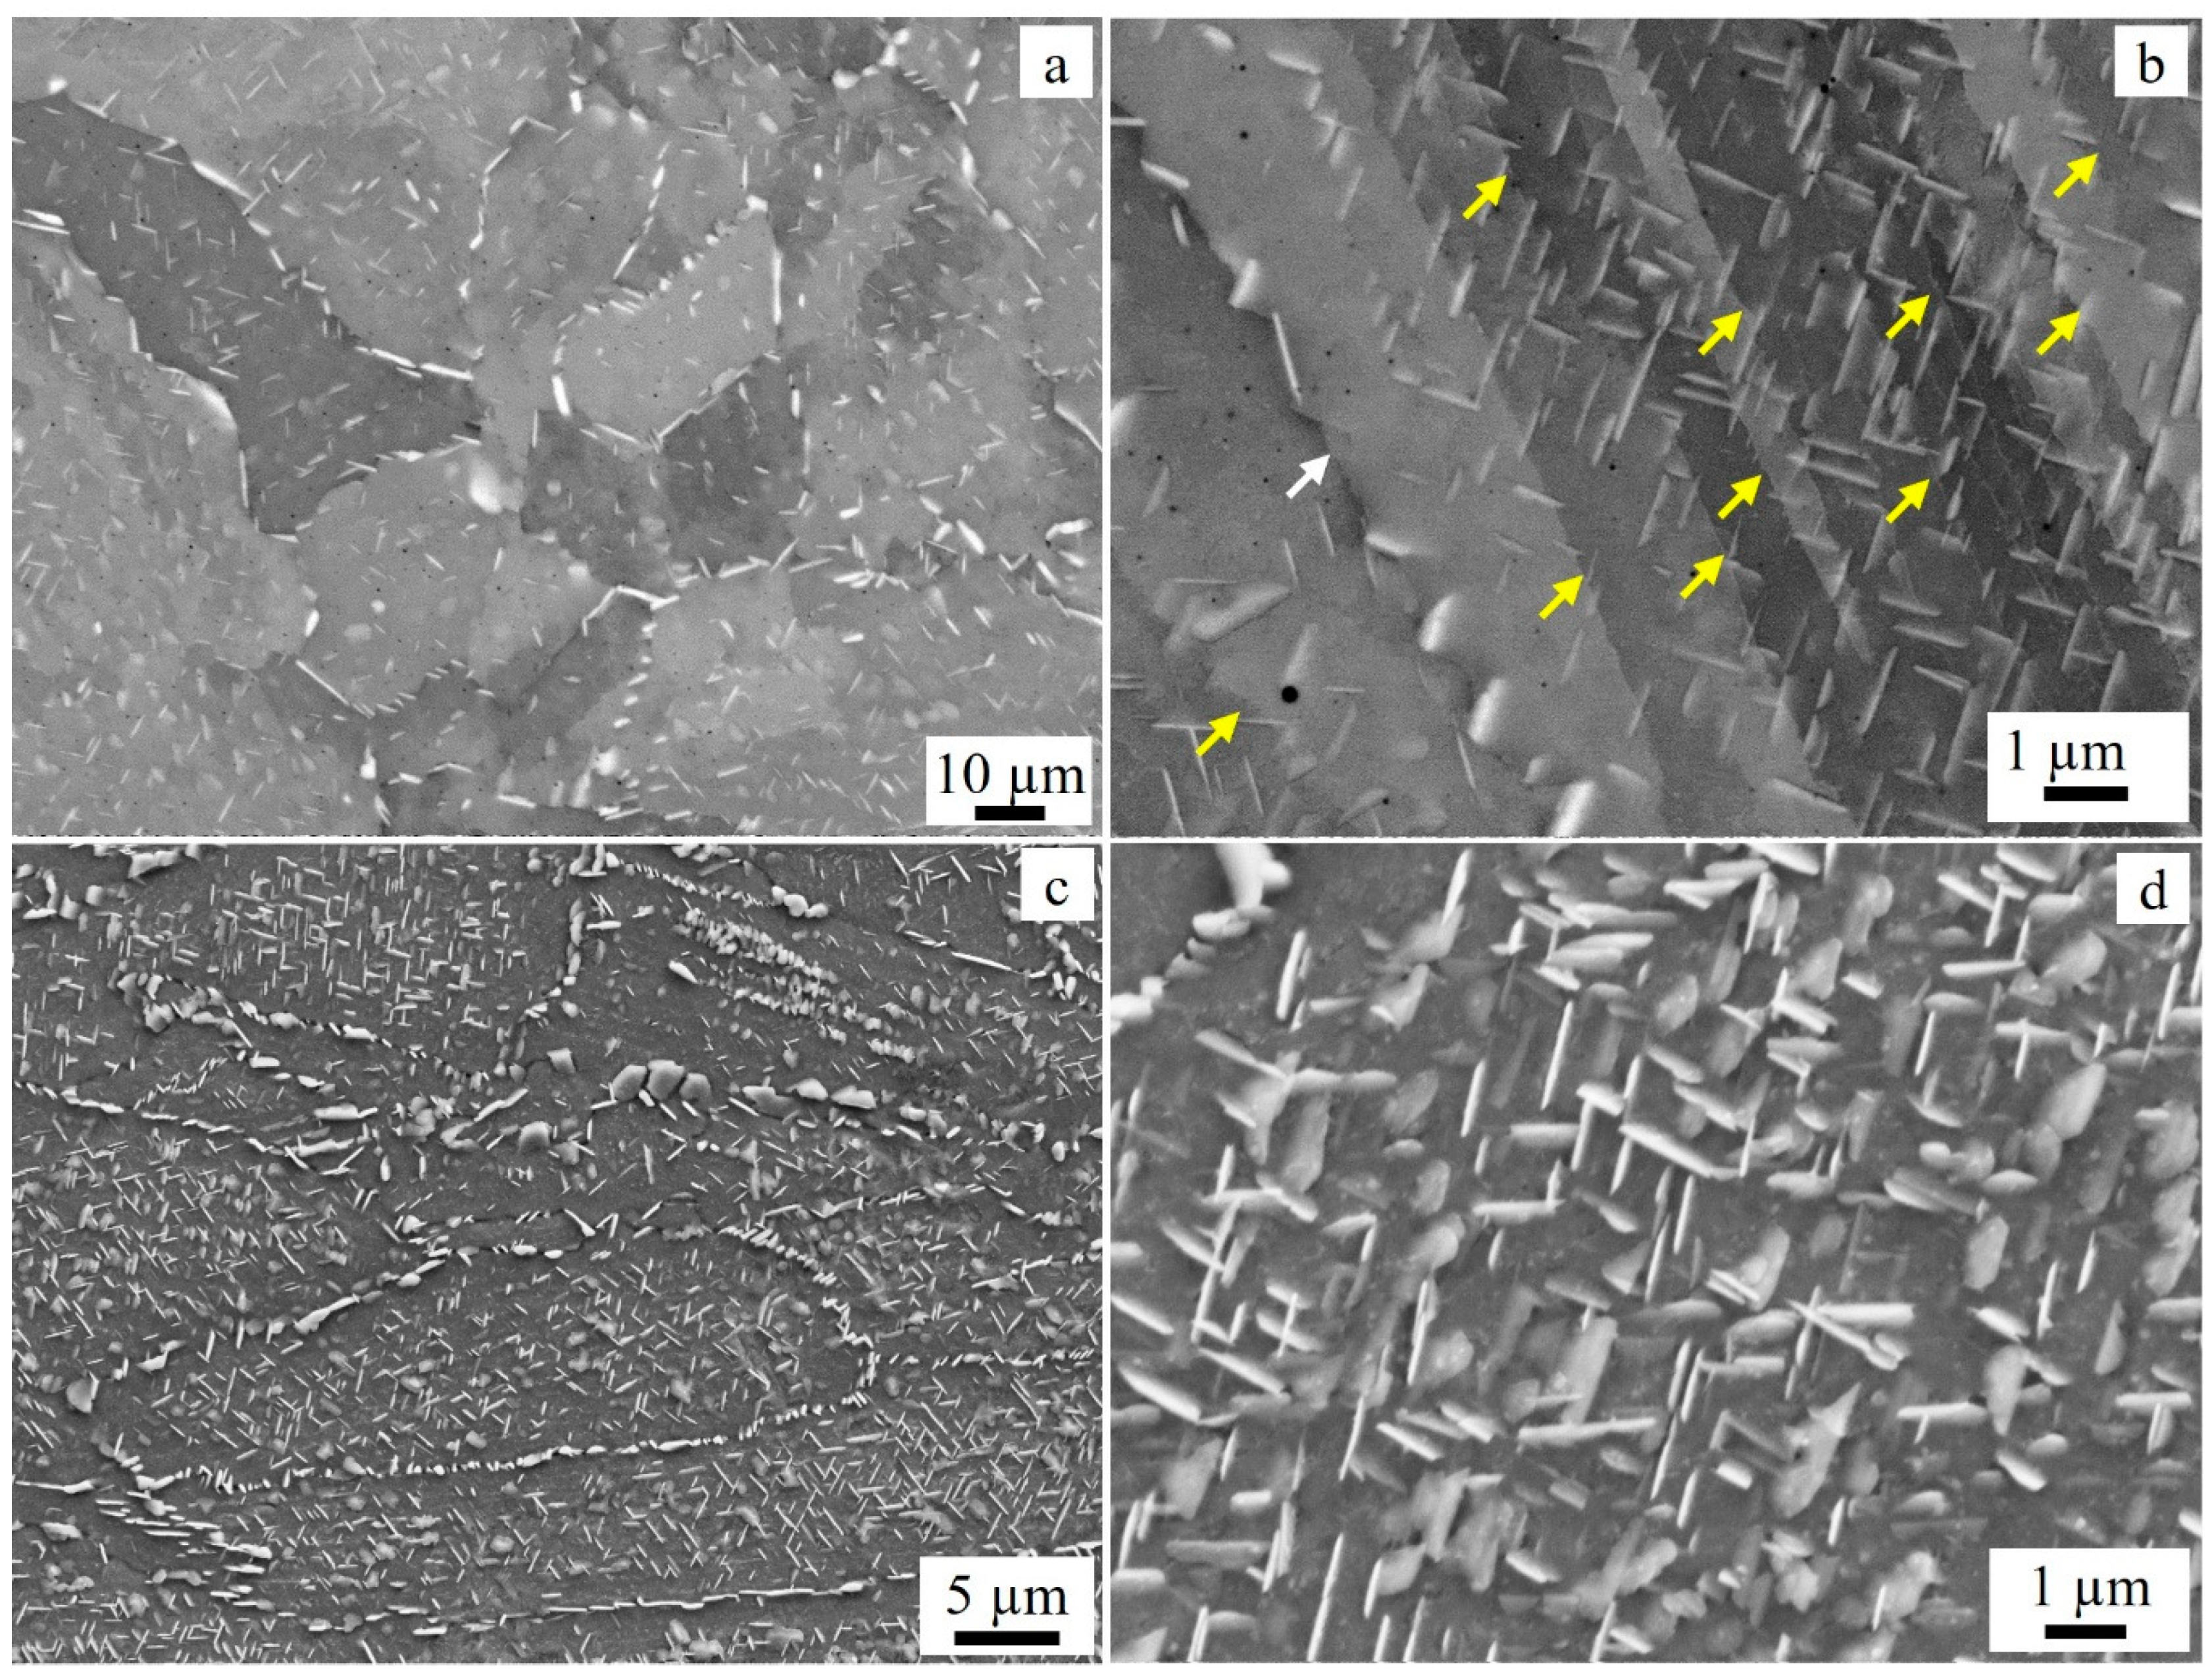
Figure 4.
(a) SEM images of an etched S980 sample showing microcracks along the grain boundaries. (b) is a high magnification image from the marked region in (a). The yellow arrows in (a) point to the microcracks.
Figure 4.
(a) SEM images of an etched S980 sample showing microcracks along the grain boundaries. (b) is a high magnification image from the marked region in (a). The yellow arrows in (a) point to the microcracks.
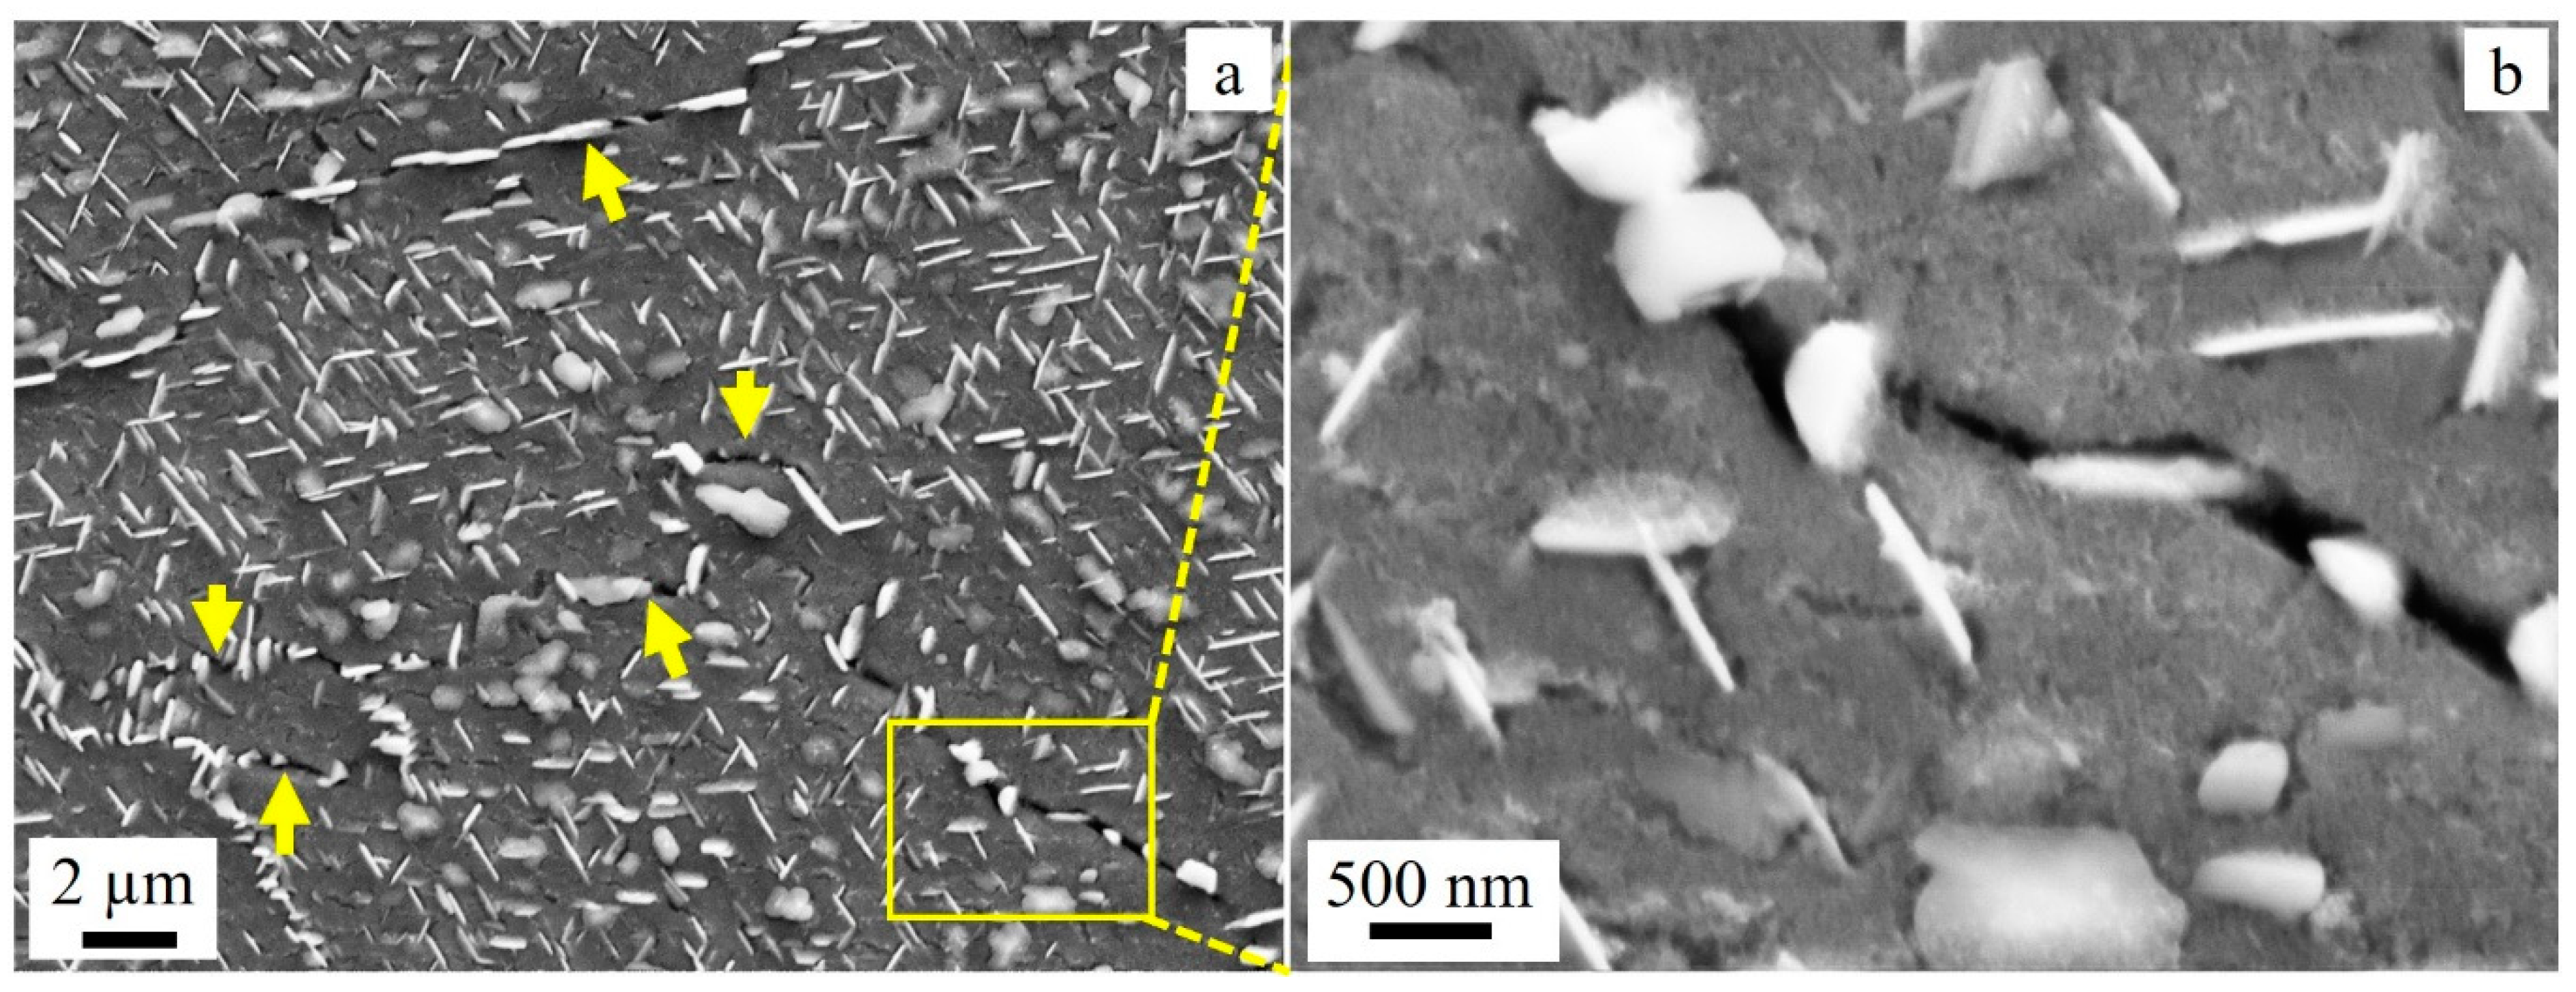
Figure 5.
TEM bright field images showing precipitation of δ phase across (a) cellular and (b) columnar subgrain boundaries.
Figure 5.
TEM bright field images showing precipitation of δ phase across (a) cellular and (b) columnar subgrain boundaries.
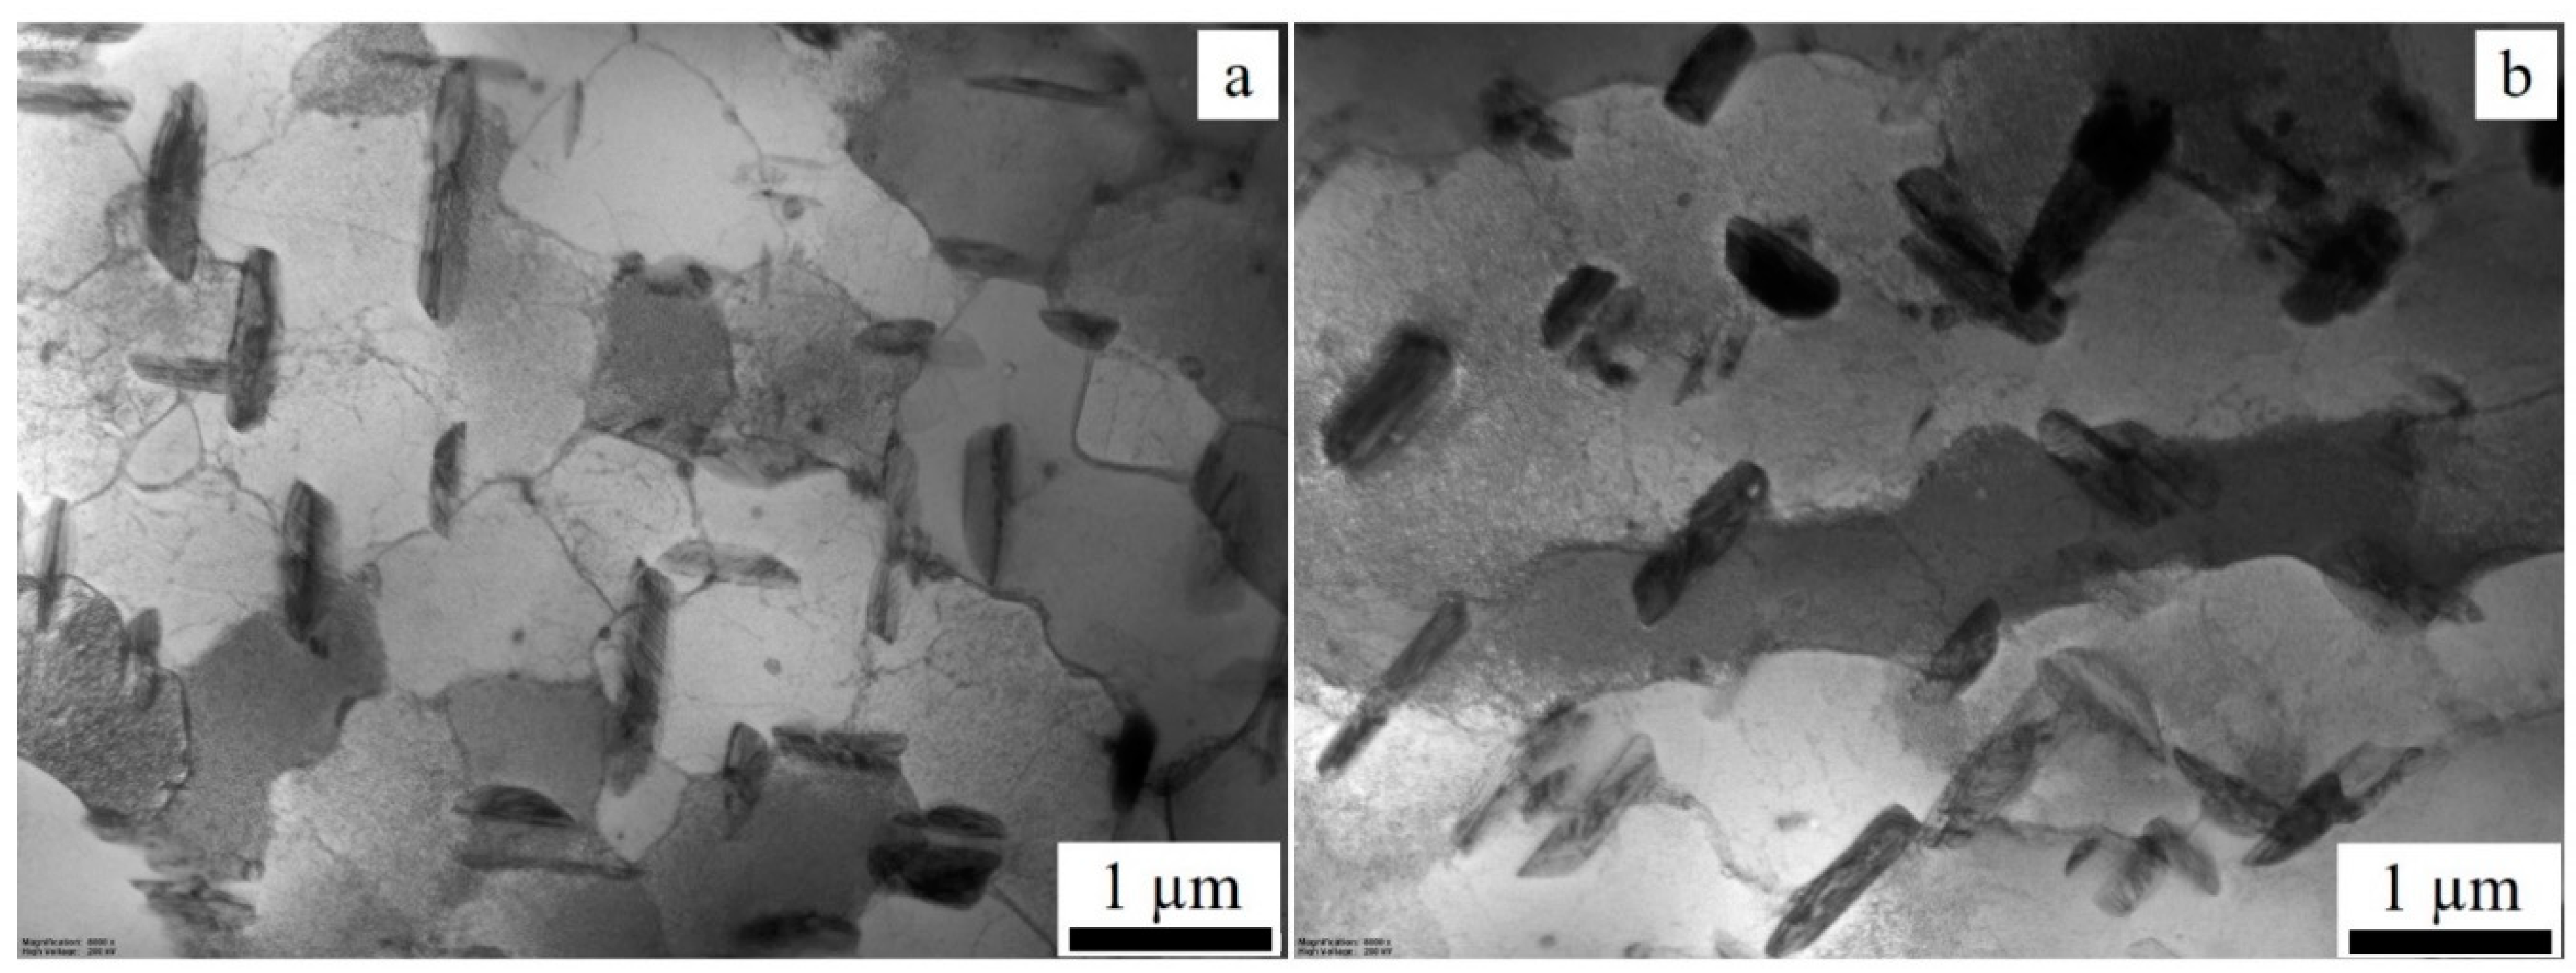
Figure 6.
EBSD quality images (1.2 x 1.2 mm) of specimens oriented parallel to the BD (a) ST at 980°C/1h and (b) ST at 1100°C/3h showing grain boundaries (black lines) and twin boundaries (red lines).
Figure 6.
EBSD quality images (1.2 x 1.2 mm) of specimens oriented parallel to the BD (a) ST at 980°C/1h and (b) ST at 1100°C/3h showing grain boundaries (black lines) and twin boundaries (red lines).
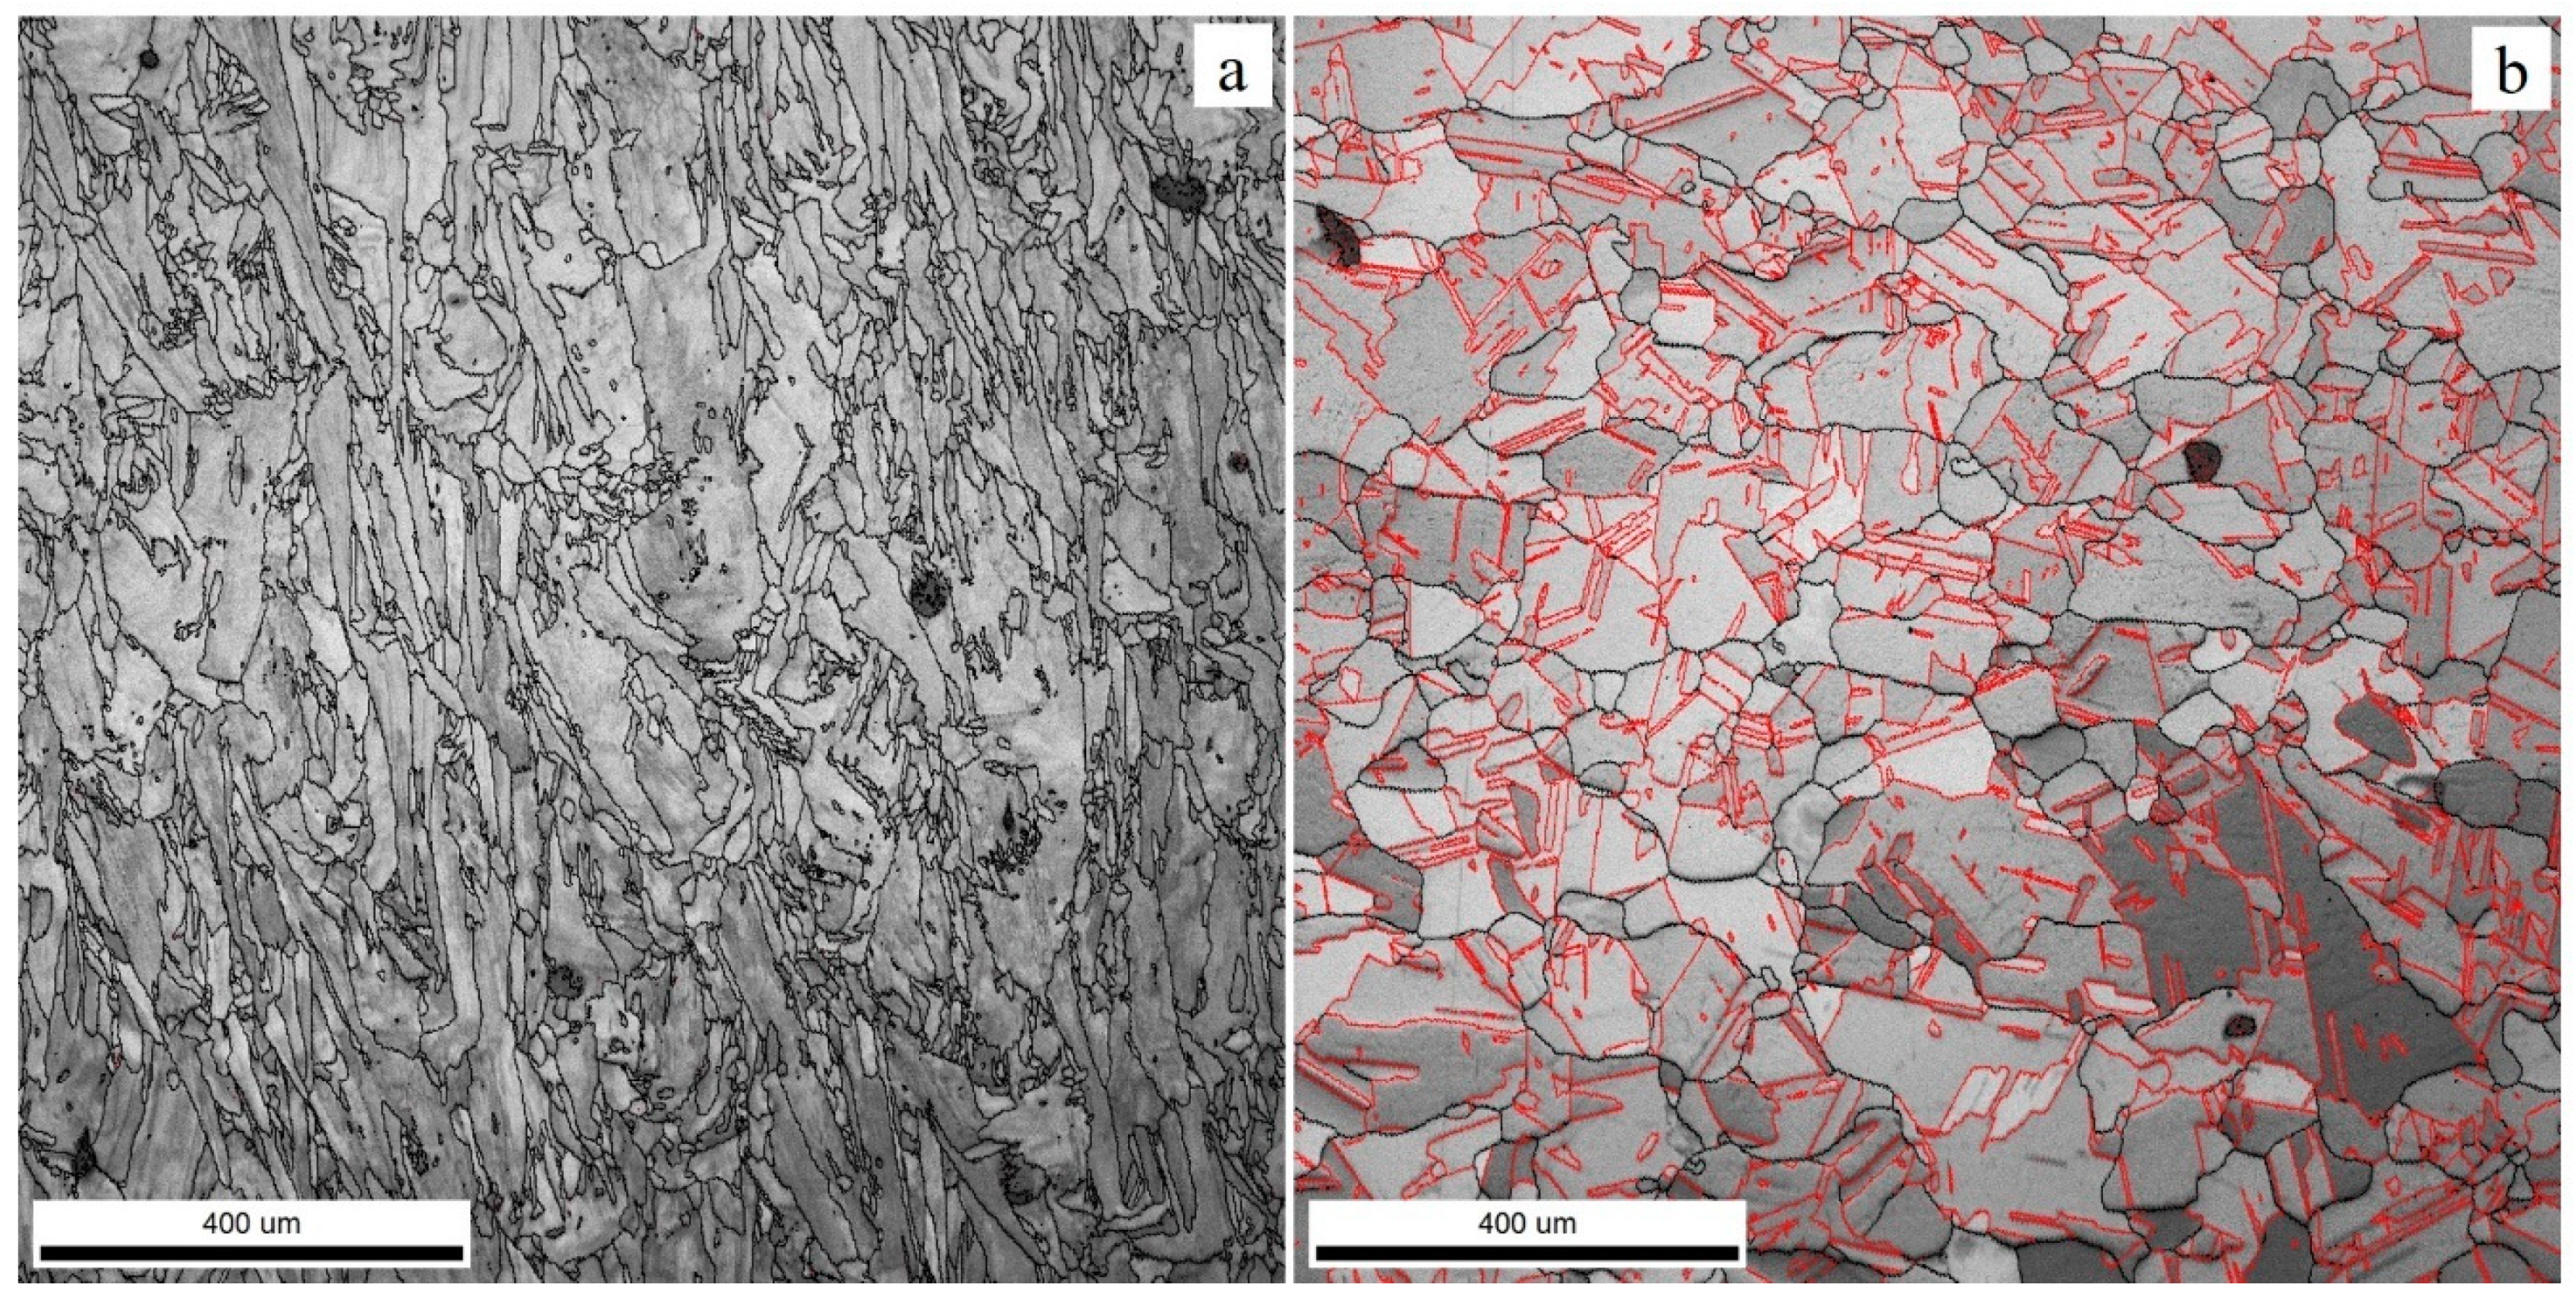
Figure 7.
TEM images showing (a) δ phase in the FCC-matrix in <110> orientation (b) diffraction pattern of the γ matrix in [110] orientation with superlattice reflections corresponding to different variants of the δ phase and γ′′ phase. Examples of spots from reflections of the γ′′ phase are marked by yellow circles. (c) A variant of the δ phase in the FCC-matrix in [001] orientation. A spot marked with a white circle is a reflection from the variant in the inset SADP, parallel with {110}γ′′. (d) image of γ′′ precipitates from (002) γ′′, whose orientation relationship is <100>γ//<100>γ′′. The dark field image was obtained mainly from the reflection of the marked spot in the inset SADP in (c).
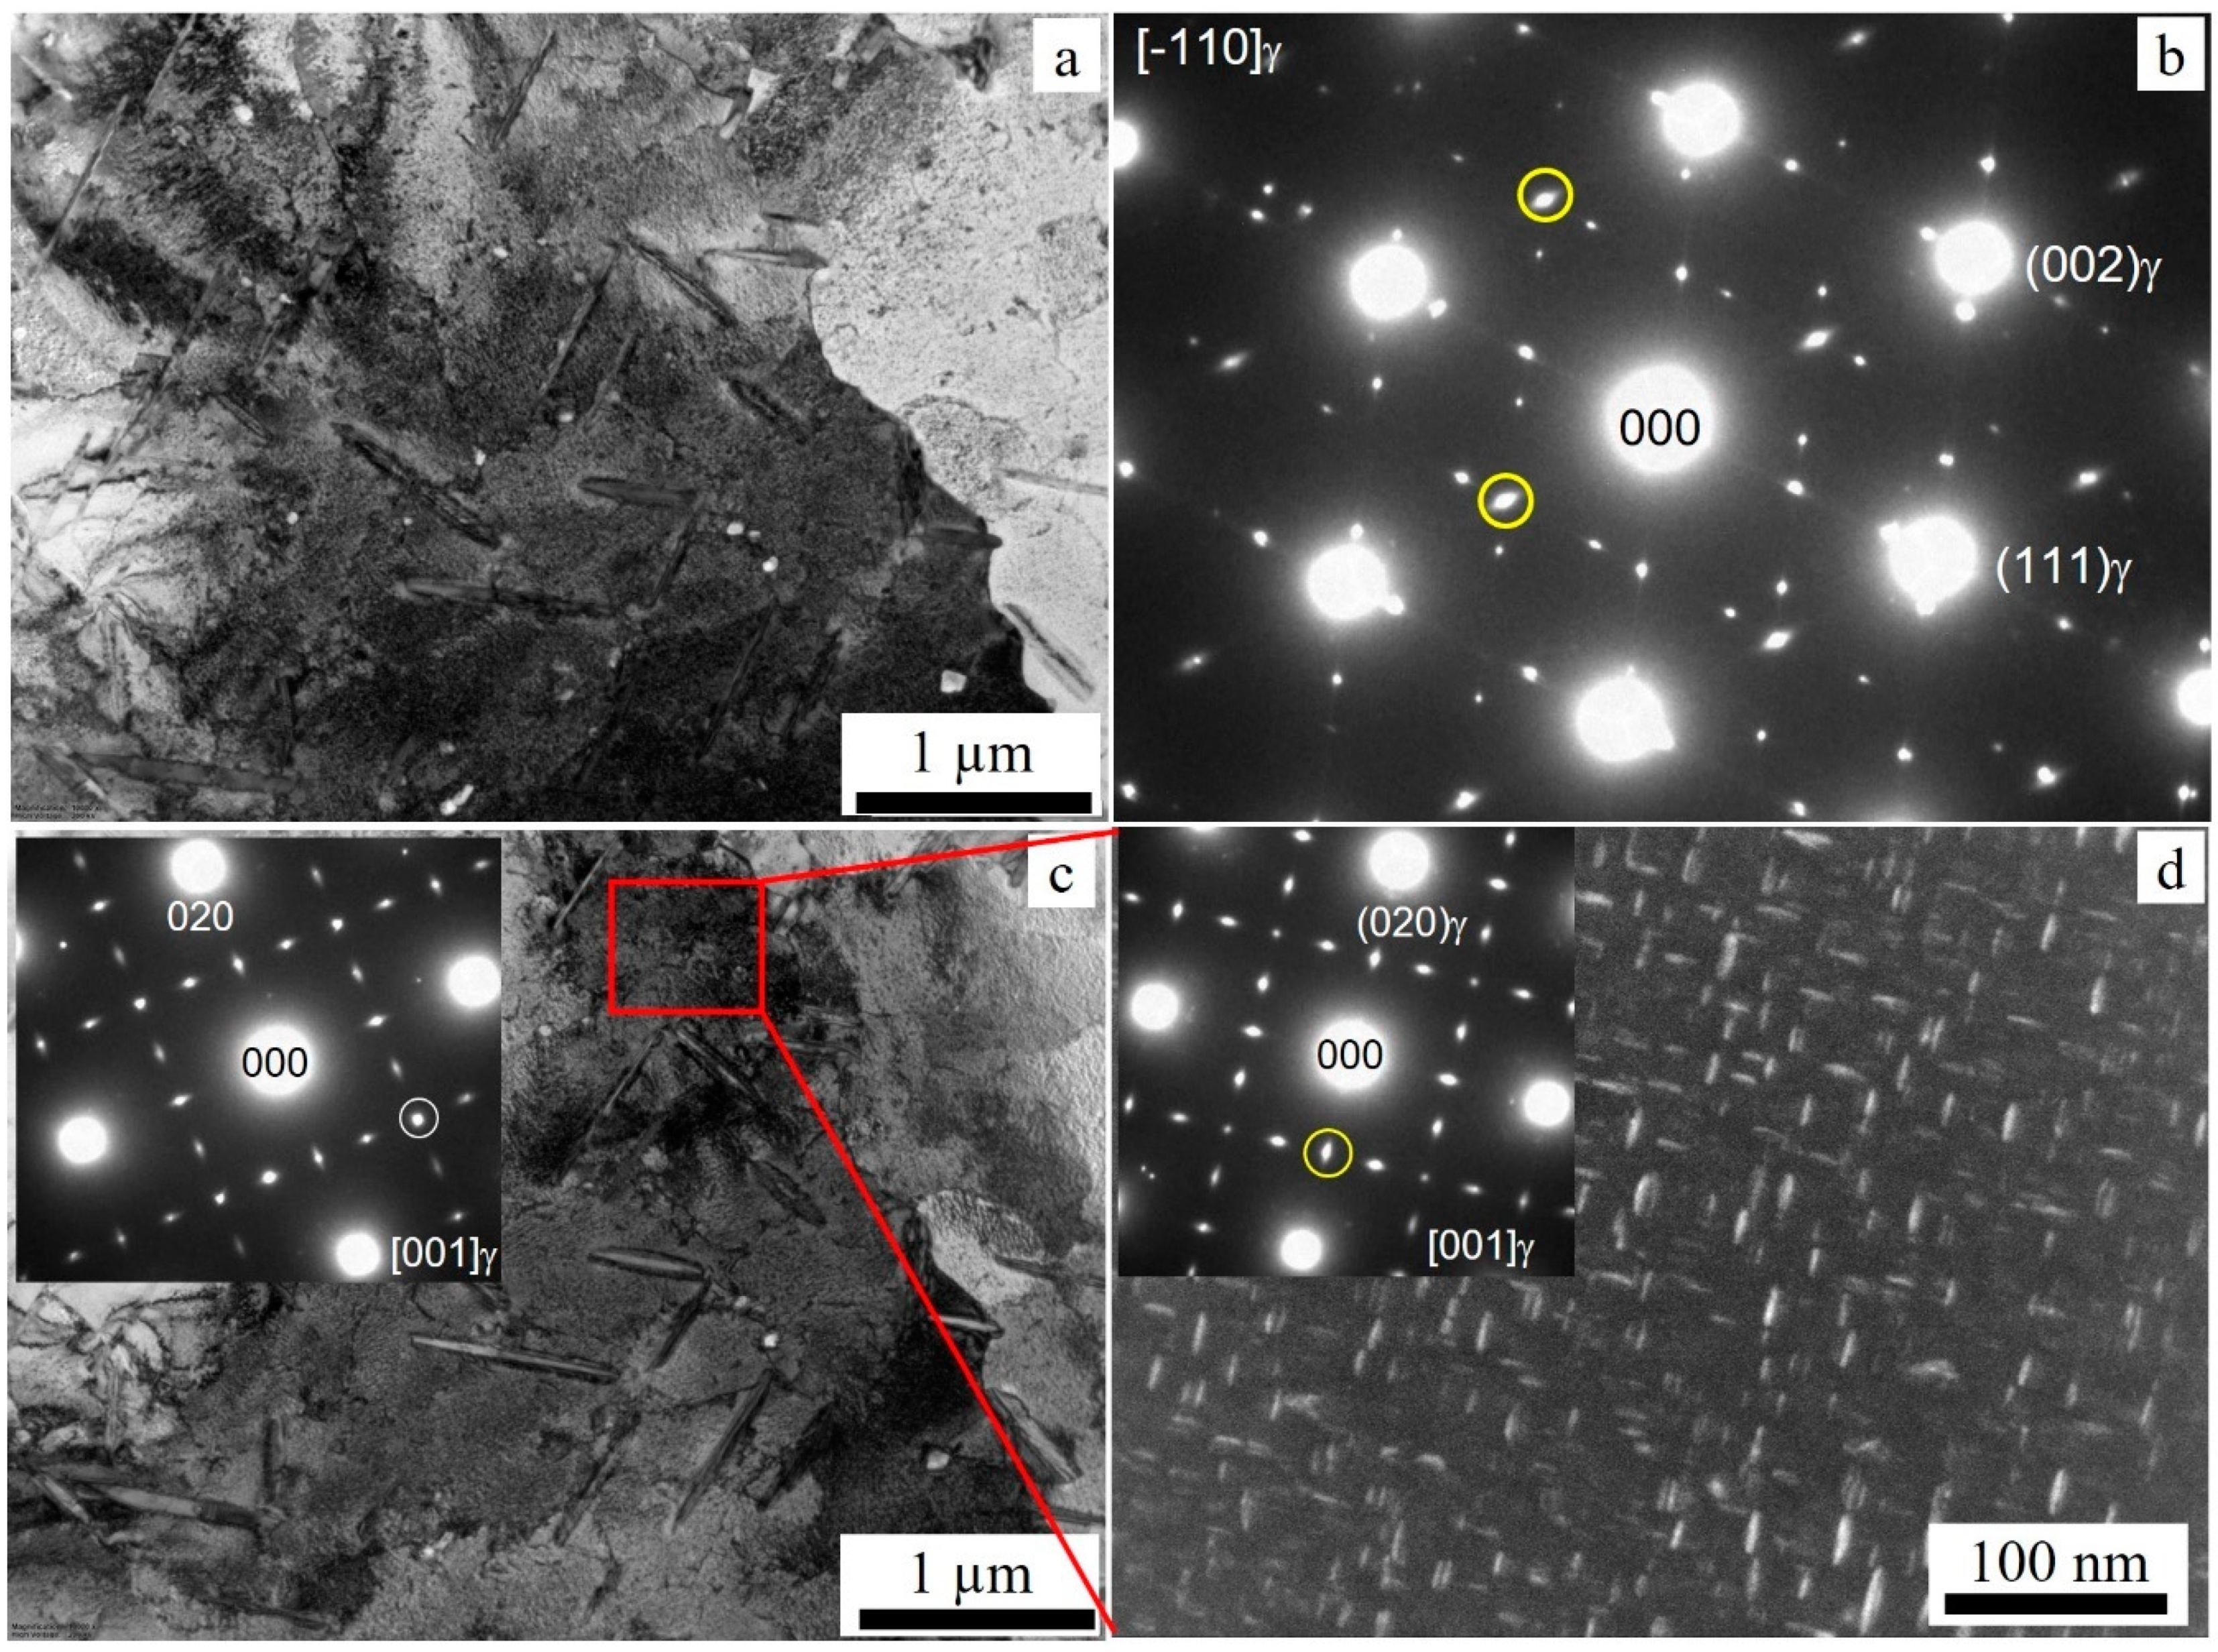
Figure 8.
X-ray diffractograms of (a) S980, (b) magnified view of (a) between 2θ of 37 and 55° (c) S1100 and (d) magnified view of (c) between 2θ of 37 and 55°.
Figure 8.
X-ray diffractograms of (a) S980, (b) magnified view of (a) between 2θ of 37 and 55° (c) S1100 and (d) magnified view of (c) between 2θ of 37 and 55°.
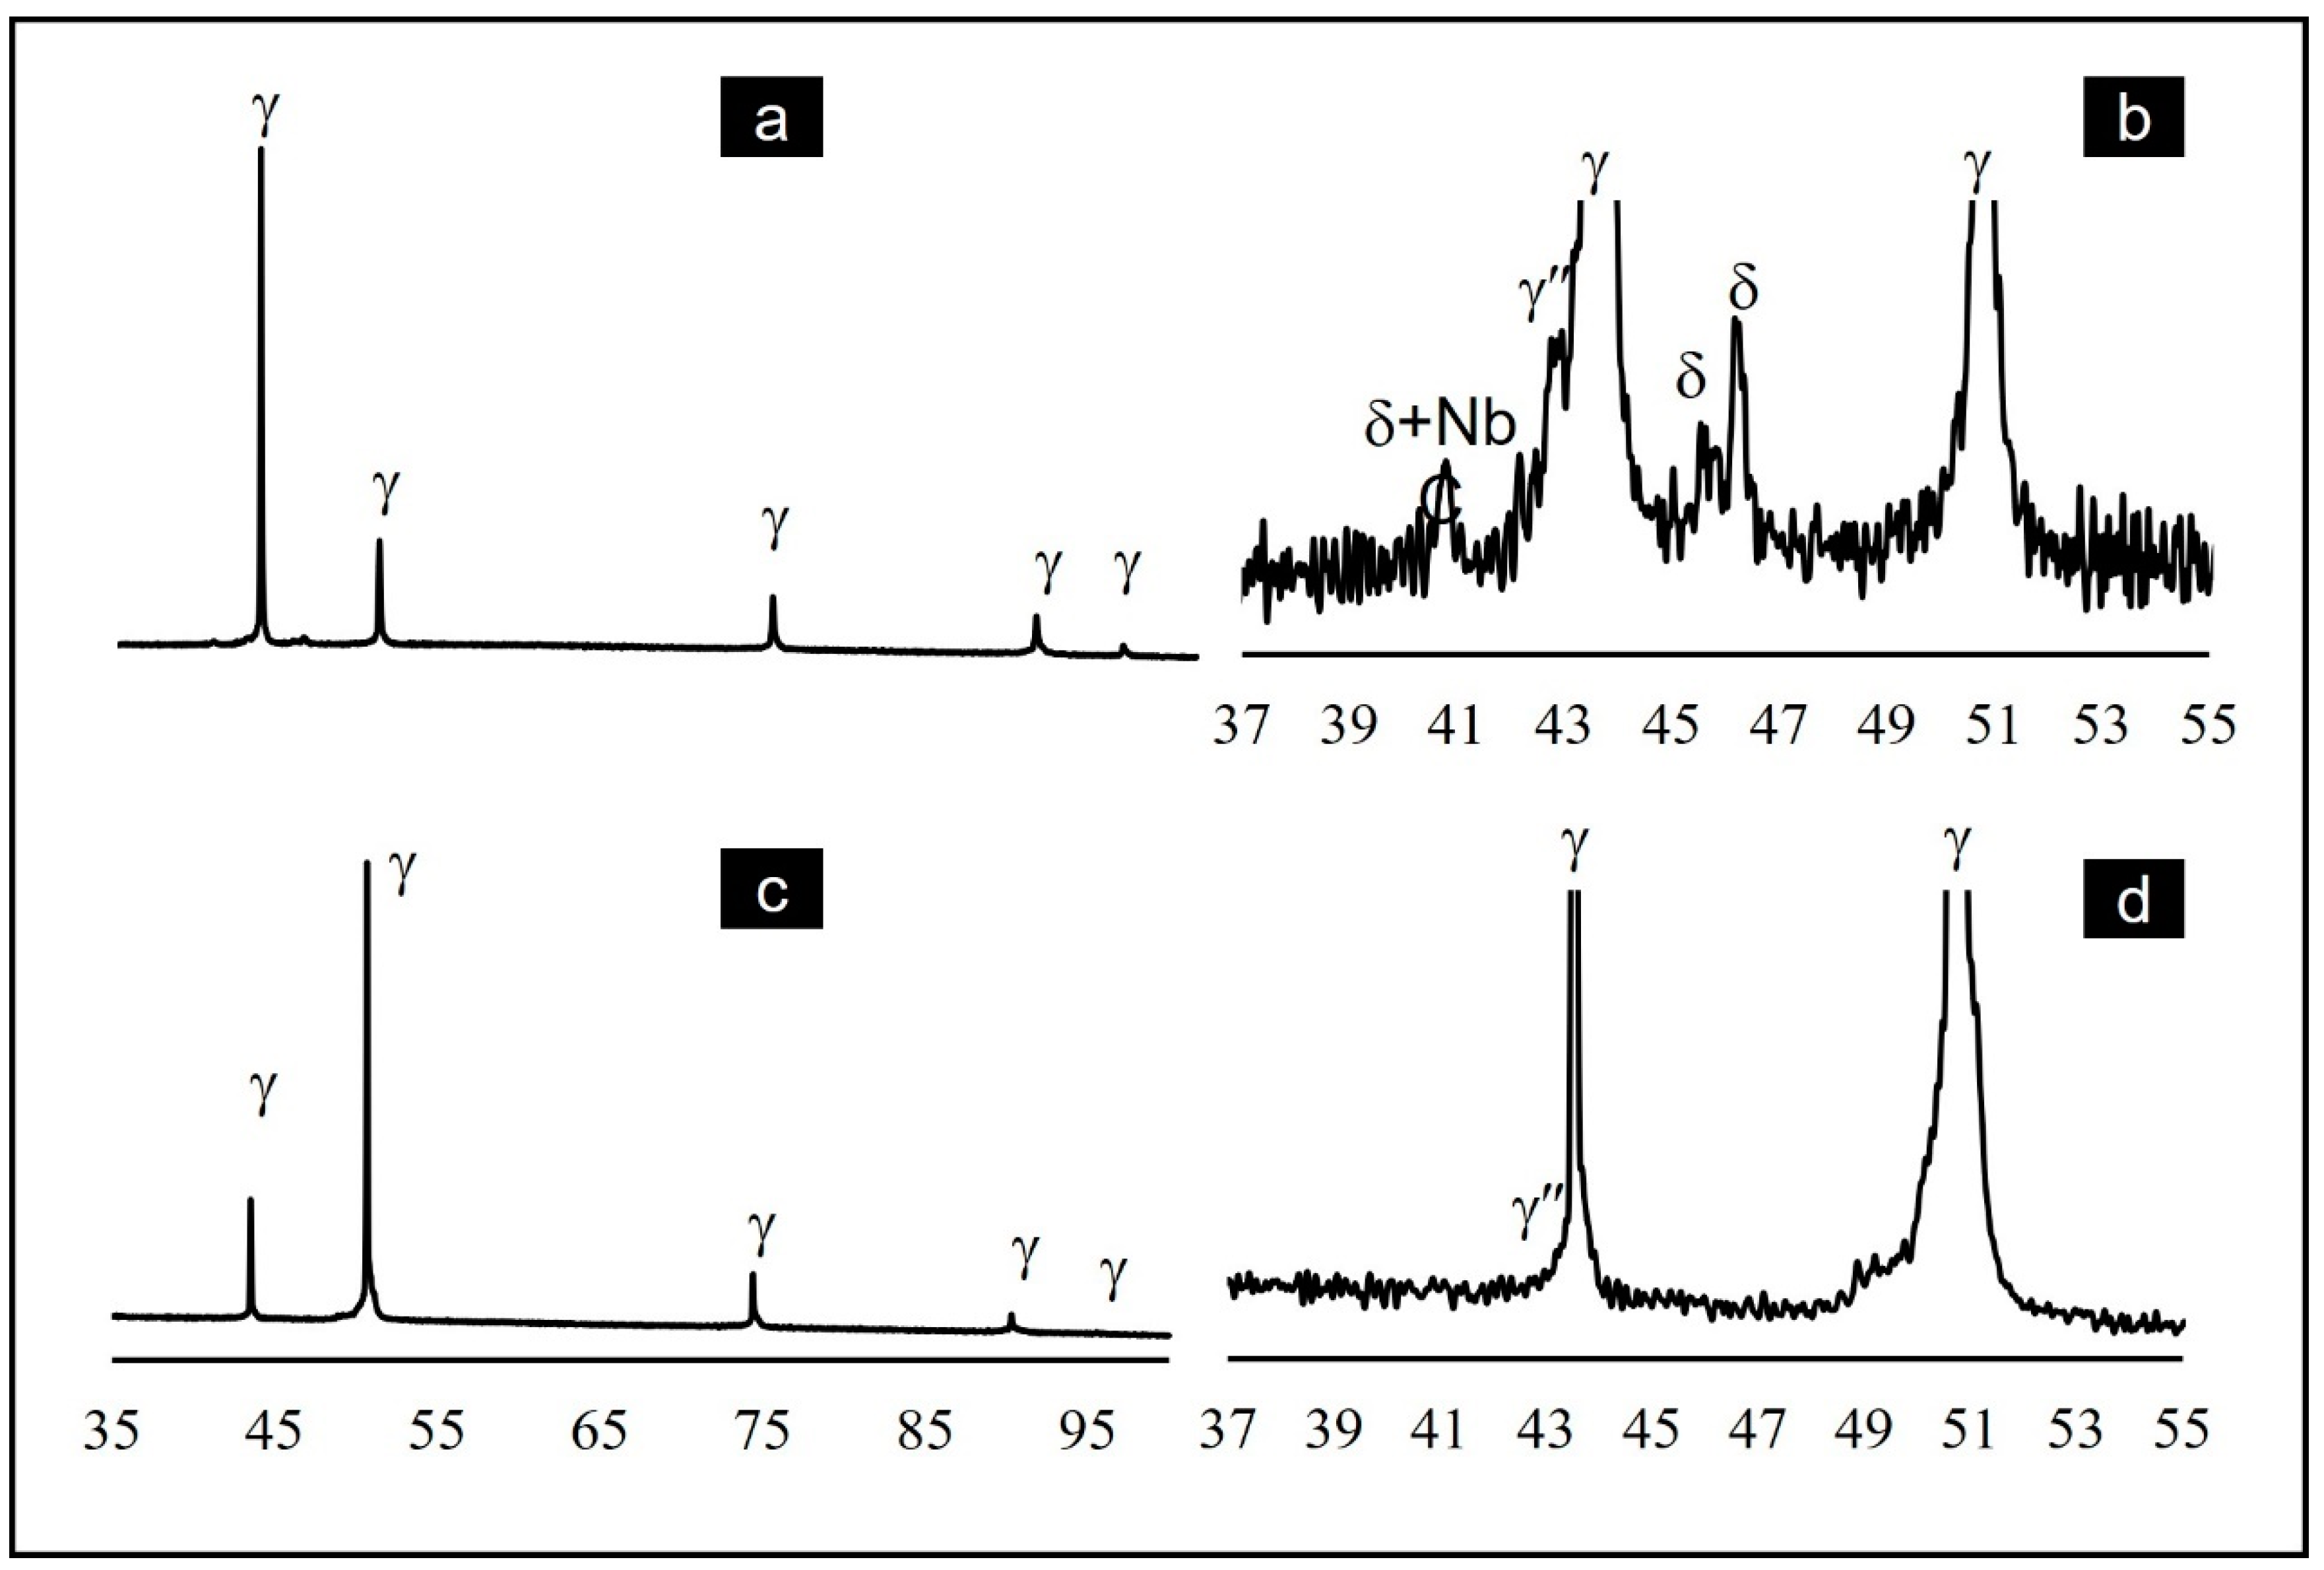
Figure 9.
Hardness measurement on three different surfaces, normal (S1) and parallel (S2 and S3) to the BD.
Figure 9.
Hardness measurement on three different surfaces, normal (S1) and parallel (S2 and S3) to the BD.
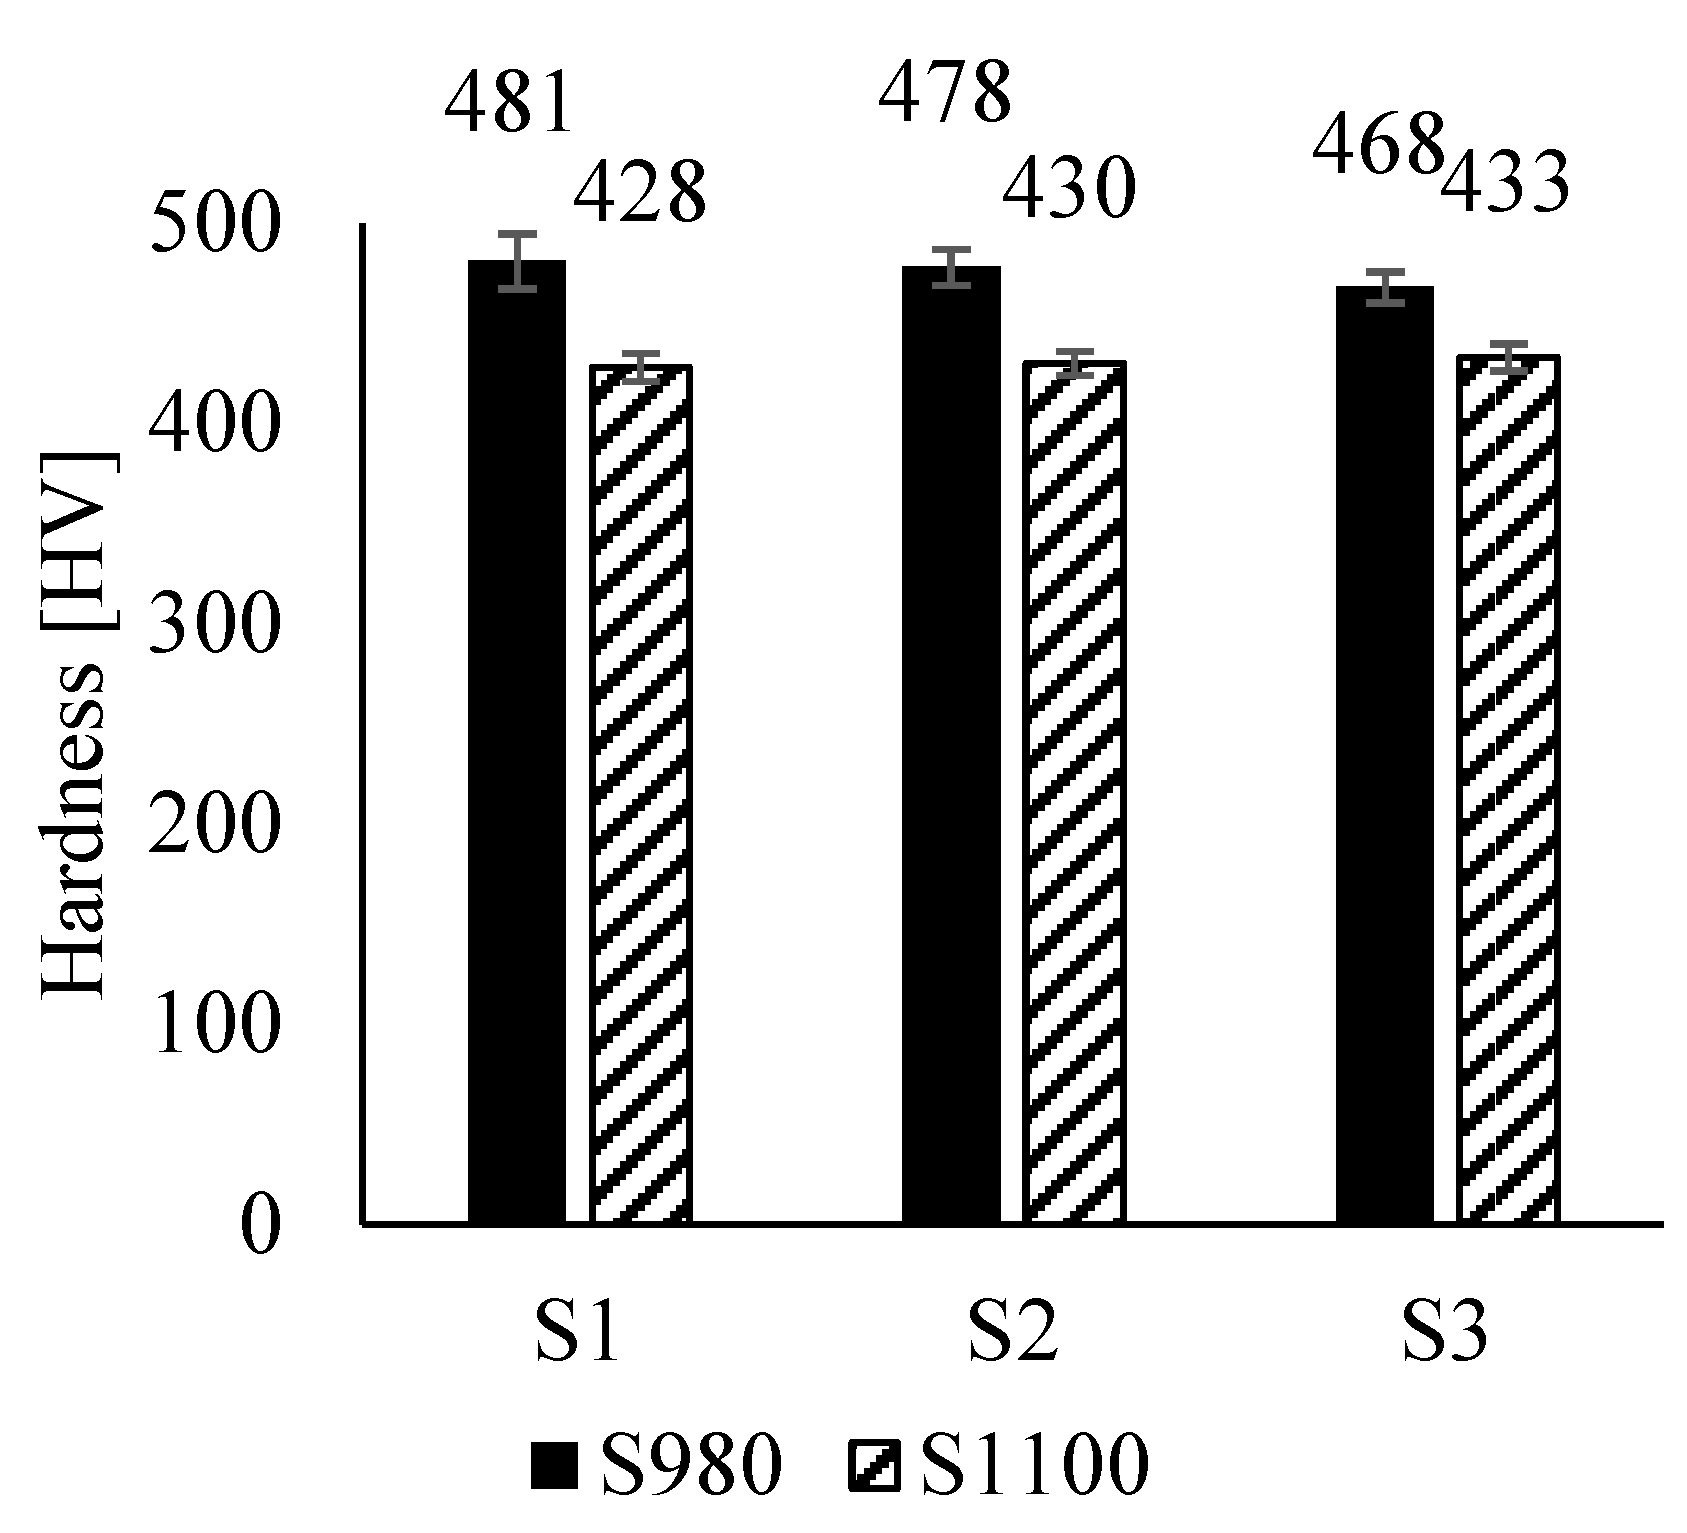
Figure 10.
Typical tensile properties of S980 and S1100. The tensile behaviour of the specimens that were heat treated under different conditions. S980 exhibits higher tensile strength than S1100, but lower elongation-to-failure.
Figure 10.
Typical tensile properties of S980 and S1100. The tensile behaviour of the specimens that were heat treated under different conditions. S980 exhibits higher tensile strength than S1100, but lower elongation-to-failure.
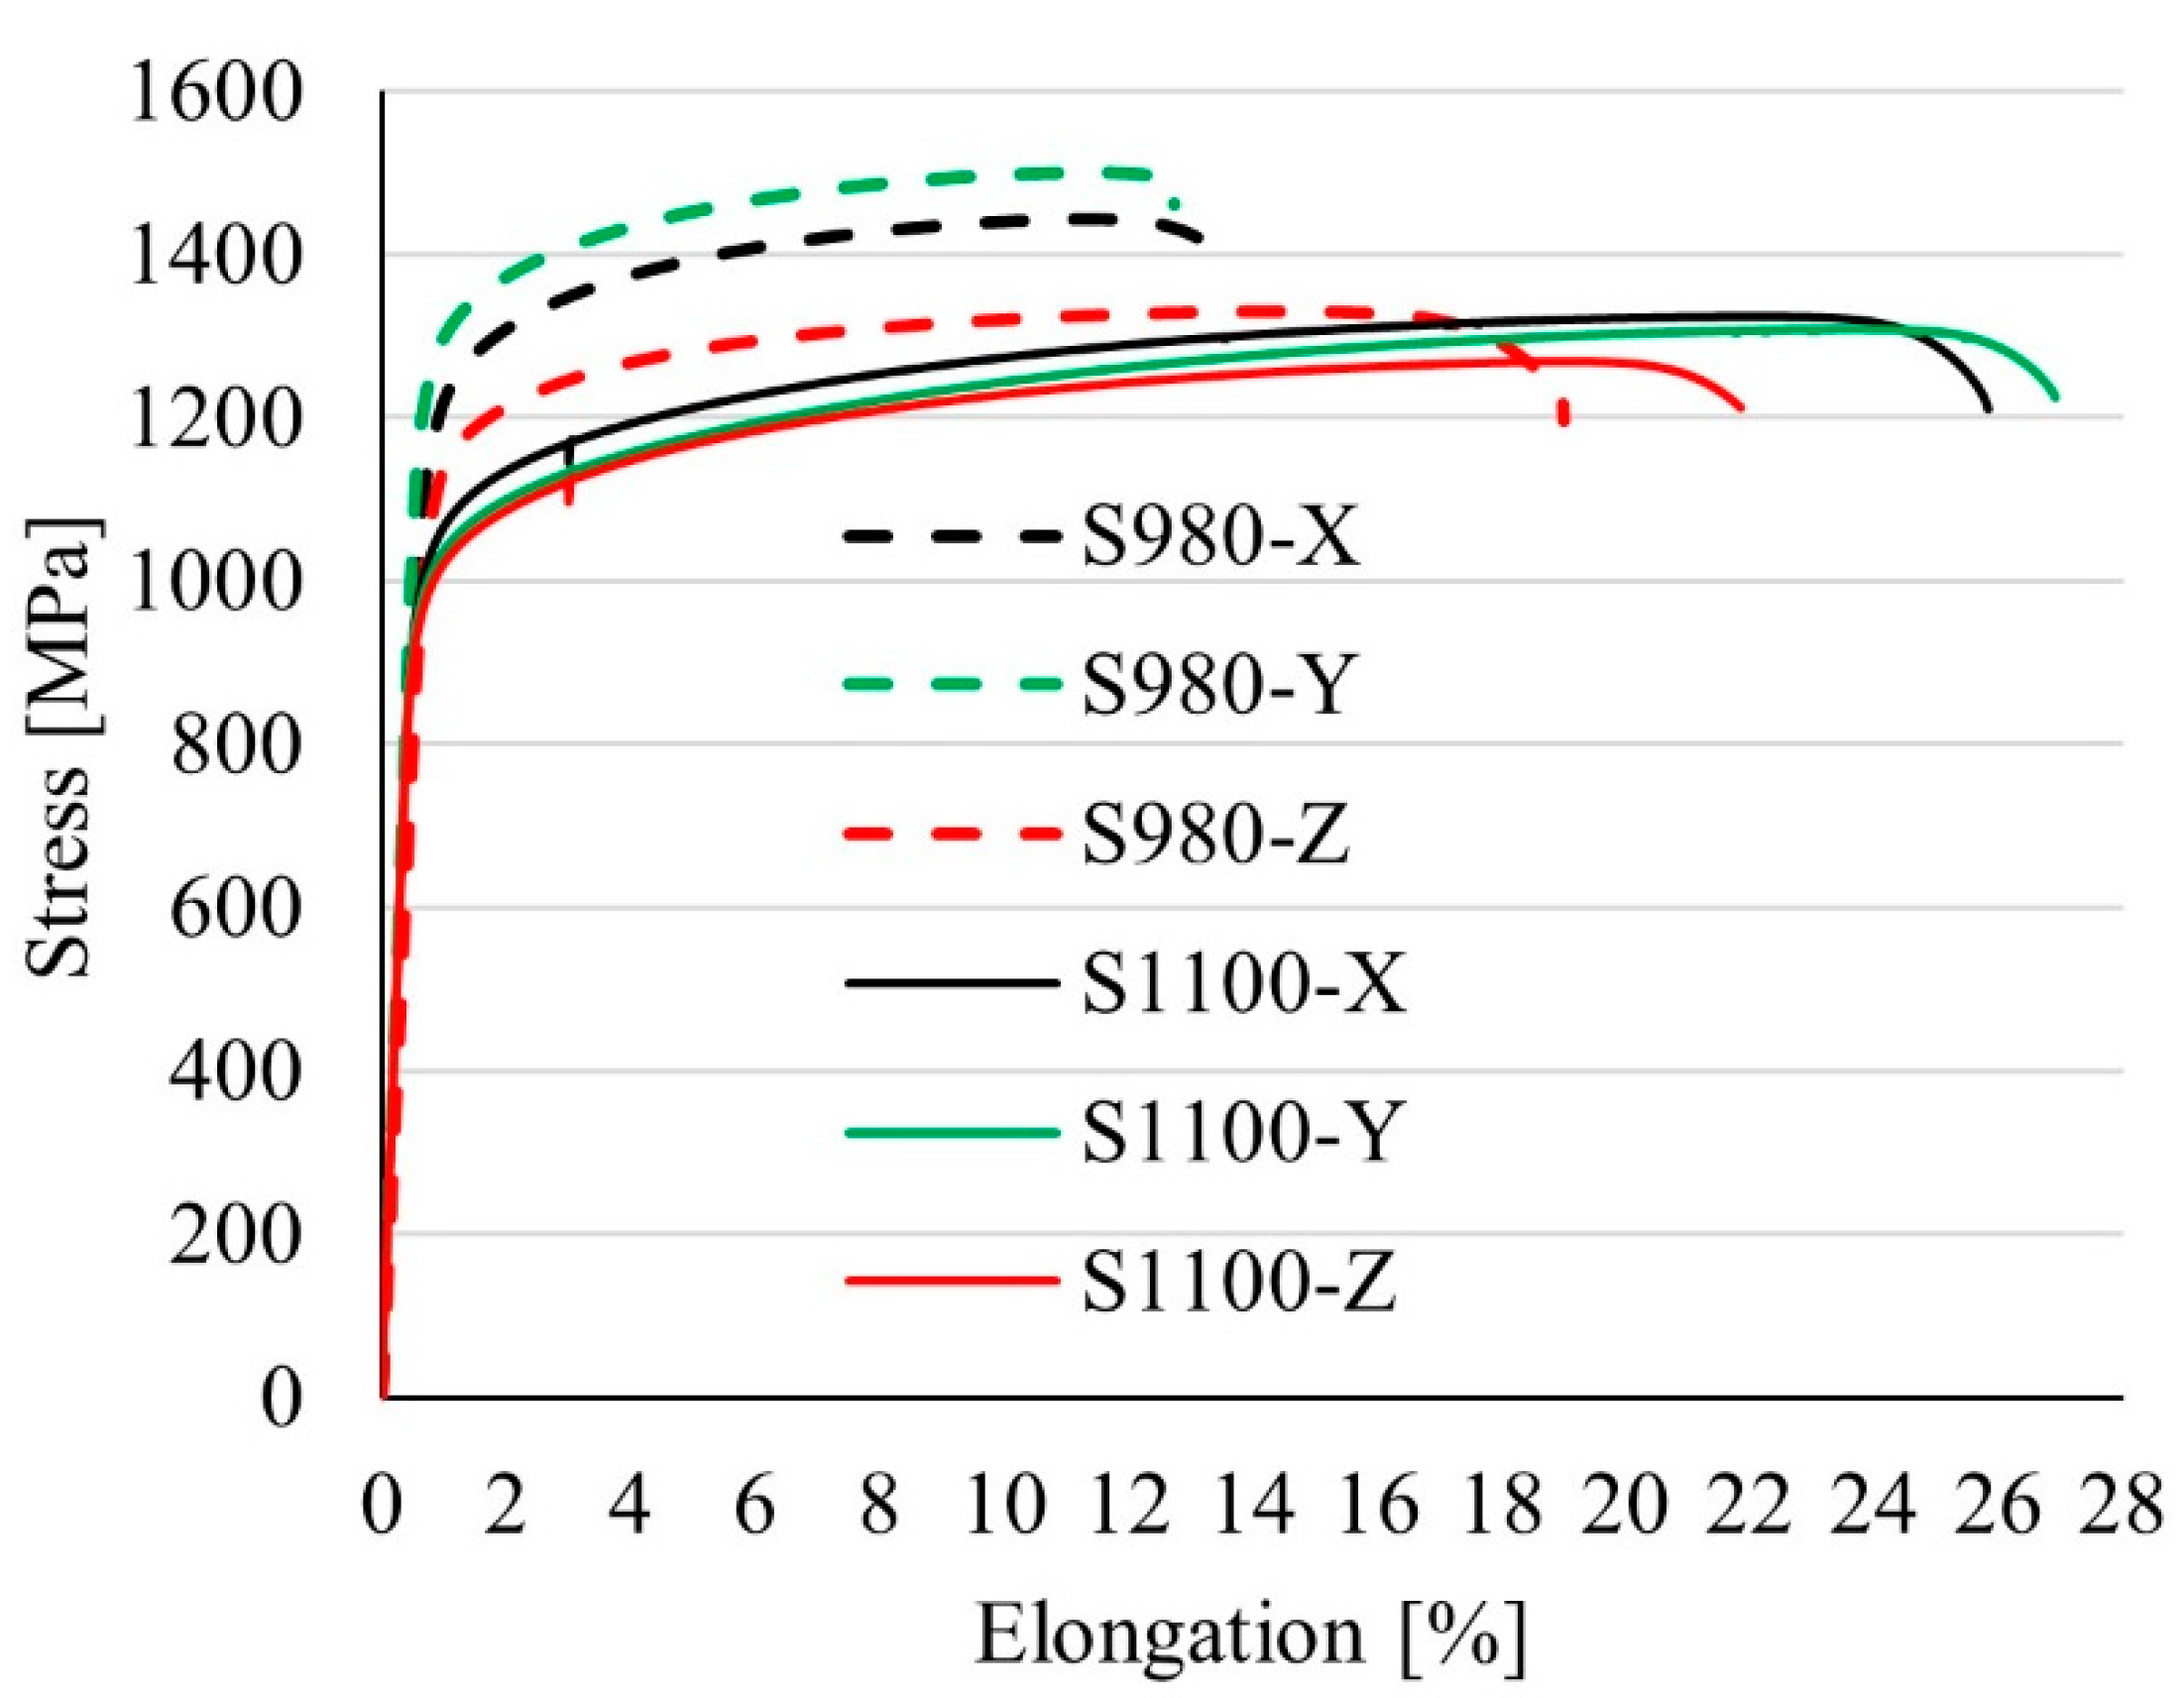
Figure 11.
Tensile properties (a) YS 0.2%, (b) UTS, and (c) elongation.
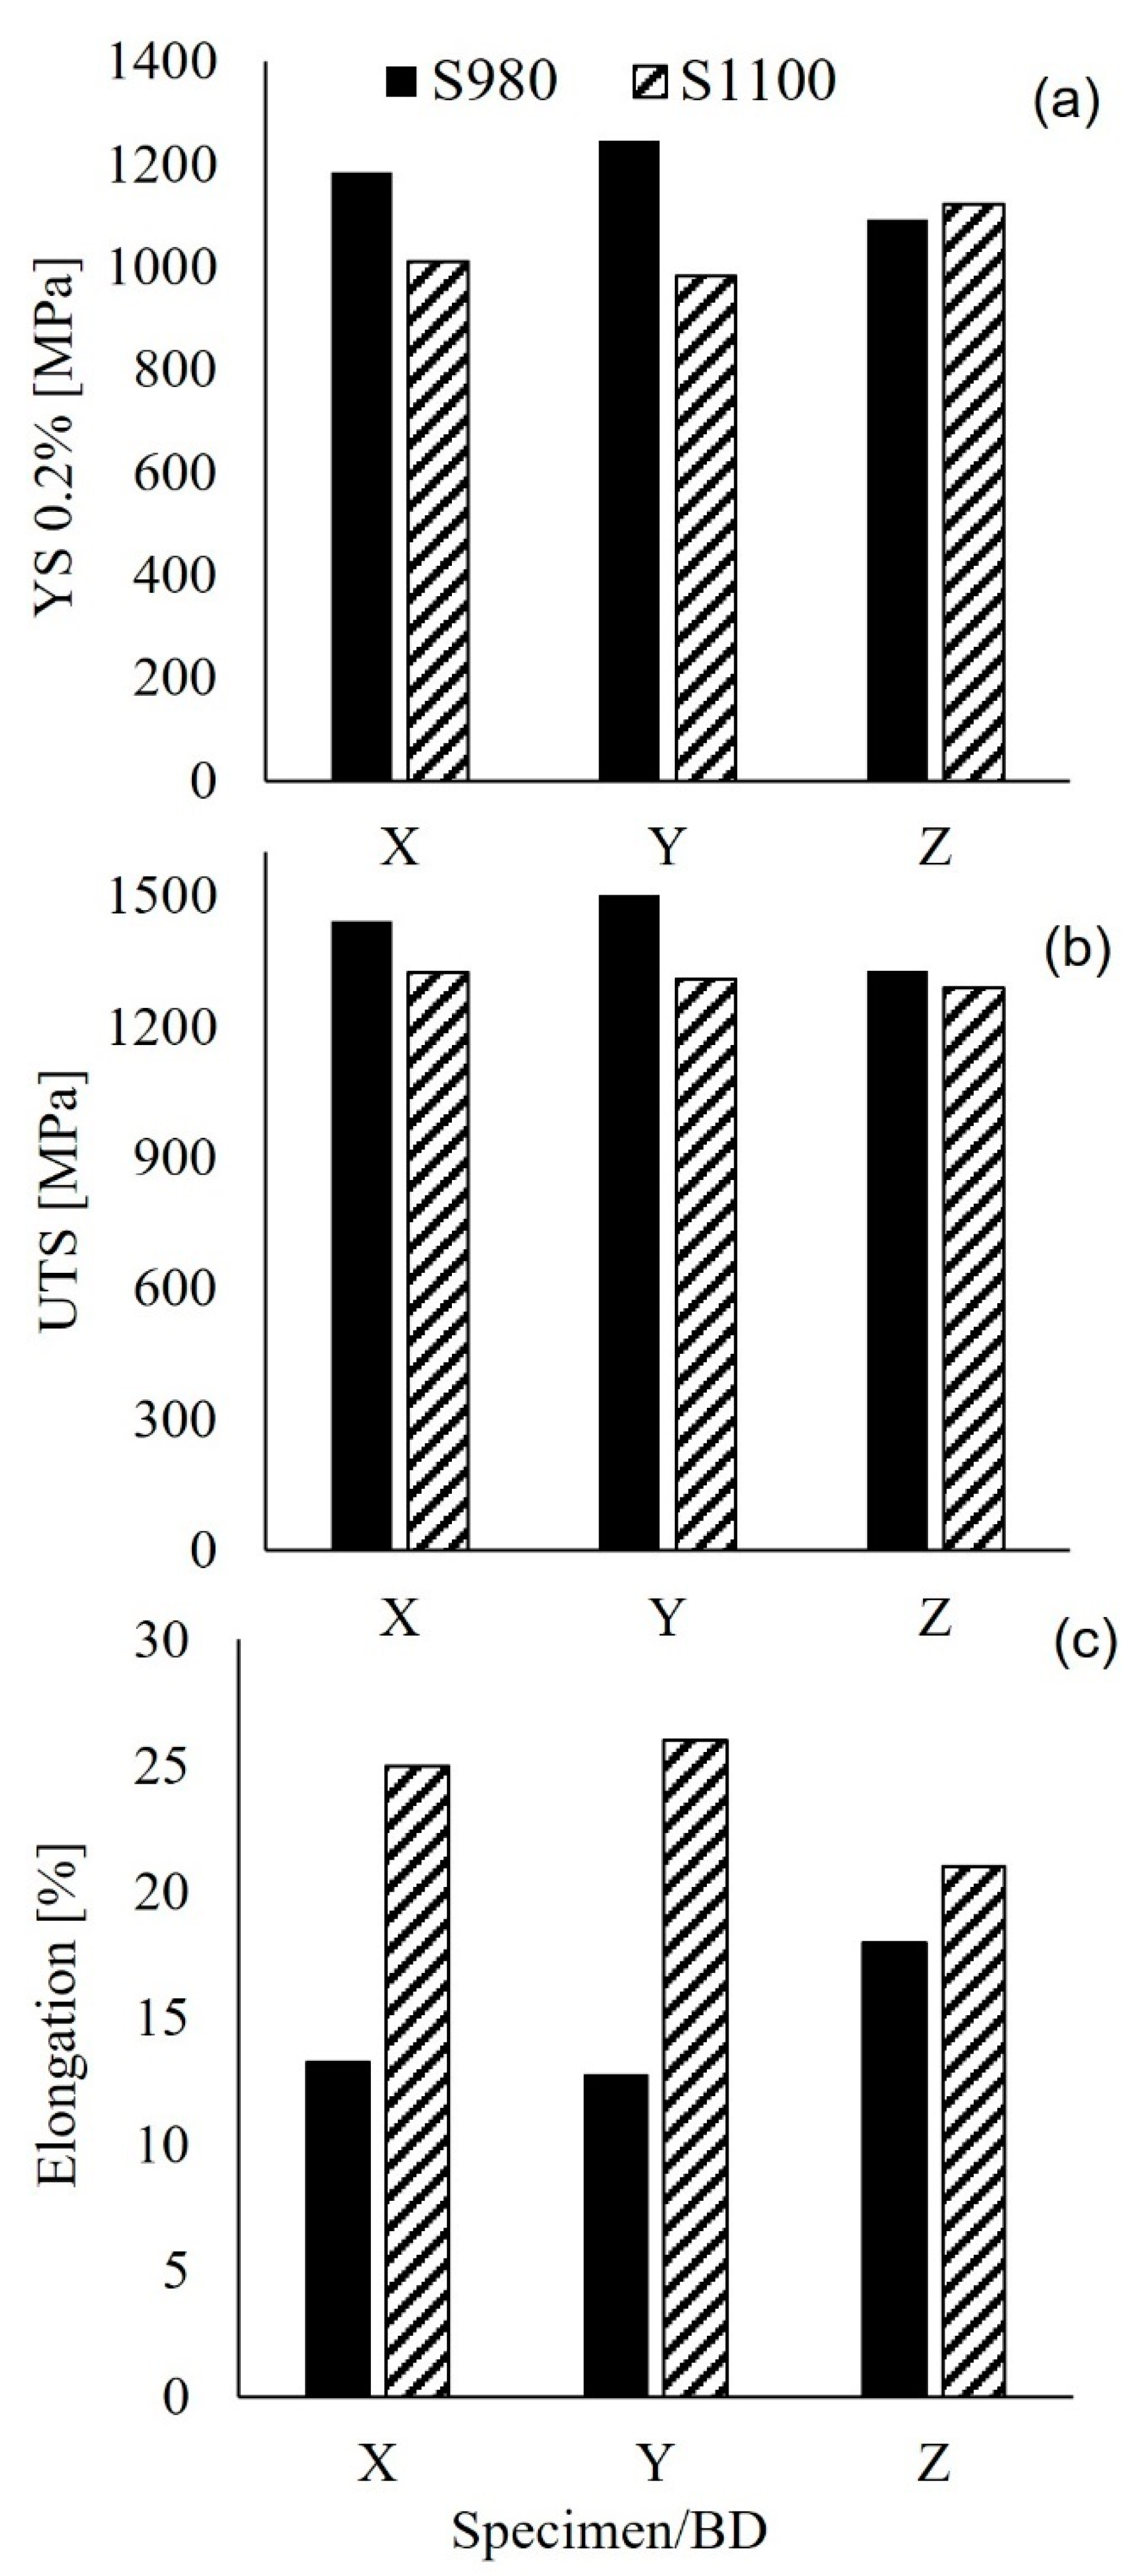
Figure 12.
Charpy impact toughness measurements reveal that, in all three building orientations, S1100 has an impact toughness that is more than twice as high as S980.
Figure 12.
Charpy impact toughness measurements reveal that, in all three building orientations, S1100 has an impact toughness that is more than twice as high as S980.
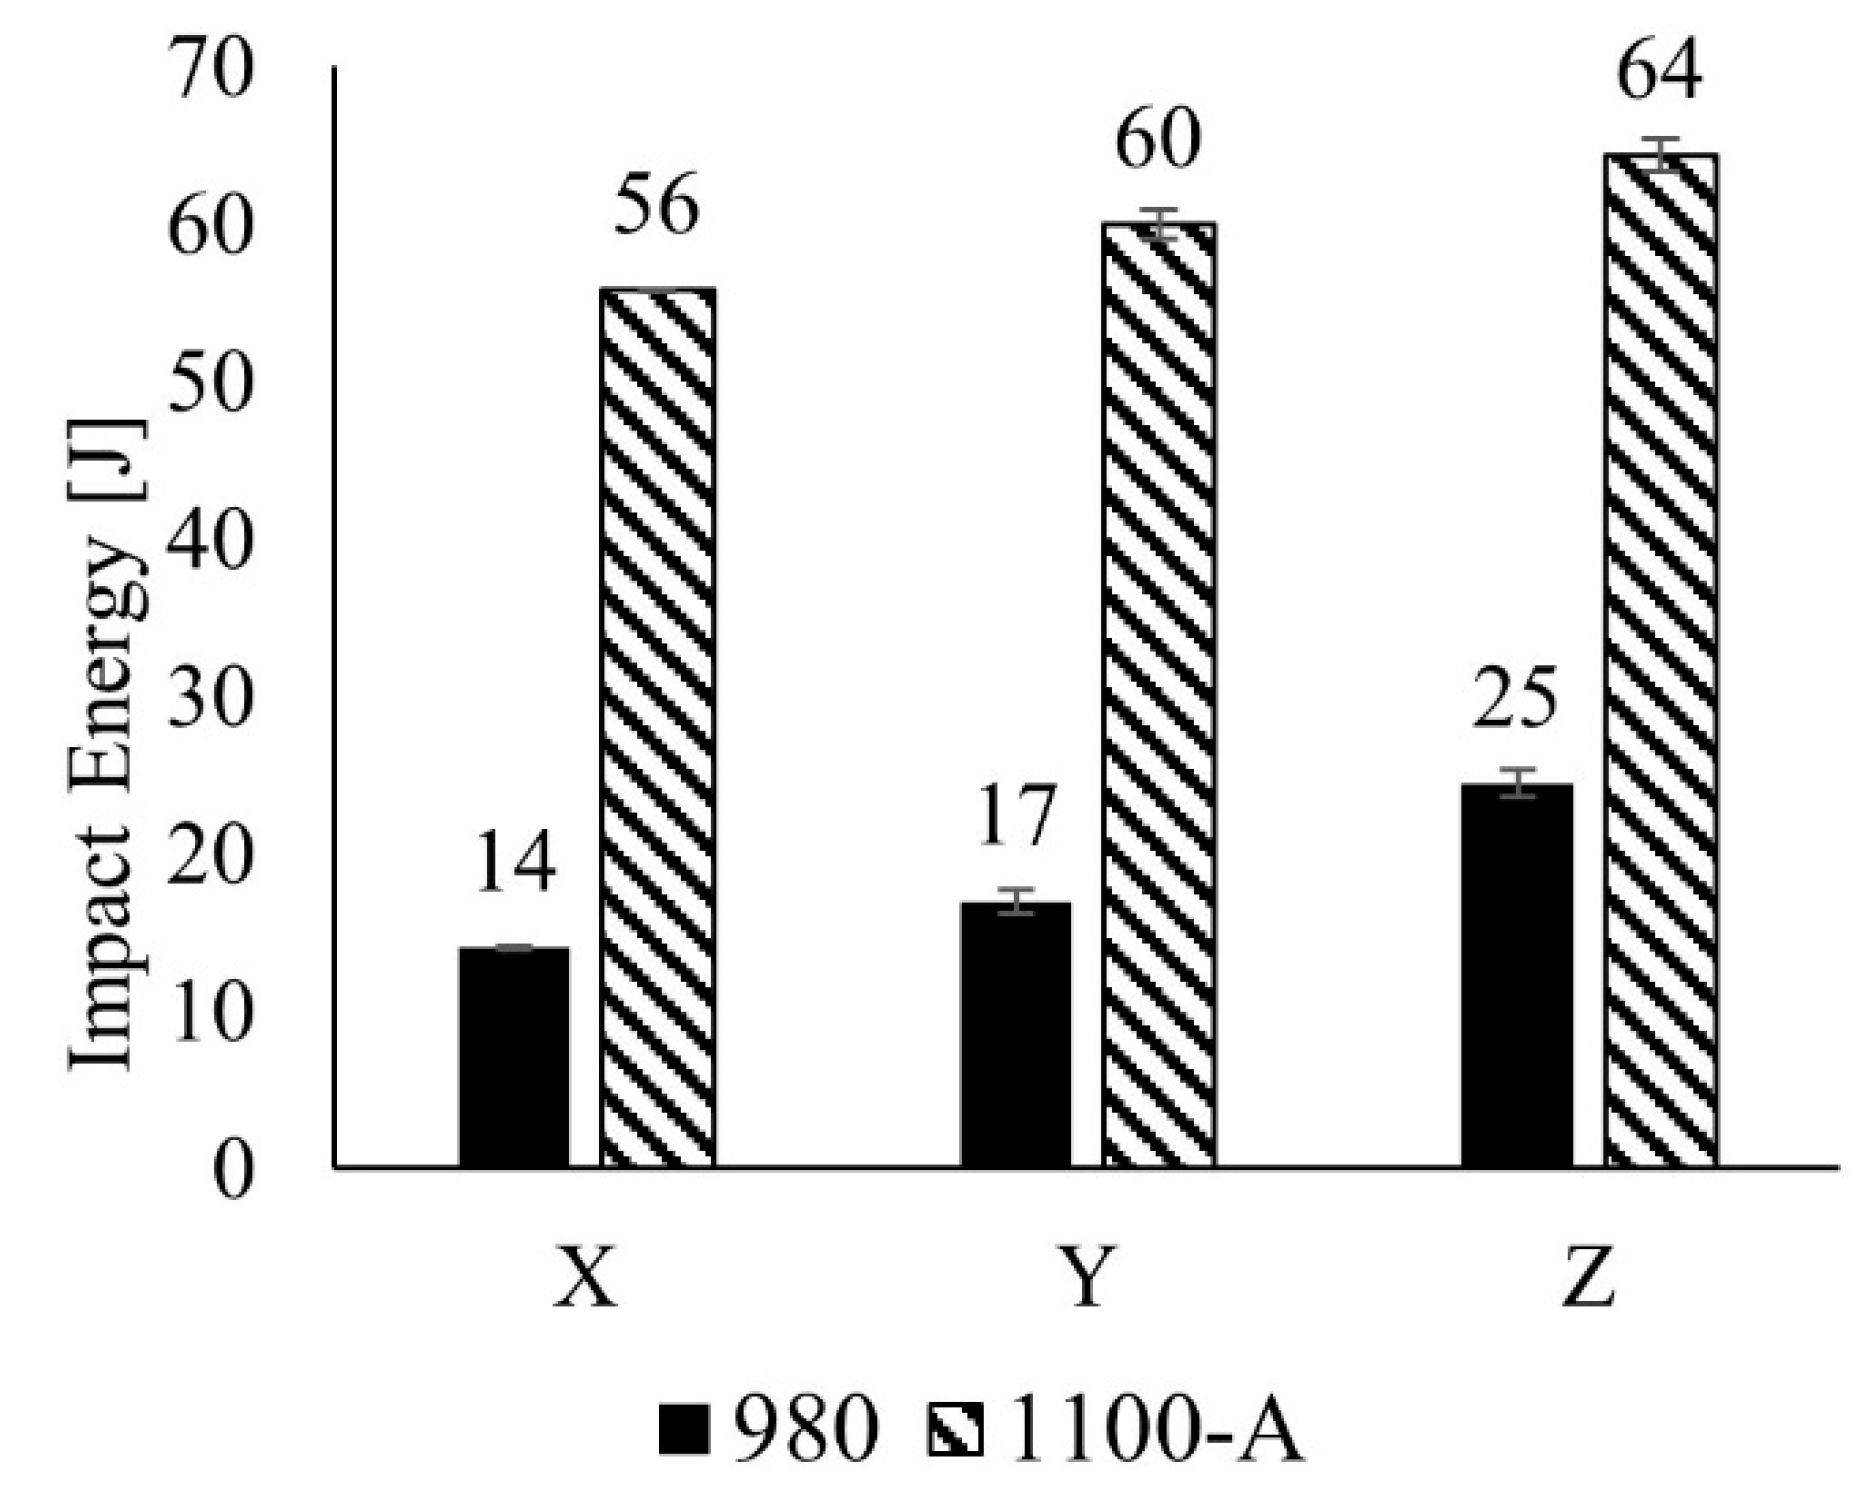
Figure 13.
Tensile fracture surfaces of specimens built in the horizontal orientation (Y) – S980 (a & b) and S1100 (c & d). The yellow arrows indicate secondary cracks while the white arrow point to the area of cleavage.
Figure 13.
Tensile fracture surfaces of specimens built in the horizontal orientation (Y) – S980 (a & b) and S1100 (c & d). The yellow arrows indicate secondary cracks while the white arrow point to the area of cleavage.
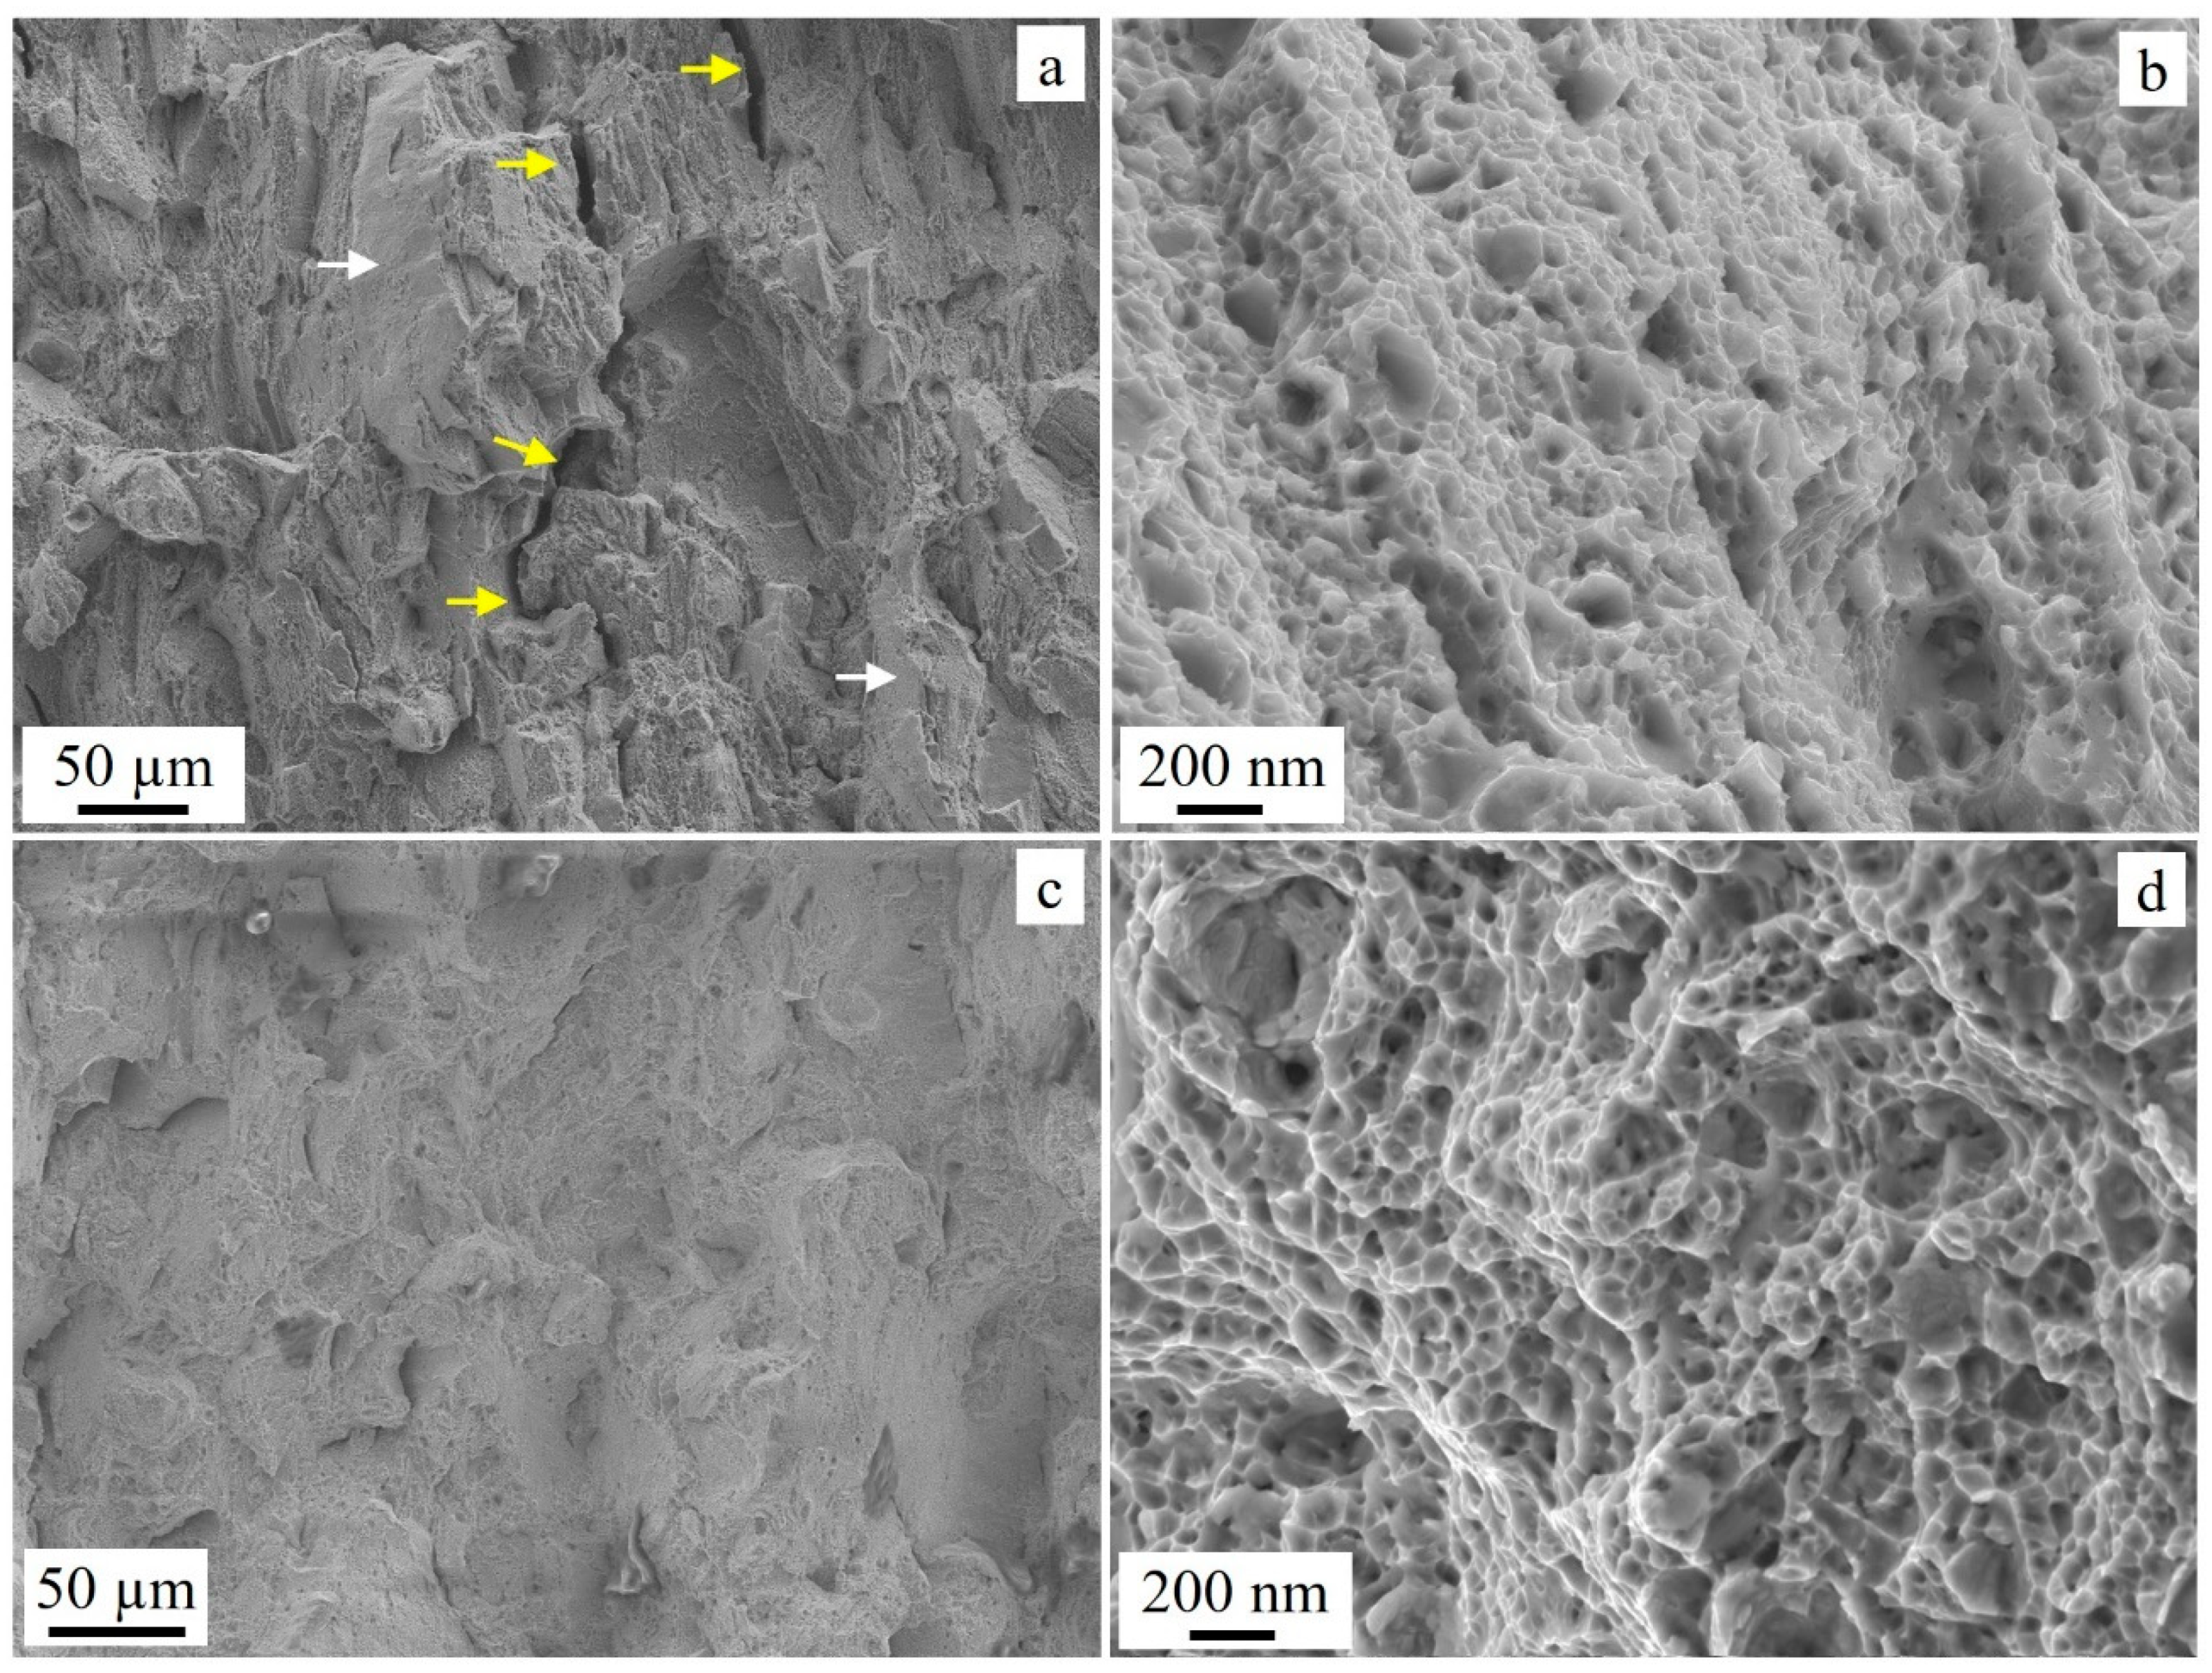
Figure 14.
Impact fracture surfaces of (a) S980-X, (b) S908-Y, (c) S980-Z, (d) S1100-X, (e) S1100-Y, and (f) S1100-Z. The white arrows are pointing to microcracks while the yellow arrows are indicating some of the faceted coalesces.
Figure 14.
Impact fracture surfaces of (a) S980-X, (b) S908-Y, (c) S980-Z, (d) S1100-X, (e) S1100-Y, and (f) S1100-Z. The white arrows are pointing to microcracks while the yellow arrows are indicating some of the faceted coalesces.
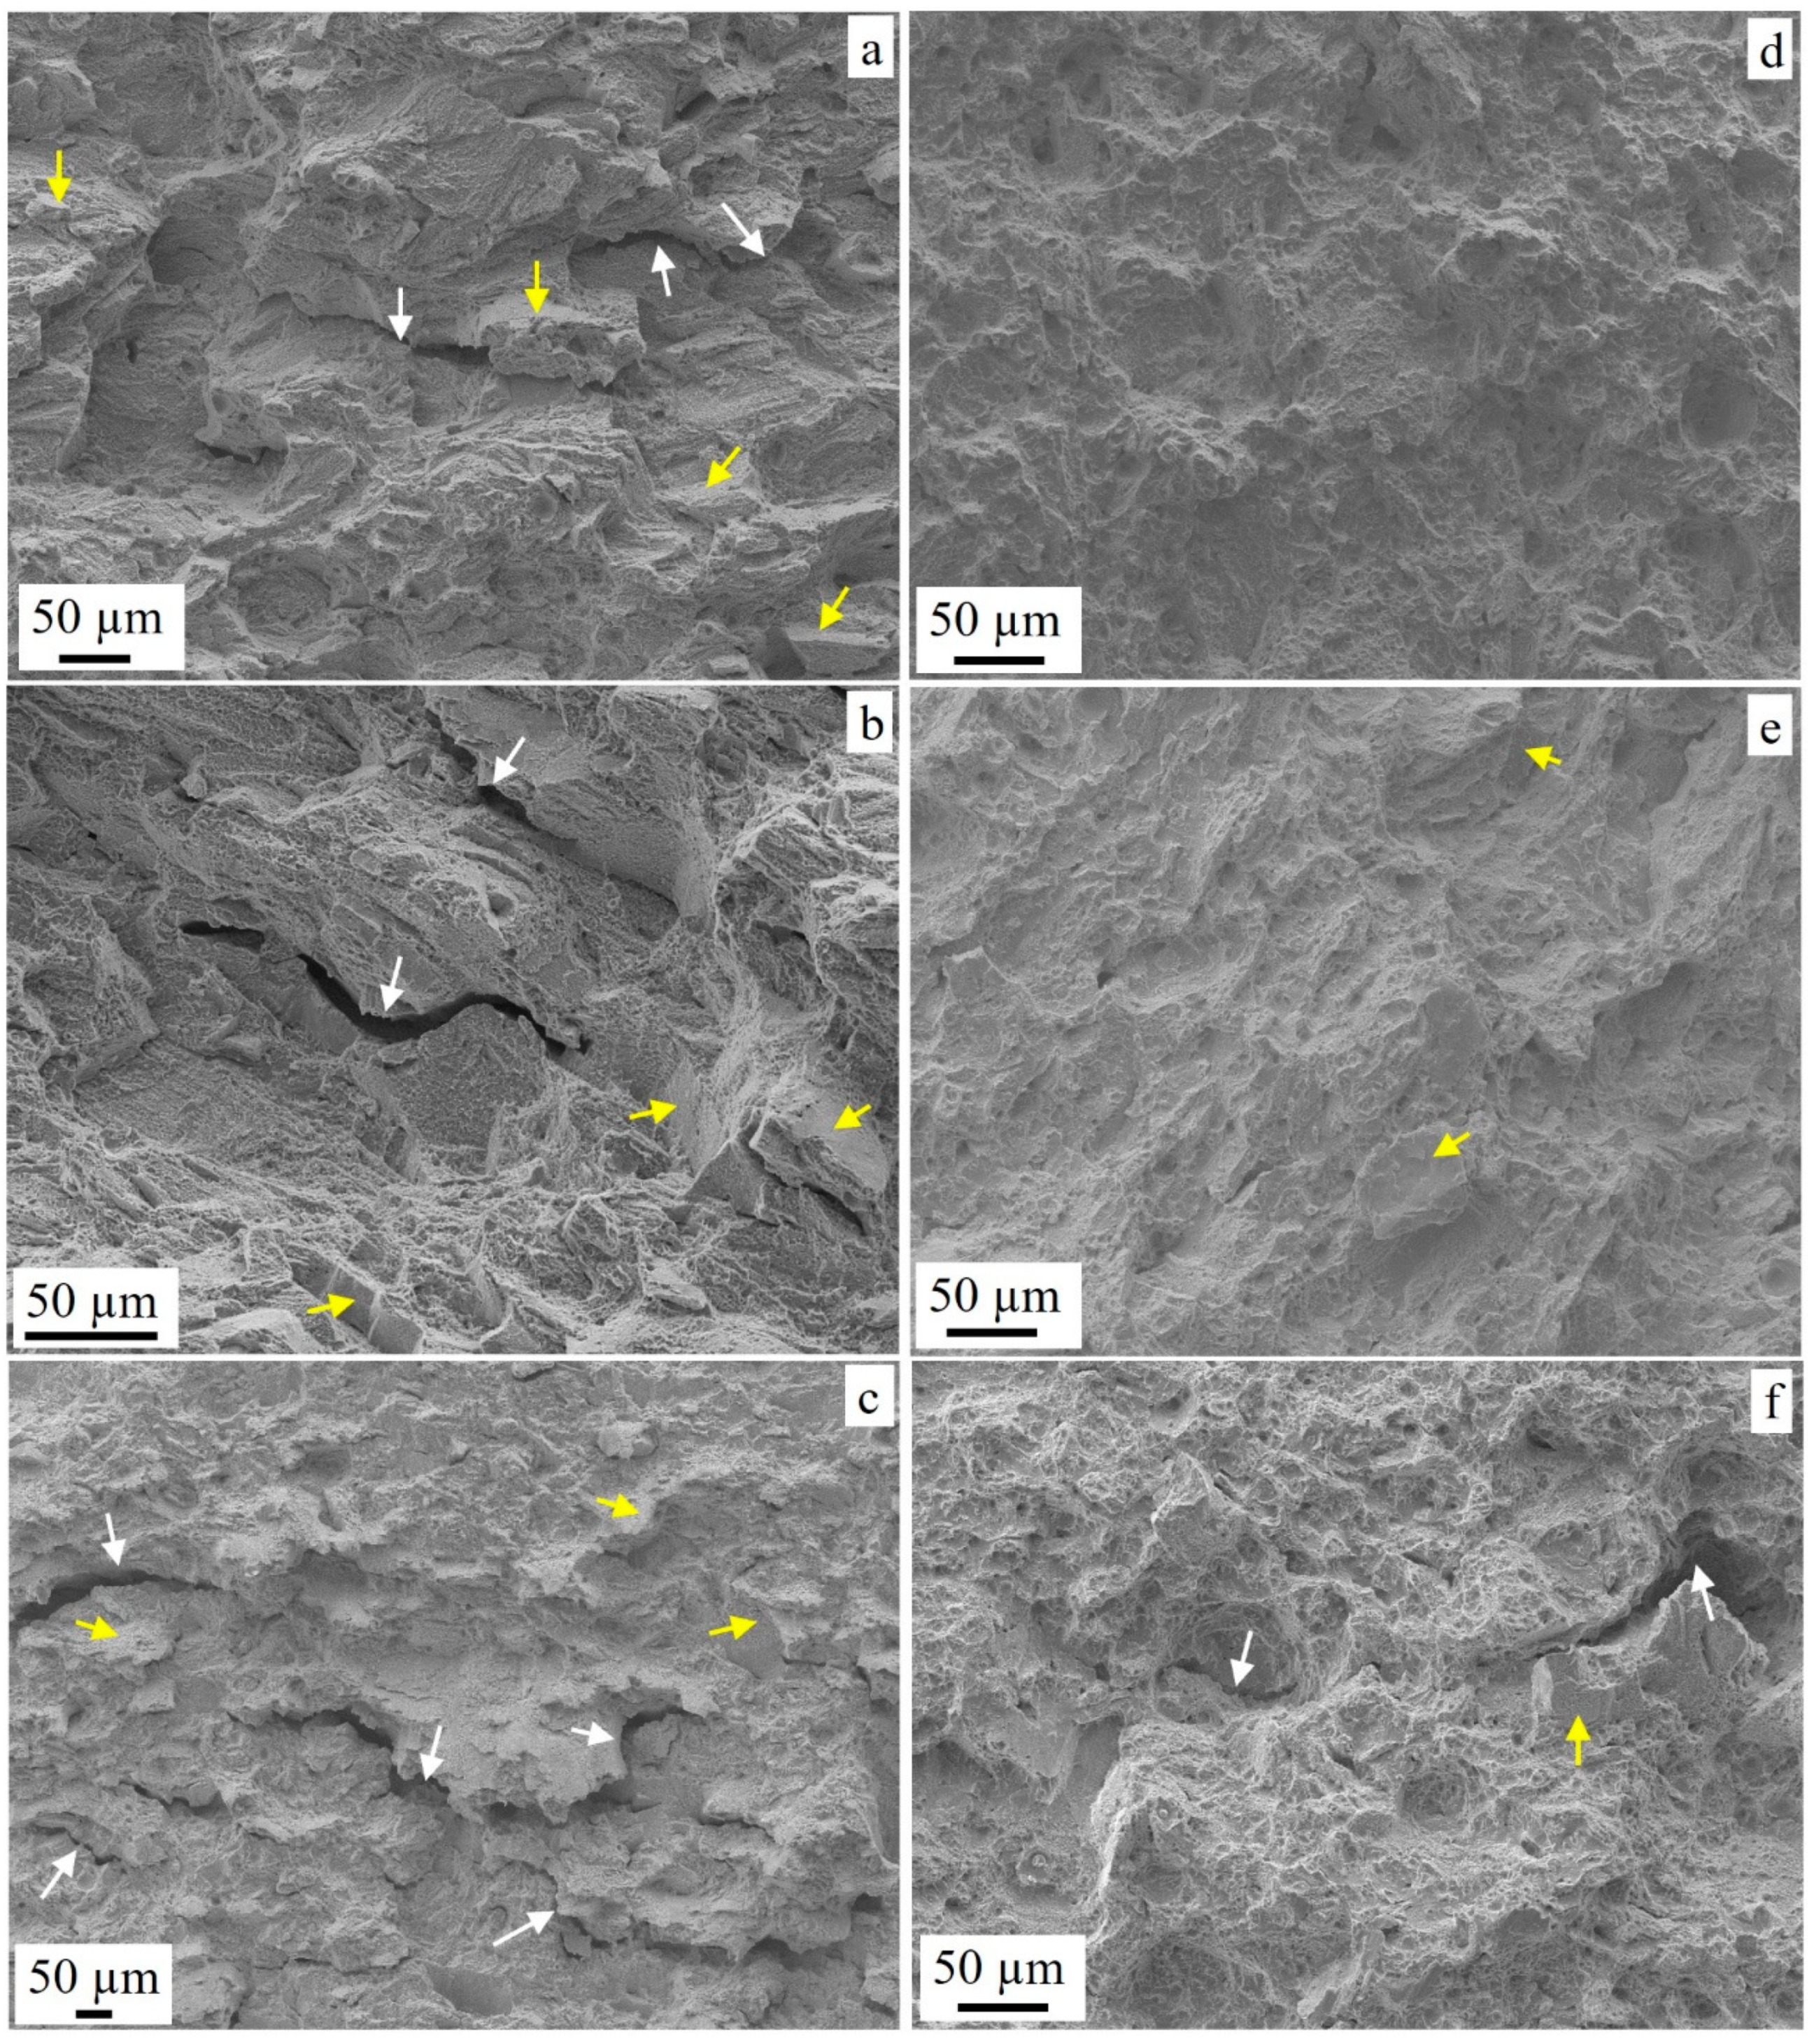

Table 1.
Nominal composition of IN718 powder - ASTM F3055 – 14a.
| Elements | Ni | Fe | Cr | Nb | Mo | Ti | Al | Co | Si | Mn | Cu |
|---|---|---|---|---|---|---|---|---|---|---|---|
| Wt.% | 50-55 | 11-22.4 | 17-21 | 4.8-5.5 | 2.8-3.3 | 0.7-1.2 | 0.2-0.8 | 1.0 | 0.4 | 0.4 | 0.3 |
Disclaimer/Publisher’s Note: The statements, opinions and data contained in all publications are solely those of the individual author(s) and contributor(s) and not of MDPI and/or the editor(s). MDPI and/or the editor(s) disclaim responsibility for any injury to people or property resulting from any ideas, methods, instructions or products referred to in the content. |
© 2024 by the authors. Licensee MDPI, Basel, Switzerland. This article is an open access article distributed under the terms and conditions of the Creative Commons Attribution (CC BY) license (https://creativecommons.org/licenses/by/4.0/).
Copyright: This open access article is published under a Creative Commons CC BY 4.0 license, which permit the free download, distribution, and reuse, provided that the author and preprint are cited in any reuse.


