
Submitted:
06 May 2024
Posted:
07 May 2024
You are already at the latest version
Abstract
This paper investigates the potential of different fermentation feedstocks towards succinic acid production. Three alternative flowsheets were constructed and modelled in SuperPro Designer™, utilizing different fermentation substrates: crude glycerol (a by-product of the biodiesel industry), a commercial 95% glucose syrup and pure glycerol. Techno-economic analysis of the modelled plants showed that all three potential investments can be economically profitable, with the crude glycerol case as the most promising one. The succinic acid production cost for the crude glycerol scenario is estimated at 3.59 $/kg, while a thorough study of the capacity effect to the economics showed that it could drop as low as $2.6 $/kg. Parametric analysis and optimization performed on a flowsheet level, indicated opportunities for lowering the production cost down to 3 $/kg, a value that could pave the framework for a further potential decrease in the selling price of the product.
Keywords:
succinic acid
; fermentation
; bioprocess modelling
; techno-economic assessment
; optimization
1. Introduction
1.1. The Importance of Succinic Acid
The vast majority of materials and products that have been developed in the modern world the last 100 years, are largely based on the value chain of crude oil. The rapid growth and intensification of petroleum extraction and processing technologies has provided fuels (such as gasoline, diesel, kerosene, etc.) and petrochemical products, including plastics (polyethylene, polypropylene, polyvinyl chloride, etc.). Furthermore, the petrochemical industry offers a plethora of additives, intermediate molecules, and structural units for the production of other important products, such as paints, dyes, coatings, resins, and more.
However, it is widely accepted by the scientific community that the carbon footprint of the overall petroleum industrial chain, from extraction to further processing, needs to be controlled and mitigated. Industrial research for alternative production technologies has become essential [1]. Significant efforts focus on the development and industrialization of technologies related to the utilization of (primarily residual) biomass for the production of the same products and materials as those produced by the petrochemical industry, through an alternative decarbonized pathway [2,3].
Various approaches for an alternative refinery, with biomass replacing crude oil (biorefineries), have been proposed and designed. One such idea was initially reported by the U.S. Department of Energy (DOE) in 2004, suggesting a list of alternative biofuels and biochemical structural units [4]. One of these compounds, which was included in the 12 most important future biochemicals in the study, is succinic acid. Succinic acid (SA) subsequently garnered research and industrial interest. In a later study by the same institution, it was designated as one of the five most important chemicals of the future [5,6].
1.2. Market Analysis
From 16,000 MT in 2007, the succinic acid production has increased up to 50,000 – 60,000 MT in 2016 [7,8]. This increase is primarily due to the technological development of fermentation technologies up to a Technology Readiness Level of 7-8. Table 1 summarizes the majority of industrial bio-SA production plants. That being said, essential for the SA production to grow further, is the ability to lower its production cost. DOE declared that the last decade, the product’s selling price was 6-9 $/kg, while for large scale implementation the price should fall at around 1-2 $/kg [9]. There are considerable fluctuations to the market, influenced by various factors such as supply and demand dynamics, raw material availability, and end-use applications [10]. Currently, succinic acid selling price should be somewhere between the prices reported above, at around 3-5 $/kg, depending on crystal purity and end-use application.
1.3. Production Pathways and Feedstock Selection
SA production can be carried out through several routes including chemical synthesis, fossil fuel-based processes, and fermentation. Fermentation is considered the most sustainable and green production pathway, as it offers lower costs, reduced waste and greenhouse gas emissions, and the potential for co-production of other valuable products [1]. There are two categories of SA producing microorganisms: natural producers and metabolically engineered strains. The natural producers are mainly rumen bacteria like Actinobacillus succinogenes, Basfia succiniciproducens and Mannheimia succiniciproducens [8]. These bacteria can utilize several carbon sources (glucose, maltose, sucrose, xylose etc.) to naturally produce SA as a part of their Krebs cycle, or as a part of their TCA reductive cycle from the intermediate oxaloacetate [10,13].
The second category of succinic acid producing microorganisms are metabolically engineered strains. Typical bacterial and yeast strains used for industrial biotechnological processes, which cannot naturally produce SA, have been genetically modified and used for succinic acid fermentations. More specifically, mutant strains of E. coli, S. Cerevisiae and Y. lipolytica can be used to effectively convert several substrates (carbon sources) to SA, as documented by several patents [14]. These strains are already used in pilot and industrial scale SA production [15]. The most important performance criteria for a suitable microorganism to be used in industrial fermentations include the concentration of SA in the fermentation broth, the conversion yield of the carbon source to SA, the volumetric productivity, and the selectivity of the microorganisms to SA. Natural producing bacteria tend to deliver less pure succinic acid, since they co-produce several other acids, such as formic, acetic, lactic etc. The presence of such by-products increases the purification costs and may also cause inhibition phenomena to the fermentation system.
The selection of the fermentable substrate is also a crucial consideration in process development. As mentioned before, there are several substrates that can be utilized with the majority of them being C5-C6 fermentable sugars. The direct use of refined sugars (1st generation feedstocks) is not the optimal selection in terms of sustainability, as these feedstocks are primarily consumed from other industries such as the food industry. The utilization of waste biomass (2nd generation feedstocks) is a rather preferable option [16]. These feedstocks are considered renewable, and they have a much lower purchase cost in comparison with the 1st generation feedstocks [17]. Typical residual feedstocks are lignocellulosic biomass, food and beverage industry waste (like bread waste, winery waste, etc.), agricultural or even municipal waste [18,19,20,21]. However, these feedstocks are not considered suitable for large scale industrial feedstocks, due to considerations related to their volumes and seasonal availability. From the above feedstocks, the abundant and cheap lignocellulosic biomass has already been widely investigated [22].
An interesting alternative is glycerol as produced by the biodiesel industry. Biodiesel production plants produce approximately 1 kg of glycerol for every 10 kg of Fatty Acid Methyl Esters biodiesel produced. This by-product stream also contains water, methanol, salts and other impurities, the concentration of which depends on the production process of each plant [23]. Even though this glycerol stream is not pure, it is important to find ways to utilize it by fractionating, purifying and converting it to useful products.
Several works highlight the potential of selected microorganisms to effectively ferment both crude and pure glycerol to SA in high yields and final titres. A series of mutant strains originated from typical SA producing microorganisms including A. succinogenes [24], E. coli [25] and Y. lipolytica [26] can ferment glycerol under anaerobic, microaerobic or aerobic conditions quite efficiently. In particular, E. coli mutant strains were proven to produce high titres and yields, while at the same time the only by-product produced is acetic acid at relatively low concentrations [27].
To the best of our knowledge, there are no previous literature contributions that model and compare the production of succinic acid from glycerol and glucose in an integrated flowsheet level. The majority of techno-economic assessments focus primarily on the utilization of one substrate, with that being mostly lignocellulosic originated biomass [12,28,29,30]. The objective of this work is the detailed design and comparison of alternative process flowsheets for the production of bio-based succinic acid using two glycerol and one glucose-based feedstock. The first glycerol feedstock will be a high purity refined glycerol feedstock (pure glycerol), while the second one will be a crude glycerol stream as given from the biodiesel industry. The glucose feedstock will be a typical 95% glucose syrup. This study sets to investigate the potential of these feedstocks, their impact on process economics and the influence of certain operational parameters on the plant’s efficiency and economic viability.
2. Materials and Methods
2.1. Bio-Succinic Acid Plant Modelling
Three different bio-succinic acid production plants were modelled and simulated using SuperPro Designer™, corresponding to the construction of three respective flowsheets (valorising different fermentation feedstocks). The design of the equipment and the techno-economic evaluation of the alternatives was based on SuperPro Designer™ models (some of them were altered and fine-tuned for the specific case of succinic acid production processes). Operating conditions, design parameters and degrees of freedom were defined from literature data and patents for the respective technology, while thermodynamic calculations and mass and energy balances were implemented in the software environment of SuperPro Designer™. The main differentiation between the three flowsheets is the upstream processing part and more specifically the pre-treatment of the feedstock and the fermentation production technology. The downstream processing part was the same for all three alternatives, targeting the most accurate representation and evaluation of the three different feedstocks potential (the difference in process economics is only due to the utilization of different feedstock and upstream technology in each case).
The annual capacity of the plants was first defined at 15,000 MT, as an industrially realistic and applicable scale for the current state of technologies, while a capacity analysis was also performed in order to estimate the influence of the economies of scale in the plants process economics. Each flowsheet has been divided into four separate sub-sections and more specifically:
- Section 100: Feedstock Pretreatment and Media Preparation
- Section 200: Fermentation
- Section 300: Fermentation Broth Purification
- Section 400: Crystallization – Product Recovery
Each flowsheet (analytical screenshots from SuperPro Designer™ software) with respective information regarding mass and energy balance calculations (stream tables) are presented in the Supplementary Material (Tables S1-S10). In this work a complete description of each process for the pure glycerol flowsheet is made and the main differences between this and the other two flowsheets (crude glycerol and glucose syrup) is reported. These differences mainly include Sections 100 and 200. Table 2 summarizes the composition of the feedstock utilized in each process alternative:
2.2. Pure Glycerol Process Model
2.2.1. Section 100: Feedstock Pretreatment and Media Preparation
Table 2 shows the chemical composition of the three feedstocks. It was assumed that the pure glycerol feedstock contains only a minor amount of impurities (0.1%), as per quality specifications of commercial USP grade glycerol. In general, impurities may act as an inhibition factor in the fermentation system. However, the low concentration of impurities contained in the pure glycerol syrup in combination with the dilution of the stream with water for preparing the fermentation media, ensures no inhibition in the fermentation. It is also important to mention that for all the studied feedstocks, any impurities added in the process via the feedstock, are effectively removed by the downstream processing, together with all the unfermented nutrients and all metabolites and other cell related impurities generated during the fermentation.
The feedstock glycerol stream is split by a splitter (P-1 / FDIS-101) into two separate streams; one heading to the preparation of the growth (seed cultivation) media (P-2 / MX-102) and one heading to the preparation of the fed-batch (production) media (P-3 / MX-103). Both media are prepared in the respective mixers, P-2 and P-3, where water and nutrients are being added. The dilution of the streams with water achieves the desired concentrations of glycerol in the media, which are 60 g/L in the batch media used in seed and main production fermentors and 600 g/L in the fed-batch media in production fermentation unit). The nutrients added in the media are various salts and trace elements, which facilitate the bacterial growth. These are partially consumed by the microorganisms and are added in excess. The media recipe was adopted in detail, according to respective patents and publications [27,31]. The growth and production media are sterilized in the sterilizers (P-6 / PZ-101) and (P-7/ PZ-102), and then stored in the sterile media tanks (P-8 / V-103) and (P-9 / V-104), respectively. The media enter the continuous sterilizers at temperatures of about 35oC, heated up against the hot outlet media in the regenerator, then heated up against steam to 140oC using steam, then cooled down against the cold inlet media to recover the heat, and finally cooled down to the fermentation temperature using cooling water. The respective flowsheet area (Section 100) is shown in Figure 1:
2.2.2. Section 200: Fermentation
The fermentation section consists of a train of three seed fermentation steps which grow the culture to ultimately inoculate the production fermenters. The first seed fermenter (P-11 / SFR-101) is inoculated with the respective microorganism strain (E. coli), while the inoculum for each one of the next fermenters (P-12 / SFR-102, P-13 / SFR-103 and P-24 / FR-101) is the fermentation product of the respective previous one. Each fermenter is steamed, loaded with the glycerol batch media and inoculated. The succinic acid produced during the fermentation drops the pH, as a dicarboxylic acid (pKa1 = 4.202, pKa2 = 5.635). Succinic acid needs to be neutralized in order to maintain the desirable pH throughout the fermentation. For the selected fermentation technology, the pH is controlled via adding a solution of di-potassium carbonate (K2CO3). All fermentation steps occur under aeriation. The air is filtered (P-16 / AF-101), compressed and cooled (P-17 / G-101), and then distributed to each fermenter via a flow distributor (P-18 / FDIS-102). The aeriation rate is assumed equal to 0.15 VVM, while the cultivation time for each seed fermenter is 24 hours. The production fermentation has two fermentation operations; the first one involves biomass growth under aerobic conditions with a duration of 24 hours, while the second fermentation operation involves product formation with a residence time of 28 hours. The complete cycle of each seed fermenter consists of the six operations that are presented below:
- SIP (Steam-In-Place): At the beginning of each batch, an SIP operation ensures sterility of the vessels and piping, prior to pulling in the fermentation media and inoculum.
- Pull In Media: Right after the SIP, the sterile media are pulled into the sterilized reactors.
- Pull In Inoculum: The inoculation of each seed fermenter occurs right after the addition of the media in the sterilized reactor.
- Fermentation: After the inoculation, the fermentation operation starts. The fermentation takes place at a constant temperature of 39oC. The heat generated during the culture growth is removed against cooling water flowing in the cooling jacket. The seed fermentation duration is equal to 24 hours, while there is constant aeriation (0.15 VVM) and fed-batch supply of the buffer.
- Transfer-Out: At the end of fermentation, the broth of each seed fermenter is transferred to inoculate the following fermenter of the seed train.
- CIP (Clean-In-Place): After the removal of the broth, the vessels are cleaned in place.
The CIP cycle consists of an initial flush with water, a wash with a 2% NaOH solution, a post rinse with water, a wash with a 2% phosphoric acid solution, and a final flush with water.
There are three seed reactors in the cultivation train with increasing volume, corresponding to an inoculation ratio of approximately 1:15. In addition to the above operations the main production fermenter cycle includes a production fermentation phase, which follows the cultivation-growth phase. During the production phase, concentrated fed-batch media are added. Each new operation is presented below (the unit operations that remain the same are not being further explained):
- SIP (Steam-In-Place)
- Pull In Media
- Pull In Inoculum
- Fermentation
- Pull In Fed Batch Media: As soon as the glycerol is depleted fed batch media are continuously fed in the fermenter.
- Production Fermentation: Similarly with the batch phase, the fed-batch fermentation operation takes place at a constant temperature of 39oC. There is constant aeriation and fed-batch supply of media and pH control buffer.
- Transfer-Out
- CIP (Clean-In-Place)
All of the reactions that occur in the fermenters are modelled as stoichiometric reactions with their respective conversion rates. The stoichiometry of the four respective reactions is presented in Table S12 in Supplementary Material. The respective flowsheet area (Section 200) is shown in Figure 2:
2.2.3. Section 300: Fermentation Broth Purification
The produced fermentation broth contains a significant amount of impurities, suspended biomass, unfermented glycerol and nutrients. The purification of the broth starts with a disk-stack centrifugation process (P-20 / DS-101), which removes almost all of the suspended biomass. The fermentation broth is being further processed by a membrane filtration unit for the total removal of the solids and large molecules from the broth (P-21 / UF-101).
The filtered broth is then passed through a mixed ion exchange column, in order to remove the unfermented nutrients and salts. This mixed column unit retains both all cations, including the Potassium cations (K+) of the succinate and acetate salts and all salt related anions. The dissociation reactions were modelled in a generic box with reaction (P-22 / GBX-101).
The filtered broth is then sent to the buffer tank P-23, heated up to 52oC in a heater (P-24 / HX-101) using steam, and loaded to the ion exchange column P-25. The column operates in batch mode and cycles independently of the main recipe. The column also operates in stagger mode, with an extra set of equipment. The scheduling was fine-tuned so that there is always one column loading and purifying product, while the other column is washed and regenerated. The duration of a complete batch cycle is assumed at 7.2 hours and consists of the following four operations:
- Load: The column is loaded with the filtered broth that flows through the column while the salt ions are being retained.
- Wash: After the retention of the salt ions the resin is washed with water.
- Cation Regeneration: The cations resin is regenerated with a respective hydrochloric acid solution.
- Rewash 1: A second wash with water removes the cation regeneration solution.
- Cation Regeneration: The anions resin is regenerated with a respective sodium hydroxide solution.
- Rewash 2: A second wash with water removes the regeneration solution and prepares the column for its next cycle.
The final purification step is the processing through an activated carbon column (P-31 / GAC-101), where the broth is decolorized and more impurities are separated by the product stream. The salt free product stream is loaded in a buffer tank P-29, heated in a heater (P-30 / HX-102), and loaded in the activated carbon column (P-31). The Carbon Column operates in batch mode and cycles independently of the main recipe. In order to ensure continuous processing of the broth, similarly with the Ion Exchanger Columns, the carbon column operates in stagger mode, with one additional unit. There is always one column being loaded, and another one is being regenerated. There are four operations in the Activated Carbon Columns:
- Load: The salt free broth is loaded in the carbon column, which retains the impurities.
- Product Wash: The column is washed with water.
- Wash with NaOH: The column is regenerated with a NaOH solution.
- Wash with Water: A second water wash removes the regeneration solution and prepares the column for its next cycle.
2.2.4. Section 400: Crystallization-Product Recovery
After the purification of the broth, the product stream contains about 7.7 wt.% succinic acid, 0.4 wt.% acetic acid and 91.9 wt.% water. The purified broth is preheated in a heater (P-35 HX-103) and then passed through a four-effect evaporator (P-36 / EV-101), which concentrates the solution up to about 45 wt.% SA. The next step is the recovery of the SA from the purified solution via cooling crystallization. Acetic acid is soluble in water at any concentration while SA is partially miscible in water, depending on temperature and pH [32,33,34]. The concentrated SA product solution is cooled at 34 oC and finally 4 oC in the continuous crystallizers P-41 and P-42, respectively, crystallizing the succinic acid up to a final concentration of 110 and 30 g/L succinic acid in the mother liquor [35]. The residence time in these two continuous units (P-41 and P-42) was assumed at 2 hours [36].
The slurry is loaded in a basket centrifugation (P-44 / BCFD-101), which separates the crystals from the mother liquor. The basket centrifugation unit (P-44) operates in batch mode cycling independently from the main recipe with the following operations.
- Filter: The slurry is filtered while loaded in the centrifuge. The crystals are retained, while the mother liquor is separated.
- Cake Wash: The retained crystals are washed with water.
- Transfer Out: The basket is emptied.
As a batch unit operation, the basket centrifugation unit operates in staggered mode, with one staggered equipment. The separated crystals from P-44 are finally dried in a rotary drying procedure (P-48 / RDR-101). The air inlet is added with a fan (P-45). The flow of air is then split in a flow distributor (P-46). Part of the air is pre-heated in a heater (P-47) against steam and then entered in the dryer (P-48 / RDR-101), while the remaining air cools down the dried crystals. The crystals exit the dryer with a polymer grade succinic acid purity.
The mother liquor and the wash drain from the basket centrifuge contain a significant amount of dissolved SA and are recycled back to the crystallization section. The entire amount of wash drain is recycled back to the mixer P-33 / MX-106, where it is mixed with the purified SA that enters the crystallization section. In parallel, part of the mother liquor is recycled, via a splitter (P-49 / FSP-102). The recycling streams might contain some nuclei and small crystals. These crystals are dissolved in a generic box (P-34 / GBX-103), after the mother liquor and the wash drain streams are mixed with the dilute purified SA stream and before they re-enter in the evaporator of the crystallization system. The respective flowsheet area is shown in Figure 5 and Figure 6:
2.3. Crude Glycerol Process Model
In this conceptual flowsheet regarding the second case study, an initial crude glycerol stream is assumed as a feedstock. Crude glycerol can be purchased in much lower price than purified glycerol, however some pre-treatment processes are needed for the feedstock to be suitable for fermentation. Due to this reason, an extra section was added to the flowsheet called “Glycerol Pretreatment” (black icons on the flowsheet).
In contrast with the case of pure glycerol, the assumed feedstock is contaminated with various impurities and unwanted salts that should be treated properly. The composition of the feedstock has been presented previously on Table 2.
The crude glycerol feedstock stream is being stored in a storage tank (P-1 / V-101) and then heated up to 50oC in a heater (P-2 / HX-101) against steam. The heated crude glycerol is further processed in an ion exchange column for the removal of the unwanted salts (P-4/ INX-101). The retained salt ions leave the column and are sent to wastewater treatment. The Ion Exchange Column operates in batch mode and consists of the following unit operations:
- Load: The column is loaded with the crude glycerol feedstock that flows through the column while the salt ions are being retained.
- Wash: After the retention of the salt ions the resin is washed with water.
- Cation Regeneration: The column cation resin is regenerated with a respective hydrochloric acid solution.
- Rewash 1: A second wash with water removes the regeneration solution.
- Anion Regeneration: The column anion resin is regenerated with a respective sodium hydroxide solution.
- Rewash 2: A second wash with water removes the regeneration solution and prepares the column for its next cycle.
The ion exchange unit operates in stagger mode with one extra staggered unit each. There is always one unit loading and purifying crude glycerol syrup, while the second unit is regenerated. After the pre-treatment of the feedstock the flowsheet structure and operations are identical to those described in Section 2.2.
2.4. Glucose Syrup Process Model
In this case study the process utilizes a glucose syrup as a fermentation substrate (its composition is presented on Table 2). The main difference with the previous case is the fermentation section, where a different fermentation process occurs (as there is a different carbon source). Here the main differences between the fermentation technologies will be discussed. Although the cultivation of the microorganisms (again E.coli strains) is being performed in aerobic conditions, the production fermentation is a dual-phase fermentation, where the first phase takes place under aerobic conditions, until aeriation stops and in the second phase the fermentation is being performed under anaerobic conditions with fed-batch fermentation media supply (glucose syrup), conditions that favor the production succinic acid. The main differences in the stoichiometric conversion equations are summarized in Table S12 of the Supplementary Material.
The batch cycle of this fermentation process is more complex and lasts longer than the glycerol case. More specifically, the aeriation phase has a duration of about 24 hours, while the anaerobic fed-batch operation has a duration of about 50 hours. In cumulative numbers the total batch cycle of the glucose fermentative process is 72 hours, while the respective batch cycle for the glycerol case is about 52 hours. This imposes the need to use one more fermentors, that operate in staggered mode in order to reach the annual capacity of about 15,000 MT.
2.5. Technoeconomic and Break-Even Analysis
After describing the methodology that was followed for the modelling and flowsheeting of the three different case studies, a complete techno-economic evaluation has been performed. The flowsheets for the three alternatives were modelled in such a way so that they are pretty much identical, while the utilization and upstream processing of each different feedstock is their only practical difference. Therefore, the techno-economic assessment and comparison between the existing alternatives investigates the potential impact of the feedstock selection to the process economics.
In addition to the mass and energy balances calculations, SuperPro Designer™ provides equipment sizing calculations and techno-economic analysis for the flowsheets developed. The outcomes of this analysis are summarized in tables, which include an estimation of the size as well as the cost of each equipment to ultimately provide an estimation of the plant CAPEX, OPEX, unit production cost and other economic criteria and KPI’s (e.g. Payback Time, Net Present Value, Gross Margin).
A break-even analysis for the calculation of the minimum selling price of the product for each one of the three process alternatives was also conducted. To achieve that, multiple simulations were performed inside the simulation environment of SuperPro Designer™, with the flowsheet models that have already been constructed. The only input parameter that changed in each simulation was the product selling price and the target was the identification of the point, where the NPV for the investment was equal to zero. After the collection of the respective data for each case study, the data was processed in Microsoft Excel and linear equations were extracted for each case. These equations represent the correlation between the NPV and the selling price of succinic acid.
2.6. Capacity Analysis
The production capacity of a processing plant is one of the most important parameters for a plant’s economic performance. Generally, it is desirable to reach high production capacities and take advantage of the economies of scale, while also keeping in mind the scalability of each process. In the case of succinic acid (similarly with other industrial bioprocesses), the scale up of the reactors may have some negative effects on the process performance. More specifically heat and mass transport phenomena and their corresponding coefficients (heat, mass transfer) decrease with the increase of scale (adding mass and heat transfer limitations). This may impact negatively the productivity of the fermentors and ultimately the performance and the resource requirements of the entire processes. For this reason, two different approaches were investigated in this part of the work.
In the first approach the increase in the production capacity was achieved by increasing the number of fermentation reactors. In such a way, the volume of each reactor remained the same and the operation of the process cannot be compromised. The analysis was performed for various number of reactors (4, 6, 8, 10, 12), which all operate in staggered mode. The number of seed fermenters in the respective cultivation section was also increased respectively so in each case the minimum idle time for the process equipment is achieved. The analysis was carried out for the crude glycerol flowsheet alternative, since, as will be later analyzed, it is the most profitable alternative.
In the second approach, the capacity study was performed by scaling up the volume of the reactors up to a certain limit (900 m3), where it was assumed that the performance of the process is not affected by the scale of the reactor. This is an important assumption that introduces some uncertainty in the calculations performed by this approach.
2.7. Parametric Analysis – Optimization Approaches
As discussed above, the selection of the feedstock influences the structure of the process, the CAPEX and OPEX requirements and ultimately the process economics. Moreover, for each feedstock, some key design decisions can also influence the structure of the process, the yields, the consumption of resources and as such the process economics. For instance, the recycling of a stream might increase the yield of the process, but this might require additional equipment to be installed, which comes with additional CAPEX requirements, as well as additional utilities and labor requirements that are necessary to run the additional equipment. In the current study a number of design decisions and process parameters were identified to have potential for considerable impact to the process resource requirements and process economics. These areas are introduced below, studied only in the context of the most promising feedstock.
2.7.1. Water Recycle Loop
One of the most important conclusions from the economic analysis presented in Section 3, is the major effect of the raw materials cost to each plants’ economic performance. Apart from the cost of the fermentation feedstock, this cost source also includes the cost of fresh water, which is a rather significant cost factor. It is indicative to mention that the crude glycerol process uses about 58 kg of water for every kg of crystalline succinic acid produced. The largest users of water in the process are the ion exchangers, that utilize water for their regeneration and wash in each cycle. The second larger consumer of water is the media preparation.
For this reason, an integrated system of water recycling from the downstream processing to the upstream processing part of the plant has been designed. Although, most of the water exiting the downstream processes (centrifugation, filtration, ion exchange, carbon column) is highly contaminated with various salts and impurities, there is a water stream that could be utilized after prior treatment. More specifically, the water removed in the evaporation system, the process vapor condensate (PVC) is expected to contain only a small amount of volatiles, such as acetic acid. A reverse osmosis membrane unit is proposed for the purification of the PVC.
The vapor from the last stage of the evaporator is condensed against cooling water (P-45) and then mixed with the condensates from the previous stages (P-48). The combined condensate is led to a reverse osmosis unit (P-59/RO/101) for the removal of any impurities contained in the process condensate and then mixed with fresh water. The final water stream is being distributed to the processes that demand water in the flowsheet via a flow distribution unit (P-63/FDIS-105). The respective flowsheet section with information about the related mass and energy balances (steam tables) is provided as a part of the Supplementary Material (Figure S1 and Table S10). After implementing the above models in the existing flowsheet of the crude glycerol feedstock (as the most profitable one), another techno-economic calculation is being performed. The objective is to evaluate the influence of the water recycle loop to the process economics.
2.7.2. Mother Liquor Recycle Loop
Another approach for enhancing the plant’s economic performance is the investigation of the bleed fraction in the mother liquor recycle loop. The mother liquor separated from the massecuite (crystals slurry) has a reduced purity and is partially recycled back to the evaporator. In this loop a bleed stream is necessary to remove part of the mother liquor, in order to control the amount recirculated impurities. Inevitably, this bleed stream will also discard some product, thus reducing the yield of the crystallization area. A parametric analysis is being performed, aiming to investigate the influence of the recycle percentage in the crystallization performance (crystals purity) and process economics.
2.7.3. Number of Evaporation Stages
Prior to the crystallization the product solution is dilute. It needs to be concentrated in order to facilitate the subsequent continuous cooling crystallization. The most effective way to dewater the product solution is to use a multi effect evaporator. The number of evaporation stages influences the process economics. Generally, by increasing the number of stages the amount of steam required is decreased, thus reducing the underlying process operating costs. However, the capital investment for the evaporator increases. The analysis was performed for a single stage evaporator up to a 5-stage evaporation system, with an objective to find the optimal number of effects that maximizes the process economics. Vapor recompression options were outside the scope of this study.
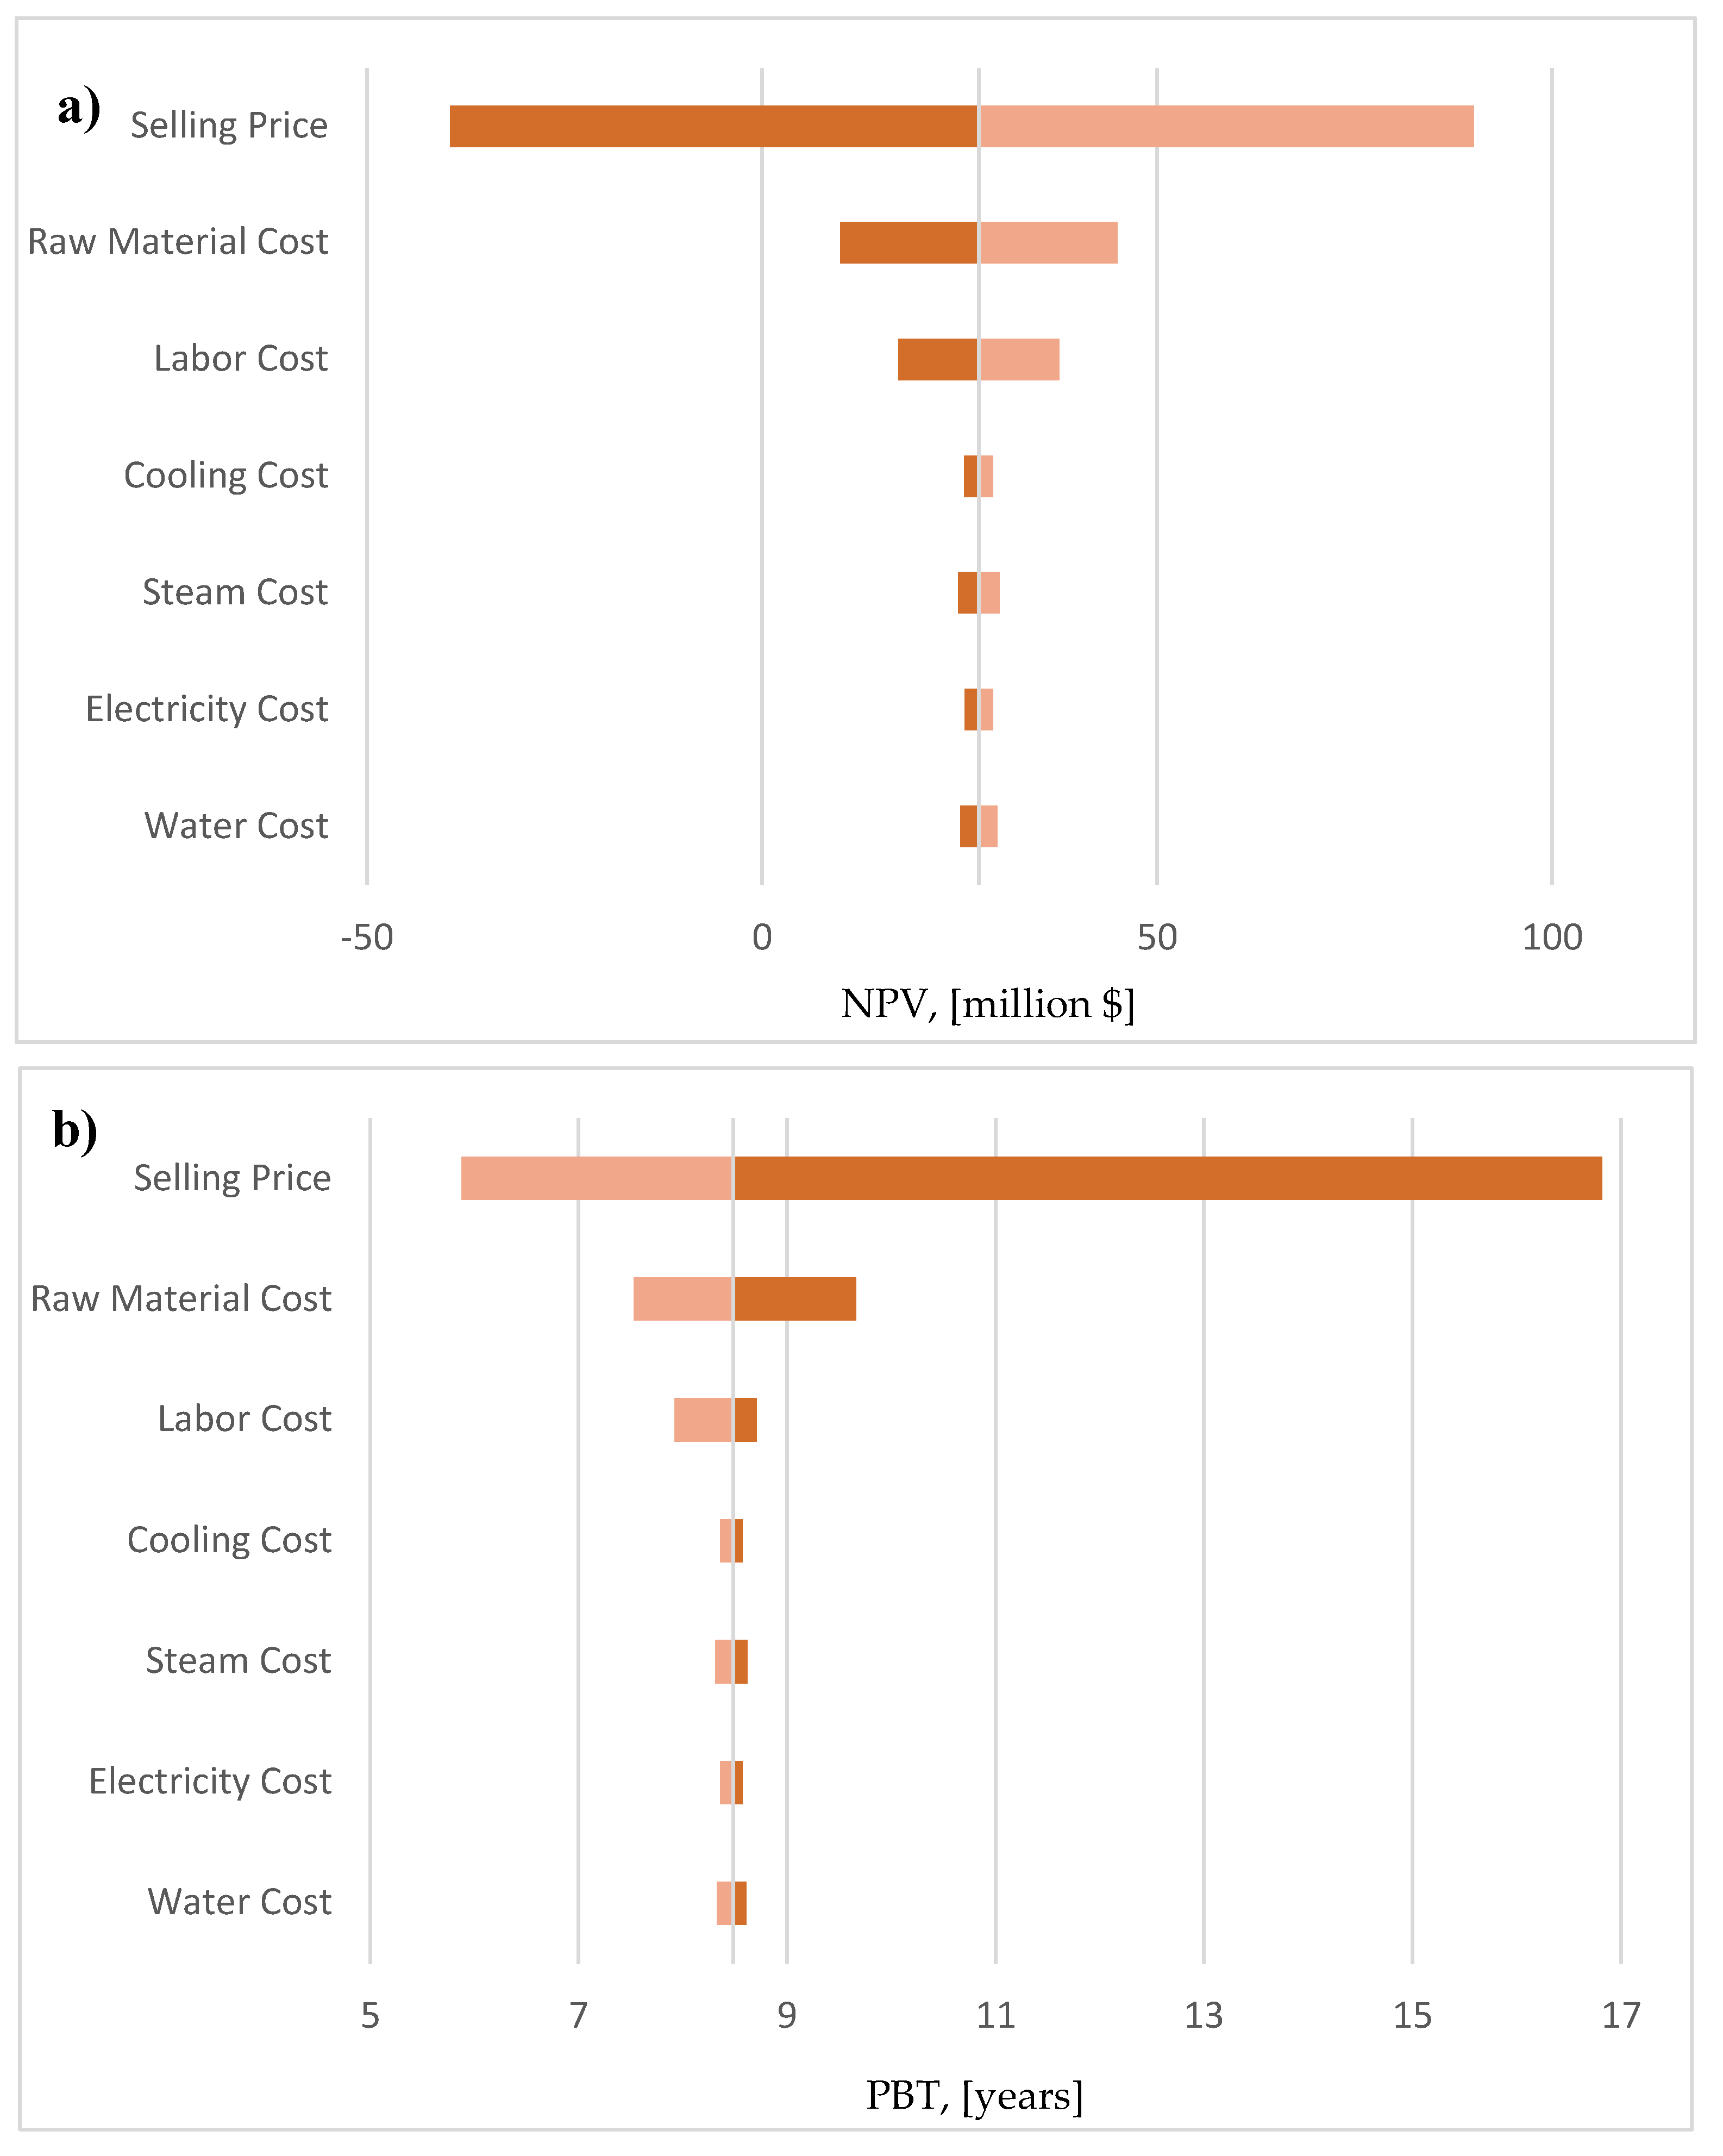
2.8. Sensitivity Analysis
All the results of the analysis performed above, were based onto some assumptions and simplifications that were made, especially in some economic input parameters that were assigned to the model (the majority of them listed in Table 3). These assumptions introduce some uncertainty in the economic results of the analysis. It is important to quantify in a way this uncertainty that was introduced to the calculations, by performing a sensitivity analysis.
The analysis was based on the construction of tornado diagrams, which incorporate the influence of specific input parameters of the model, such as cost of raw materials, utilities and labor, to certain important economic KPI’s, such as the Net Present Value (NPV) and the Payback Time (PBT).
3. Results
3.1. Techno-Economic Analysis Results
Table 3 summarizes the key design and economic specifications for the execution of the simulation. As discussed in Section 1, the selling price for succinic acid was assumed at 5 $/kg.
Table 4 presents the most important economic performance indicators for each case study. As a first conclusion, all three alternatives illustrate a profitability potential due to the positive Net Present Values (NPV). It is also important to highlight that the crude glycerol flowsheet is the most profitable one, leading to a unit production cost of 3.59 $/kg with about 28% Gross Margin. The glucose syrup flowsheet results in a slightly more expensive unit production cost, just by 2% at 3.65 $/kg. The pure glycerol flowsheet appears to be considerably more expensive, making it marginally profitable, featuring a unit production cost of 4.69 $/kg with a 6.03% Gross Margin.
A deeper analysis into the results, reveals that the major difference between the flowsheets is the respective annual operating cost for each case. It is worth mentioning that even though the pure glycerol case has a slightly lower CAPEX than the crude glycerol case (107 M$ versus 115 M$, respectively), it is a more expensive process with poor financial KPI’s, due to the significantly higher operating costs. Pure glycerol has approximately 10 times larger purchase price than crude glycerol. The additional CAPEX and OPEX requirements for purifying the crude glycerol are offset by its much lower purchase price, offering a promising alternative to produce succinic acid using as feedstock a byproduct of the biodiesel industry.
However, this is not the only factor affecting the process economics. Similarly, to the pure glycerol, the purchase cost of glucose syrup is approximately 8 times bigger than the purchase cost of crude glycerol. Moreover, glucose fermentation to succinic acid features a longer cycle time and a lower productivity than the glycerol fermentation. The above characteristics should increase the production cost considerably. However, the economic performance of the glucose syrup flowsheet is quite close to the crude glycerol case. The primary reason for this is that glucose has a higher conversion efficiency of substrate to succinic acid. Part of the feedstock is used for biomass growth and another part for product formation. The overall balance of succinic acid produced in the production fermentor divided by the total amount of glycerol or glucose used for the batch and fed-batch media of the seed and main fermentors is 51% and 91%, respectively. Moreover, although the fermentation residence time is larger in the glucose fermentation flowsheet, the glucose to succinic acid fermentation is anaerobic, allowing for larger fermentor vessels, and better economies of scale. The above advantages of the glucose fermentation process, reduce the difference in the production costs compared to the cheap crude glycerol process, although the latter still remains the most attractive alternative both in terms of production cost, but also in terms of sustainability.
A visual representation of the operating cost breakdown for each case is presented in Figure 7.
For the pure glycerol case, the most important cost factors contributing to the annual operating costs are the cost of raw materials (40%), facility dependent (27%) and labour costs (15%). Regarding the glucose syrup case, the most important cost factors are facility dependent costs (36%), cost of raw materials (25%) and labour costs (17%), while for the most profitable crude glycerol flowsheet the most important cost factors are facility dependent costs (39%), labour costs (21%), with the raw materials costs contributing only 16% to the total operating costs of the facility.
Focusing on the break-even analysis, Table 5 presents the corresponding linear equations linking the NPV with the product selling price for each flowsheet (with the values of R2), as well as the calculated minimum selling prices at the break-even point. The linear approximations are very accurate as the values of the residuals R2 indicate, thus minimizing the uncertainty in the resulting minimum selling prices accuracy.
3.2. Capacity Analysis Results
Figure 8 shows the effect of the number of fermenters to the total capital investment (TCI), annual operating costs (AOC) and NPV. As expected, the capital investment increases linearly as the number of reactors increases, while a slight increase in the annual operating costs is also noted. Even though, both capital and operating costs increase, the final NPV of the investment increases as the facility achieves larger production capacities for the final product. This is also clear in Figure 9, that shows the relation between the capacity and two important economic indicators (payback time and unit production cost). It is important to highlight that the unit production cost for the maximum annual capacity of 30,000 MT is 3.08 $/kg (14.2% decrease) thus revealing the potential of this scale-up methodology.
Figure 10 compares the relation between unit production cost and capacity for the two different scale-up approaches. It can be seen that for annual capacities greater than 15,000 MT, the most efficient way to increase the capacity is to increase the scale of the reactors and not the number of the reactors. The production cost reduction curve for the reactor-scale up reaches lower production costs and features a greater reduction potential. This can be attributed to the fact that, the major equations, and functions for the calculation of equipment cost, have exponential correlations between the reactor cost and its volume. Therefore, it becomes more efficient to perform a scale-up action by increasing the volume rather than the number of the reactors. It is important to mention that for the maximum capacity of 30,000 MT, the unit production cost can potentially drop down to 2.83 $/kg (representing a 21.2% decrease).
Due to the remarkable potential of decreasing the production cost, this approach was also implemented for the remaining two flowsheets (pure glycerol and glucose syrup), to investigate the impact of the scale-up in the economics of those flowsheets too. Figure 11 shows the outcome of this analysis, comparing the unit production costs for all three alternatives for various capacities up to 40,000 MT/year. A further increase in the capacity (more than 40,000 MT per year), would violate the cap limit that was set for the reactors volume (900 m3). It is clear that even the less financially attractive case of pure glycerol, shows a significantly improved performance, with much lower production costs at higher production capacities.
3.3. Parametric Analysis Results
The flowrate of the PVC in the base case flowsheet is estimated at 21.5 MT/h. In the base case scenario, this stream is headed to a wastewater treatment facility, with an assumed cost of 5 $/MT, while the cost of fresh water was assumed at 3 $/MT. Based on these assumed costs and the annual operating time of the plant (49 weeks per year) the potential savings with the integration of the water recycle loop is 1.3 M$ annually. However, the installation of the reverse osmosis membrane unit adds additional cost sources to the plant (electricity, labor, membrane replacement etc.). Due to these reasons, the installation of the water recycling loop did not improve the economics considerably, although the production cost was estimated at 3.57 $/kg, representing a negligible reduction of about 0.02$/kg. Apart from the small impact on process economics, the process water savings are more than 18MT/h, and the water total consumption was dropped to about 53.5 kg of water for every kg of crystalline succinic acid produced.
As expected, increasing the recycle percentage of mother liquor results to an increase in the crystallization yield and to the overall plant’s production capacity. Figure 4 presents the impact of increasing recycling on NPV and on unit production cost of succinic acid. However, it should be mentioned that such an increase in the mother liquor recycle percentage, decreases the purity in the crystallization section and ultimately of the final crystal product. The commercial purity specification for succinic acid is at 99.5% w/w. Although the flowsheet comfortably meets this purity specification, producing crystals with a purity higher than 99.9% w/w, in a real plant this purity could be lower, due to e.g. inclusion of impurities inside the crystals as they are grown, or perhaps due to imperfect purification in the ion exchangers or in the carbon column that will introduce more impurities in the crystallization loop. In any case, if more impurities enter the crystallization area it is more likely that higher mother liquor recycling percentages cannot be achieved. In the absence of real process data, the maximum mother liquor recycling assumed was at 65%, corresponding to a crystallization yield of about 98%. This already optimistic crystallization yield was allowed, since one of the major impurities that enter the crystallization system is acetic acid, which is in fact volatile, as such separated in the evaporator. This additional “bleed” of impurity in the crystallization area, unlike the mother liquor bleed, does not withdraw any product in order to be separated, since the succinic acid is practically not volatile in the operating pressures and temperatures of the evaporators, and it is not expected to be found in considerable quantities in the process vapor condensate. The presence of acetic acid in the PVC was a limiting factor in the water recycling concept above. However, it is weirdly advantageous to have to deal with volatile impurities in the crystallization area, since these are separated in the evaporator and do not reduce the crystallization yield. Considering the above discussion and insights, changing the mother liquor recycle percentage to 65% (the base case flowsheets presented in Chapter 2 had a recycle rate of 50%), a 3.82% increase in the NPV of the crude glycerol plant was achieved.
Moving onto the evaporation system design, it can be seen in Figure 13.a, that although the increase in the capital cost is linear, the respective decrease in the total cost of steam for the process follows an exponential trend. Due to this difference, there is a trade-off between the two KPI’s, which is important to investigate. Figure 13.b presents the NPV and unit production cost for each individual case (of evaporation design). Even though, the use of more evaporation stages decreases further the unit production cost, this decrease does not compensate the increased capital investment required. Due to this reason, the optimal number of evaporation stages – that maximized the NPV of the investment – is three. This is one of the cases, in which performing process optimization with economic objectives (NPV) leads to different results compared to the optimization that relies on operating and technical KPI’s such as the steam consumption. By implementing this approach in the existing flowsheet (the base case design utilized 4 stages as reported in Chapter 2), an increase of 4.5% in the NPV is achieved (154 M$).
3.4. Sensitivity Analysis
Due to page limitations, the sensitivity analysis results from the pure glycerol case will be discussed in this section, as it is the only marginally profitable scenario. However, the respective plots for the other two cases are presented in Figure S.9 of the Supplementary Material. The influence of a variation of 10% in the values of the product selling price and the cost of raw materials, utilities and labor to the NPV and PBT is presented in Figure 7. It can be observed that, the pure glycerol scenario could be potentially non-profitable, with negative NPV’s and extremely high PBT’s only in a potential decrease in the selling price of the product. In every other case (increased operating costs, such as utilities, raw materials or labor), the facility seems to still be financially profitable. It is also worth mentioning, that after the selling price of the product, the two most important input parameters that affect the process economics of this case are the cost labor and the cost of the pure glycerol feedstock. On the other hand, the cost of steam, water and electricity seems to introduce minor uncertainty to the process economics. It should be borne in mind that this is another interpretation of the results presented in Figure 14. Finally, it should be mentioned that the sensitivity analysis for the other two cases (presented more extensively in Figure S.9 of the Supplementary Material), showed that they are always profitable, presenting positive economic indices in all cases.
4. Discussion
All the results presented in Section 3.3 and Section 3.4 revealed optimal values for important process variables that enhance the economic performance of the facility. The final part of the simulation work is to explore the financial outcome of a case, where all the optimal results are being applied together in the same flowsheet. More specifically for a crude glycerol facility of 15,000 MT annual capacity, without water recycle loop, with 65% mother liquor recycle rate and with 3 evaporation stages the Net Present Value is estimated at 158,5 M$, representing a 7.3% increase from the base case design. The respective unit production cost for succinic acid decreased from 3.59 $/kg to 3.51 $/kg.
The final optimal scenario is defined by adding the results of the capacity analysis. Although it is clear from the analysis presented in Section 3.3 that scaling up the equipment is the most financially efficient approach, the approach of increasing the number of production fermentation reactors has been adopted instead, as the scale-up results can be totally trustworthy without any uncertainty in the operation of the plant. For a plant of 30,000 MT capacity utilizing crude glycerol, the optimal design results in a significant reduction in the unit production cost to 3.05 $/kg which represents a 15% decrease. A comparison between relevant literature contributions related to technoeconomic assessments of succinic acid process design is presented on Table 6. It should be mentioned that each specific case involves different processing steps, modelling and design assumptions and reporting years. As such conclusions cannot be safely derived and the reader is suggested to review the details of each study. For example, the results of this study cannot be directly compared to those in Table 6, as the inflation, utilities costs and other cost factors (e.g. equipment cost parameters and indicators) are significantly higher than those reported before 2020.
This final result is a strong indication that the production of bio-succinic acid can potentially be a financially profitable green investment utilizing second generation biomass feedstocks. It is quite important to mention that the target production cost for succinic acid (1-2$/kg) is still some technological steps away, however it is reasonable to assume that it is feasible to achieve.
Possible technological steps that still need to be made include the improvement of fermentation technologies for larger fermenter volumes (probably shifting from aerobic to anaerobic conditions), as that would enhance the production capacity of the plants. Other improvements include modifications of the operation mode of the process such as continuous fermentation, or integrated systems with partial separations. When the technological state would provide the means to increase capacities up to 50,000 – 100,000 MT, the production costs could fall below 2 $/kg. Finally, another consideration is the market demand and dynamics which have a rather complex and uncertain impact in the economics of such investments.
5. Conclusions
This work leads to the conclusion that fermentative succinic acid production can be an economically viable technology. Three alternative pathways for producing succinic acid were investigated and the respective process models were developed and optimized. Techno-economic assessment revealed that the potential utilization of crude glycerol is the most promising alternative, a very important result since a by-product from another bioprocess can be efficiently utilized and converted into the high-value product of succinic acid. Such a relation could pave the framework for the potential design and construction of integrated facilities in which biodiesel and succinic acid are co-produced.
Supplementary Materials
The following supporting information can be downloaded at: Preprints.org.
Author Contributions
Conceptualization, G.M. and N.M.; methodology, G.M. and N.M.; software, G.M and N.M..; validation, GM..; formal analysis, G.M..; investigation, G.M..; resources, D.P..; writing—original draft preparation, G.M.; writing—review and editing, M.G., N.M., D.P.; visualization, G.M.; supervision, D.P. and M.G.; project administration, M.G. and D.P.. All authors have read and agreed to the published version of the manuscript.
Funding
This research received no external funding.
Institutional Review Board Statement
Not applicable
Informed Consent Statement
Not applicable
Data Availability Statement
Data can be available upon request.
References
- M. Ferone, A. Ercole, F. Raganati, G. Olivieri, P. Salatino, and A. Marzocchella, “Efficient succinic acid production from high-sugar-content beverages by Actinobacillus succinogenes,” Biotechnol Prog, vol. 35, no. 5, Sep. 2019. [CrossRef]
- K. K. Cheng, X. B. Zhao, J. Zeng, and J. A. Zhang, “Biotechnological production of succinic acid: Current state and perspectives,” Biofuels, Bioproducts and Biorefining, vol. 6, no. 3. pp. 302–318, May 2012. [CrossRef]
- J. M. Pinazo, M. E. Domine, V. Parvulescu, and F. Petru, “Sustainability metrics for succinic acid production: A comparison between biomass-based and petrochemical routes,” Catal Today, vol. 239, pp. 17–24, Jan. 2015. [CrossRef]
- Aden, J. Bozell, J. Holladay, and J. F. White, “Top Value Added Chemicals From Biomass. Volume 1-Results of Screening for Potential Candidates From Sugars and Synthesis Gas Chemical Transformations Initiative View project Special Issue ‘Hydrothermal Liquefaction for Aviation and Maritime Sustainable Fuels’ View project,” 2004. [Online]. Available: https://www.researchgate.net/publication/235062870.
- J. H. Ahn, Y. S. Jang, and S. Y. Lee, “Production of succinic acid by metabolically engineered microorganisms,” Current Opinion in Biotechnology, vol. 42. Elsevier Ltd, pp. 54–66, Dec. 01, 2016. [CrossRef]
- S. K. Lin, R. Luque, J. H. Clark, C. Webb, and C. Du, “Wheat-based biorefining strategy for fermentative production and chemical transformations of succinic acid,” Biofuels, Bioproducts and Biorefining, vol. 6, no. 1. pp. 88–104, Jan. 2012. [CrossRef]
- M. Sauer, D. Porro, D. Mattanovich, and P. Branduardi, “Microbial production of organic acids: expanding the markets,” Trends in Biotechnology, vol. 26, no. 2. pp. 100–108, Feb. 2008. [CrossRef]
- Pateraki et al., “Actinobacillus succinogenes: Advances on succinic acid production and prospects for development of integrated biorefineries,” Biochemical Engineering Journal, vol. 112. Elsevier B.V., pp. 285–303, Aug. 15, 2016. [CrossRef]
- M. J. Biddy, C. Scarlata, and C. Kinchin, “Chemicals from Biomass: A Market Assessment of Bioproducts with Near-Term Potential,” 2016. [Online]. Available: www.nrel.gov/publications.
- M. Ferone, F. Raganati, G. Olivieri, and A. Marzocchella, “Bioreactors for succinic acid production processes,” Critical Reviews in Biotechnology, vol. 39, no. 4. Taylor and Francis Ltd, pp. 571–586, May 19, 2019. [CrossRef]
- R. Dickson et al., “Sustainable bio-succinic acid production: superstructure optimization, techno-economic, and lifecycle assessment,” Energy Environ Sci, vol. 14, no. 6, pp. 3542–3558, Jun. 2021. [CrossRef]
- Mancini et al., “Economic and environmental analysis of bio-succinic acid production: From established processes to a new continuous fermentation approach with in-situ electrolytic extraction,” Chemical Engineering Research and Design, vol. 179, pp. 401–414, Mar. 2022. [CrossRef]
- R. Kumar, B. Basak, and B. H. Jeon, “Sustainable production and purification of succinic acid: A review of membrane-integrated green approach,” Journal of Cleaner Production, vol. 277. Elsevier Ltd, Dec. 20, 2020. [CrossRef]
- M. L. A. Jansen and W. M. van Gulik, “Towards large scale fermentative production of succinic acid,” Current Opinion in Biotechnology, vol. 30. Elsevier Ltd, pp. 190–197, 2014. [CrossRef]
- N. P. Nghiem, S. Kleff, and S. Schwegmann, “Succinic acid: Technology development and commercialization,” Fermentation, vol. 3, no. 2. MDPI AG, Jun. 01, 2017. [CrossRef]
- V. Narisetty et al., “Technological advancements in valorization of second generation (2G) feedstocks for bio-based succinic acid production,” Bioresource Technology, vol. 360. Elsevier Ltd, Sep. 01, 2022. [CrossRef]
- J. P. Tan, A. A. I. Luthfi, S. F. A. Manaf, T. Y. Wu, and J. M. Jahim, “Incorporation of CO2 during the production of succinic acid from sustainable oil palm frond juice,” Journal of CO2 Utilization, vol. 26, pp. 595–601, Jul. 2018. [CrossRef]
- J. Akhtar, A. Idris, and R. Abd. Aziz, “Recent advances in production of succinic acid from lignocellulosic biomass,” Applied Microbiology and Biotechnology, vol. 98, no. 3. Springer Verlag, pp. 987–1000, Feb. 01, 2014. [CrossRef]
- K. Filippi, N. Georgaka, M. Alexandri, H. Papapostolou, and A. Koutinas, “Valorisation of grape stalks and pomace for the production of bio-based succinic acid by Actinobacillus succinogenes,” Ind Crops Prod, vol. 168, Sep. 2021. [CrossRef]
- C. C. J. Leung, A. S. Y. Cheung, A. Y. Z. Zhang, K. F. Lam, and C. S. K. Lin, “Utilisation of waste bread for fermentative succinic acid production,” Biochem Eng J, vol. 65, pp. 10–15, Jun. 2012. [CrossRef]
- Stylianou, E., Carvajal-Arroyo, J. M., Ladakis, D., Lin, C. S. K., Eßmann, V., Dörr, S., ... & Pateraki, C. (2023). Development of an electrochemical membrane bioreactor for succinic acid production and in situ separation with engineered Yarrowia lipolytica cultivated on municipal biowaste hydrolysate. Chemical Engineering Journal, 466, 142877.
- Mancini, S. S.; Mansouri, K. V. Gernaey, J. Luo, and M. Pinelo, “From second generation feed-stocks to innovative fermentation and downstream techniques for succinic acid production,” Crit Rev Environ Sci Technol, vol. 50, no. 18, pp. 1829–1873, Sep. 2020. [CrossRef]
- Q. Li et al., “Production of succinate from simply purified crude glycerol by engineered escherichia coli using two-stage fermentation,” Bioresour Bioprocess, vol. 5, no. 1, 2018. [CrossRef]
- M. Carvalho, M. Matos, C. Roca, and M. A. M. Reis, “Succinic acid production from glycerol by Actinobacillus succinogenes using dimethylsulfoxide as electron acceptor,” N Biotechnol, vol. 31, no. 1, pp. 133–139, Jan. 2014. [CrossRef]
- Q. Li, H. Wu, Z. Li, and Q. Ye, “Enhanced succinate production from glycerol by engineered Escherichia coli strains,” Bioresour Technol, vol. 218, pp. 217–223, Oct. 2016. [CrossRef]
- Z. Cui, C. Gao, J. Li, J. Hou, C. S. K. Lin, and Q. Qi, “Engineering of unconventional yeast Yarrowia lipolytica for efficient succinic acid production from glycerol at low pH,” Metab Eng, vol. 42, pp. 126–133, Jul. 2017. [CrossRef]
- R. Y. Rogers, H. Theron, and H. Xiaohui, “Fermentation of Glycerol to Organic Acids,” PCT/US11ASOO1, Apr. 24, 2014.
- K. F. Lam, C. C. J. Leung, H. M. Lei, and C. S. K. Lin, “Economic feasibility of a pilot-scale fermentative succinic acid production from bakery wastes,” Food and Bioproducts Processing, vol. 92, no. 3, pp. 282–290, 2014. [CrossRef]
- B. Cok, I. Tsiropoulos, A. L. Roes, and M. K. Patel, “Succinic acid production derived from carbohydrates: An energy and greenhouse gas assessment of a platform chemical toward a bio-based economy,” Biofuels, Bioproducts and Biorefining, vol. 8, no. 1, pp. 16–29, Jan. 2014. [CrossRef]
- X. Li and E. Mupondwa, “Empirical analysis of large-scale bio-succinic acid commercialization from a technoeconomic and innovation value chain perspective: BioAmber biorefinery case study in Canada,” Renewable and Sustainable Energy Reviews, vol. 137, Mar. 2021. [CrossRef]
- J. J. Beauprez, M. De Mey, and W. K. Soetaert, “Microbial succinic acid production: Natural versus metabolic engineered producers,” Process Biochemistry, vol. 45, no. 7, pp. 1103–1114, Jul. 2010. [CrossRef]
- M. Alexandri et al., “Downstream separation and purification of succinic acid from fermentation broths using spent sulphite liquor as feedstock,” Sep Purif Technol, vol. 209, pp. 666–675, Jan. 2019. [CrossRef]
- J. Y. Law et al., “Recovery of succinic acid from fermentation broth by forward osmosis-assisted crystallization process,” J Memb Sci, vol. 583, pp. 139–151, Aug. 2019. [CrossRef]
- National Center for Biotechnology Information, “PubChem Compound Summary for CID 1110, Succinic Acid.
- Q. Li et al., “One step recovery of succinic acid from fermentation broths by crystallization,” Sep Purif Technol, vol. 72, no. 3, pp. 294–300, May 2010. [CrossRef]
- Ç. Efe, L. A. M. van der Wielen, and A. J. J. Straathof, “Techno-economic analysis of succinic acid production using adsorption from fermentation medium,” Biomass Bioenergy, vol. 56, pp. 479–492, Sep. 2013. [CrossRef]
- Orjuela, A. Orjuela, C. T. Lira, and D. J. Miller, “A novel process for recovery of fermentation-derived succinic acid: Process design and economic analysis,” Bioresour Technol, vol. 139, pp. 235–241, 2013. [CrossRef]
- J. A. Posada, L. E. Rincón, and C. A. Cardona, “Design and analysis of biorefineries based on raw glycerol: Addressing the glycerol problem,” Bioresour Technol, vol. 111, pp. 282–293, May 2012. [CrossRef]
- Vlysidis, M. Binns, C. Webb, and C. Theodoropoulos, “A techno-economic analysis of biodiesel biorefineries: Assessment of integrated designs for the co-production of fuels and chemicals,” Energy, vol. 36, no. 8, pp. 4671–4683, 2011. [CrossRef]
- U. Diwekar, D. Xiang, M. Abdul Shaik, and F. Shaikh, “The design and techno economic analysis of a succinic acid production facility.
Figure 1.
Pure glycerol flowsheet Section 100 from SuperPro Designer™ environment.
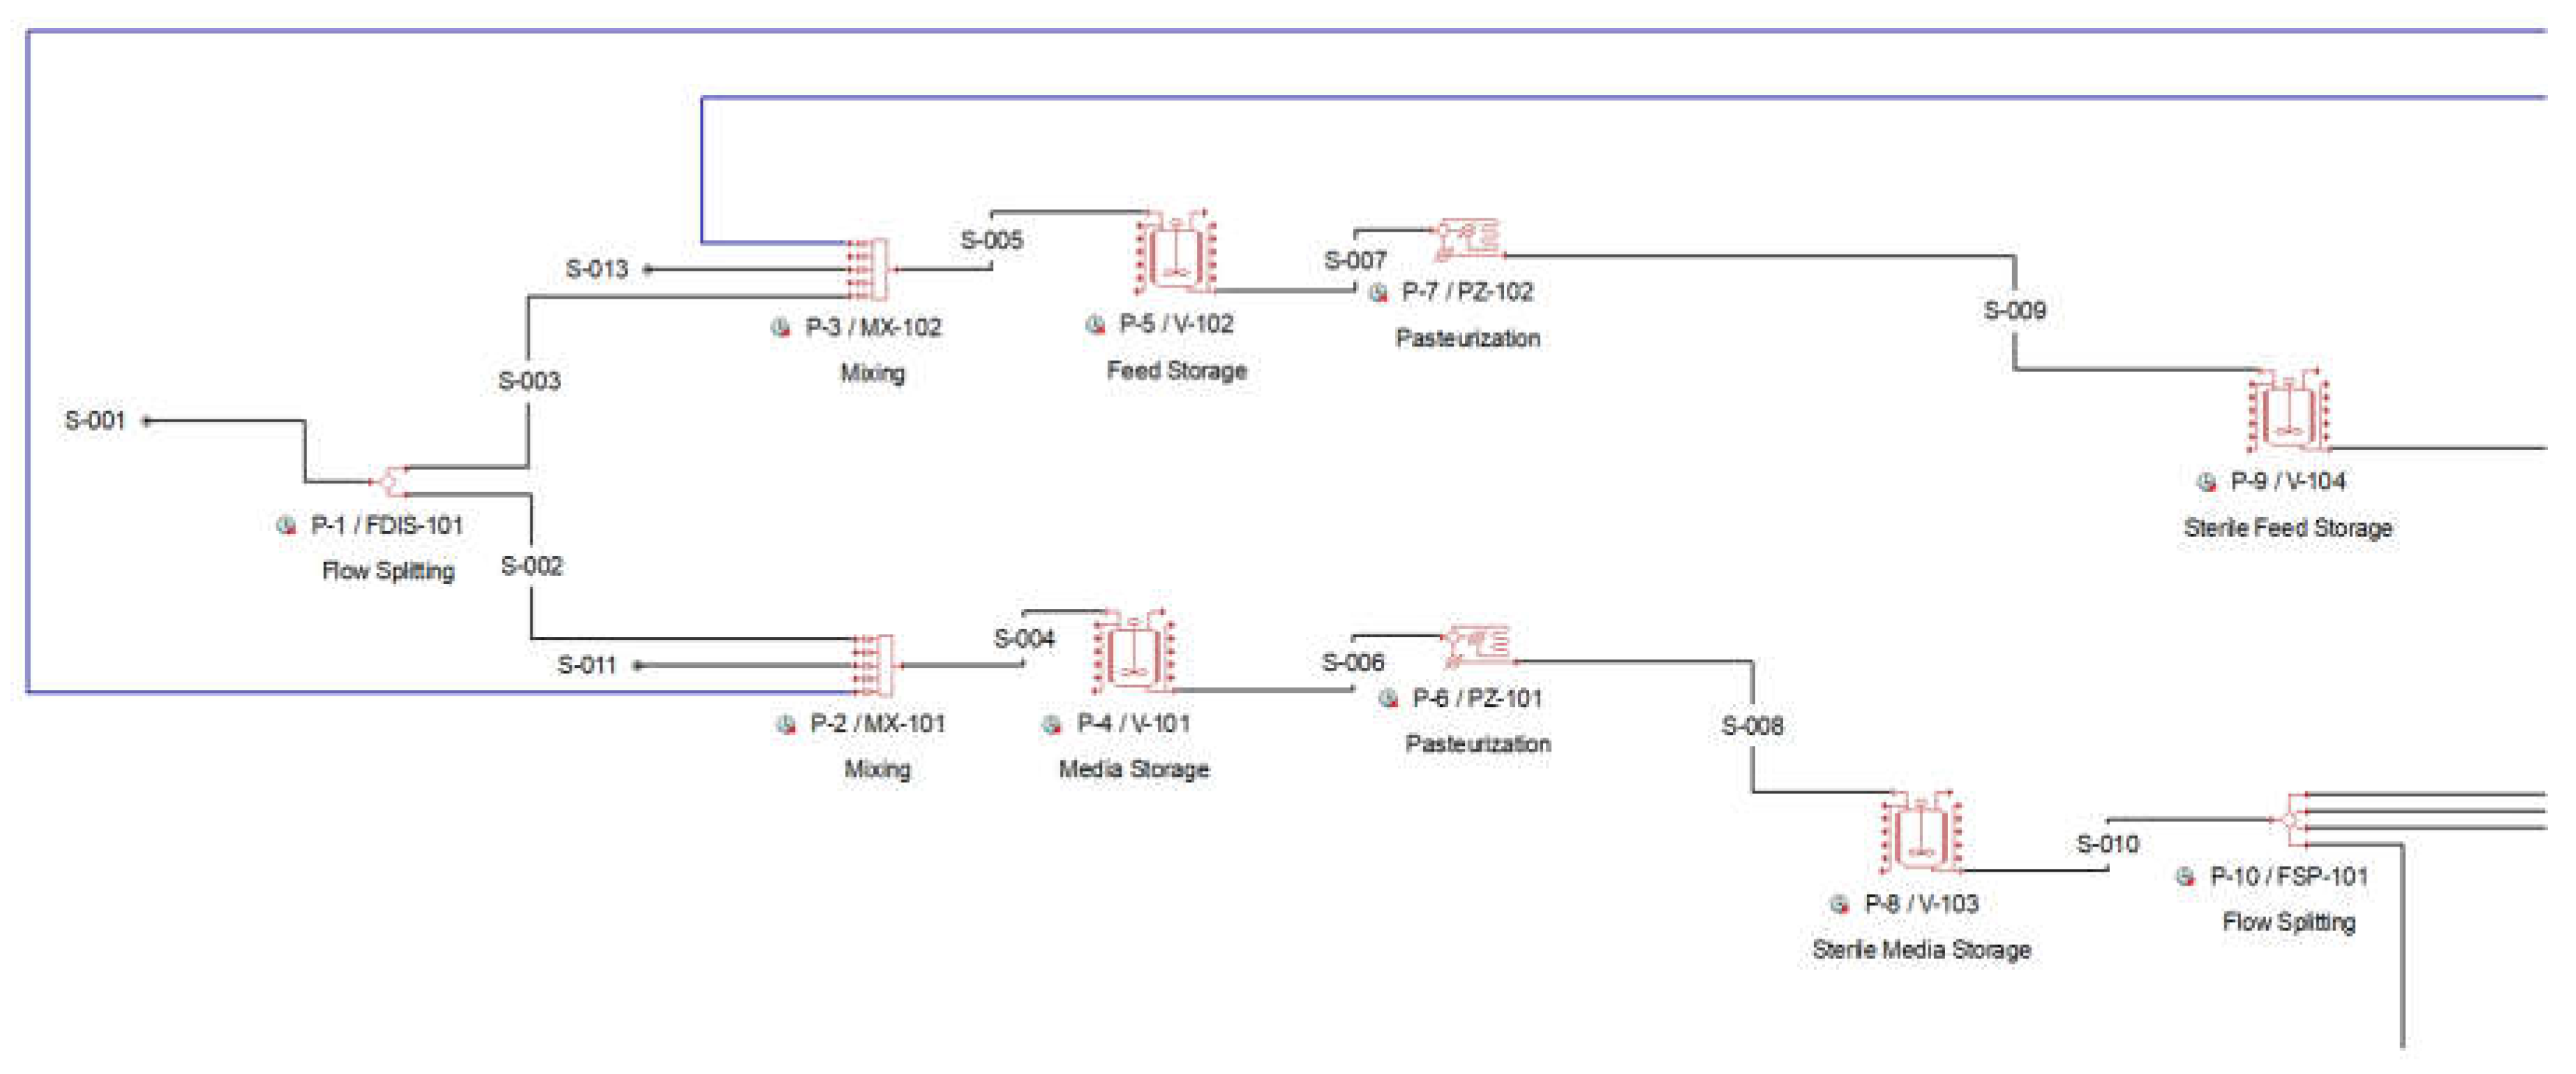
Figure 2.
Pure glycerol flowsheet Section 200 from SuperPro Designer™ environment.
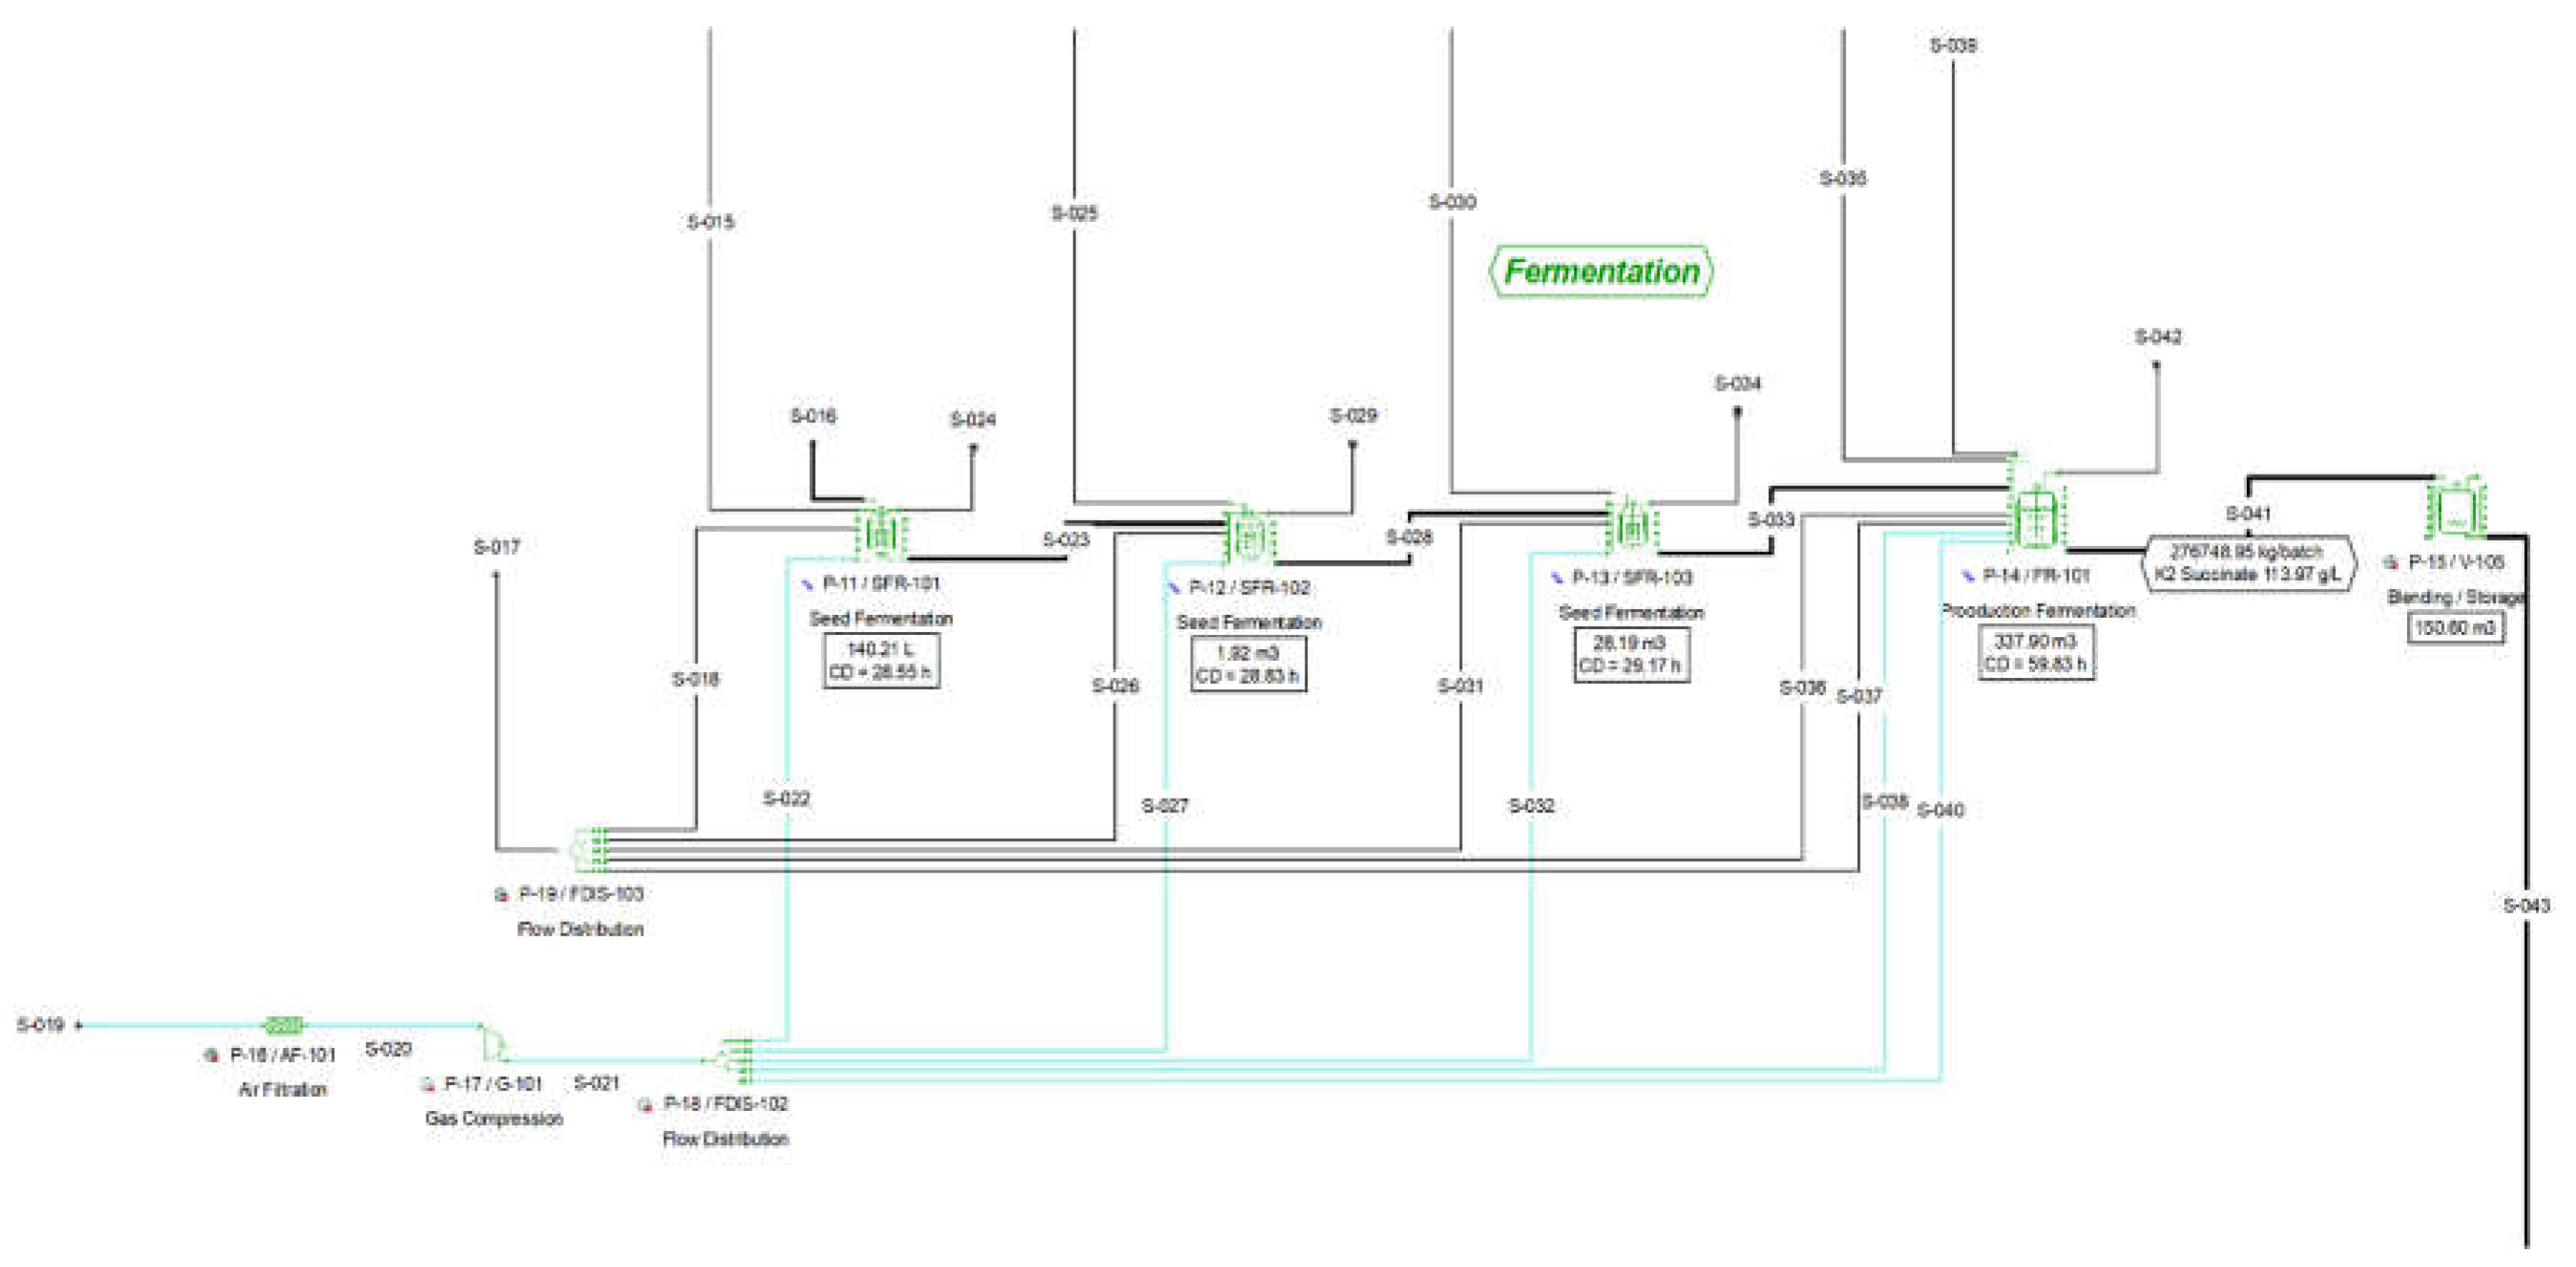
Figure 3.
Pure glycerol flowsheet Section 300(a) from SuperPro Designer™ environment.
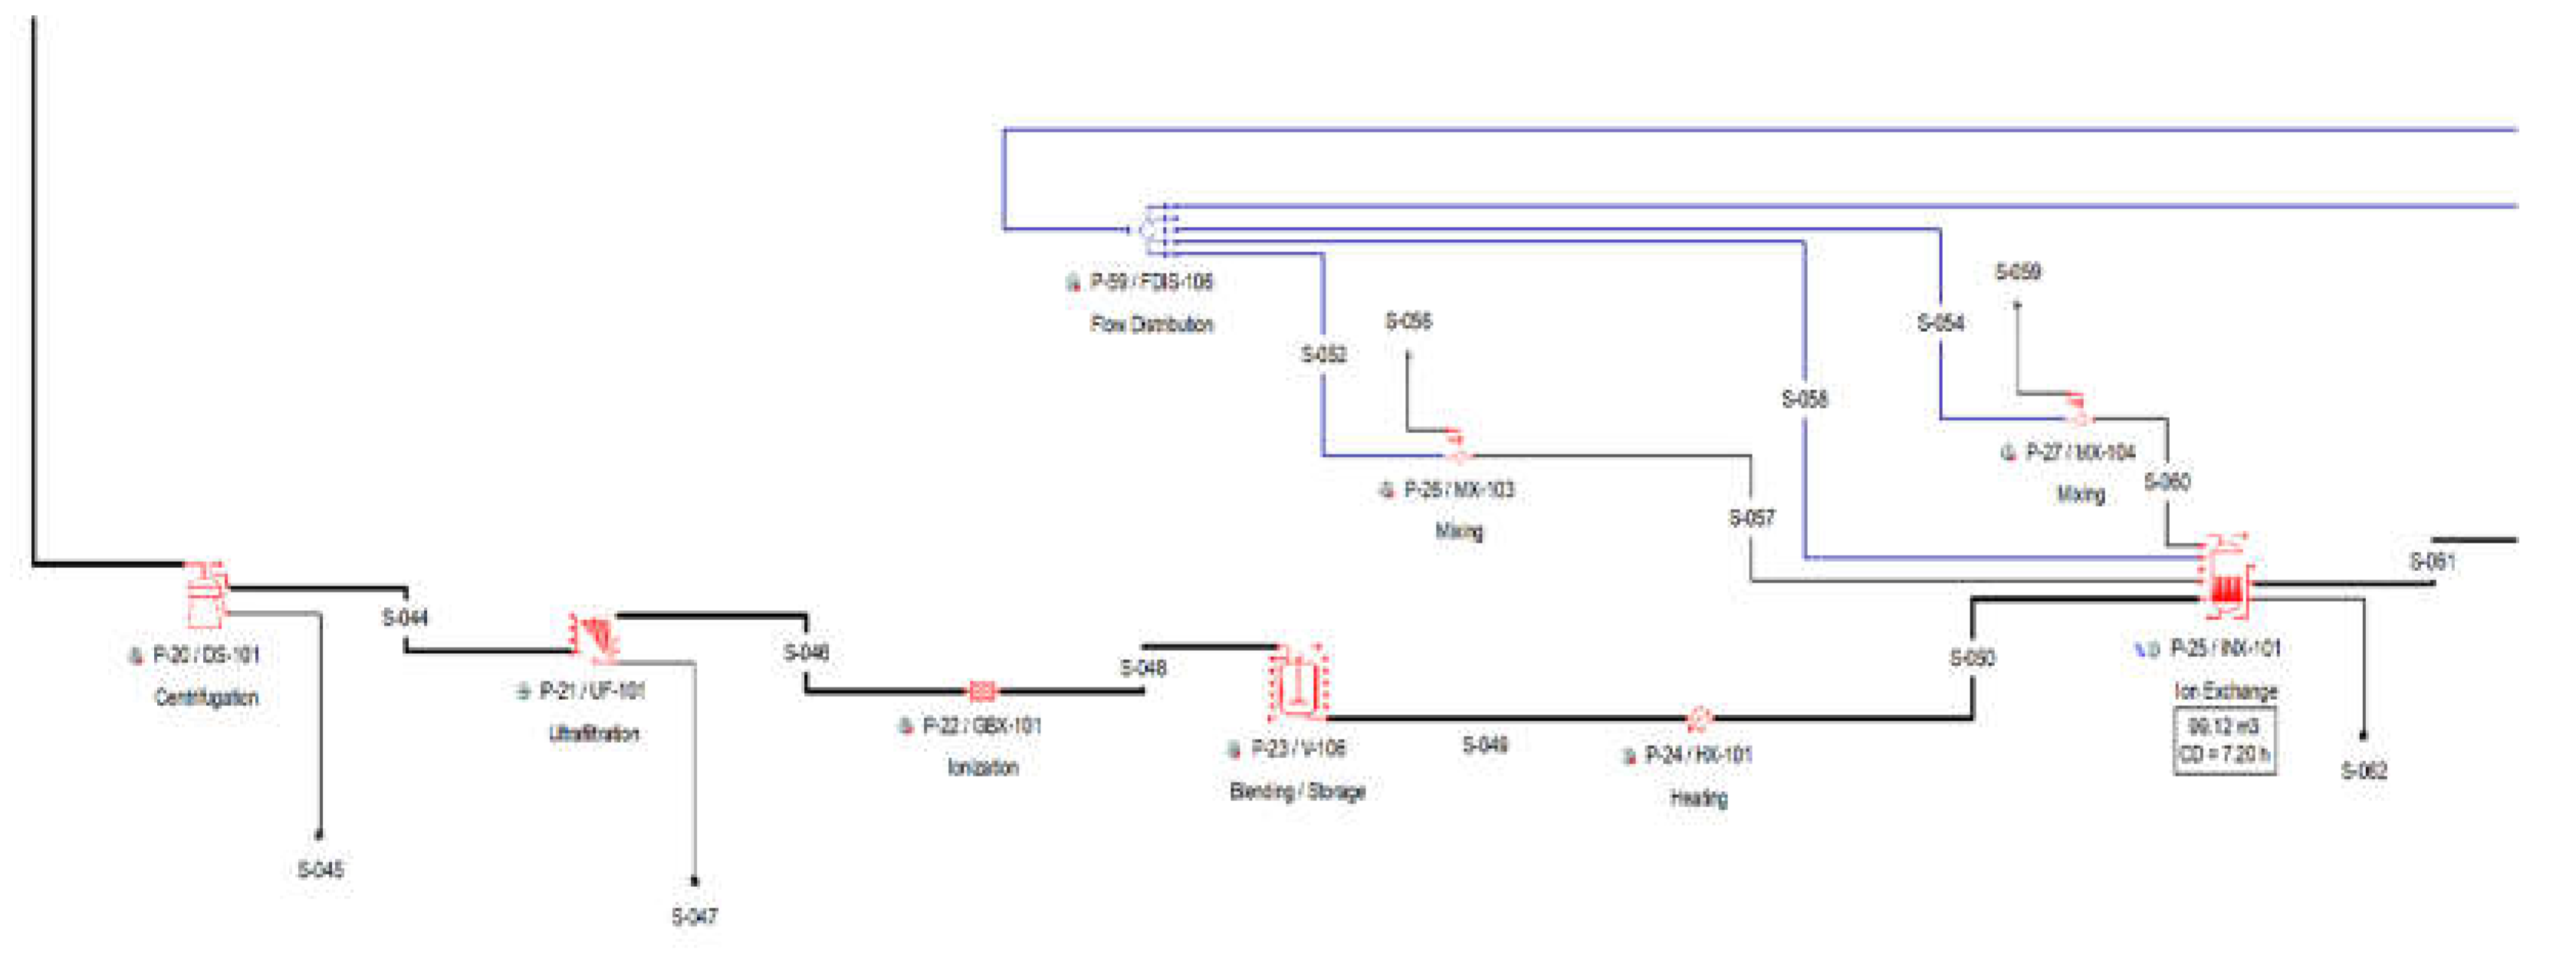
Figure 4.
Pure glycerol flowsheet Section 300(b) from SuperPro Designer™ environment.
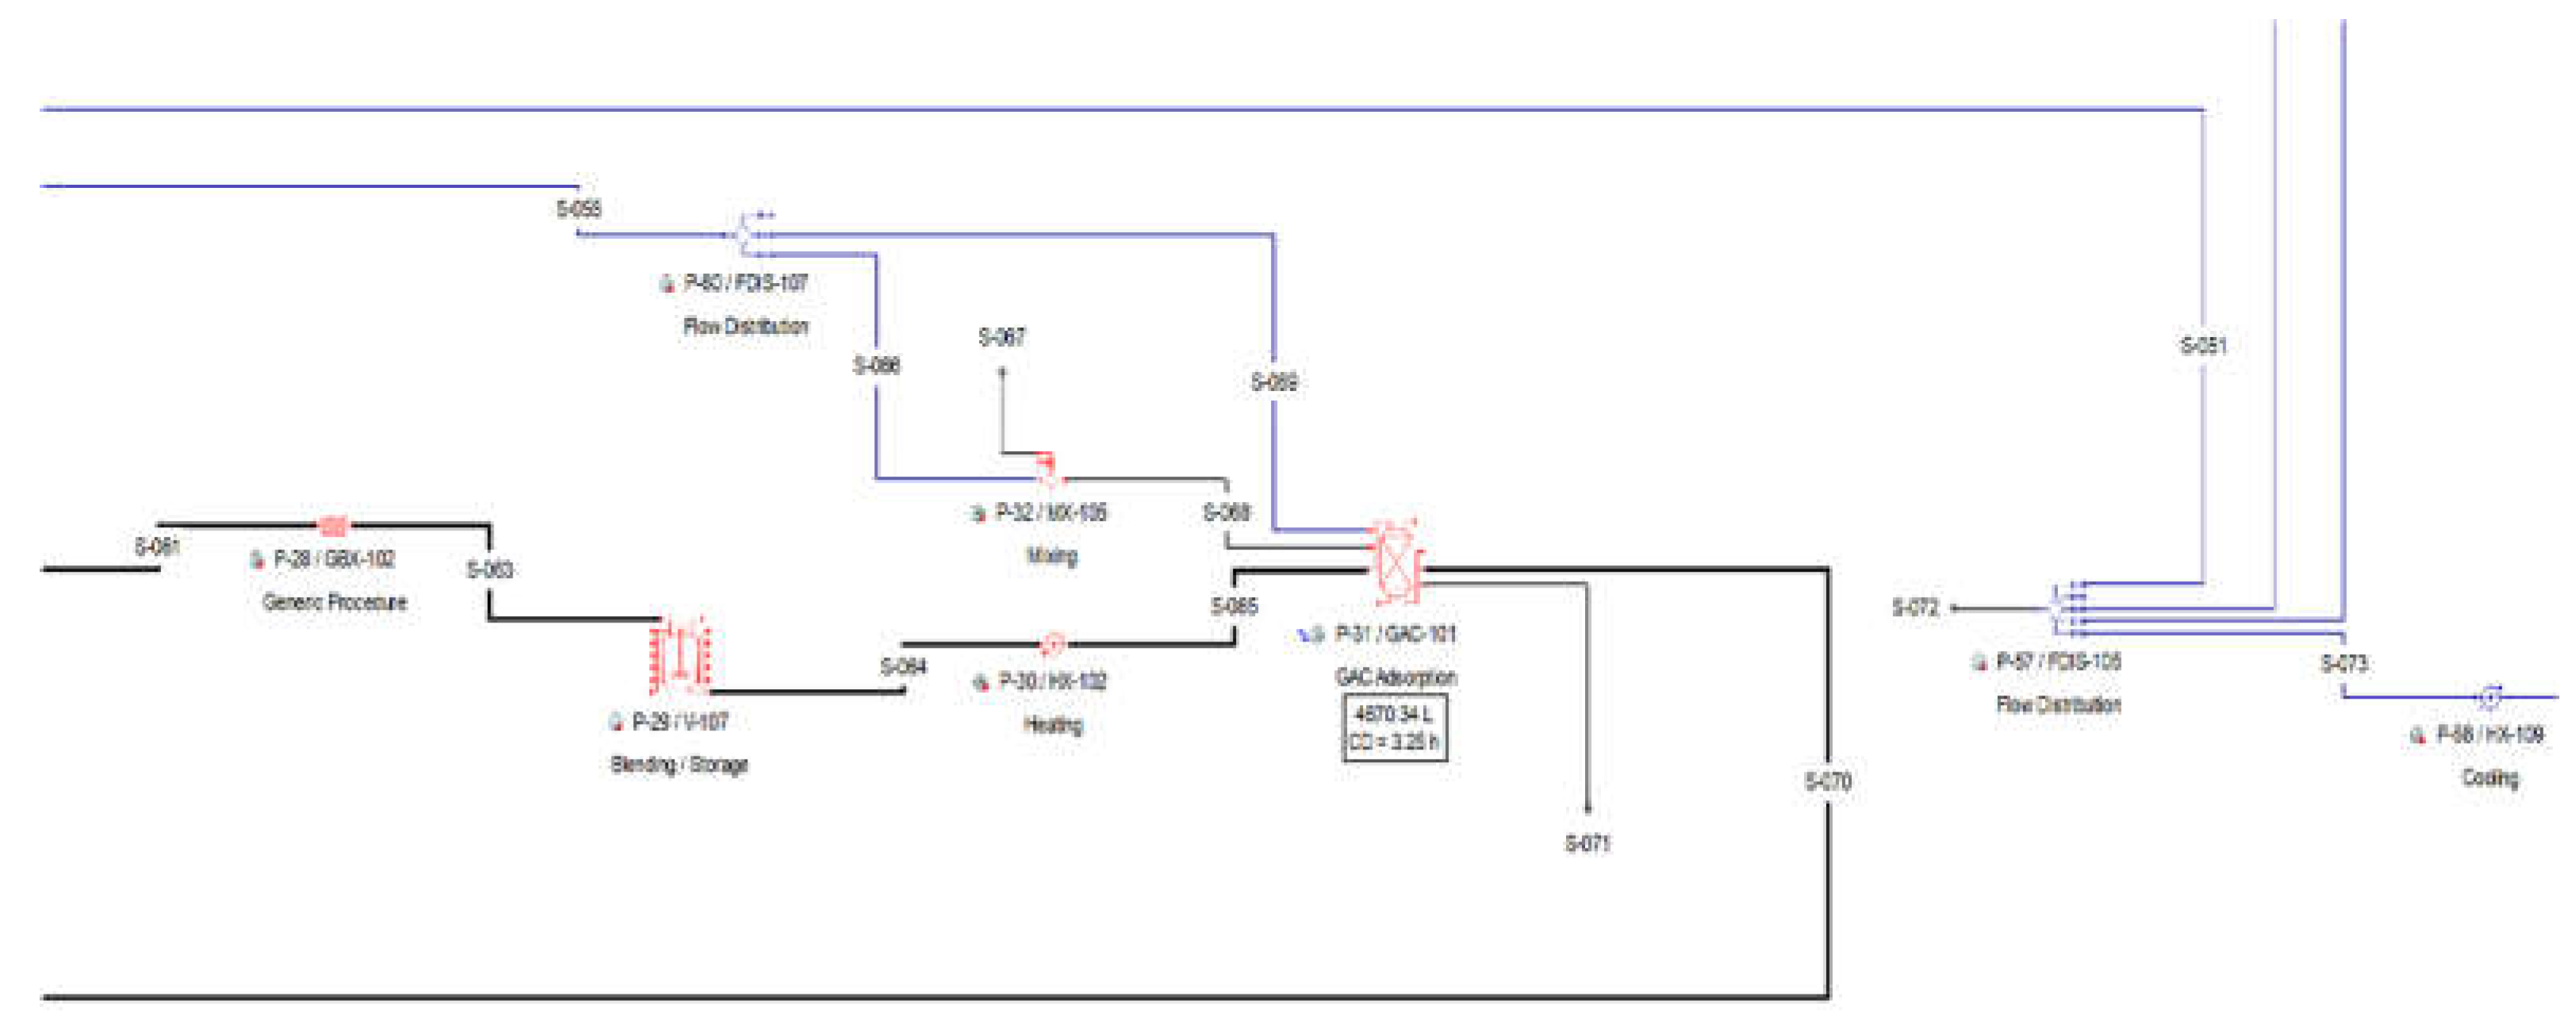
Figure 5.
Pure glycerol flowsheet Section 400(a) from SuperPro Designer™ environment.
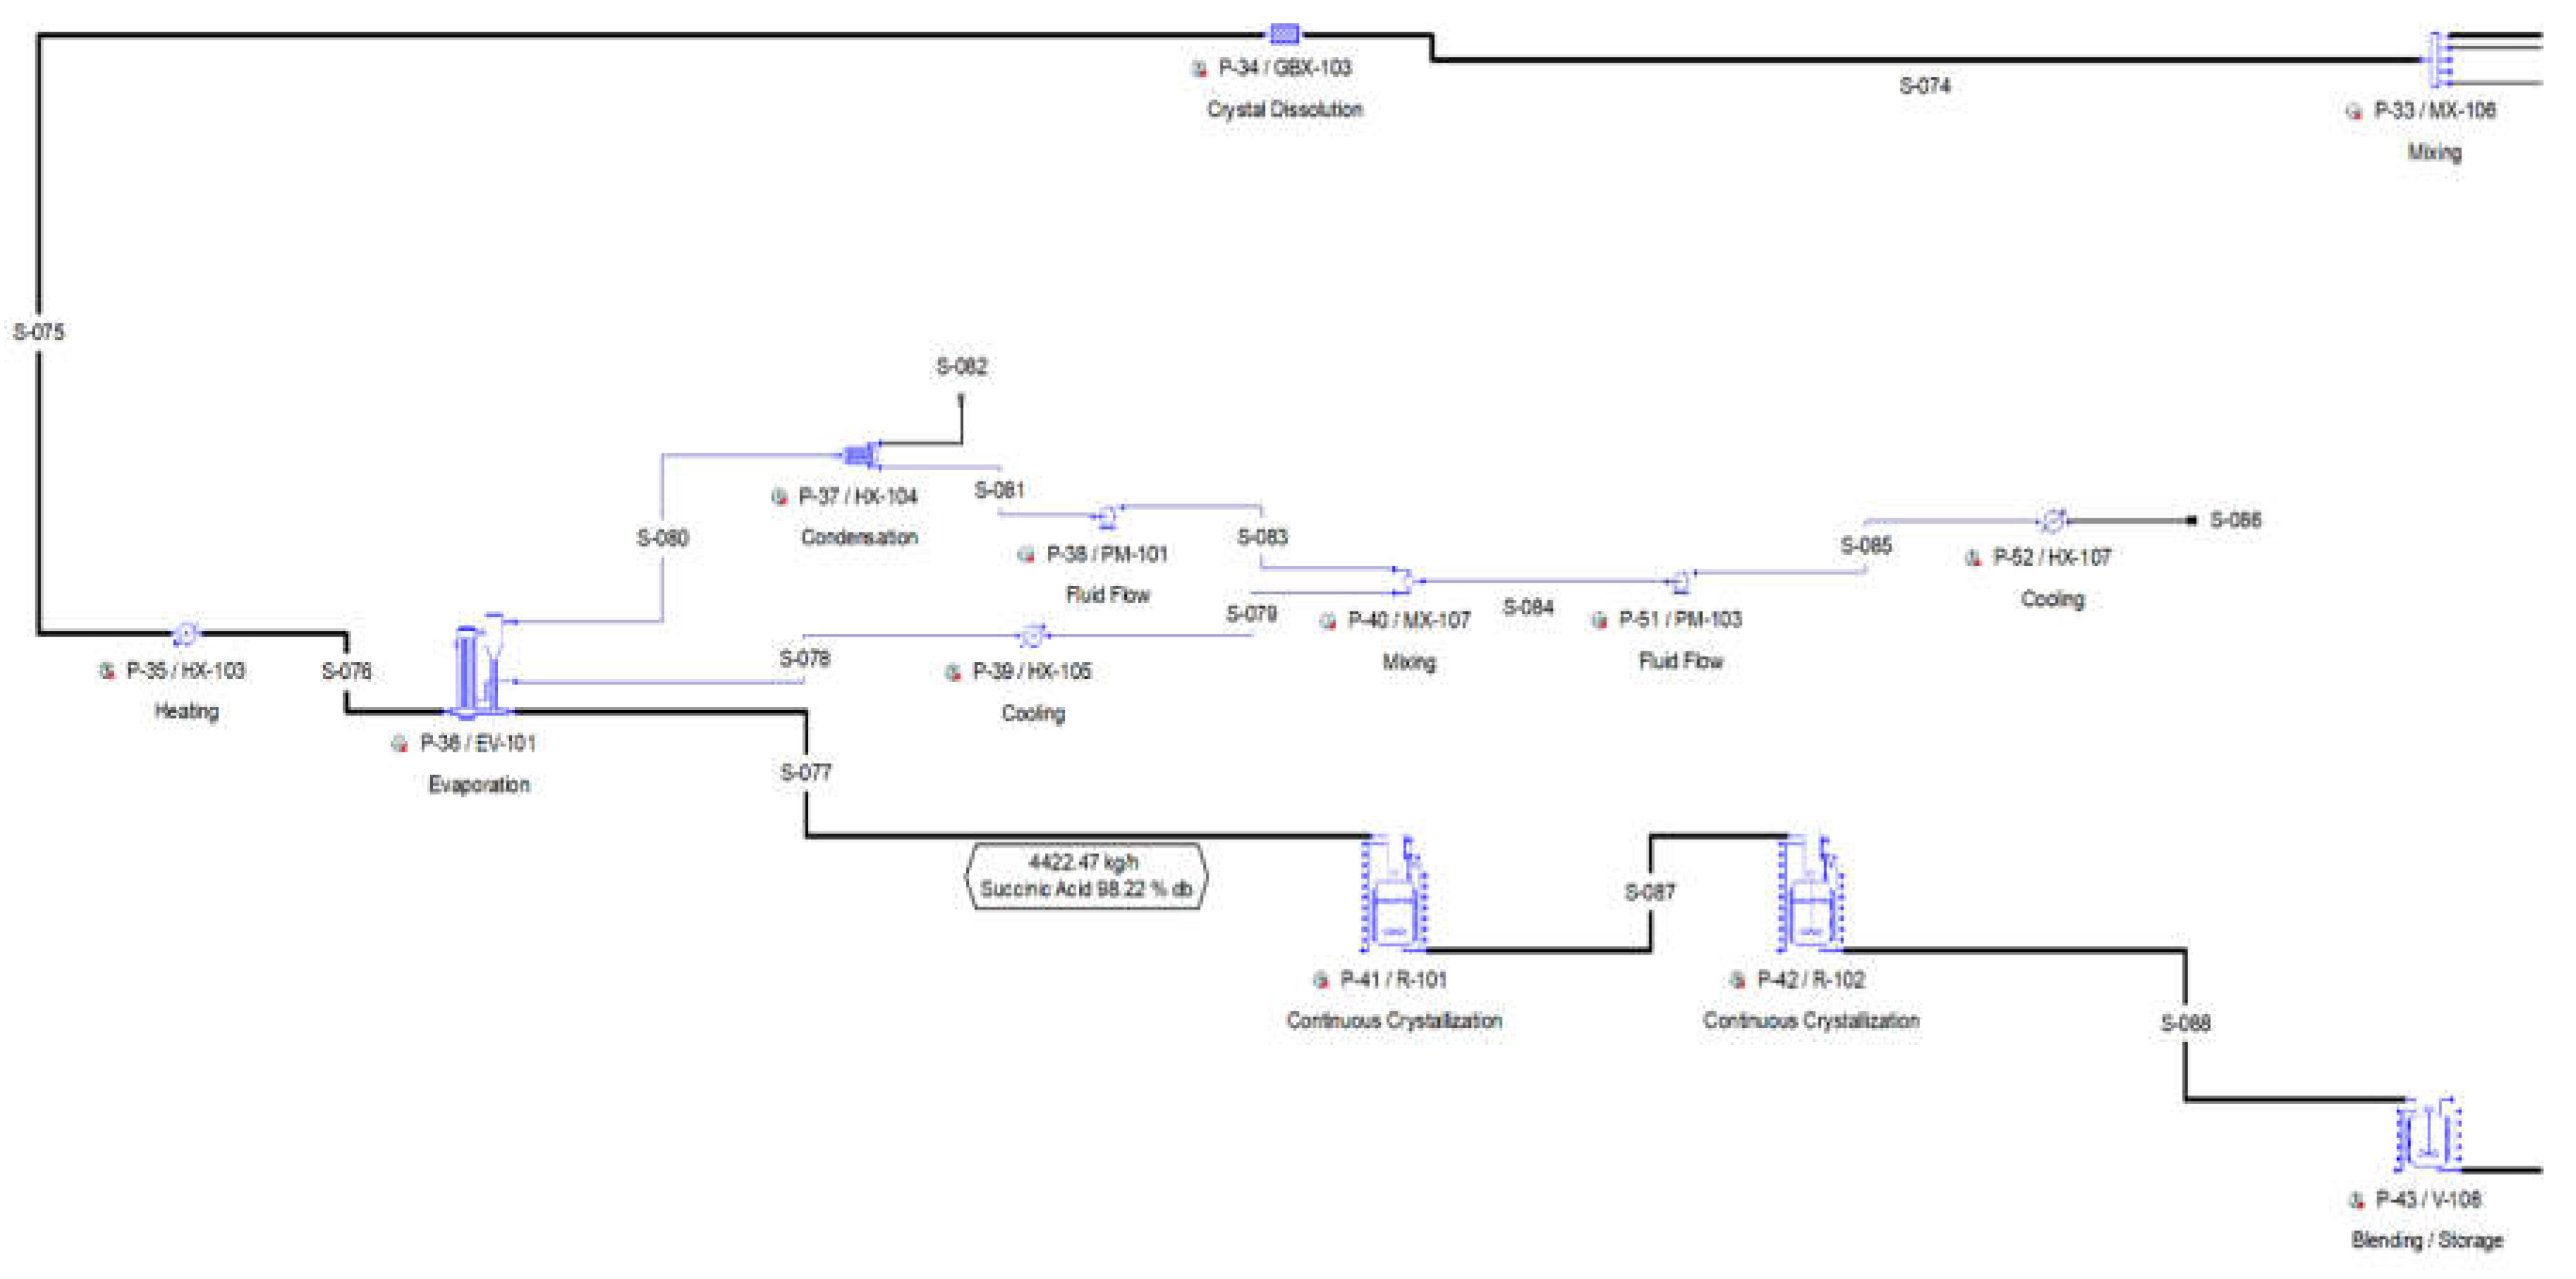
Figure 6.
Pure glycerol flowsheet Section 400(b) from SuperPro Designer™ environment.
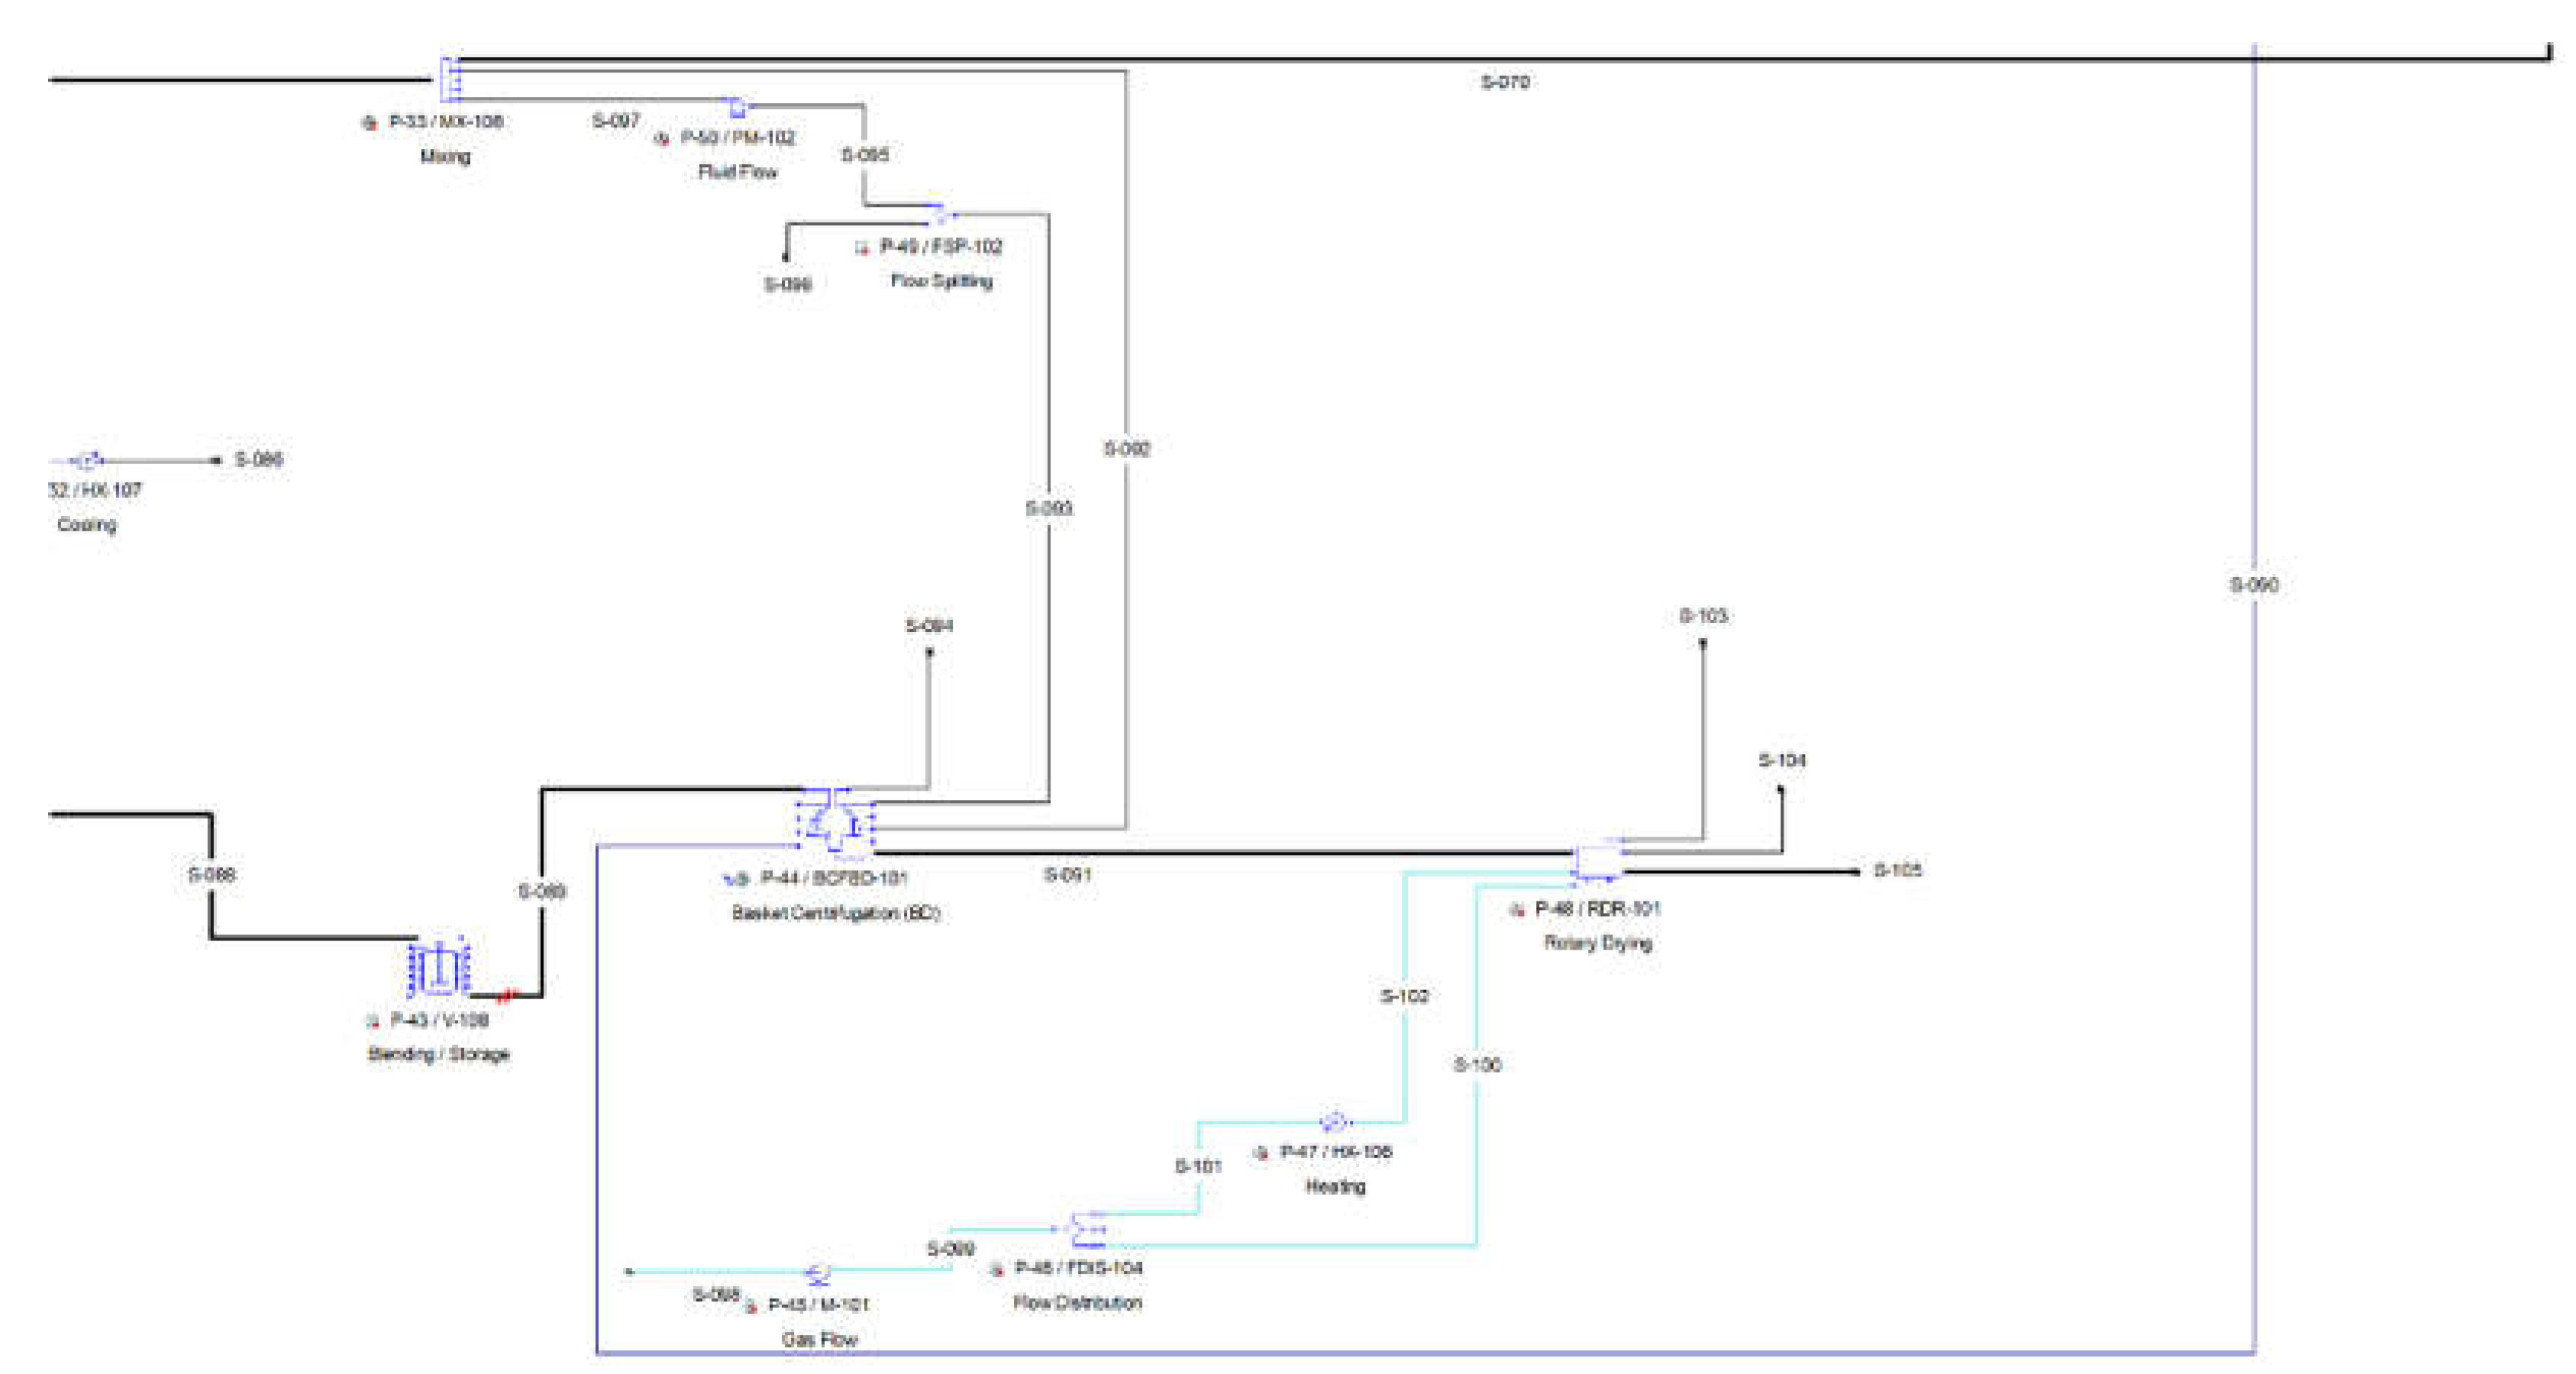
Figure 7.
Breakdown of annual operating cost.
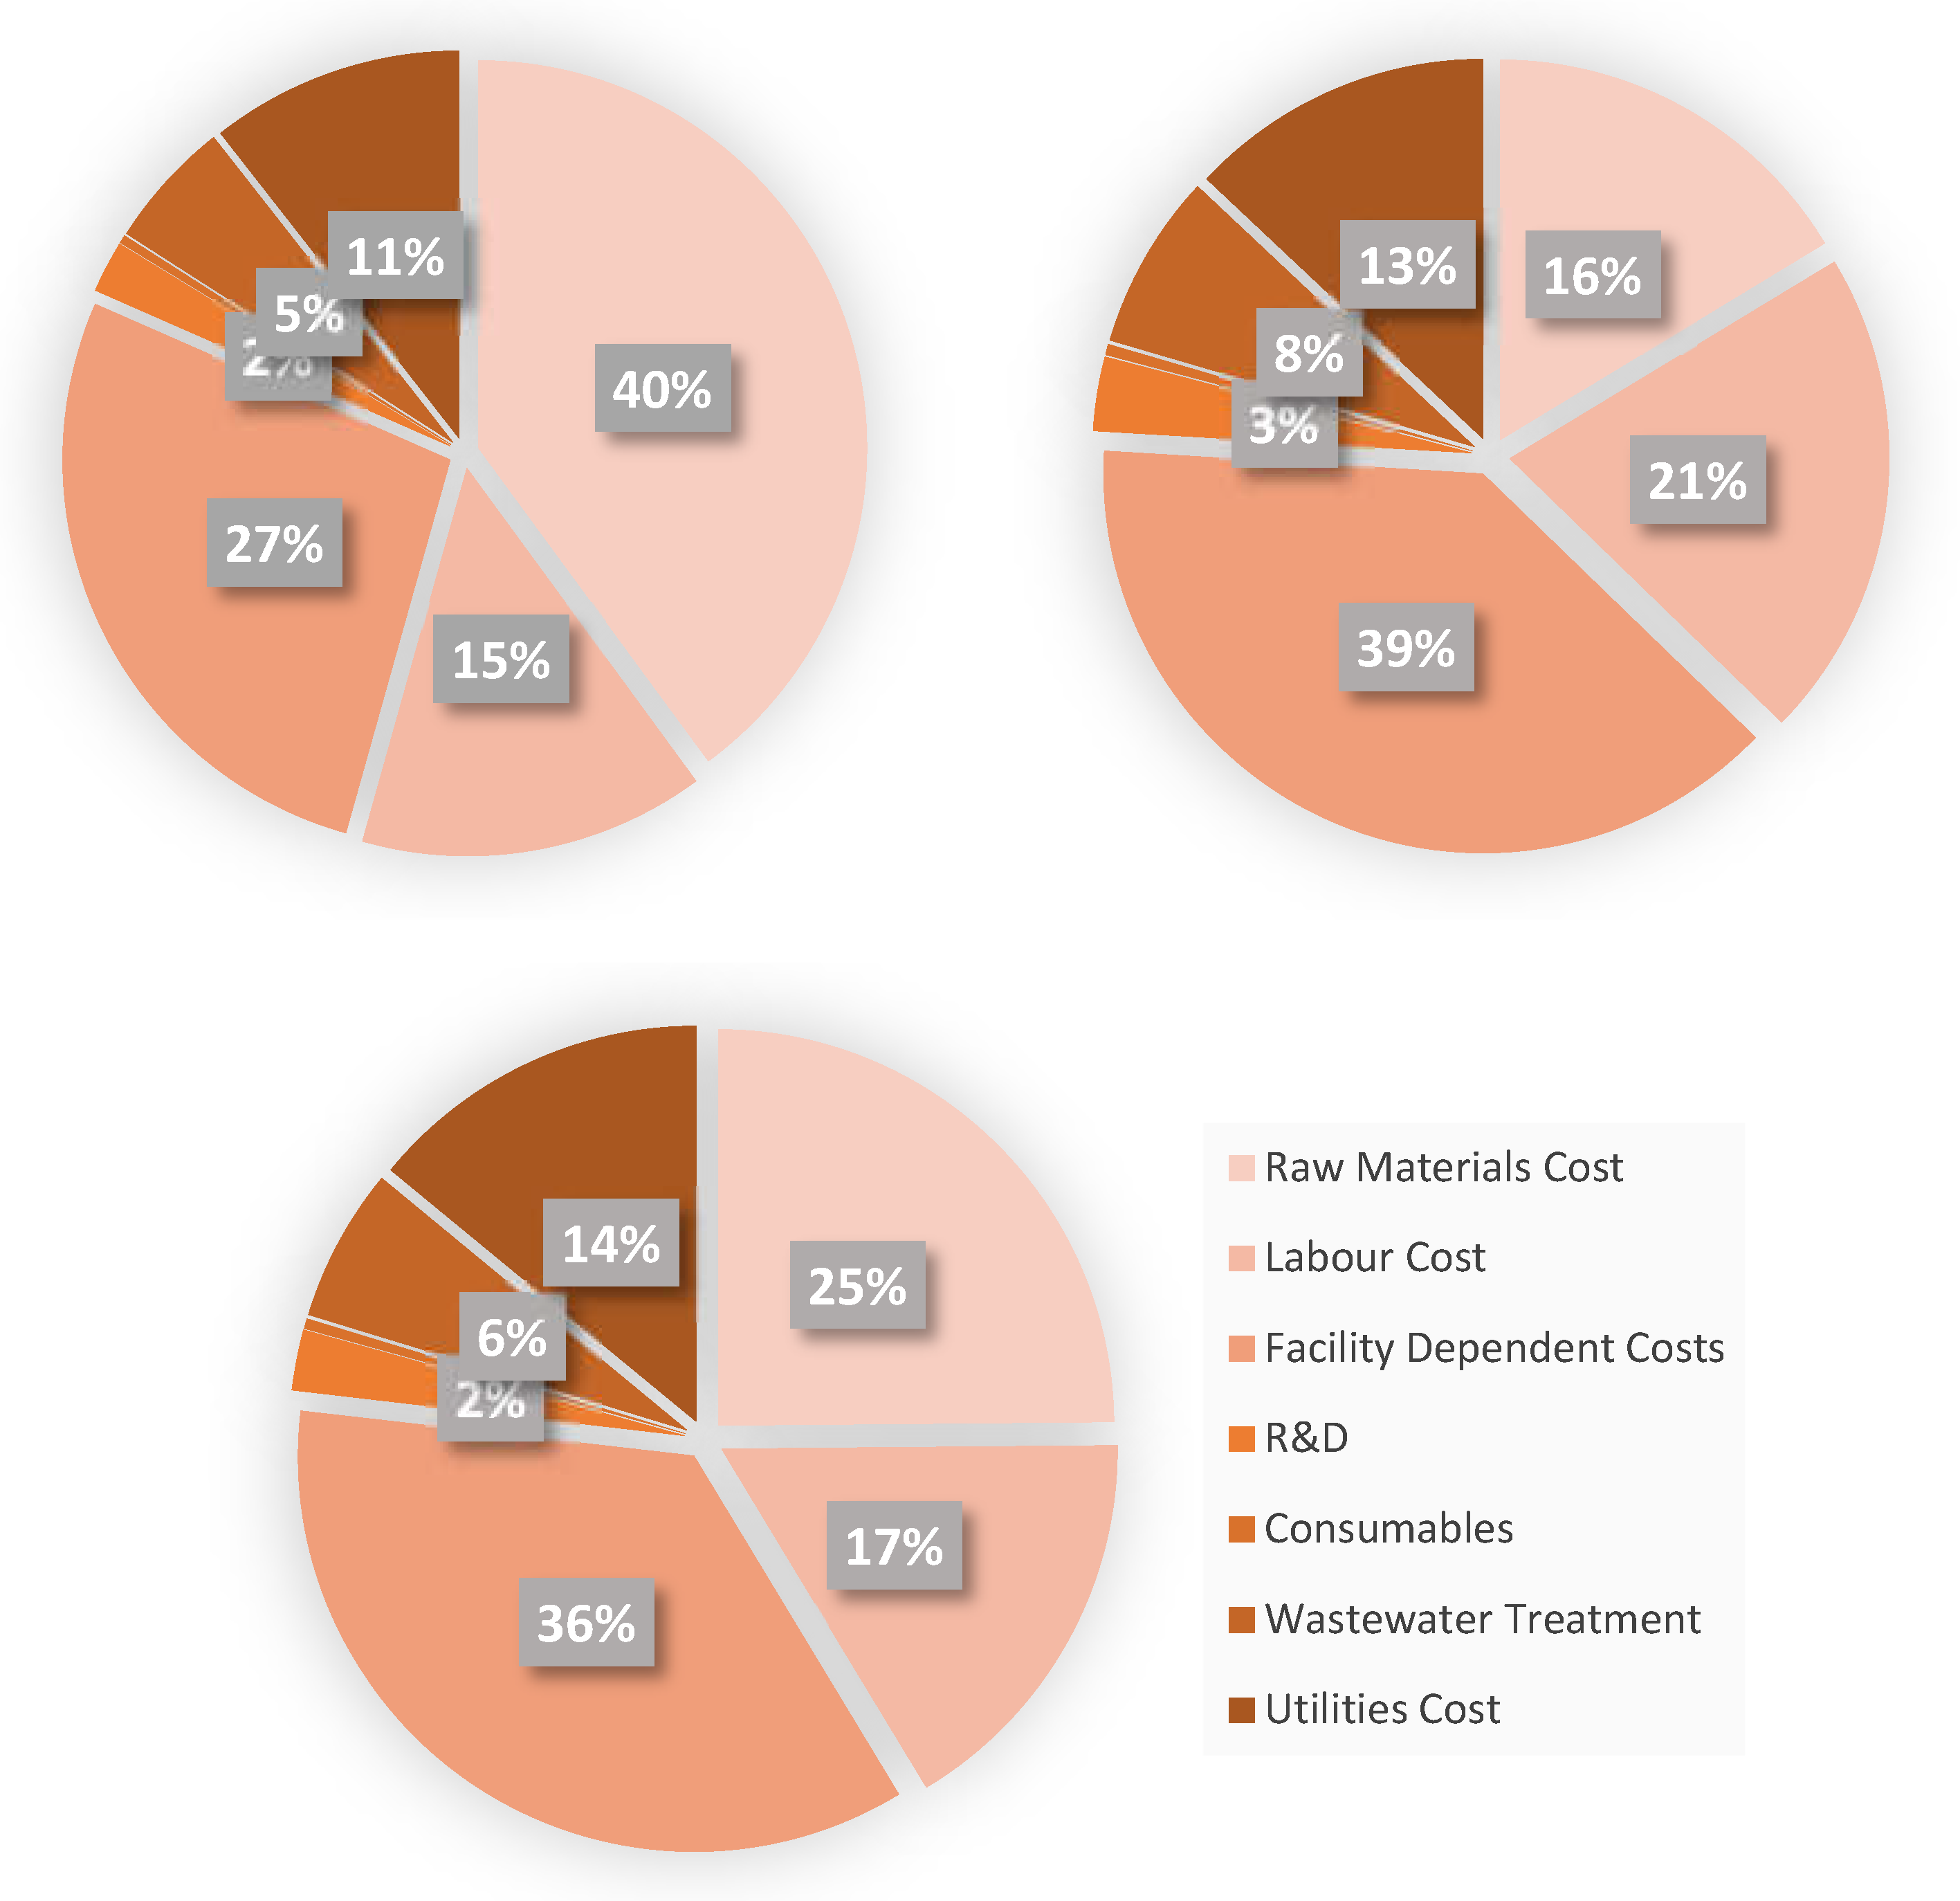
Figure 8.
Effect of number of reactors on various economic indicators.
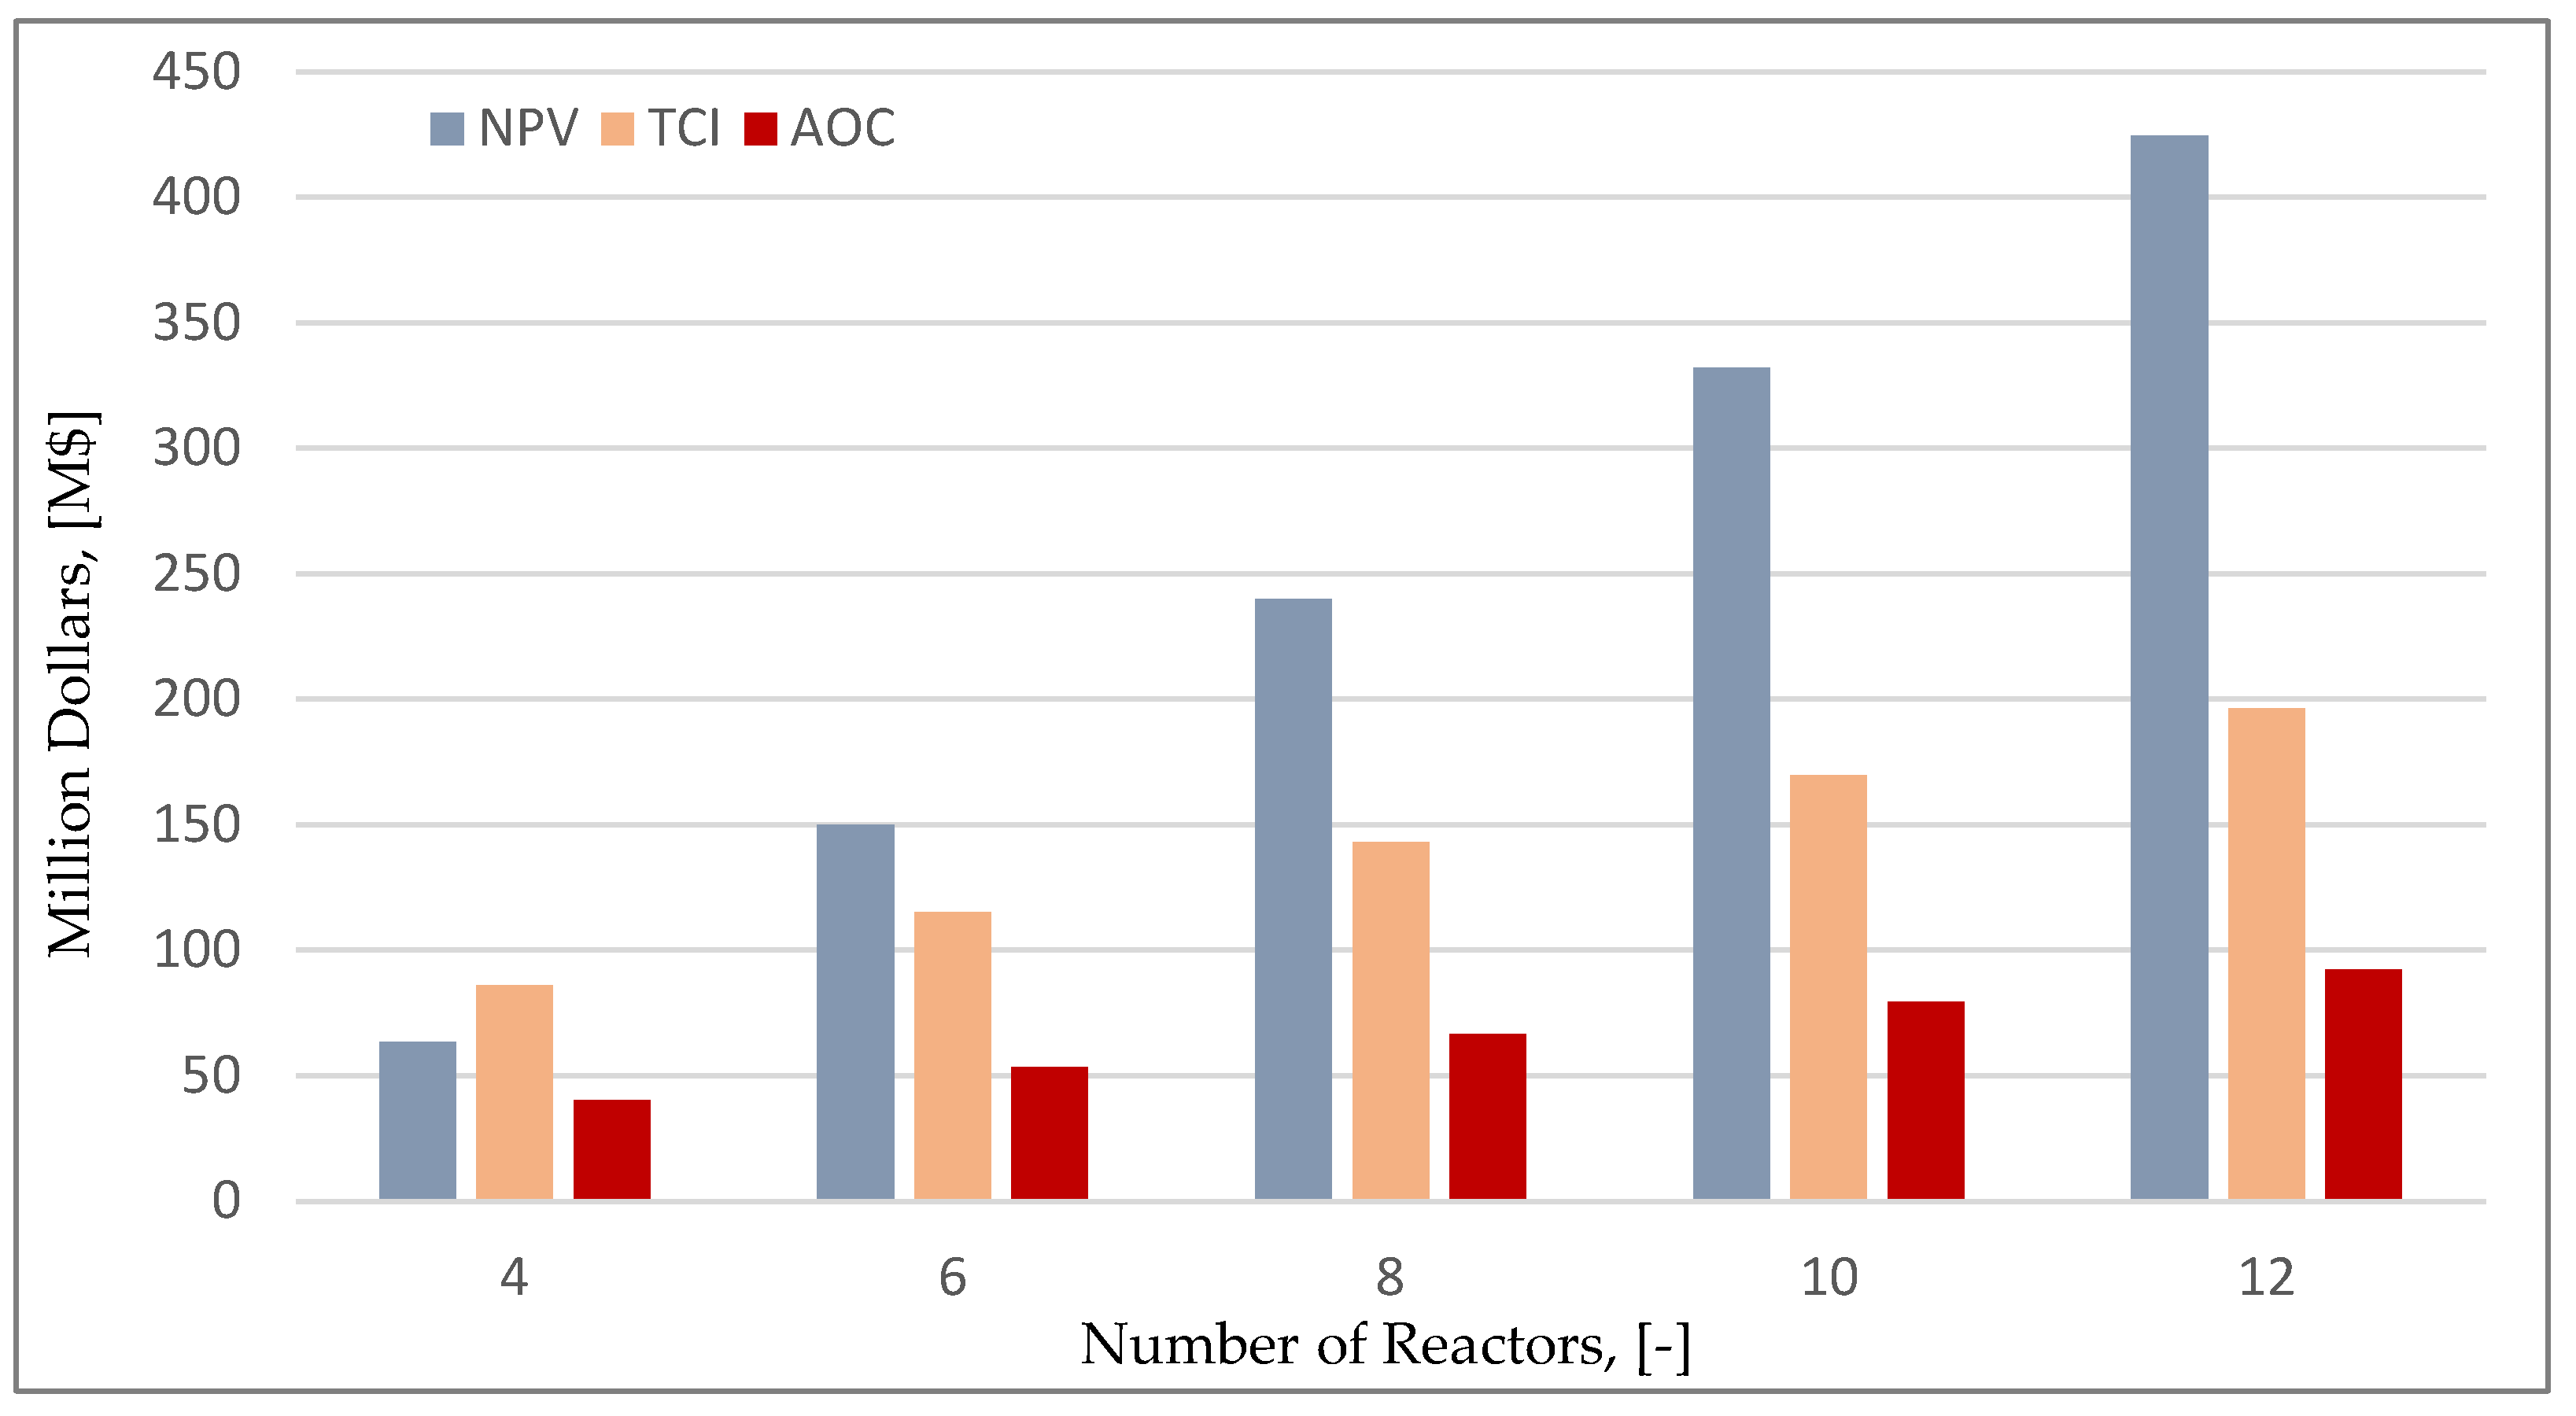
Figure 9.
Effect of production capacity on payback time and production cost.
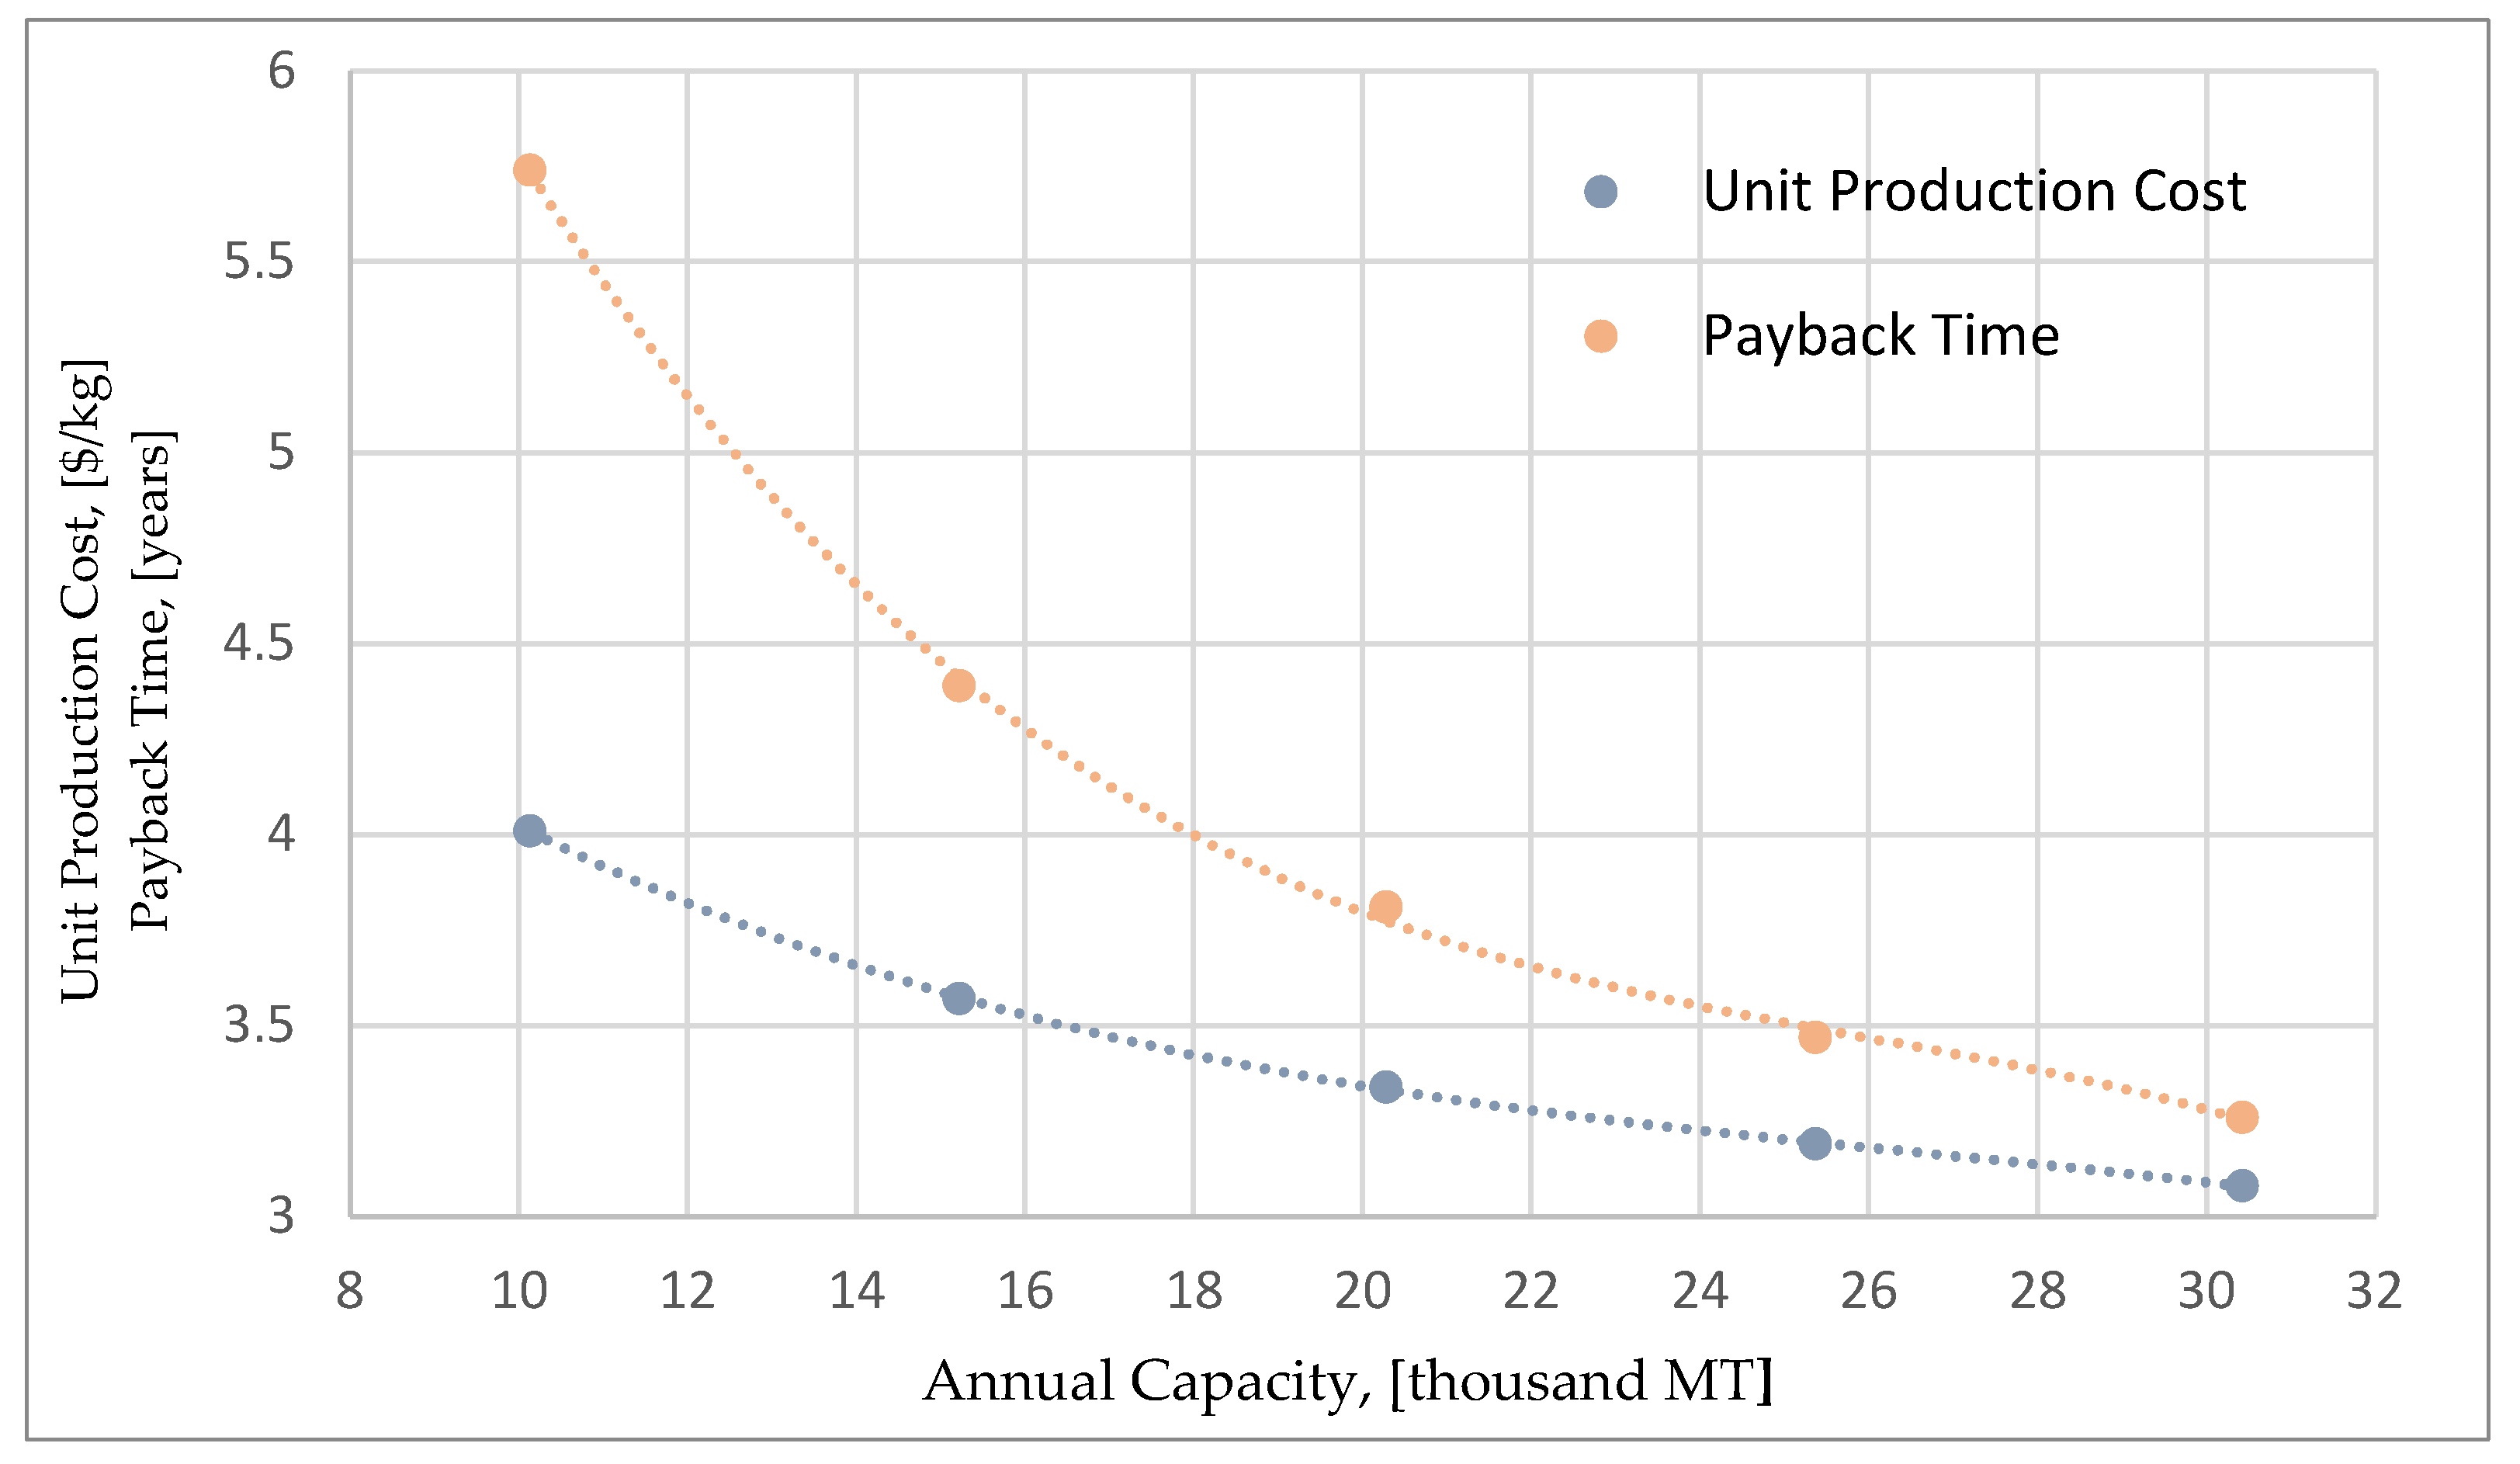
Figure 10.
Effect of production capacity on production cost via reactor scale-up approach.
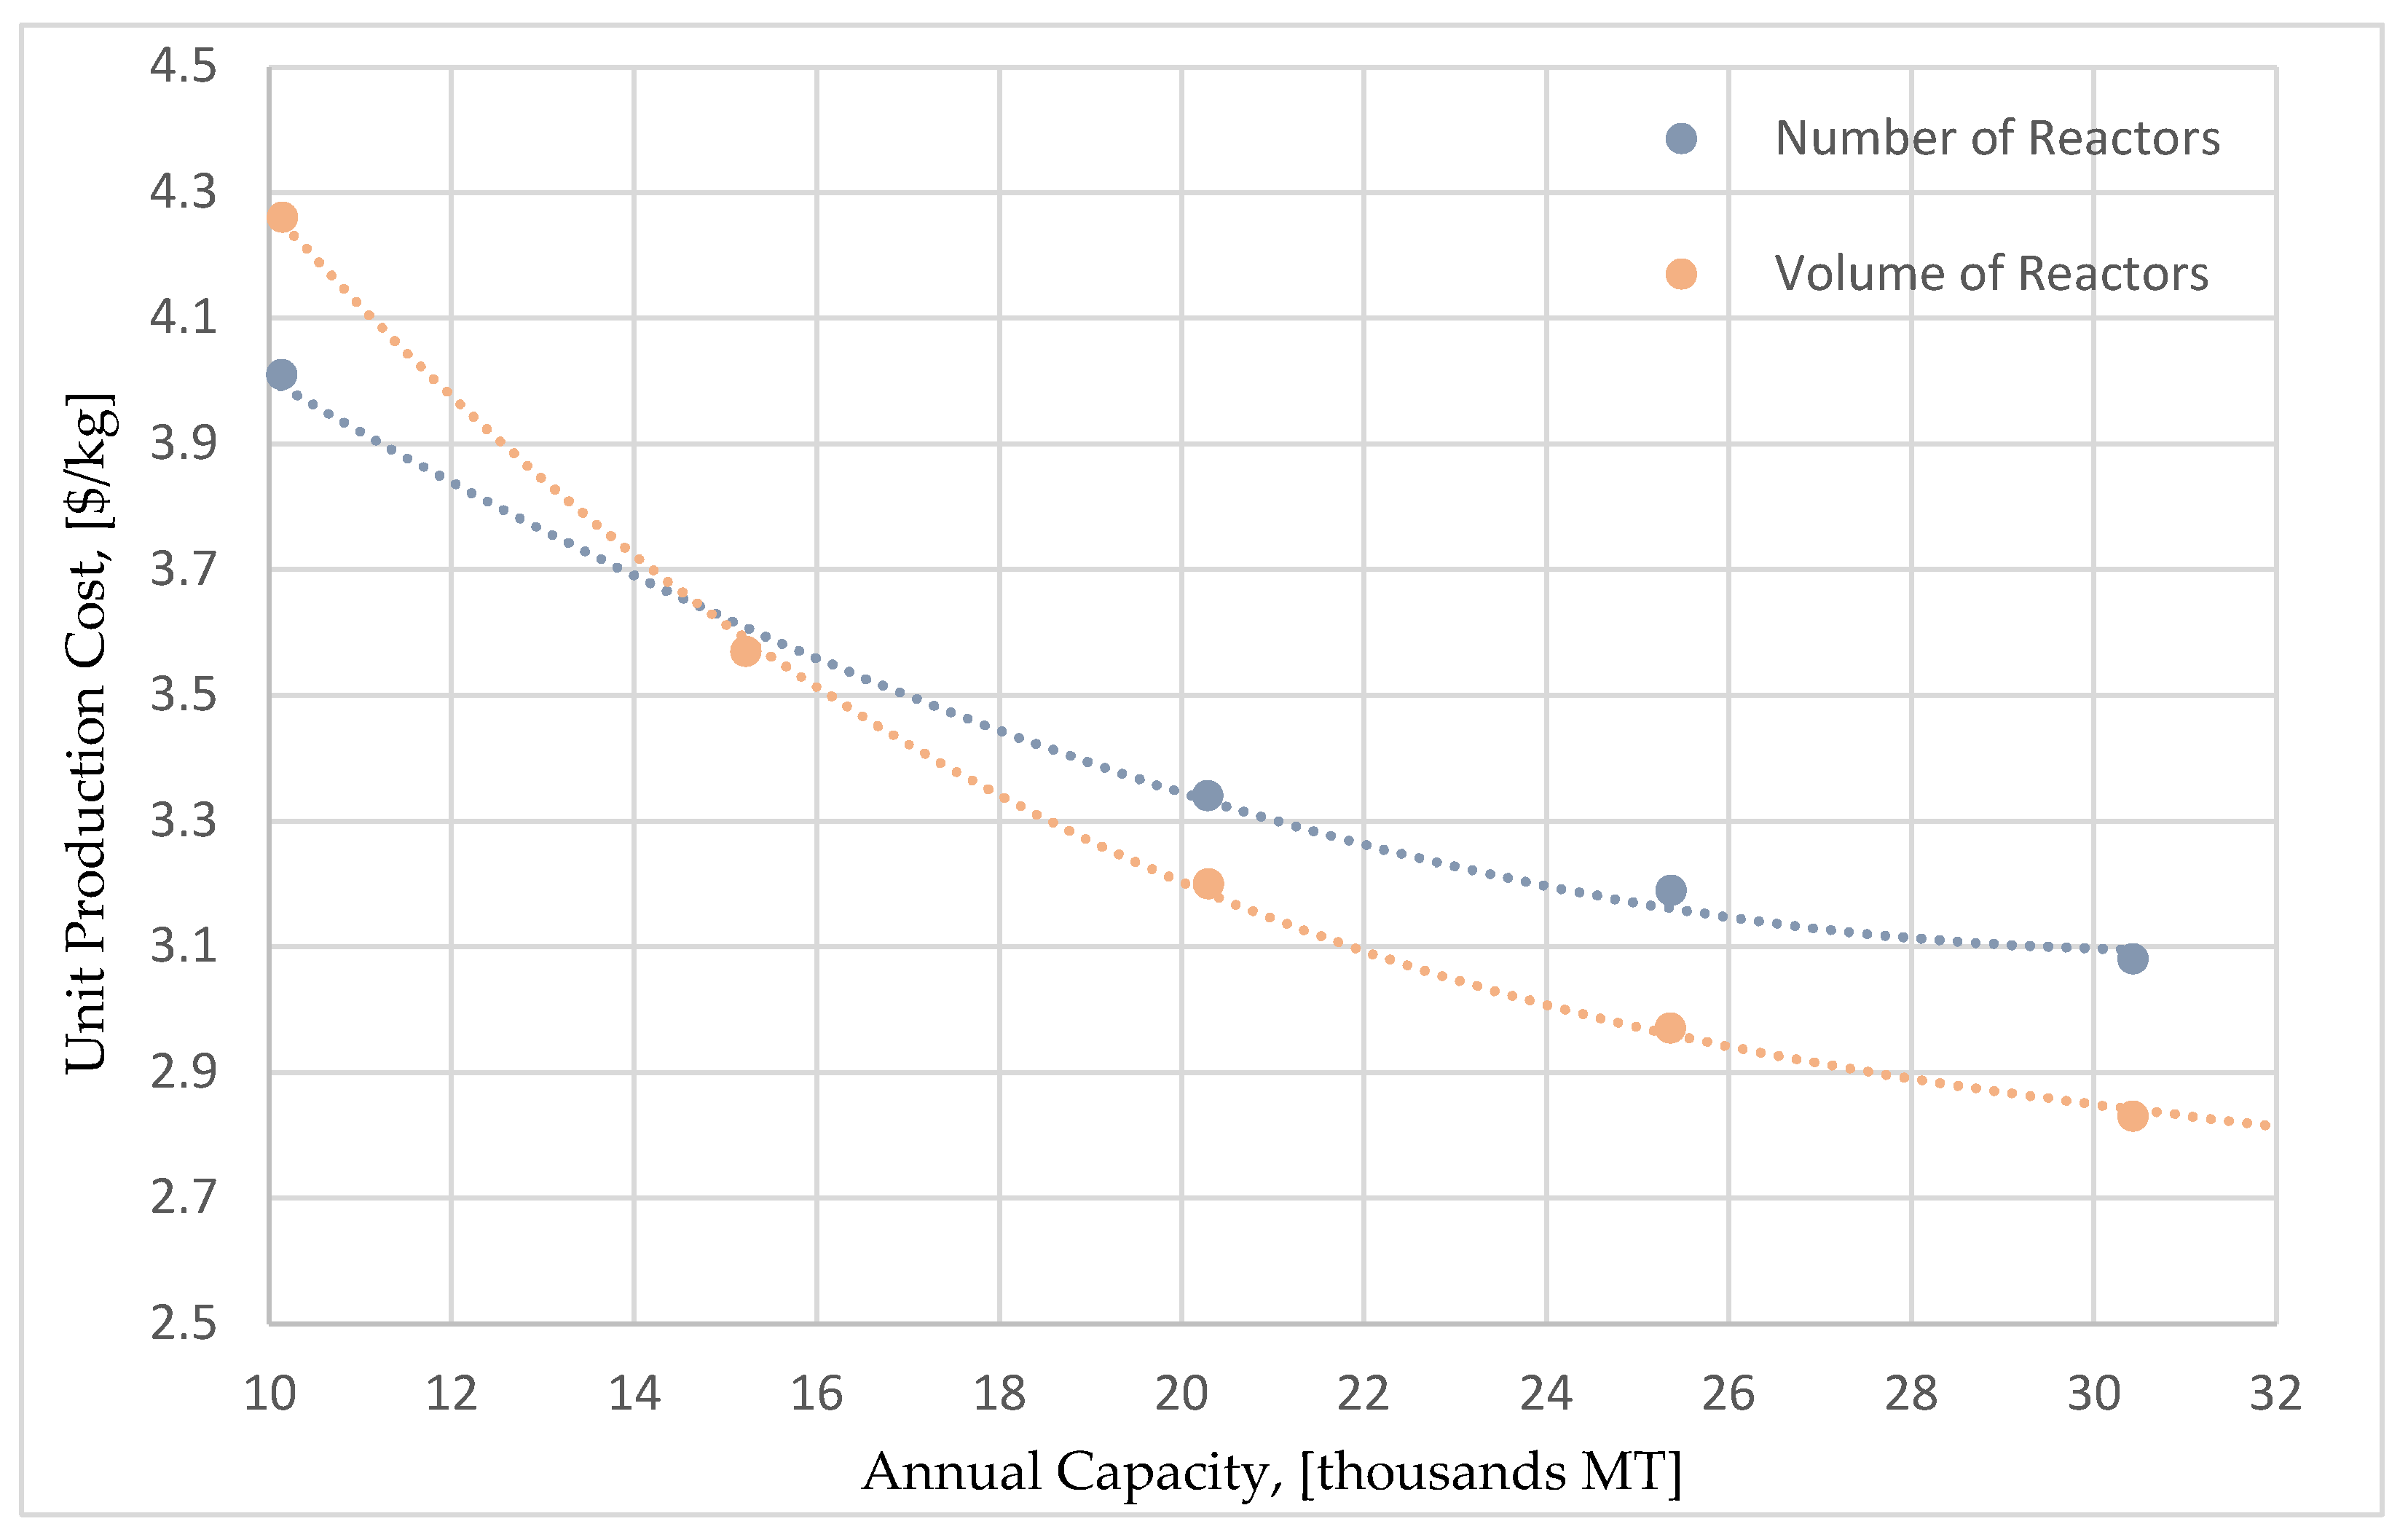
Figure 11.
Effect of production capacity on production cost for each process alternative.
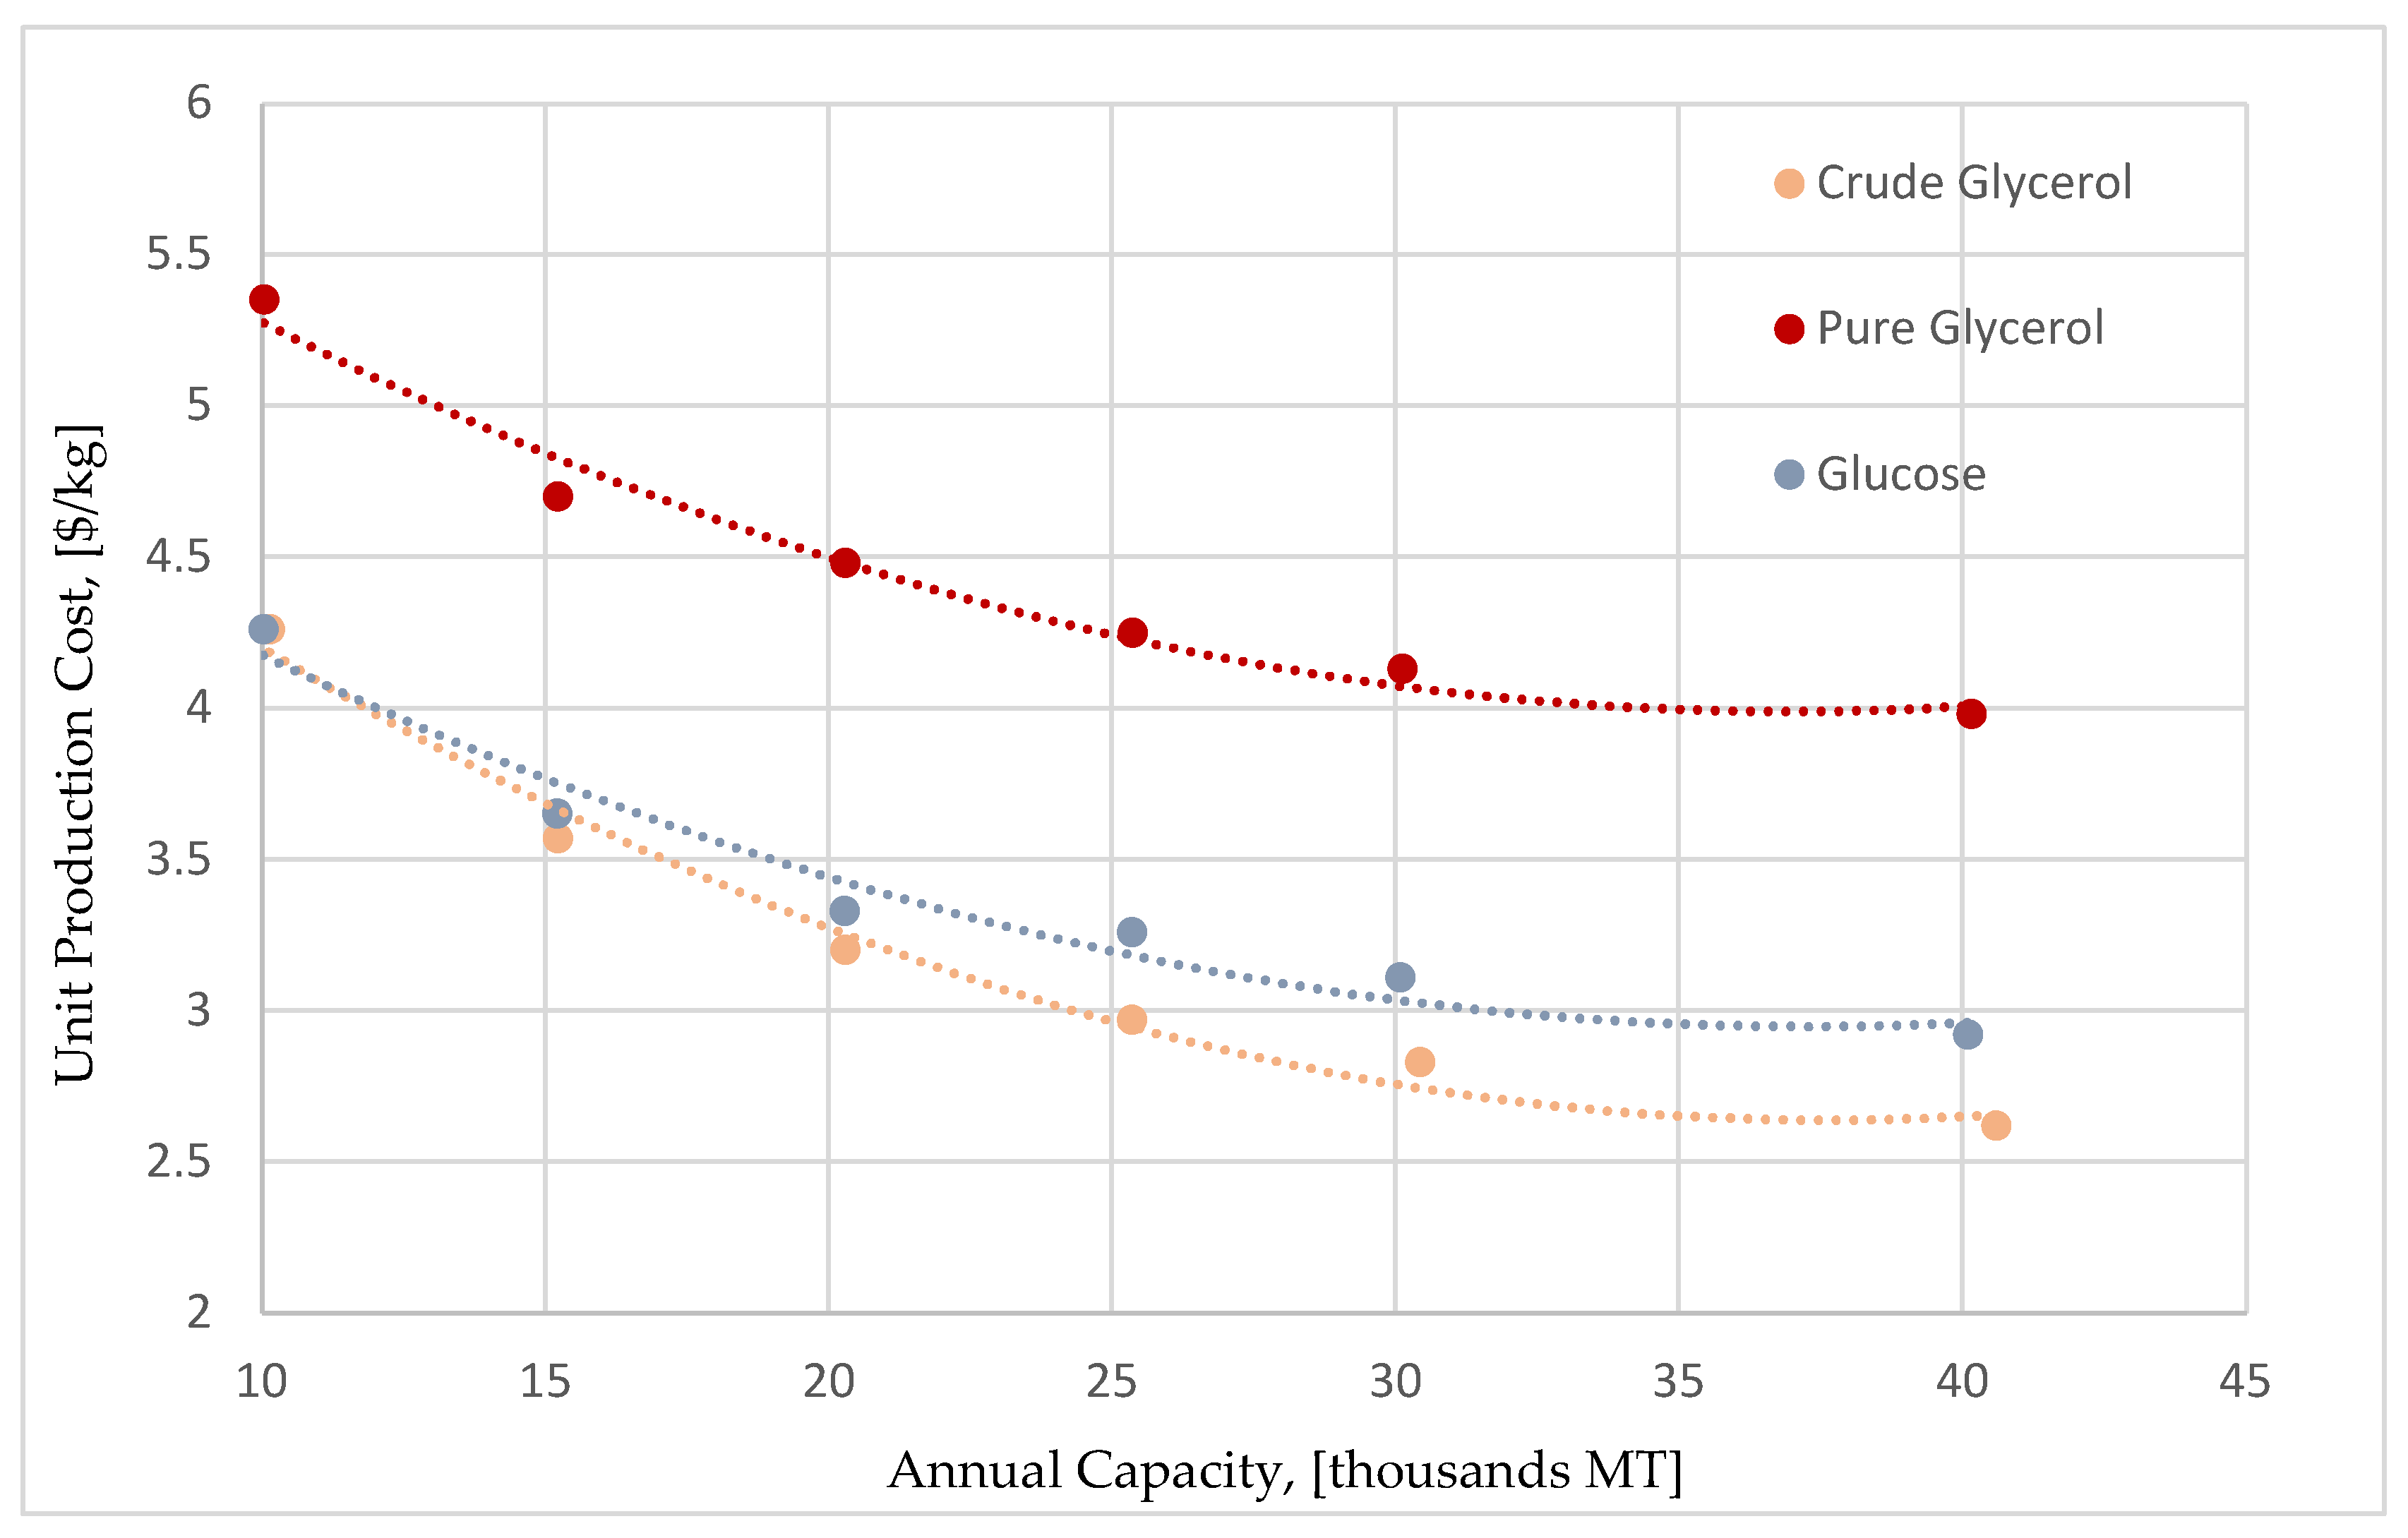
Figure 12.
Effect of recycle percentage on NPV and production cost.
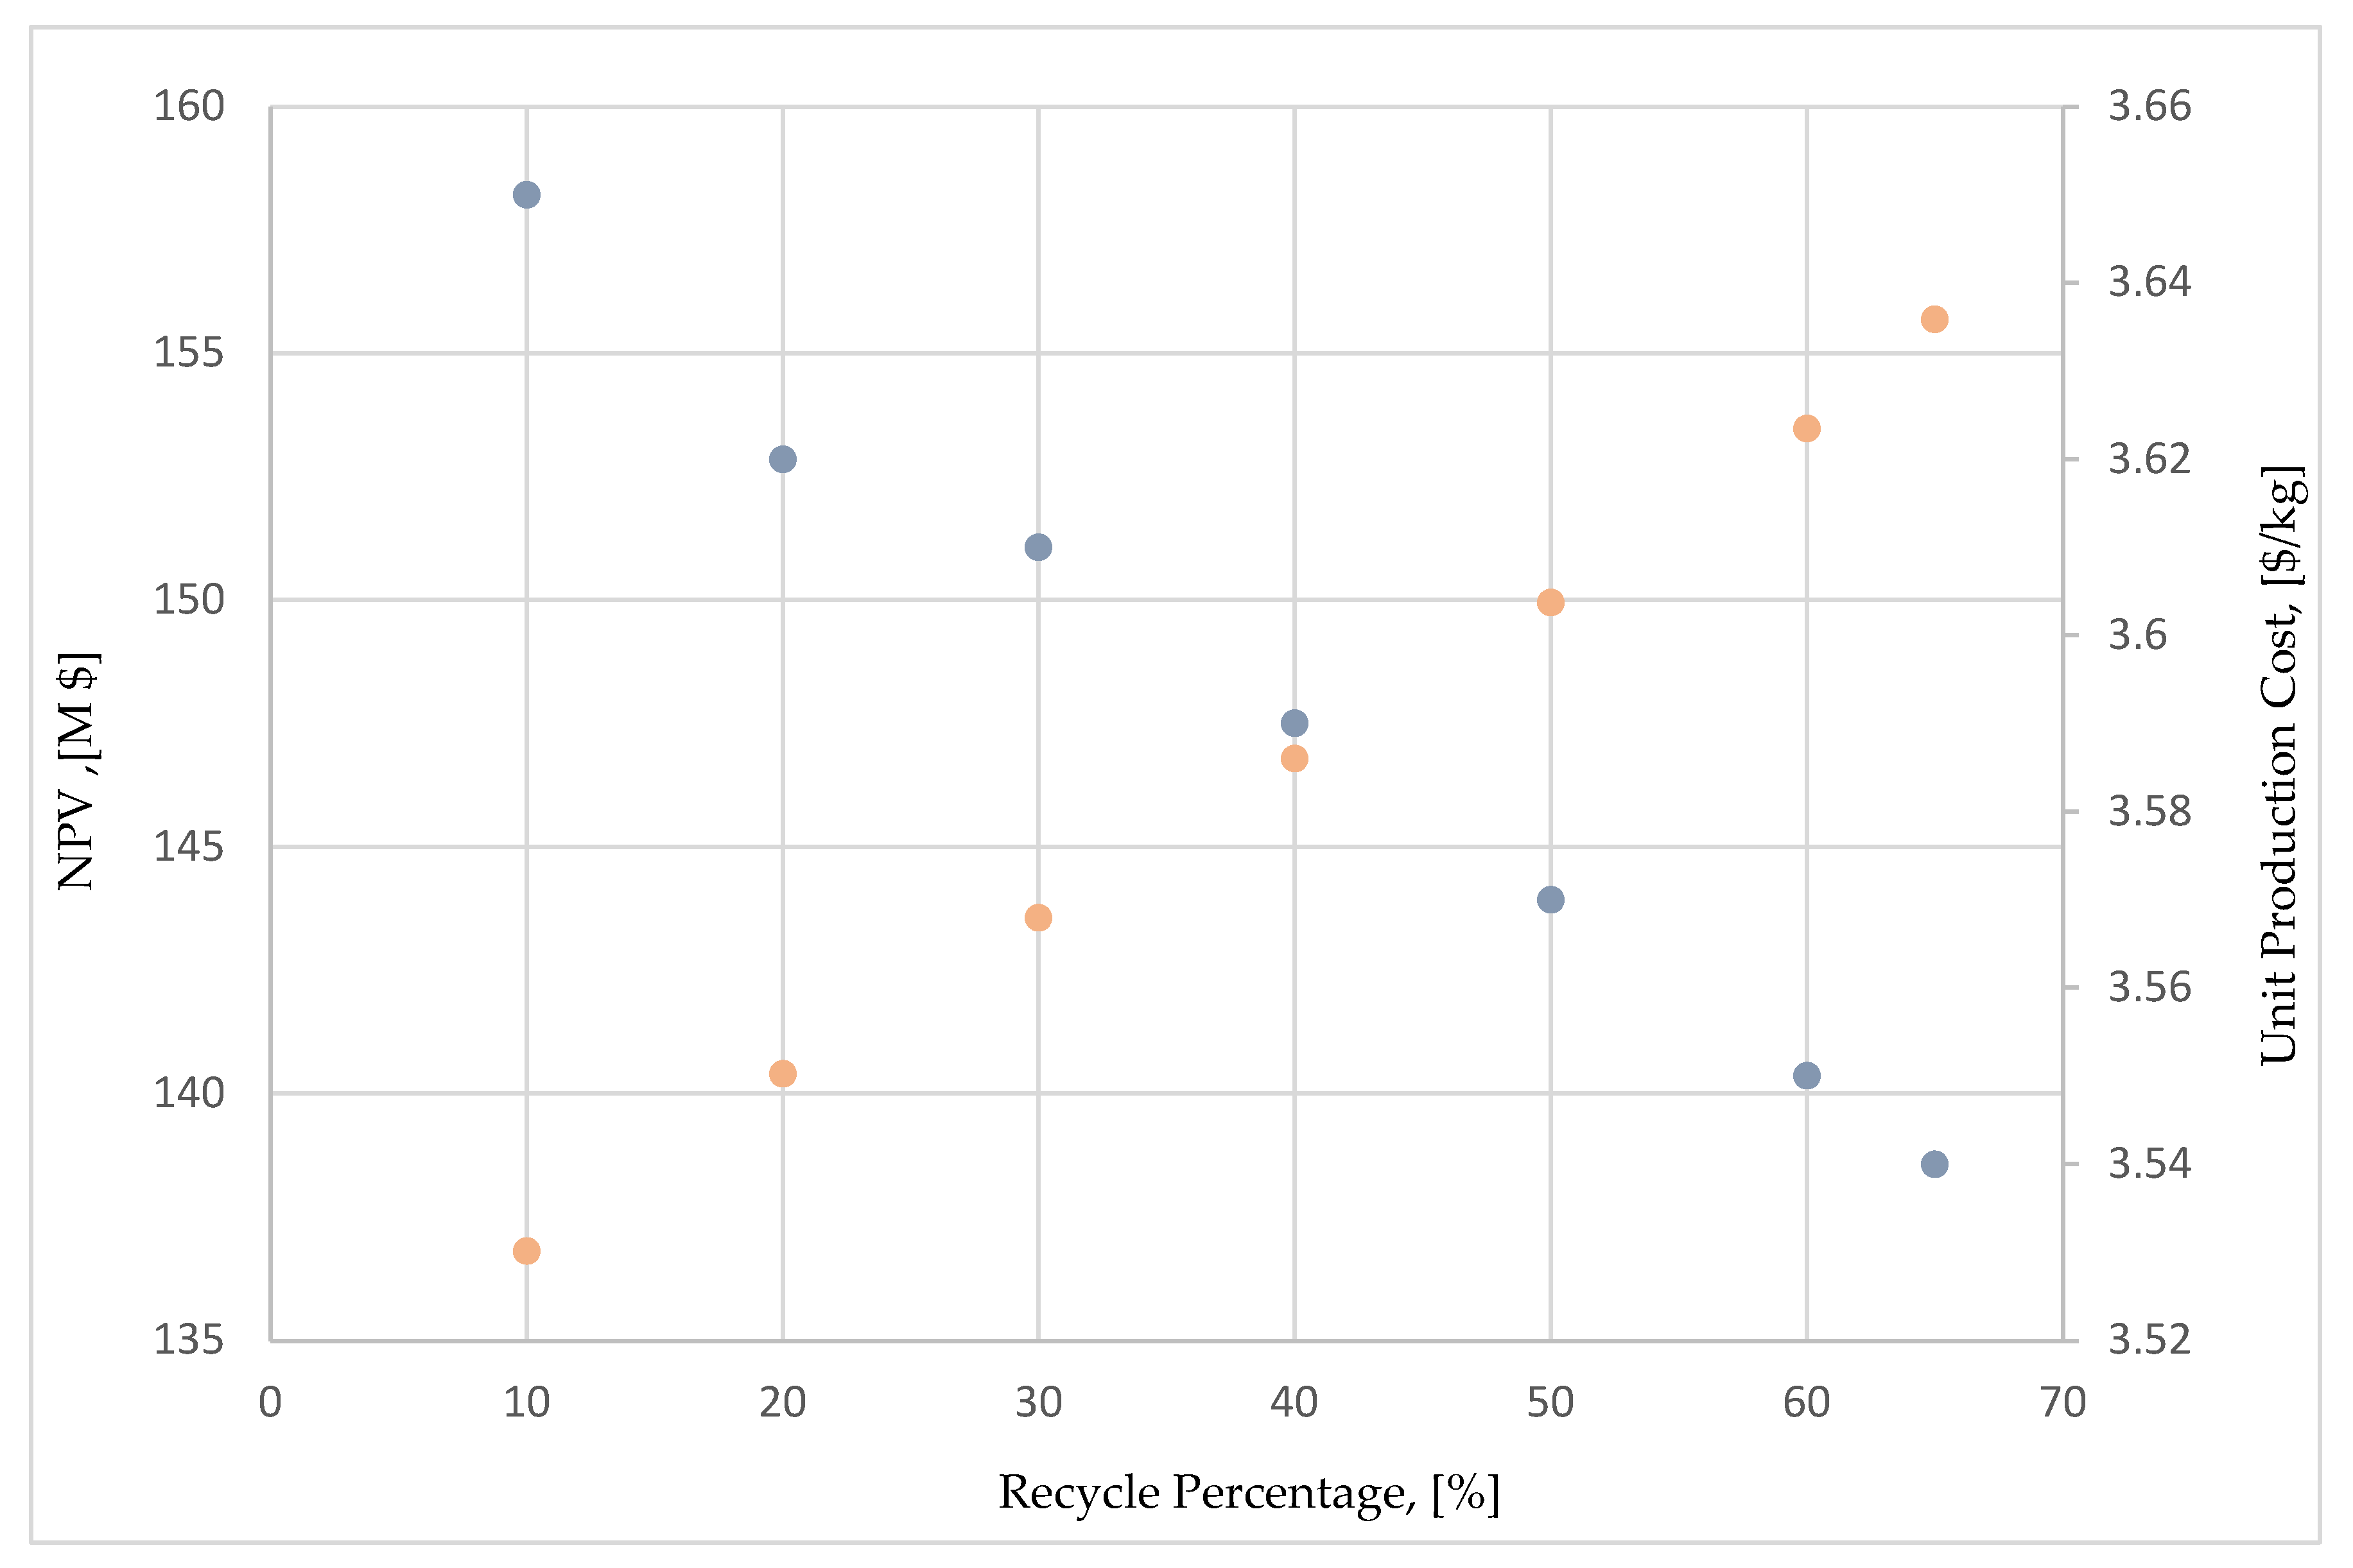
Figure 13.
a: Effect of number of evaporation effects on equipment cost and steam consumption. b: Effect of number of evaporation effects on unit steam cost and NPV.
Figure 13.
a: Effect of number of evaporation effects on equipment cost and steam consumption. b: Effect of number of evaporation effects on unit steam cost and NPV.
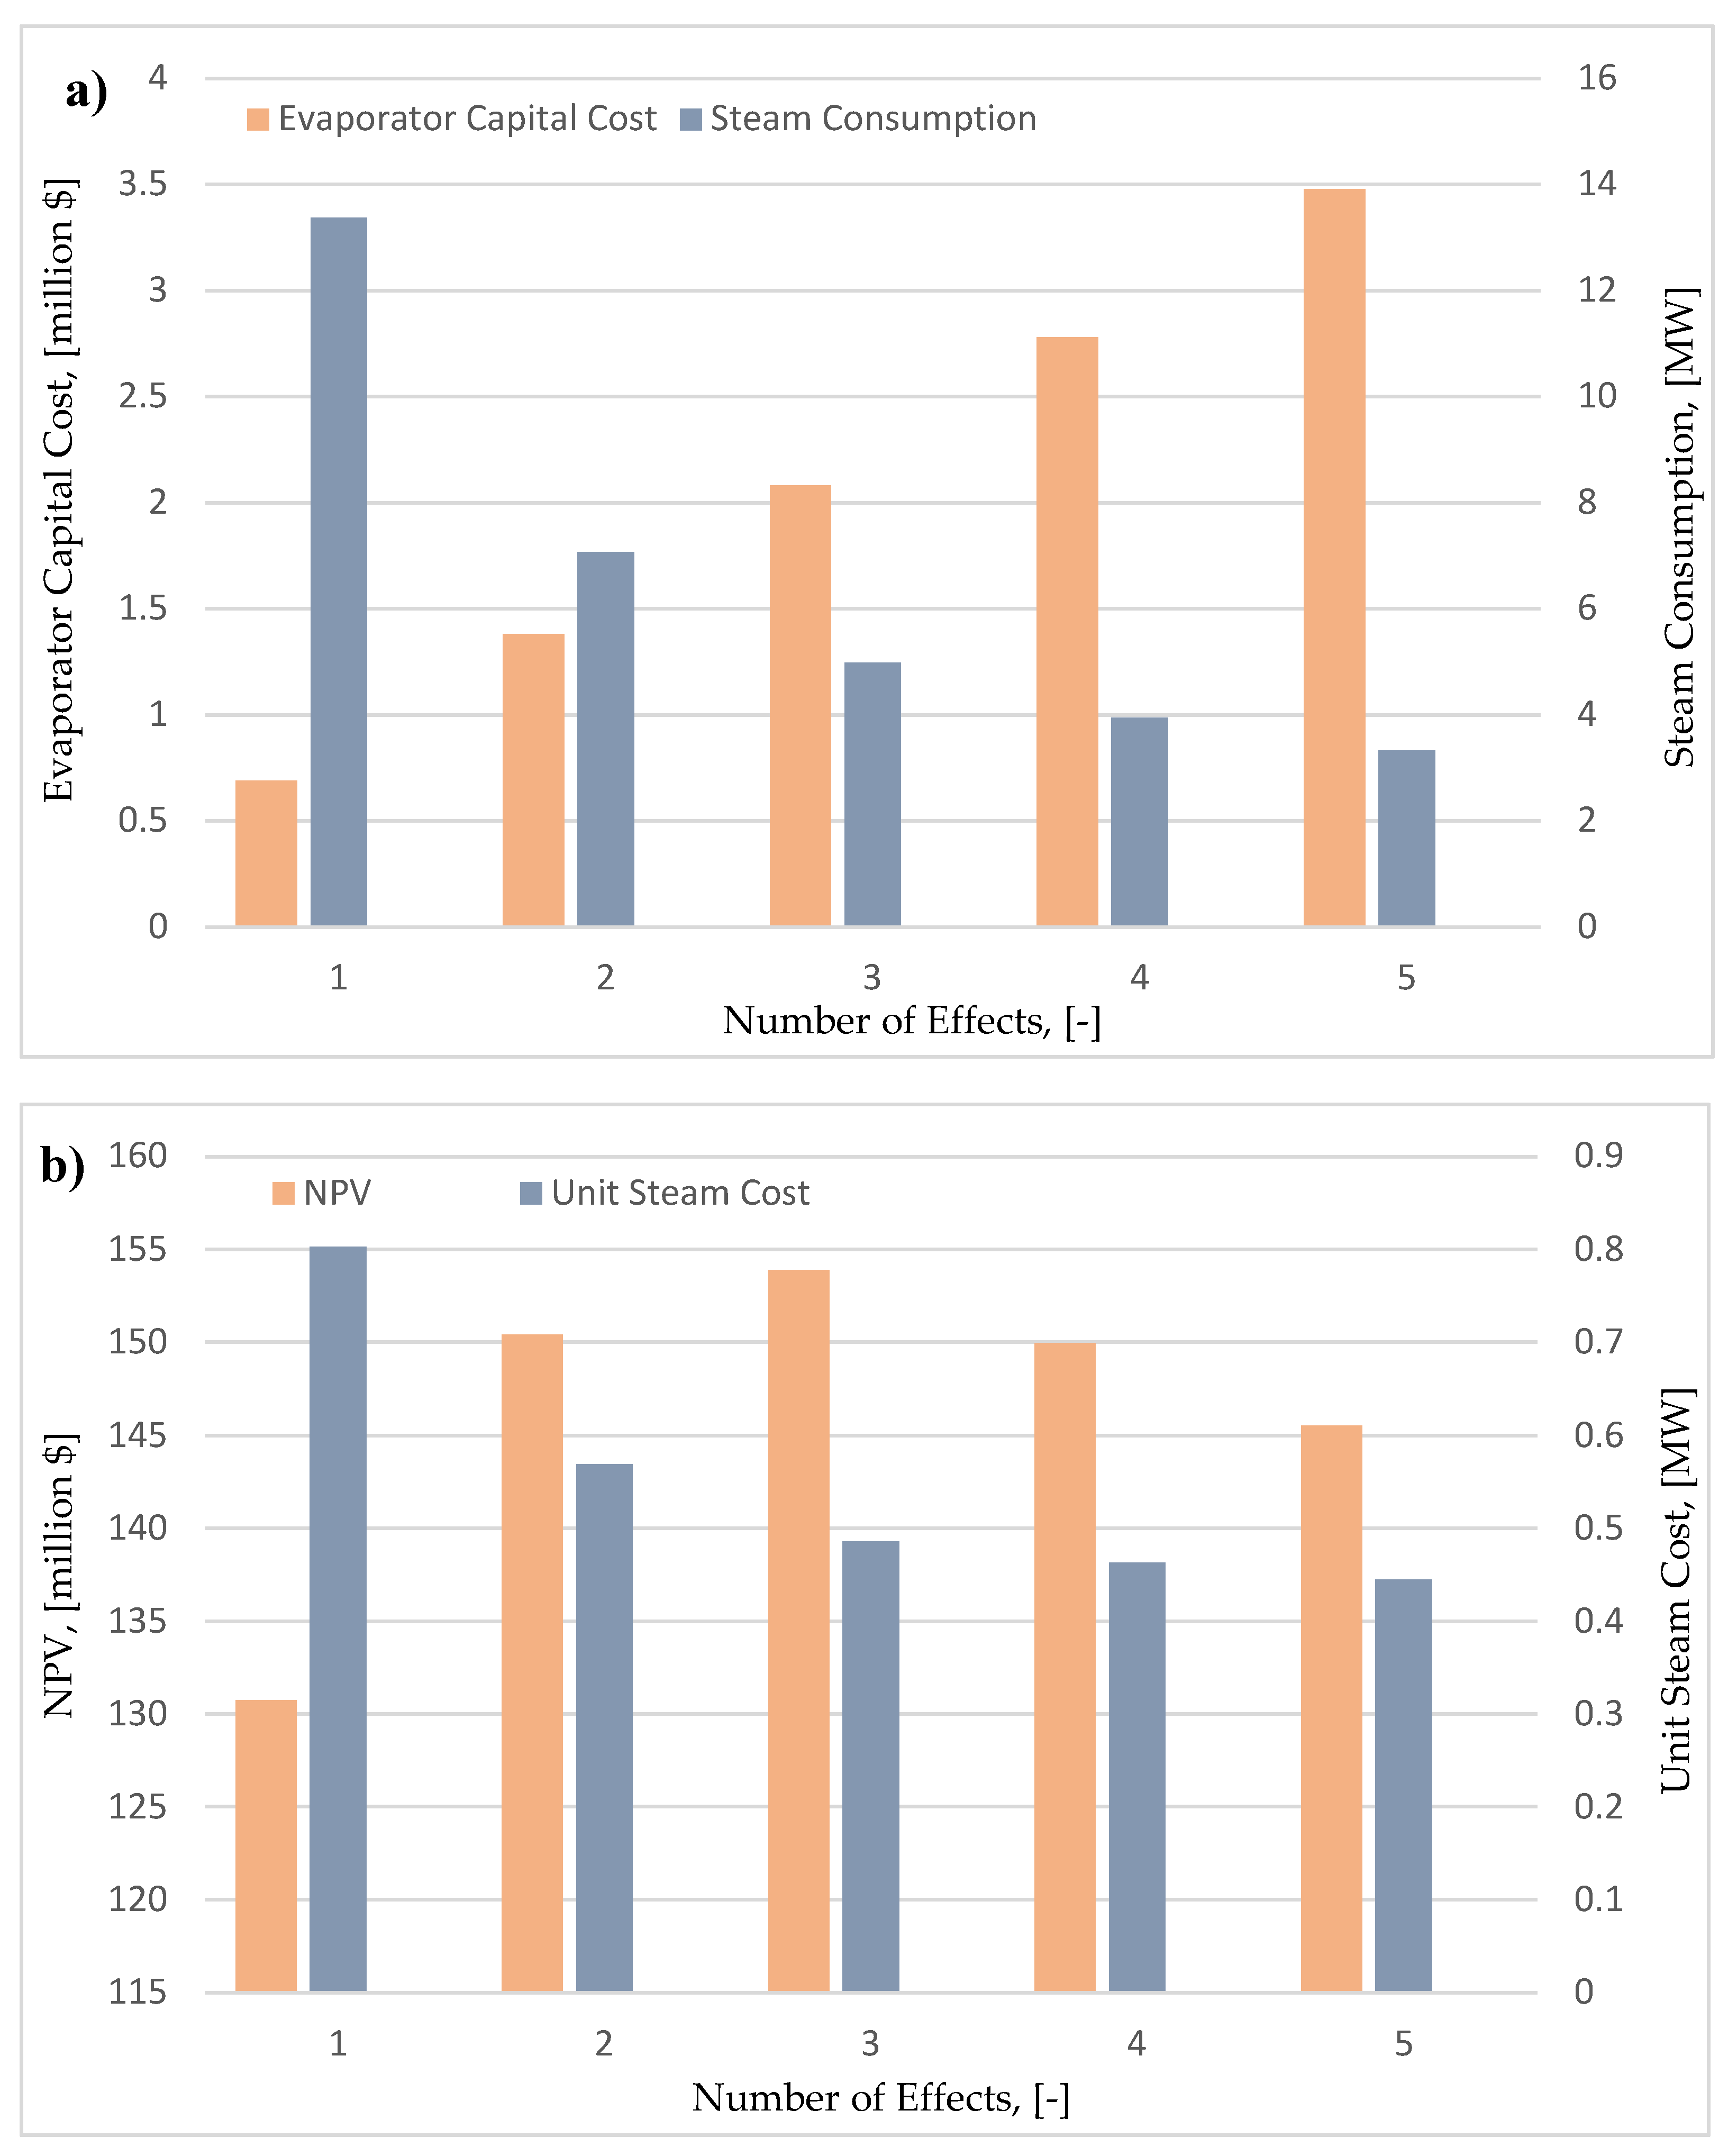
Figure 14.
a: Tornado diagram for the influence of various input parameters to the NPV. 14b: Tornado diagram for the influence of various input parameters to the PBT.
Figure 14.
a: Tornado diagram for the influence of various input parameters to the NPV. 14b: Tornado diagram for the influence of various input parameters to the PBT.

| Industry | Location | Capacity (MT/year) |
Raw Material |
|---|---|---|---|
| BioAmber | Pomacle, France | 3,000 | Wheat Glucose |
| BioAmber, Mitsui | Ontario, Canada | 30,000-50,000 | Corn Glucose |
| Myriant | Louisiana, U.S.A | 14,000 | Corn Glucose |
| Succinity | Montmelo, Spain | 10,000 | Crude Glycerol |
| Reverida | Cassano, Italy | 10,000 | Sorghum Glucose |
Table 2.
Fermentation feedstocks compositions.
| Component (wt.%) | Pure Glycerol | Crude Glycerol | Glucose Feedstock |
|---|---|---|---|
| Glycerol | 76.5 | 75 | - |
| Glucose | - | - | 67.86 |
| Water | 23.4 | 22 | 29.00 |
| Impurities | 0.1 | 1 | 0.01 |
| Maltose | - | - | 1.69 |
| Maltotriose | - | - | 1.24 |
| DPn | - | - | 0.19 |
| Soluble Proteins | - | - | 0.01 |
| Salts | - | 2 | - |
Table 3.
Techno-economic analysis input parameters and cost sources.
| Analysis Parameter | Value | Cost Parameter | Value |
|---|---|---|---|
| Year of Analysis | 2023 | Pure Glycerol | 550 $/MT |
| Construction Year | 2023 | Crude Glycerol | 40 $/MT |
| Construction Period | 30 months | Glucose Syrup | 300 $/MT |
| Start-up Period | 4 months | Steam | 32 $/MT |
| Duration Life of Investment | 30 years | Electricity | 0.1 $/kWh |
| Inflation | 4% | Cooling Water | 0.1 $/MT |
Table 4.
Techno-economic analysis executive summary for each flowsheet.
| KPI | Pure Glycerol | Crude Glycerol | Glucose Syrup |
|---|---|---|---|
| Direct Capital Cost | 99,143,000 $ | 107,180,000 $ | 99,835,000 $ |
| Total Cost of Investment | 108,431,000 $ | 115,270,000 $ | 107,763,000 $ |
| Annual Operating Cost | 70,419,000 $ | 53,836,000 $ | 54,368,000 $ |
| Batch Size | 18.44 MT | 18.45 MT | 33.42 MT |
| Sales Revenues | 74,941,000 $ | 74,889,000 $ | 74,527,000 $ |
| Taxes | 25% | 25% | 25% |
| Unit Production Cost | 4.69 $/kg | 3.59 $/kg | 3.65 $/kg |
| Selling Price | 5.00 $/kg | 5.00 $/kg | 5.00 $/kg |
| Gross Margin | 6.03 % | 28.11 % | 27.05 % |
| ROI | 11.81 % | 22.53 % | 22.83 % |
| Payback Time | 8.46 | 4.44 | 4.38 |
| IRR (after taxes) | 9.69 % | 17.61 % | 18.01 % |
| NPV at 7% | 27,462,000 $ | 146,947,000 $ | 142,034,000 $ |
Table 5.
Linear approximations and calculated minimum selling price for each flowsheet.
| Flowsheet Alternative |
Linear Approximation | R2 | Minimum Selling Price ($/kg) |
|---|---|---|---|
| Crude Glycerol | NPV = 120.10*SP - 457.56 | 0.9995 | 3.81 |
| Glucose Syrup | NPV = 120.22*SP - 449.78 | 0.9993 | 3.74 |
| Pure Glycerol | NPV = 141.41*SP - 676.95 | 0.9988 | 4.79 |
Table 6.
Production costs from various literature sources and this study.
| Capacity (MT/year) | Production Cost | Reference |
|---|---|---|
| 45,000 | 1.50 $/kg | [11] |
| 54,900 | 1.85 $/kg | [37] |
| 30,000 | 2.26 $/kg | [36] |
| 4,000 | 2.95 $/kg | [38] |
| 430 | 3.64 $/kg | [39] |
| 11,500 | 5.40 $/kg | [40] |
| 15,000 | 3.51 $/kg | This study |
| 30,000 | 3,05 $/kg | This study |
Disclaimer/Publisher’s Note: The statements, opinions and data contained in all publications are solely those of the individual author(s) and contributor(s) and not of MDPI and/or the editor(s). MDPI and/or the editor(s) disclaim responsibility for any injury to people or property resulting from any ideas, methods, instructions or products referred to in the content. |
© 2024 by the authors. Licensee MDPI, Basel, Switzerland. This article is an open access article distributed under the terms and conditions of the Creative Commons Attribution (CC BY) license (http://creativecommons.org/licenses/by/4.0/).
Copyright: This open access article is published under a Creative Commons CC BY 4.0 license, which permit the free download, distribution, and reuse, provided that the author and preprint are cited in any reuse.


