Submitted:
02 May 2024
Posted:
07 May 2024
You are already at the latest version
Abstract
Background: Across the world, antibiotic resistance is a grave problem. To address this issue, it is necessary to investigate new antibiotic sources. Aim of the study: Egypt's diverse soil habitats were used to produce bacterial Myxopyronin B, which was then tested for antimicrobial activity in preclinical animal studies and randomized human clinical trials stages 1/2. Type of the study: Screening experimental study. Methodology: Egypt's various soil conditions were examined for the development of bacterial isolates that produced the antibiotic compound Myxopyronin B. Reversed phase HPLC was used to purify Myxopyronin B. To determine the test antibiotic's minimum inhibitory concentration( MIC) and invitro antibacterial activity, the Broth microdilution method and the Paper disc diffusion assay were utilized. Moreover, in vivo antibacterial spectrum, adverse medication responses, and pharmacokinetics were found in preclinical animal testing stages and phases 1/2 of randomized clinical studies involving volunteer humans. Results: Myxopyronin B was generated from the culture supernatant of Myxococcus SDU36, the main soil bacterial isolate cultured on a Casein yeast peptone plate. With MICs less than 100 mcg/ml, the test antibiotic prevented the growth of several Gram +ve bacteria, whereas, at MICs higher than 100 mcg/ml, it inhibited the development of a small number of Gram -ve bacteria, including Escherichia coli. However, eukaryotic cells—such as those found in fungi and humans—were unaffected. The test antibiotic was seen to inhibit prokaryotic DNA-dependent RNA polymerase( RNLP), indicating its bactericidal activity. Mean Cmax was 9-10 mcg/ ml at mean Tmax 1 hour when 600 mg dose was orally administered in randomized human clinical trials phases 1/2, and T1/2 reached 2.25 hours following first-order kinetics of elimination. Duration of its action was nearly 8 hours after oral administration. Rare toxicity was detected during preclinical and randomized human clinical trials phases 1/2 in the form of mild diarrhea and GI upset in less than 7 % of experimental candidates. It exhibited approximately 90% plasma protein binding, especially with albumin which resulted in prolonged therapeutic action. It showed a concentration dependant antibiotic killing effect. With the concentration-dependent killing pattern, the higher the drug concentration relative to the pathogen minimum inhibitory concentration( MIC), the greater the rate and extent of antimicrobial activity. Conclusion: The present study was promising due to the production of the bactericidal antibiotic Myxopyronin B from Myxococcus sp. SDU36 isolated from different soil environments in Egypt.
Keywords:
Myxopyronin B
; microbial
; antibiotic
; resistance
; myxobacteria
Introduction
For an antibiotic to be useful as a medicine, it must exhibit selective toxicity.[1] The activities of bacteria must be significantly suppressed compared to those of human cells.[2] The search for novel antibiotic sources is essential because antibiotic resistance is a serious, global issue that has to be addressed.[3] Cell walls, ribosomes, cell membranes, and nucleic acids are the four main targets of antibacterial drugs.[4] These drugs have no impact on human cells since they don’t have a cell wall and have unique ribosomes, nucleic acid enzymes, and sterols in their membranes.[5] drugs known to be bactericidal are effective against bacteria.[6] Conversely, bacteriostatic drugs prevent the growth of germs.[7] The pathogen is eliminated by the patient’s phagocytes while using bacteriostatic drugs.[8]
When a patient has a low neutrophil count, they should be given Bacteriocidal drugs.[9] The alpha-pyrone antibiotic class includes Myxopyronins.[10] The term “pyrones” or “pyranones” refers to a class of heterocyclic chemical compounds.[11] They comprise an unsaturated six-membered ring that is composed of one oxygen atom and a ketone functional group.[12] The names of the two isomers are 2-pyrone and 4-pyrone.[13] Given that Myxopyronins exhibit no cross-resistance with other medications, they may be able to mitigate the growing problem of drug resistance in tuberculosis.[14] Additionally, their medication may be beneficial for Methicillin-resistant Staphylococcus aureus( MRSA).[15] Assessing the production of a novel antibiotic, Myxopyronin B, in various soil conditions in Egypt was the aim of the present investigation. It was also examined for antibacterial efficacy in phases 1/2 randomized human clinical trials.
Patients and Methods
Ethical statement:
Prioritized in the current study were all pertinent institutional, national, and/or international standards concerning the use and care of humans and animals. All study protocols involving humans and animals were authorized by the Ethical Committee for Human and Animal Handling at Cairo University( ECAHCU), located at the Faculty of Pharmacy, Cairo University, Egypt, by the Weatherall Report’s recommendations (approval number T-10-5-2023). At all costs, the study’s human and animal subjects’ numbers and suffering were kept to a minimum. Phases 1/2 registration number for the randomized human clinical trials was NCT00000806/ 2023.
Type of the study:
Screening experimental study.
Place and date of the study:
This study was processed at faculty of pharmacy, Cairo university, Egypt between May 2023 and February 2024.
Source of animal models:
They were existed and legalized from the pharmacology and toxicology department of the faculty of pharmacy, Cairo university, Egypt.
Inclusion criteria for animal models:
Adult male obese rabbit animal models weighing about 2 kg; could be inoculated with different bacterial infections. Rabbits were acclimatized for one week before the experiment. At a humidity( 50 % 5), light-dark cycle( 12/ 12 h), and a controlled temperature( 252 0C). The rabbits were fed with fresh grass.
Exclusion criteria for animal models:
Young and female rabbits; Non-obese rabbits weighing less than 2 kg.
Collection of 100 soil samples:
Randomly selected samples were grassland soils collected from various soil types in Egypt at a depth of 30 cm. Before processing, samples were stored at 4oC in sterile containers. Each soil sample was weighed one gram and each 250 ml Erlenmeyer flask contained 99 ml of sterile distilled water. The vials were shaken at 400 rpm using a gyroscopic shaker for 5 min. After dilution from 10-1 to 10-6 in sterile distilled water, the soil suspension was placed on selective casein peptone( CYP) yeast agar medium( purchased from Sigma-Aldrich, USA). 50 cc of nutrient broth with pH 7 was added to a 250 ml Erlenmeyer flask to create an inoculum for the bacterial strain under study. The medium was autoclaved and then inoculated with a loop of culture from nutrient agar slants overnight. The inoculum consisted of inoculated vials, which were shaken throughout the day at 150 rpm.
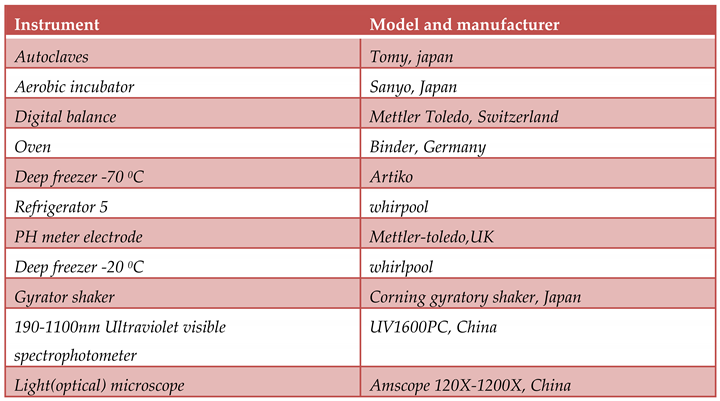
Instruments

Table 1.
List of instruments:.
 |
Material:
All chemical and biochemical substances were obtained from Algomhuria Pharmaceutical Company and Alnasr Chemical Company, Egypt. All chemical reagents utilized were of expository review.
Isolation of Myxococcus SDU36 producing Myxopyronin B antibiotic:
The selective isolation of species of Myxococcus SDU36 from different soil samples was directly performed utilizing dilution plating. The technique included the suppression of competing bacteria exploiting antibiotics such as 10 mcg/ ml Vancomycin and/ or 10 mcg/ ml Chloramphenicol combined with wet heat treatment of soils and air drying. Fungi were eliminated via supplementing the plating medium with 2 mcg/ ml Terbinafine HCl. Swarming of Myxococcus SDU36 colonies was controlled with Casein Yeast Peptone( CYP) plates incubated at 30℃ and PH 7.2 for 5 days. The composition of CYP plate included 0.4 % Peptone from Casein, tryptically digested, 0.3 % CaCl2.2H2O, 0.1 % MgSO4.7H2O, PH 7.2. The potent bacterial isolate producing Myxopyronin was performed utilizing 16 S rRNA sequencing technique. The predominant bacterial isolate with high antibacterial activity was identified using 16S rRNA sequencing and other biochemical tests. Nucleic acid was extracted from a swab by bead-beating in a buffered solution containing Phenol, Chloroform and Isoamyl alcohol. Variable region of 16S rRNA gene was then amplified from the resulting nucleic acid using PCR. The genomic DNA was extracted from 120 hours cultured cells using a DNA purification kit[ PurreLinkTM Genomic DNA Mini Kit with Catalog number: K182002 was purchased from Invitrogen, USA] according to the protocol provided by the manufacturer of DNA purification kit. The 16S rRNA gene was amplified by PCR[ PCR SuperMix kit was purchased from Invitrogen,USA] using forward[ 5-AGAGTTTGATCCTGGCTCAG-3-] and reverse[ 5-GGTTACCTTGTTACGACTT-3-] primers. PCR amplicons from up to hundreds of samples were then combined and sequenced on a single run. The resulting sequences were matched to a reference database to determine relative bacterial abundances. Polymerase Chain Reaction ( PCR) was a powerful method for amplifying particular segments of DNA. PCR used the enzyme PlatinumTM Taq DNA polymerase with catalog number 10966018[ purchased from Invitrogen, USA] that directed the synthesis of DNA from deoxynucleotide substrates on a single-stranded DNA template. DNA polymerase added nucleotides to the 3` end of a custom-designed oligonucleotide when it was annealed to a longer template DNA. Thus, if a synthetic oligonucleotide was annealed to a single-stranded template that contained a region complementary to the oligonucleotide, DNA polymerase could use the oligonucleotide as a primer and elongate its 3` end to generate an extended region of double stranded DNA. Denaturation was the initial PCR cycle stage The DNA template was heated to 94° C. This broke down the weak hydrogen bonds that held DNA strands together in a helix, allowing the strands to separate creating single stranded DNA. Annealing was the second PCR cycle. The mixture was cooled to anywhere from 50-70° C. This allowed the primers to bind (anneal) to their complementary sequence in the template DNA. Extension was the final step of PCR cycle. The reaction was ; then heated up to 72° C, the optimal temperature for DNA polymerase to act. DNA polymerase extended the primers, adding nucleotides onto the primer in a sequential manner, using the target DNA as a template. With one cycle, a single segment of double-stranded DNA template was amplified into two separate pieces of double-stranded DNA. These two pieces were then available for amplification in the next cycle. As the cycles were repeated, more and more copies were generated and the number of copies of the template was increased exponentially. The amplified PCR product was sequenced using a genetic analyzer 3130XL[ purchased from Applied biosystems, USA]. DNA sequence homology search analysis of the predominant bacterial isolate was achieved using Blastn algorithm at NCBI website. Fruiting bodies were examined using a Stereomicroscope( dissecting microscope) MSC-ST45T( purchased from Infetik, China). Wet mounts from crushed fruiting bodies were prepared. The refaractility, shape and the size of Myxospores were determined victimizing phase contrast microscopy. On the other hand the plates were exposed to 360 nm wavelength ultraviolet light to assess the fruiting bodies fluoresced.[16]
Identification Myxopyronin B producing bacterial isolates:
Gram stain:
It grouped bacteria into two types based on their cell wall composition.
Bacterial cells turned purple after being treated with a solution of crystal violet and then iodine on a microscope slide. When stained cells were treated with solvents such as alcohol or acetone, Gram-positive bacteria retained the stain while Gram-negative bacteria lost the stain and became colorless. With the addition of the decolorizing agent safranin, transparent Gram-negative bacteria turned pink.[17]
Spore shape:
This was discovered using the spore staining method. To get rid of any fingerprints, the slide was wiped with alcohol and a Kim-wipe. On the bottom of the slide, a Sharpie was used to create two circles. Each circle was filled with two tiny droplets of water using an inoculation loop. A very small amount of germs was taken out of the culture tube using an aseptic method. The water droplet on the slide had microorganisms on it. The slide was thoroughly dried by air. Bypassing the slide through the flame three to four times with the smear side up, the slide was heat-fixed. It took a while for the slide to completely cool. A piece of paper towel placed inside the slide’s border was used to hide the streaks. A beaker of heating water was situated over the slide. The slide was allowed to steam for three to five minutes; while the paper towel was covered with a malachite green liquid. Removed and thrown away was the discolored paper towel. To get rid of any stray paper towel bits, the slide was gently cleaned with water. The counter-stain was safranin for 1 minute. Before putting the slide on the microscope’s stage and seeing it via the oil immersion lens, the slide’s bottom was dried.[18]
Spore site:
During the Gram stain test, the spore location was grooved.[19]
Cell shape:
During the Gram stain test, the cell shape was determined.[20]
Blood haemolysis:
On blood agar media, the test antibiotic capacity to haemolyze the blood was tried.[21]
Motility test:
It distinguished between motile bacteria and non-motile bacteria.
A sterile needle was used to penetrate the medium to within 1 cm of the tube’s bottom to select a well-isolated colony and test for motility. The needle was certainly preserved in the same position as it was artifact-ed and removed from the medium. It took 18 hours of incubation at 35°C, or until evident growth materialized.[22]
Nitrate reduction test:
0.5 ml of Nitrate broth situated in a clean test tube was autoclaved for 15 minutes at 15 lbs pressure and 121°C, and was all-awed to cool to room temperature. The tube was inoculated with a heavy inoculum of unspoiled bacterial culture and was incubated at 35°C for 2 hours. 2 drops of reagent A and 2 drops of reagent B were added and blended well. The evolution of red color within 2 minutes was ascertained for. If no red color was formed, a small quantity of Zinc dust was added and discovered for the alteration to the red color in 5 minutes.[23]
Methyl red test:
In the Methyl Red test, an pestiferous tube of MR broth was used before adding the methyl red PH indicator. The buffers in the medium were get over by the acids when an organism utilized the blended acid fermentation pathway and brought forth stable acidic end products, consequent on an acidic environment.[24]
Catalase test:
A little inoculum of a specific bacterial strain was enclosed to a 3% Hydrogen peroxide solution to comprehend if it might produce Catalase. It was ascertained for the rapid emission of Oxygen bubbles.[25]
Oxidase test:
The 1% Kovács oxidase reagent was added to a little piece of filter paper, which was then let to air dry. A well-isolated colony was confiscated from a fresh( 18 to 24-hour culture) bacterial plate victimizing a sterile loop, and it was then hang-up onto processed filter paper. Color changes were detected.[26]
Citrate utilization:
Five milliliters of a Simmon Koser’s citrate medium were condemned after it had been autoclaved at 15 pounds for 15 minutes. To make up a clear slant and butt, the test tube incorporating melted citrate medium was slanted. Exploiting sterilized wire and labeled tubes, the specified samples of microbe were injected on the media’s incline. For 24 hours, the tubes were incubated at 37°C. The medium’s color alteration was observed for.[27]
Starch hydrolysis:
For 48 hours at 37°C, the bacterium plates were injected. After incubation, a dropper was utilized to saturate the surface of the plates with an iodine solution for 30 seconds. Iodine that was in superfluous was subsequently swarmed out. The area surrounding the bacterial growth line was dictated.[28]
Tween 80 hydrolysis:
1% Tween 80 was exploited to make up agar media. The rendered microorganism was introduced to the Tween 80 agar plates by employing an inoculating loop to make up a single center streak in the plate. The plates were procreated for 24 hours at 37 °C. HgCl2 solution was displaced over the plates. After a short while, the plates were discovered. Positive test outcome; well-defined halo-zone surrounding the injected area demonstrated Tween 80 chemical reaction.[29]
Growth at 10-45 0C:
On nutrient agar media, biological process was observed to be possible at 10- 45°C.[30]
Indol test:
The test tube incorporating the microorganism for inoculation received 5 drops of the Kovács reagent directly. Within seconds after inserting the reagent to the media, the reagent layer settled a pink to red colour (cherry-red ring), which was a mark of a positive Indol test.[31]
Tolerance salinity test:
Voges-Proskauer(VP) test:
For the test, Voges-Proskauer broth, a glucose-phosphate broth affluent-ed with microorganisms, was added to Alpha-naphthol and Potassium hydroxide. A successful consequence was betoken aside a Cherry red tint; whereas an unfortunate consequence was signal via a yellow-brown color.[33]
Casein hydrolysis test:
For testing the Casein hydrolyzing activity of the test antibiotic, a single line streak of the given culture was performed in the center of the skim milk agar plate under aseptic conditions and plate was procreated at 37°C in an incubator for 24-48 h.[34]
Saccharide fermentation tests:
Glucose fermentation test:
The fermentation reactions of glucose were investigated using glucose purple broth. Peptone and the PH indicator bromcresol purple made up the purple broth. A 1% concentration of glucose was added. Isolated colonies from a 24-hour pure culture of microorganisms were added to the glucose purple broth as an inoculant. Parallel to the inoculation of the glucose-based medium, a control tube of purple broth base was used. The inoculated medium was incubated aerobically for 3 days at a temperature of 35–37 °C. The medium began to become yellow, which was a sign of a successful outcome. A poor carbohydrate fermentation response was indicated by the lack of yellow color development.[35]
Fructose fermentation test:
A pure culture’s inoculum was aseptically transferred to a sterile tube of phenol red fructose broth. The infected tube was incubated for 18–24 hours at 35–37 °C. A color shift from red to yellow, signifying an acidic PH alteration, was a sign of a favorable response.[36]
Maltose fermentation test:
A pure culture inoculum was aseptically transferred to a sterile tube containing phenol red maltose broth. The infected tube was incubated for 18–24 hours at 35–37 °C. A color shift from red to yellow, signifying an acidic PH alteration, was a sign of a favorable response.[37]
Sucrose fermentation test:
A pure culture’s inoculum was aseptically transferred to a sterile tube containing phenol red sucrose broth. For 24 hours, the infected tube was incubated at 35–37 0C. A colour shift from red to yellow, signifying an acidic PH alteration, was a sign of a favourable response.[38]
Purification of Myxopyronin B antibiotic:
This was achieved through reversed phase chromatography technique.
The aeration rate was 0.142 V/ V. min. The stirring rate was 500 rpm. PO2 was about 90 % of saturation; but decreased to about 20 % after 18 hours). The fermentation was stopped after 40 hours via centrifugation at 500 rpm in a gyrator shaker. The supernatants were collected; then tested for antimicrobial sensitivity using broth dilution technique to detect MICs and agar paper diffusion discs technique. The test antibiotic was extracted from the 2 liters of culture broth with 2/ 10 volume ethyl acetate. The ethyl acetate was then removed under the reduced pressure at 40℃. Afterwards, the residue was dissolved in 398 ml of methanol-water( 90: 10) and chromatographed on reversed phase HPLC. Methanol was the mobile phase. The eluent was 70 part methanol: 16 part water: 4 part acetic acid with flow rate 300 ml/ min. Detection of the antibiotic components was achieved exploiting refractive index. The main peak with retention time 5 minutes contained the biological antibiotic activity which was determined via agar diffusion assay using paper discs and Staphylococcus aureus as an indicator organism. On the other hand, the main peak was subjected to neutralization via NaHCO3. Myxopyronin B was extracted using 10 % V/ V Ethylene chloride. After the evaporation of the solvent, about 85 % of the remaining antibiotic substance was pure. It was noticed that the retention Time of Myxopyronin B was 10 minutes. Molecular formula of the purified Myxopyronin B was detected through mass spectrometer( Quadrupole mass spectrometer, Advion, USA).[39]
Procedure of Broth dilution assay for determination of MICs of Myxopyronin B:
During testing, multiple microtiter plates were filled with a certain broth, according to the needs of target bacteria. Varying concentrations of the antibiotics and the bacteria to be tested were then added to the plate. The plate was then placed into a non-CO2 incubator and incubated at thirty-seven degrees Celsius for sixteen to twenty hours. Following the allotted time, the plate was removed and checked for bacterial growth. When the broth became cloudy, bacterial growth occurred. The results of the broth microdilution method were reported in Minimum Inhibitory Concentration( MIC), or the lowest concentration of antibiotics that stopped bacterial expansion.[40]
Agar diffusion assay with paper discs procedure for the determination of Myxopyronin A antimicrobial activity:
The disk diffusion method( DDM) was classified as an agar diffusion method( ADM) because the test antibiotic extract to be tested diffused from its reservoir through the agar medium seeded with the test microorganism. Generally, the reservoir was a filter paper disk, which was placed on top of an agar surface. When tested extracts compounds were microbiologically active, an inhibition zone developed around the filter paper disk after incubation. The diameter of the inhibition zone properly described the antimicrobial potency of test extract.[41] The test microbes were isolated using either selective or enrich growth media or broth( Table 2).
Estimation of Myxopyronin B effect on bacterial RNA synthesis:
The concentration of RNA isolated with RNeasy Kits( purchased from QIAGEN, USA) was determined by measuring the absorbance at 260 nm in a spectrophotometer. An absorbance of 1 unit at 260 nm corresponds to 40 µg of RNA per ml( A260 = 1 = 40 µg/ ml).[42]
Estimation of Myxopyronin B effect on bacterial protein synthesis:
Absorbance was measured at 205 nm to calculate the protein concentration by comparison with a standard curve. A( 205) method could be used to quantify total protein in crude lysates and purified or partially purified protein. The UV spectrophotometer was set to read at 205 nm allowing 15 min for the instrument to equilibrate. The absorbance reading was set to zero with a solution of the buffer and all components except the protein present. The protein solution was placed in the 1 ml cuvette and the absorbance was determined. The dilution and readings of samples were performed in duplicate.The matched cuvettes for samples and controls were utilized during the test procedure. The extinction coefficient of the protein was known, the following equation was employed. Absorbance = Extinction coefficient × concentration of protein × path length( 1 cm) to determine the concentration of the protein.[43]
Estimation of pharmacodynamic and pharmacokinetic effects of Myxopyronin B during experimental animal testing in preclinical clinical trials:
In the present study, the pharmacokinetics and the pharmacodynamics of Myxopyronin A were evaluated after dosing in male rabbit animal models weighing about 2 kg. Furthermore, compound concentrations were determined in target compartments, such as lung, kidney and thigh tissue, using LC-MS/ MS. Based on the pharmacokinetic results, the pharmacodynamic profile of Myxopyronin B was assessed utilizing the standard neutropenic thigh and lung infection models.[44]
Estimation of pharmacodynamic and pharmacokinetic effects of Myxopyronin B in randomized human clinical trials phases 1/2:
This study was conducted in 150 human volunteer subjects to show the bioavailability, pharmacokinetics and the pharmacodynamics of the test antibiotic. The study was designed as randomized, single-dose, 2-treatment, 2-period crossover trial with a washout period of 1 week. Blood samples were collected at 0( baseline), 10, 20, and 40 minutes and at 1, 1.5, 2, 3, 4, 6, 9, 12, and 24 hours postdose. Plasma concentrations of the 4 drugs were measured by using a rapid chromatography-tandem mass spectrometry method. Pharmacokinetic parameters were calculated by using noncompartmental methods. Bioequivalence was determined if the 90 % CIs of the log-transformed test/ reference ratios AUC( 0-25), AUC( 0-∞), and Cmax were within the predetermined range of 80% to 125%. Tolerability was assessed by using clinical parameters and subject reports Pharmacodynamic effects were evaluated through the determination of MICs via agar diffusion assay and broth dilution technique During randomized human clinical trials phases 1/2 all utilized infectious bacterial cell counts were estimated spectrophotometrically.[45]
Estimation of of phototoxicity, mutagenicity and carcinogenicity of Myxopyronin B:
The phototoxicity was dictated via 3T3 neutral red uptake phototoxicity technique.[46] On the other hand, mutagenicity and carcinogenicity of the test antibiotic were assessed using Ames test.[47]
The determination of toxokinetics and toxodynamic impacts of Myxopyronin B:
Up and down method for acute toxicity detection of Myxopyronin B was utilized for this purpose.[48]
The determination of maximum bactericidal activity of Myxopyronin B:
A pure culture of a specified microorganism was grown overnight, then diluted in growth-supporting broth( typically Mueller Hinton Broth) to a concentration between 1 x 10^5 and 1 x 10^6 cfu/ ml. A stock dilution of the antimicrobial test substance was made at approximately 100 times the expected MIC. Further 1:1 dilutions were made in test tubes. All dilutions of the test antibiotic were inoculated with equal volumes of the specified microorganism. A positive and negative control tube was included for every test microorganism to demonstrate adequate microbial growth over the course of the incubation period and media sterility, respectively. An aliquot of the positive control was plated and used to establish a baseline concentration of the microorganism used.The tubes were then incubated at the appropriate temperature and duration. Turbidity indicated growth of the microorganism and the MIC was the lowest concentration where no growth was visually observed. To determine the MBC, the dilution representing the MIC and at least two of the more concentrated test product dilutions were plated and enumerated to determine viable CFU/ ml. The MBC was the lowest concentration that demonstrated a pre-determined reduction (such as 99.9%) in CFU/ ml when compared to the MIC dilution.[49]
Determination of plasma protein binding capacity of Myxopyronin B:
Using an ultrafiltration technique, the protein binding( PB) extent and changeability of the test antibiotic medicates were settled when given simultaneously to 30 patients inoculated with infectious pneumococci inside hospitals in Egypt. Clinical samples used were routinely received by microbiological laboratory inside the faculty of Pharmacy, Cairo University, Egypt. Plasma proteins were likewise plumbed. A protein-free medium was utilized to ascertain the nonspecific binding. Plasma samples from 30 patients were included, of which plasma proteins were emancipated for 24 patients.
Determination of liver, kidney and heart function tests of the test antibiotic:
These functional tests were carried out to evaluate the vitality of liver, kidney and heart during the randomized human clinical trials phases 1/2. On the other hand, Urine, stool analyses in addition to estimation of blood complete counts were performed to all experimental subjects given graded doses of Myxopyronin B.
Figure 1.
It demonstrates the structure of Myxopyronin B extracted from bacterial isolates Myxococcus SDU36 collected from different soil environments in Egypt . Molecular formula of the purified test antibiotic was noticed to be C24H33NO6 determined through mass spectrometer.
Figure 1.
It demonstrates the structure of Myxopyronin B extracted from bacterial isolates Myxococcus SDU36 collected from different soil environments in Egypt . Molecular formula of the purified test antibiotic was noticed to be C24H33NO6 determined through mass spectrometer.
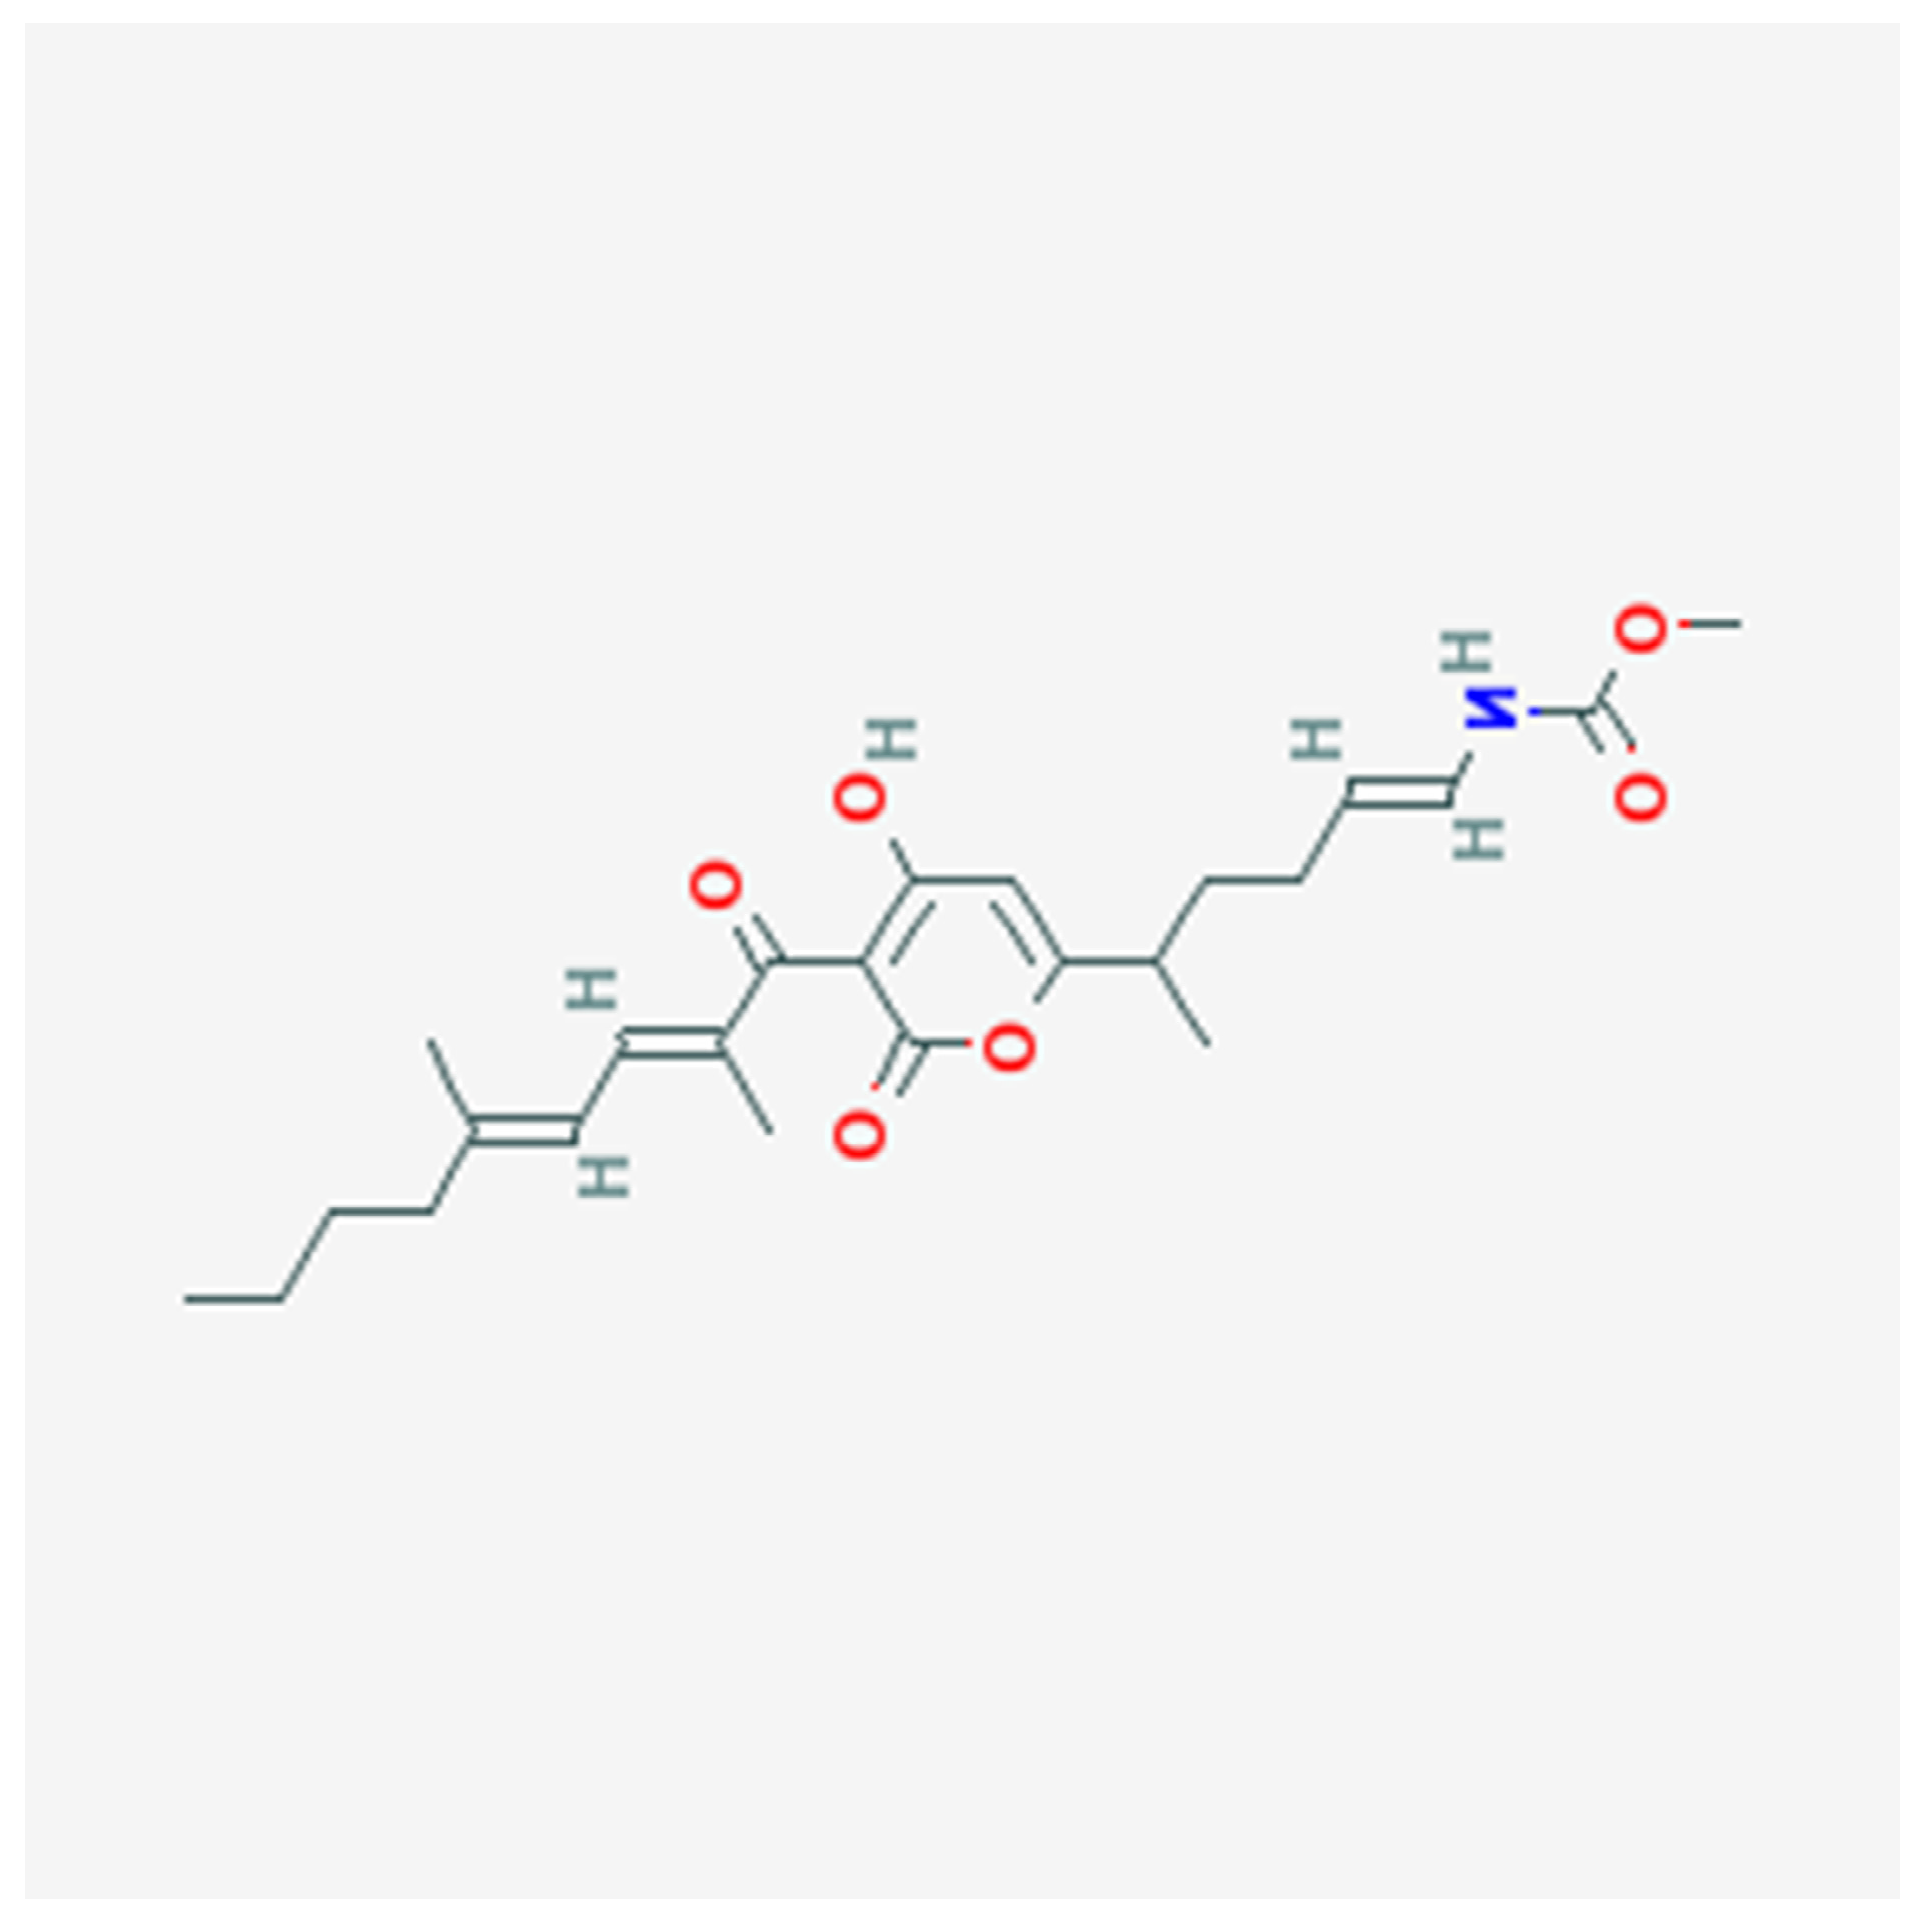
Figure 2.
It represents docking of Myxopyronin B ligand on Bacterial RNA polymerase. Myxopyronin B non-competitively showed high affinity and inhibitory effect towards the switch region. Molecular mass of Myxopyronin B was observed to be nearly 430 Da. ∆G was reached 20 joule/ mole; while Kd was observed to be nearly -290 nM.
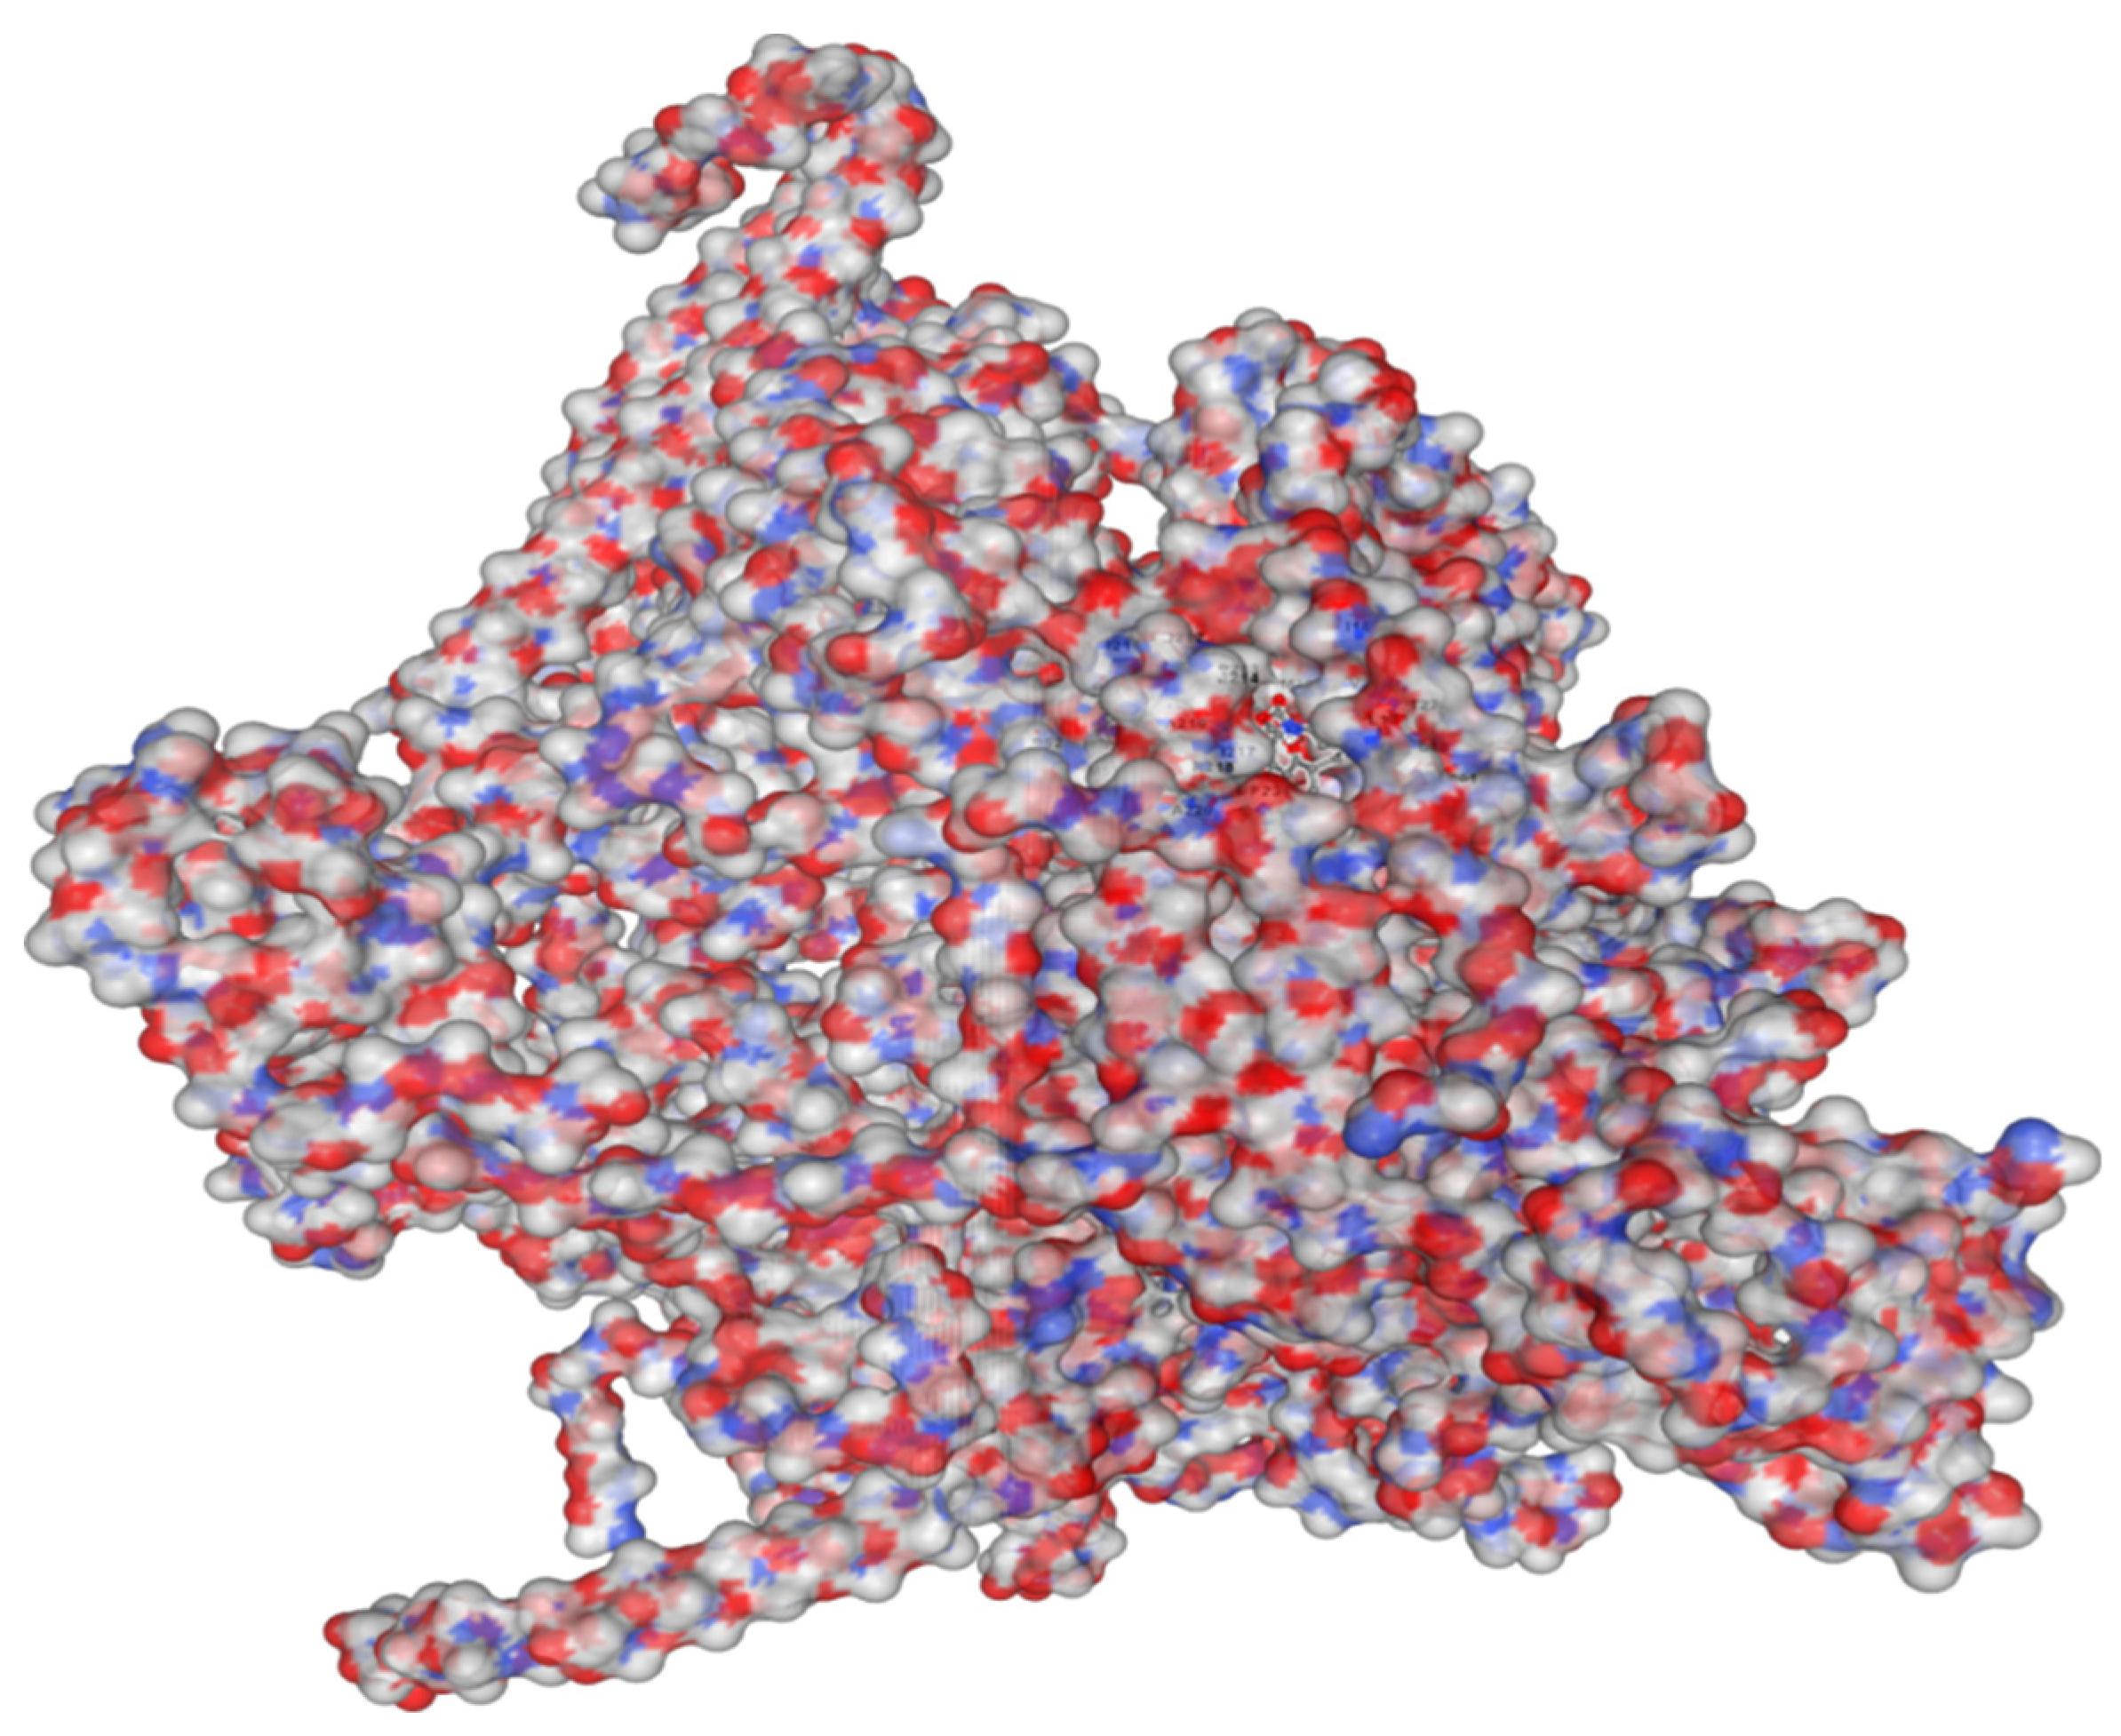
Figure 3.
It demonstrates 3D structure of bacterial prokaryotic RNA polymerase comprising the switch binding site to which Myxopyronin B Ligand strongly bound inhibiting bacterial RNA polymerase activity selectively leading to the inhibition of mRNA transcription and subsequently the mortality of the microbe. The secondary structure of RNA polymerase enzyme consisted of spiral alpha and beta sheets. Its molecular mass was approximately 198 amino-acids.
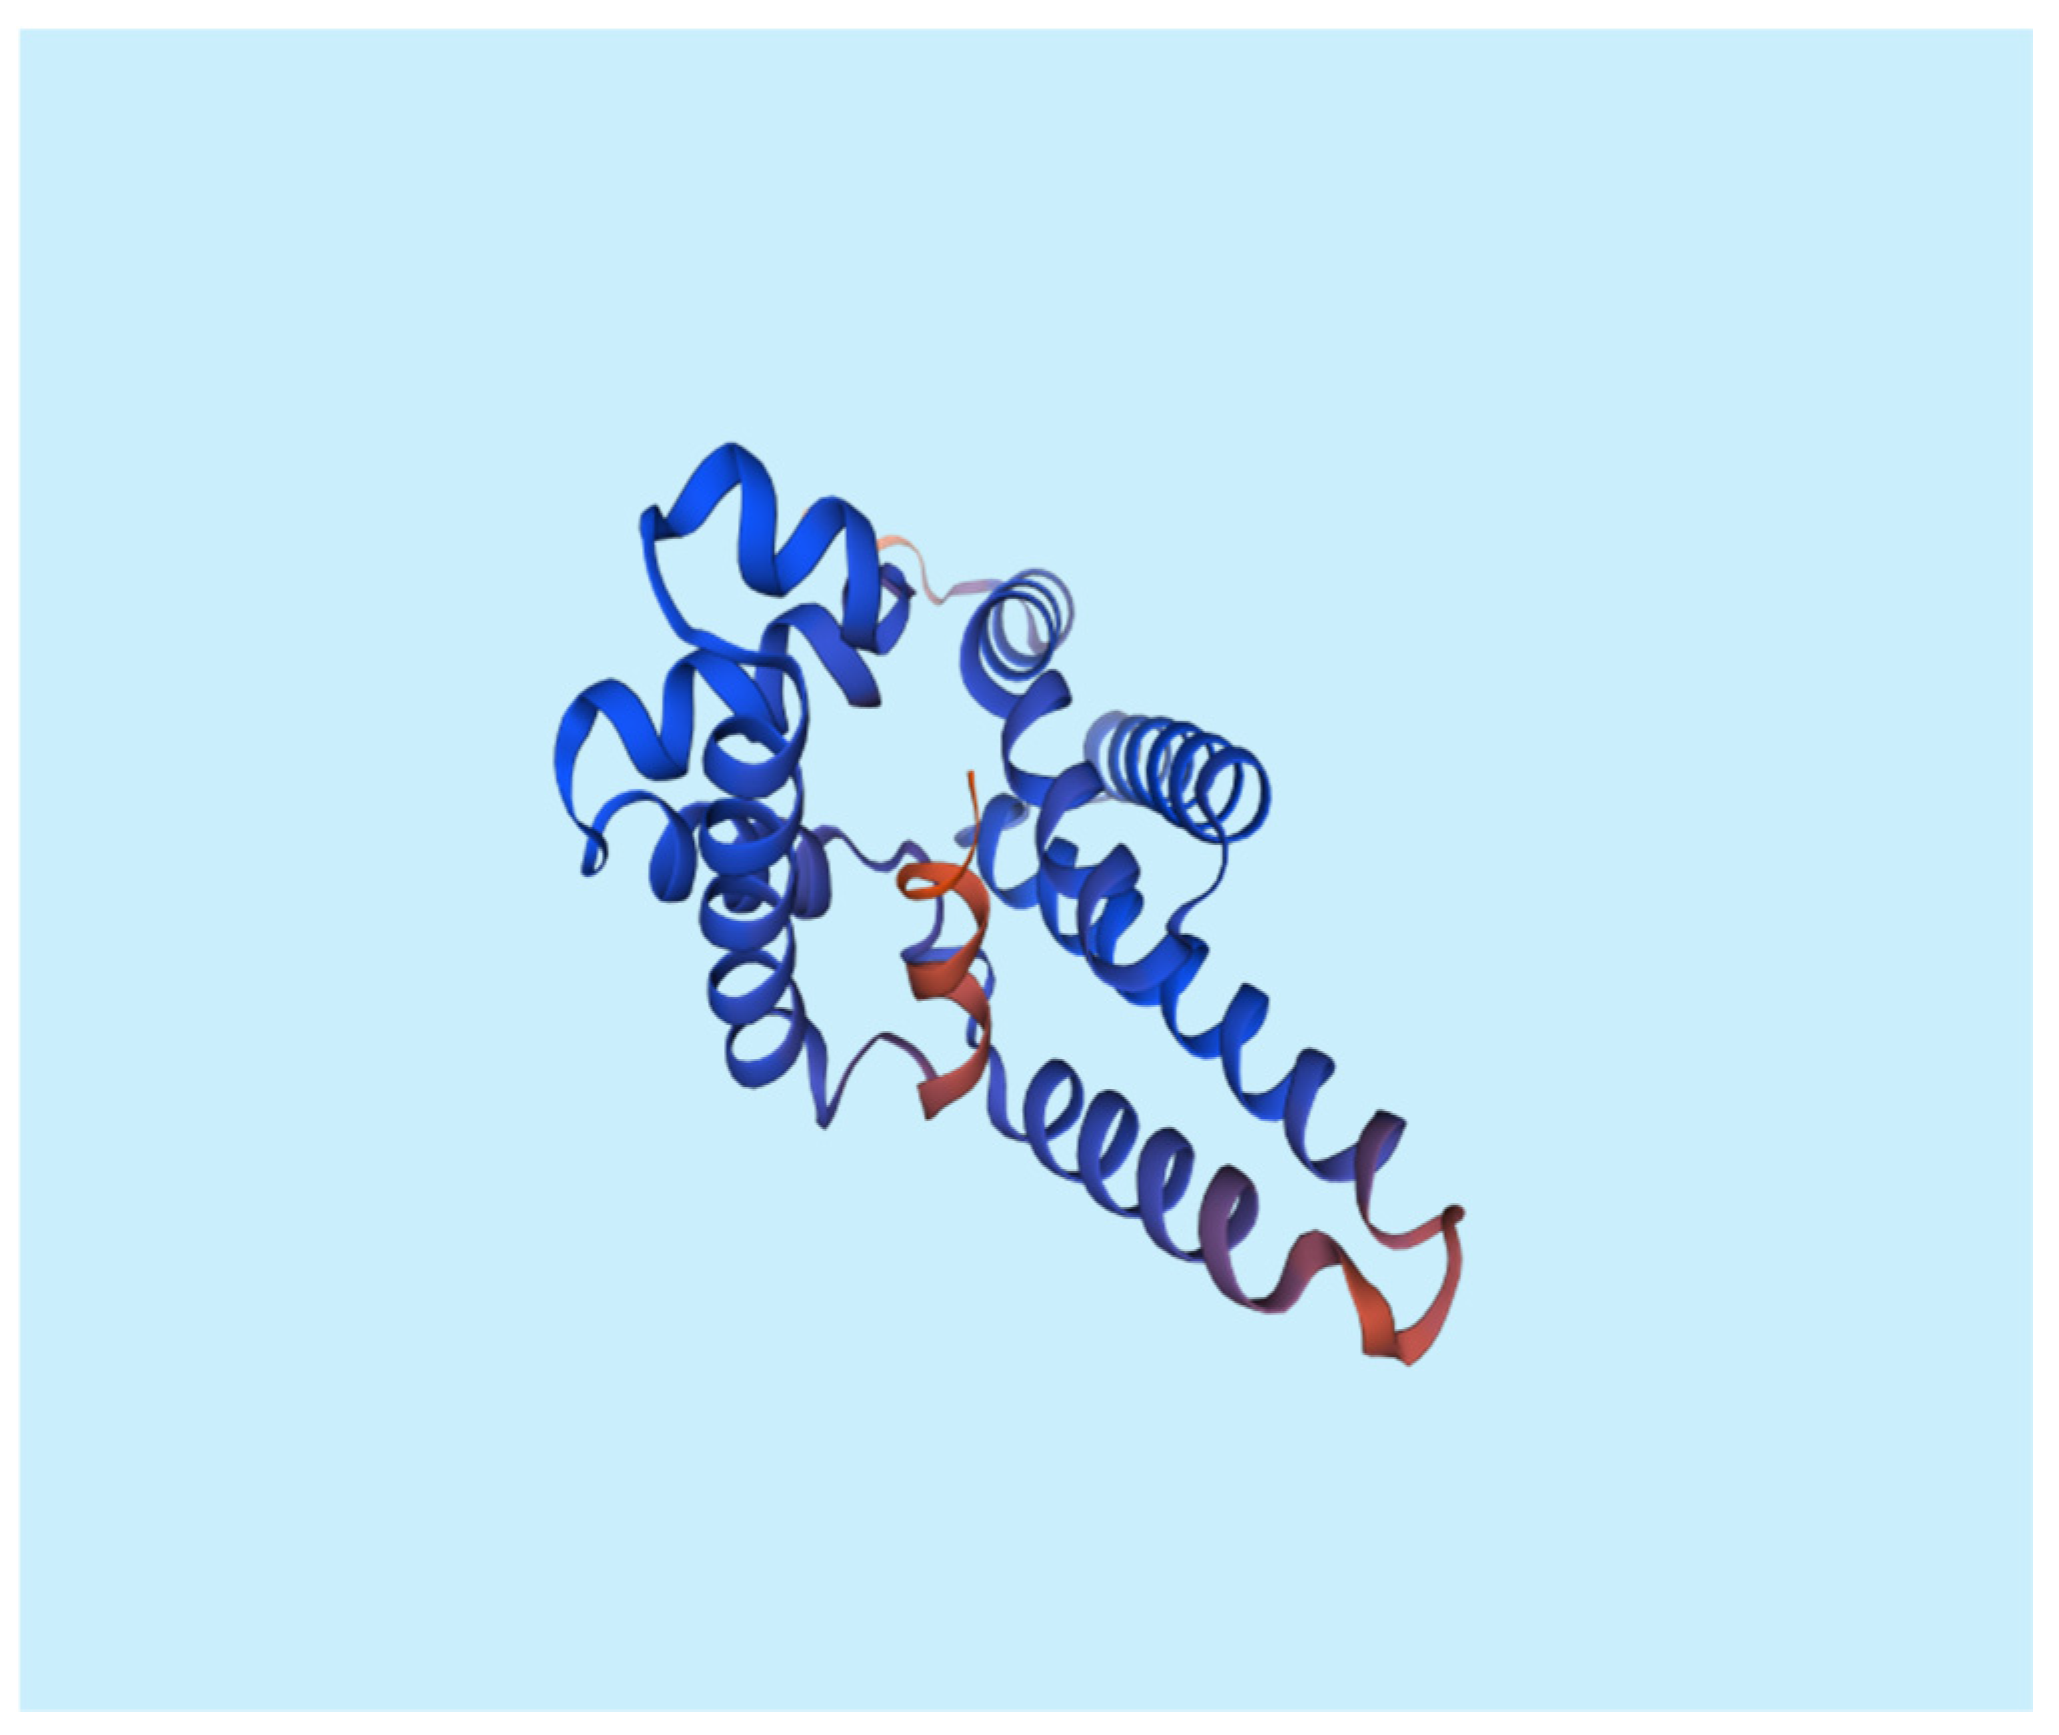
Figure 4.
It shows the impact of various concentrations of Soluble Starch on the production of Myxopyronin B.
Figure 4.
It shows the impact of various concentrations of Soluble Starch on the production of Myxopyronin B.
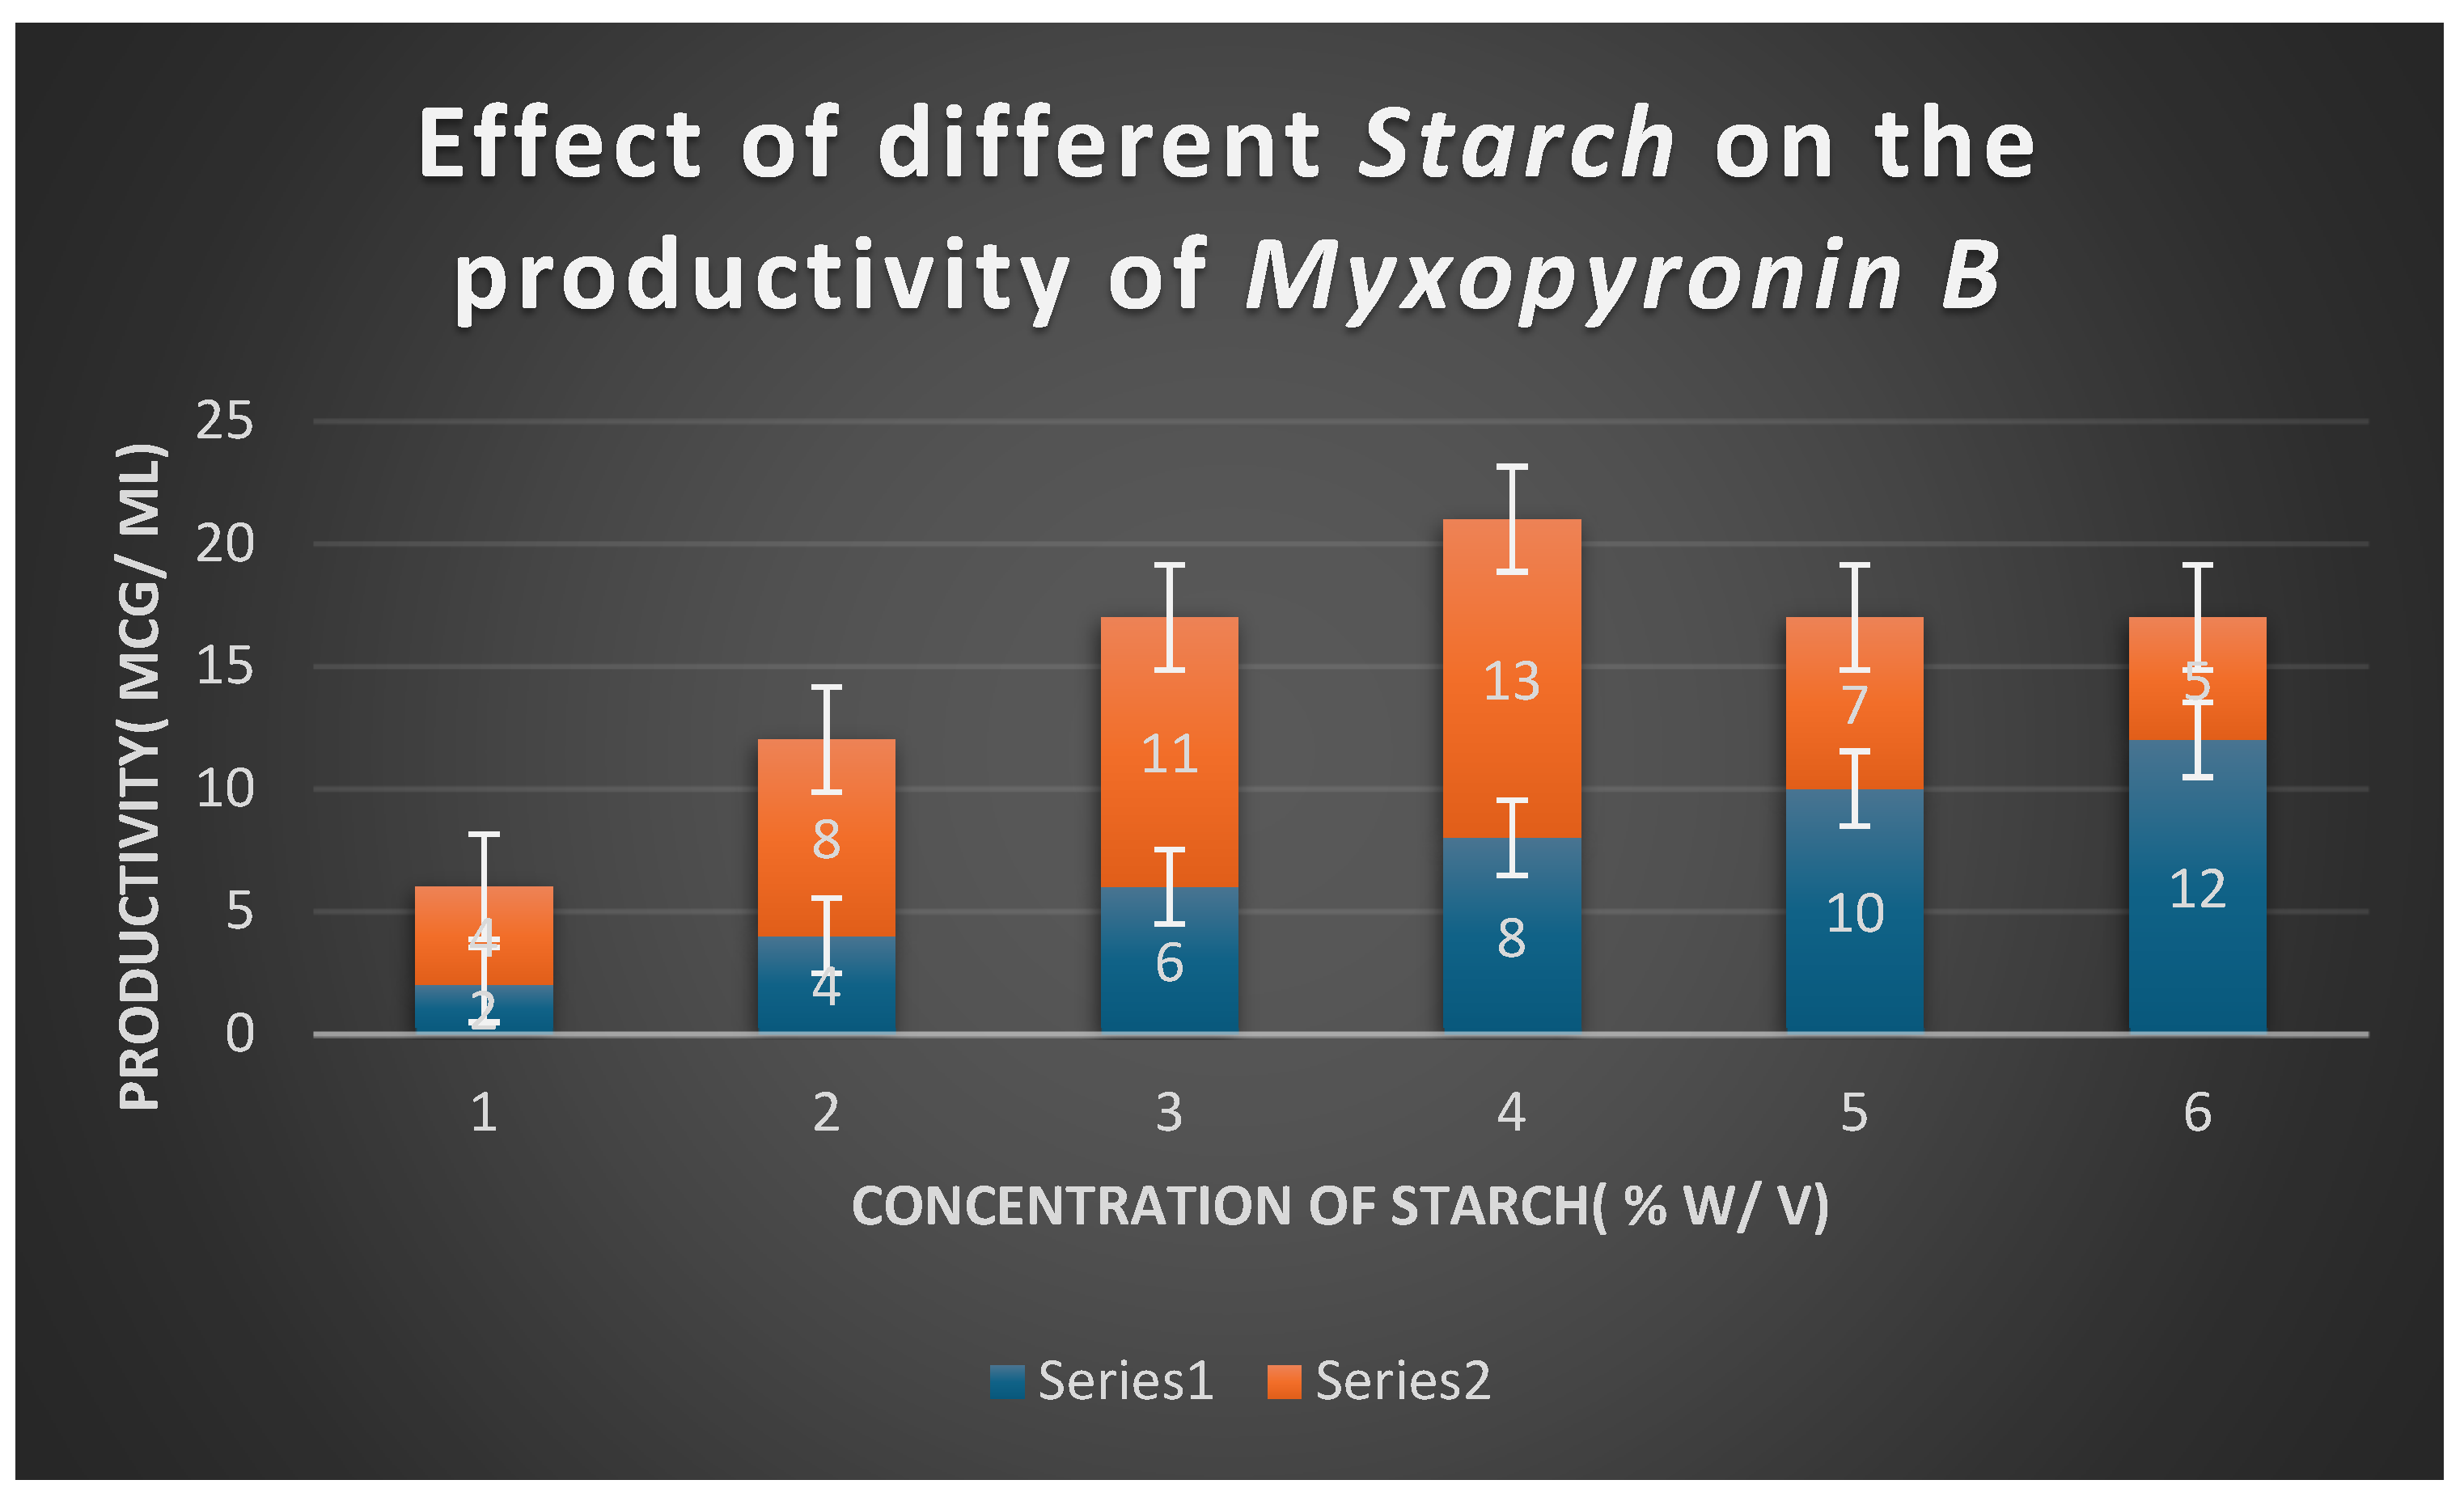
Figure 5.
It shows the effects of different Peptone concentrations as nitrogen growth factor on the productivity of Myxopyronin B.
Figure 5.
It shows the effects of different Peptone concentrations as nitrogen growth factor on the productivity of Myxopyronin B.
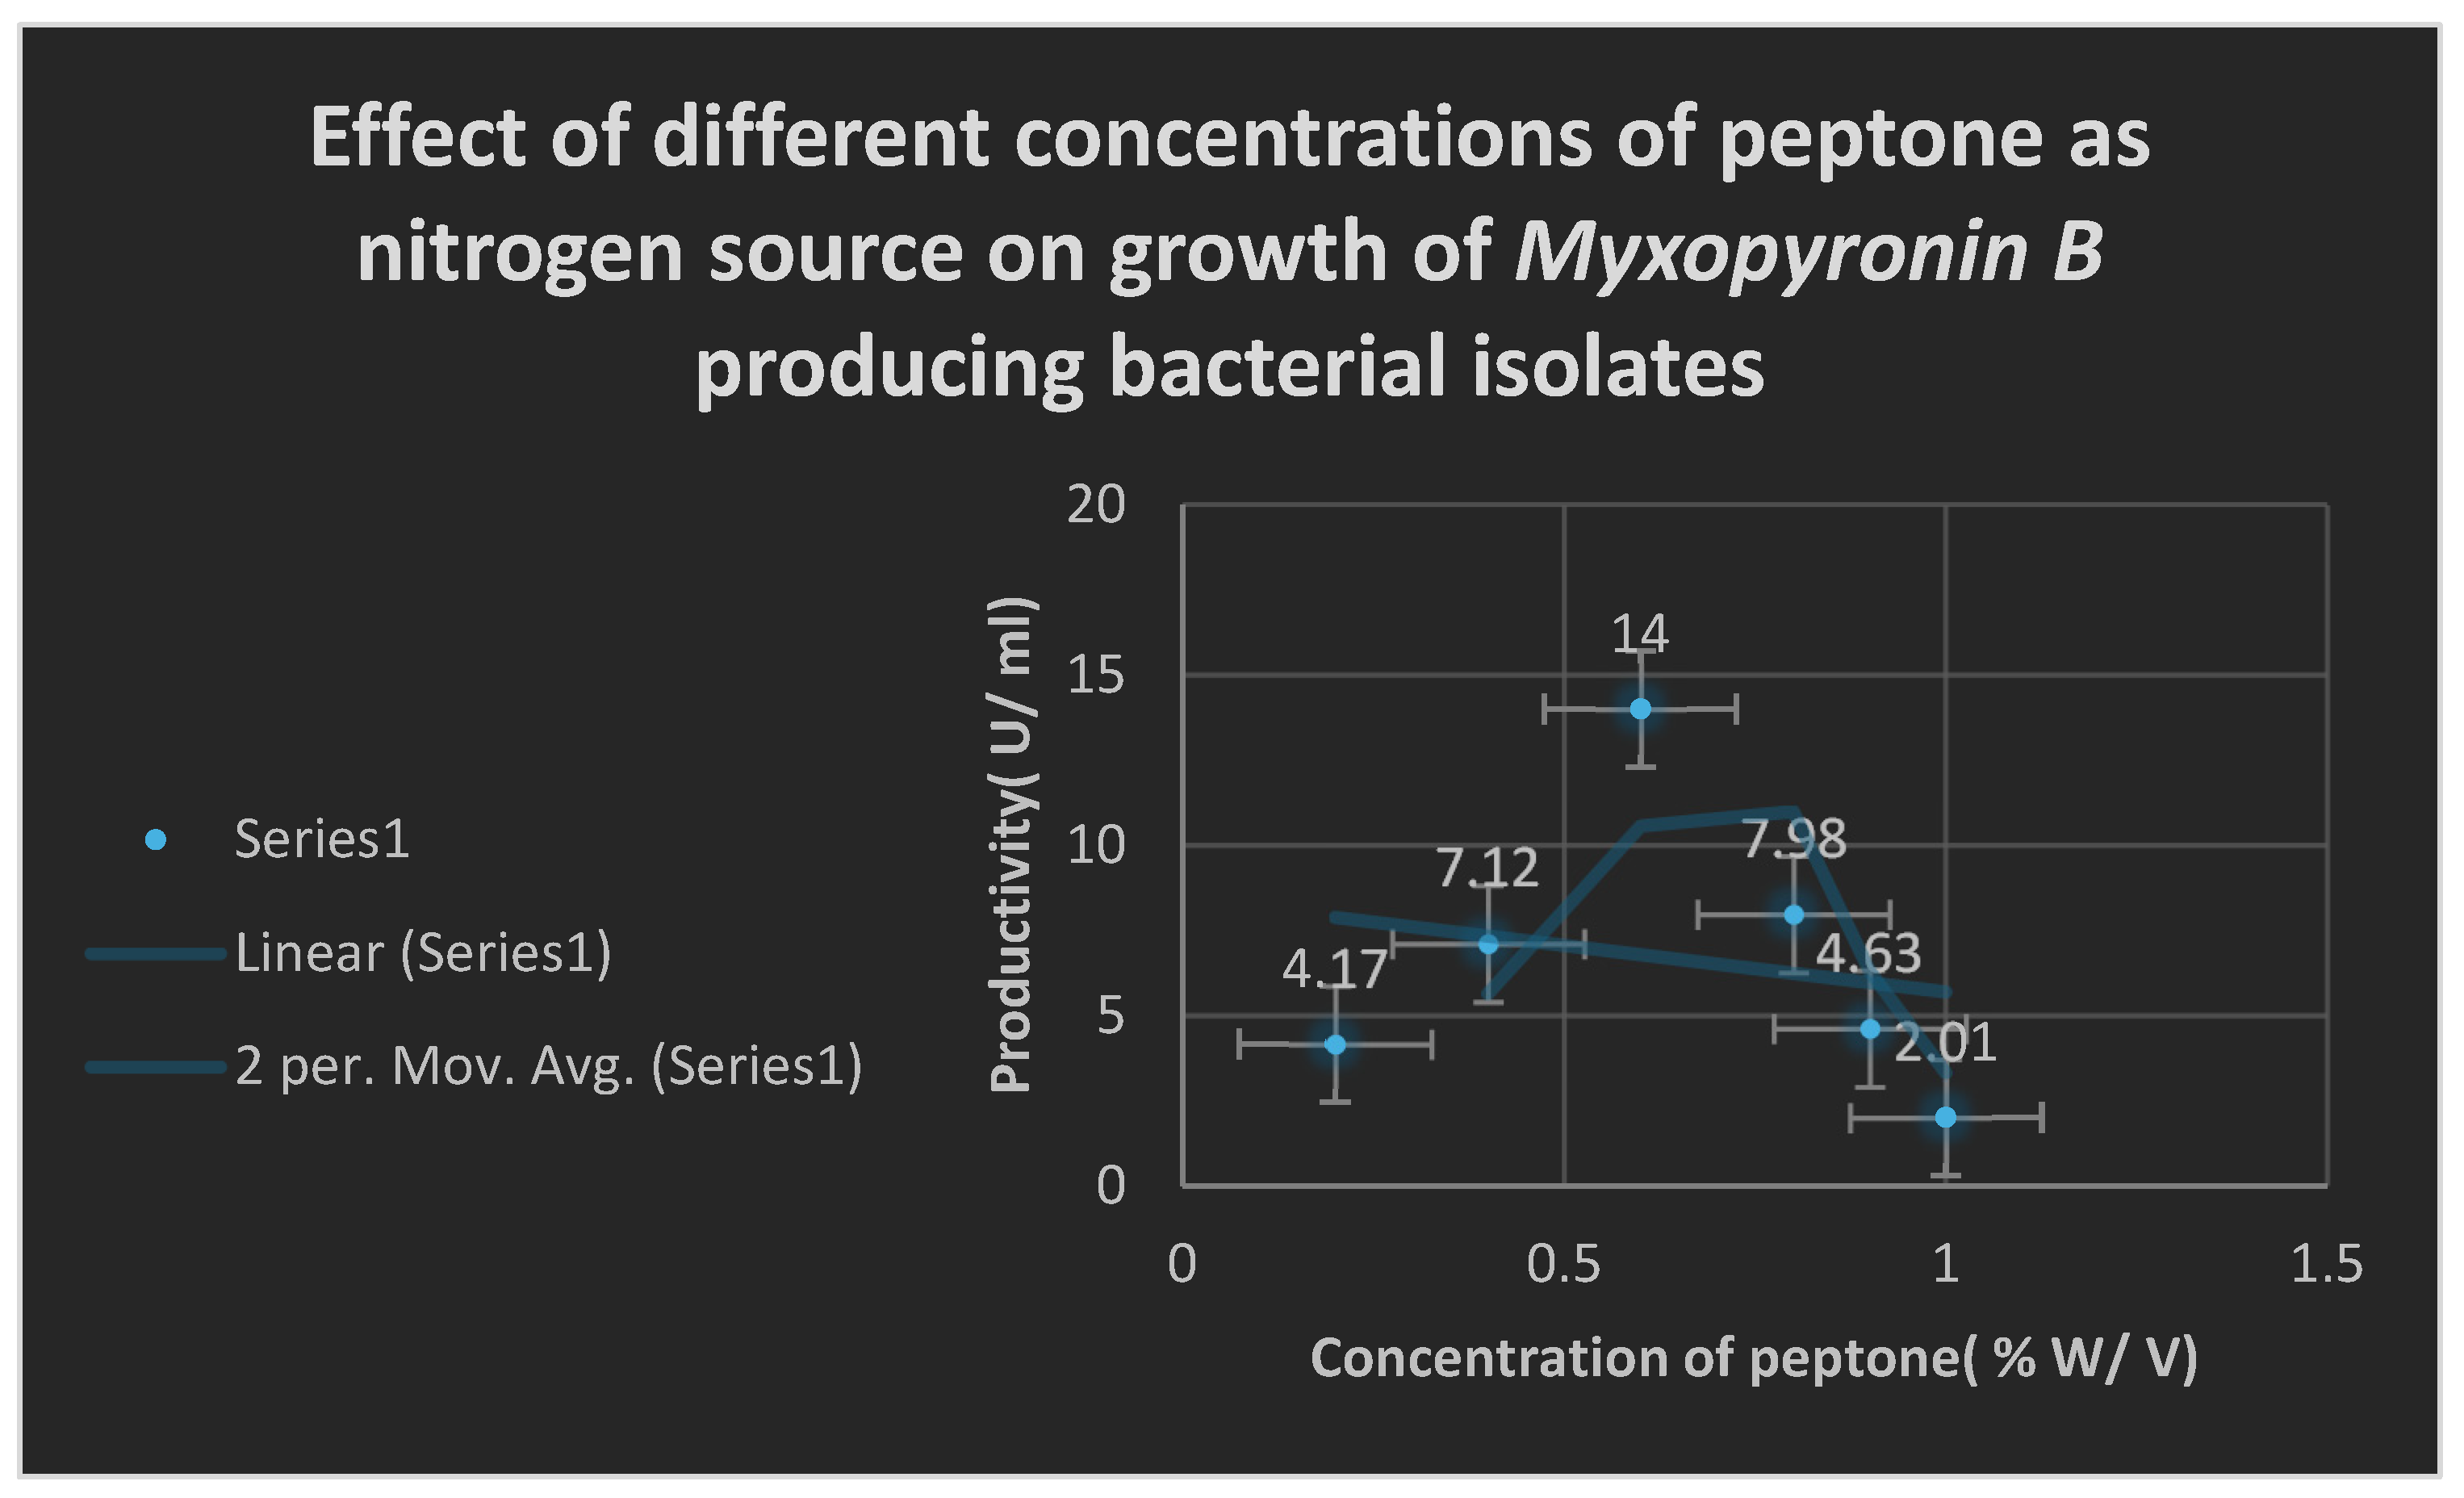
Figure 6.
It refers to the estimation of effect of Myxopyronin B on microbial mRNA productivity. mRNA synthesis was detected to be diminished proportionately up on employment of exploding doses of Myxopyronin B antibiotic.
Figure 6.
It refers to the estimation of effect of Myxopyronin B on microbial mRNA productivity. mRNA synthesis was detected to be diminished proportionately up on employment of exploding doses of Myxopyronin B antibiotic.
Figure 7.
It demonstrates the influence of Myxopyronin B on protein synthesis using UV spectrophotometer absorption at 205 nm. Protein synthesis was noticed to be decreased dramatically up on utilization of increasing doses of Myxopyronin B antibiotic.
Figure 7.
It demonstrates the influence of Myxopyronin B on protein synthesis using UV spectrophotometer absorption at 205 nm. Protein synthesis was noticed to be decreased dramatically up on utilization of increasing doses of Myxopyronin B antibiotic.
Figure 8.
It shows AUC of Myxopyronin B following SC administration in clinical trials stages 1/2. Efficacious dose ranged from 7-8 mg/ kg of body weight. Onset of action was observed following closely 15 minutes. It followed first order of elimination kinetics. Bioavailability reached nearly 92%.
Figure 8.
It shows AUC of Myxopyronin B following SC administration in clinical trials stages 1/2. Efficacious dose ranged from 7-8 mg/ kg of body weight. Onset of action was observed following closely 15 minutes. It followed first order of elimination kinetics. Bioavailability reached nearly 92%.
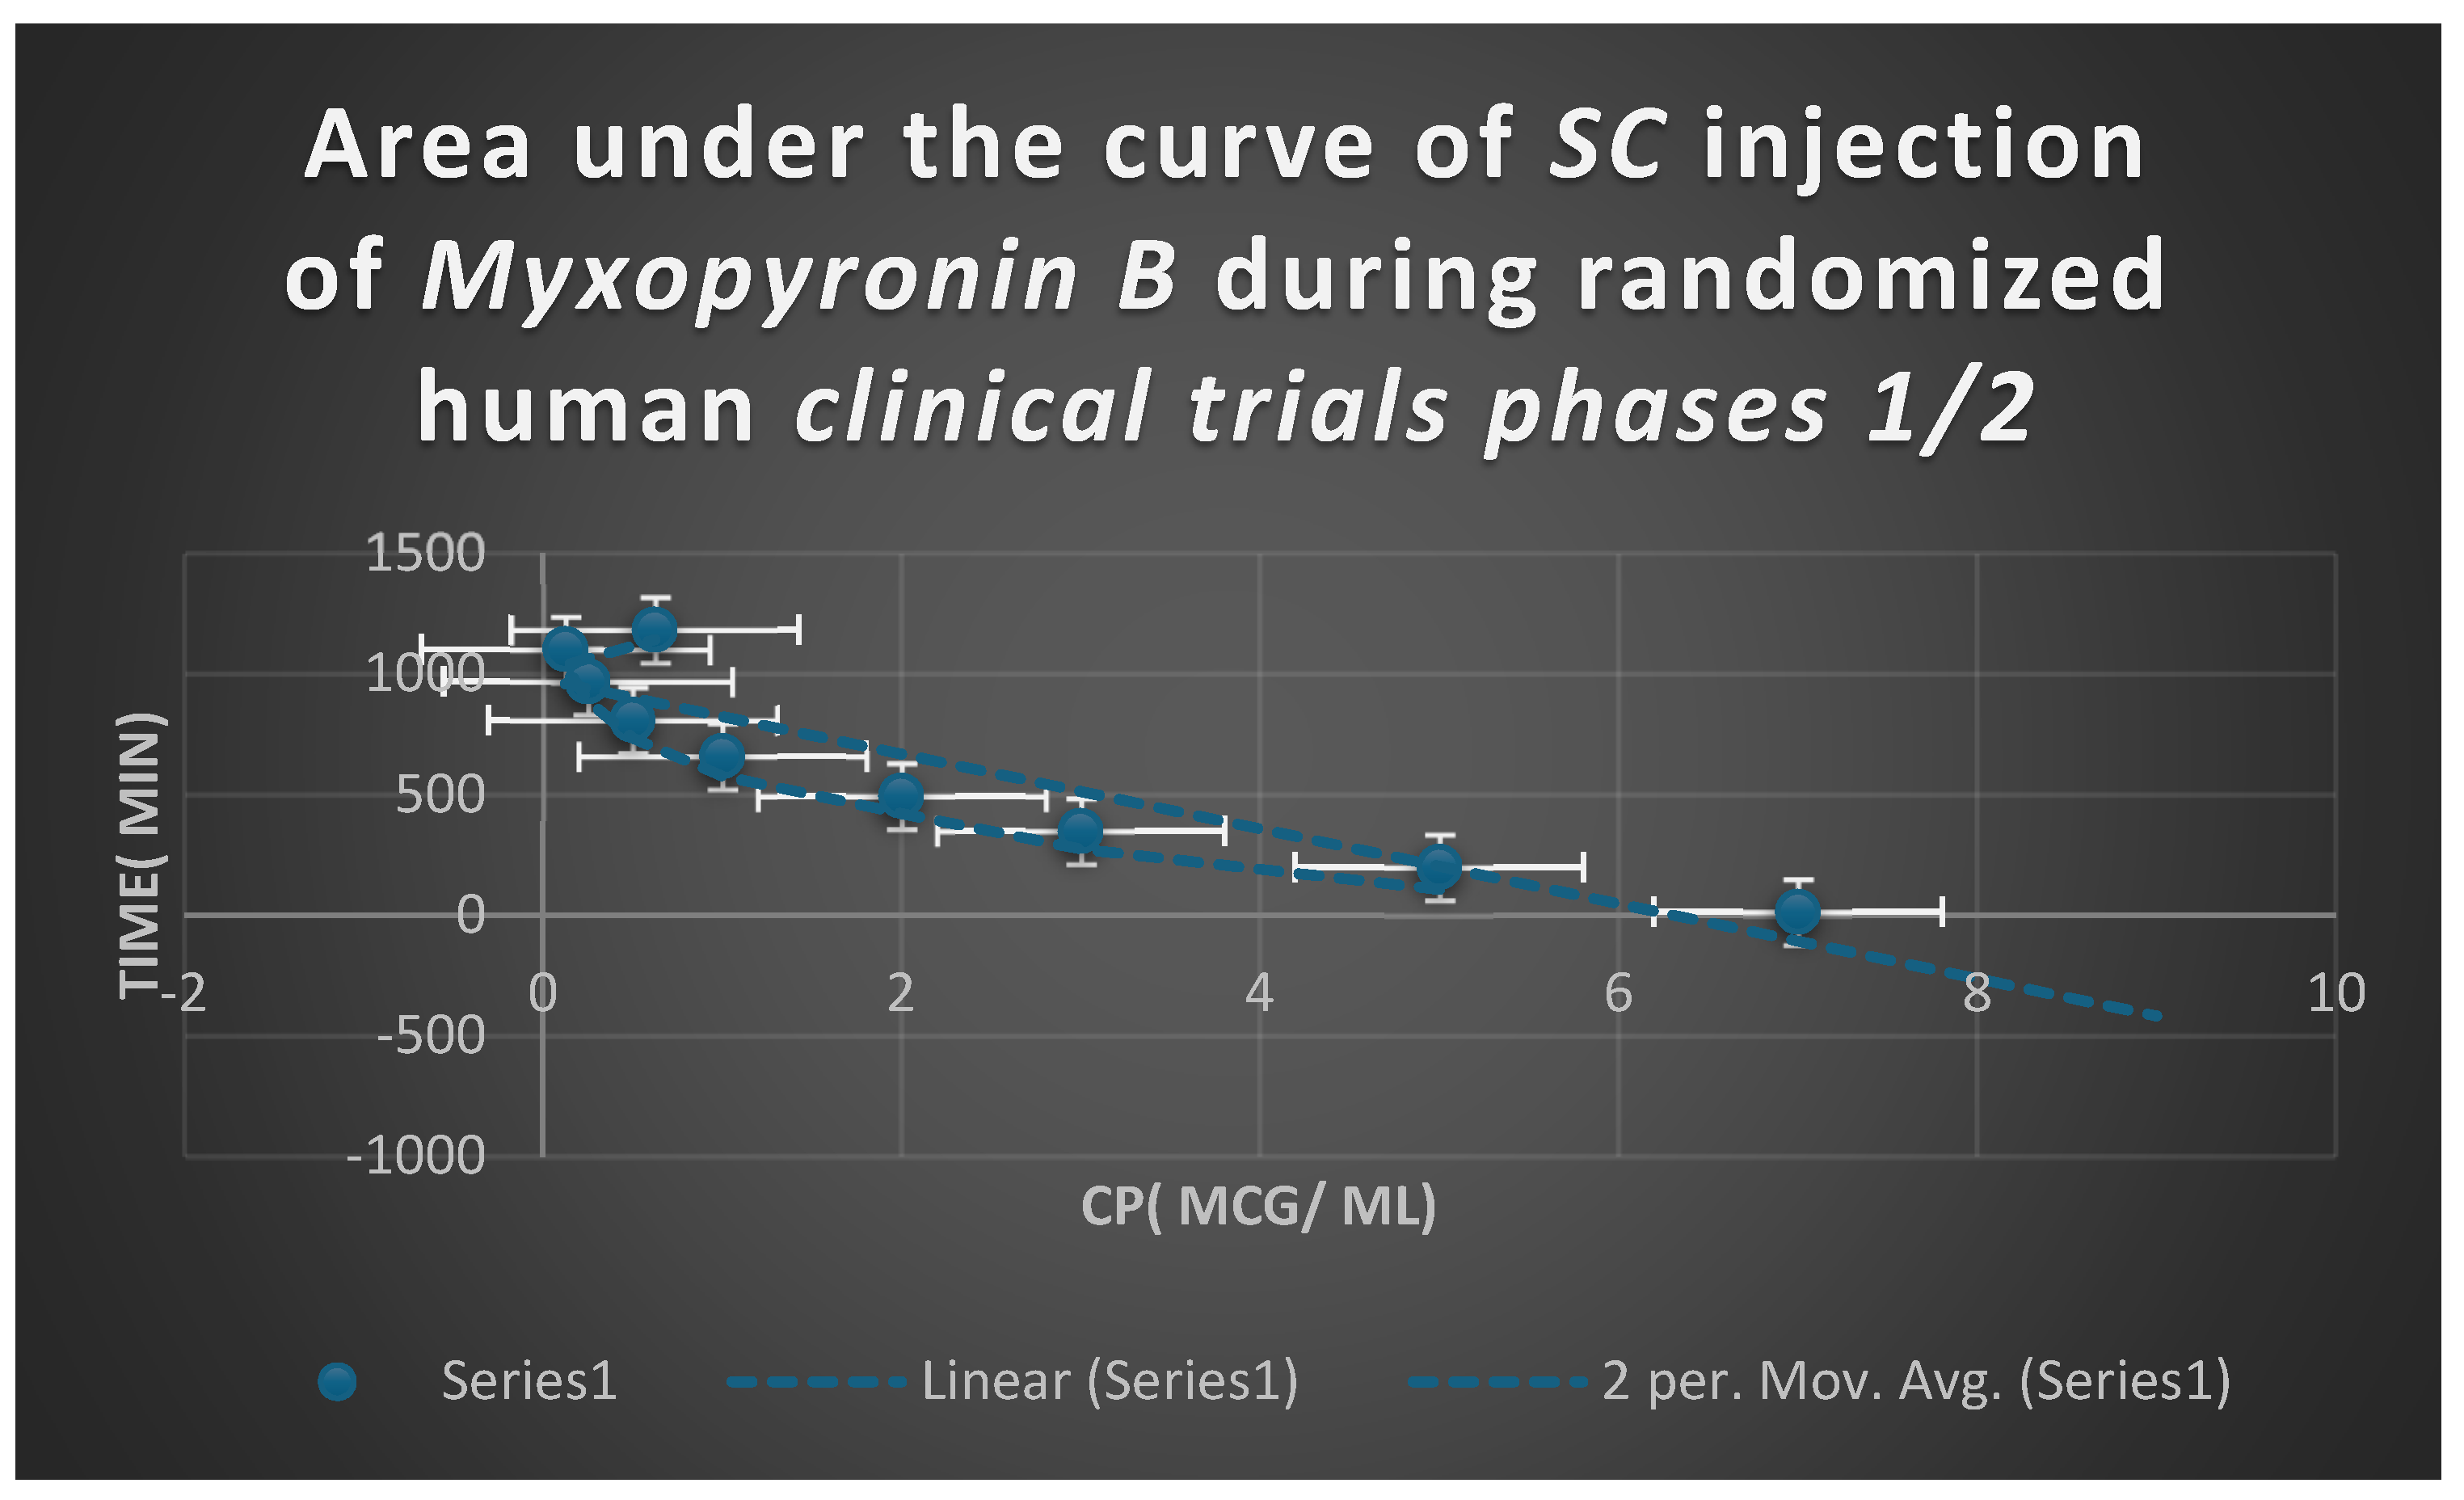
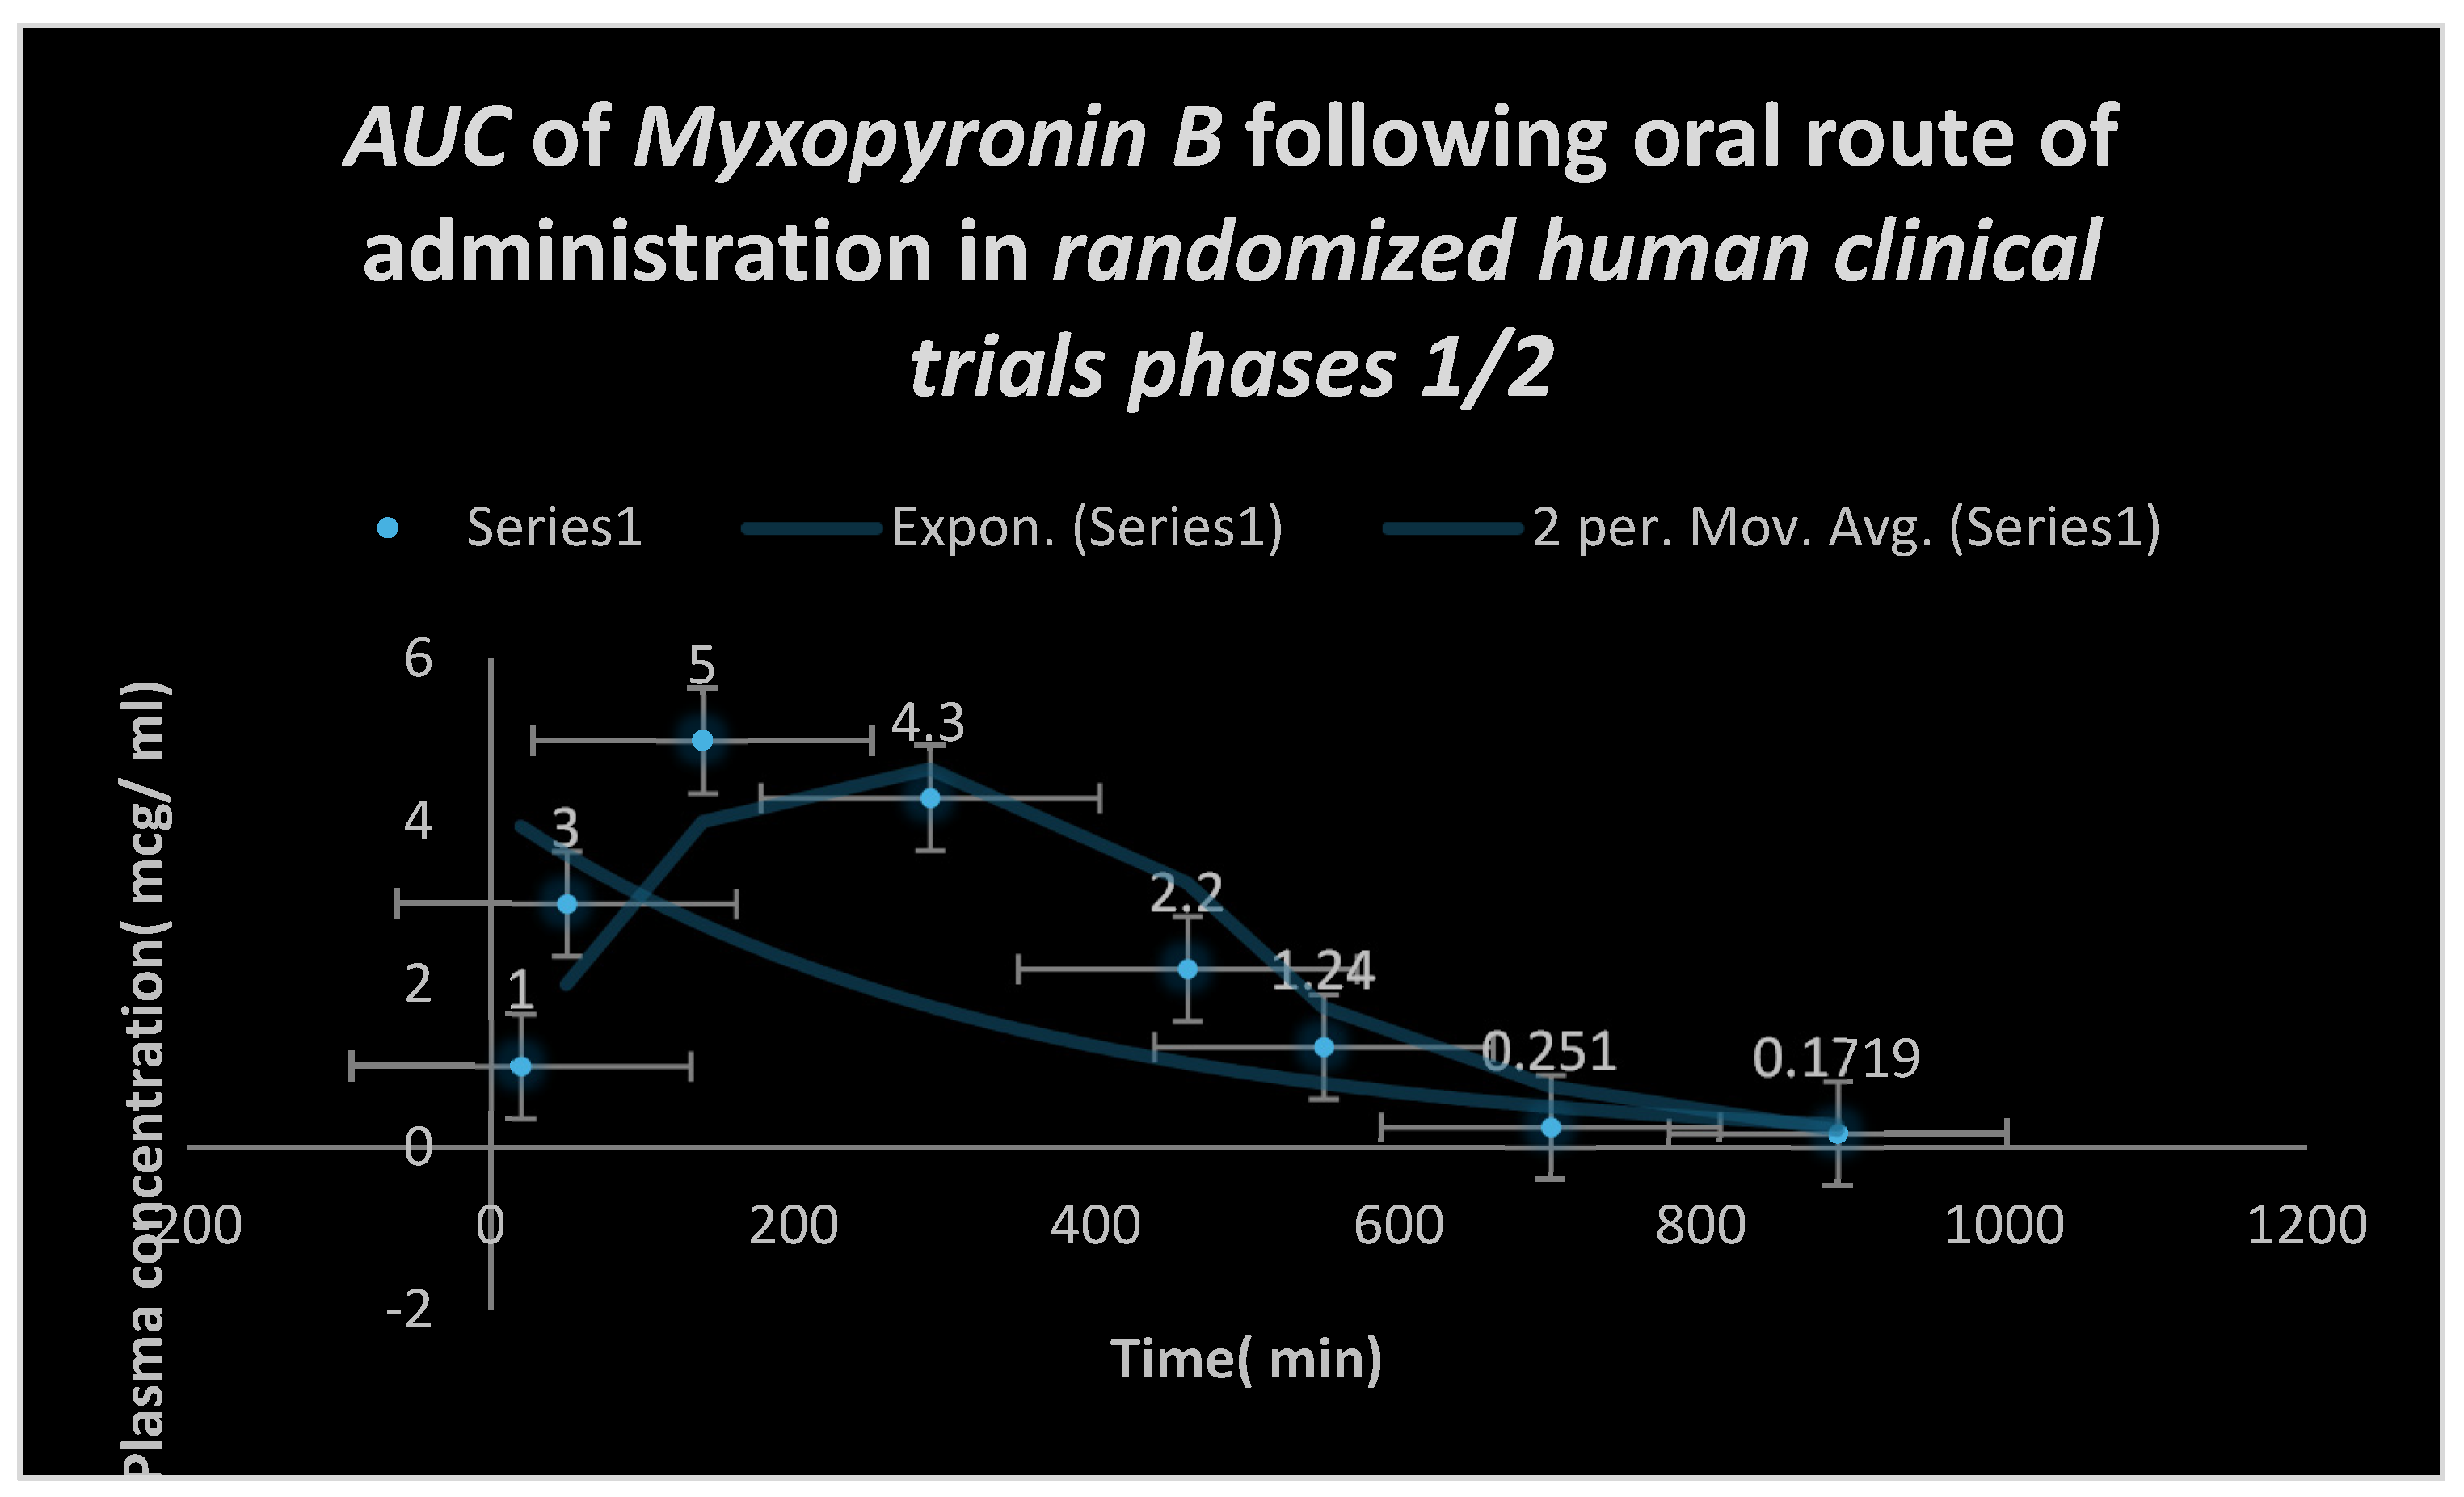
Figure 9.
Area under the curve( AUC) following oral administration of Myxopyronin B during clinical trials phases 1/2. Effective dose ranged from 9-10 mg/ kg of body weight. Onset of action was observed following nearly 28 minutes. It followed first order of elimination kinetics. Bioavailability reached about 90%.
Statistical Analysis
All cultures were conducted in triplets. Their presentation was by means and standard deviation. One way analysis of variance( p value≤ 0.05) was used as means for performing statistical analysis and also, statistical analysis was based on excel-spreadsheet-software. The F statistical analysis test was utilized during the present study.
Results
The primary soil bacterial isolate cultivated on Casein yeast peptone plate, Myxococcus SDU36 produced the culture supernatant from which Myxopyronin B was produced. The test antibiotic reduced the growth of a few Gram-ve bacteria, including Escherichia coli, at MICs more than 100 mcg/ml, but it did not prevent the development of numerous Gram+ve bacteria at MICs lower than 100 mcg/ml. Eukaryotic cells, on the other hand, including those in humans and fungi, were unharmed. The test antibiotic’s bactericidal effect was shown by its inhibition of bacterial DNA-dependent RNA polymerase( RNLP). In phase 1/2 of randomized human clinical trials, the mean Cmax was 9–10 mcg/ml, and the mean Tmax was 1 hour when the 600 mg dosage was taken orally. T1/2 also reached 2.25 hours after first-order kinetics of elimination. It took over eight hours for it to start working after oral administration. In fewer than 7% of experimental candidates, rare toxicity in the form of mild diarrhea and GI discomfort was found during preclinical and randomized human clinical trial stages 1/2. It demonstrated around 90% affinity to plasma proteins, particularly Albumin, which led to a lasting therapeutic effect. It demonstrated an antibiotic’s concentration-dependent killing action.
The pace and amount of antimicrobial activity in the concentration-dependent killing pattern increase with drug concentration in relation to the pathogen minimum inhibitory concentration( MIC). After the test antibiotics were refined and purified using the reverse phase HPLC technology, Myxopyronin B was the predominant component( Table 4). The 3T3 neutral red uptake phototoxicity test was used to determine the phototoxicity, and it revealed no phototoxicity. Conversely, the Ames test was used to evaluate the mutagenicity and carcinogenicity of the test antibiotic, and the results showed no genotoxicity or carcinogenicity at all.
The quantal dosage response curve for Myxopyronin B’s toxicokinetics is shown in Figure 10. It was discovered that LD50% was 300 mg/kg and LD99% was over 600 mg/kg. Using a stereomicroscope, Figure 11 depicts Myxococcus SDU36 bacterial isolates on CYP isolation plates secreting the antibiotic Myxopyronin B.
Table 3.
It shows the distribution of Myxopyronin B producing bacterial isolates:.
| No of +ve bacterial isolates producing Myxopyronin B | No of -ve bacterial isolates producing Myxopyronin B |
| 42 | 58 |
Table 4.
It demonstrates the degree of purity of test antibiotics following the purification via reversed phase HPLC technique:.
Table 4.
It demonstrates the degree of purity of test antibiotics following the purification via reversed phase HPLC technique:.
| Test antibiotic | Degree of purity( %) |
| Myxopyronin A | 15 |
| Myxopyronin B | 85 |
Table 5.
It demonstrates 16 S rRNA detection of Myxopyronin B producing isolates using BLASTn software:.
Table 5.
It demonstrates 16 S rRNA detection of Myxopyronin B producing isolates using BLASTn software:.
| Description | Scientific Name | Max Score | Total Score | Query Cover | E value | Per. ident |
| Myxococcus sp. MH1 DNA, complete genome | Myxococcus sp. MH1 | 525 | 1051 | 99% | 3.00E-144 | 94.94 |
| Myxococcus sp. SDU36 chromosome, complete genome | Myxococcus sp. SDU36 | 436 | 870 | 99% | 1.00E-117 | 90.15 |
| Myxococcus hansupus strain mixupus chromosome, complete genome | Myxococcus hansupus | 126 | 126 | 65% | 3.00E-24 | 77.23 |
| Cystobacter fuscus strain DSM 52655 chromosome, complete genome | Cystobacter fuscus | 124 | 124 | 54% | 1.00E-23 | 78.92 |
| Cystobacter fuscus strain Cbf 8 chromosome, complete genome | Cystobacter fuscus | 124 | 124 | 54% | 1.00E-23 | 78.92 |
Table 6.
It shows the estimation of zones of inhibition and minimum inhibitory concentrations of Myxopyronin B via Agar diffusion assay using paper discs:.
Table 6.
It shows the estimation of zones of inhibition and minimum inhibitory concentrations of Myxopyronin B via Agar diffusion assay using paper discs:.
 |
1 The initial density of each organism during Agar diffusion assay for the determination of minimum inhibitory concentrations and zones of inhibition of gtowth was nearly 10^5/ ml.
Table 7.
It demonstrates MICs of Myxopyronin B on different microorganisms using broth microdilution technique:.
Table 7.
It demonstrates MICs of Myxopyronin B on different microorganisms using broth microdilution technique:.
 |
Table 8.
It demonstrates Minimum bactericidal concentrations( MBCs) of Myxopyronin B on different microorganisms using broth microdilution technique:.
Table 8.
It demonstrates Minimum bactericidal concentrations( MBCs) of Myxopyronin B on different microorganisms using broth microdilution technique:.
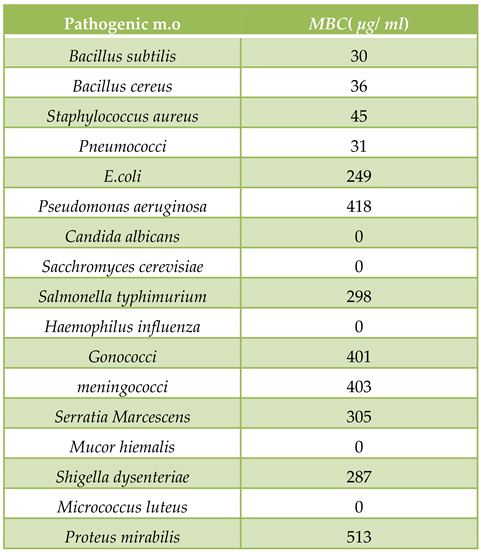 |
Table 9.
It shows the estimation of mRNA quantity via UV spectrophotometer at 260 nm after addition of Myxopyronin B:.
Table 9.
It shows the estimation of mRNA quantity via UV spectrophotometer at 260 nm after addition of Myxopyronin B:.
 |
Table 10.
It shows the effect of Myxopyronin B on the microbial protein synthesis using UV spectrophotometer at 205 nm:.
Table 10.
It shows the effect of Myxopyronin B on the microbial protein synthesis using UV spectrophotometer at 205 nm:.
| Bacterial protein concentration( mcg/ ml) | Time( min) |
| 80.2 | 60 |
| 31.56 | 180 |
| 21.08 | 300 |
| 2.85 | 450 |
| 0.03 | 720 |
Table 11.
The resolution of biochemical reactions:.
 |
Table 9 and Table 10, respectively, show that there was a substantial reduction in protein synthesis and mRNA synthesis as the dosage of Myxopyronin B was increased. Docking experiments with the MCULE and SWISS DOCK software showed that the test antibiotic’s mode of action was most likely caused by inhibiting RNA polymerase by binding to its switch region. The test antibiotic’s high ∆G was found to be around 20 J/mol using the SWISS model software. However, utilizing SWISS MODEL software, it was discovered that the test antibiotic’s low Kd near the switch area was around -290 nM. Table 11 provides a summary of the biochemical profile and morphology of the strong bacterial isolates used in this investigation to produce the test antibiotic. Myxococcus SDU36 was the most common bacterial isolate found to be secreting the extracellular test antibiotic, according to its morphology and biochemical responses. The study had 150 human volunteers in total, with a mean age of 28.1[ 8.7] years( SD). The 90% confidence intervals( CIs) for the long transformed ratios of Cmax, AUC( 0-25), and AUC( 0-∞) for the test antibiotic were, respectively, 89.2 to 95.3, 88.2 to 96.1, and 90.8 to 93.4. For Myxopyronin B, the mean protein binding( PB) was found to be around 90%. It was shown that albumin exhibited the predominant protein binding for both Rifampicin and Myxopyronin B. The therapeutic activity was discovered to be attributed to the unbound fraction. The structure of Myxopyronin B, which was isolated from bacterial isolates of Myxococcus SDU36 collected from various soil habitats in Egypt, is depicted in Figure 1. Using a mass spectrometer, the molecular formula of the purified test antibiotic was found to be C24H33NO6. The area under the curve( AUC) after oral Myxopyronin B dosing throughout phases 1/2 of clinical trials is displayed in Figure 9. The range of the effective dosage was 9–10 mg/kg of body weight. The first signs of activity( onset of action) were noted after about 28 minutes. It adhered to the kinetics of first order elimination. The location of bacterial isolates that produce Myxopyronin B is displayed in Table 3. The resolution of biological reactions is shown in Table 11. Table 10 uses a UV spectrophotometer set at 205 nm to illustrate how Myxopyronin B affects the synthesis of microbial proteins. Table 8 uses the broth microdilution technique to show the minimum bactericidal concentrations( MBCs) of Myxopyronin B on various bacteria. The estimation of Myxopyronin B’s impact on microbial mRNA productivity is shown in Figure 6. An increase in the dosage of the antibiotic Myxopyronin B was found to cause a commensurate decrease in mRNA production. Following the administration of Myxopyronin B, Table 9 displays the estimation of mRNA quantity using a UV spectrophotometer at 260 nm. Table 7 shows the broth microdilution technique’s minimum inhibitory concentrations( MICs) for several bacteria. Table 6 illustrates how the Agar diffusion assay, which uses paper discs, was used to estimate the zones of inhibition and lowest inhibitory doses of Myxopyronin B. Table 5 shows how to use BLASTn software to detect isolates that produce Myxopyronin B using 16S rRNA. The range of bacterial isolates that produce Myxopyronin B is displayed in Table 3. Using a stereomicroscope, Figure 11 depicts Myxococcus SDU36 bacterial isolates on CYP isolation plates secreting the antibiotic Myxopyronin B. The quantal dosage response curve for Myxopyronin B’s toxicokinetics is shown in Figure 10. It was discovered that LD50% was 300 mg/kg and LD99% was over 600 mg/kg. The structure of Myxopyronin B, which was isolated from bacterial isolates of Myxococcus SDU36 collected from various soil conditions in Egypt, is depicted in Figure 1.
Using a mass spectrometer, the molecular formula of the purified test antibiotic was found to be C24H33NO6. The area under the curve( AUC) after oral Myxopyronin B dosing during phases 1/2 of clinical trials is shown in Figure 9. The range of the effective dose was 9–10 mg/kg of body weight. The onset of actions were noted after almost 28 minutes. It adhered to the kinetics of first order elimination. The AUC of Myxopyronin B after SC injection in phases 1/2 of clinical trials is displayed in Figure 8. The range of effective doses was 7-8 mg/kg of body weight. The beginning of the action was noted after a close 15 minutes. It adhered to the kinetics of first order elimination. Figure 4 illustrates how different soluble starch concentrations affect the synthesis of Myxopyronin B. Figure 7 uses the UV spectrophotometer absorption at 205 nm to illustrate how Myxopyronin B affects protein production. A significant reduction in protein synthesis was seen upon administration of escalating dosages of the antibiotic Myxopyronin B. The 3D structure of bacterial prokaryotic RNA polymerase is shown in Figure 3. It includes the switch binding site, to which Myxopyronin B Ligand binds strongly and inhibits bacterial RNA polymerase activity selectively, thereby inhibiting mRNA transcription and ultimately causing the microbe to die. Alpha and Beta spiral sheets made up the RNA polymerase enzyme’s secondary structure. It had a molecular mass of about 198 amino acids. The docking of the Myxopyronin B ligand on Bacterial RNA polymerase is shown in Figure 2. High affinity and an inhibitory action were demonstrated by Myxopyronin B towards the switch region.
Discuss
The in vitro and in vivo antimicrobial activity of Myxopyronin B, a novel antibiotic was evaluated in the present study. It demonstrated excellent bactericidal activity against a broad spectrum of G +ve bacteria with MICs did not exceed 20 mcg/ ml. On the other hand It showed few bactericidal activities against G -ve bacteria.with minimal inhibitory concentrations were greater than 100 mcg/ ml. Its mechanism of action was realized during the investigation of RNA synthesis to be via the inhibition of prokaryotic DNA-dependant-RNA polymerase; whereas no inhibitory impact was observed for Eukaryotic one. Docking studies through SWISS DOCK software confirmed this as well. The antibiotic activities Myxopyronin A and B were isolated from the culture supernatant of 29 bacterial isolates of Myxobacterium Myxococcus SDU36 detected molecularly using 16 S rRNA technique( Table 3).
The antibiotic activity did not inhibit the growth or kill eukaryotic cells such as human and fungal cells reflecting selectivity towards the inhibition of the growth of prokaryotic bacterial cells. This selectivity effect minimized the adverse effects noticed during the present study. Docking studies via SWISS DOCK software revealed that desmethylation of either Myxopyronin A or B enhanced its biological activity. Purification was performed through reversed phase HPLC. Myxopyronin B was the main refined antibiotic. Its purity degree reached approximately 85 %; while, the remaining purified antibiotic was detected to be Myxopyronin A. The antibacterial activity was assessed via the determination of MICs of the test antibiotics using the agar diffusion technique utilizing paper discs 5 mm in diameter and the broth dilution assay. The initial density of each test microorganism was about 105/ ml of the culture suspension. The mean MICs of test antibiotic against G +ve bacteria ranged from 5 to 20 mcg/ ml; Whereas MICs reached above 100 mcg/ ml against some selected G -ve bacteria. On the other hand no effect was detected against the growth of fungi and yeasts. ( Irschik H et al., 1983) stated that myxovalargin A was a novel peptide antibiotic isolated from the culture supernatant of the myxobacterium Myxococcus fulvus strain Mx f65. It was active against Gram-positive bacteria( MIC 0.3 approximately 5 micrograms/ ml), at higher concentrations also against Gram-negative ones( MIC 6 approximately 100 micrograms/ ml), and not at all against yeasts and molds. Its mechanism of action involved the inhibition of the bacterial protein synthesis.[50] According to( Glaus F et al., 2018) Ripostatin, a novel antibiotic, isolated from the culture supernatant of Myxobacterium, Sorangium cellulosum strain So ce377. On the other hand it interfered of the bacterial RNA synthesis.[51] On the other hand, Myxopyronin A was found to be structurally related to α-pyrone antibiotics from myxobacteria. Its ability to inhibit RNA polymerase was through interaction with the switch region of RNA polymerase; while Rifampicin inhibited the same enzyme through different region.[52] Myxopyronin showed no phototoxicity and mutagenicity in rabbit animal models during the preclinical trials stage, in the present study. Rare adverse effects including mild diarrhea and cholestatic jaundice were reported in less than 5 % of the experimental subjects received the test antibiotics during randomized human clinical trials phases 1/2. The biological half life of Myxopyronin A reached approximately 2.5 hours. 0.6 % peptone and 8 % soluble starch were detected to be the optimal nitrogen and carbon growth factors for bacterial isolates producing the test antibiotics, respectively( Figure 4 and Figure 5). High ∆G of the test antibiotic was observed to be approximately 20 J/ mole as determined via SWISS MODEL software reflecting high catalytic activity of the test antibiotic towards the switch region. On the other hand, low Kd of the test antibiotic towards the switch region was found to be approximately -290 nM using SWISS MODEL software indicating high affinity and binding capacity. Bioavailability studies were performed using HPLC during randomized human clinical trials phases 1/2 revealed that Myxopyronin B reached nearly 90% oral bioavailability, 92% IM bioavailability and 100% IV bioavailability. Metabolic studies using HPLC revealed that the test antibiotic showed no in vivo induction of hepatic metabolizing Cytochrome P450 enzymatic system; while rifampicin induced CYP3A4 hepatic metabolizing enzyme potently. Up and down procedure intended for the evaluation of acute toxicity profile of the test antibiotic showed that LD50% was about 200 mg/ kg body weight; while LD99% reached 300 mg/ kg. On the other hand, therapeutic margin of the test antibiotic ranged from 7 mcg/ ml to 100 mcg/ ml. Myxopyronin A producing bacterial isolates were gram negative, spore forming obligate aerobes and chemoorganotrophic. They were elongated rods with tapered ends. No flagella were present; but the cells moved via gliding. They fermented Tween 80, starch and casein. On the other hand they were positive for catalase while negative for oxidase tests. They reduced nitrates
And were able to grow at 10-37 ℃. A total of 150 human subjects( mean SD age, 27.3[ 9.8] years were enrolled and completed the study. The 90% confidence intervals( CIs) for the long transformed ratios of Cmax, AUC( 0-25), and AUC( 0-∞) for the test antibiotic were, respectively, 89.2 to 95.3, 88.2 to 96.1, and 90.8 to 93.4. The point estimates for Cmax in the present study were outside the limit for bio-equivalence for rifampicin standard drug. The mean PB was observed for Myxopyronin B which approximated 90% while that of Rifampicin reached 88%.[53] It was noticed that plasma protein binding was proportionally increased with increasing the doses of the test antibiotic. The plasma protein binding participated in extending the Myxopyronin B duration of action. The major protein binding for Myxopyronin B and Rifampicin was noticed to be albumin. The unbound fraction was detected to be responsible for the therapeutic activity.
Conclusion
Antibiotic resistance is a global challenge that the current study shows promise in solving. According to the findings of the current study, Myxopyronin B, which was isolated from the bacterial isolates ∆G was found to be roughly 20 J/mol using the SWISS MODEL software. However, utilizing SWISS MODEL software, it was discovered that the test antibiotic’s low Kd near the switch area was roughly -290 nM. that were collected from various soil environments in Egypt, exhibited significant antibiotic activity both in vitro and in vivo against a moderate range of pathogenic bacteria, particularly G+ve varieties. Future research is recommended to investigate pharmacological interactions of the synergism type between Myxopyronin A and different antibiotic classes.
Funding
There was no funding.
Consent to participate
Not applicable
Consent for publication
The author gives the publisher to publish the present study.
Consent of ethics
Prioritized in the current study were all pertinent institutional, national, and/or international standards concerning the use and care of humans and animals. All study protocols involving humans and animals were authorized by the Ethical Committee for Human and Animal Handling at Cairo University( ECAHCU), located at the Faculty of Pharmacy, Cairo University, Egypt, by the Weatherall Report’s recommendations (approval number T-10-5-2023). At all costs, the study’s human and animal subjects’ numbers and suffering were kept to a minimum. Phases 1/2 registration number for the randomized human clinical trials was NCT00000806/ 2023.
Data availability
The data used in the present study are available within the manuscript.
Competing interest
There are no competing interests.
References
- Dalhoff A. Selective toxicity of antibacterial agents-still a valid concept or do we miss chances and ignore risks? Infection. 2021 Feb;49(1):29-56. Epub 2020 Dec 23. [CrossRef] [PubMed] [PubMed Central]
- Hutchings MI, Truman AW, Wilkinson B. Antibiotics: past, present and future. Curr Opin Microbiol. 2019 Oct;51:72-80. Epub 2019 Nov 13. [CrossRef] [PubMed]
- Wencewicz TA. Crossroads of Antibiotic Resistance and Biosynthesis. J Mol Biol. 2019 Aug 23;431(18):3370-3399. Epub 2019 Jul 6. [CrossRef] [PubMed] [PubMed Central]
- Lepe JA, Martínez-Martínez L. Resistance mechanisms in Gram-negative bacteria. Med Intensiva (Engl Ed). 2022 Jul;46(7):392-402. Epub 2022 May 31. [CrossRef] [PubMed]
- Vila J, Marco F. Lectura interpretada del antibiograma de bacilos gramnegativos no fermentadores [Interpretive reading of the non-fermenting gram-negative bacilli antibiogram]. Enferm Infecc Microbiol Clin. 2010 Dec;28(10):726-36. Spanish. Epub 2010 Jun 26. [CrossRef] [PubMed]
- Mushtaq S, Vickers A, Woodford N, Livermore DM. WCK 4234, a novel diazabicyclooctane potentiating carbapenems against Enterobacteriaceae, Pseudomonas and Acinetobacter with class A, C and D β-lactamases. J Antimicrob Chemother. 2017 Jun 1;72(6):1688-1695. [CrossRef] [PubMed]
- Irwin SV, Fisher P, Graham E, Malek A, Robidoux A. Sulfites inhibit the growth of four species of beneficial gut bacteria at concentrations regarded as safe for food. PLoS One. 2017 Oct 18;12(10):e0186629. [CrossRef] [PubMed] [PubMed Central]
- Jeong S, Lee Y, Yun CH, Park OJ, Han SH. Propionate, together with triple antibiotics, inhibits the growth of Enterococci. J Microbiol. 2019 Nov;57(11):1019-1024. Epub 2019 Oct 28. [CrossRef] [PubMed]
- Kohanski MA, Dwyer DJ, Hayete B, Lawrence CA, Collins JJ. A common mechanism of cellular death induced by bactericidal antibiotics. Cell. 2007 Sep 7;130(5):797-810. [CrossRef] [PubMed]
- Brauer M, Herrmann J, Zühlke D, Müller R, Riedel K, Sievers S. Myxopyronin B inhibits growth of a Fidaxomicin-resistant Clostridioides difficile isolate and interferes with toxin synthesis. Gut Pathog. 2022 Jan 6;14(1):4. [CrossRef] [PubMed] [PubMed Central]
- Doundoulakis T, Xiang AX, Lira R, Agrios KA, Webber SE, Sisson W, Aust RM, Shah AM, Showalter RE, Appleman JR, Simonsen KB. Myxopyronin B analogs as inhibitors of RNA polymerase, synthesis and biological evaluation. Bioorg Med Chem Lett. 2004 Nov 15;14(22):5667-72. [CrossRef] [PubMed]
- Lira R, Xiang AX, Doundoulakis T, Biller WT, Agrios KA, Simonsen KB, Webber SE, Sisson W, Aust RM, Shah AM, Showalter RE, Banh VN, Steffy KR, Appleman JR. Syntheses of novel myxopyronin B analogs as potential inhibitors of bacterial RNA polymerase. Bioorg Med Chem Lett. 2007 Dec 15;17(24):6797-800. Epub 2007 Oct 17. [CrossRef] [PubMed]
- Moy TI, Daniel A, Hardy C, Jackson A, Rehrauer O, Hwang YS, Zou D, Nguyen K, Silverman JA, Li Q, Murphy C. Evaluating the activity of the RNA polymerase inhibitor myxopyronin B against Staphylococcus aureus. FEMS Microbiol Lett. 2011 Jun;319(2):176-9. Epub 2011 Apr 20. [CrossRef] [PubMed]
- Srivastava A, Talaue M, Liu S, Degen D, Ebright RY, Sineva E, Chakraborty A, Druzhinin SY, Chatterjee S, Mukhopadhyay J, Ebright YW, Zozula A, Shen J, Sengupta S, Niedfeldt RR, Xin C, Kaneko T, Irschik H, Jansen R, Donadio S, Connell N, Ebright RH. New target for inhibition of bacterial RNA polymerase: ‘switch region’. Curr Opin Microbiol. 2011 Oct;14(5):532-43. Epub 2011 Aug 19. [CrossRef] [PubMed] [PubMed Central]
- Mosaei H, Harbottle J. Mechanisms of antibiotics inhibiting bacterial RNA polymerase. Biochem Soc Trans. 2019 Feb 28;47(1):339-350. Epub 2019 Jan 15. [CrossRef] [PubMed]
- Sucipto H, Sahner JH, Prusov E, Wenzel SC, Hartmann RW, Koehnke J, Müller R. In vitro reconstitution of α-pyrone ring formation in myxopyronin biosynthesis. Chem Sci. 2015 Aug 1;6(8):5076-5085. Epub 2015 May 18. [CrossRef] [PubMed] [PubMed Central]
- O’Toole GA. Classic Spotlight: How the Gram Stain Works. J Bacteriol. 2016 Nov 4;198(23):3128. [CrossRef] [PubMed] [PubMed Central]
- Luhur J, Chan H, Kachappilly B, Mohamed A, Morlot C, Awad M, Lyras D, Taib N, Gribaldo S, Rudner DZ, Rodrigues CDA. A dynamic, ring-forming MucB / RseB-like protein influences spore shape in Bacillus subtilis. PLoS Genet. 2020 Dec 14;16(12):e1009246. [CrossRef] [PubMed] [PubMed Central]
- Qin Y, Faheem A, Hu Y. A spore-based portable kit for on-site detection of fluoride ions. J Hazard Mater. 2021 Oct 5;419:126467. Epub 2021 Jun 24. [CrossRef] [PubMed]
- Cabeen MT, Jacobs-Wagner C. Bacterial cell shape. Nat Rev Microbiol. 2005 Aug;3(8):601-10. [CrossRef] [PubMed]
- Wang Q, Xiao L, He Q, Liu S, Zhang J, Li Y, Zhang Z, Nie F, Guo Y, Zhang L. Comparison of haemolytic activity of tentacle-only extract from jellyfish Cyanea capillata in diluted whole blood and erythrocyte suspension: diluted whole blood is a valid test system for haemolysis study. Exp Toxicol Pathol. 2012 Nov;64(7-8):831-5. Epub 2011 Apr 6. [CrossRef] [PubMed]
- Dubay MM, Acres J, Riekeles M, Nadeau JL. Recent advances in experimental design and data analysis to characterize prokaryotic motility. J Microbiol Methods. 2023 Jan;204:106658. Epub 2022 Dec 15. [CrossRef] [PubMed]
- Wang C, Zhang Y, Luo H, Zhang H, Li W, Zhang WX, Yang J. Iron-Based Nanocatalysts for Electrochemical Nitrate Reduction. Small Methods. 2022 Oct;6(10):e2200790. Epub 2022 Sep 14. [CrossRef] [PubMed]
- Hu CY, Cheng HY, Yao XM, Li LZ, Liu HW, Guo WQ, Yan LS, Fu JL. Biodegradation and decolourization of methyl red by Aspergillus versicolor LH1. Prep Biochem Biotechnol. 2021;51(7):642-649. Epub 2020 Nov 23. [CrossRef] [PubMed]
- Xu D, Wu L, Yao H, Zhao L. Catalase-Like Nanozymes: Classification, Catalytic Mechanisms, and Their Applications. Small. 2022 Sep;18(37):e2203400. Epub 2022 Aug 15. [CrossRef] [PubMed]
- Pawlik A, Stefanek S, Janusz G. Properties, Physiological Functions and Involvement of Basidiomycetous Alcohol Oxidase in Wood Degradation. Int J Mol Sci. 2022 Nov 9;23(22):13808. [CrossRef] [PubMed] [PubMed Central]
- Cordaro JT, Sellers W. Blood coagulation test for citrate utilization. Appl Microbiol. 1968 Jan;16(1):168-9. [CrossRef] [PubMed] [PubMed Central]
- Krajang M, Malairuang K, Sukna J, Rattanapradit K, Chamsart S. Single-step ethanol production from raw cassava starch using a combination of raw starch hydrolysis and fermentation, scale-up from 5-L laboratory and 200-L pilot plant to 3000-L industrial fermenters. Biotechnol Biofuels. 2021 Mar 16;14(1):68. [CrossRef] [PubMed] [PubMed Central]
- Kerwin BA. Polysorbates 20 and 80 used in the formulation of protein biotherapeutics: structure and degradation pathways. J Pharm Sci. 2008 Aug;97(8):2924-35. [CrossRef] [PubMed]
- Trueba FJ, Neijssel OM, Woldringh CL. Generality of the growth kinetics of the average individual cell in different bacterial populations. J Bacteriol. 1982 Jun;150(3):1048-55. [CrossRef] [PubMed] [PubMed Central]
- McCrea KW, Xie J, LaCross N, Patel M, Mukundan D, Murphy TF, Marrs CF, Gilsdorf JR. Relationships of nontypeable Haemophilus influenzae strains to hemolytic and nonhemolytic Haemophilus haemolyticus strains. J Clin Microbiol. 2008 Feb;46(2):406-16. Epub 2007 Nov 26. [CrossRef] [PubMed] [PubMed Central]
- Jogawat A, Vadassery J, Verma N, Oelmüller R, Dua M, Nevo E, Johri AK. PiHOG1, a stress regulator MAP kinase from the root endophyte fungus Piriformospora indica, confers salinity stress tolerance in rice plants. Sci Rep. 2016 Nov 16;6:36765. [CrossRef] [PubMed] [PubMed Central]
- Barry AL, Feeney KL. Two quick methods for Voges-Proskauer test. Appl Microbiol. 1967 Sep;15(5):1138-41. [CrossRef] [PubMed] [PubMed Central]
- Wang J, Su Y, Jia F, Jin H. Characterization of casein hydrolysates derived from enzymatic hydrolysis. Chem Cent J. 2013 Apr 4;7(1):62. [CrossRef] [PubMed] [PubMed Central]
- Bie TH, Witkamp RF, Balvers MG, Jongsma MA. Effects of γ-aminobutyric acid supplementation on glucose control in adults with prediabetes: A double-blind, randomized, placebo-controlled trial. Am J Clin Nutr. 2023 Sep;118(3):708-719. Epub 2023 Jul 24. [CrossRef] [PubMed]
- Endoh R, Horiyama M, Ohkuma M. D-Fructose Assimilation and Fermentation by Yeasts Belonging to Saccharomycetes: Rediscovery of Universal Phenotypes and Elucidation of Fructophilic Behaviors in Ambrosiozyma platypodis and Cyberlindnera americana. Microorganisms. 2021 Apr 5;9(4):758. [CrossRef] [PubMed] [PubMed Central]
- Lu Z, Guo W, Liu C. Isolation, identification and characterization of novel Bacillus subtilis. J Vet Med Sci. 2018 Mar 24;80(3):427-433. Epub 2018 Jan 23. [CrossRef] [PubMed] [PubMed Central]
- Zhao Y, Meng K, Fu J, Xu S, Cai G, Meng G, Nielsen J, Liu Z, Zhang Y. Protein engineering of invertase for enhancing yeast dough fermentation under high-sucrose conditions. Folia Microbiol (Praha). 2023 Apr;68(2):207-217. Epub 2022 Oct 6. [CrossRef] [PubMed]
- Irschik H, Gerth K, Höfle G, Kohl W, Reichenbach H. The myxopyronins, new inhibitors of bacterial RNA synthesis from Myxococcus fulvus (Myxobacterales). J Antibiot (Tokyo). 1983 Dec;36(12):1651-8. [CrossRef] [PubMed]
- Wiegand I, Hilpert K, Hancock RE. Agar and broth dilution methods to determine the minimal inhibitory concentration (MIC) of antimicrobial substances. Nat Protoc. 2008;3(2):163-75. [CrossRef] [PubMed]
- Balouiri M, Sadiki M, Ibnsouda SK. Methods for in vitro evaluating antimicrobial activity: A review. J Pharm Anal. 2016 Apr;6(2):71-79. Epub 2015 Dec 2. [CrossRef] [PubMed] [PubMed Central]
- Dell’Anno A, Fabiano M, Duineveld GCA, Kok A, Danovaro R. Nucleic acid (DNA, RNA) quantification and RNA/DNA ratio determination in marine sediments: comparison of spectrophotometric, fluorometric, and HighPerformance liquid chromatography methods and estimation of detrital DNA. Appl Environ Microbiol. 1998 Sep;64(9):3238-45. [CrossRef] [PubMed] [PubMed Central]
- Simonian MH. Spectrophotometric determination of protein concentration. Curr Protoc Cell Biol. 2002 Aug;Appendix 3:Appendix 3B. [CrossRef] [PubMed]
- Rox K, Becker T, Schiefer A, Grosse M, Ehrens A, Jansen R, Aden T, Kehraus S, König GM, Krome AK, Hübner MP, Wagner KG, Stadler M, Pfarr K, Hoerauf A. Pharmacokinetics and Pharmacodynamics (PK/PD) of Corallopyronin A against Methicillin-Resistant Staphylococcus aureus. Pharmaceutics. 2022 Dec 30;15(1):131. [CrossRef] [PubMed] [PubMed Central]
- Xu J, Jin H, Zhu H, Zheng M, Wang B, Liu C, Chen M, Zhou L, Zhao W, Fu L, Lu Y. Oral bioavailability of rifampicin, isoniazid, ethambutol, and pyrazinamide in a 4-drug fixed-dose combination compared with the separate formulations in healthy Chinese male volunteers. Clin Ther. 2013 Feb;35(2):161-8. [CrossRef] [PubMed]
- Utku Türk EG, Jannuzzi AT, Alpertunga B. Determination of the Phototoxicity Potential of Commercially Available Tattoo Inks Using the 3T3-neutral Red Uptake Phototoxicity Test. Turk J Pharm Sci. 2022 Feb 28;19(1):70-75. [CrossRef] [PubMed] [PubMed Central]
- Thomas DN, Wills JW, Tracey H, Baldwin SJ, Burman M, Williams AN, Harte DSG, Buckley RA, Lynch AM. Ames Test study designs for nitrosamine mutagenicity testing: qualitative and quantitative analysis of key assay parameters. Mutagenesis. 2023 Dec 19:gead033. Epub ahead of print. [CrossRef] [PubMed]
- Zhang, YY., Huang, YF., Liang, J. et al. Improved up-and-down procedure for acute toxicity measurement with reliable LD50 verified by typical toxic alkaloids and modified Karber method. BMC Pharmacol Toxicol 23, 3 (2022). [CrossRef]
- Heuser E, Becker K, Idelevich EA. Bactericidal Activity of Sodium Bituminosulfonate against Staphylococcus aureus. Antibiotics (Basel). 2022 Jul 5;11(7):896. [CrossRef] [PubMed] [PubMed Central]
- Irschik H, Gerth K, Kemmer T, Steinmetz H, Reichenbach H. The myxovalargins, new peptide antibiotics from Myxococcus fulvus (Myxobacterales). I. Cultivation, isolation, and some chemical and biological properties. J Antibiot (Tokyo). 1983 Jan;36(1):6-12. [CrossRef] [PubMed]
- Glaus F, Dedić D, Tare P, Nagaraja V, Rodrigues L, Aínsa JA, Kunze J, Schneider G, Hartkoorn RC, Cole ST, Altmann KH. Total Synthesis of Ripostatin B and Structure-Activity Relationship Studies on Ripostatin Analogs. J Org Chem. 2018 Jul 6;83(13):7150-7172. Epub 2018 Mar 29. [CrossRef] [PubMed]
- Dennison TJ, Smith JC, Badhan RKS, Mohammed AR. Formulation and Bioequivalence Testing of Fixed-Dose Combination Orally Disintegrating Tablets for the Treatment of Tuberculosis in the Paediatric Population. J Pharm Sci. 2020 Oct;109(10):3105-3113. Epub 2020 Jul 22. [CrossRef] [PubMed]
- Alghamdi WA, Al-Shaer MH, Peloquin CA. Protein Binding of First-Line Antituberculosis Drugs. Antimicrob Agents Chemother. 2018 Jun 26;62(7):e00641-18. [CrossRef] [PubMed] [PubMed Central]
Figure 10.
Quantal dose response curve for the determination of toxicokinetics of Myxopyronin B. LD50 % was found to be 300 mg / kg; while LD99 % was nearly 600 mg/ kg.
Figure 10.
Quantal dose response curve for the determination of toxicokinetics of Myxopyronin B. LD50 % was found to be 300 mg / kg; while LD99 % was nearly 600 mg/ kg.
Figure 11.
It shows Myxococcus SDU36 bacterial isolates on CYP isolation plates secreting Myxopyronin B antibiotic using Stereomicroscope.
Figure 11.
It shows Myxococcus SDU36 bacterial isolates on CYP isolation plates secreting Myxopyronin B antibiotic using Stereomicroscope.

Table 2.
It demonstrates different isolation media for different pathogenic m.os. utilized in the Broth microdilution test and agar diffusion assay using paper discs:.
Table 2.
It demonstrates different isolation media for different pathogenic m.os. utilized in the Broth microdilution test and agar diffusion assay using paper discs:.
| Pathogenic m.o | No of strains | Isolation media |
| Bacillus subtilis | 5 | Mannitol egg yolk polymixin agar( MEYP) |
| Bacillus cereus | 7 | Polymixin egg yolk mannitol bromothymol blue agar( PEMBA) |
| Staphylococcus aureus | 6 | Salt mannitol agar( SMA) |
| Pneumococci | 13 | Todd Hewitt broth with yeast extract |
| coli | 17 | Sorbitol- Macconkey agar |
| Pseudomonas aeruginosa | 10 | Pseudomonas isolation agar( PSA) |
| Candida albicans | 1 | Potato dextrose agar( PDA) |
| Sacchromyces cerevisiae | 5 | Sabourad dextrose agar( SDA) |
| Salmonella typhimurium | 4 | Bismuth sulfite agar( BSA) |
| Haemophilus influenza | 3 | Enriched chocolate agar |
| Gonococci | 4 | Thayer martin medium |
| meningococci | 6 | Mueller Hinton agar |
| Serratia Marcescens | 4 | Caprylate thallous agar medium |
| Mucor hiemalis | 1 | Potato dextrose broth |
| Shigella dysenteriae | 8 | Hekteon enteric agar |
| Micrococcus luteus | 1 | Tryptic soy agar |
| Proteus mirabilis | 1 | Blood agar |
Disclaimer/Publisher’s Note: The statements, opinions and data contained in all publications are solely those of the individual author(s) and contributor(s) and not of MDPI and/or the editor(s). MDPI and/or the editor(s) disclaim responsibility for any injury to people or property resulting from any ideas, methods, instructions or products referred to in the content. |
© 2024 by the authors. Licensee MDPI, Basel, Switzerland. This article is an open access article distributed under the terms and conditions of the Creative Commons Attribution (CC BY) license (http://creativecommons.org/licenses/by/4.0/).
Copyright: This open access article is published under a Creative Commons CC BY 4.0 license, which permit the free download, distribution, and reuse, provided that the author and preprint are cited in any reuse.


