Submitted:
05 May 2024
Posted:
06 May 2024
You are already at the latest version
Abstract
The goal of this research is to determine the optimal microwave-assisted sol-gel synthesis pa-rameters of TiO2 nanoparticles with the achievement of the crystalline TiO2 nanoparticles with the highest specific surface area and the lowest energy band gap. Titanium isopropoxide was used as a precursor to prepare the sol (colloidal solution) of TiO2, isopropanol as a solvent, acetylacetone for complexation, and nitric acid as a catalyst. Four samples of titanium dioxide were synthesized from the prepared colloidal solution in a microwave reactor at a temperature of 150 °C for 30 minutes and at a temperature of 200 °C for 10, 20, and 30 minutes. The phase composition of the prepared samples was determined by X-ray diffraction analysis (XRD) and Fourier-transform infrared spectroscopy (FTIR). Nitrogen adsorption/desorption isotherms were used to determine the spe-cific surface area and pore size distributions by Brunauer-Emmett-Teller (BET) method. The band gap energy values of the TiO2 samples were determined by diffuse reflectance spectroscopy (DRS). CrystallineTiO2 nanoparticles with the highest specific surface area and the lowest energy band gap were obtained for the TiO2 sample synthesized at 200 °C for 10 minutes.
Keywords:
titanium dioxide
; microwave-assisted synthesis
; characterization
1. Introduction
Titanium dioxide (TiO2) is a non-toxic, biocompatible, and inexpensive material with a very high dielectric constant and chemical stability. It most commonly occurs in nature in the form of anatase and rutile and rarely as brookite [1,2]. TiO2 is a semiconductor with a band gap energy ranging from 3.0 eV (as rutile) to 3.2 eV (as anatase). TiO2 is used in many different fields, such as the cosmetic industry, paper industry, paint, and varnish industry [3], as photocatalysts for the removal of pollutants [4,5,6], in optical devices [7], sensors [8,9], solar cell production [10], etc.
Different methods exist for synthesizing TiO2, such as the sol-gel method [6,11], hydrothermal method [12], solvothermal method [13], and recently appeared microwave-assisted synthesis method [14,15,16].
The sol-gel synthesis is a universal process for producing various new materials, covering a broad and interdisciplinary research area ranging from nano to macro dimensions. In the typical sol-gel process, a colloidal suspension or sol is formed by the hydrolysis of precursors and their polymerization. Obtaining TiO2 by the sol-gel method involves the chemical conversion of titanium salts or solutions of organotitanium substances into monomeric titanium hydroxide (Ti(OH)4) and its subsequent polycondensation to form colloidal particles. Unlike other methods, sol-gel method allows for control over the structure and morphology of TiO2 particles, optimization of energy costs, and the use of simple and affordable technological equipment. But, to achieve TiO2 nanoparticles, the obtained gel must be heated in a kiln at high temperatures for a few hours, significantly increasing production costs [17,18].
Microwave-assisted synthesis is a unique and straightforward technique that offers rapid and efficient material processing with greater renewability. Microwave radiation is electromagnetic radiation in the frequency range from 0.3 GHz to 300 GHz, corresponding to wavelengths from 1 mm to 1 m [19]. Microwaves can be used for nanomaterial synthesis, solid-state chemistry, nanotechnology, and organic synthesis [20]. Organic reactions can be accelerated, and the selectivity of the resulting products can be enhanced by choosing appropriate microwave parameters. Microwave-assisted synthesis offers several advantages over conventional heating, such as instantaneous and rapid heating (deep internal heating), high-temperature homogeneity, and selective heating [21].
Compared to the other synthesis methods, microwave-assisted synthesis is based on the interaction of microwaves with the material at the molecular level. Specifically, molecular dipoles absorb microwaves and convert their energy into heat, resulting in heat generation within the material or suspension. The temperature gradient in microwave synthesis is opposite to that in conventional heating, i.e., it is a so-called core heating rather than heating from the outside [22]. Heat transfer by microwaves depends on the specific loss factor characteristic for each solvent. The higher this value, the better the solvent will absorb microwaves. During synthesis, a large amount of energy is released, enabling rapid heating rates, high yields, and precise heating control, ultimately ensuring early phase formation and uniform particle size distribution. The shortened synthesis time also prevents overheating phenomena. In a closed reactor, under the influence of microwaves, solvents can be heated to a temperature higher than the (atmospheric) boiling temperature without boiling [15].
Microwave dielectric heating relies on the ability of a material (such as a solvent or reagent) to absorb microwave energy and convert it into heat. Heating mechanisms by microwave energy consist of heating with the electric and magnetic fields, which are controlled by different mechanisms. There are two main mechanisms for electric field heating: dipolar polarization and ionic conductivity, while the combination of these two mechanisms is interfacial polarization. Dipolar polarization is a mechanism involving the rotation of polar molecules that align with the electric field of microwaves, where heat and friction are generated due to the continuous alignment of polar molecules while the electric field regularly oscillates. As for ionic conductivity, an electric current is generated by the oscillation of ions back and forth due to the electric force of the microwaves. This produced current encounters with internal resistance, leading to collisions between charged molecules and their neighbouring molecules, resulting in material heating [23].
Traditionally, organic synthesis is conducted using conductive heating with an external heat source (e.g., oil bath or heating mantle). Besides being relatively slow, this method is inefficient for energy transfer in the system because it relies on convection currents and the thermal conductivity of different materials through which heat must pass to reach the reaction mixture. Consequently, the reaction vessel has a higher temperature than the reaction mixture. On the other hand, microwave (MW) irradiation produces efficient internal heating (volumetric heating in the core) by directly coupling MW energy with molecules (solvents, reagents, catalysts) present in the reaction mixture. For MW heating, reaction vessels made of materials that are (almost) microwave-transparent are used to allow radiation to pass through their walls. Materials used for this purpose include borosilicate glass, quartz, or Teflon. This (near) microwave passage results in a reversed temperature gradient compared to conventional heating. If the microwave cavity is well designed, the temperature rise will be uniform throughout the sample [19].
This research aims to prepare titanium dioxide particles using the sol-gel method and microwave-assisted synthesis at different exposure times to MW radiation and at different temperatures. The properties of the prepared material were investigated using various techniques and equipment.
2. Results and Discussion
2.1. Characterization of Prepared TiO2 Photocatalyst
The FTIR spectrum of the obtained TiO2 (Figure 1) displays characteristic bands for Ti-O vibrations, and Ti-O-Ti stretches in the range of approximately 400 to 100 cm–1. At around 1500 cm-1, Ti-OH vibrational stretches are observed, as well as -OH asymmetric and symmetric vibrational stretches at approximately 3400 cm–1. These -OH stretches may originate from adsorbed water. The obtained results are consistent with the literature [10,24,25].
The diffractograms of the prepared TiO2 photocatalyst shown in Figure 2 indicate that the temperature and processing time influence the crystalline phases present in the samples. Thus, the sample processed at 150 °C shows no pronounced diffraction peaks, while samples processed at 200 °C indicate the presence of the TiO2 anatase phase (ICDD PDF#21-1272). Among samples treated at 200 °C for different durations, no drastic change in intensities was observed. Still, it can be noted that the intensities of samples treated for 30 minutes, compared to those treated for 20 and 10 minutes, exhibit slightly more intense and narrower diffraction peaks, suggesting an increase in the crystallite size within the sample.
Diffuse reflectance spectroscopy (Figure 3) indicated that an increase in processing temperature from 150 °C to 200 °C results in a shift of reflection towards shorter wavelengths (from approximately 400 to 350 nm) and, consequently, an increase in the band gap energy from 2.78 eV to 3.0 eV, indicating an indirect transition. The obtained values are in good agreement with literature data for TiO2 rutile, suggesting the presence of defects within the sample causing the shift in the band gap energy (3.2 eV for anatase) [26]. The best option to verify this assumption is to use the advanced analysis methods such as XPS (x-ray photoelectron spectroscopy).
According to the new IUPAC classification [27], the nitrogen adsorption/desorption isotherms (Figure 4) of all TiO2 samples synthesized at 200 °C correspond to type IV(a), while the isotherm obtained for the sample synthesized at 150 °C corresponds to type I(b). The hysteresis obtained in the case of a type IV(a) isotherm indicate the presence of capillary condensation, which occurs when the pore width exceeds a certain critical width, usually around 4 nm in the case of nitrogen adsorption in cylindrical pores at 77 K. [28,29,30,31]. Type I(b) isotherms are found in materials that exhibit a certain range of wider micropores and possibly narrow mesopores (smaller than 2.5 nm), which is consistent with the pore size distribution obtained for the sample synthesized at 150 °C (Figure 5a). From the results shown in Table 1, it can be concluded that the average pore diameter of TiO2 samples is between 2.0 and 9.1 nm, indicating that the prepared TiO2 samples have a mesoporous structure with a certain amount of micropores obtained in the sample synthesized at 150 °C. This resulted in a higher specific surface area and smaller pore diameter of TiO2 at a lower synthesis temperature. For samples synthesized at 200 °C, increasing the synthesis time leads to a decrease in the specific surface area (Figure 5).
3. Materials and Methods
3.1. Preparation of TiO2 Nanoparticles
TiO2 nanoparticles were prepared using the microwave assisted sol-gel method. TiO2 sol (colloidal solution) was prepared by mixing the following analytical grade reagents: titanium(IV) isopropoxide (TIP, Ti(OCH(CH3)2)4, 98%, Sigma–Aldrich, St. Louis, MO, USA) as the precursor, i-propyl alcohol (PrOH, C3H7OH, 99.9%, Gram-Mol, Zagreb, Croatia) as the solvent, acetylacetone (AcAc. CH3(CO)CH2COCH3, 99%+, VWR International, Radnor, PA, USA) as the chelating agent and nitric acid (HN, HNO3, 65%, Carlo Erba Reagents, Val-de-Reuil, France) as the catalyst. The molar ratio of these reactants in all colloidal solutions was TIP:PrOH:AcAc:HN = 1:35:0.63:0.015 (6, 11). The colloidal solution is then transferred into Teflon tubes, which are sealed and placed into ceramic vessels, which are then placed in a microwave reactor (Microwave Reaction System SOLV, Multiwave PRO, Anton Paar, Graz, Austria) at 150 °C for 30 minutes, on 200 °C for 10, 20 and 30 minutes. After synthesis, the samples were rinsed with distilled water and alcohol. TiO2 particles were separated by centrifuge (Centrifuge Centric 322A) at a speed of 2000 revolutions per minute for 5 minutes. The particles were then dried in a drying oven (Instrumentaria Zagreb ST-05) at 60 °C for 4 hours. The obtained particles were then ground in a mortar and characterized using the methods described below.
3.2. Characterization of Prepared TiO2 Nanoparticles
FTIR analysis of the synthesized TiO2 samples was conducted using a spectrometer (IRSpirit, Shimadzu, Tokyo, Japan) equipped with an additional ATR (attenuated total reflectance). The X-ray diffraction method was used to determine the crystalline phases in the samples. XRD analysis of the samples was performed using a diffractometer (D8 Advance, Bruker, Billerica, USA), with CuKα radiation at an accelerating voltage of 40 kV and a current of 25 mA. Data was collected in Bragg-Brentano configuration in the range of 10 to 80 (or 10 to 60) °2θ angles with a step size of 0.02° and a step duration of 0.6 s. Diffuse reflectance spectroscopy was performed on a spectrophotometer (Lambda 1050+, PerkinElmer, USA) for all prepared samples. Reflectance spectra (Figure 3) were recorded in the wavelength range from 250 nm to 750 nm (UV-Vis region), with a recording resolution of 1 nm. Barium (II) sulfate (BaSO4) was used as the standard. The band gap energy, Eg, was then determined from the obtained spectra using the Kubelka-Munk equation or Tauc plot. Nitrogen adsorption/desorption isotherms (Figure 5) of the obtained TiO2 samples were recorded using an ASAP-2000 instrument (Micromeritics, USA) at a temperature of -196°C. Prior to this, potentially adsorbed substances on the samples needed to be removed by degassing at a temperature of 150°C until a vacuum of less than 50 mm Hg was achieved. The specific surface area (SBET) of the samples was calculated using the BET model, using five points within the relative pressure range of 0 to 0.2. Pore volume (Vp) and pore size distribution were calculated from the nitrogen adsorption branch of the isotherm using the Barrett–Joyner–Halenda (BJH) model. The values of specific surface area and average pore diameter of TiO2 samples are presented in Table .
4. Conclusions
In this study, TiO2 nanoparticles were synthesized using the sol-gel method in a microwave reactor at a temperature of 150 °C for 30 minutes and at a temperature of 200 °C for 10, 20 and 30 minutes. Based on the obtained results of the characterization of prepared TiO2 samples, the following conclusions can be drawn:
- FTIR analysis confirmed the presence of TiO2 by detecting characteristic peaks in the FTIR spectrum typical for TiO2 according to literature data.
- XRD analysis revealed that in the TiO2 sample synthesized at 150 °C for 30 minutes, an amorphous phase was present, while in the other samples synthesized at 200 °C, a crystalline anatase phase was present.
- DRS analysis determined the band gap energy, Eg. For samples with a crystalline phase, the band gap energy value was around 3.0 eV, consistent with literature data for TiO2 in the rutile phase. This band gap energy value suggests the presence of defects within the samples, causing a shift in the band gap energy (3.2 eV for anatase).
- BET analysis determined that for the TiO2 sample synthesized at 200 °C for 10 minutes, the specific surface area was the highest at 191.6 m2 g-1. The average pore diameter of this sample was 6.1 nm, corresponding to a mesoporous structure. According to the IUPAC classification, the nitrogen adsorption-desorption isotherm of this sample corresponds to the type IV isotherm.
- CrystallineTiO2 nanoparticles, without amorphous phase, with the highest specific surface area (191.6 m2 g-1) and the lowest energy band gap (2.90 eV) were obtained for the sample synthesized at 200 °C for 10 minutes.
Author Contributions
Conceptualization, L.Ć., D.Lj., D.B. and I.G.; methodology, L.Ć., D.Lj., I.G. and D.B.; software, L.Ć., D.Lj., A.B., D.B. and I.G.; validation, L.Ć., D.Lj., A.B., G.M., D.B. and I.G.; formal analysis, D.B., A.B., G.M. and I.G.; investigation, D.B. and I.G.; resources, L.Ć., D.Lj. and A.B.; data curation, L.Ć., D.Lj., A.B., G.M., D.B. and I.G.; writing—original draft preparation, L.Ć., D.B., D.Lj. and I.G.; writing—review and editing, L.Ć., D.Lj., A.B., G.M., D.B. and I.G.; visualization, L.Ć., D.Lj., A.B., G.M., D.B. and I.G.; supervision, D.Lj. and L.Ć.; project administration, L.Ć. and D.Lj.; funding acquisition, L.Ć. and D.Lj. All authors have read and agreed to the published version of the manuscript.
Funding
This work was funded by the Croatian Science Foundation under the project [IP-2022-10-4400]: Development of molecularly imprinted polymers for use in analysis of pharmaceuticals and during advanced water treatment processes (MIPdePharma).
Data Availability Statement
The data presented in this study are available upon reasonable request from the corresponding author.
Conflicts of Interest
The authors declare no conflict of interest.
References
- Parrino, F.; Pomilla, F.R.; Camera-Roda, G.; Loddo, V.; Palmisano, L. Properties of titanium dioxide. In Titanium Dioxide (TiO₂) and Its Applications, 1st ed.; Parrino, F., Palmisano, L., Eds.; Elsevier: Amsterdam, Netherlands, 2021; pp. 13–66. [Google Scholar]
- Chen, X.; Mao, S.S. Titanium Dioxide Nanomaterials: Synthesis, Properties, Modifications, and Applications. Chem. Rev. 2007, 107, 2891–2959. [Google Scholar] [CrossRef]
- Haider, A.J.; Jameel, Z.N.; Al-Hussaini, I.H.M. Review on: Titanium Dioxide Applications. Enrgy Proced. 2019, 157, 17–29. [Google Scholar] [CrossRef]
- Gabelica, I.; Ćurković, L.; Mandić, V.; Panžić, I.; Ljubas, D.; Zadro, K. Rapid Microwave-Assisted Synthesis of Fe3O4/SiO2/TiO2 Core-2-Layer-Shell Nanocomposite for Photocatalytic Degradation of Ciprofloxacin. Catalysts 2021, 11, 1136. [Google Scholar] [CrossRef]
- Čizmić, M.; Ljubas, D.; Rožman, M.; Ašperger, D.; Ćurković, L.; Babić, S. Photocatalytic Degradation of Azithromycin by Nanostructured TiO2 Film: Kinetics, Degradation Products, and Toxicity. Materials 2019, 12, 873. [Google Scholar] [CrossRef]
- Ćurković, L.; Ljubas, D.; Šegota, S.; Bačić, I. Photocatalytic degradation of Lissamine Green B dye by using nanostructured sol–gel TiO2 films. J. Alloy Compd. 2014, 604, 309–316. [Google Scholar] [CrossRef]
- Gülşen, G.; Naci Inci, M. Thermal optical properties of TiO2 films. Opt. Mater. 2002, 18, 373–381. [Google Scholar] [CrossRef]
- Bai, J.; Zhou, B. Titanium Dioxide Nanomaterials for Sensor Applications. Chem. Rev. 2014, 114, 10131–10176. [Google Scholar] [CrossRef] [PubMed]
- Sun, X.; Wang, C.; Su, D.; Wang, G.; Zhong, Y. Application of Photocatalytic Materials in Sensors. Adv. Mater. Technol. 2020, 5, 1900993. [Google Scholar] [CrossRef]
- Chougala, L.; Yatnatti, M.; Linganagoudar, R.; Kamble, R.; Kadadevarmath, J. A Simple Approach on Synthesis of TiO2 Nanoparticles and its Application in dye Sensitized Solar Cells. J. Nano- Electron. Phys. 2017, 9, 04005–1. [Google Scholar] [CrossRef]
- Švagelj, Z.; Mandić, V.; Ćurković, L.; Biošić, M.; Žmak, I.; Gaborardi, M. Titania-Coated Alumina Foam Photocatalyst for Memantine Degradation Derived by Replica Method and Sol-Gel Reaction. Materials 2020, 13, 227. [Google Scholar] [CrossRef]
- Awan, A.M.; Khalid, A.; Ahmad, P.; Alharthi, A.I.; Farooq, M.; Khan, A.; et al. Defects oriented hydrothermal synthesis of TiO2 and MnTiO2 nanoparticles as photocatalysts for wastewater treatment and antibacterial applications. Heliyon 2024, 10, e25579. [Google Scholar] [CrossRef] [PubMed]
- Zhang, K.; Wang, J.; Ninakanti, R.; Verbruggen, S.W. Solvothermal synthesis of mesoporous TiO2 with tunable surface area, crystal size and surface hydroxylation for efficient photocatalytic acetaldehyde degradation. Chem. Eng. J. 2023, 474, 145188. [Google Scholar] [CrossRef]
- Sanchez Tobon, C.; Ljubas, D.; Mandić, V.; Panžić, I.; Matijašić, G.; Ćurković, L. Microwave-Assisted Synthesis of N/TiO2 Nanoparticles for Photocatalysis under Different Irradiation Spectra. Nanomaterials 2022, 12, 1473. [Google Scholar] [CrossRef] [PubMed]
- Gupta, D.; Jamwal, D.; Rana, D.; Katoch, A. Microwave synthesized nanocomposites for enhancing oral bioavailability of drugs. In Applications of Nanocomposite Materials in Drug Delivery, 1st ed.; Inamuddin, A., Mohammad, A., Eds.; Woodhead Publishing: Sawston, UK, 2018; pp. 619–632. [Google Scholar]
- Sanchez Tobon, C.; Panžić, I.; Bafti, A.; Matijašić, G.; Ljubas, D.; Ćurković, L. Rapid Microwave-Assisted Synthesis of N/TiO2/rGO Nanoparticles for the Photocatalytic Degradation of Pharmaceuticals. Nanomaterials 2022, 12, 3975. [Google Scholar] [CrossRef] [PubMed]
- Mironyuk, I.; Soltys, L.; Tatarchuk, T.; Savka, K. Methods of Titanium Dioxide Synthesis (Review). Phys. Chem. Solid State 2020, 21, 462–477. [Google Scholar] [CrossRef]
- Trindade, F.; Politi, M.J. Sol-Gel Chemistry—Deals With Sol–Gel Processes. In Nano Design for Smart Gels, 1st ed.; Bacani, R., Trindade, F., Politi, M.J., Triboni, E.R., Eds.; Elsevier: Amsterdam, Netherlands, 2019; pp. 15–34. [Google Scholar]
- Kappe, C.O. Microwave-Assisted Chemistry. In Comprehensive Medicinal Chemistry II, 2nd ed.; Taylor, J.B., Triggle, D.J., Eds.; Elsevier: Oxford, UK, 2007; pp. 837–860. [Google Scholar]
- Gawande, M.B.; Shelke, S.N.; Zboril, R.; Varma, R.S. Microwave-Assisted Chemistry: Synthetic Applications for Rapid Assembly of Nanomaterials and Organics. Accounts Chem. Res. 2014, 47, 1338–1348. [Google Scholar] [CrossRef]
- Henary, M.; Kananda, C.; Rotolo, L.; Savino, B.; Owens, E.A.; Cravotto, G. Benefits and applications of microwave-assisted synthesis of nitrogen containing heterocycles in medicinal chemistry. RSC Adv. 2020, 10, 14170–14197. [Google Scholar] [CrossRef]
- Nunes, D.; Pimentel, A.; Santos, L.; Barquinha, P.; Pereira, L.; Fortunato, E.; et al. Synthesis, design, and morphology of metal oxide anostructures. In Metal Oxide Nanostructures, 1st ed.; Korotcenkov, A., Ed.; Elsevier: Oxford, UK, 2019; pp. 21–57. [Google Scholar]
- Chia, S.R.; Nomanbhay, S.; Milano, J.; Chew, K.W.; Tan, C.-H.; Khoo, K.S. Microwave-Absorbing Catalysts in Catalytic Reactions of Biofuel Production. Energies 2022, 15, 7984. [Google Scholar] [CrossRef]
- Zhu, X.; Zhang, Y.; Zhou, Y.; Huang, X. Moisture Absorption Characteristics of Nanoparticle-Doped Silicone Rubber and Its Influence Mechanism on Electrical Properties. Polymers 2021, 13, 1474. [Google Scholar] [CrossRef]
- Praveen, P.; Viruthagiri, G.; Mugundan, S.; Shanmugam, N. Structural, optical and morphological analyses of pristine titanium di-oxide nanoparticles-Synthesized via sol-gel route. Spectrochim. Acta A 2013, 117, 622–629. [Google Scholar] [CrossRef]
- Wu, Q.; Huang, F.; Zhao, M.; Xu, J.; Zhou, J.; Wang, Y. Ultra-small yellow defective TiO2 nanoparticles for co-catalyst free photocatalytic hydrogen production. Nano Energy 2016, 24, 63–71. [Google Scholar] [CrossRef]
- Thommes, M.; Kaneko, K.; Neimark, A.V.; Olivier, J.P.; Rodriguez-Reinoso, F.; Rouquerol, J.; Sing, K.S.W. Physisorption of Gases, with Special Reference to the Evaluation of Surface Area and Pore Size Distribution (IUPAC Technical Report). Pure and Applied Chemistry 2015, 87, 1051–1069. [Google Scholar] [CrossRef]
- Lowell, S.; Shields, J.; Thomas, M.A.; Thommes, M. Characterization of Porous Solids and Powders: Surface Area. Porosity and Density; Springer, 2004. [Google Scholar]
- Thommes, M.; Cychosz, K. A. Physical adsorption characterization of nanoporous materials: progress and challenges. Adsorption 2014, 20, 233–250. [Google Scholar] [CrossRef]
- Landers, J.; Gor, G.Y.; Neimark, A.V. Density functional theory methods for characterization of porous materials. Colloid. Surfaces A: Physicochem. Eng. Aspects 2013, 437, 3–30. [Google Scholar] [CrossRef]
- Mele, G.; Del Sole, R.; Vasapollo, G.; Garcia-Lopez, E.; Palmisano, L.; Jun, L.; Slota, R.; Dyrda, G. TiO2-based photocatalysts impregnated with metallo-porphyrins employed for degradation of 4-nitrophenol in aqueous solutions: role of metal and mac-rocycle. Res. Chem. Intermed. 2007, 33, 433–448. [Google Scholar] [CrossRef]
- Sun, W.-J.; Li, J.; Yao, G.-P.; Zhang, F.-X.; Wang, J.-L. Surface-modification of TiO2 with new metalloporphyrins and their photocatalytic activity in the degradation of 4-notrophenol. Appl. Surf. Sci. 2011, 258, 940–945. [Google Scholar] [CrossRef]
- Ćurković, L.; Ljubas, D.; Juretić, H. Photocatalytic decolorization kinetics of diazo dye Congo Red aqueous solution by UV/TiO2 nanoparticles. React. Kinet. Mech. Catal. 2010, 99, 201–208. [Google Scholar] [CrossRef]
Figure 1.
FTIR spectra of prepared TiO2 photocatalyst on 150 °C for 30 min (black line), 200 °C for 10 min (orange line), 200 °C for 20 min (green line) and 200 °C for 10 min (blue line).
Figure 1.
FTIR spectra of prepared TiO2 photocatalyst on 150 °C for 30 min (black line), 200 °C for 10 min (orange line), 200 °C for 20 min (green line) and 200 °C for 10 min (blue line).
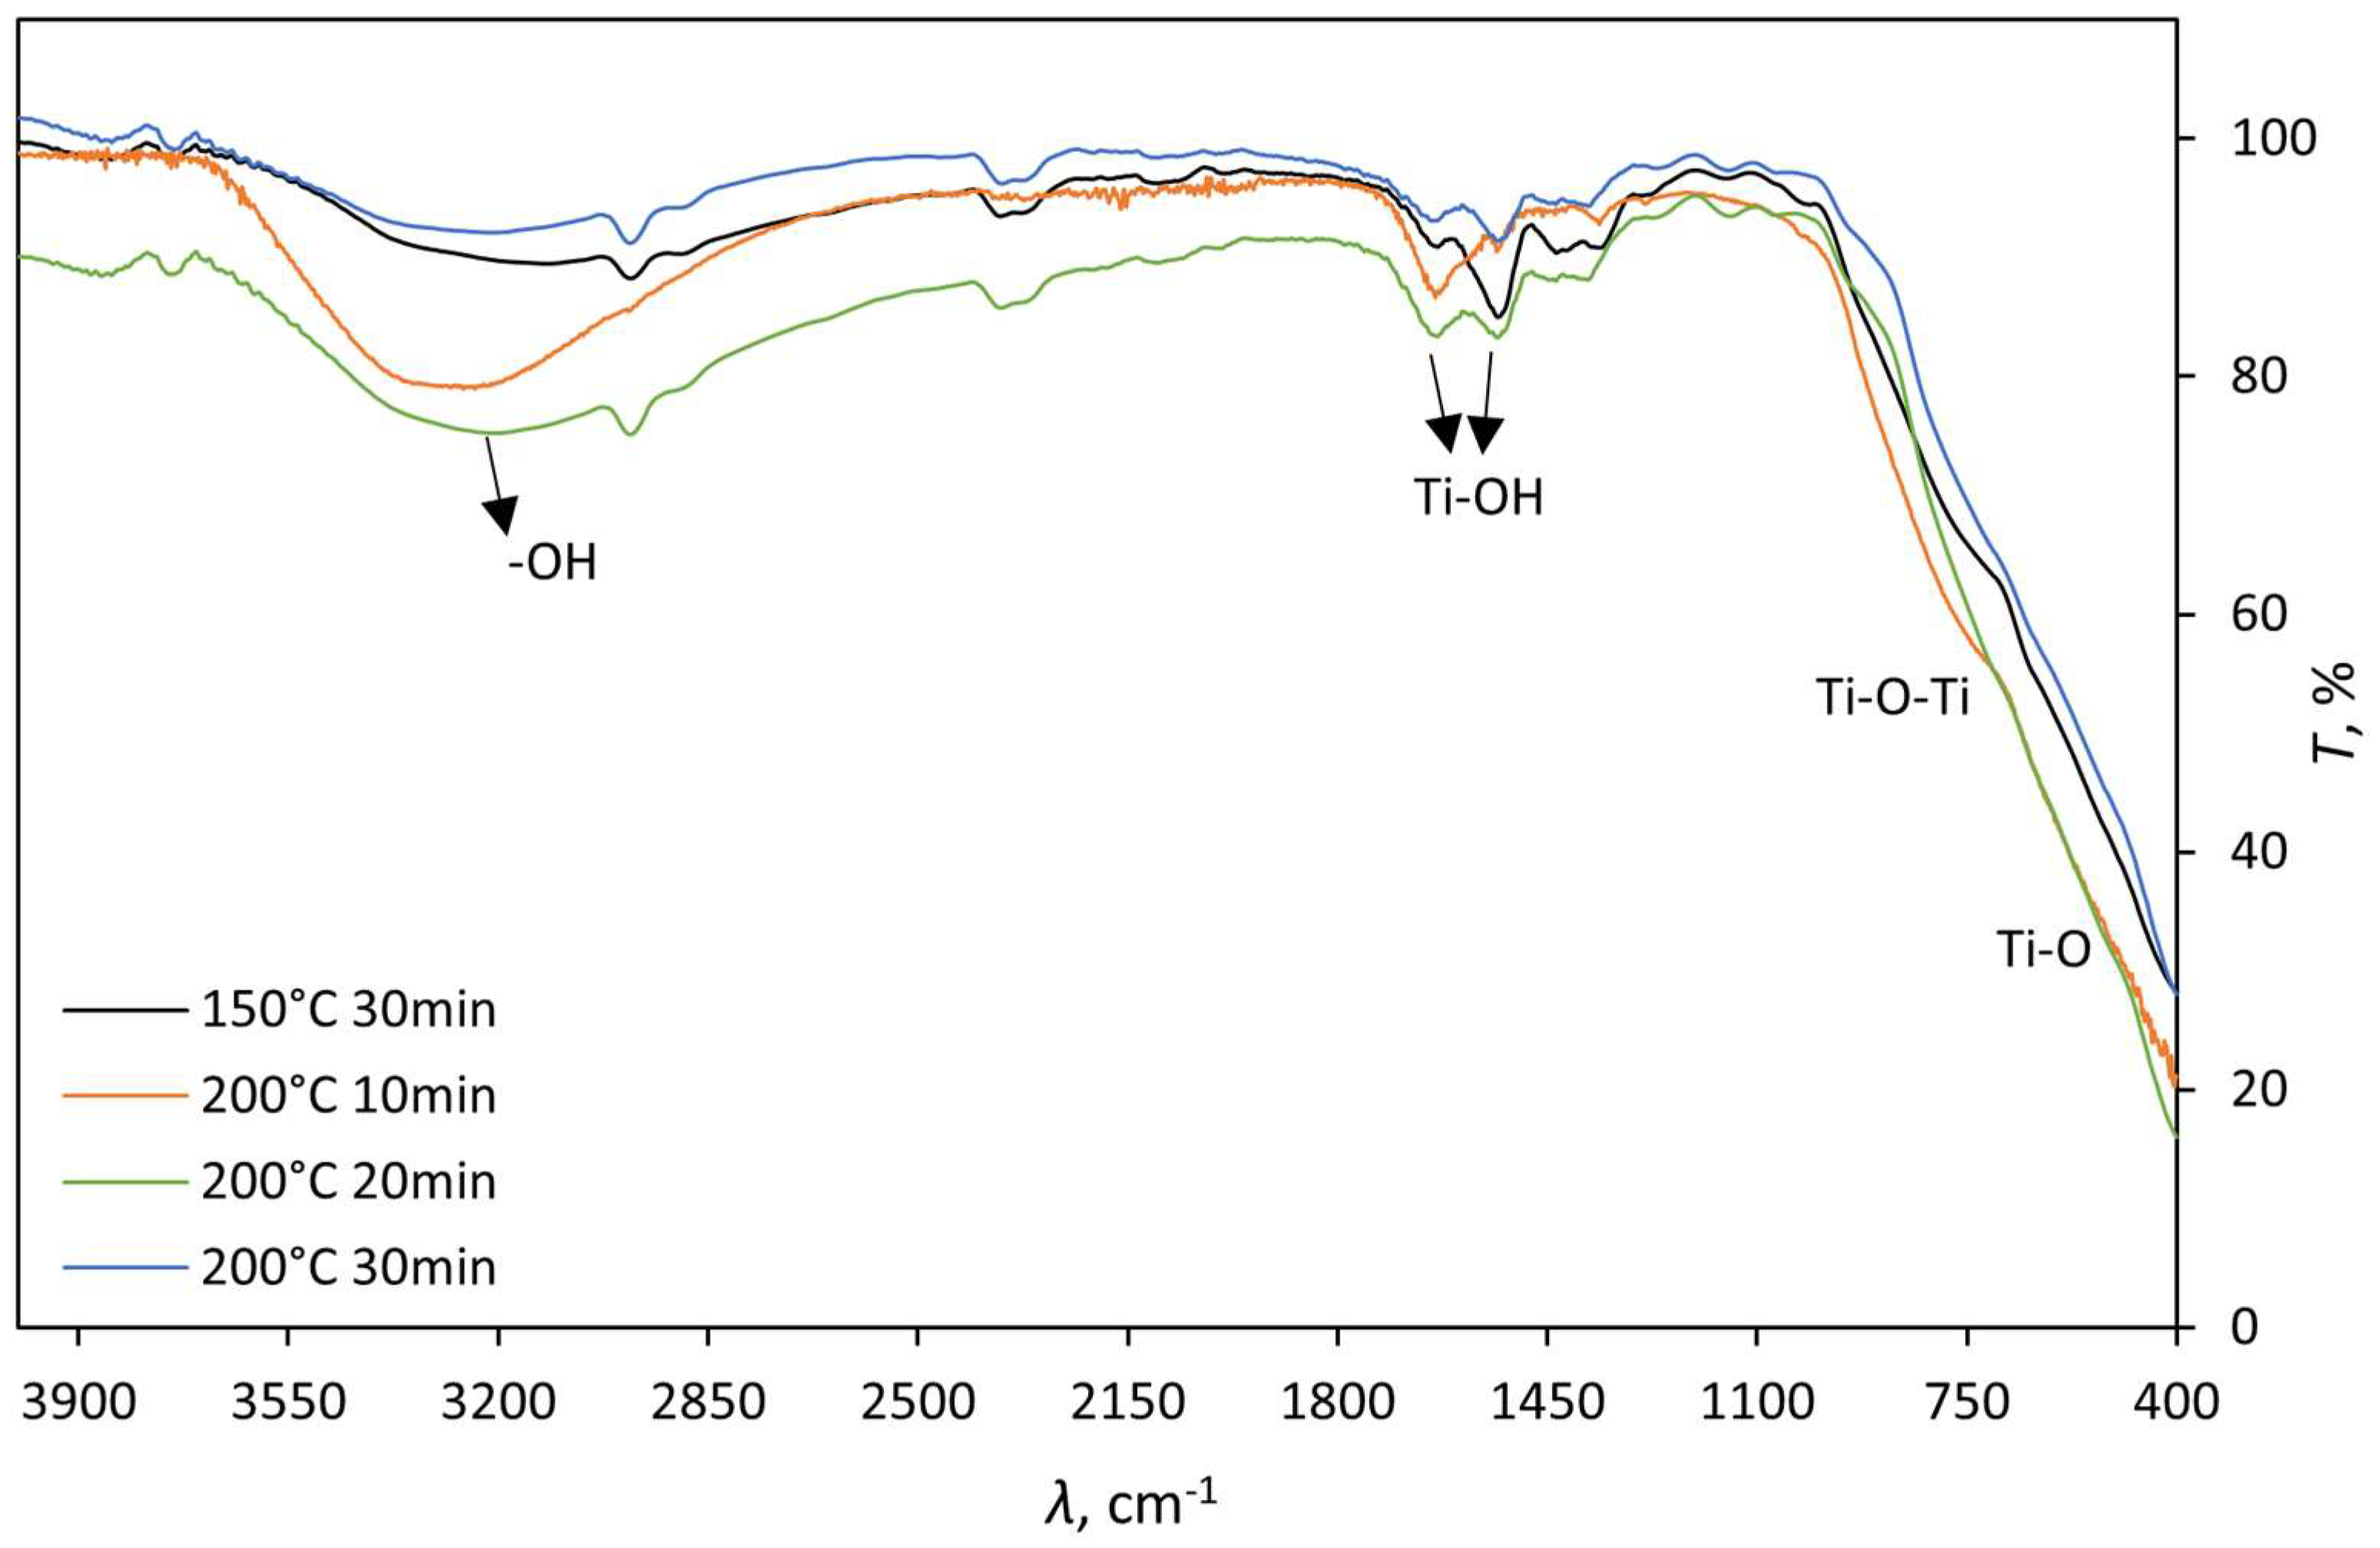
Figure 2.
Diffractograms of prepared TiO2 photocatalysts on 150 °C for 30 min (TiO2- MW 150C 30 min), 200 °C for 10 min (TiO2-MW 200C 10 min), 200 °C for 20 min (TiO2-MW 200C 20 min) and 200 °C for 30 min (TiO2-MW 200C 10 min).
Figure 2.
Diffractograms of prepared TiO2 photocatalysts on 150 °C for 30 min (TiO2- MW 150C 30 min), 200 °C for 10 min (TiO2-MW 200C 10 min), 200 °C for 20 min (TiO2-MW 200C 20 min) and 200 °C for 30 min (TiO2-MW 200C 10 min).
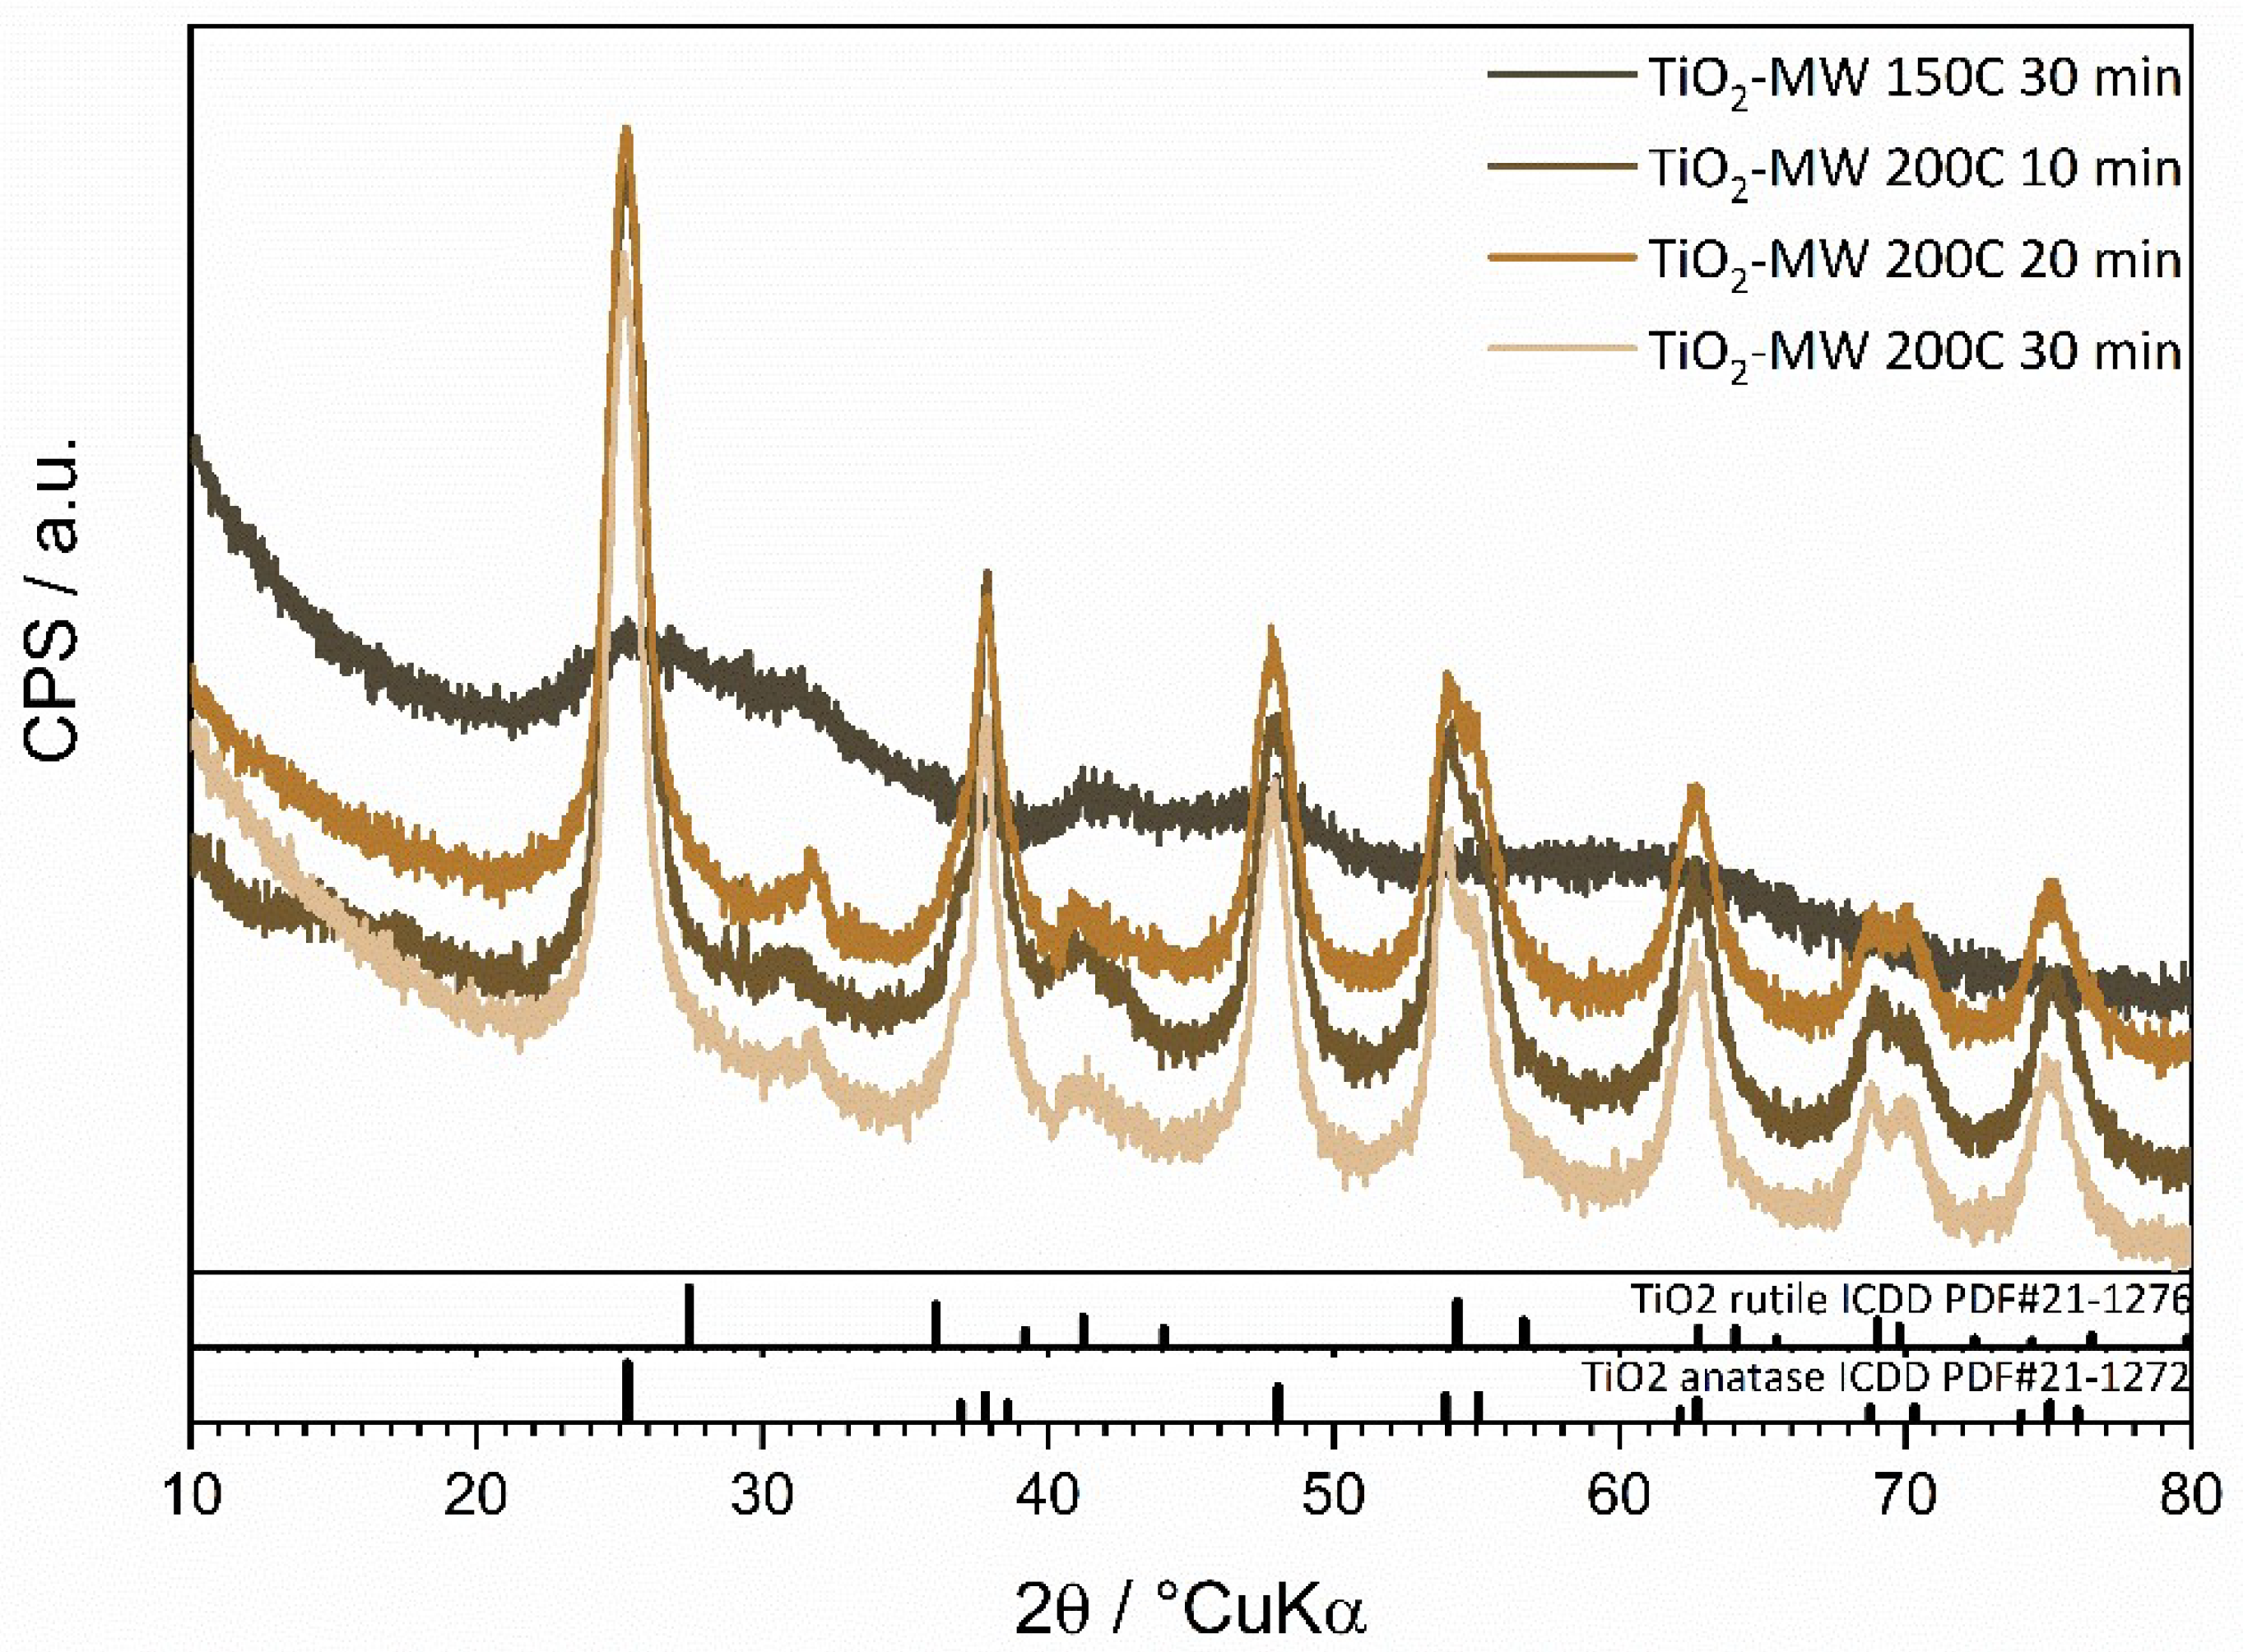
Figure 3.
Reflectance spectra (a) and Tauc's graphical representation (b) for prepared TiO2 photocatalyst at 150 °C for 30 min (TiO2-MW-150C-30min), 200 °C for 10 min (TiO2- MW- 200C- 10min), 200 °C for 20 min (TiO2-MW-200C-20min) and 200 °C for 30 min (TiO2- MW- 200C-10min).
Figure 3.
Reflectance spectra (a) and Tauc's graphical representation (b) for prepared TiO2 photocatalyst at 150 °C for 30 min (TiO2-MW-150C-30min), 200 °C for 10 min (TiO2- MW- 200C- 10min), 200 °C for 20 min (TiO2-MW-200C-20min) and 200 °C for 30 min (TiO2- MW- 200C-10min).
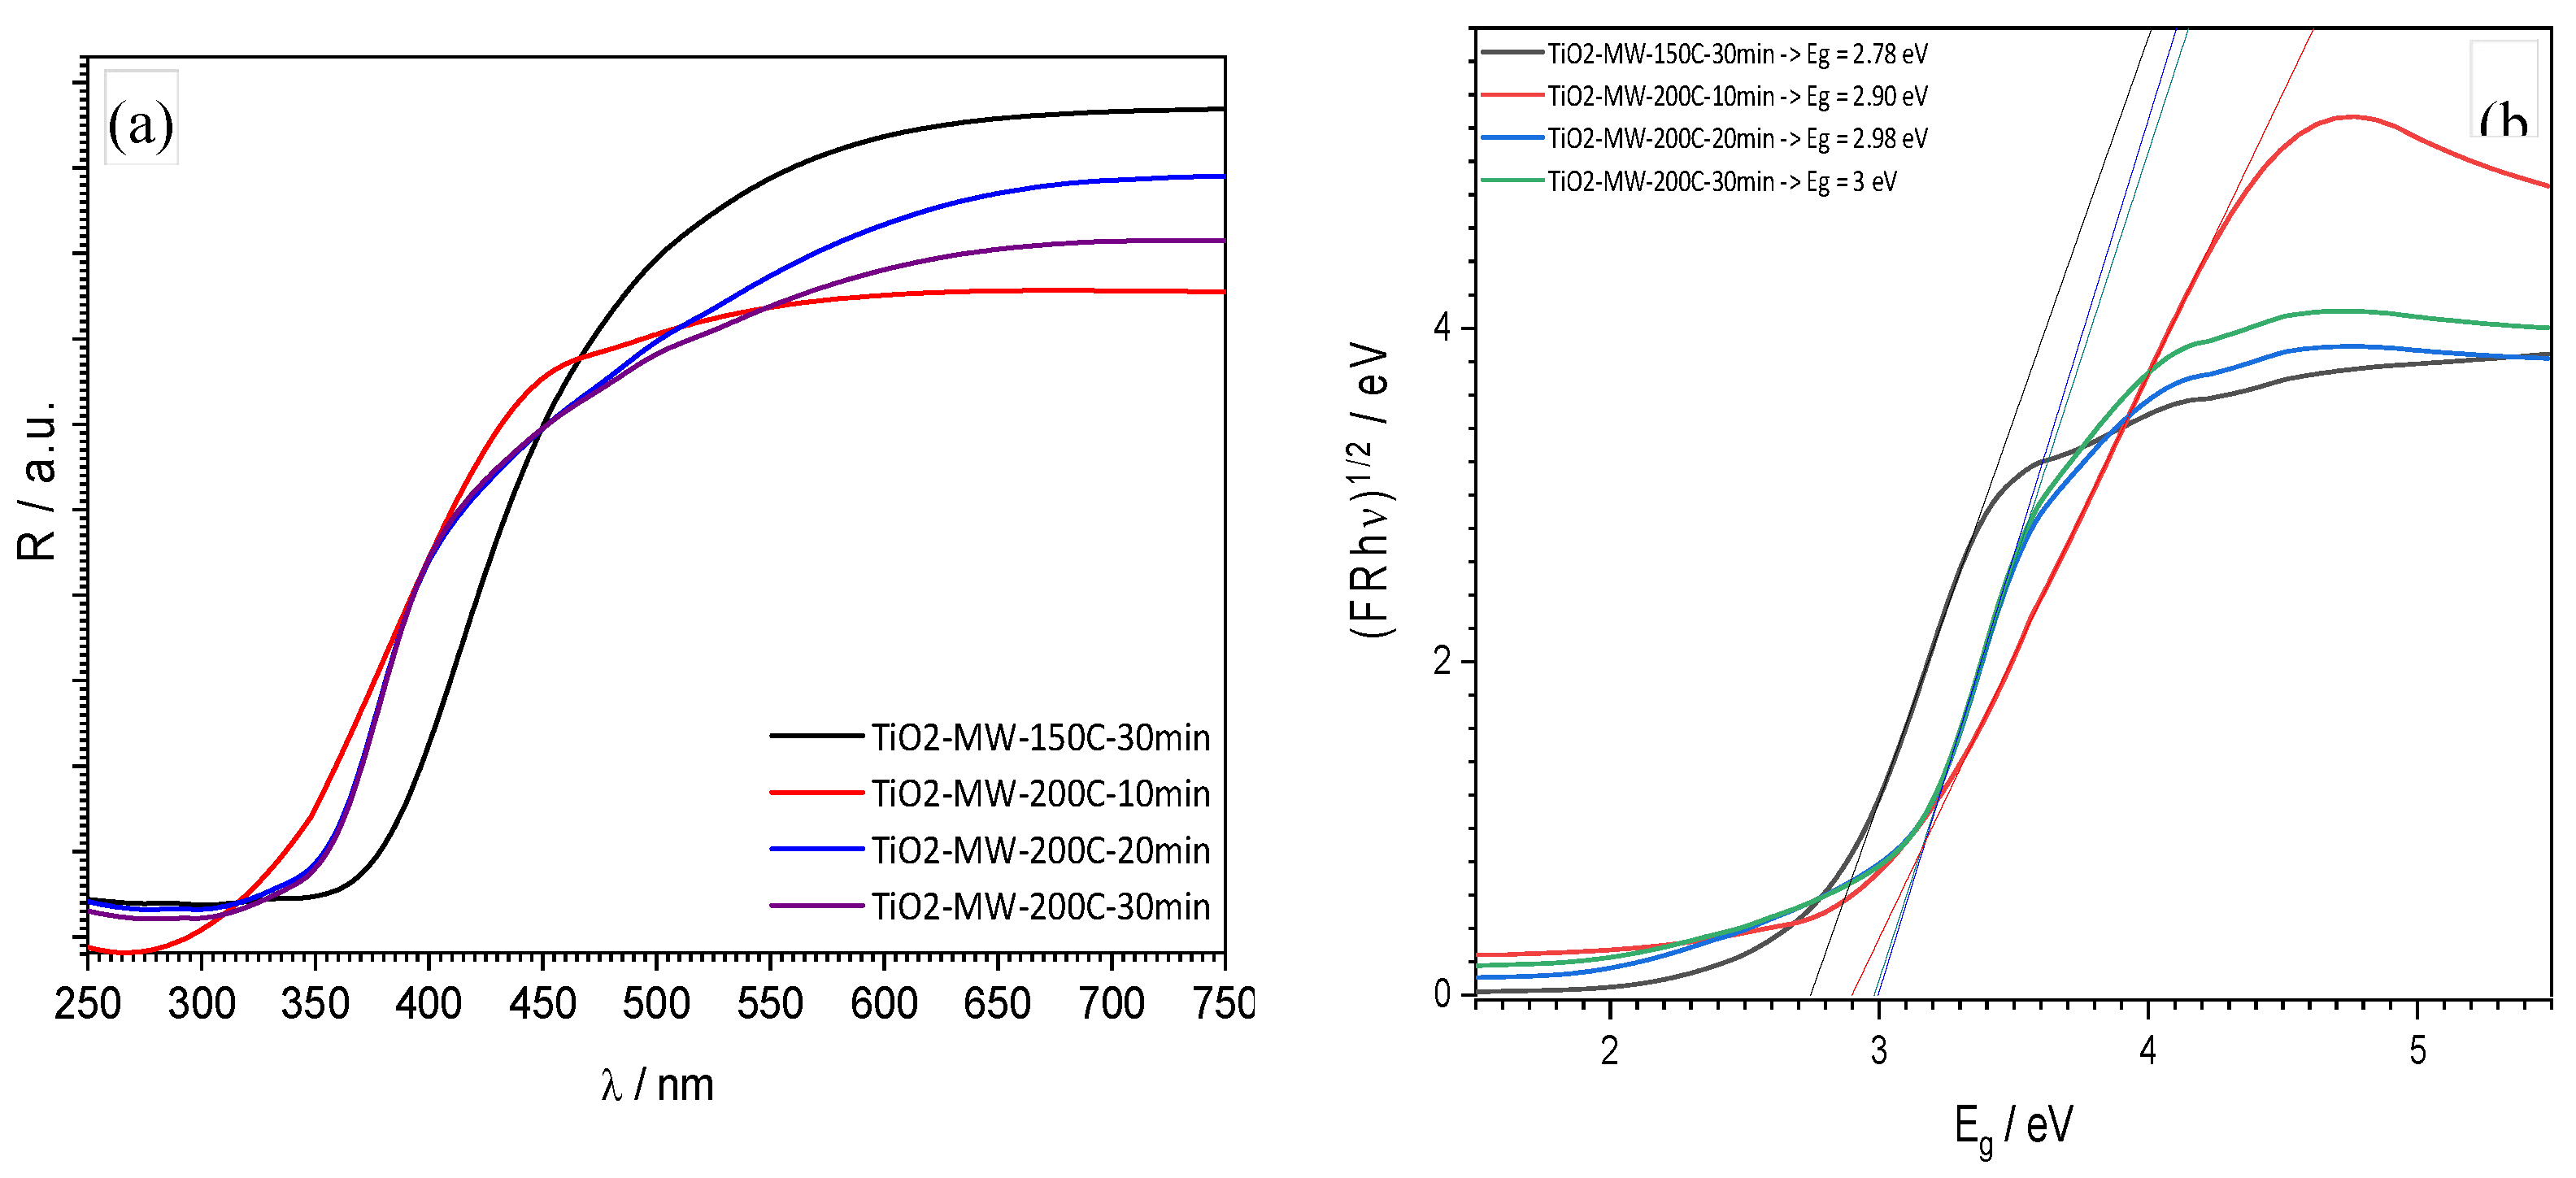
Figure 4.
Nitrogen adsorption/desorption isotherms for prepared TiO2 photocatalyst on (a) 150 °C for 30 min, (b) 200 °C for 10 min, (c) 200 °C for 20 min, and (d) 200 °C for 30 min.
Figure 4.
Nitrogen adsorption/desorption isotherms for prepared TiO2 photocatalyst on (a) 150 °C for 30 min, (b) 200 °C for 10 min, (c) 200 °C for 20 min, and (d) 200 °C for 30 min.
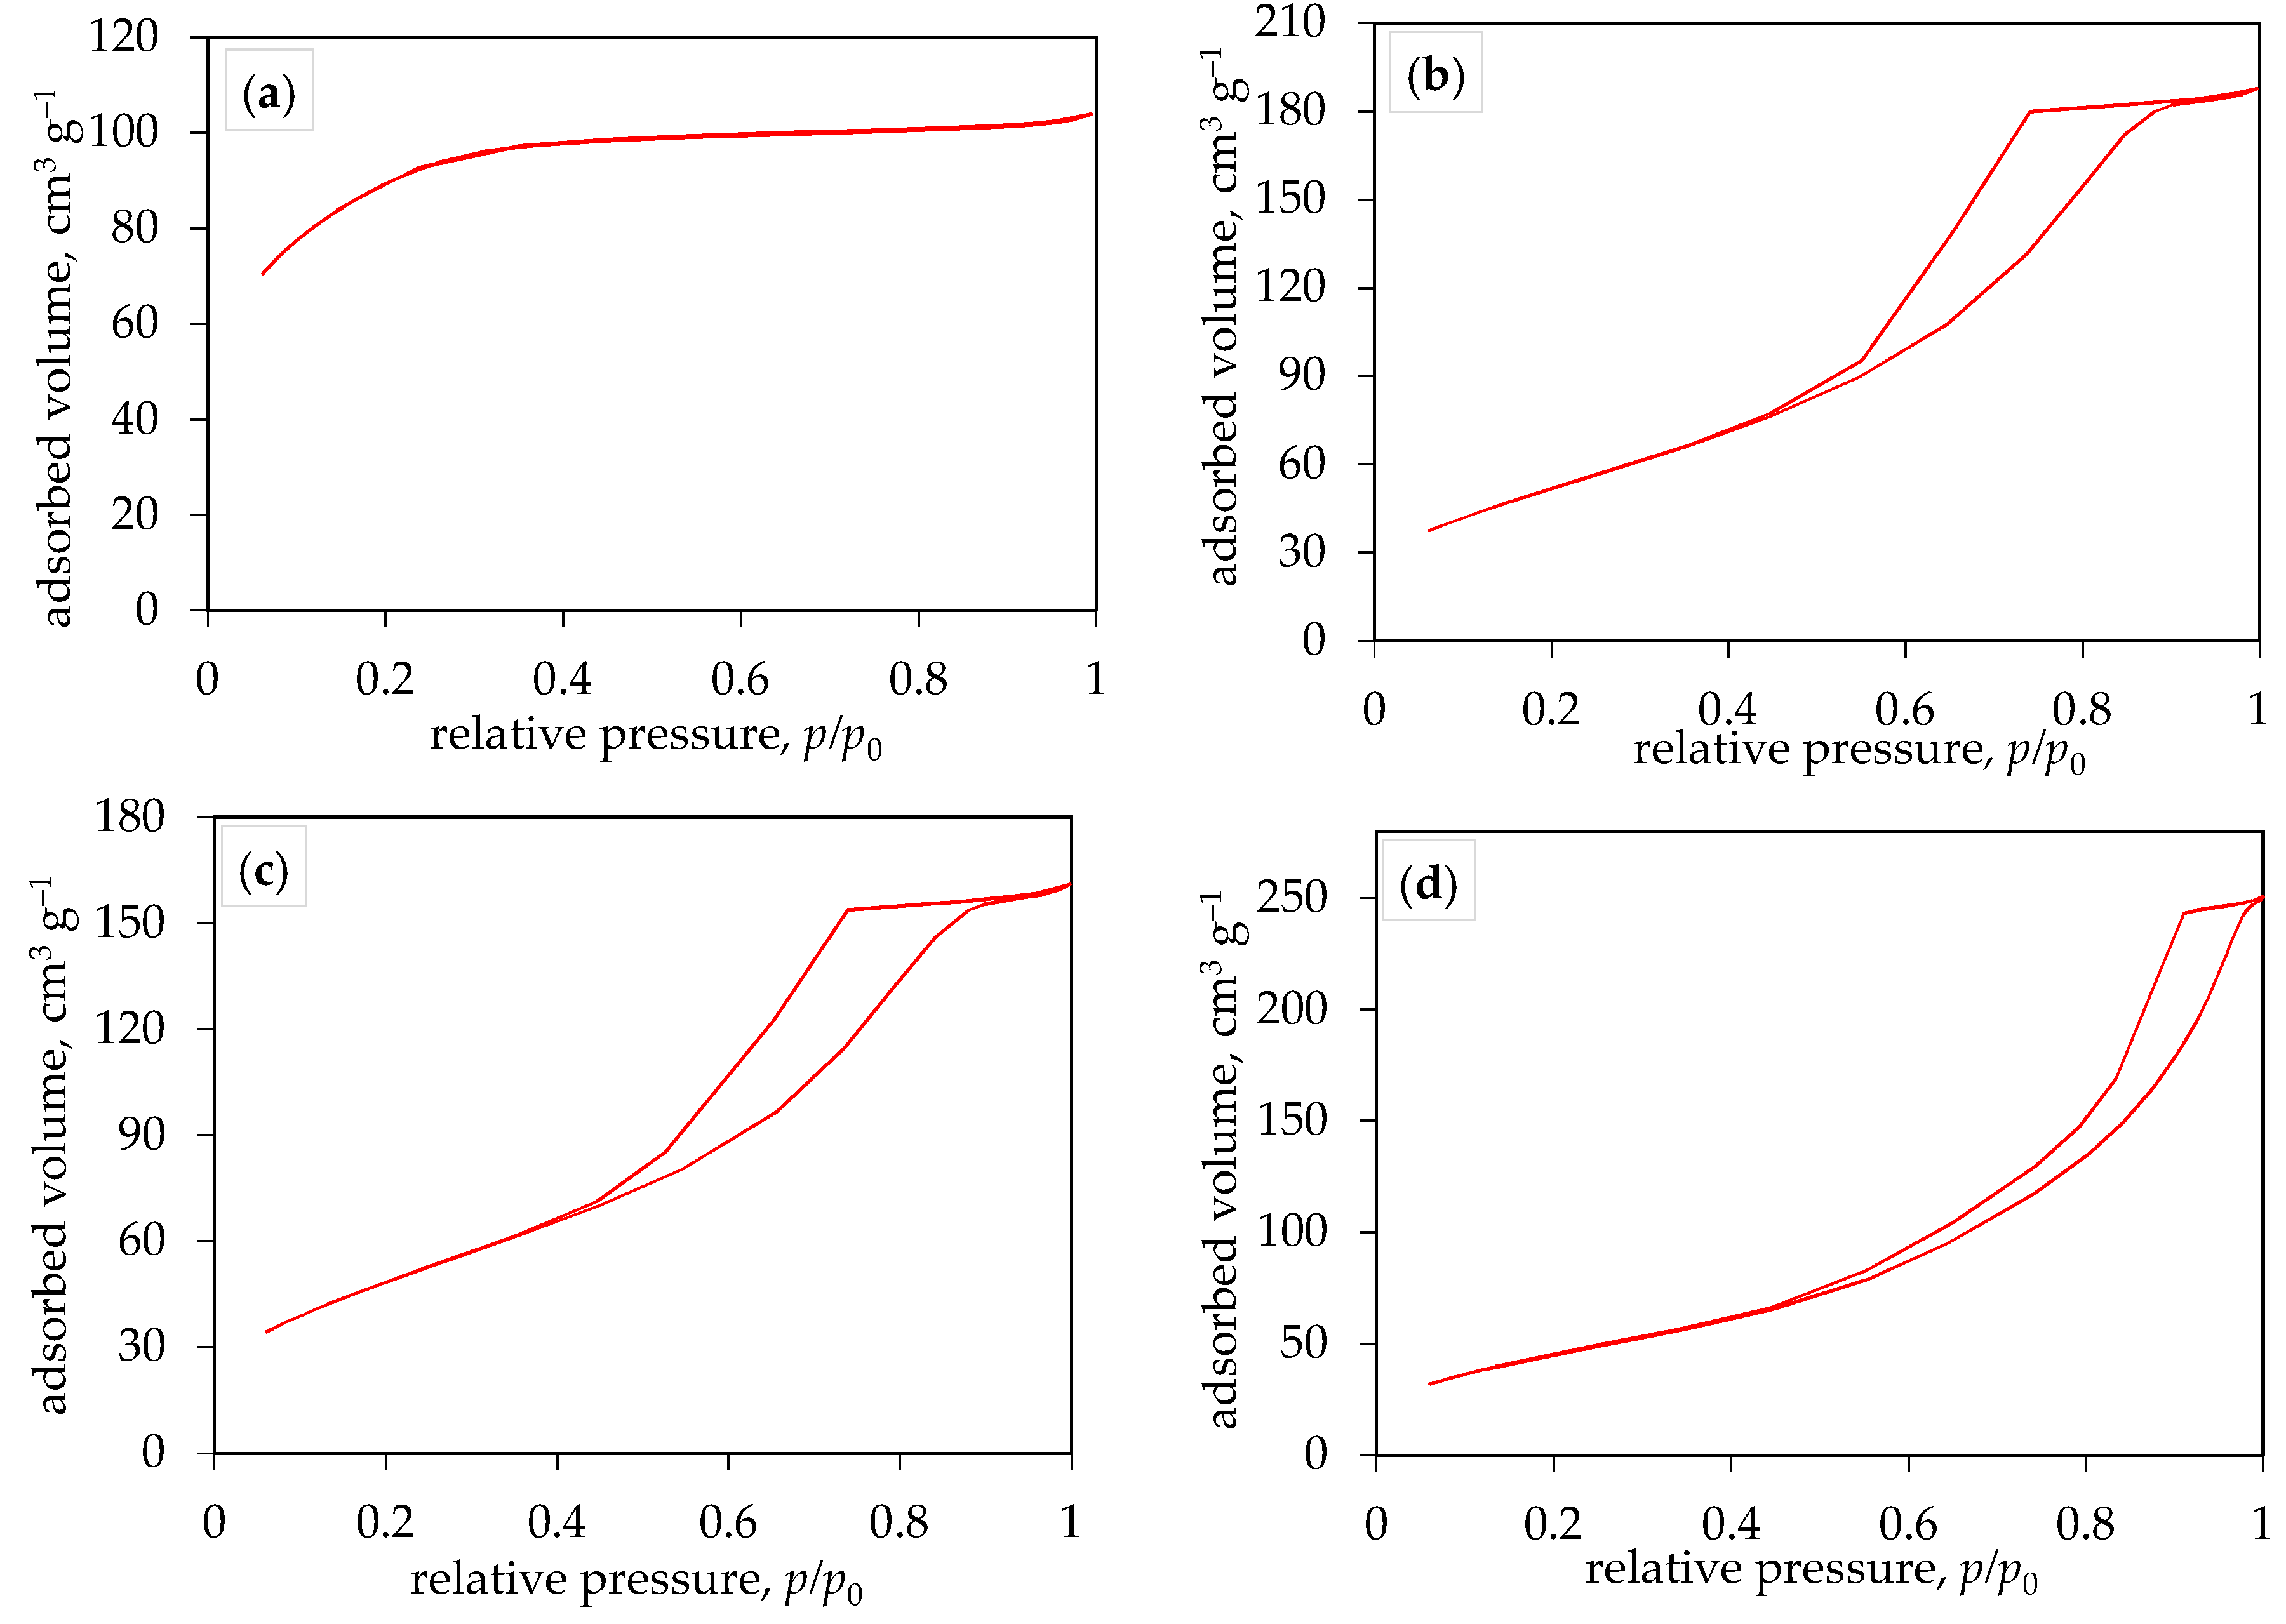
Figure 5.
Pore size distribution for prepared TiO2 photocatalyst on (a) 150 °C for 30 min, (b) 200 °C for 10 min, (c) 200 °C for 20 min, and (d) 200 °C for 30 min.
Figure 5.
Pore size distribution for prepared TiO2 photocatalyst on (a) 150 °C for 30 min, (b) 200 °C for 10 min, (c) 200 °C for 20 min, and (d) 200 °C for 30 min.
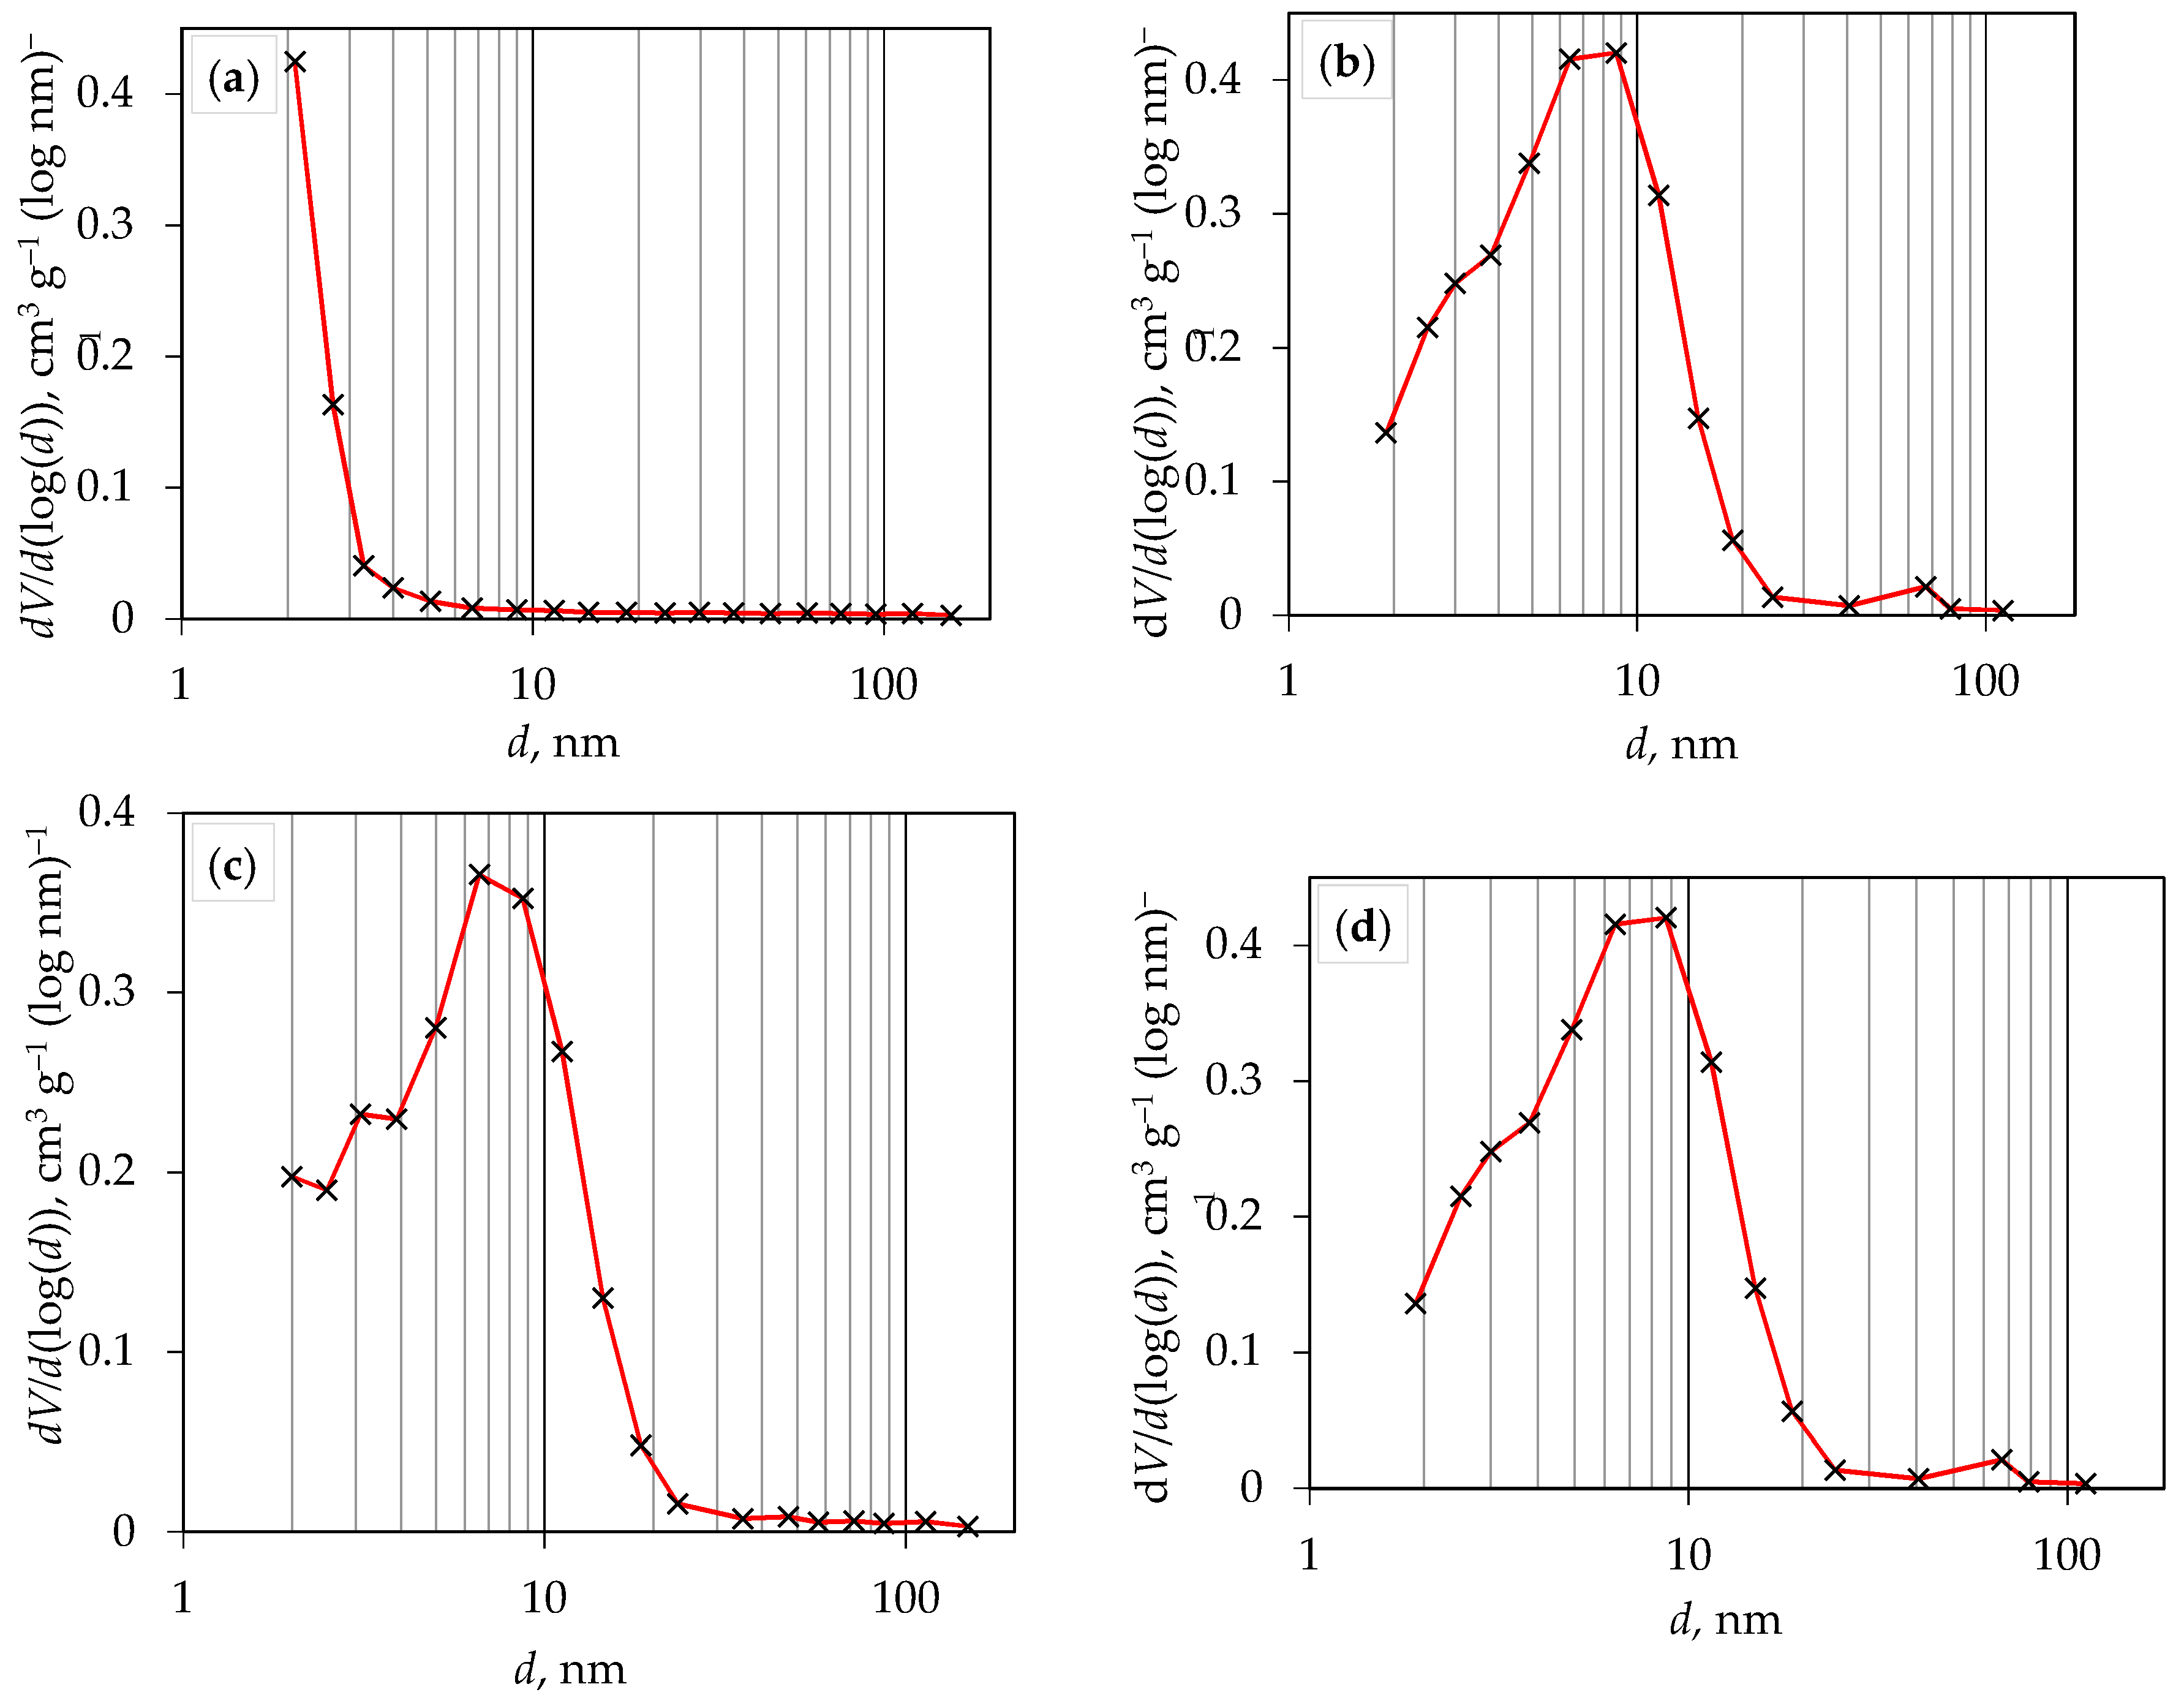

Table 1.
The values of specific surface area and average pore diameter of prepared TiO2 samples.
| TiO2 sample | Specific surface area, | Average pore diameter, | |
|---|---|---|---|
| T, °C | t, min | ||
| 150 | 30 | 321.9 | 2.0 |
| 200 | 10 | 191.6 | 6.1 |
| 200 | 20 | 181.1 | 5.4 |
| 200 | 30 | 168.5 | 9.1 |
Disclaimer/Publisher’s Note: The statements, opinions and data contained in all publications are solely those of the individual author(s) and contributor(s) and not of MDPI and/or the editor(s). MDPI and/or the editor(s) disclaim responsibility for any injury to people or property resulting from any ideas, methods, instructions or products referred to in the content. |
© 2024 by the authors. Licensee MDPI, Basel, Switzerland. This article is an open access article distributed under the terms and conditions of the Creative Commons Attribution (CC BY) license (http://creativecommons.org/licenses/by/4.0/).
Copyright: This open access article is published under a Creative Commons CC BY 4.0 license, which permit the free download, distribution, and reuse, provided that the author and preprint are cited in any reuse.


