Submitted:
01 May 2024
Posted:
02 May 2024
You are already at the latest version
Abstract
The paper provides a methodological framework based on Multiple Criteria Decision Aid methods for determining relative regional vulnerabilities associated with forest fires that occurred during a given period. Different notions of ex-post vulnerability are defined based on the forest area burned and the frequency of forest fires, and their relation to the regions’ area and several socioeconomic characteristics. The methodology is applied to Greece and its administrative regions for the period 2000–2022. Linking the forest fire events with summer and spring temperatures and precipitation and using econometric count data analysis, the paper explores the climatic drivers of forest fire occurrence and provides projections of the expected change in the frequency of fires of specific size classes conditional on the evolution of mean seasonal regional temperature and precipitation according to IPCC scenarios. The results regarding relative regional vulnerabilities and expected forest fires could be useful in designing policies for preserving forests as natural capital and promoting sustainability.
Keywords:
wildfires
; regional vulnerability
; climate change
; ecosystem services
; multicriteria decision making
; Poisson regression.
1. Introduction
Human-induced climate change has, according to the IPCC Sixth Assessment Report [1], increased the frequency, intensity and/or duration of extreme weather events such as droughts, wildfires, terrestrial and marine heatwaves, cyclones and floods and caused widespread and severe loss and damage to human and natural systems. Moreover, the same report states that since the writing of the IPCC Fifth Assessment Report [2], the impacts of climate change and extreme weather events have adversely affected or caused loss and damage to human health, incomes and livelihoods, and security and inequality, indicating that climate change has been evolving over the past decade.
Abatzoglou et al. [3] provide evidence indicating that increased fire weather becomes more widespread as a function of global temperature change, which suggests that an increase in fire weather conditions is related to anthropogenic climate change. In a review of 57 scientific papers regarding the link between climate change and fire risk, Jones et al. ([4], page 117) find that “Human-induced warming has already led to a global increase in the frequency and severity of fire weather, increasing the risks of wildfire. This signal has emerged from natural variability in many regions, including the western US and Canada, southern Europe, Scandinavia and Amazonia.” For Southern Europe and the Mediterranean, Jones et al. [4] indicate that the impact of anthropogenic climate change on fire weather extremes and the length of fire seasons started in the 1990s (see also [3]). In a recent report regarding wildfire activity across Europe, Pronto et al. [5] identify a significant increase in wildfire activity and associate this increase in wildfire risks with prolonged heatwaves, droughts, and strong or unusual wind patterns.1
In Greece, forests and woodlands cover 49.5% (6.532 million hectares) of the total land [7]. Kassomenos [8] points out that intense forest fires have been occurring with increasing frequency in Greece since the 1970s. He associates wildfire events and wildfire persistence with interactions between low- and high-pressure systems and anticyclonic conditions associated with high temperatures, low humidity, and moderate winds. Papadopoulos et al. [9] also conclude that high temperatures which strongly desiccate the land and dry anticyclonic activity encourage wildfires in Greece. Koutsias et al. [10] studied the long-run relationship between forest fires and weather conditions using data for the period 1894–2010. Their results indicate a statistically significant positive trend between the number of fires and air temperature – which was related to the occurrence of summer heat waves – after the mid-1970s. Sarris et al. [11] predict escalation of wildfires with global warming, based on a case study of Mt. Taygetos in southern Greece.
Forests provide a wide range of ecosystem services which include provisioning services (e.g., food, timber, water), regulatory services (e.g., climate regulation, flood control, carbon dioxide sequestration), cultural services (e.g., recreation, tourism, spiritual and moral values) and supporting services which are necessary for the production of all other ecosystem services (e.g., soil creation, photosynthesis, conservation of species) [12]. Thus, the contribution of forest ecosystem services to human well-being is significant. Furthermore, these services are important in supporting the livelihoods of poor rural households [13]. Therefore, conserving forest ecosystems could play an important role in poverty reduction.
De Groot et al. [14] provide extensive information on the valuation of forest ecosystem services,2 with aggregate values for tropical forests and temperate forests respectively being 119,076 and 5,383 Int$/hectare-year in 2020 price levels, while the value of ecosystem services for woodland and shrubland is 769 Int$/hectare-year in 2020 price levels. In a recent study of forest resilience in Greece – whose forests are Mediterranean3 – the value of ecosystem services was estimated to be greater than 726 €/hectare-year in 2020 price levels with a probability of 90%, with the mean and median of the value distribution being 1,262 and 1,145 €/hectare-year in 2020 price levels respectively, not including loss of human life and private property [17].
The discussion above indicates that climate change and the associated changes in temperature and precipitation have an impact on forest fires, and that the occurrence of forest fires implies a loss in ecosystem services which are important for human well-being at both the local and global levels. In the sustainability context, preservation of ecosystem services provided by forests requires the preservation of forests, which are regarded as natural capital. Forest fires degrade this type of natural capital and could harm the prospects for sustainability, with sustainable development defined, following Arrow et al. [18], as the non-declining productive base of the economy.4 Thus, understanding the link between forest fires and climate change could be important in designing adaptation policies which would protect forests as natural capital and would support sustainable development.
Since forest fires in each country are distributed across different administrative regions according to geographical characteristics, the associated losses in ecosystem services have a spatial distribution. Given that the loss of ecosystem services affects well-being, there is a corresponding spatial distribution of welfare losses as well.
The area burned in a given region – along with the frequency of fires in the same region when expressed relative to specific regional characteristics such as area, gross domestic product (GDP), population level and density, and regional GDP per capita relative to the country’s GDP per capita – can provide different insights into the vulnerability of a region to forest fires relative to the rest of the regions of the country. This relative vulnerability concept could be useful for prioritizing adaptation policies when trade-offs emerge because of funding constraints. For example, whether regions which are more vulnerable in terms of regional income distribution should have priority over regions which are more vulnerable in terms of population density.
In this context, the contribution of the present paper is twofold. First, it provides a methodological framework based on Multiple Criteria Decision Aid methods for determining relative regional vulnerabilities associated with the forest area burned and the frequency of forest fires that occurred during the period 2000–2022 in Greece as a whole and its administrative regions. Area burned and frequency were related to the regions’ area and certain socioeconomic characteristics to define different notions of ex-post vulnerability based on observed forest fires. Second, by linking the forest fire events during 2000–2022 with summer and spring temperatures and precipitation, and by using econometric count data analysis, the paper explores the climatic drivers of forest fires and forecasts the expected number of fires of specific size conditional on the evolution of temperature in the regions of Greece according to the IPCC representative concentration pathways (RCP) scenarios RCP4.5 [19] and RCP8.5 [20]. This can be regarded as providing insight into a forward-looking measurement of vulnerability, and the forecasts can be used to study the expected vulnerability associated with the evolution of climate change and to design adaptation policies.
The rest of the paper is organized as follows. Section 2 describes the multicriteria method and the formulation of the socioeconomic sustainability indices. Section 3 presents the data on regional forests fires for the period 2000–2022 and calculates vulnerability indices. Section 4 provides forecasts according to IPCC scenarios using a Poisson regression framework. Section 5 concludes and discusses policy implications.
2. Regional Vulnerability Assessment and Multicriteria Methods
The decision process for assessing the vulnerability of a region to a specific hazard depends on many factors. The selection of the appropriate assessment method can therefore be considered as a multi-criteria decision-making (MCDM) problem. MCDM methods5 have been extensively used in vulnerability assessment [23,24,25]. In this paper we use the Technique of Order Preference Similarity to the Ideal Solution (TOPSIS) method, which assigns vulnerability attributes or criteria – characteristics of regional impacts of fires in this case – to regions. A decision matrix is then created, and weights are associated with different attributes. TOPSIS is based on finding an ideal and an anti-ideal solution and comparing the distance of each of the alternatives to them. Suppose, for example, we have a problem with m alternative regions, Ai, and n vulnerability attributes, Cj. Then the decision matrix shown in Table 1 is constructed. The weights reflect the relative importance associated with a specific attribute, while the values of the entries provide a numerical value of attribute to region . For the case of Greece, there are 13 regions.6
Then the following steps are taken:
- Step 1: We calculate the normalized decision matrix P with elements
The process of normalization allows us to remove the units of measurement which makes the various features comparable to each other.
- Step 2: We calculate the weight of each criterion using equations (1)–(3). Equation (1) represents entropy which, in information theory, is a measure of the amount of uncertainty presented by a discrete probability distribution:
Equation (2) is interpreted as the degree of diversity of the information contained in each criterion, and can be calculated as
Finally, equation (3) is the objective weights for each criterion that are given by
Step 2 provides an objective way of calculating the weights so there are no subjective biases that could distort the importance of the criteria.7
- Step 3: We calculate the ideal () and anti-ideal () solution aswhere
J1 is the set of benefit criteria and J2 is the set of cost criteria. This basically tells us that the ideal solution consists of the maximum of each provision criterion and the minimum of each cost criterion. In contrast, the anti-ideal solution consists of the minimum of each provision criterion and the maximum of each cost criterion.
- Step 4: We compute the weighted Euclidean distances between each alternative and , and between each alternative and aswhere
- Step 5: We calculate the relative proximity of each alternative to the ideal solution. The relative proximity of alternative with respect to is defined as
This relative proximity tells us how close each alternative is to the ideal . By ranking the alternatives from largest to smallest based on relative closeness, we can see which alternative is closest to the ideal solution and which is farthest away.
2.1. Regional Forest Fires in Greece
The total number of forest fires in Greece for the period 2000–2022 was 233,116 with the annual distribution shown in Figure 1.
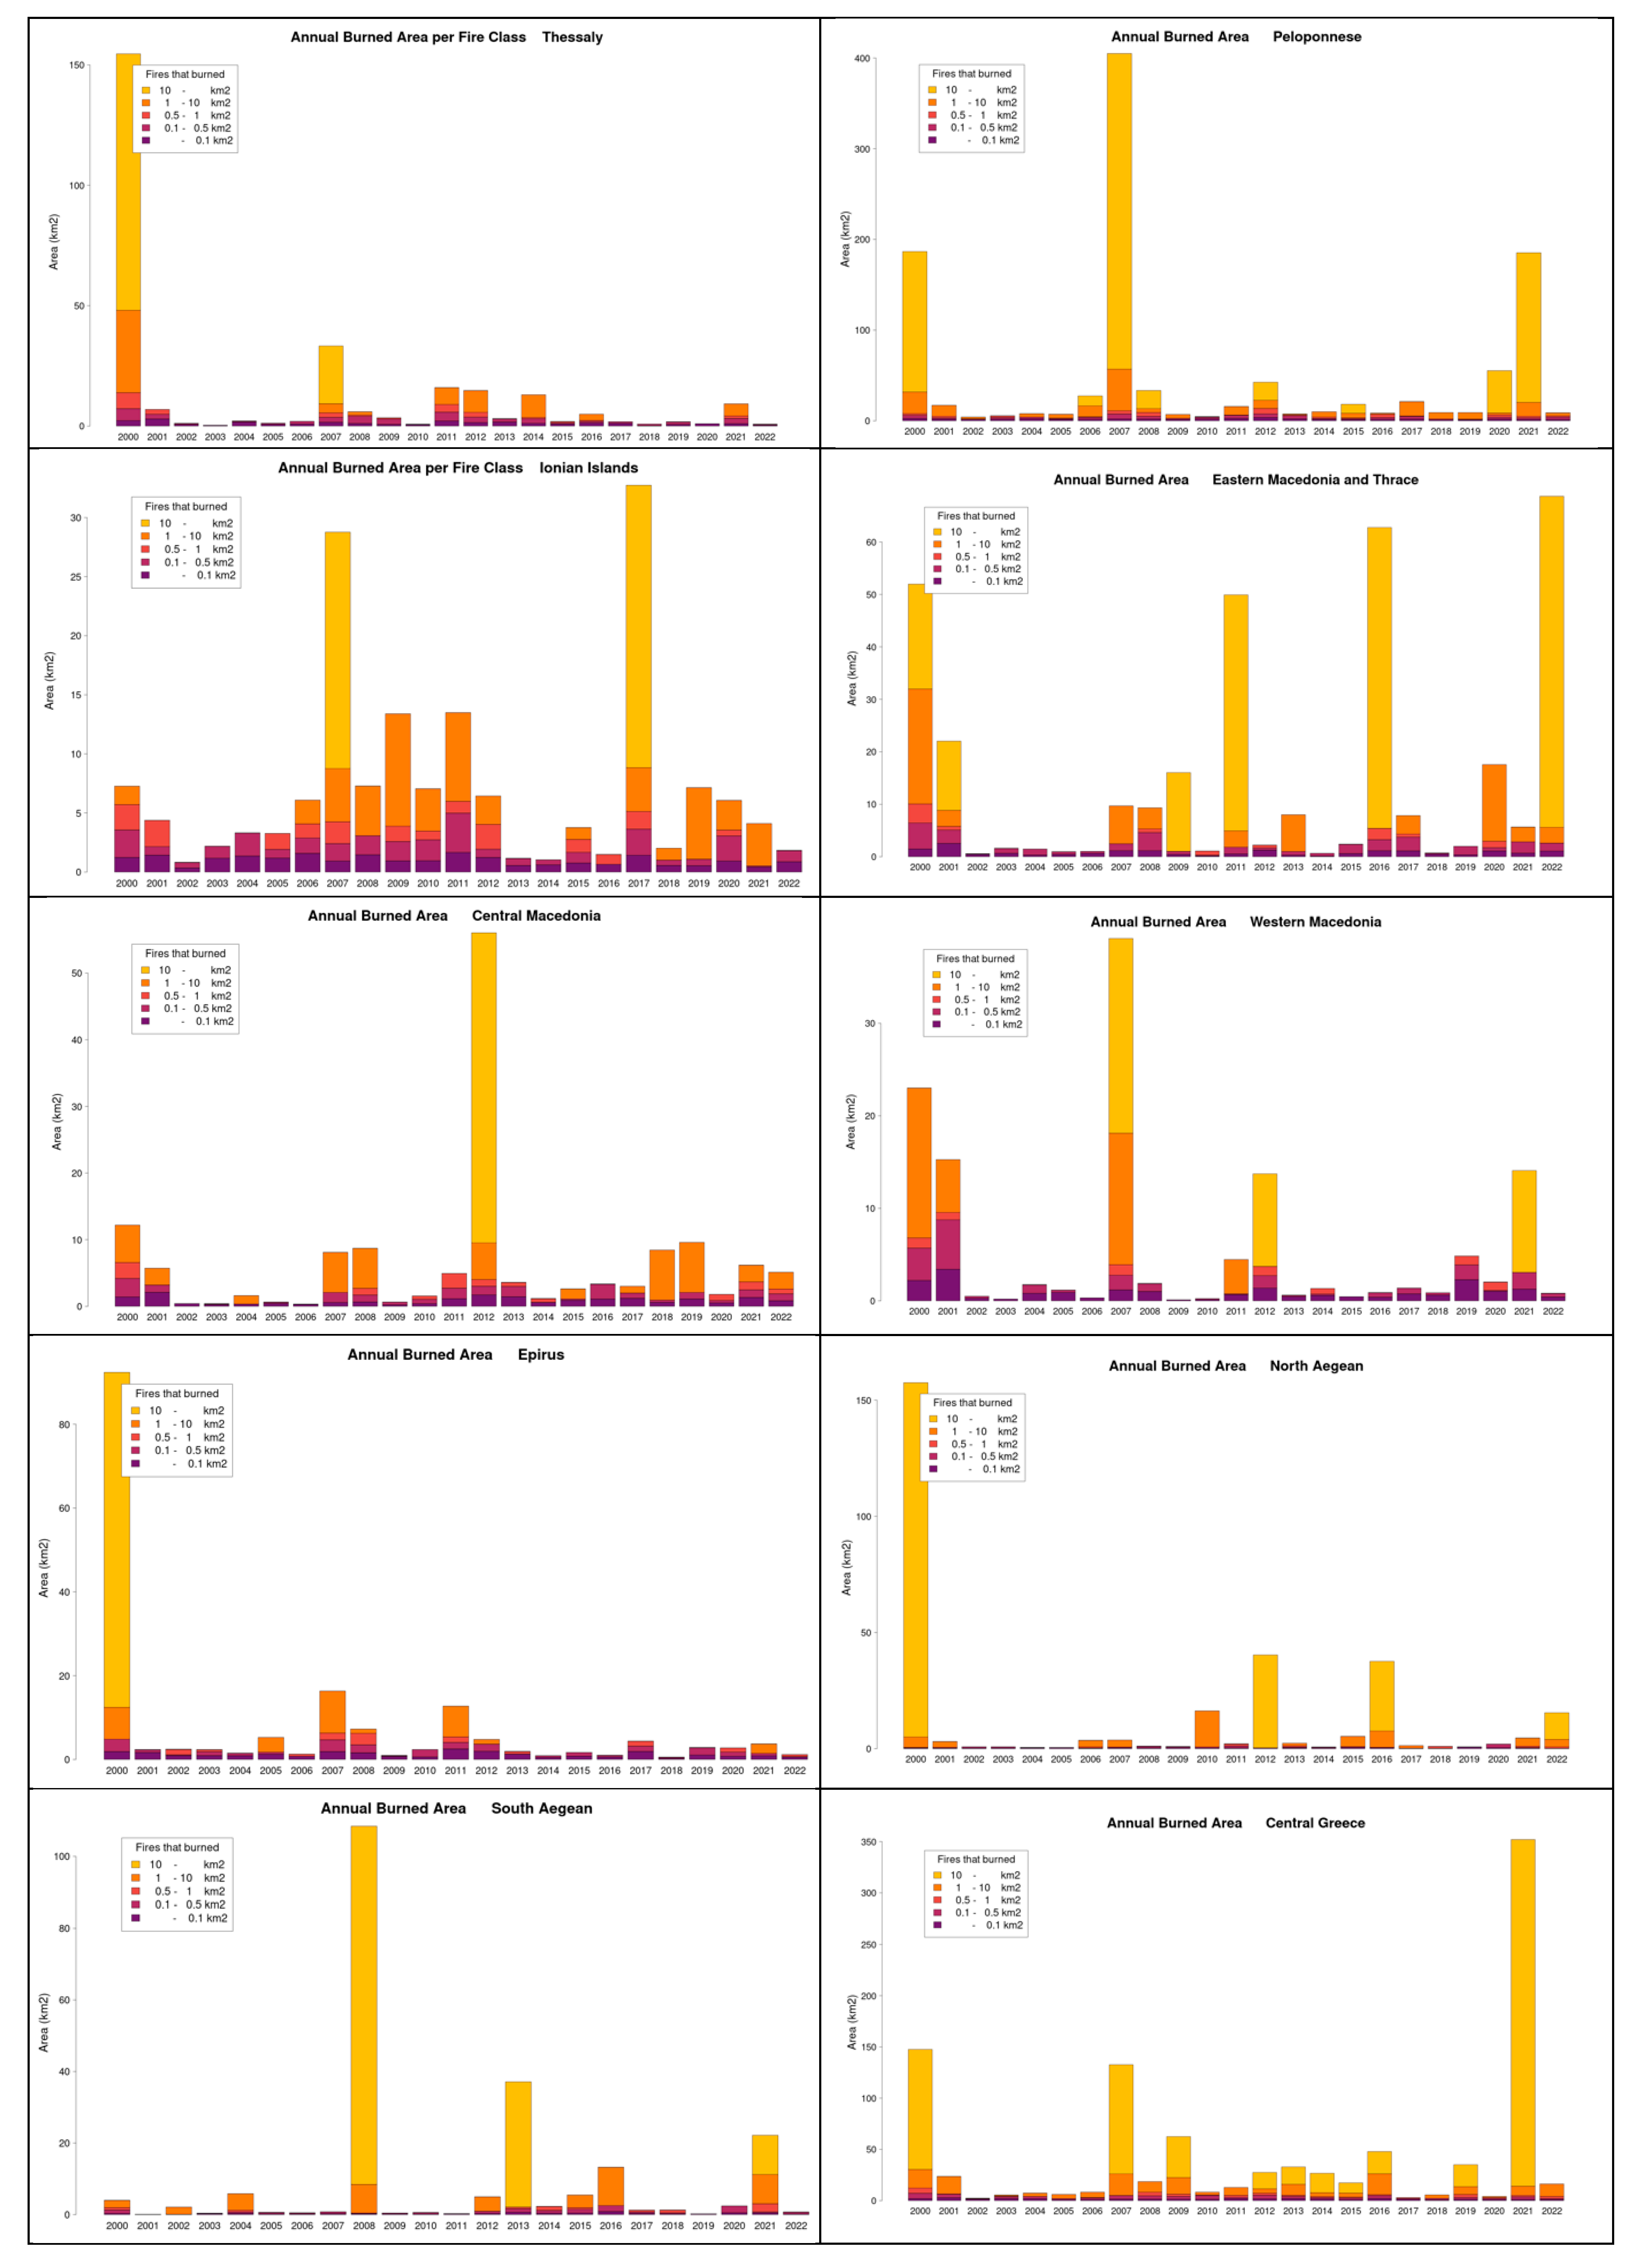
The fire events were grouped into five categories according to the size of the burned area: less than 10 hectares; between 10 and 50 hectares; between 50 and 100 hectares; between 100 and 1,000 hectares; more than 1,000 hectares. This structure provides a basis for examining vulnerability to different types of fires with respect to area burned and frequency of fires. The burned areas in Greece as a whole and in three selected regions are presented in Figure 2.8
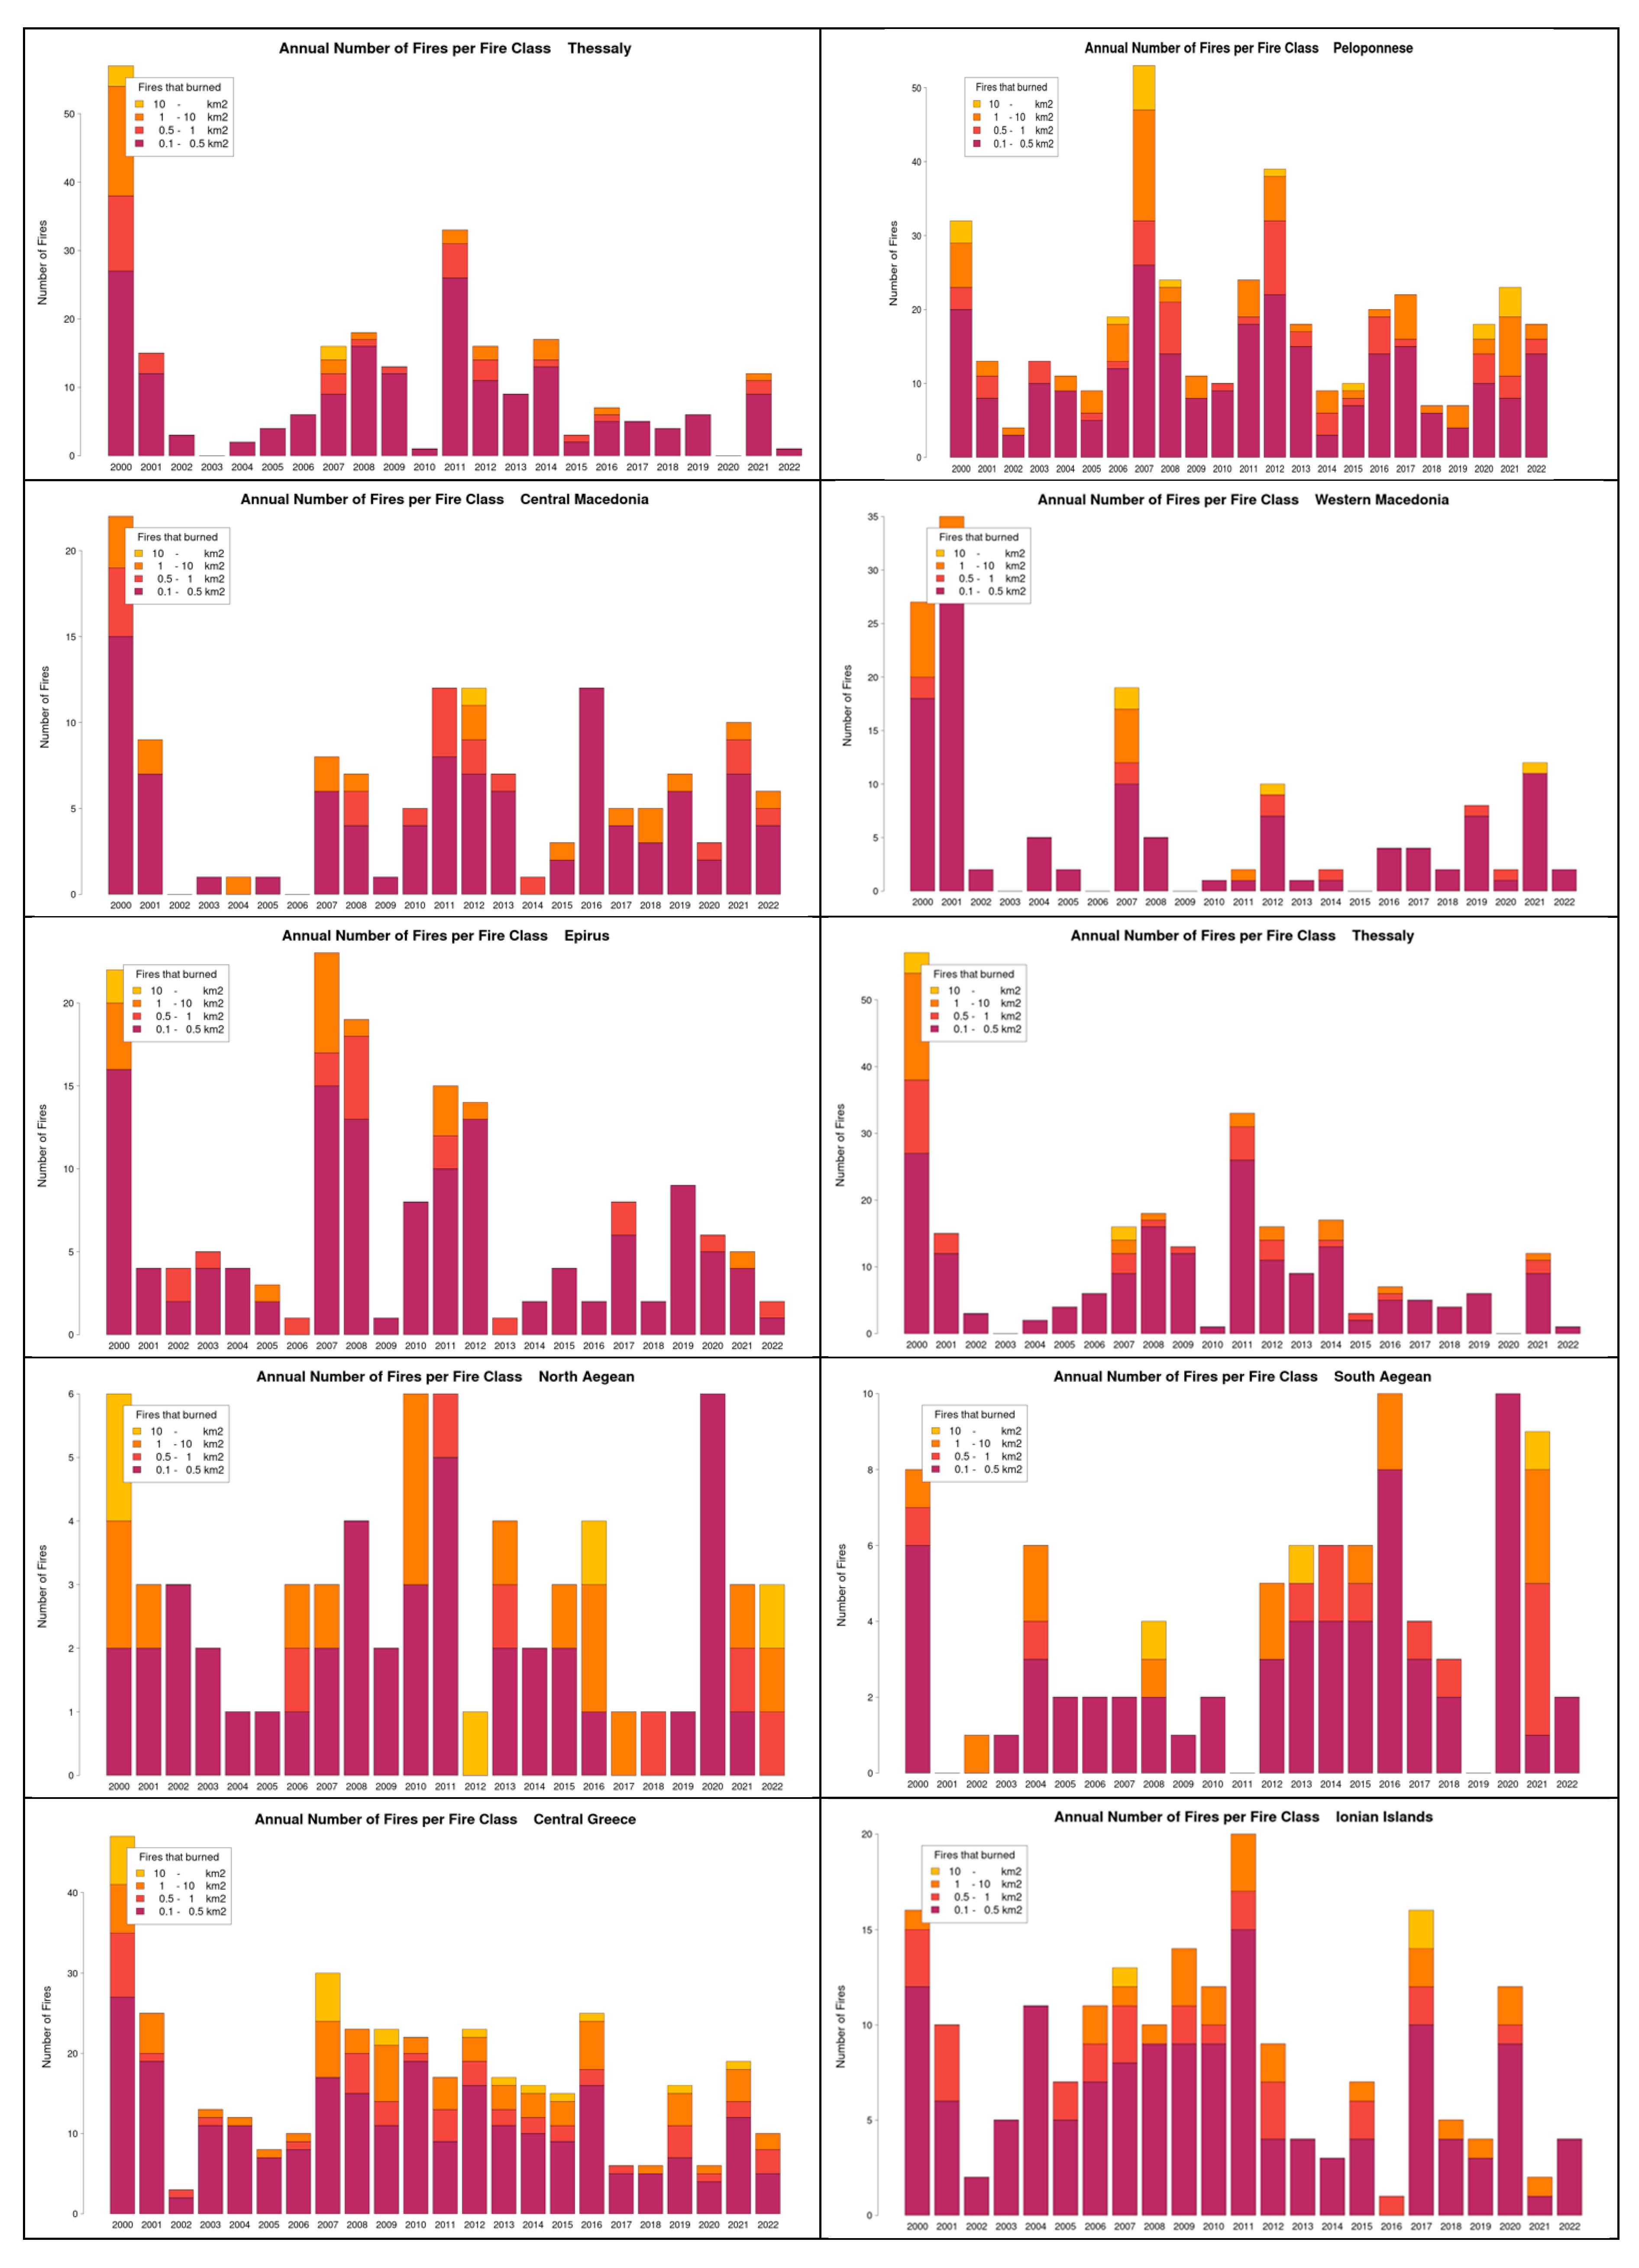
Figure 2 presents the total area burned each year by the five categories of fires in Greece as a whole and in three selected regions. The larger fires burned the greatest amount of land. Figure 3 is the same as Figure 2 except for the number of fire events. Most of the fires are small, while the large mega-fires are just a small fraction of the total number of fires.
This mismatch is emphasized in Figure 4 which is a combination of Figure 2 and Figure 3 for the whole of Greece. The dominant color in the figure is light orange, which represents the area burned by the fires in the largest category. This contrasts with the small number of these fires which is represented by the light orange part of the x-axis that is measured by the difference between the light orange arrow and the dark orange arrow on the x-axis.
The data used to produce Figure 4 for Greece as a whole, as well as for each Greek region, were used to define nine fire characteristics:
- the number of fires in each region that burned: between 10 and 50 hectares; between 50 and 100 hectares; between 100 and 1000 hectares; above 1000 hectares (four attributes),
- the total area burned for each category (four attributes), and
- the total area burned for the whole region9 (one attribute).
There is a direct correspondence between area burned and damages to society. These damages include the loss of ecosystem services, as stated in the introduction, but also include health effects from wildfire smoke exposure.10 Worldwide, wildfire smoke is estimated to kill 339,000 people a year, mostly in Asia and sub-Saharan Africa.11 In a recent paper, Gould et al. [26] report a statistically significant association between wildfire PM2.5 and respiratory hospitalization and respiratory emergency department visits. Furthermore, evidence suggests negative mental health outcomes during and after wildfires [27]. Thus, vulnerability measured in terms of frequency and size of forest fires is directly associated with vulnerability in terms of economic damages, with economic damages defined in terms of economic valuation of both ecosystem services (e.g., [28]) and related health effects (e.g., [29]).
2.2. Vulnerability of Greek Regions to Forest Fires
Vulnerability is a metric that can be defined in a multidimensional context. In physical terms, vulnerability for a region can be strictly defined as a function of the frequency and the size of fires. However, since forest fires induce damages which can be expressed in economic terms, vulnerability can be interpreted from the point of view of economic damages. In the same way, a social interpretation is possible if damages are associated with, for example, the regional distribution of GDP per capita.
Extending the concept of vulnerability means that the attributes in Table 1 with for the case of Greece can be defined in alternative ways. We therefore define the following vulnerability types:
- a.
- Unadjusted physical vulnerability, , and adjusted regional area physical vulnerability, . is the number of fires or the area burned in a given region, and is the same quantity divided by the area of the region. The former quantifies aggregate losses in ecosystem services, while the latter captures losses per regional unit area. Therefore, large regions are relatively less vulnerable in terms of this metric for a similar number of fires or area burned.
- b.
- Economic vulnerability, , defined per regional GDP and obtained by dividing the attribute by the GDP of the region. Regions with relatively higher GDP are less vulnerable in terms of this metric.
- c.
- Social vulnerability, , defined per inhabitant of the region and obtained by dividing the attribute by the population of the region.
- d.
- Socioeconomic vulnerability, , which is obtained by calculating the quantitywhere is the attribute – number of fires or area burned – for region ; is the per capita GDP for region ; is the per capita GDP for Greece; and is the elasticity of the marginal utility of income which reflects society’s aversion to income inequality. Higher values for indicate stronger societal preference for equal income distribution. Typical values for range from 1 to 3. The distributional coefficient indicates that regions with GDP per capita below the national average are relatively more vulnerable than regions with GDP per capita above the national average for the same ratio. For , vulnerability depends only on the relation between the attribute and the regional GDP per capita and is not affected by the relation between the regional GDP per capita and the overall GDP per capita of the country.
- e.
- Vulnerability with respect to regional population density, . Vulnerability per capita that reflects damages from forest fires per person might not provide the whole picture with respect to the effects of the wildfires. This is because, apart from provisioning services and some cultural services, important regulating and supporting services have public good characteristics and their loss affects most or even the whole regional population. Furthermore, the smoke from wildfires also has public good characteristics and in densely populated regions affects relatively more people and therefore generates higher aggregate damages.12 Thus, a region with high population density could experience relatively higher impacts compared to regions with low population density. is defined then as the attribute multiplied by the regional population density (inhabitants per km2).
Combining the nine attributes for the 13 regions of Greece, the six vulnerability indicators were calculated using the TOPSIS method. The data for forest fires for the period 2000–2022 were used, and two sets of vulnerability indices were estimated, one covering the period 2000–2010 and the other the period 2011–2022. Results are shown in Table 2.
The relative vulnerabilities shown in Table 2 suggest that:
- Attica, which is the smallest region in terms of area but the most heavily populated both in terms of absolute number and density and has the highest GDP per capita, is the most vulnerable region in terms of density, , and per unit area, . This exemplifies the public good aspect of damages from wildfires.
- Peloponnese is highly vulnerable in almost every vulnerability type except This indicates that the area-adjusted indices should be interpreted carefully. This is because although the region is vulnerable in most of the indices, it is not vulnerable in the area-adjusted, , because it is a large region.
- Central Greece shows a similar pattern to Peloponnese.
- Eastern Macedonia and Thrace shows higher socioeconomic vulnerability at high preferences for equal distribution (). This suggests that damages in this region disproportionally affect relatively poor communities.
- For Central Greece, the vulnerability of almost all types increased during the period 2011–2022 relative to the previous period.
In order to explore potential links between regional vulnerabilities based on observed data and regional characteristics, we regarded the vulnerabilities estimated in Table 2 for the periods 2000–2010 and 2011–2022 as functions of average regional population density (avg_dens) and/or average regional GDP (avg_gdp). Using panel data with the two periods of time, we performed regression analysis. The results are shown in Table 3.
The results indicate that the relative physical vulnerability increases with average population density (avg_dens) which emphasizes the public good aspect of forest fires since it suggests that the damages from forest fires are diffused to a large population in a given area. The socioeconomic relative vulnerability is shown to decrease with average regional GDP (avg_gdp), but the result is not strongly statistically significant.
3. Climate Change and Expected Forest Fires
The analysis in the previous section used historical data to explore the relative vulnerability of Greek regions in terms of frequency and size of forest fires. In this section the link between forest fires and climate change is explored. Table 4 presents the simple correlation between the number of fires in each category and the Canadian fire weather index (FWI).
The Canadian FWI [31,32] is a measure of forest fire intensity and can be used for the assessment of fire occurrence risk, particularly for large fires [32,33]. The input for its calculation consists of four meteorological input parameters, namely the recent rainfall, temperature, wind speed and relative humidity, as well as information such as the date and latitude [31]. Although it was produced for use in Canada, it has been widely used by scientists across the world for decades, including in the Mediterranean region [34,35,36,37]. FWI data for the period 2000-2022 are derived from the Copernicus Climate Change Service [38]. Table 4 shows the correlation between the number of fires and the FWI for the 13 Greek regions and Greece as a whole for the period 2000–2022.
Table 4 suggests some strong correlations between the FWI and the frequency of fires of a certain size. In order to thoroughly explore the link between forest fires and climate change, a quantitative framework based on the Poisson distribution in which forest fires are treated as arrivals of events was adopted. Climate change is captured by the evolution of average summer and spring regional temperature and precipitation during the period 2000–2022, which are used as explanatory variables. Both summer and spring regional temperature and precipitation averages are calculated from ERA-5 gridded reanalysis data [39]. The objective here is to model the arrival of forest fires in Greece from relatively small to big, so we focus on fires that burned more than 10, 50, and 100 hectares.
More specifically, in the context of Poisson regression analysis, the dependent variable or outcome is the annual number of fires that burned an area in excess of a set threshold, which is a non-negative integer. In Poisson regression, the underlying probability distribution of the dependent variable is assumed to be Poisson, which is a discrete distribution commonly used to model measurements of events occurring during a time interval. The dependent variable can take any non-negative integer value. Poisson distribution has only one parameter equal to the mean value and the variance. The distribution is given by the relationship:
The aim of the Poisson regression (PR), in our case, is to adapt the observed data on the annual occurrence of forest fires to a regression equation which models the expected value of the dependent variable . This expected value is a function of an vector of explanatory variables and regression parameters . In this case,
where is the number of fires expected in a year for given values of the explanatory variables . The calendar year is used, given that in Greece most fires occur during the hot and dry period, i.e., mostly from May to October. From (4), a unit change in will change the expected number of forest fires by keeping all other explanatory variables constant.
As it is well known, when the variance of the dependent variable of the dataset statistically exceeds the corresponding mean, that is, when overdispersion is present, then the negative binomial regression is regarded as the appropriate estimation method [40]. In this model the expected value is defined as
with and When underdispersion is present, the generalized Poisson (GPR) regression can be used [41]. When there is an excess number of zeros for the dependent variable, which is a possible case if we use annual data for large regional wildfires, then the zero-inflated Poisson regression (ZIPR) or zero-inflated negative binomial (ZINB) regression can be used (see [40], Chapter 9.6, and the STATA manual for details).
3.1. Results
3.1.1. Greece
A description of the variables for the aggregate data for Greece is shown in Table 5. N100, N50, and N10 correspond to forest fires that burned more than 100, 50, and 10 hectares per year respectively. The explanatory variables for summer and spring were denoted respectively as , for temperature in degrees Celsius, and for precipitation in mm.
Table 6 presents the results of the regression analysis for fires that burned more than 10, 50, and 100 hectares. The data for observed forest fires are connected to the climate data. Subsequently, the established relationships are used to project the change in event occurrence for the three fire classes in the future. Climatic projections were based on an ensemble of climate simulations. Specifically, seven combinations of global circulation models (GCMs) and regional climate models (RCMs) were used. The names of the models are provided in Appendix C. The simulations participated in the EURO-CORDEX experiment [42] and they used the EUR-11 domain which has a spatial resolution of 0.11 x 0.11 (approx. 12.5 km x 12.5 km). The simulations were used to produce data for the climate change in two future periods, the near future (2031–2060) and the far future (2071–2100) under the RCP4.5 and RCP8.5 greenhouse gases concentration scenarios, relative to the reference period (1971–2000).
The RCP scenarios were the main source of input on greenhouse gases (GHGs) concentrations for the IPCC Fifth Assessment Report [2]. The report states that RCP4.5 is considered to be “intermediate” while RCP8.5 is considered a “very high GHG emissions scenario”. However, Schwalm et al. [43] found that the RCP8.5 scenario was at the moment in close agreement with GHG emissions and that it was the best match with the governmental stated policies for the following years.
The results suggest that mean summer temperature is positively related to the arrival of wildfires of any category, while both the summer and the spring precipitation are negatively related to the number of fires. The spring mean temperature did not seem to have any statistically significant effect on the arrival of wildfires. Also, a dummy variable used to capture the impact of the new legal framework about forests introduced in 2014 was highly insignificant.
The predictions of expected forest fires in all categories indicate an increase relative to the mean number of fires during the sample period (2000–2022) for both the RCP4.5 and the RCP8.5 scenarios. The highest percentage increase is recorded for fires that burned more than 50 hectares, followed by fires that burned more than 100 hectares.
To account for heterogeneities across regions, we analyzed the balanced panel of all 13 regions with years (2000–2022), regions, and observations in total, with dependent variable N100 to concentrate on relatively big forest fires.
Figure 5 provides a scatter plot of the panel data that shows the number of fires versus temperatures and precipitation along with a fitted line. The results suggest a positive relation between number of fires and temperature for summer, and a negative relation between number of fires and precipitation. The relationship between forest fires and spring temperature is ambiguous.
For the panel data, fixed-effects estimation was used to allow for arbitrary correlation between unobserved effects, which may reflect region-specific characteristics and the observed climate variables [44]. In this sense, the fixed-effects model controls for all time-invariant differences between regions, so the estimated coefficients of the fixed-effects models cannot be biased because of omitted time-invariant characteristics [45]. The pooled data was also used with pooled feasible generalized least-squares estimation denoted by the PA estimator.13 In the panel data the ratio of the standard deviation over the mean for the outcome variable N100 was . In order to consider overdispersion effects, a negative binomial regression was used. In addition, the panel data contain a large number of zeros (45.8%) which represent cases of zero fires. To allow for this, we provide estimates of the pooled data using ZINB.
Estimation results for the aggregate data and the panel data are shown in Table 7. Results are presented for the panel of all 13 regions and for a panel of 9 regions with a low proportion of zero N100 fires (fewer than 65%). The results suggest that the main drivers of the forest fires that burned more than 100 hectares are the average summer temperature and the average precipitation in the summer and spring. The impact of the spring precipitation is interesting since it suggests that spring precipitation can be used as an early warning signal for policy design to prevent wildfires.
The intercept of the fixed-effects model can be interpreted as the average of the individual regional effects. The term is statistically significant, which indicates significant regional effects.
3.1.2. Greek Regions
The results of the previous section suggest that the forest fires have a statistically significant relationship with summer temperature and with spring and summer precipitation. They also suggest that individual regional effects are significant. To explore in more detail the heterogeneity among regions, individual Poisson or negative binomial regressions were estimated for the 9 regions with low proportion of zero N100 fires counts. The results are summarized in Table 8.
The results confirm that the main climatic drivers are summer temperature and summer and spring precipitation. A dummy variable used to capture the impact of the new legal framework about forests introduced in 2014 was highly insignificant.
Based on the results of Table 8, for the period 2031–2060 and under RCP4.5 scenario, for 6 out of the 9 regions, namely Attica, Central Greece, Central Macedonia, Eastern Macedonia & Thrace, Peloponnese and Western Macedonia, the average expected number of fires annually are expected to increase by more than 40% relative to the reference period (1971–2000). Although these are approximate estimates, they suggest that the number of fires that will burn more than 50 or 100 hectares is expected to increase along with the evolution of climate change. This will most likely increase the vulnerability of the regions to forest fires. The results are more pessimistic for the second future period (1971–2100) and for the “more aggressive” – in terms of emission and temperature anomaly – RCP8.5 scenario.
4. Conclusions
This paper studied forest fires in Greece in two different contexts. The first was the study of vulnerability using historical data on forest fires. The second was the use of the same historical data and count regression techniques to link climate change in Greece with the emergence of forest fires and make predictions for the future using IPCC scenarios.
The relative vulnerability of the Greek regions to forest fires was estimated based on data on forest fires between 2000 and 2022. Using the frequency and size of fires in each region, nine physical attributes were determined and then, by expressing them in relation to regional area, population, GDP, GDP distribution and population density, different vulnerability concepts were defined. Using the multicriteria decision method TOPSIS, relative vulnerabilities were determined for all regions. For the most recent period of 2011–2022, the relatively most vulnerable regions were found to be Attica, Central Greece, and Peloponnese. These are the southernmost regions of continental Greece, and therefore the ones with the most distinctly Mediterranean climate. Eastern Macedonia and Thrace was found to be the relatively most vulnerable region in terms of distributional considerations. This result suggests the need for regional distributional policies associated with compensating for damages from forest fires which are diffused to the general population of the region. These damages are not strictly local in the sense of directly affecting local populations associated with provisioning services, but have public good characteristics and relate to more general diffusive ecosystem services. Panel regression analysis suggests that between the periods 2000–2010 and 2011–2022, average vulnerability increased with regional population density and decreased with regional GDP. The result regarding population density stresses the public good dimension of damages from forest fires.
The forest fire events were linked with the weather variables of summer and spring average temperature and precipitation. The focus was on fires that burned more than 100 hectares (N100) as it was demonstrated that they were responsible for the greatest part of burned land. Scatter plots indicated a positive relationship between N100 and summer temperature, and a negative relationship between N100 and summer and spring precipitation. Correlation analysis between the forest fire weather index and the number of forest fires also shows a positive correlation for some of the most relatively vulnerable regions.
Poisson and negative binomial regression analysis confirmed the scatter plot analysis and indicated that the main drivers for forest fire events for Greece as a whole were summer temperature and summer and spring precipitation. The use of panel data indicated heterogeneity among regions regarding the forest fire events and the climate variables. Regression analysis of distinct regions confirmed the heterogeneity as well as the main climatic drivers. Projections of forest fires under the RCP4.5 and RCP8.5 scenarios were also obtained.
The most important findings of this paper include the identification of the relative vulnerability of Greek regions to forest fires that occurred during the period 2000–2022 and the use of this data to predict the arrival of relatively large forest fires according to the IPCC scenarios. The importance of spring precipitation as a driver of forest fires provides an “early warning” signal that can be used for policy design. Predictions regarding future fires suggest that the regions which were relatively more vulnerable during the period 2000–2022 will remain vulnerable in the future. This result can provide some guidance for targeted regional policies in the context of climate change. Such policies could be infrastructure development as part of adaptation policies to climate change, or the creation of carbon offsets and associated voluntary carbon markets supported by carbon sequestration in protected forests in Greece. Such policies would be preserving components of natural capital related to forests and promoting sustainability.
Appendix A. The Regions of Greece
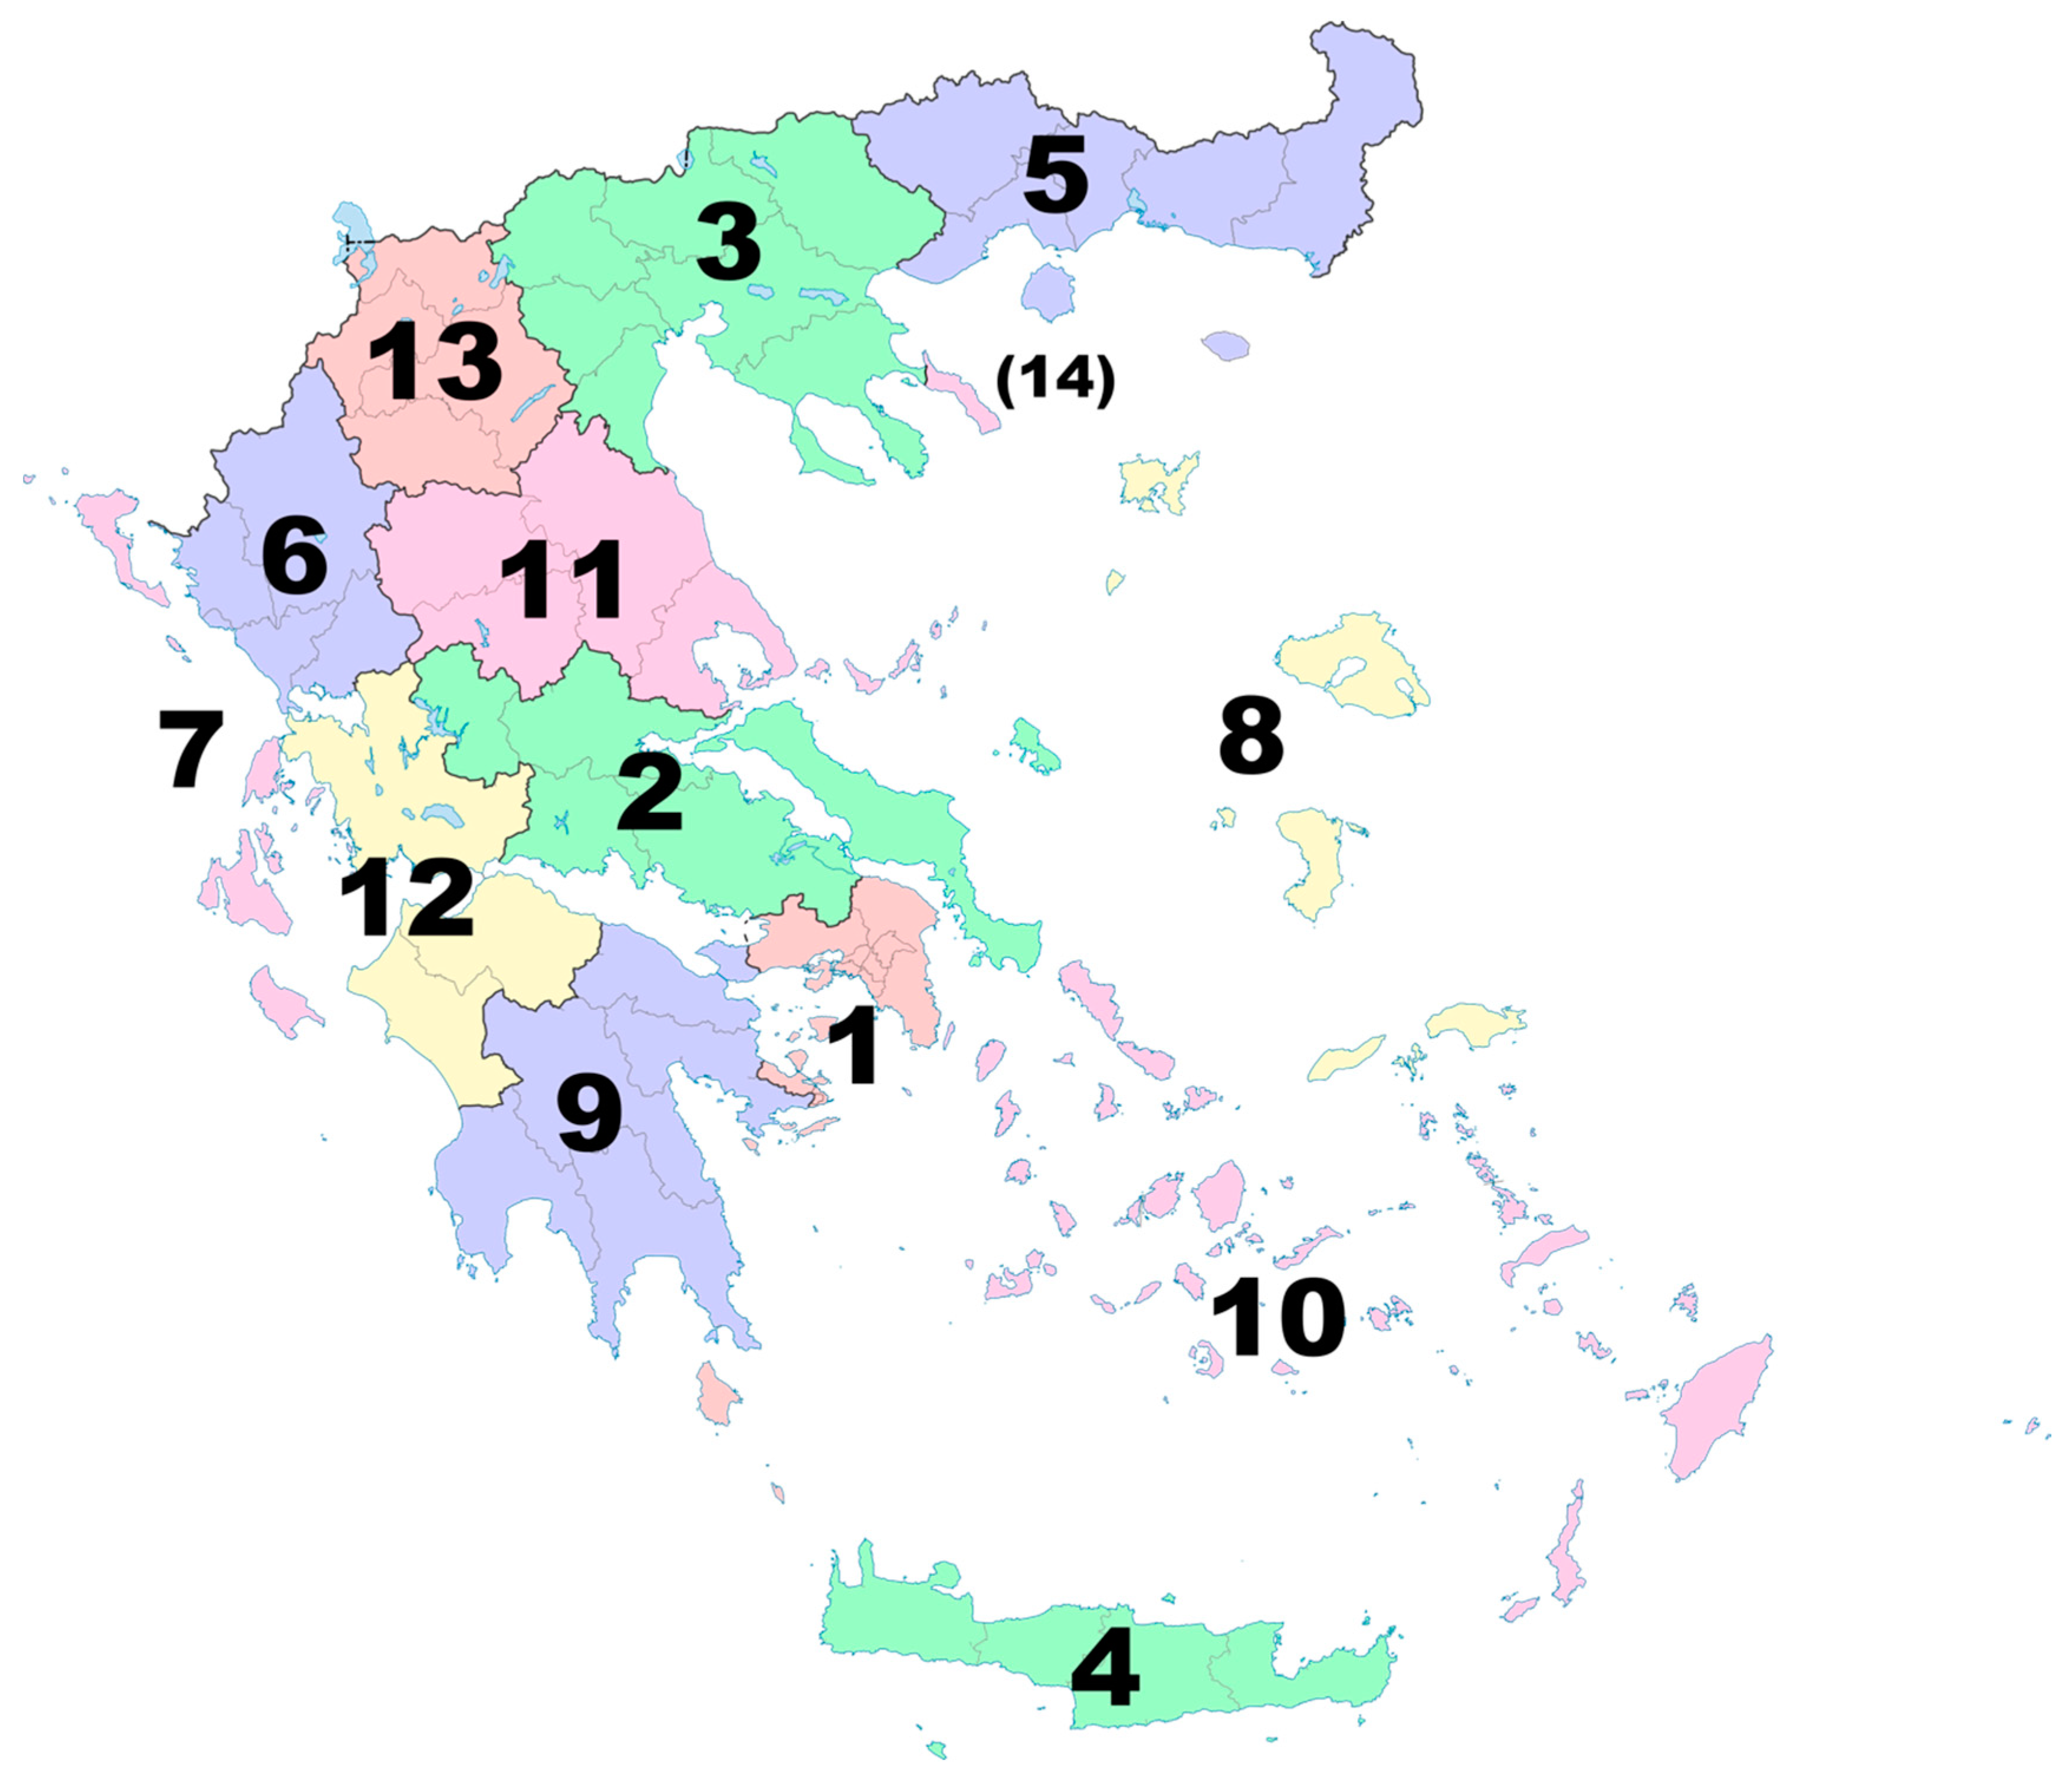
1. Attica, 2. Central Greece, 3. Central Macedonia, 4. Crete, 5. Eastern Macedonia and Thrace, 6. Epirus, 7. Ionian Islands, 8. North Aegean, 9. Peloponnese, 10. South Aegean, 11. Thessaly, 12. Western Greece, 13. Western Macedonia, (14) Monastic community of Mount Athos. Source: https://en.wikipedia.org/wiki/Regions_of_Greece
Appendix B. Area Burned and Number of Forest Fires in Greece
Appendix C. The Climate Simulations

| Simulation name | RCM | GCM |
| CNRM-CERFACS-CNRM-CM5_KNMI-RACMO22E | RACMO22E | CNRM-CM5 |
| ICHEC-EC-EARTH_CLMcom-CCLM4 | CLM4 | EC-Earth |
| ICHEC-EC-EARTH_DMI-HIRHAM5 | HIRHAM5 | EC-Earth |
| MOHC-HadGEM2-ES_KNMI-RACMO22E | RACMO22E | HadGEM2-ES |
| MOHC-HadGEM2-ES_SMHI-RCA4 | RCA4 | HadGEM2-ES |
| MPI-M-MPI-ESM-LR_MPI-CSC-REMO2009 | REMO2009 | MPI-ESM-LR |
| MPI-M-MPI-ESM-LR_SMHI-RCA4 | RCA4 | MPI-ESM-LR |
| 1 | For a general view of the impacts of fire on forests, see e.g., [6]. |
| 2 | For a general discussion of the value of ecosystem services, see for example, [15]. |
| 3 | Mediterranean forests are, in general, characterized by low timber productivity due to the climate and poor pasture production [16]. |
| 4 | The non-declining productive base consists of the sum of produced, human, and natural capital, valued at appropriate accounting prices. |
| 5 | For a detailed analysis of MCDM methods, see, e.g., [21,22]. |
| 6 | For a detailed description of the regions, see Appendix 1. |
| 7 | If an element of the normalization matrix is zero, then the corresponding term of the sum in the definition of will be zero since . |
| 8 | Graphs for the rest of the regions are presented in Appendix 2. |
| 9 | The total area burned for the whole region includes the small fires that burned between 0 and 0.1 km2. |
| 10 | The smoke from wildfires contains carbon dioxide and pollutants such as carbon monoxide, volatile organic compounds, hydrocarbons, nitrogen, and particulate matter including that which is smaller than 2.5 micrometers in diameter (PM2.5). |
| 11 | |
| 12 | The study of the diffusion of smoke from wildfires which could affect neighboring regions is beyond the scope of the present paper. |
| 13 | STATA was used for all the econometric estimations. For details of the methods used see [30]. |
References
- IPCC. Climate Change 2022: Impacts, Adaptation and Vulnerability. Working Group II Contribution to the IPCC Sixth Assessment Report, Pörtner, H.-O.; Roberts, D.C., Tignor, M., Poloczanska, E.S., Mintenbeck, K., Alegría, A., Craig, M., Langsdorf, S., Löschke, S., Möller, V., Okem, A., Rama, B., Eds.; Cambridge University Press: Cambridge, UK; New York, NY, USA, 2022. [Google Scholar]
- IPCC. Climate Change 2014: Synthesis Report. Contribution of Working Groups I, II and III to the Fifth Assessment Report of the Intergovernmental Panel on Climate Change, Core Writing Team, Pachauri, R.K.; Meyer, L.A., Ed.; IPCC: Geneva, Switzerland, 2014. [Google Scholar]
- Abatzoglou, J.T.; Williams, A.P.; Barbero, R. Global emergence of anthropogenic climate change in fire weather indices. Geophys. Res. Lett. 2019, 46, 326–336. [Google Scholar] [CrossRef]
- Jones, M.W.; Smith, A.; Betts, R.; Canadell, J.G.; Prentice, I.C.; Le Quéré, C. Climate change increases the risk of wildfires. ScienceBrief Review 2020, 116. [Google Scholar]
- 5. Pronto et al., 2023, Research for REGI Committee-Forest Fires of Summer 2022, European Parliament, Policy Department for Structural and Cohesion Policies, Brussels. Available online: https://www.europarl.europa.eu/RegData/etudes/STUD/2023/747280/IPOL_STU(2023)747280_EN.pdf (accessed 2 January 2024).
- Robinne, F.-N. Impacts of disasters on forests, in particular forest fires. UNFFS Background paper. 2021. Available online: https://www.un.org/esa/forests/wp-content/uploads/2021/08/UNFF16-Bkgd-paper-disasters-forest-fires_052021.pdf (accessed on 10 November 2021).
- Arianoutsou et al., 2023. Climate change and resilience of forest ecosystems. In Resilience of Forest Ecosystems of Greece to Climate Change; Committee for the Resilience of the Greek Forest Ecosystems to Climate Change (EADO); Arianoutsou, M.; Zerefos, C.; Kalabokidis, K.; Poupkou, A.; Aravanopoulos, F., Eds.; Academy of Athens, Athens, Greece, 2023.
- Kassomenos, P. Synoptic circulation control on wild fire occurrence. Phys. Chem. Earth, Parts A/B/C 2010, 35, 544–552. [Google Scholar] [CrossRef]
- Papadopoulos, A.; Paschalidou, A.K.; Kassomenos, P.A.; McGregor, G. Investigating the relationship of meteorological/climatological conditions and wildfires in Greece. Theor. Appl. Climatol. 2013, 112, 113–126. [Google Scholar] [CrossRef]
- Koutsias, N.; Xanthopoulos, G.; Founda, D.; Xystrakis, F.; Nioti, F.; Pleniou, M.; Mallinis, G.; Arianoutsou, M. On the relationships between forest fires and weather conditions in Greece from long-term national observations (1894–2010). Int. J. Wildland Fire 2012, 22, 493–507. [Google Scholar] [CrossRef]
- Sarris, D.; Christopoulou, A.; Angelonidi, E.; Koutsias, N.; Fulé, P.Z.; Arianoutsou, M. Increasing extremes of heat and drought associated with recent severe wildfires in southern Greece. Reg. Environ. Change 2014, 14, 1257–1268. [Google Scholar] [CrossRef]
- Millennium Ecosystem Assessment. Ecosystems and Human Well-being: Synthesis; Island Press: Washington, DC, USA, 2005. [Google Scholar]
- TEEB. The Economics of Ecosystems and Biodiversity. Ecological and Economic Foundations, Kumar, P., Ed.; Earthscan: London and Washington, 2010.
- De Groot, R.; Brander, L.; Solomonides, S. Ecosystem Services Valuation Database (ESVD) Version June 2020.
- Costanza, R.; De Groot, R.; Sutton, P.; Van der Ploeg, S.; Anderson, S.J.; Kubiszewski, I.; Farber, S.; Turner, R.K. Changes in the global value of ecosystem services. Glob. Environ. Change 2014, 26, 152–158. [Google Scholar] [CrossRef]
- Enríquez-de-Salamanca, Á. Valuation of ecosystem services: A source of financing Mediterranean loss-making forests. Small-scale For. 2023, 22, 167–192. [Google Scholar] [CrossRef]
- Xepapadeas, A. Cost-benefit analysis of the increase in the resilience of Forests. In Resilience of Forest Ecosystems of Greece to Climate Change; Committee for the Resilience of the Greek Forest Ecosystems to Climate Change (EADO); Arianoutsou, M.; Zerefos, C.; Kalabokidis, K.; Poupkou, A.; Aravanopoulos, F., Eds.; Academy of Athens, Athens, Greece, 2023.
- Arrow, K.J.; Dasgupta, P.; Goulder, L.H.; Mumford, K.J.; Oleson, K. Sustainability and the measurement of wealth. Environ. Dev. Econ. 2012, 17, 317–353. [Google Scholar] [CrossRef]
- Thomson, A.M.; Calvin, K.V.; Smith, S.J.; Page Kyle, G.; Volke, A.; Patel, P.; Delgado-Arias, S.; Bond-Lamberty, B.; Wise, M.A.; Clarke, L.E.; et al. RCP4.5: A pathway for stabilization of radiative forcing by 2100. Clim. Change 2011, 109, 77. [Google Scholar] [CrossRef]
- Riahi, K.; Rao, S.; Krey, V.; Cho, C.; Chirkov, V.; Fischer, G.; Kindermann, G.; Nakicenovic, N.; Rafaj, P. RCP 8.5—A scenario of comparatively high greenhouse gas emissions. Clim. Change 2011, 109, 33. [Google Scholar] [CrossRef]
- Triantaphyllou, E. Multi-criteria decision making methods. In Multi-criteria Decision Making Methods: A Comparative Study; Applied Optimization, vol. 44; Springer: Boston, MA, USA, 2000; pp. 5–21. [Google Scholar]
- Papathanasiou, J.; Ploskas, N. Multiple Criteria Decision Aid. Methods, Examples and Python Implementations; Springer Nature: Switzerland, 2018. [Google Scholar]
- Huang, J. Combining entropy weight and TOPSIS method for information system selection. 2008 IEEE Conference on Cybernetics and Intelligent Systems, 2008, pp. 1281–1284.
- Kim, Y.; Chung, E.S. Assessing climate change vulnerability with group multi-criteria decision making approaches. Clim. Change 2013, 121, 301–315. [Google Scholar] [CrossRef]
- Andersen, L.M.; Sugg, M.M. Geographic multi-criteria evaluation and validation: A case study of wildfire vulnerability in Western North Carolina, USA following the 2016 wildfires. Int. J. Disaster Risk Sci. 2019, 39, 101123. [Google Scholar] [CrossRef]
- Gould, C.F.; Heft-Neal, S.; Johnson, M.; Aguilera, J.; Burke, M.; Nadeau, K. Health effects of wildfire smoke exposure. Ann. Rev. Med. 2023, 75, 277–292. [Google Scholar] [CrossRef] [PubMed]
- Zhang, Y.; Workman, A.; Russell, M.A.; Williamson, M.; Pan, H.; Reifels, L. The long-term impact of bushfires on the mental health of Australians: A systematic review and meta-analysis. Eur. J. Psychotraumatol. 2022, 13, 2087980. [Google Scholar] [CrossRef] [PubMed]
- OECD. Cost-Benefit Analysis and the Environment: Further Developments and Policy Use; OECD Publishing: Paris, France, 2018. [Google Scholar]
- Im, U.; Brandt, J.; Geels, C.; Hansen, K.M.; Christensen, J.H.; Andersen, M.S.; Solazzo, E.; Kioutsioukis, I.; Alyuz, U.; Balzarini, A.; et al. Assessment and economic valuation of air pollution impacts on human health over Europe and the United States as calculated by a multi-model ensemble in the framework of AQMEII3. Atmos. Chem. Phys. 2018, 18, 5967–5989. [Google Scholar] [CrossRef] [PubMed]
- Cameron, A.C.; Trivedi, P.K. Microeconometrics using Stata, Vols. 1,2, 2nd ed.; Stata Press: College Station, TX, USA, 2022. [Google Scholar]
- Van Wagner, C.E. Development and structure of the Canadian Forest Fire Weather Index System. Canadian Forestry Service: Ottawa, Ontario, Canada. Canadian Forestry Technical Report 35, 1987.
- Stocks, B.J.; Lawson, B.D.; Alexander, M.E.; Wagner, C.V.; McAlpine, R.S.; Lynham, T.J.; Dube, D.E. The Canadian forest fire danger rating system: An overview. The Forestry Chronicle 1989, 65, 450–457. [Google Scholar] [CrossRef]
- Viegas, D.X.; Bovio, G.; Ferreira, A.; Nosenzo, A.; Sol, B. Comparative study of various methods of fire danger evaluation in southern Europe. Int. J. Wildland Fire 1999, 9, 235–246. [Google Scholar] [CrossRef]
- Moriondo, M.; Good, P.; Durao, R.; Bindi, M.; Giannakopoulos, C.; Corte-Real, J. Potential impact of climate change on fire risk in the Mediterranean area. Clim. Res. 2006, 31, 85–95. [Google Scholar] [CrossRef]
- Good, P.; Moriondo, M.; Giannakopoulos, C.; Bindi, M. The meteorological conditions associated with extreme fire risk in Italy and Greece: Relevance to climate model studies. Int. J. Wildland Fire 2008, 17, 155–165. [Google Scholar] [CrossRef]
- Rovithakis, A.; Grillakis, M.G.; Seiradakis, K.D.; Giannakopoulos, C.; Karali, A.; Field, R.D.; Lazaridis, M.; Voulgarakis, A. Future climate change impact on wildfire danger over the Mediterranean: The case of Greece. Environ. Res. Lett. 2022, 17, 045022. [Google Scholar] [CrossRef]
- Kapsomenakis, J.; Douvis, C.; Poupkou, A.; Zerefos, S.; Solomos, S.; Stavraka, T.; Melis, N.S.; Kyriakidis, E.; Kremlis, G.; Zerefos, C. Climate change threats to cultural and natural heritage UNESCO sites in the Mediterranean. Environ. Dev. Sustain. 2023, 25, 14519–14544. [Google Scholar] [CrossRef]
- Copernicus Climate Change Service, Climate Data Store. Fire danger indices historical data from the Copernicus Emergency Management Service. Copernicus Climate Change Service (C3S) Climate Data Store (CDS), 2019. [CrossRef]
- Hersbach, H.; Bell, B.; Berrisford, P.; Biavati, G.; Horányi, A.; Muñoz Sabater, J.; Nicolas, J.; Peubey, C.; Radu, R.; Rozum, I. ERA5 hourly data on pressure levels from 1940 to present; Copernicus Climate Change Service (C3S) Climate Data Store (CDS), 2023. [CrossRef]
- Long, J.S.; Freese, J. Regression Models for Categorical Dependent Variables using Stata, 3rd ed.; Stata Press, 2014.
- Hilbe, J.M. Negative Binomial Regression, 2nd ed.; Cambridge University Press: Cambridge, UK, 2011. [Google Scholar]
- Jacob, D.; Petersen, J.; Eggert, B.; Alias, A.; Bøssing Christensen, O.; Bouwer, L.M.; Braun, A.; Colette, A.; Déqué, M.; Georgievski, G.; et al. EURO-CORDEX: new high-resolution climate change projections for European impact research. Reg. Environ. Change 2014, 14, 563–578. [Google Scholar] [CrossRef]
- Schwalm, C.R.; Glendon, S.; Duffy, P.B. RCP8.5 tracks cumulative CO2 emissions. Proc. Natl Acad. Sci. U.S.A. 2020, 117, 19656–19657. [Google Scholar] [CrossRef] [PubMed]
- Wooldridge, J.M. Econometric Analysis of Cross Section and Panel Data, 2nd ed; The MIT Press: Cambridge, MA, USA, 2010. [Google Scholar]
- Kohler, U.; Kreuter, F. Data Analysis using Stata, 3rd ed.; Stata Press, 2012.
Figure 1.
Annual number of forest fires in Greece, 2000–2022. Source: The Fire Service of Greece, https://www.fireservice.gr/el_GR/synola-dedomenon.
Figure 1.
Annual number of forest fires in Greece, 2000–2022. Source: The Fire Service of Greece, https://www.fireservice.gr/el_GR/synola-dedomenon.
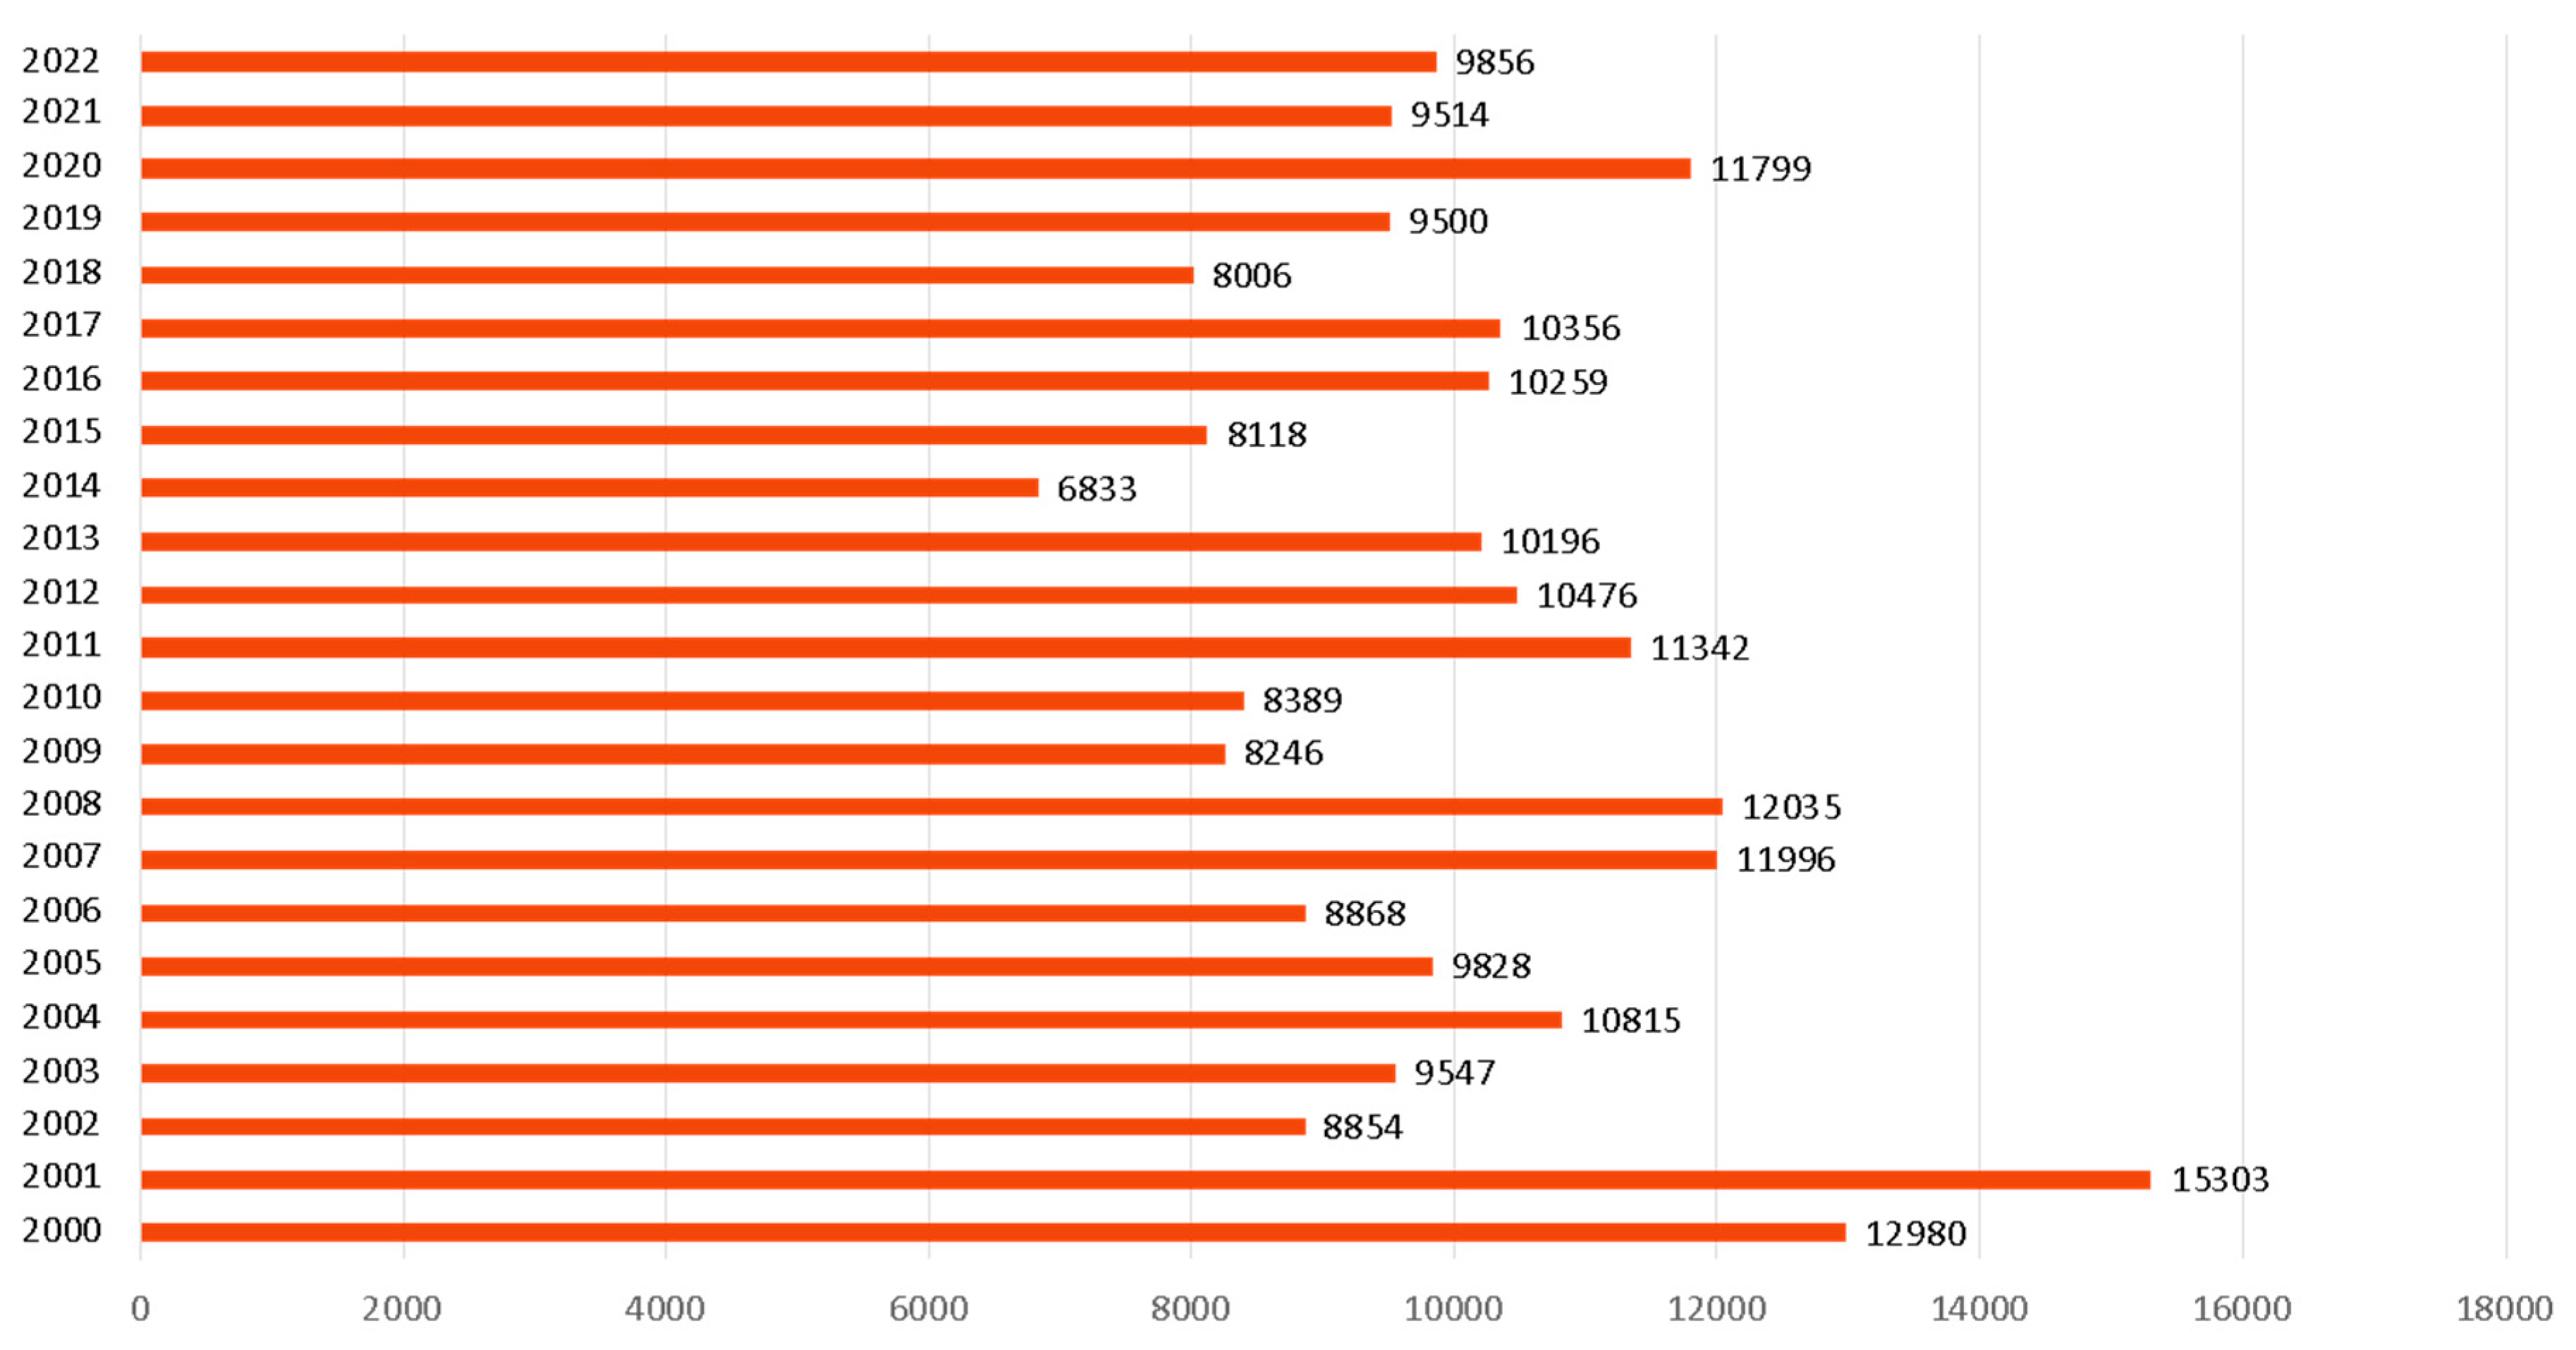
Figure 2.
Area burned by forest fires in Greece, 2000–2022, per year and per size category. Source: Data from The Fire Service of Greece and own calculations.
Figure 2.
Area burned by forest fires in Greece, 2000–2022, per year and per size category. Source: Data from The Fire Service of Greece and own calculations.
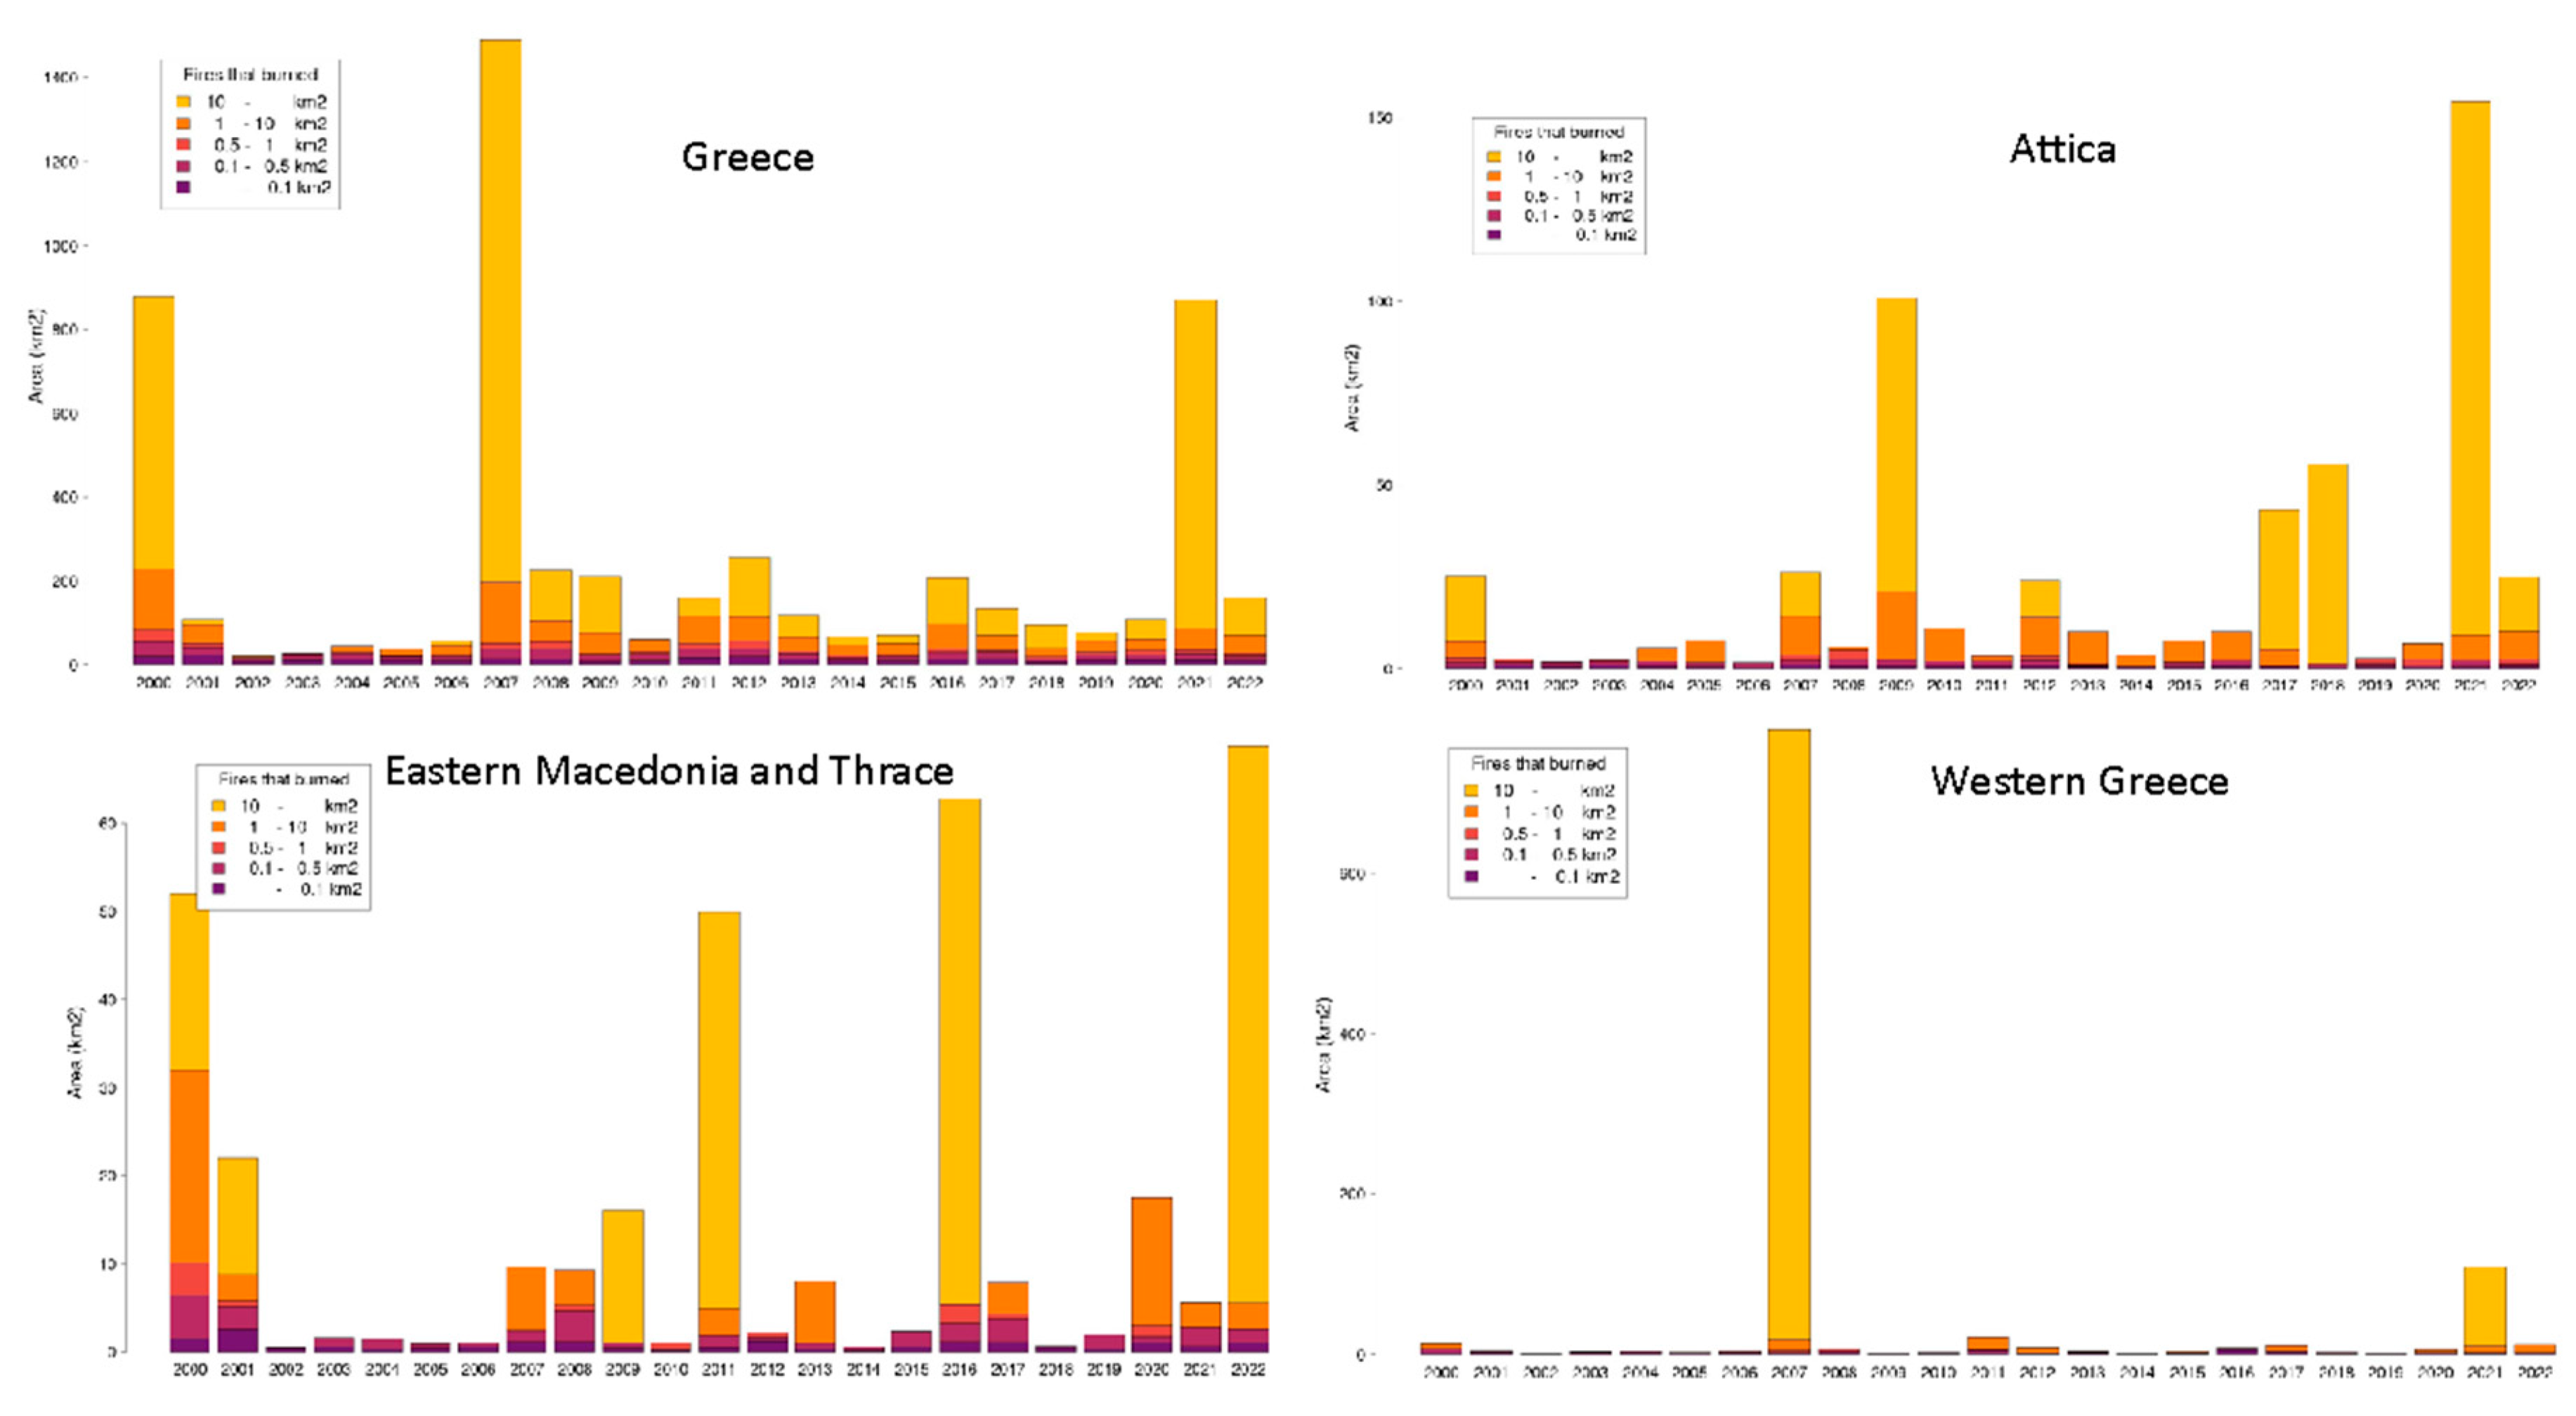
Figure 3.
Number of fires per fire category in Greece, 2000–2022. Source: Data from The Fire Service of Greece and own calculations.
Figure 3.
Number of fires per fire category in Greece, 2000–2022. Source: Data from The Fire Service of Greece and own calculations.
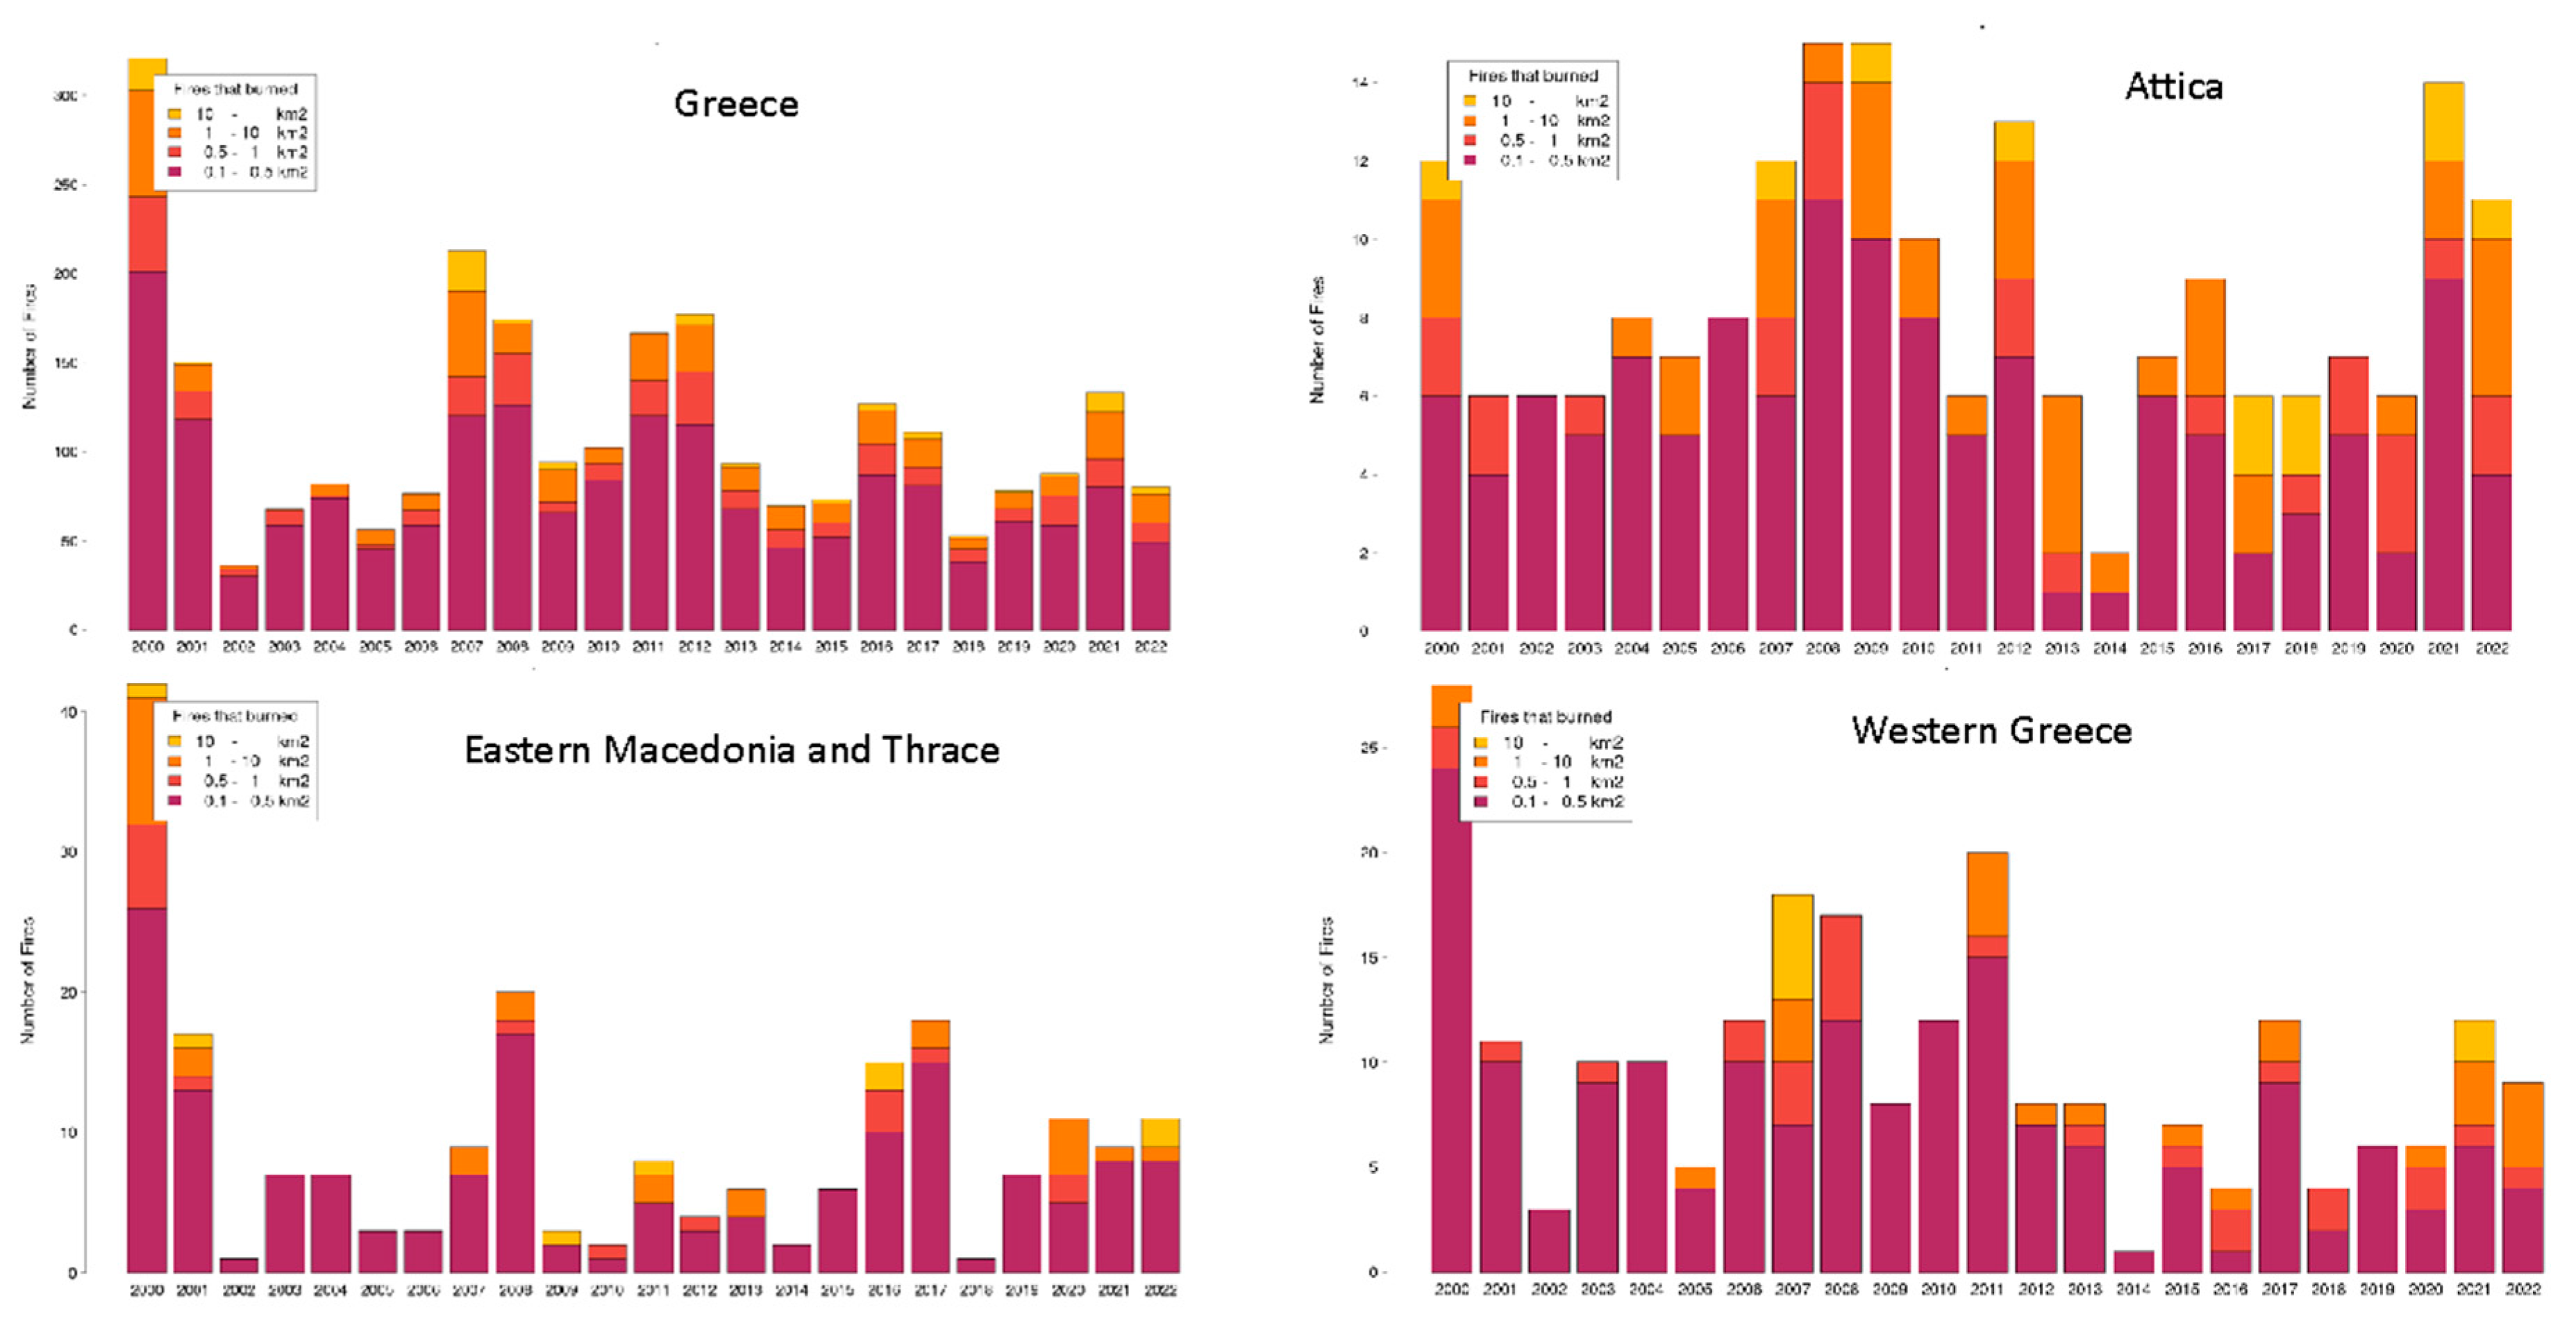
Figure 4.
Area burned and number of fires for each category of fire in Greece, 2000–2022. Source: Data from The Fire Service of Greece and own calculations.
Figure 4.
Area burned and number of fires for each category of fire in Greece, 2000–2022. Source: Data from The Fire Service of Greece and own calculations.
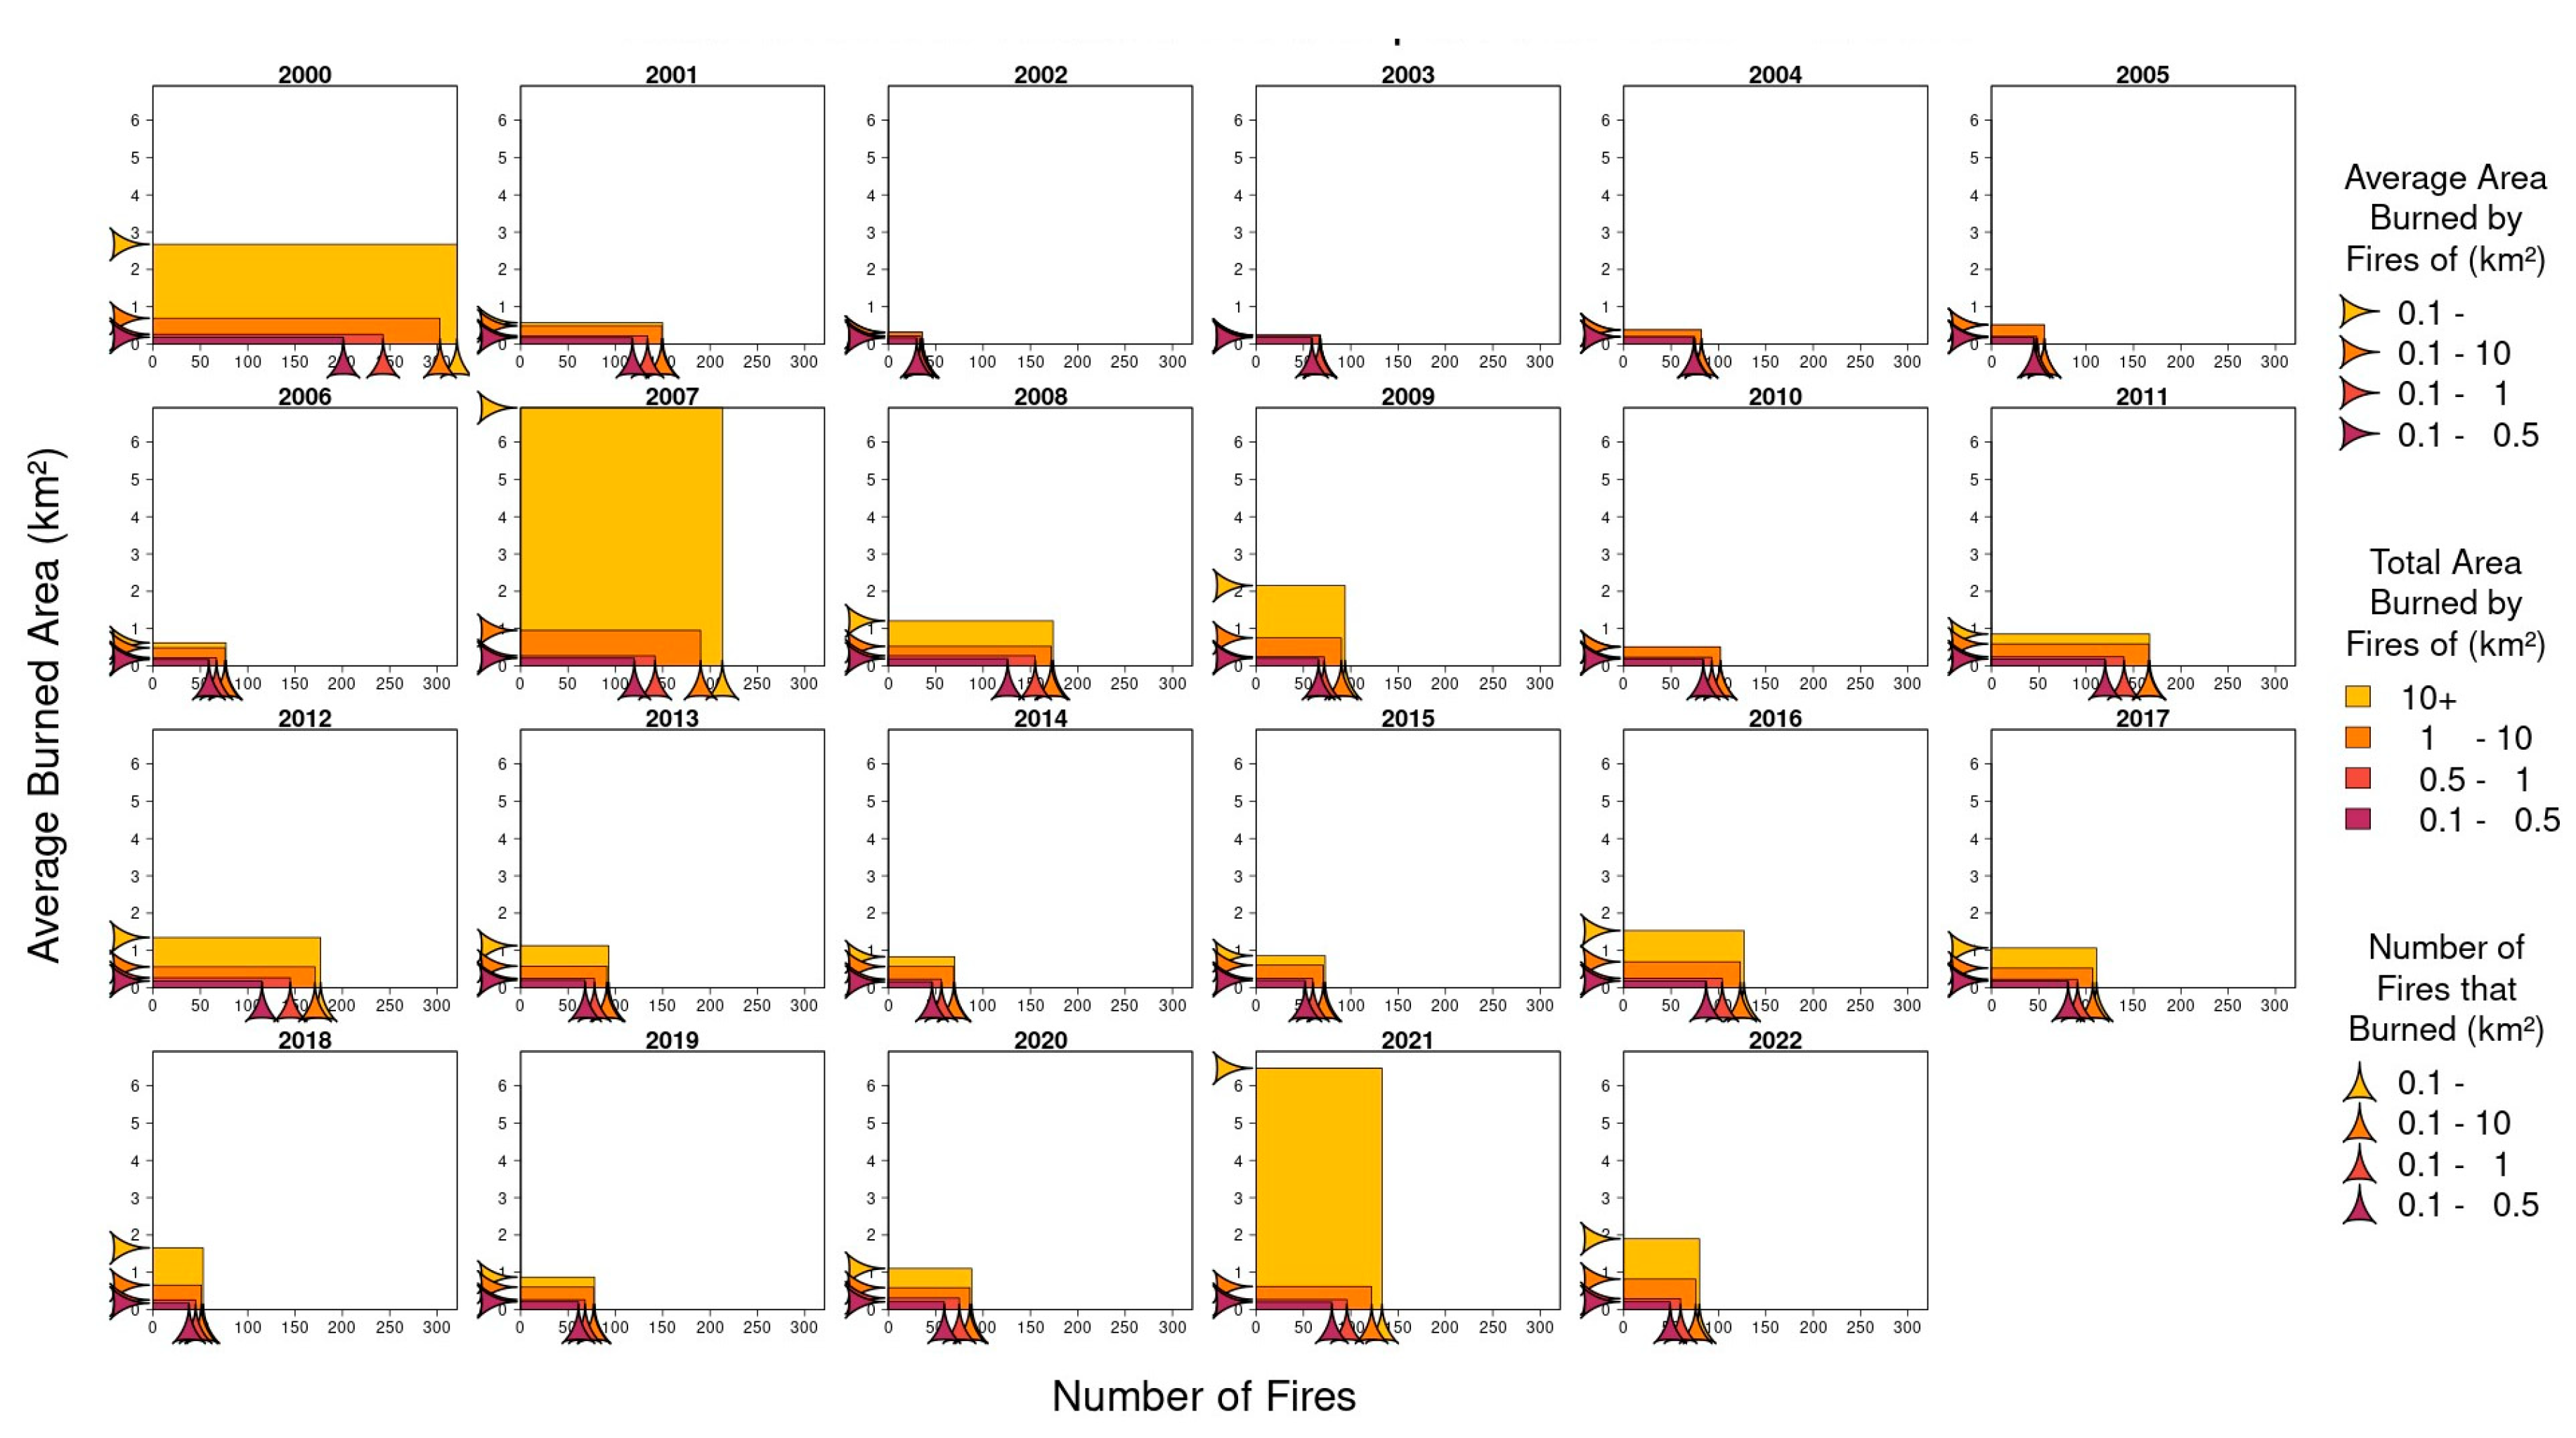
Figure 5.
Number of forest fires that burned more than 100 hectares versus: (a) average summer temperature; (b) average summer precipitation; (c) average spring temperature; (d) average spring precipitation.
Figure 5.
Number of forest fires that burned more than 100 hectares versus: (a) average summer temperature; (b) average summer precipitation; (c) average spring temperature; (d) average spring precipitation.
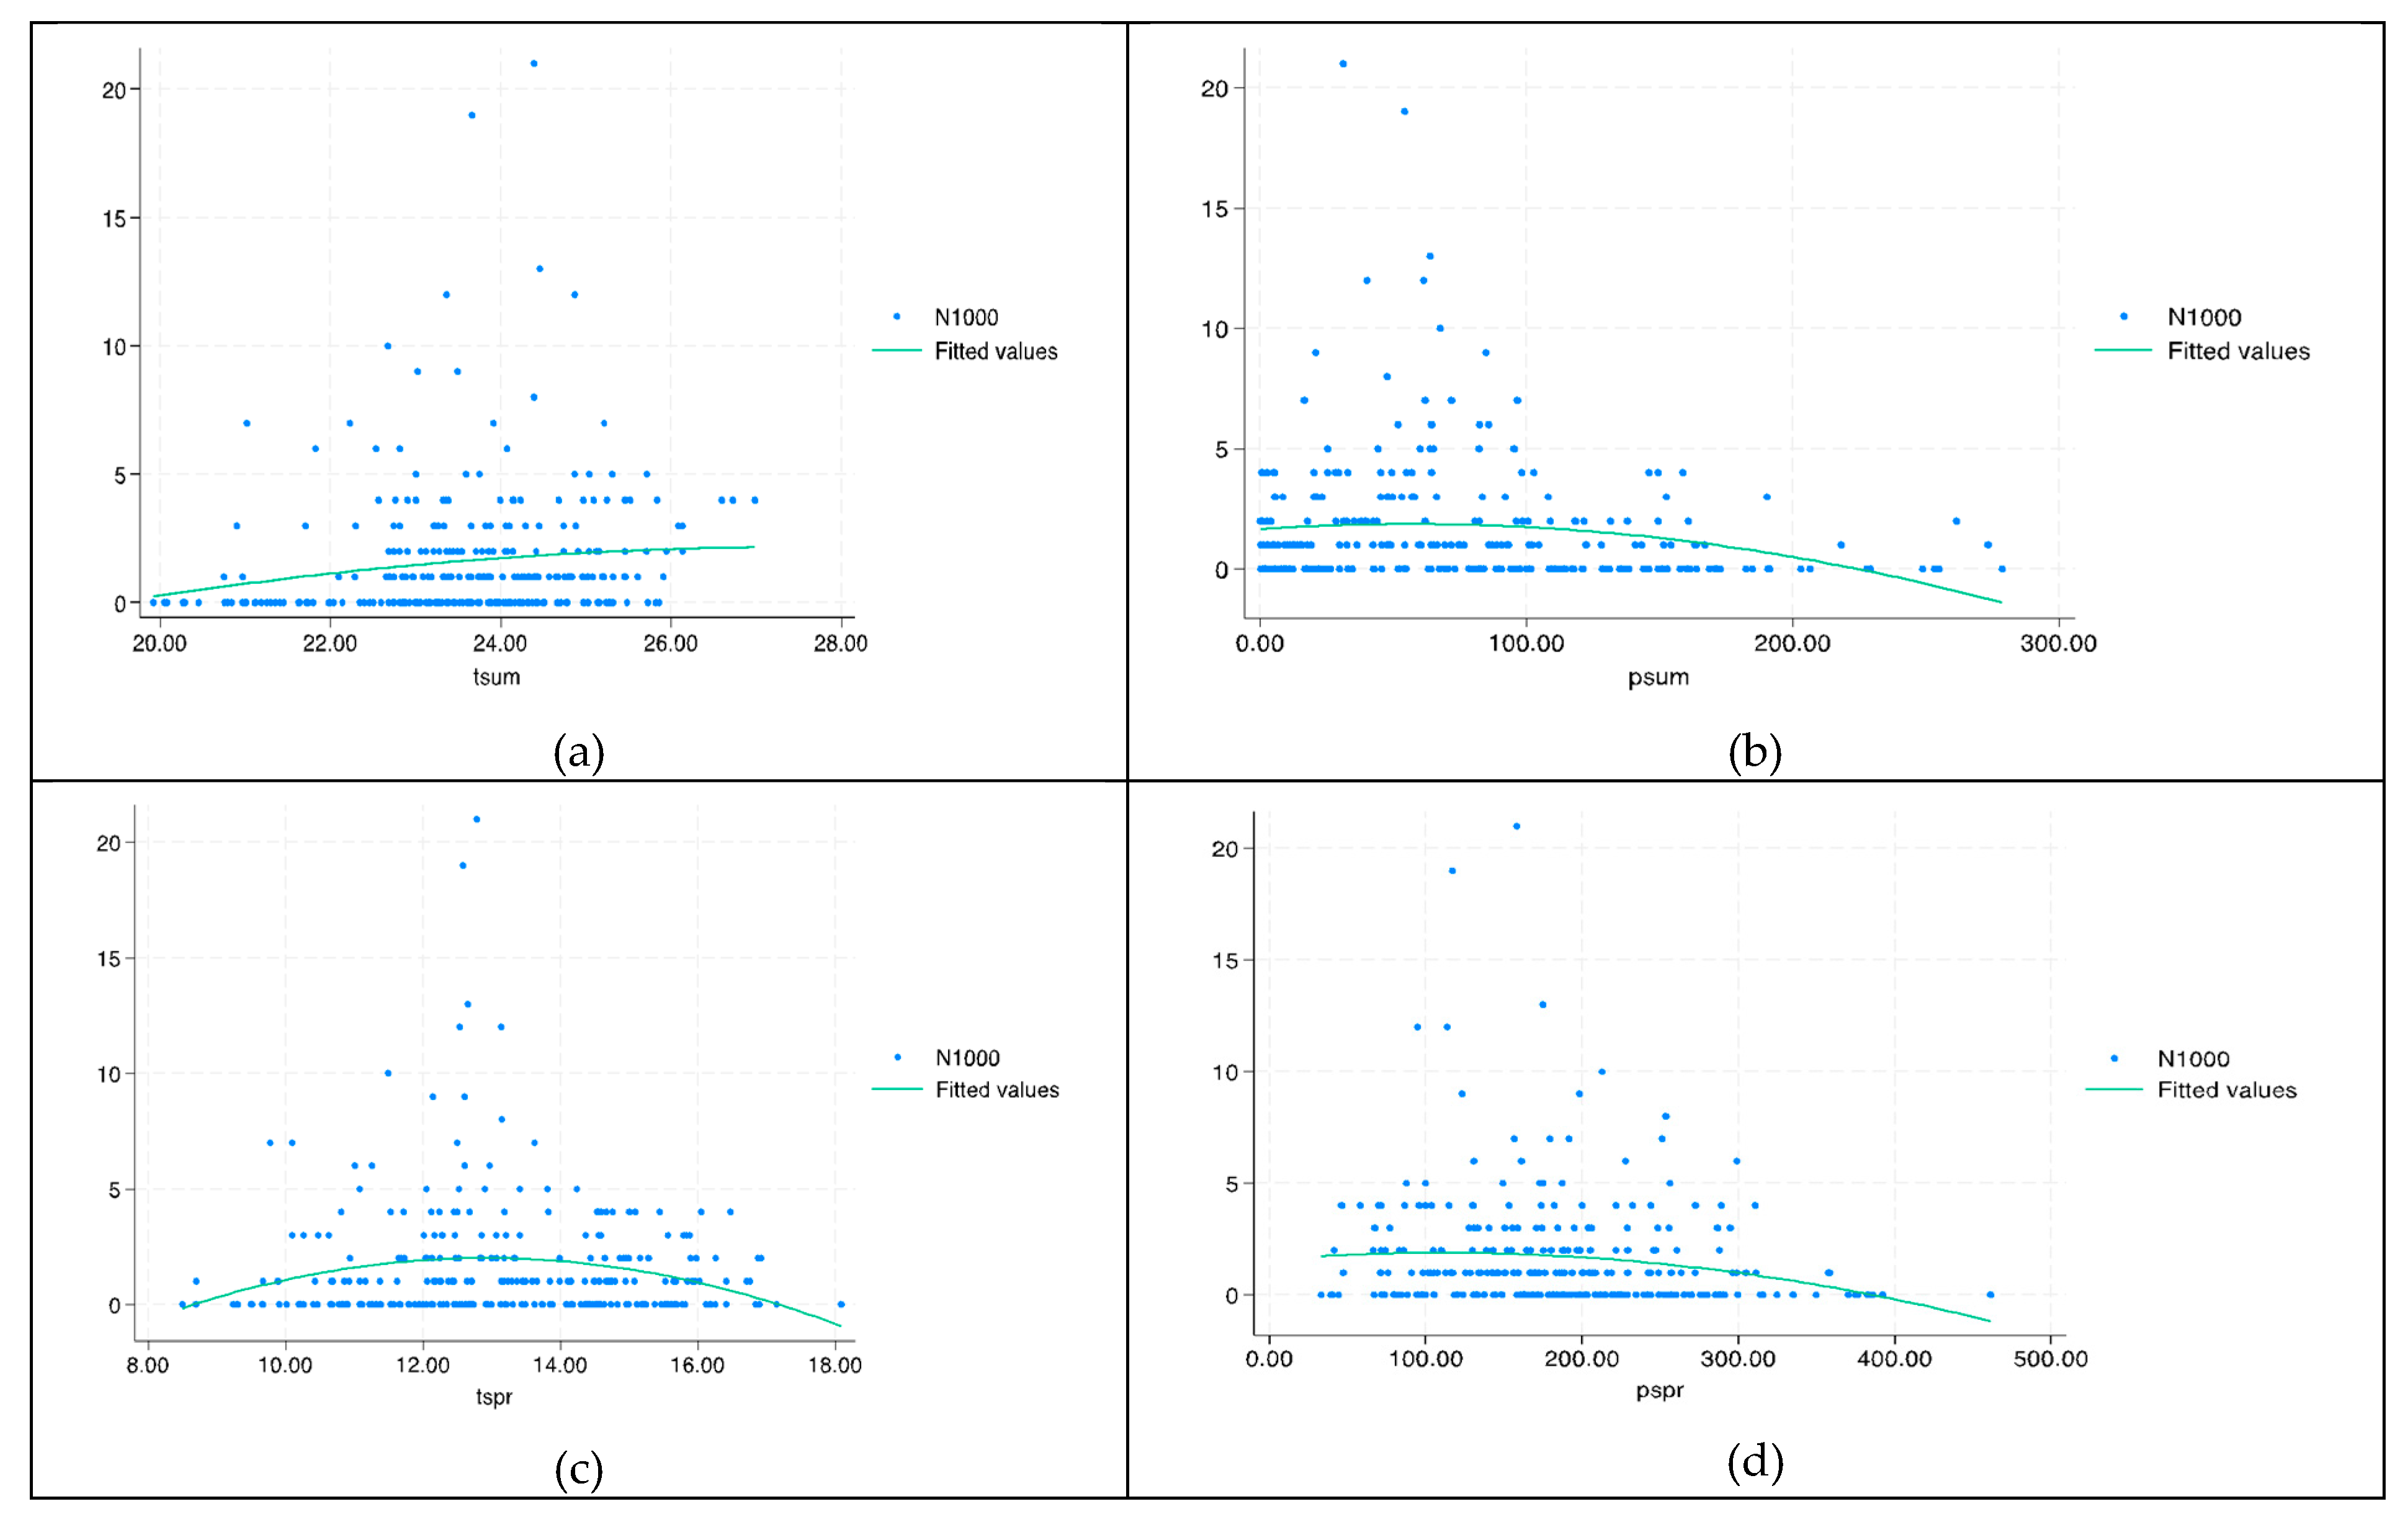
Table 1.
The decision matrix.
| Vulnerability attributes | … | |||||
| Weights | … | |||||
| Regions | ||||||
| … | ||||||
| … | ||||||
| … | … | … | … | … | … | |
| … | ||||||
Table 2.
Results of the six vulnerability types for each of the 13 regions of Greece.
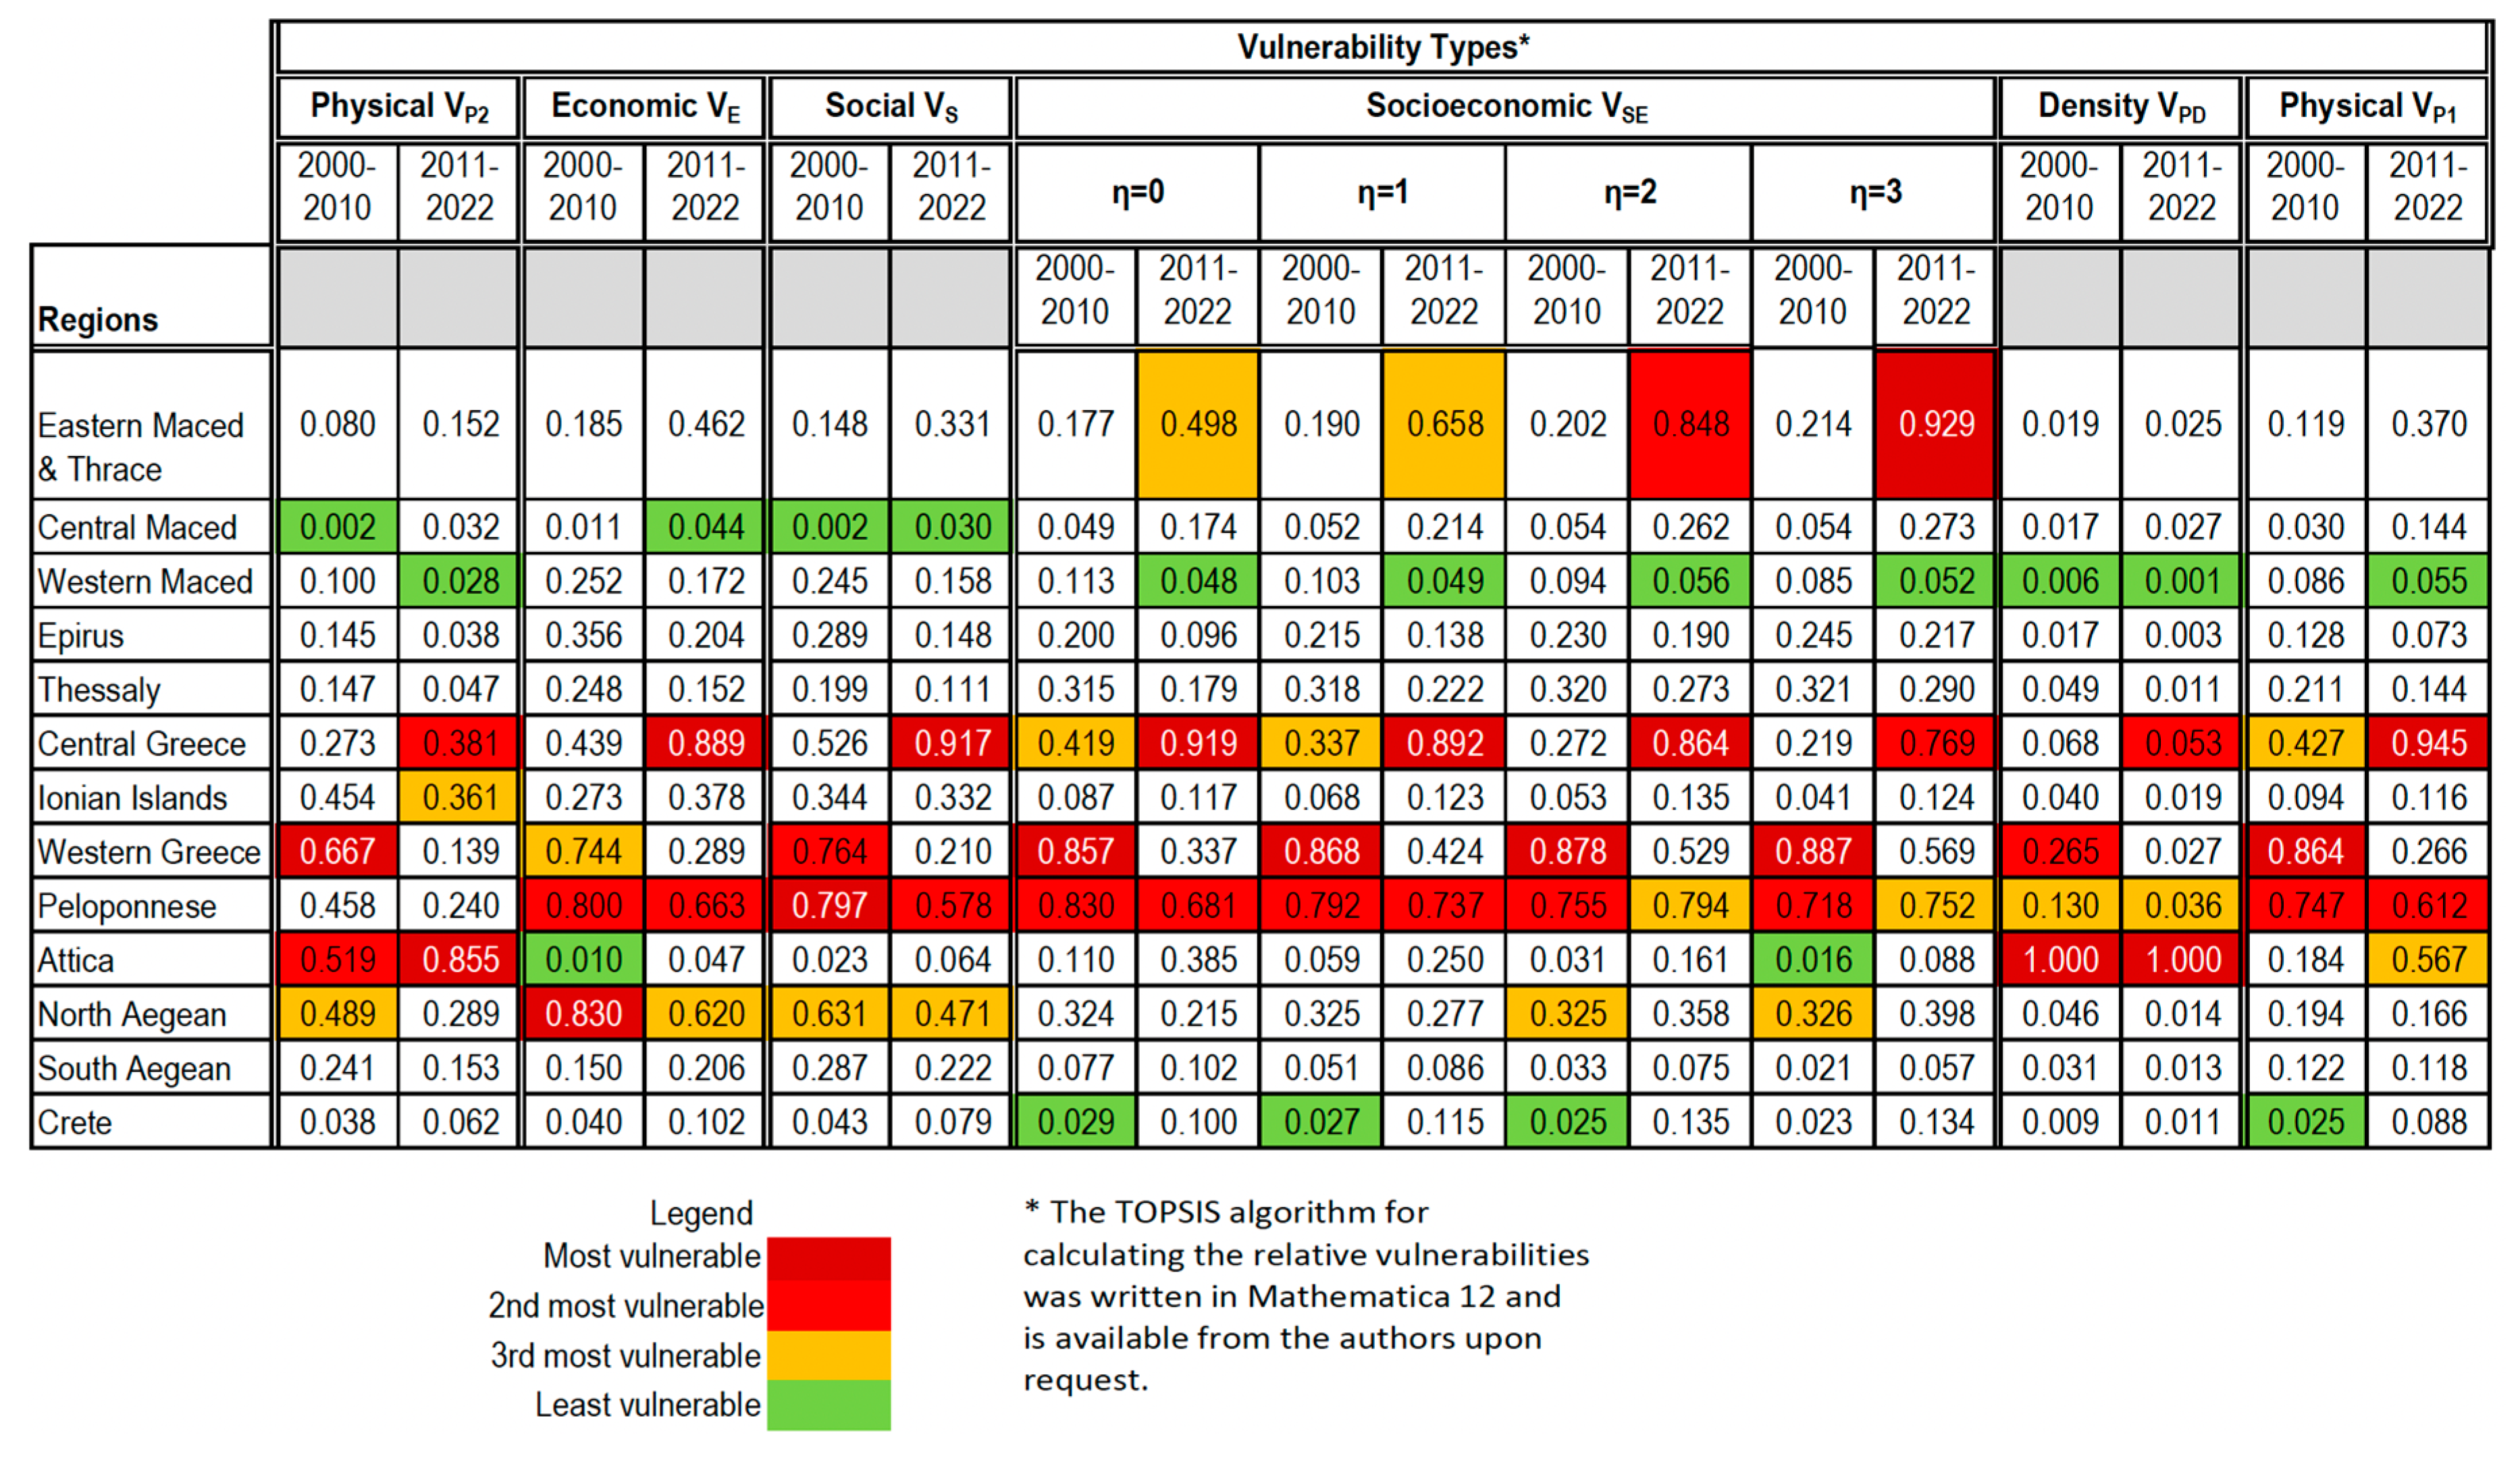 |
Table 3.
Relative vulnerability versus population density and GDP.
| Dependent variable | VP1 (BE) |
VP1 (PA) |
VSE , η=1 (PA) |
VSE , η=1 (RE)* |
|---|---|---|---|---|
| Constant | 0.1819487 | 0.1820646 | 0.7478916 | 0.7530574 |
| 0.03 | 0.0 | 0.010 | 0.0014 | |
| avg_dens | 0.0004962 | 0.0004953 | ||
| 0.013 | 0.01 | |||
| avg_gdp | −0.00003 | −0.0000303 | ||
| 0.108 | 0.124 | |||
| Wald χ2(1) | 8.68 | 10.22 | 2.58 | 2.36 |
| P > χ2 | 0.013 | 0.0014 | 0.1083 | 0.1241 |
Notes: BE: between estimator for panel data. PA: population-averaged estimator for panel data. * The Breusch and Pagan Lagrangian multiplier test for random effects rejects the null hypothesis that the variance across regions is zero. The random effects estimator is appropriate (for estimation details, see [30]).
Table 4.
Pearson’s correlation between number of days per year with FWI over a threshold and number of wildfires per year in Greece.
Table 4.
Pearson’s correlation between number of days per year with FWI over a threshold and number of wildfires per year in Greece.
| Fires/year that burned… | more than 100 ha | more than 50 ha | more than 10 ha | |||
|---|---|---|---|---|---|---|
| Days/year with… | FWI>30 | FWI>45 | FWI>30 | FWI>45 | FWI>30 | FWI>45 |
| Eastern Macedonia & Thrace | 0.322 | 0.270 | 0.365 | 0.259 | 0.370 | 0.222 |
| Central Macedonia | 0.594 | 0.506 | 0.653 | 0.710 | 0.681 | 0.686 |
| Western Macedonia | 0.292 | 0.606 | 0.344 | 0.622 | 0.374 | 0.509 |
| Epirus | 0.457 | 0.600 | 0.530 | 0.474 | 0.624 | 0.505 |
| Thessaly | 0.255 | 0.408 | 0.329 | 0.450 | 0.478 | 0.469 |
| North Aegean | 0.204 | 0.082 | 0.221 | 0.160 | 0.073 | 0.058 |
| South Aegean | 0.407 | 0.460 | 0.372 | 0.518 | 0.186 | 0.212 |
| Central Greece | 0.383 | 0.570 | 0.476 | 0.524 | 0.501 | 0.459 |
| Western Greece | 0.434 | 0.652 | 0.505 | 0.572 | 0.607 | 0.494 |
| Peloponnese | 0.594 | 0.563 | 0.690 | 0.688 | 0.736 | 0.741 |
| Ionian Islands | 0.208 | 0.068 | 0.414 | 0.061 | 0.375 | 0.308 |
| Crete | 0.024 | 0.173 | 0.061 | 0.232 | 0.240 | 0.364 |
| Attica | 0.329 | 0.413 | 0.510 | 0.620 | 0.342 | 0.491 |
| Greece | 0.561 | 0.772 | 0.652 | 0.709 | 0.686 | 0.552 |
Note: The warmer colors denote higher correlations, starting at 0.3 (light yellow).
Table 5.
Description of variables (2000–2022).
| Variable | Mean | Std. dev. | Min | Max |
|---|---|---|---|---|
| N100 | 20.6 | 19.175 | 1 | 78 |
| N50 | 34.1 | 27.501 | 6 | 120 |
| N10 | 114.0 | 64.056 | 36 | 321 |
| tsum | 23.29 | 0.7067 | 22.24 | 25.014 |
| psum | 102.42 | 42.52 | 37.518 | 224.436 |
| tspr | 12.26 | 0.778 | 10.89 | 14.296 |
| pspr | 209.55 | 34.482 | 147.659 | 268.986 |
Table 6.
Regression results for fires that burned more than 10, 50, and 100 hectares in Greecea.
| Dependent variable | N10 (GPR) | N50(GPR) | N100(PR) |
|---|---|---|---|
| tsum | 0.2049 | 0.4941 | 0.2227 |
| 0.071 | 0.023 | 0.0 | |
| psum | −0.0065 | −0.006 | −0.0086 |
| 0.0 | 0.015 | 0.0 | |
| pspr | −0.0033 | −0.0023 | −0.0067 |
| 0.096 | 0.466 | 0.0 | |
| Constant | 1.2315 | −6.99 | |
| 0.659 | 0.187 | ||
| Wald χ2(3) | 35.92 | 17.48 | 4844.8 |
| Pseudo | 0.46 | 0.64 | 0.30 |
| MNF Est. | 105.4 | 30.3 | 18.1 |
| MNF data (Table 4) | 114 | 34.1 | 20.6 |
| 2031-2060 RCP 4.5 | 190.387 (67.01%) | 72.5404 (112.73%) | 39.6955 (92.7%) |
| 2071-2100 RCP 4.5 | 218.535 (91.7%) | 97.783 (186.75%) | 47.2403 (129.32%) |
| 2031-2060 RCP 8.5 | 210.161 (84.35%) | 89.9841 (163.88%) | 44.9298 (118.11%) |
| 2071-2100 RCP 8.5 | 394.921 (246.42%) | 344.548 (910.41%) | 95.4483 (363.34%) |
Notes: aAll estimations were obtained using STATA 18. GPR: generalized Poisson regression to allow for underdispersion. The constants were not significant for the N10 and N50 regression, but they are reported because the GPR estimation method used, because of underdispersion, did not allow for intercept suppression. For the N100 regression the constant was highly insignificant and was suppressed. PR: Poisson regression. The Pseudo was estimated as where is the log likelihood of an intercept-only model and is the log likelihood of the fitted model. In discrete models such as Poisson, maximum Pseudo [30]. MNF Est: mean number of fires per year estimated for the regression equation. MNF data: mean number of fires per year observed from the data. 2031-2060 / 2071-2100 RCP4.5 / RCP8.5: predicted number of fires using the estimated regression (based on equations (4) and (5)) for the average values of the explanatory variables for 2031–2060 and 2071–2100 under the RCP4.5 and RCP8.5 scenarios relative to the reference period (1971–2000) interpolated in the locations of the 13 Greek regions. The proportional change in the predicted number of fires relative to the values of MNF data is shown in parentheses.
Table 7.
Estimation results for Greece, panel data (dependent variable is N100).
| Variable | Panel Data | |||
|---|---|---|---|---|
| Fixed effects1 13 Regions |
PA estimator2 13 Regions |
ZINB3 13 Regions |
Fixed effects1 9 Regions |
|
| tsum | 0.3839 | 0.0544 | 0.0537 | 0.5052 |
| 0.0 | 0.0 | 0.0 | 0.0 | |
| psum | −0.0071 | −0.0048 | −0.0045 | −0.0041 |
| 0.01 | 0.007 | 0.016 | 0.063 | |
| pspr | −0.0061 | −0.0027 | −0.0027 | −0.0061 |
| 0.0 | 0.003 | 0.05 | 0.001 | |
| Constant | −7.2102 | −9.9985 | ||
| 0.003 | 0.0 | |||
| Wald χ2(3) | 61.45 | 12.95 | 37.81 | 23.0 |
| 0.338 | ||||
| 0.049 | ||||
| MNF Est | 1.23 | 1.54 | 1.56 | 1.70 |
| MNF Data | 1.59 | 1.59 | 1.59 | 1.84 |
| 2031-2060 RCP4.5 | 1.846 (16.09%) | 1.73 (9.03%) | 1.74 (9.61%) | 2.6 (41.22%) |
| 2071-2100 RCP4.5 | 2.404 (51.18%) | 1.82 (14.4%) | 1.83 (14.95%) | 3.64 (97.95%) |
| 2031-2060 RCP8.5 | 2.231 (40.29%) | 1.79 (12.8%) | 1.80 (13.35%) | 3.31 (79.99%) |
| 2071-2100 RCP8.5 | 6.951 (337.162%) | 2.25 (41.31%) | 2.25 (41.28%) | 13.67 (643.17%) |
Notes: z values in parentheses. 1 The H0 for the Hausman test was rejected so the fixed-effects model is used. 2 Correlation: nonstationary, Semi-robust standard errors. 3 Inflation model: probit. Inflation variable: tspr. The MNF Est and MNF Data values represent number of fires that burned more than 100 hectares per region and year. The IPCC entries have the same interpretation as in Table 6.
Table 8.
Regression results for the nine significant Greek regions.
| Region | Attica | Central Greece | Central Macedonia | Crete | E. Macedonia & Thrace | North Aegean | Peloponnese | Western Greece | Western Macedonia |
|---|---|---|---|---|---|---|---|---|---|
| Est. Meth. | GPR | PR | PR | ZIPR | ZINB | ZIPR | PR | PR | ZINB |
| Dep. Var. | N100 | N100 | N50 | N50 | N50 | N50 | N100 | N50 | N50 |
| tsum | 0.4878 | 0.1242 | 0.6039 | 0.63524 | 0.04691 | 0.07767 | 0.16103 | 0.09753 | 0.152441 |
| 0.035 | 0.0 | 0.05 | 0.01 | 0.0 | 0.001 | 0.0 | 0.0 | 0.018 | |
| psum | −0.00956 | −0.01409 | −0.029586 | ||||||
| 0.02 | 0.0 | 0.040 | |||||||
| pspr | −0.00993 | −0.00404 | −0.0073 | −0.00687 | −0.01198 | −0.00998 | −0.00574 | ||
| 0.029 | 0.095 | 0.077 | 0.111 | 0.01 | 0.0 | 0.012 | |||
| Constant | −10.746 | −12.77 | |||||||
| 0.072 | 0.014 | ||||||||
| Wald | 8.92 | 210.4 | 23.28 | 12.3 | 274.52 | 61.58 | 6.31 | ||
| Prob > | 0.011 | 0.0 | 0.0 | 0.0021 | 0.0 | 0.0 | 0.047 | ||
| Pseudo | 0.11 | 0.16 | 0.14 | 0.10 | 0.19 | 0.20 | 0.07 | 0.49 | |
| LR | 11.57 | 15.44 | |||||||
| Prob > | 0.0031 | 0.001 | |||||||
| MNF Est. | 2.13 | 3.4 | 1.4 | 2.28 | 2.21 | 1.47 | 3.59 | 2.35 | 0.74 |
| MNF Smpl. | 1.91 | 3.8 | 1.6 | 2.04 | 2.09 | 1.13 | 4.21 | 2.48 | 1.3 |
| 2031-2060 RCP4.5 | 2.78 (45.73%) |
5.39 (41.82%) |
2.73 (70.45%) |
1.83 (-10.54%) |
3.08 (47.43%) |
1.303 (15.34%) |
5.98 (42.16%) |
2.42 (-2.46%) |
1.87 (43.54%) |
| 2071-2100 RCP4.5 | 4.02 (110.48%) |
6.08 (59.9%) |
4.1 (156.15%) |
2 (-1.95%) |
3.16 (51.29%) |
1.53 (35.56%) |
7.61 (80.93%) |
2.75 (11.08%) |
1.96 (50.84%) |
| 2031-2060 RCP8.5 | 3.71 (94.29%) |
6.04 (59.06%) |
3.48 (117.45%) |
1.97 (-3.61%) |
3.15 (50.58%) |
1.5 (32.52%) |
7.33 (74.1%) |
2.72 (9.61%) |
1.8 (38.23%) |
| 2071-2100 RCP8.5 | 12.82 (571.1%) | 9.5 (149.85%) | 18.47 (1054.61%) | 2.69 (31.93%) |
3.55 (69.79%) |
1.97 (74.13%) |
15.1 (258.65%) |
4.12 (66.18%) |
4.11 (216.5%) |
Disclaimer/Publisher’s Note: The statements, opinions and data contained in all publications are solely those of the individual author(s) and contributor(s) and not of MDPI and/or the editor(s). MDPI and/or the editor(s) disclaim responsibility for any injury to people or property resulting from any ideas, methods, instructions or products referred to in the content. |
© 2024 by the authors. Licensee MDPI, Basel, Switzerland. This article is an open access article distributed under the terms and conditions of the Creative Commons Attribution (CC BY) license (http://creativecommons.org/licenses/by/4.0/).
Copyright: This open access article is published under a Creative Commons CC BY 4.0 license, which permit the free download, distribution, and reuse, provided that the author and preprint are cited in any reuse.


