Submitted:
30 April 2024
Posted:
01 May 2024
You are already at the latest version
Abstract
The current study compared the goodness of fit and estimation precision of Bayes and maximum likelihood (ML) structural equation modeling across sample sizes. Data consisted of Markov Chain Monte Carlo generated samples of 50, 75, 100, 125, 150, 200, 250, 500, 750, 1000, and 1500 observations. The Bayes and ML methods were used to estimate a structural equation model with 40 parameters, including 12 continuous observed indicators, four latent variables, and three structural paths. Analyses were conducted with the Mplus 8.0 statistical software and were replicated 500 times with each of the 22 conditions (11 sample sizes x 2 estimation methods). Indices of model fit were the Bayes information criterion, the Tucker-Lewis index, the comparative fit index, the root mean square error of approximation, the posterior predictive p-value (for Bayes models), and the ꭓ2 test (for ML models). Results showed that as the sample size increased, both estimation methods exhibited improved model fit and enhanced estimation precision, and both methods performed well with samples of 200 or larger; however, ML demonstrated a marginally superior fit with smaller samples. These findings were not consistent with previous research and suggest that ML remains a better choice with continuous data and small samples.
Keywords:
structural equation modeling
; Bayesian analysis
; maximum likelihood
MSC: 60E05; 62H05; 62E10; 62F10; 62F15; 62P05
1. Introduction
Structural Equation Modeling (SEM) is a statistical technique used to analyze the relationships between observed and latent variables. It allows researchers to test complex theoretical models that hypothesize directional relationships among variables. SEM combines factor analysis and multiple regression analysis, enabling the examination of both measurement models (relating latent variables to observed indicators) and structural models (relating latent variables to each other) [1,2,3].
Bayesian Structural Equation Modeling (BSEM) is a statistical technique used for estimating structural equation models within a Bayesian framework. It combines SEM with Bayesian statistical methods to analyze complex relationships among variables [4,5,6].
1.1. Sample Size in SEM and BSEM
In statistical analysis and applied research, sample size is a critical consideration due to its impact on the reliability, validity, and generalizability of study findings. General sample size guidelines for SEM depend on the complexity of the model and the desired level of statistical power. Although there is no universally agreed-upon rule, several researchers and methodologists have proposed guidelines based on simulation studies and empirical research. Hair et al. recommend a minimum sample size of 100-200 cases for basic SEM models, with larger samples required for more complex models with many parameters [7]. Kline suggests a minimum sample size of 200 cases for simple models and 300-500 cases for more complex models [1]. Wolf et al. provide sample size recommendations based on model complexity and desired statistical power, with minimum recommendations ranging from 100 to 300 cases [8]. MacCallum et al. offer guidelines for sample size determination in SEM based on desired power levels and model complexity [9].
Inadequate sample sizes can result in low statistical power, limiting the ability of researchers to detect true effects or relationships among variables. Small sample sizes increase the risk of Type I errors (false positives) and Type II errors (false negatives). Researchers may mistakenly conclude the presence or absence of effects or relationships due to the limited power of the study [10,11]. In studies involving complex relationships among variables, such as mediation or moderation effects, larger sample sizes may be necessary to adequately test these relationships. Small samples may not provide sufficient statistical power to detect these nuanced effects [12]. Further, small sample sizes may not be representative of the population from which they are drawn, reducing the external validity or generalizability of study findings [13]. They result in larger standard errors of estimates, reducing the precision of the results. Estimates of population parameters, such as means, proportions, or effect sizes, may be less reliable with smaller samples, leading to increased uncertainty in research findings [14].
Research on BSEM in relation to sample size is still limited. Some studies have shown that BSEM tends to be more robust to small sample sizes compared to traditional maximum likelihood (ML) estimation approaches. Bayesian methods allow for the incorporation of prior information, which can stabilize parameter estimates and reduce the impact of small sample sizes, especially when informative priors are used. [5,15,16]. Although some studies suggest that BSEM may offer advantages in handling small samples, this estimation method may also pose computational challenges, particularly with large models or complex priors. Further, Markov chain Monte Carlo (MCMC) methods, commonly used in BSEM, can be computationally intensive and may require longer run times for large datasets [17].
1.2. Objectives
The current study continues the previously described line of research by delving into Bayesian and ML estimation precision and model fit. Lee & Song conducted a similar investigation using the LISREL program [5]; however, the present investigation employed the Mplus statistical package, used a broader spectrum of sample sizes, encompassing both small and larger samples, and incorporated a more comprehensive array of model fit indices. Specifically, the present study aimed to address the following research questions:
- How do the Bayes and ML goodness of fit indices compare across varying sample sizes?
- How does the Bayes and ML model parameter estimation precision compare across varying sample sizes?
2. Methods
2.1. Structural Equation Modeling
SEM enables researchers to simultaneously estimate the relationships among latent and observed variables in a complex theoretical framework. It involves the specification of measurement models and structural models, allowing for the assessment of direct and indirect effects among variables [1,2,3].
The general formula for Structural Equation Modeling (SEM) involves representing observed variables as linear combinations of latent variables and error terms, with path coefficients indicating the strength and direction of the relationships among variables. A basic formulation specifies a model with p observed variables Y1, Y2,...,Yp and q latent variables η1, η2,...,ηq, the structural equation model can be expressed as:
where:
Y=Λη+ε
η=Γξ+ζ
- Y is a vector of observed variables.
- η is a vector of latent variables.
- ξ is a vector of exogenous latent variables (if any).
- Λ and Γ are matrices of factor loadings representing the relationships between latent and observed variables and between latent variables, respectively.
- ε and ζ are vectors of error terms.
2.2. Bayesian Structural Equation Modeling
Like traditional SEM, BSEM, specifies a theoretical model that represents the hypothesized relationships among observed and latent variables. The model is typically represented as a system of linear equations, where each variable is influenced by one or more variables. Bayesian methods are then employed to estimate the parameters of the model, including regression coefficients, variances, and covariances. Unlike traditional SEM, which relies on ML estimation, BSEM uses Bayesian estimation techniques such as Markov Chain Monte Carlo (MCMC) simulation to obtain parameter estimates. One advantage of BSEM is its flexibility in handling missing data and complex model specifications. Additionally, Bayesian methods provide estimates of uncertainty, allowing researchers to quantify the uncertainty associated with parameter estimates and make more informed interpretations of their results [5,6,15].
The formula for BSEM involves specifying the structural equation model within a Bayesian framework, incorporating priors, likelihood, and posterior distributions. The likelihood function typically follows the structural equation model specification, incorporating error terms and covariance matrices. Priors are specified based on prior knowledge or assumptions about the parameters. As for the specific formulation and application of BSEM, it would depend on the software or package used for estimation, as well as the model specification (e.g., confirmatory factor analysis, path analysis, etc.) [15]. A general outline of the formula includes:
- Structural Equations: Like traditional SEM, BSEM describes relationships between latent and observed variables These equations are typically written in the form:where Y is a vector of observed variables, Λ is a matrix of factor loadings representing the relationships between latent variables (η) and observed variables, and ϵ is a vector of error terms.Y=Λη+ϵ
- Priors for Parameters: In Bayesian analysis, prior distributions are specified for model parameters. These priors reflect prior beliefs or knowledge about the parameters before observing the data. The choice of priors can vary depending on the specific model and research question. Commonly used priors include normal, uniform, or informative priors based on previous studies or expert knowledge.
-
Likelihood Function: The likelihood function specifies the probability of observing the data given the model parameters. In BSEM, this typically involves assuming a distribution for the observed variables conditional on the latent variables and error terms. Common distributions include the normal distribution for continuous variables or the categorical distribution for categorical variables. The joint posterior distribution of the parameters given the data is then obtained using Bayes' theorem:where:p(θ∣data)∝p(data∣θ)×p(θ)
2.3. Goodness of Fit
Goodness of fit in SEM refers to the extent to which the proposed model adequately represents the patterns of relationships observed in the data. It assesses how well the hypothesized model fits the actual data. Goodness of fit indices provide quantitative measures to evaluate the fit between the model and the data [18,19,20]. In assessing the fit of structural equation models, several fit indices are commonly utilized to evaluate how well the specified model fits the observed data. These fit indices provide insights into various aspects of model fit, including goodness of fit, parsimony, and overall model adequacy.
2.3.1. The χ2 Test of Model Fit
The χ2 test of model fit is conducted with frequentist estimation methods to compare the observed covariance matrix |S| with the model-implied covariance matrix |Smodel| using the following formula:
where:
χ2=(N−1)(ln∣Smodel∣−ln∣S∣)
- N is the sample size,
- ∣Smodel∣ is the determinant of the model-implied covariance matrix, and
- ∣S∣ is the determinant of the observed covariance matrices.
The degrees of freedom (df) represent the difference between the number of independent observations and the number of estimated parameters in the model. A non-significant χ2 value suggests that the model does not significantly differ from the observed data, indicating good fit. Conversely, a significant χ2 suggests poor fit, indicating that the model does not adequately capture the relationships among variables. Nevertheless, the χ2 test is sensitive to sample size, often leading to rejection of the model in large samples. Additionally, it assumes multivariate normality and can be influenced by outliers [18,19,21].
Several modifications and adjustments to the χ2 test have been proposed to address its limitations, such as the χ2 divided by degrees of freedom (χ2/df), which addresses the sensitivity of the χ2 statistic to sample size. By dividing the χ2 statistic by its degrees of freedom, this test provides a standardized measure of fit that is less influenced by sample size. The formula for the χ2/df ratio is:
where:
𝜒2/df=𝜒2/((𝑁−1)− k)
- N is the sample size,
- k is the number of estimated parameters in the model, and
- df represents the degrees of freedom.
A lower χ2/df ratio indicates better fit, with values approaching 1 or lower than 1 suggesting good fit. Typically, values below 2 or 3 are considered indicative of acceptable fit. The χ2/df test allows for comparisons of model fit across different sample sizes and models. Although the χ2/df test is less sensitive to sample size, it does not provide information about the nature or magnitude of misfit. Additionally, it can still be influenced by model complexity and the number of observed variables [18,19,21]. Therefore, alternative fit indices like the Bayes information criteria (BIC), the Tucker-Lewis index (TLI), the comparative fit index (CFI), and root mean square error of approximation (RMSEA) are used to assess model fit.
2.3.2. The Bayes Information Criteria
The BIC is a statistical criterion used in SEM for model selection and comparison. It balances model fit and complexity by penalizing models with more parameters. Lower BIC values indicate better model fit, accounting for model parsimony. BIC is calculated as follows:
where:
BIC=−2ln(L)+k × ln(N)
- L is the likelihood of the model,
- k is the number of estimated parameters in the model, and
- N is the sample size.
BIC penalizes models with more parameters by adding a penalty term proportional to the number of parameters. Lower BIC values indicate better model fit. When comparing different models, the model with the lowest BIC value is preferred. BIC accounts for both model fit and model complexity, favoring simpler models that provide adequate fit. BIC provides a quantitative measure for comparing different models while considering both model fit and model complexity. Nevertheless, BIC assumes that the true model is among the models being compared and may not perform well when this assumption is violated. It can also be influenced by sample size, with larger samples resulting in lower BIC values [18,19,22]
2.3.3. The Tucker-Lewis Index
The TLI, also known as the Non-Normed Fit Index (NNFI), is commonly used in SEM and compares the fit of the hypothesized model to the fit of a baseline model, such as the null or independence model. It provides a measure of model fit ranging from 0 to 1. It is calculated as follows:
where:
TLI=1− (df(H0)/df(M)) × (TL(M)/TL(H0))
- df(H0) is the degrees of freedom of the baseline (null) model,
- df(M) is the degrees of freedom of the hypothesized model,
- TL(M) is the TLI value of the hypothesized model, and
- TL(H0) is the TLI value of the baseline model.
The TLI values are computed by dividing the difference between the non-centrality parameter of the model and the non-centrality parameter of the baseline model by the noncentrality parameter of the baseline model. TLI values range from 0 to 1. A TLI value closer to 1 indicates better fit, with values above 0.90 typically considered indicative of acceptable fit. The TLI provides a measure of fit that is less influenced by sample size compared to the chi-square statistic. It accounts for model complexity and provides a standardized measure of fit that allows for comparisons across different models and sample sizes. Although the TLI is widely used and provides useful information about model fit, it is sensitive to model misspecification and can be influenced by sample size and model complexity [19,23,24].
2.3.4. The Comparative Fit Index
Like TLI, the CFI compares the fit of the hypothesized model to the fit of a baseline model, typically the independence model. It quantifies the improvement in fit of the hypothesized model relative to the baseline model, providing a measure of model fit ranging from 0 to 1. It is calculated as follows:
where:
CFI=(TLP−TLO)/(TLP−TLO+df)
- TLP is the Tucker-Lewis Index of the proposed model,
- TLO is the Tucker-Lewis Index of the baseline (null) model, and
- df represents the degrees of freedom of the model.
CFI values range from 0 to 1. A CFI value closer to 1 indicates better fit, with values above 0.90 typically considered indicative of acceptable fit and values above 0.95 suggesting excellent fit. The CFI provides a measure of fit that is less influenced by sample size compared to the chi-square statistic. It accounts for model complexity and provides a standardized measure of fit that allows for comparisons across different models and sample sizes. Although the CFI is widely used and provides useful information about model fit, it is sensitive to model misspecification and can be influenced by sample size and model complexity [18,19,24].
2.3.5. The Root Mean Square Error of Approximation
The RMSEA is a widely used goodness-of-fit index in SEM. It evaluates the discrepancy between the observed covariance matrix and the covariance matrix implied by the model, adjusted for model complexity. RMSEA provides a measure of fit that considers both model fit and model parsimony and is calculated as follows:
where:
RMSEA=√(𝜒2−𝑑𝑓)/(𝑑𝑓×(𝑁−1))
- 𝜒2 is the chi-square statistic,
- 𝑑𝑓 is the degrees of freedom, and
- 𝑁 is the sample size.
The RMSEA value is adjusted for model complexity by penalizing for the number of estimated parameters and is scaled by the sample size. RMSEA values typically range from 0 to 1. Lower RMSEA values indicate better fit, with values less than 0.05 indicating close fit, values between 0.05 and 0.08 suggesting reasonable fit, and values above 0.10 suggesting poor fit. RMSEA is less sensitive to sample size compared to the chi-square statistic, making it suitable for models with large sample sizes. It provides a measure of fit that considers both model fit and model complexity, allowing for comparisons across different models. Although RMSEA is widely used and provides useful information about model fit, it is sensitive to model misspecification and can be influenced by model complexity and sample size [24,25,26].
2.3.6. The Posterior Predictive P-Value (PPV)
In BSEM, the PPV assesses overall model fit by evaluating the discrepancy between the observed data and data simulated from the posterior predictive distribution under the model. It provides a way to evaluate the adequacy of the model in reproducing the observed data. The calculation of the PPV involves several steps: 1) simulate 𝑀 datasets (𝐷(1),𝐷(2),...,𝐷(𝑀)) from the posterior predictive distribution under the model; 2) compute a test statistic (𝑇) for each simulated dataset and the observed dataset; and 3) calculate the proportion of simulated test statistics that are more extreme than the observed test statistic. Mathematically, the PPV can be expressed as:
where:
- 𝑀 is the number of simulated datasets,
- 𝑇(𝑖) is the test statistic computed from the 𝑖th simulated dataset,
- 𝑇obs is the test statistic computed from the observed dataset, and
- 1(⋅) is the indicator function, which equals 1 if the condition is true and 0 otherwise.
A PPV close to 0.5 indicates good fit, suggesting that the observed data are consistent with the model-implied distribution. Values deviating substantially from 0.5 suggest potential problems with model fit. Extremely low or high PPV values (much smaller or larger than 0.5) indicate poor fit, suggesting discrepancies between the model and the observed data [27,28,29].
2.4. Data Analysis
Based on findings from prior research, the researcher hypothesized that Bayesian estimation may yield more accurate parameter estimates and have better have a better model fit with smaller sample sizes than ML estimation (Muthen 2010; Lee & Song, 2014). Additionally, the author aimed to compare the precision and model fit of Bayes and ML estimation with larger samples. While previous research used PPV, BIAS, RMS, and SE/SD to assess model fit (Lee & Song, 2014), the current study used the PPV and the ꭓ2 test to assess the overall fit of the Bayes and ML models respectively, and the BIC, RMSEA, CFI, and TLI to comparatively assess the goodness of fit of the Bayes and ML models with various sample sizes.
Simulation Study
Simulation studies play a crucial role in statistical research for several reasons. First, simulation studies allow assessment of method performance under controlled conditions where the true underlying distribution of data is known. This helps to assess the accuracy, precision, and robustness of different statistical techniques in various scenarios. Additionally, simulation studies permit the examination of assumptions about the data distribution or model structure. Simulation studies enable researchers to explore the impact of violating these assumptions and assess the method's performance under different conditions. Further, simulation studies are crucial in facilitating the comparison of different statistical methods or algorithms in terms of their performance metrics such as bias, variance, efficiency, and computational speed. This allows researchers to identify the most suitable method for a particular problem [28,30,31].
Monte Carlo simulation is a computational technique used to estimate the probability distributions of outcomes by repeatedly sampling from probability distributions of input variables. It involves generating a large number of random samples from these input distributions and then using these samples to perform statistical analyses or solve complex mathematical problems. It is a computational method for estimating the behavior of mathematical or statistical systems by performing repeated random sampling. It involves simulating uncertain input variables according to their probability distributions and using these samples to estimate the behavior of the system or solve complex problems [32]. Markov Chain Monte Carlo (MCMC) simulation is a computational method for generating samples from a probability distribution, typically the posterior distribution in Bayesian inference, by constructing a Markov chain that converges to the desired distribution. MCMC methods, such as the Metropolis-Hastings algorithm and the Gibbs sampler, are widely used for Bayesian inference, model estimation, and uncertainty quantification [33].
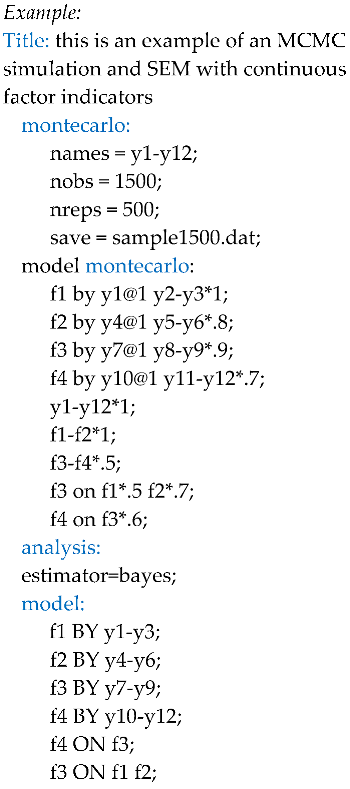
The current study employed MCMC simulations to generate multiple data sets with a defined underlying structure. The underlying structure was a model with 12 observed continuous indicators (y1-y12), describing four latent variables (factors): f1 (measured by y1-y3), f2 (measured by y4-y6), f3 (measured by (y7-y9), and f4 (measured by y10-y12). Additionally, the model specified the following structural relationships: f1 -> f3, f2->f3, and f3 ->f4. Figure 1 illustrates the specified structural model.
To set the measurement scale of each factor, the factor loadings of the y1, y4, y7, and y10, were fixed at 1. The true values (TVs) were set at 1 for the y2-y3 factor loadings, .8 for y5-y6 factor loadings, .9 for the y8-y9 factor loadings, and .7 for the y11-y12 factor loadings. The specified f1-> f3 path coefficient was .5, the f2 -> f3 path coefficient was set at .7, and the f3 ->f4 path coefficient was set at .6.
The Mplus 8.0 statistical software was used to run all simulations and statistical analyses. The MCMC algorithm was used to generate samples of 50, 75, 100, 125, 150, 200, 250, 500, 750, 1000, and 1500 observations. Overall, the structural model was assessed under 22 conditions (11 sample sizes x 2 estimation methods), with 500 replications of each condition. For each condition, the BIC, TLI, CFI, and RMSA goodness of fit statistics were recorded. Additionally, the mean PPV values of the Bayes models, and the mean ꭓ2 and ꭓ2/df of ML models were retained. Below is an example of the Mplus code for generating data and assessing the Bayes estimation with a 1500 sample size. This code was adapted from Example 5.11 in the Mplus User’s Guide [17] and should be modified as needed to change the estimation method and/or the sample size:
3. Results
With ML estimation, as sample size increased, the overall model fit improved. Specifically, the ꭓ2 statistic (df=50) gradually decreased from 57.161 (N=50) to 49.926 (N=1500) (Figure 2), and ꭓ2/df decreased from 1.14 to 0.99. Similarly, as the sample size increased, the PPV was closer to the optimal value of 0.5 (Figure 3). Interestingly, when sample sizes were 200 of smaller, PPVs were smaller than .5, whereas most of the larger sample sizes had PPVs larger than 0.5. Table 1 provides the mean PPVs and ꭓ2 statistics along with the corresponding standard deviations (SDs) for all estimated models. To facilitate the interpretation of model fit, the table includes the differences between PPVs and the optimal value of 0.5 for the Bayesian models, and the ꭓ2/df for the ML models.
As expected, mean BIC values gradually increased as the sample size increased for Bayes and ML models (Figure 4). Table 2 provides the mean BIC values and SDs for all Bayes and ML models as well as the differences between the Bayes and the ML values. Although the differences between the Bayes and the ML values were minute, most ML models had smaller mean BIC values than the Bayes models with the same sample size. These differences occurred mostly with very small and with larger samples, where mean BICs indicated slightly better fit of the ML models.
Bayes and ML mean TLI values gradually increased as the sample size increased, indicating better model fit with larger sample sizes with both estimation methods (Figure 5). The smallest Bayes and ML mean TLI values were 0.920 and 0.927 respectively (N=50), indicating acceptable model fit. The largest Bayes and ML mean TLI value was .999 (N=1500), indicating almost perfect model fit. A closer examination showed that Bayes mean TLI values were slightly smaller than ML mean TLI values with smaller sample sizes, and these differences gradually increased as the sample size decreased. Bayes and ML mean TLI values were roughly equal with sample sizes of 200 or more. Table 3 provides the Bayes and ML mean TLI values along with their standard deviations and the differences between Bayes and ML mean TLI values.
Bayes and ML mean CFI values gradually increased as the sample size increased, indicating better model fit with larger sample sizes with both estimation methods (Figure 6). Bayes mean CFI values ranged from .926 (N=50), indicating acceptable model fit, to .999 (N≥1000), indicating almost perfect model fit. Similarly, ML CFI values ranged from .944 (N=50), indicating acceptable model fit, to .999 (N≥1000). The Bayes mean CFI values were slightly smaller than ML mean CFI values with smaller sample sizes, and the differences gradually increased as the sample size decreased. Bayes and ML mean CFI values were equal with sample sizes of 200 or more. Table 4 provides the Bayes and ML mean CFI values along with their standard deviations and the differences between Bayes and ML mean values.
With both estimation methods, mean RMSEA values gradually decreased as the sample size increased, indicating a better model fit with larger sample sizes (Figure 7). Bayes mean RMSEA values ranged from .0.052 (N=50), indicating acceptable model fit, to 0.004 (N=1500), indicating excellent model fit. ML mean RMSEA values ranged from 0.046 (N=50), indicating good model fit, to 0.004 (N=1500). Although Bayes and ML mean RMSEA values were very close, the Bayes mean RMSEA values were slightly larger than the ML mean RMSEA values with smaller sample sizes, and the differences gradually increased as the sample size decreased. Bayes and ML mean RMSEA values were roughly equal with sample sizes of 200 or more. Table 5 provides the Bayes and ML mean RMSEA values along with their standard deviations and the differences between Bayes and ML values.
As indicated in Table 6, the Bayes parameter estimates showed some variations from the specified values with the smaller sample sizes and increased in precision as the sample size increased. The largest differences between the mean parameter estimates and the true values were .42, .33. .31, and .24, and occurred with the smallest sample size (N=50) (Table 7). The differences decreased significantly with the N=75 sample size, and continued to decrease as the sample size increased, reaching almost perfect precision with samples of 500 and larger (Table 7). Similarly, the percentages of statistically significant parameters were lower with the N=50 sample size; the smallest percentage for this model was 69.6% for the F4 on F3 mean parameter. Nevertheless, these percentages increased drastically with the N=75 sample size, where the lowest percentage was 87.0% for the same parameter. The percentages of statistically significant parameters continued to increase as the sample size increased, reaching 100% on all parameters with sample sizes of 150 or larger (Table 8).
The ML mean parameter estimates showed very slight deviations from the true values, even with the smaller sample sizes (Table 9). The largest difference was 0.10 and was recorded with the N=50 sample size. As the sample size increased, parameter estimates were increasingly precise, differences decreased reaching almost perfect precision with samples sizes of 200 or larger (Table 10). The smallest percentage of significant parameters was 71.5% and occurred with the F3 on F1 parameter with the N=50 sample size. These percentages gradually increased as the sample size increased, reaching 100% on all estimated parameters with samples of 150 or larger (Table 11).
4. Discussion
Research on BSEM estimation accuracy and goodness of fit is scarce. Some research studies addressing this topic suggest that BSEM can be a valuable tool for analyzing data with small sample sizes, providing more accurate and stable estimates compared to traditional MLE approaches [4,5,16]. The current study continued this line of research by 1) comparing the goodness of fit indices between ML and Bayes estimation methods across different sample sizes, and 2) assessing and comparing the precision of estimation model parameters between Bayes and ML methods across varying sample sizes. Unlike a similar previous investigation [5], the current study used a different set of goodness of fit indices, different statistical software, and a wider range of sample sizes. The findings revealed several key patterns across various measures as sample size increased. Firstly, as sample size increased, the positive predictive value (PPV) of Bayes models approached the optimal value of 0.5. Additionally, with maximum likelihood (ML) estimation, higher sample sizes corresponded to improved model fit, indicated by a decrease in ꭓ2 values. Mean BIC values increased gradually with sample size for both Bayes and ML models, with ML models generally showing smaller BIC values, particularly noticeable with very small or large samples.
Both Bayes and ML models exhibited increasing TLI and CFI values with larger sample sizes, signifying enhanced model fit. While Bayes mean TLI and CFI values were slightly smaller than ML mean values with smaller samples, the disparities diminished with sample sizes of 200 or more. Moreover, RMSEA values decreased with increasing sample size for both estimation methods. While the smallest Bayes mean RMSEA value indicated only acceptable model fit (N=50), the smallest ML mean RMSEA values indicated good model fit (N=50). The Bayes mean RMSEA values were slightly larger than ML mean RMSEA values with smaller samples; however, the differences converged with sample sizes of 200 or more. Parameter estimates also displayed improved precision with larger sample sizes, with Bayes mean parameters showing larger variations from true values than ML mean parameters, particularly noticeable with smaller sample sizes. Additionally, both estimation methods achieved 100% significant parameter estimates with samples of 150 or larger, indicating increasing precision as sample size increased.
These findings show that sample size remains important in BSEM, much like in traditional SEM, albeit with some nuances. Although Bayesian methods provide estimates in terms of probability distributions rather than point estimates, larger samples result in narrower posterior distributions, indicating greater precision. Further, larger sample sizes contribute to the robustness of BSEM results by reducing the influence of prior beliefs on posterior estimates. With more data, the likelihood function plays a more dominant role in shaping the posterior distribution, mitigating the impact of prior specifications. Additionally, Bayesian estimation techniques, such as MCMC sampling, may require longer computational time and greater convergence diagnostics for small sample sizes. Larger sample sizes facilitate faster convergence and more efficient sampling, enhancing the computational efficiency of BSEM. As in traditional SEM, the complexity of the model and the number of parameters to be estimated influence sample size requirements in BSEM. More complex models, with a greater number of latent variables, observed indicators, or structural paths, generally require larger sample sizes to obtain stable and reliable estimates [4,5,28].
5. Conclusions
The issue of sample size in statistics and applied research requires careful consideration of the research question, study design, and available resources. Researchers should strive to maximize sample sizes within practical constraints to enhance the validity and reliability of their findings. The current study showed that as the sample size increased, both estimation methods exhibited improved model fit and enhanced estimation precision; however, ML SEM models demonstrated marginally superior fit compared to Bayes SEM models, particularly evident with smaller sample sizes. Additionally, ML SEM models displayed slightly better estimation precision with smaller sample sizes than Bayes SEM models. Notably, in this study, regardless of the estimation method used, samples of 200 or more yielded optimal outcomes. Given that the estimated model comprised 40 parameters, the author advocates for a ratio of approximately five observations per parameter when employing either Bayes or ML estimation with continuous data.
6. Limitations and Suggestions for Further Research
This study focused on exploring the effects of sample size on the goodness of fit and parameter estimation precision of Bayes and ML SEM utilizing continuous indicators. Future investigations should delve into the disparities between Bayes and ML SEM using categorical, binary, and ordinal indicators. Such inquiry is crucial as these data types deviate from the normality assumption inherent in ML estimation. Moreover, while the current study estimated a correctly specified model, future research should assess Bayes and ML goodness of fit and estimation precision with mis-specified structural models. Additionally, further research may also compare BSEM accuracy and goodness of fit using informative versus non-informative priors.
References
- Kline, R.B. (2015). Principles and Practice of Structural Equation Modeling (4th ed.). Guilford Press.
- Bollen, K.A.; Pearl, J. (2013). Eight Myths About Causality and Structural Equation Models. In Handbook of Causal Analysis for Social Research (pp. 301-328). Springer. [CrossRef]
- Hair, J.F.; Black, W.C.; Babin, B.J.; Anderson, R.E. (2019). Multivariate Data Analysis, (8th ed.). Cengage Learning.
- Muthén, B.; Asparouhov, T. Bayesian structural equation modeling: A more flexible representation of substantive theory. Psychological Methods 2012, 17, 313–335. [Google Scholar] [CrossRef] [PubMed]
- Lee, S.Y.; Song, X.Y. Evaluation of the Bayesian and maximum likelihood approaches in analyzing structural equation models with small sample sizes. Multivariate Behavioral Research 2004, 39, 653–686. [Google Scholar] [CrossRef]
- Asparouhov, T.; Muthén, B. Exploratory structural equation modeling. Structural Equation Modeling: A Multidisciplinary Journal 2009, 16, 397–438. [Google Scholar] [CrossRef]
- Hair, J.F.; Black, W.C.; Babin, B.J.; Anderson, R.E. (2019). Multivariate Data Analysis, (8th ed.). Cengage Learning.
- Wolf, E.J.; Harrington, K.M.; Clark, S.L.; Miller, M.W. Sample Size Requirements for Structural Equation Models: An Evaluation of Power, Bias, and Solution Propriety. Educational and Psychological Measurement 2013, 73, 913–934. [Google Scholar] [CrossRef]
- MacCallum, R.C.; Browne, M.W.; Sugawara, H.M. Power analysis and determination of sample size for covariance structure modeling. Psychological Methods 1996, 1, 130–149. [Google Scholar] [CrossRef]
- Cohen, J. (1988). Statistical Power Analysis for the Behavioral Sciences, (2nd ed.). Lawrence Erlbaum Associates.
- Maxwell, S.E. The Persistence of Underpowered Studies in Psychological Research: Causes, Consequences, and Remedies. Psychological Methods 2004, 9, 147–163. [Google Scholar] [CrossRef] [PubMed]
- Hayes, A.F. (2013). Introduction to Mediation, Moderation, and Conditional Process Analysis: A Regression-Based Approach. Guilford Press.
- Hox, J.J.; Boeije, H.R. (2005). Data Collection, Primary versus Secondary. In International Encyclopedia of Social & Behavioral Sciences (pp. 3247-3252). Elsevier.
- Schreiber, J.B.; Nora, A.; Stage, F.K.; Barlow, E.A.; King, J. Reporting Structural Equation Modeling and Confirmatory Factor Analysis Results: A Review. The Journal of Educational Research 2006, 99, 323–338. [Google Scholar] [CrossRef]
- Muthén, B.; Asparouhov, T. Bayesian structural equation modeling: A more flexible representation of substantive theory. Psychological methods 2012, 17, 313–335. [Google Scholar] [CrossRef] [PubMed]
- van de Schoot, R.; Kaplan, D.; Denissen, J.; Asendorpf, J.B.; Neyer, F.J.; van Aken, M.A. G. A gentle introduction to Bayesian analysis: Applications to developmental research. Child Development 2014, 85, 842–860. [Google Scholar] [CrossRef] [PubMed]
- Muthén, L.K.; Muthén, B.O. (2012). Mplus User’s Guide (7th ed.). Muthén & Muthén.
- Byrne, B.M. (2016). Structural Equation Modeling with AMOS: Basic Concepts, Applications, and Programming (3rd ed.). Routledge.
- Kline, R.B. (2016). Principles and Practice of Structural Equation Modeling (4th ed.). Guilford Press.
- Hu, L.T.; Bentler, P.M. Cutoff criteria for fit indexes in covariance structure analysis: Conventional criteria versus new alternatives. Structural Equation Modeling: A Multidisciplinary Journal 1999, 6, 1–55. [Google Scholar] [CrossRef]
- Brown, T.A. (2015). Confirmatory Factor Analysis for Applied Research (2nd ed.). Guilford Press.
- Schwarz, G. Estimating the dimension of a model. The Annals of Statistics 1978, 6, 461–464. [Google Scholar] [CrossRef]
- Tucker, L.R.; Lewis, C. A reliability coefficient for maximum likelihood factor analysis. Psychometrika 1973, 38, 1–10. [Google Scholar] [CrossRef]
- Bentler, P.M. Comparative fit indexes in structural models. Psychological Bulletin 1990, 107, 238–246. [Google Scholar] [CrossRef] [PubMed]
- Steiger, J.H. Structural model evaluation and modification: An interval estimation approach. Multivariate Behavioral Research 1990, 25, 173–180. [Google Scholar] [CrossRef] [PubMed]
- Browne, M.W.; Cudeck, R. Alternative ways of assessing model fit. Sociological Methods & Research 1992, 21, 230–258. [Google Scholar]
- Gelman, A.; Meng, X.L.; Stern, H. Posterior predictive assessment of model fitness via realized discrepancies. Statistica Sinica 1996, 6, 733–760. [Google Scholar]
- Gelman, A.; Carlin, J.B.; Stern, H.S.; Dunson, D.B.; Vehtari, A.; Rubin, D.B. (2013). Bayesian Data Analysis (3rd ed.). Chapman and Hall/CRC.
- Asparouhov, T.; Muthén, B. (2010). Bayesian Analysis using Mplus: Technical Implementation, Mplus Web Notes, No. 14.
- Davison, A.C.; Hinkley, D.V. (1997). Bootstrap methods and their application, Cambridge University Press.
- Wilcox, R.R. (2017). Introduction to robust estimation and hypothesis testing (4th ed.). Academic Press.
- Rubinstein, R.Y.; Kroese, D.P. (2016). Simulation and the Monte Carlo Method, (3rd ed.). Wiley.
- Gilks, W.R.; Richardson, S.; Spiegelhalter, D.J. (1995). Markov Chain Monte Carlo in Practice, Chapman and Hall/CRC.
Figure 1.
Underlying Structural Model.
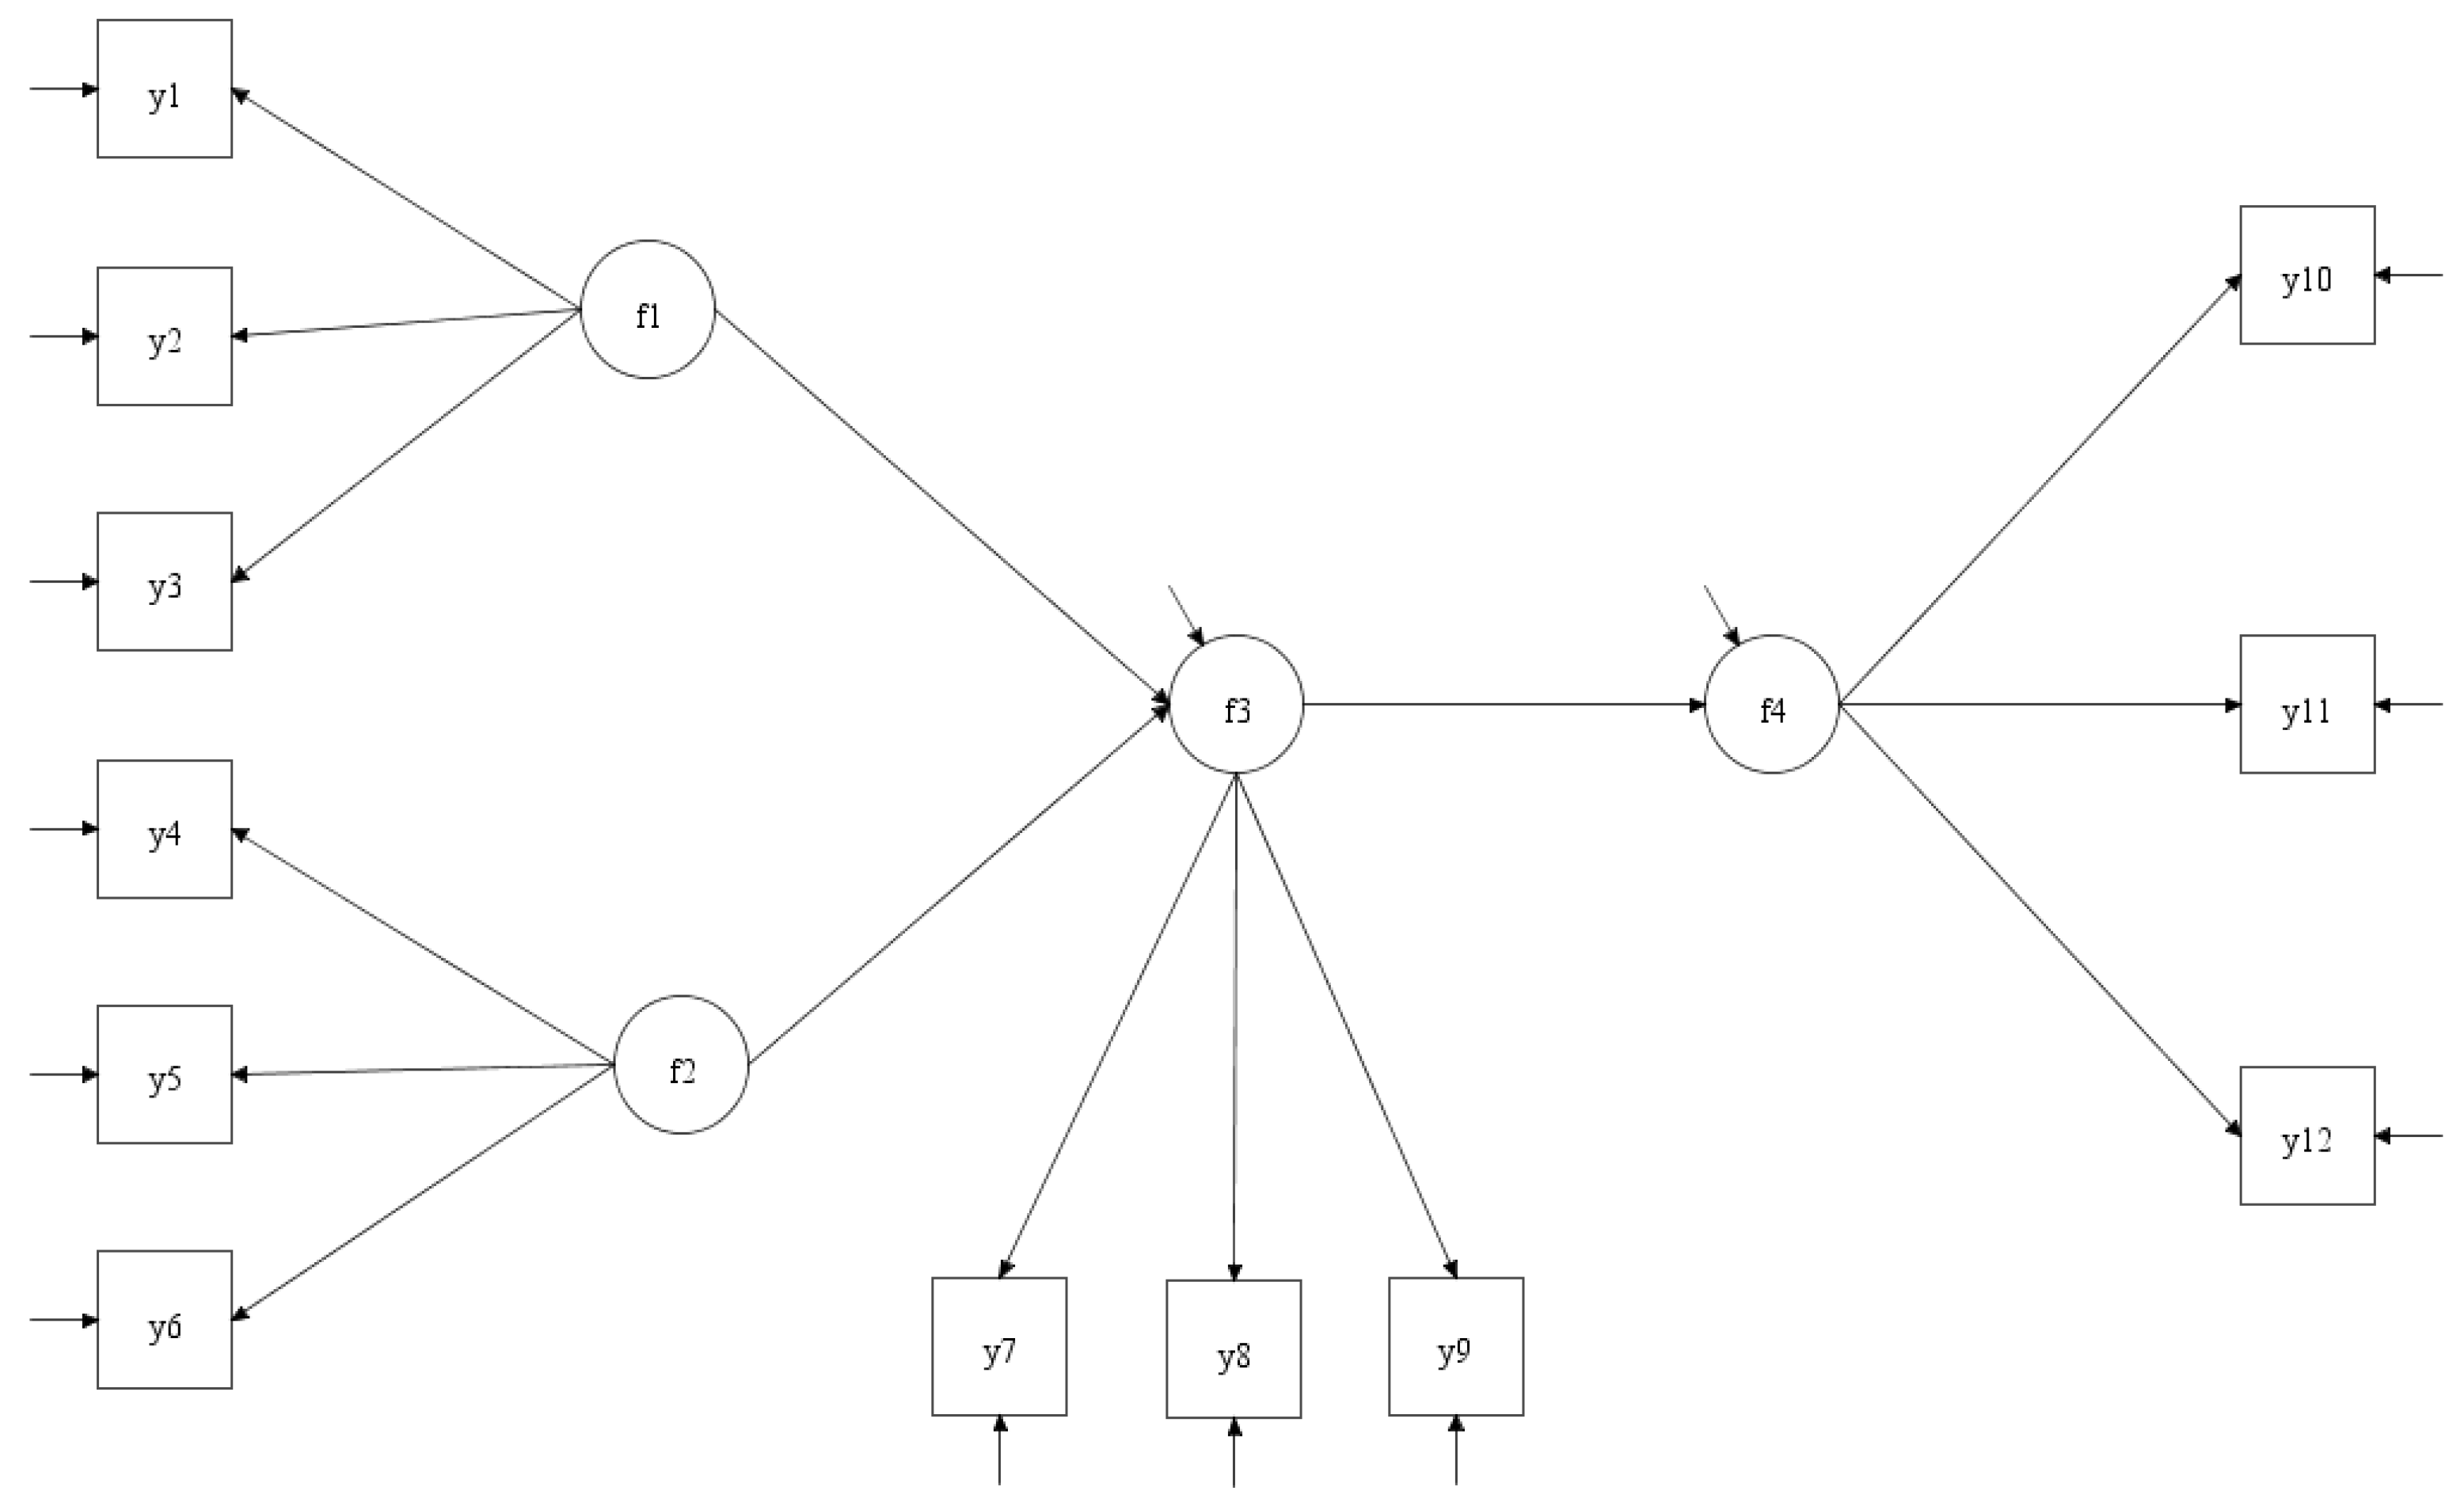
Figure 2.
Mean ꭓ2 by sample size.
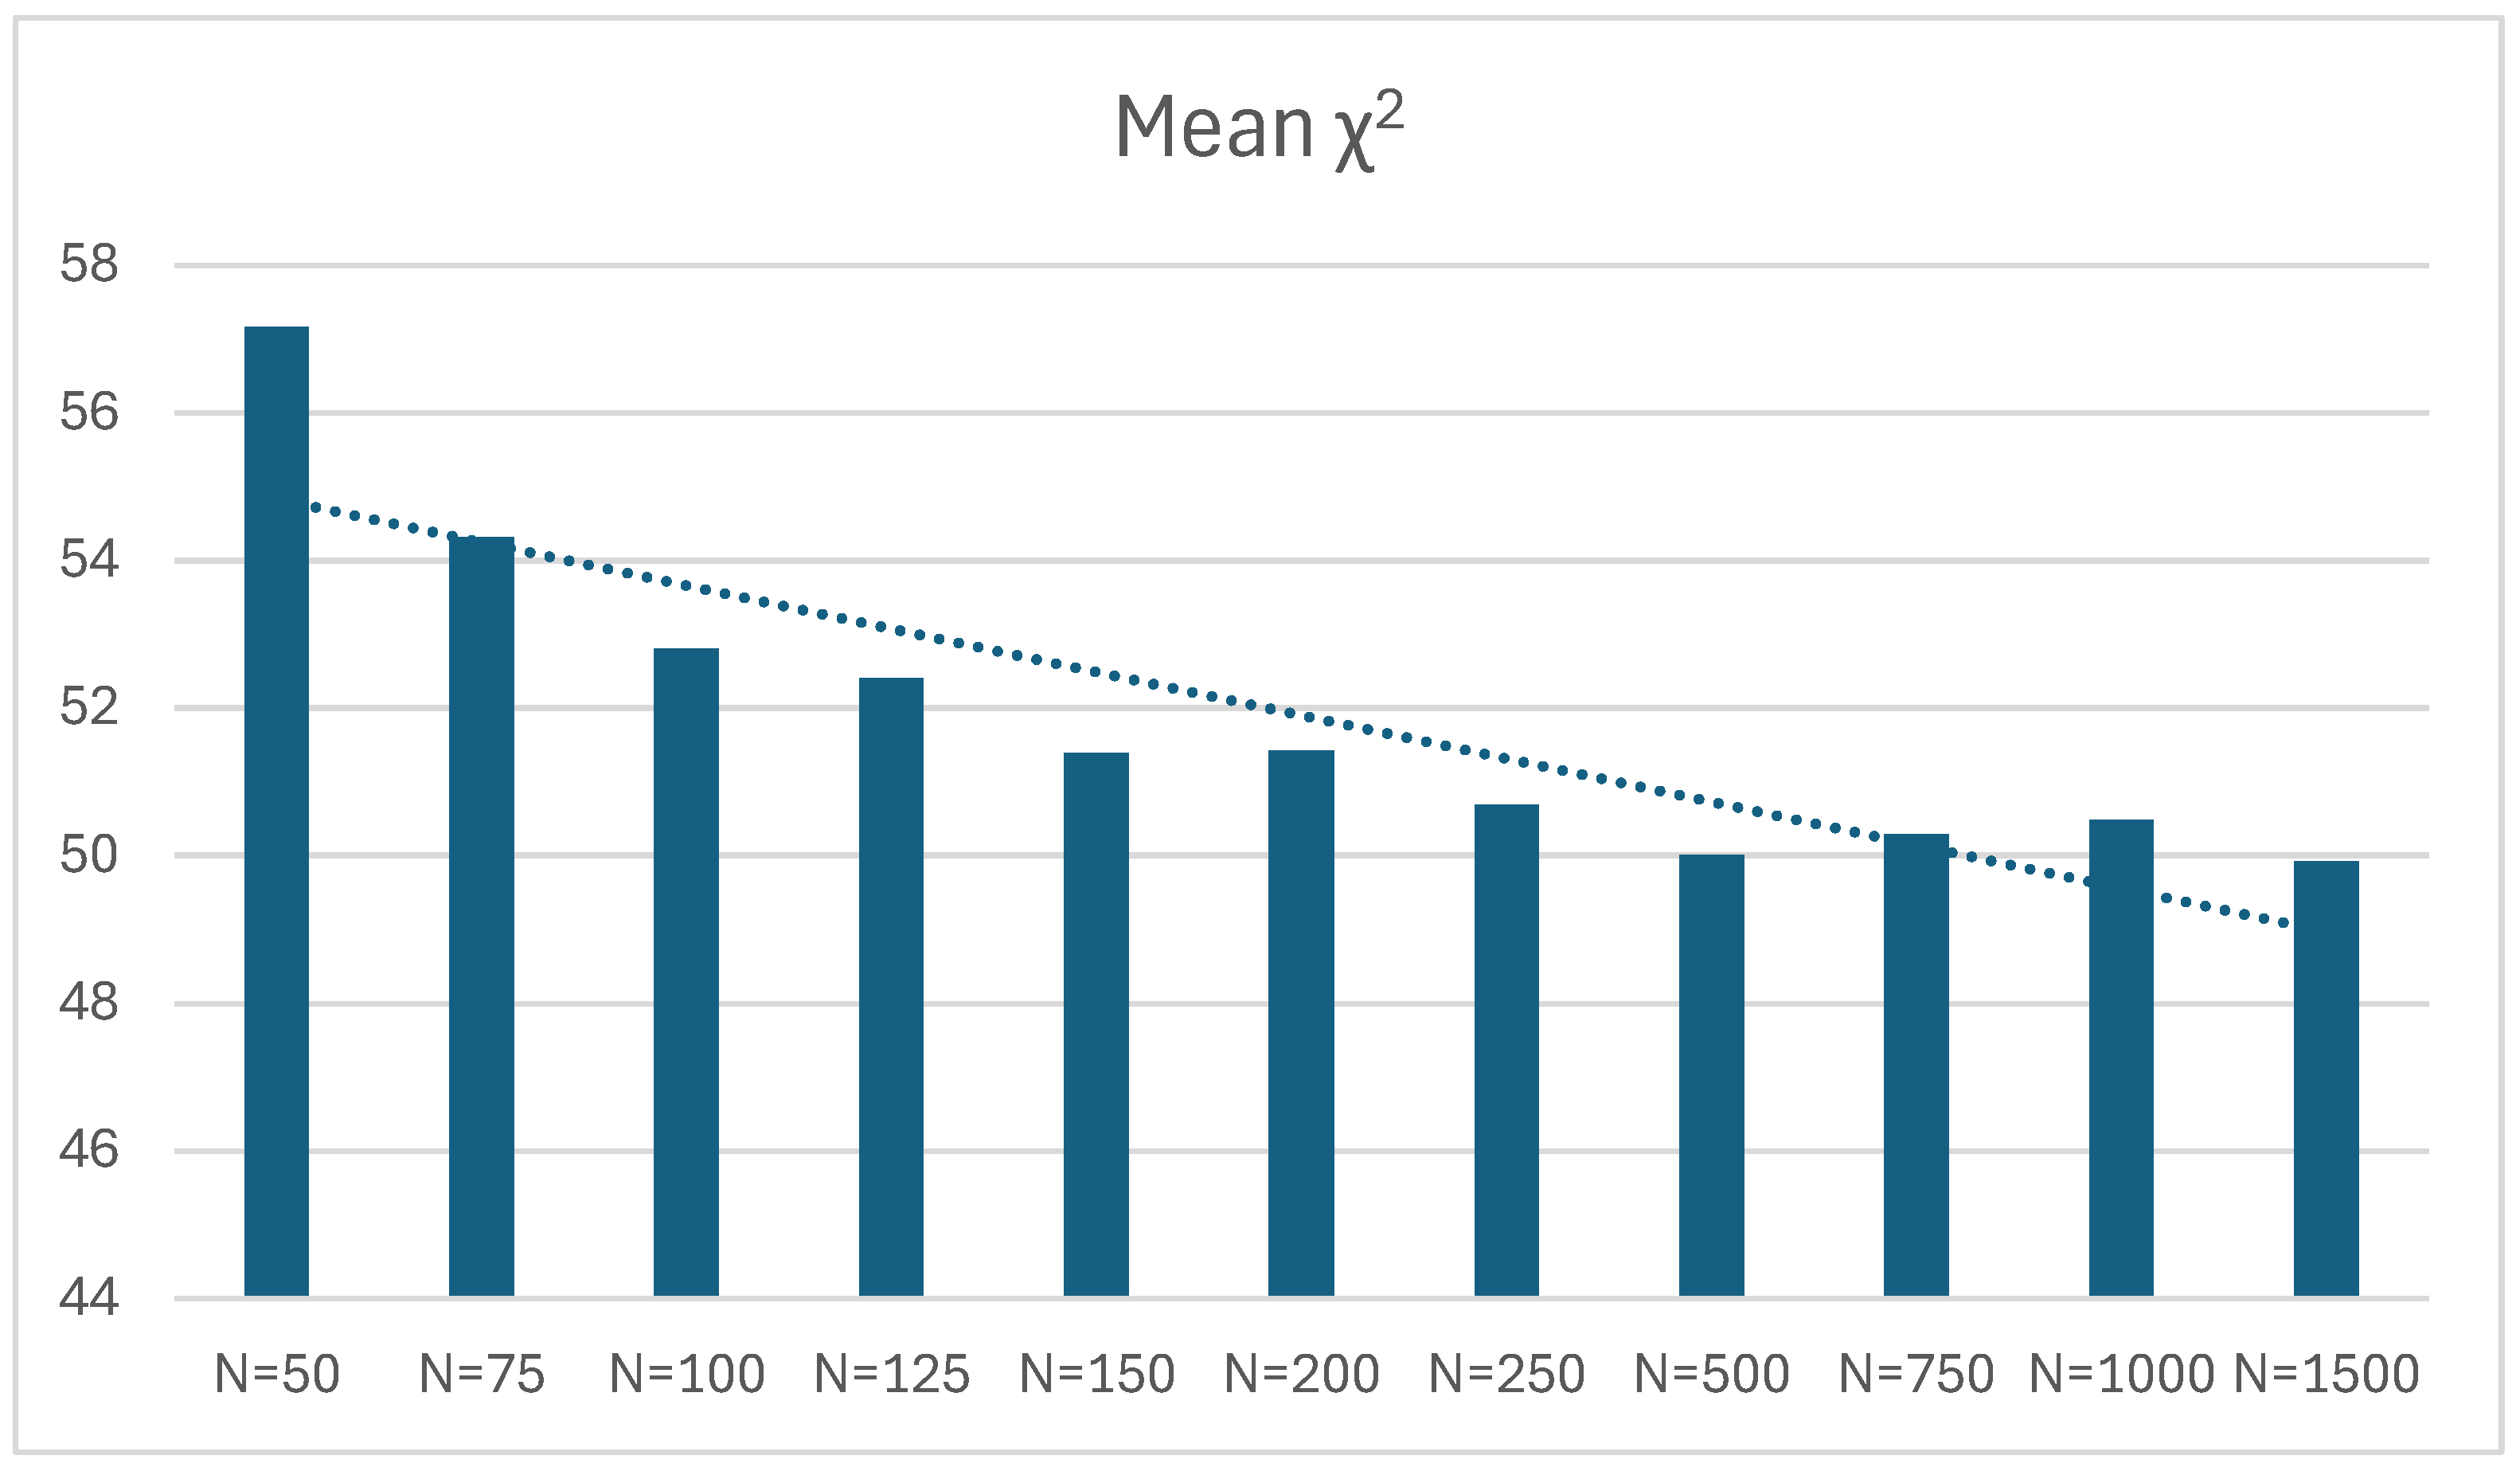
Figure 3.
Mean PPV by sample size.
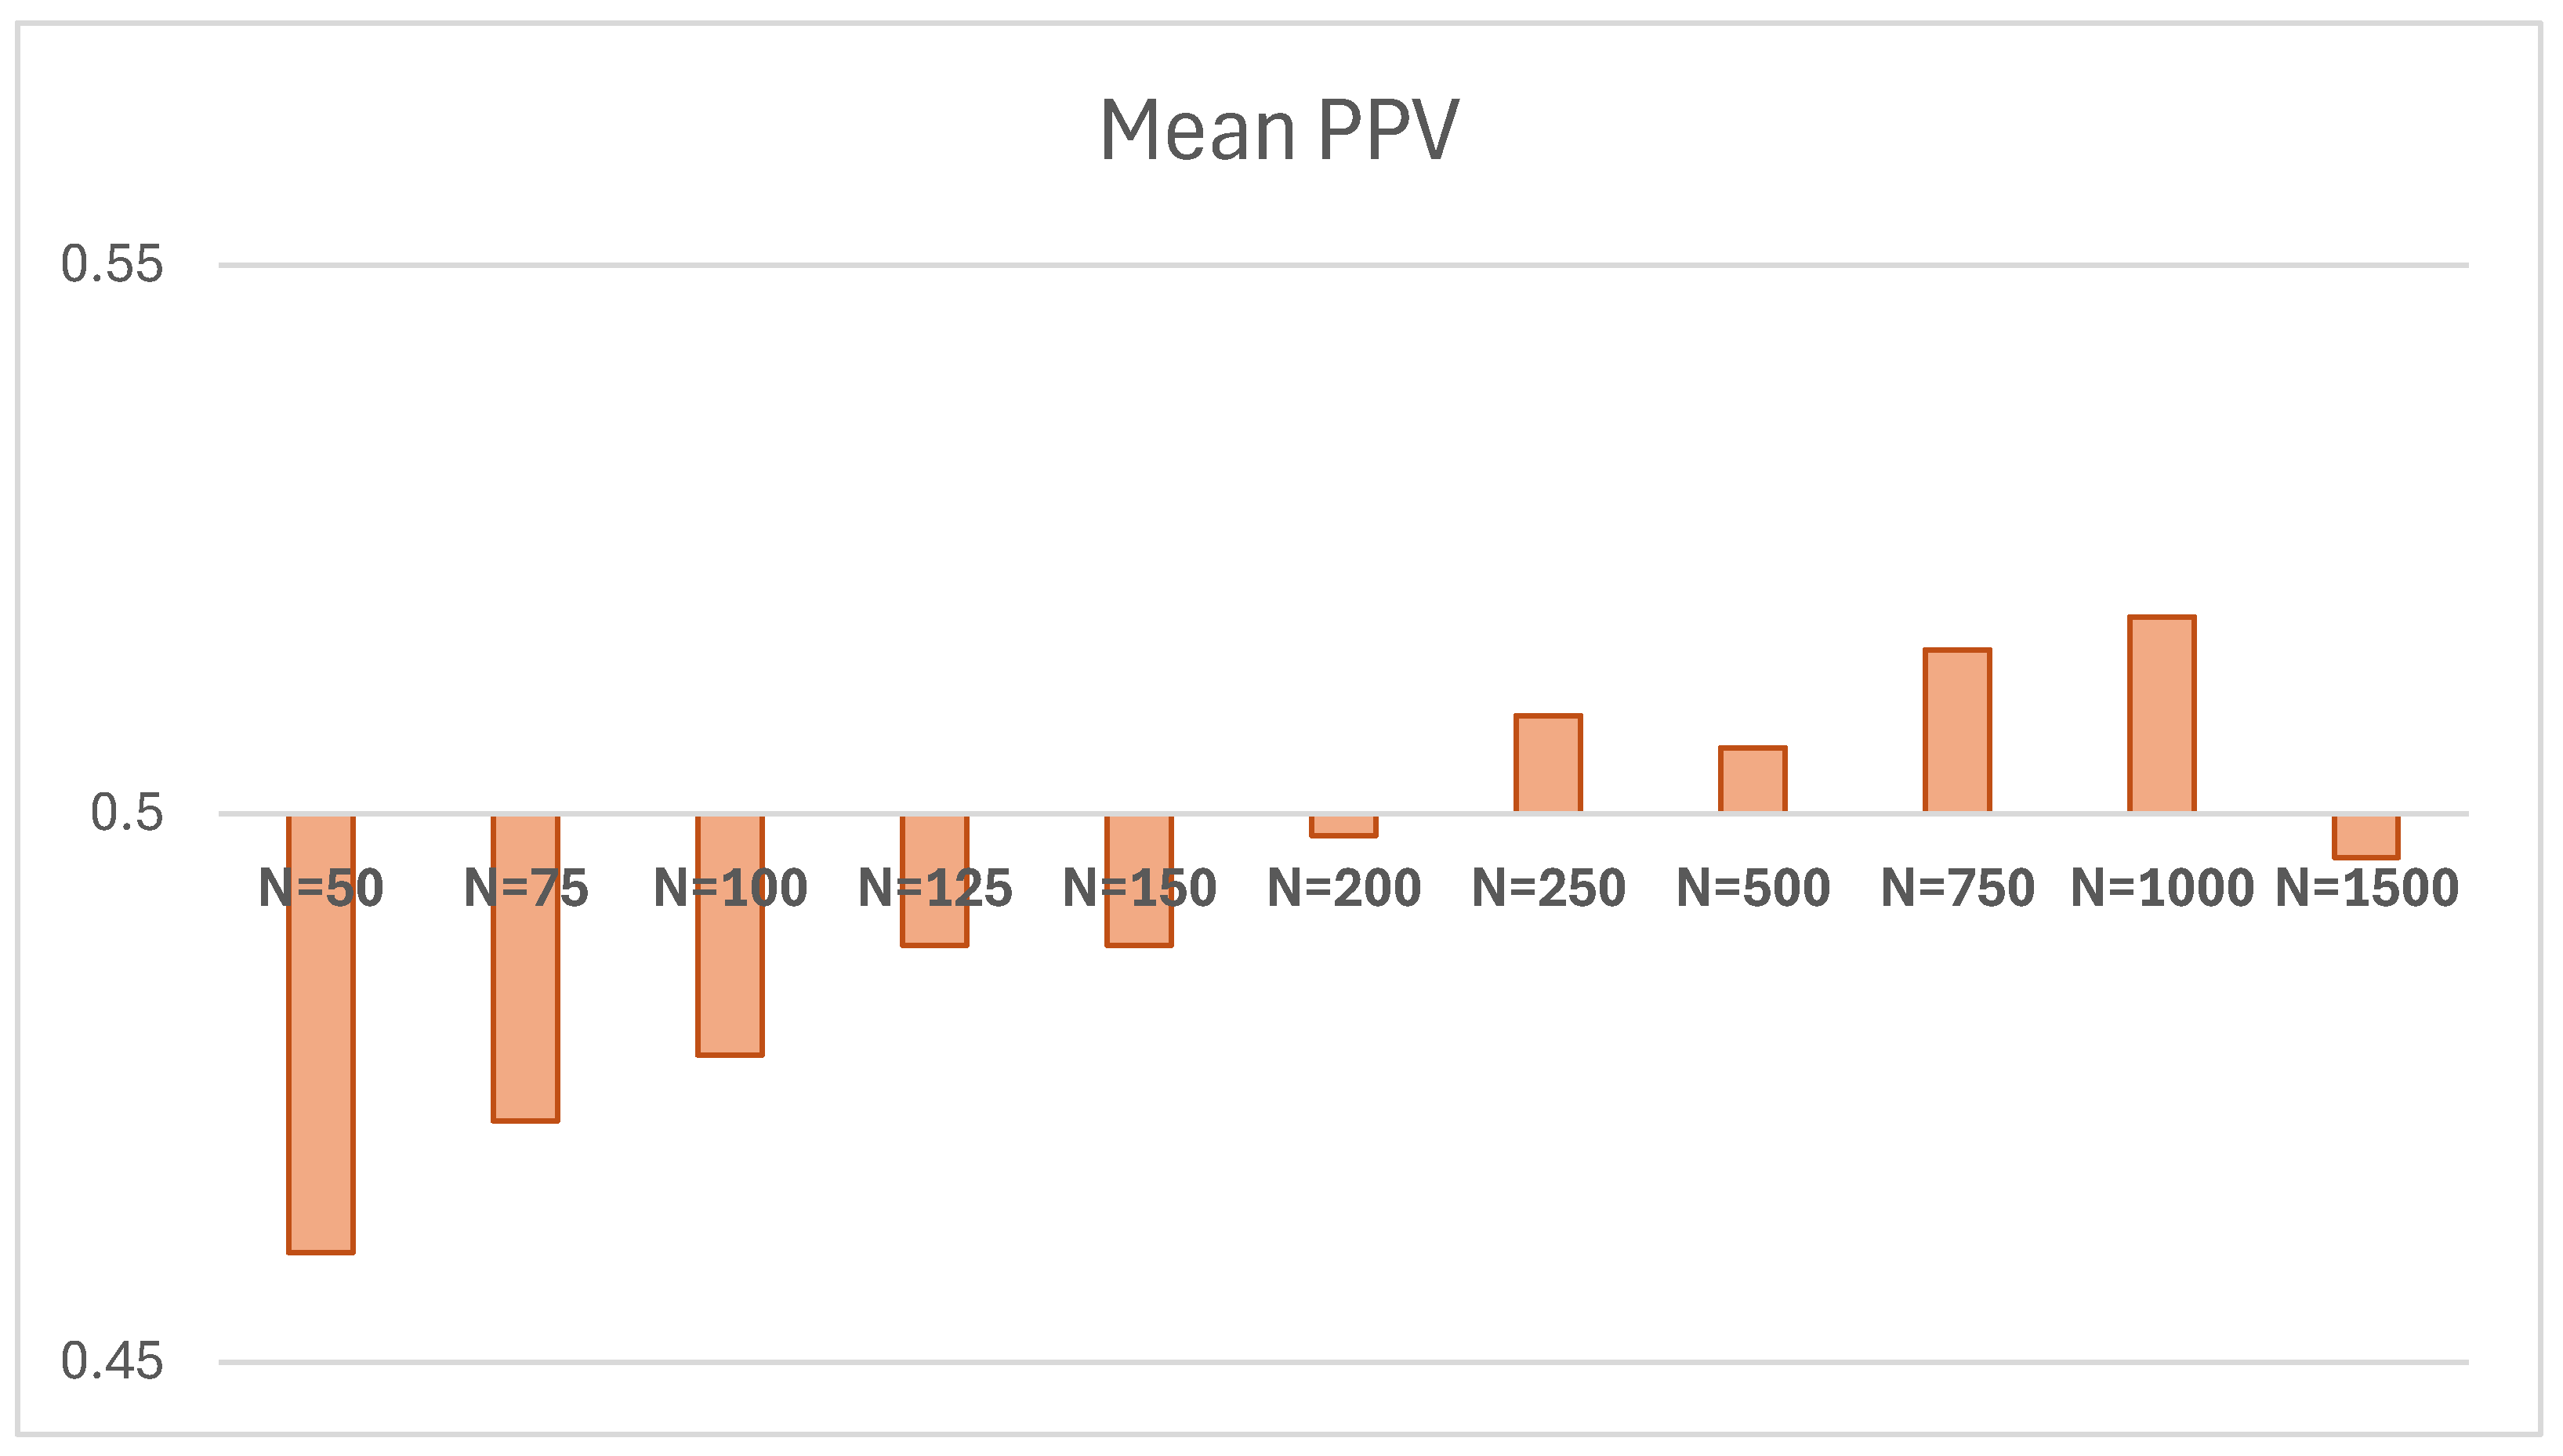
Figure 4.
Mean Bayes and ML BIC Values by Sample Size.
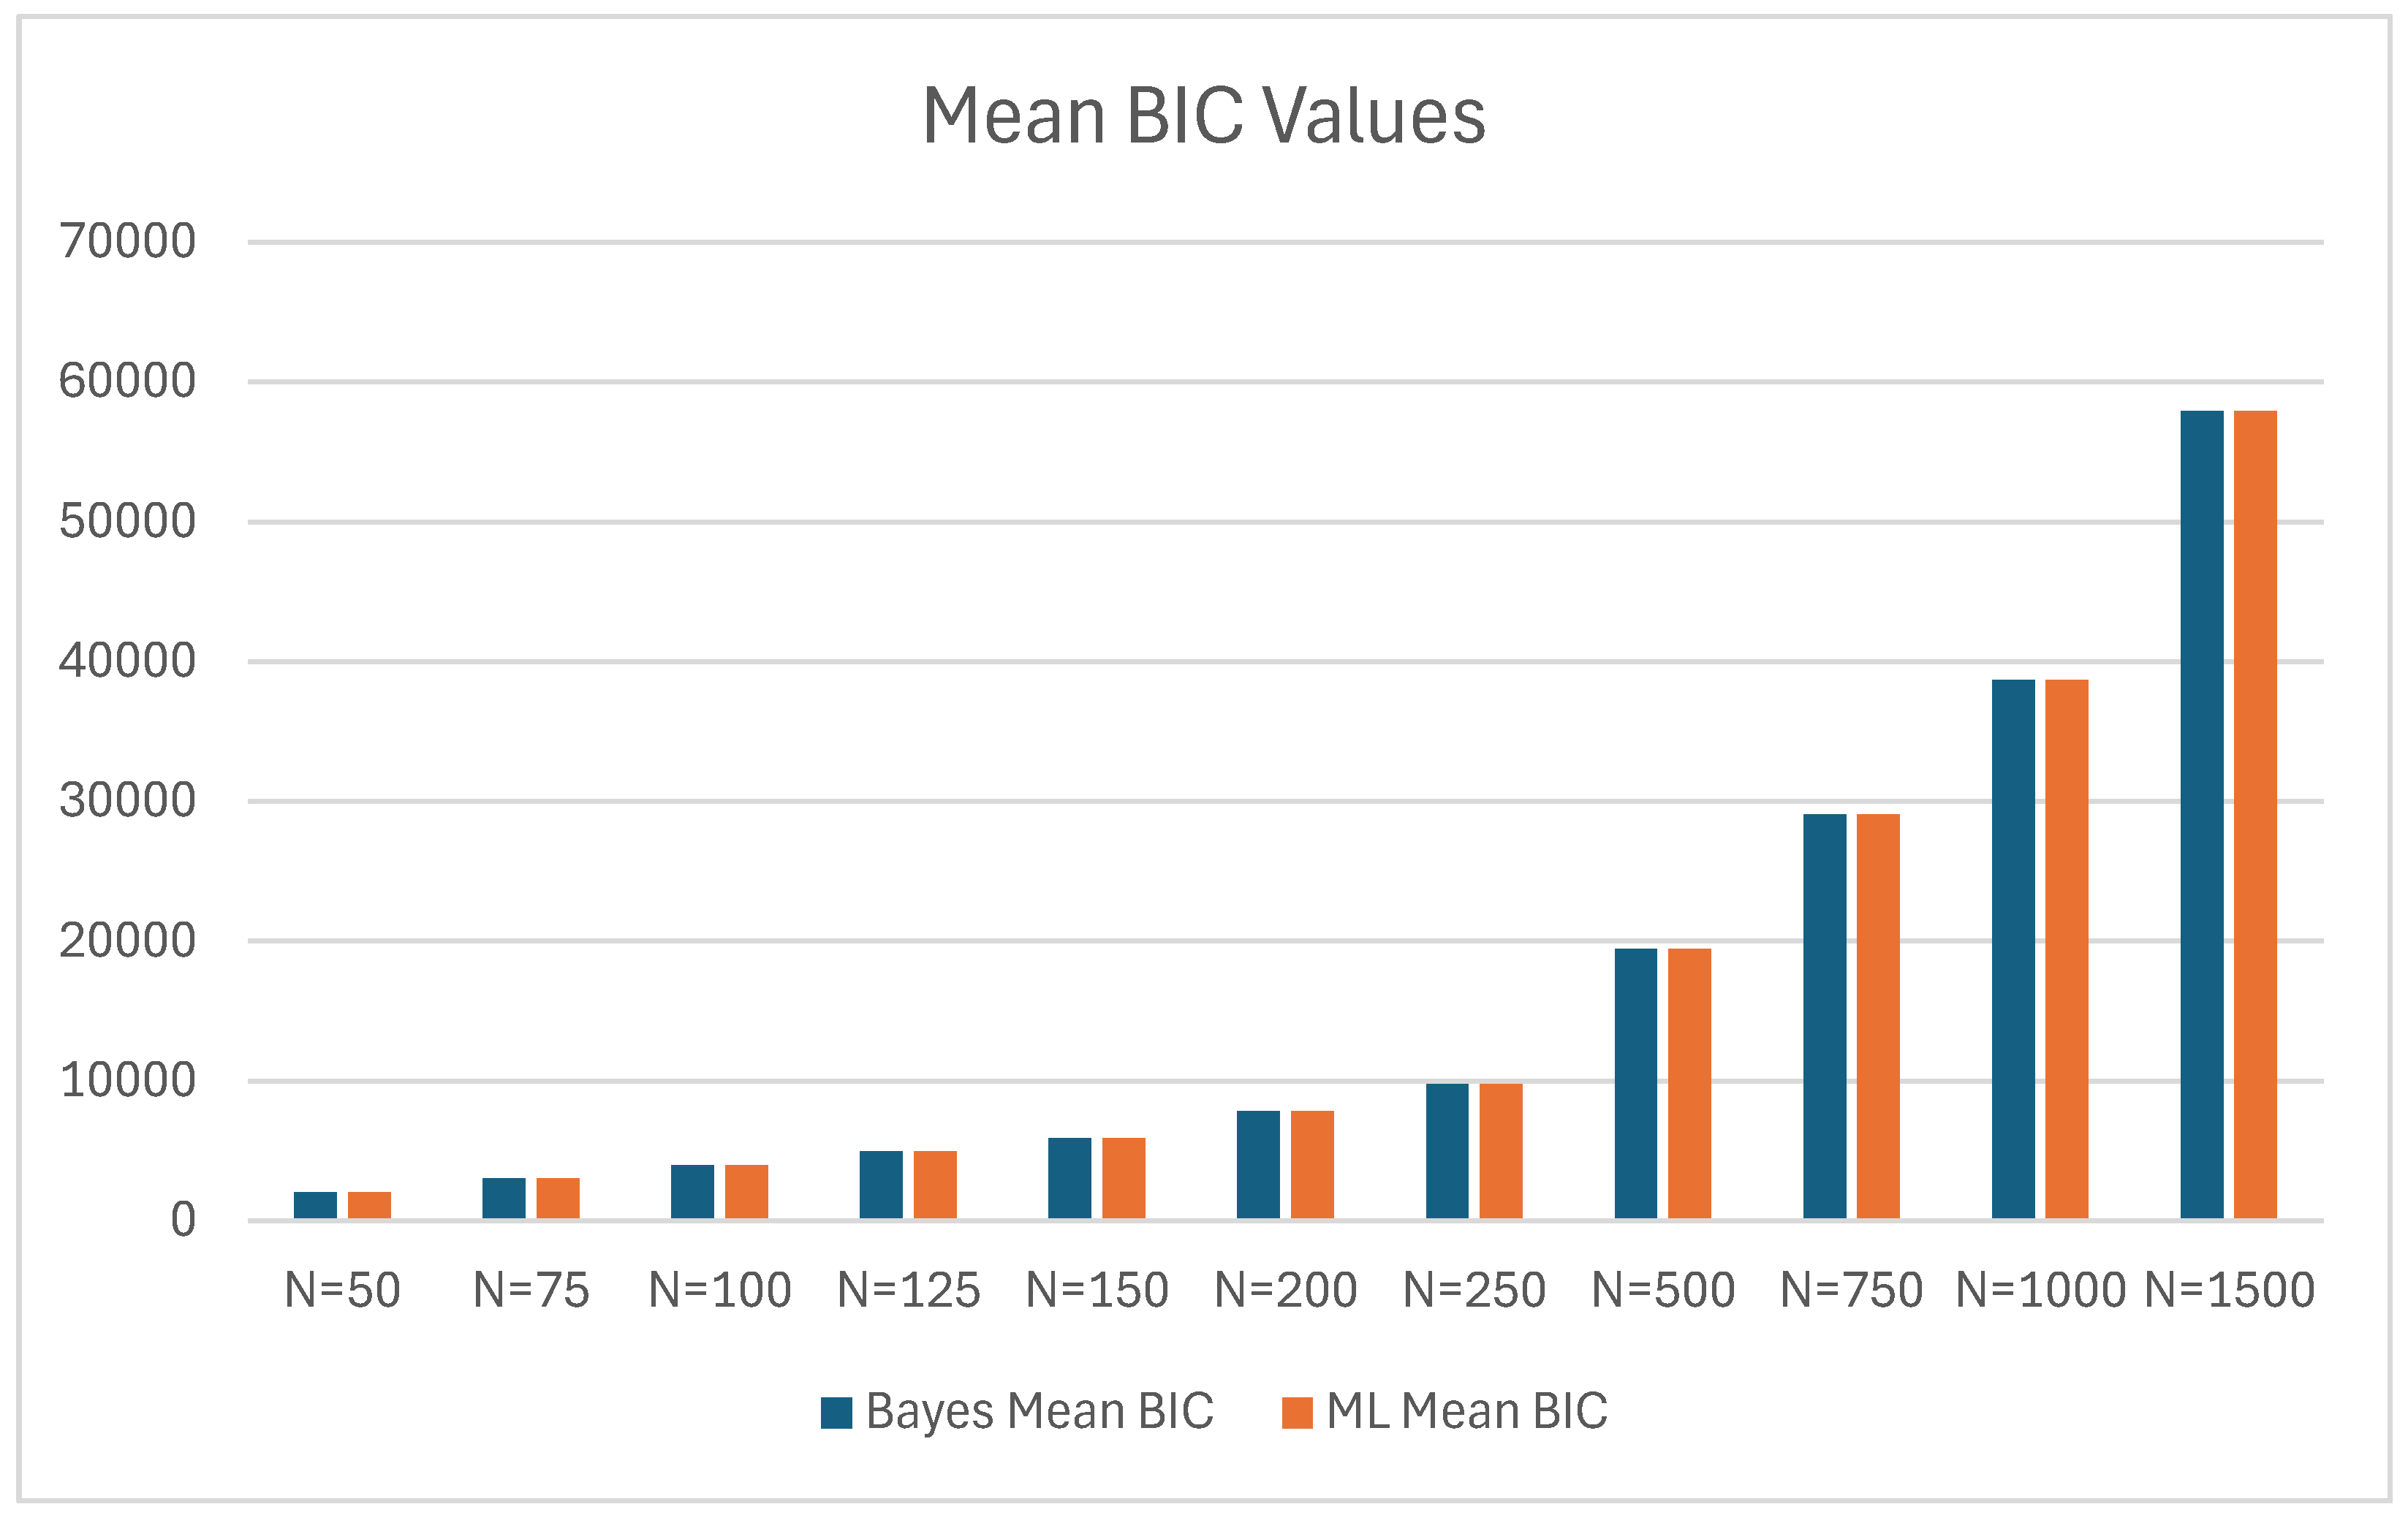
Figure 5.
Mean Bayes and ML TLI Values by Sample Size.
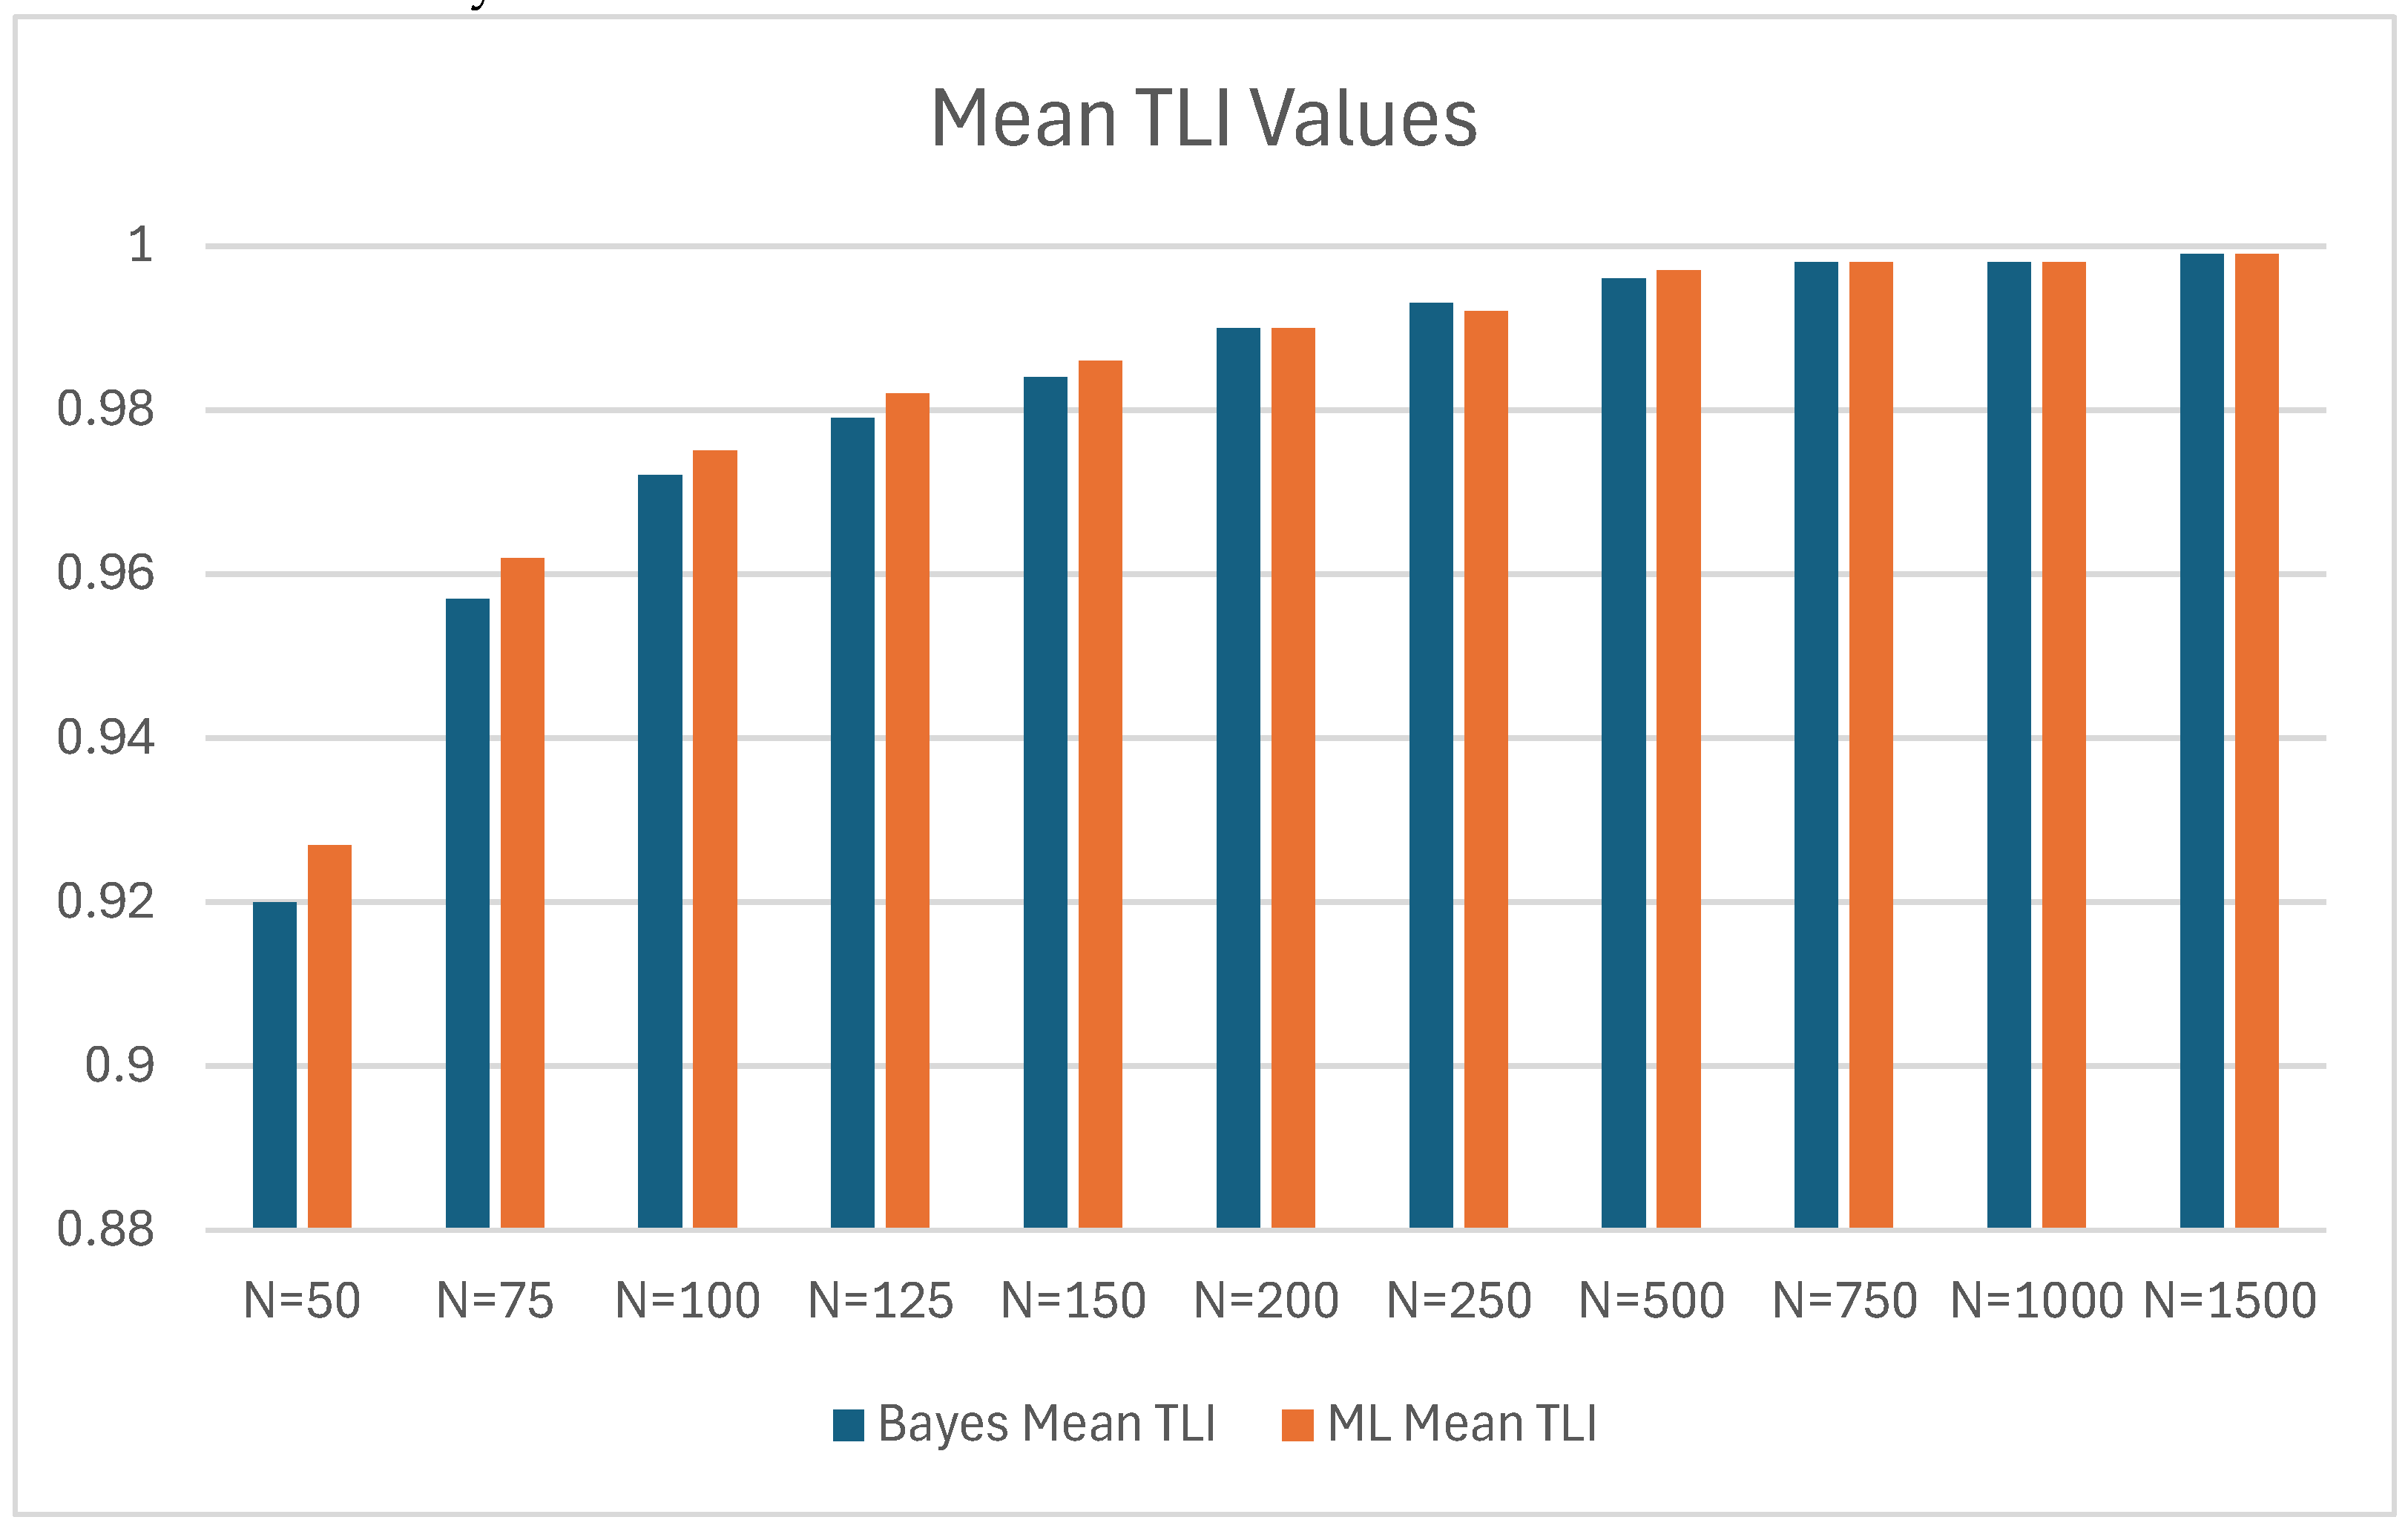
Figure 5.
Mean Bayes and ML CFI Values by Sample Size.
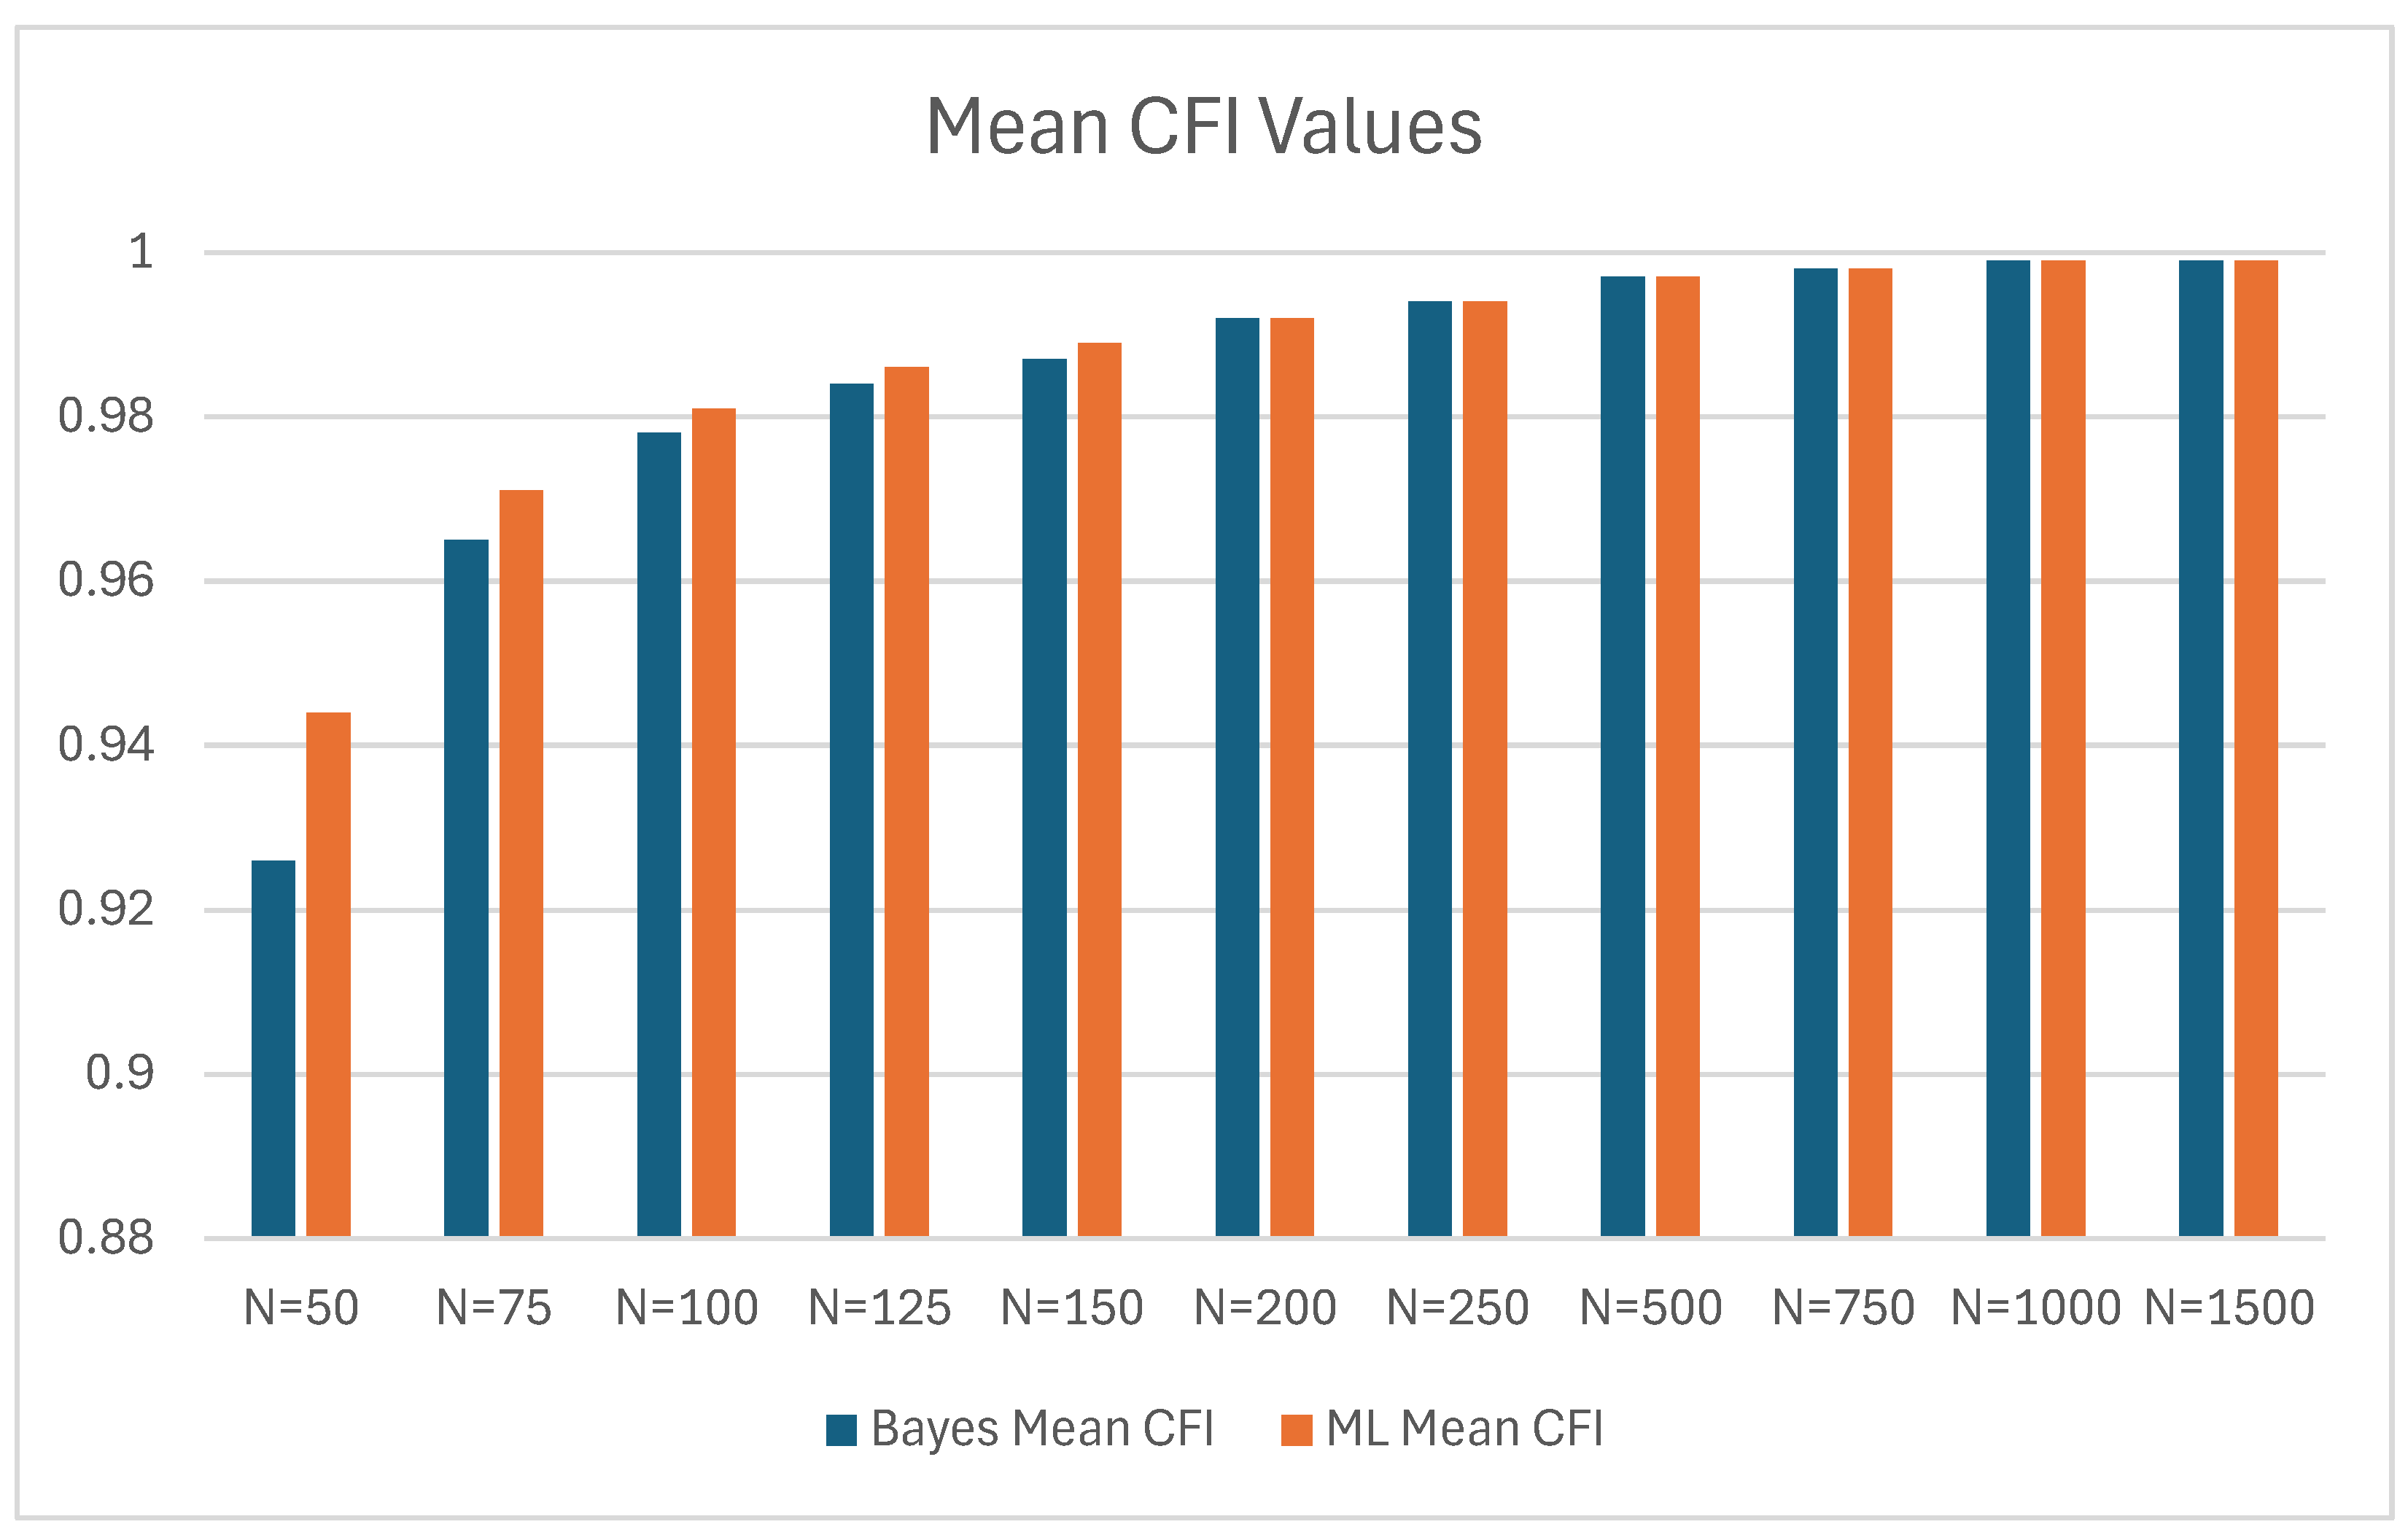
Figure 7.
Bayes and ML Mean RMSEA by Sample Size.
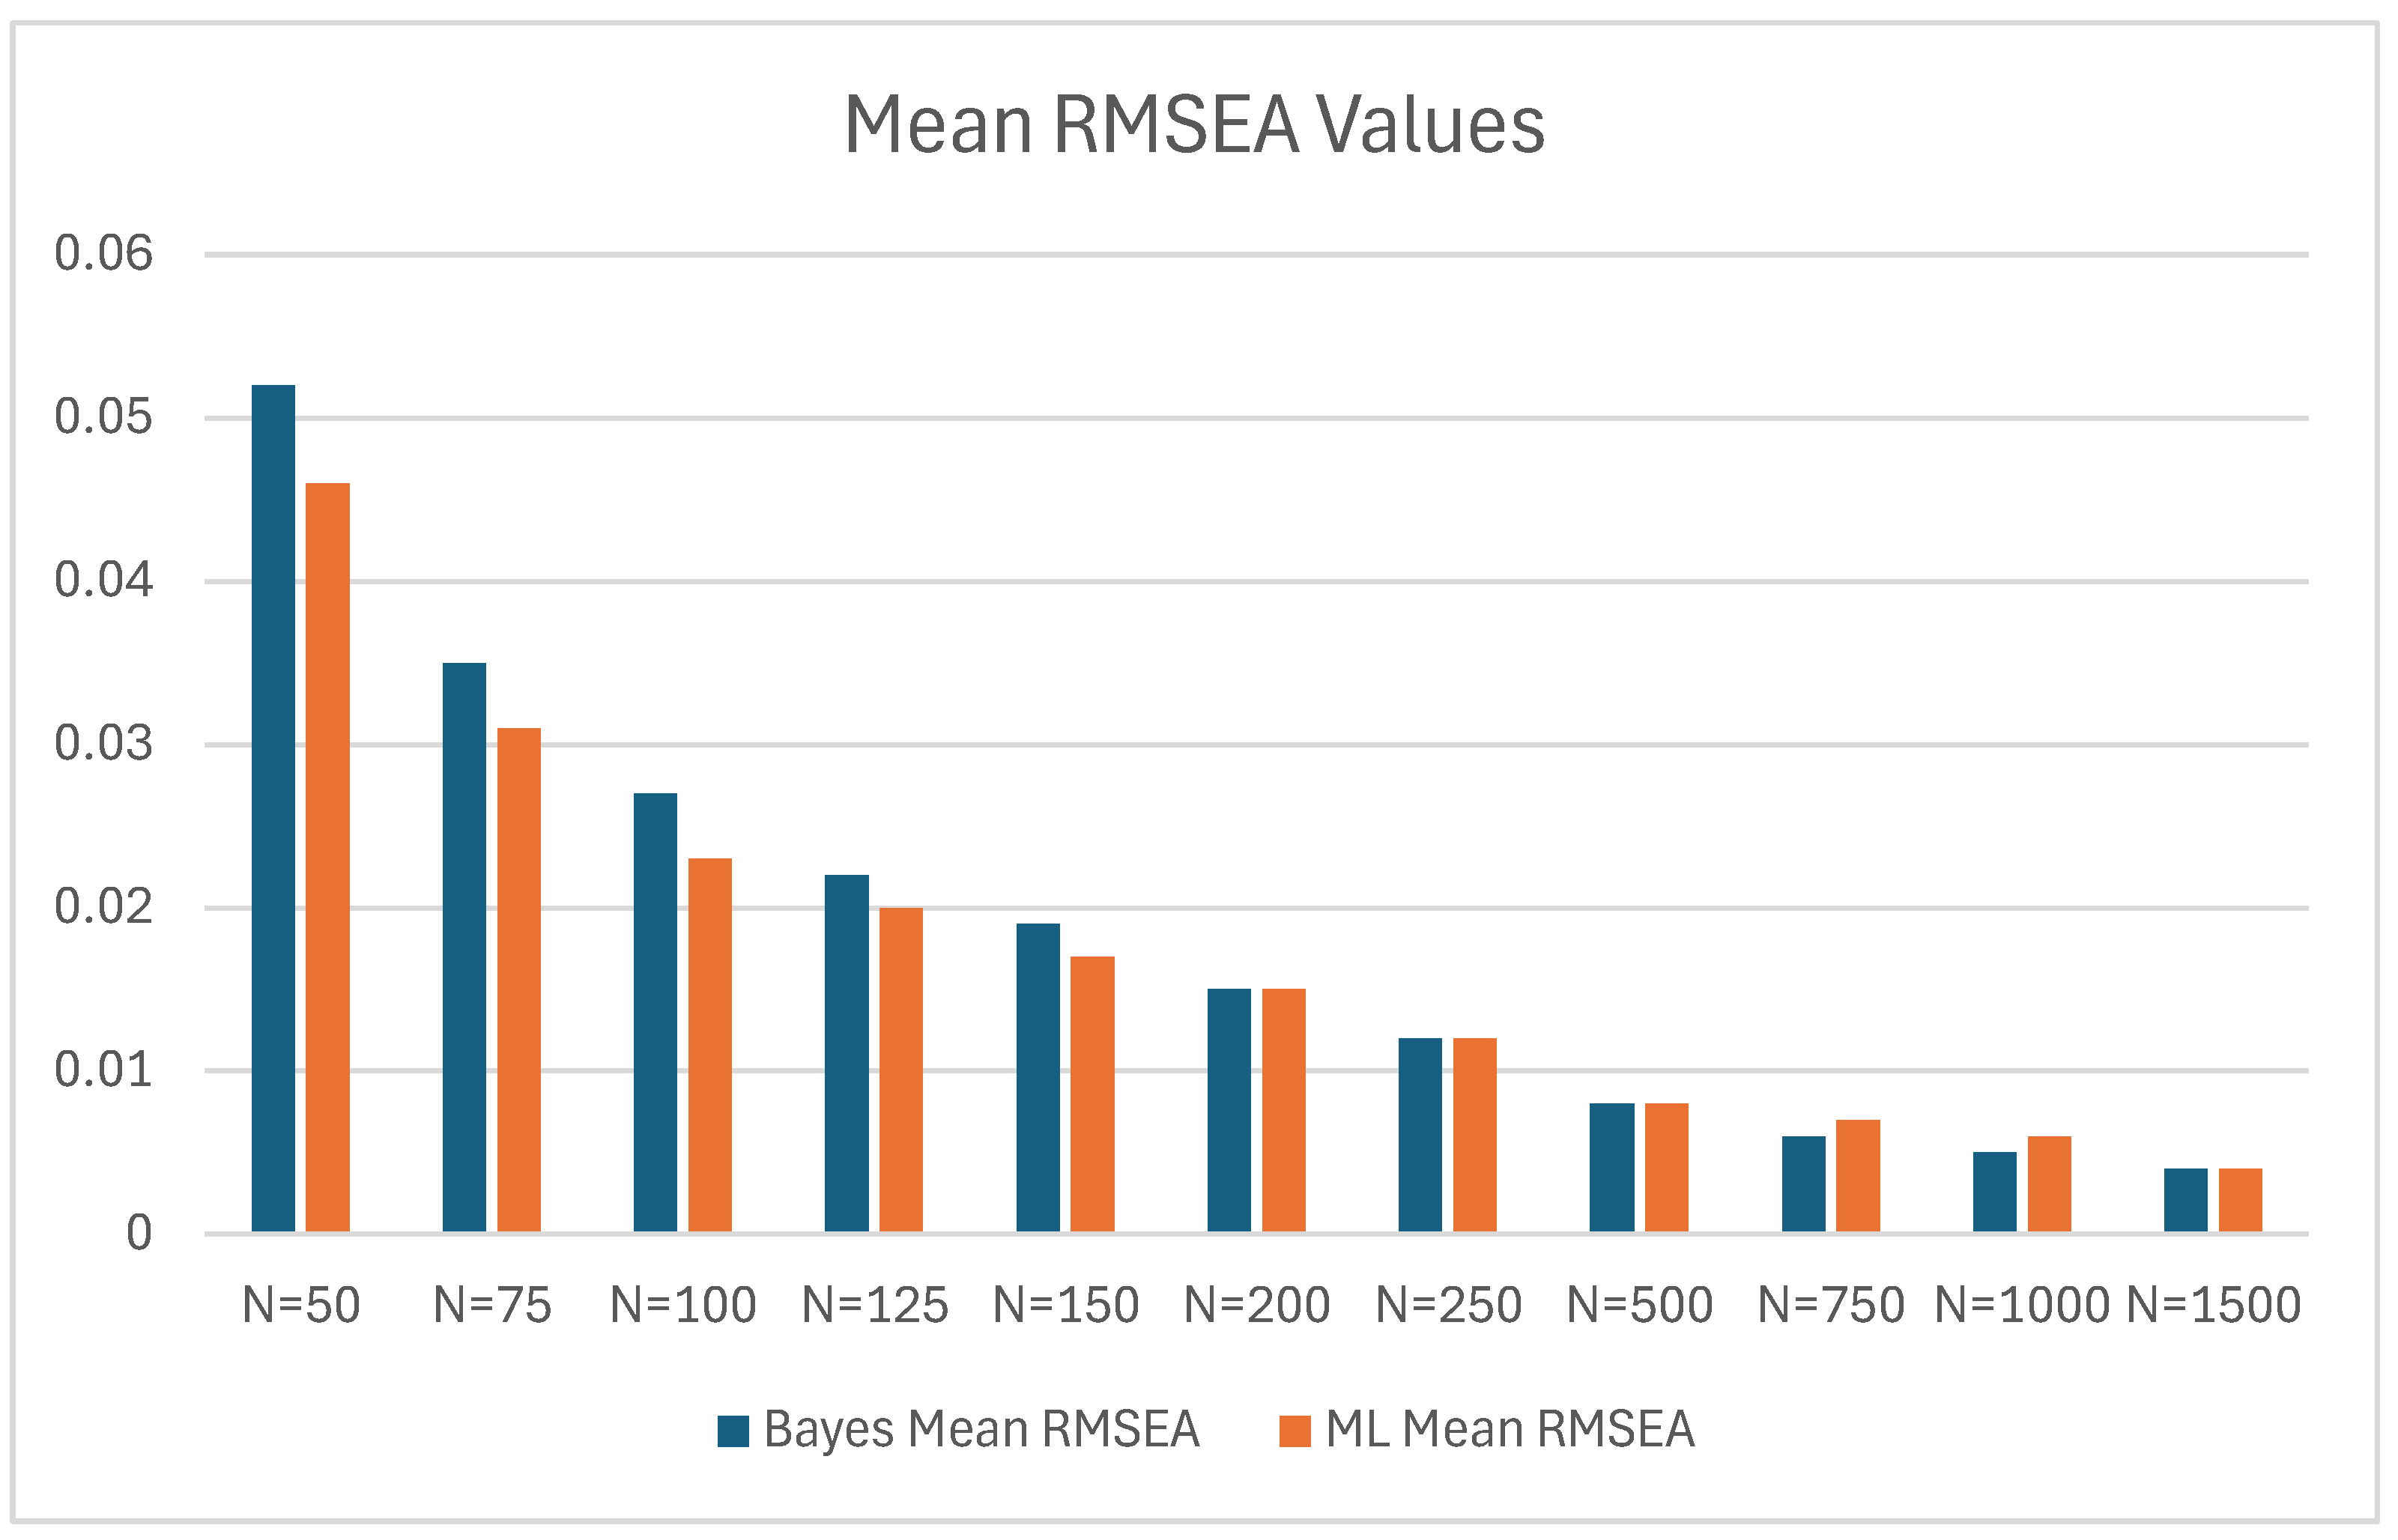

Table 1.
Bayes and ML Measures of Overall Model Fit.
| Bayes | ML | |||||||
|---|---|---|---|---|---|---|---|---|
| Posterior Predictive Value (PPV) | Chi-Square Test of Model Fit (df=50) | |||||||
| N | Mean PPV | Mean PPV – 0.5 | SD | N Successful Computations | Mean ꭓ2 | ꭓ2/df | SD | N Successful Computations |
| 50 | 0.460 | -0.040 | 0.220 | 500 | 57.161 | 1.14322 | 11.989 | 498 |
| 75 | 0.472 | -0.028 | 0.212 | 500 | 54.311 | 1.08622 | 10.724 | 500 |
| 100 | 0.478 | -0.022 | 0.207 | 500 | 52.803 | 1.05606 | 10.484 | 500 |
| 125 | 0.488 | -0.012 | 0.220 | 500 | 52.401 | 1.04802 | 10.248 | 500 |
| 150 | 0.488 | -0.012 | 0.223 | 500 | 51.393 | 1.02786 | 10.628 | 500 |
| 200 | 0.498 | -0.002 | 0.215 | 500 | 51.428 | 1.02856 | 10.274 | 500 |
| 250 | 0.509 | 0.009 | 0.217 | 500 | 50.694 | 1.01388 | 10.068 | 500 |
| 500 | 0.506 | 0.006 | 0.224 | 500 | 50.010 | 1.0002 | 9.866 | 500 |
| 750 | 0.515 | 0.015 | 0.217 | 500 | 50.299 | 1.00458 | 9.938 | 500 |
| 1000 | 0.518 | 0.018 | 0.222 | 500 | 50.487 | 1.00974 | 10.210 | 500 |
| 1500 | 0.496 | -0.004 | 0.222 | 500 | 49.926 | 0.99852 | 9.729 | 500 |
Table 2.
Bayes and ML BIC Values by Sample Size.
| Bayes | ML | Bayes Mean BIC – ML Mean BIC | |||
|---|---|---|---|---|---|
| N | Mean BIC | SD | Mean BIC | SD | |
| 50 | 2043.033 | 36.454 | 2039.316 | 35.157 | 3.717 |
| 75 | 3018.171 | 45.095 | 3017.153 | 43.054 | 1.018 |
| 100 | 3991.500 | 48.712 | 3990.543 | 48.387 | 0.957 |
| 125 | 4961.522 | 54.133 | 4961.807 | 54.398 | -0.285 |
| 150 | 5929.844 | 59.222 | 5929.626 | 56.952 | 0.218 |
| 200 | 7864.169 | 67.388 | 7864.701 | 66.513 | -0.532 |
| 250 | 9795.346 | 75.982 | 9794.467 | 74.758 | 0.879 |
| 500 | 19443.339 | 110.671 | 19439.265 | 105.014 | 4.074 |
| 750 | 29075.952 | 126.450 | 29072.427 | 124.156 | 3.525 |
| 1000 | 38703.213 | 153.895 | 38697.330 | 155.697 | 5.883 |
| 1500 | 57942.162 | 179.213 | 57943.171 | 183.588 | -1.009 |
Table 3.
Bayes and ML TLI Values by Sample Size.
| Bayes | ML | |||||
|---|---|---|---|---|---|---|
| N | Mean TLI | SD | Mean TLI | SD | Bayes Mean TLI - ML Mean TLI | |
| 50 | 0.920 | 0.073 | 0.927 | 0.080 | -0.007 | |
| 75 | 0.957 | 0.045 | 0.962 | 0.044 | -0.005 | |
| 100 | 0.972 | 0.032 | 0.975 | 0.033 | -0.003 | |
| 125 | 0.979 | 0.025 | 0.982 | 0.025 | -0.003 | |
| 150 | 0.984 | 0.021 | 0.986 | 0.021 | -0.002 | |
| 200 | 0.990 | 0.015 | 0.990 | 0.015 | 0 | |
| 250 | 0.993 | 0.011 | 0.992 | 0.011 | 0.001 | |
| 500 | 0.996 | 0.006 | 0.997 | 0.005 | -0.001 | |
| 750 | 0.998 | 0.004 | 0.998 | 0.004 | 0 | |
| 1000 | 0.998 | 0.003 | 0.998 | 0.003 | 0 | |
| 1500 | 0.999 | 0.002 | 0.999 | 0.002 | 0 | |
Table 4.
Mean Bayes and ML CFI by Sample Size.
| Bayes | ML | Bayes Mean CFI - ML Mean CFI | |||
|---|---|---|---|---|---|
| N | Mean CFI | SD | Mean CFI | SD | |
| 50 | 0.926 | 0.066 | 0.944 | 0.060 | -0.018 |
| 75 | 0.965 | 0.037 | 0.971 | 0.034 | -0.006 |
| 100 | 0.978 | 0.025 | 0.981 | 0.025 | -0.003 |
| 125 | 0.984 | 0.020 | 0.986 | 0.019 | -0.002 |
| 150 | 0.987 | 0.017 | 0.989 | 0.016 | -0.002 |
| 200 | 0.992 | 0.012 | 0.992 | 0.012 | 0 |
| 250 | 0.994 | 0.008 | 0.994 | 0.009 | 0 |
| 500 | 0.997 | 0.004 | 0.997 | 0.004 | 0 |
| 750 | 0.998 | 0.003 | 0.998 | 0.003 | 0 |
| 1000 | 0.999 | 0.002 | 0.999 | 0.002 | 0 |
| 1500 | 0.999 | 0.001 | 0.999 | 0.001 | 0 |
Table 5.
Bayes and ML Mean RMSEA Values by Sample Size.
| Bayes | ML | Bayes Mean RMSEA – ML Mean RMSEA | |||
|---|---|---|---|---|---|
| N | Mean RMSEA | SD | Mean RMSEA | SD | |
| 50 | 0.052 | 0.034 | 0.046 | 0.038 | 0.006 |
| 75 | 0.035 | 0.028 | 0.031 | 0.028 | 0.004 |
| 100 | 0.027 | 0.023 | 0.023 | 0.024 | 0.004 |
| 125 | 0.022 | 0.021 | 0.020 | 0.021 | 0.002 |
| 150 | 0.019 | 0.019 | 0.017 | 0.019 | 0.002 |
| 200 | 0.015 | 0.016 | 0.015 | 0.016 | 0.000 |
| 250 | 0.012 | 0.014 | 0.012 | 0.014 | 0.000 |
| 500 | 0.008 | 0.010 | 0.008 | 0.010 | 0.000 |
| 750 | 0.006 | 0.008 | 0.007 | 0.008 | -0.001 |
| 1000 | 0.005 | 0.007 | 0.006 | 0.007 | -0.001 |
| 1500 | 0.004 | 0.006 | 0.004 | 0.006 | 0.000 |
Table 6.
Bayes Mean Parameter Estimate (PE) by Sample Size.
| Sample Size | |||||||||||||
|---|---|---|---|---|---|---|---|---|---|---|---|---|---|
| 50 | 75 | 100 | 125 | 150 | 200 | 250 | 500 | 750 | 1000 | 1500 | |||
| Parameter | True Value | Mean PE | Mean PE | Mean PE | Mean PE | Mean PE | Mean PE | Mean PE | Mean PE | Mean PE | Mean PE | Mean PE | |
| F1 by | Y1 | 1.00 | 1.00 | 1.00 | 1.00 | 1.00 | 1.00 | 1.00 | 1.00 | 1.00 | 1.00 | 1.00 | 1.00 |
| Y2 | 1.00 | 1.24 | 1.09 | 1.06 | 1.05 | 1.03 | 1.02 | 1.02 | 1.01 | 1.01 | 1.01 | 1.00 | |
| Y3 | 1.00 | 1.19 | 1.07 | 1.04 | 1.03 | 1.03 | 1.02 | 1.02 | 1.01 | 1.01 | 1.01 | 1.00 | |
| F2 by | Y4 | 1.00 | 1.00 | 1.00 | 1.00 | 1.00 | 1.00 | 1.00 | 1.00 | 1.00 | 1.00 | 1.00 | 1.00 |
| Y5 | 0.80 | 1.22 | 0.86 | 0.84 | 0.82 | 0.82 | 0.81 | 0.81 | 0.81 | 0.80 | 0.80 | 0.80 | |
| Y6 | 0.80 | 1.13 | 0.86 | 0.83 | 0.81 | 0.81 | 0.81 | 0.80 | 0.80 | 0.80 | 0.80 | 0.80 | |
| F3 by | Y7 | 1.00 | 1.00 | 1.00 | 1.00 | 1.00 | 1.00 | 1.00 | 1.00 | 1.00 | 1.00 | 1.00 | 1.00 |
| Y8 | 0.90 | 0.93 | 0.92 | 0.92 | 0.91 | 0.91 | 0.90 | 0.90 | 0.90 | 0.90 | 0.90 | 0.90 | |
| Y9 | 0.90 | 0.92 | 0.92 | 0.91 | 0.91 | 0.91 | 0.90 | 0.90 | 0.90 | 0.90 | 0.90 | 0.90 | |
| F4 by | Y10 | 1.00 | 1.00 | 1.00 | 1.00 | 1.00 | 1.00 | 1.00 | 1.00 | 1.00 | 1.00 | 1.00 | 1.00 |
| Y11 | 0.70 | 0.71 | 0.70 | 0.70 | 0.70 | 0.71 | 0.71 | 0.70 | 0.70 | 0.70 | 0.70 | 0.70 | |
| Y12 | 0.70 | 0.73 | 0.73 | 0.72 | 0.71 | 0.71 | 0.71 | 0.71 | 0.70 | 0.70 | 0.70 | 0.70 | |
| F4 on | F3 | 0.60 | 0.57 | 0.58 | 0.59 | 0.59 | 0.59 | 0.59 | 0.59 | 0.60 | 0.60 | 0.60 | 0.60 |
| F3 on | F1 | 0.50 | 0.56 | 0.52 | 0.51 | 0.51 | 0.51 | 0.50 | 0.50 | 0.50 | 0.51 | 0.50 | 0.50 |
| F2 | 0.70 | 1.01 | 0.73 | 0.72 | 0.71 | 0.71 | 0.71 | 0.71 | 0.71 | 0.71 | 0.70 | 0.70 | |
Table 7.
Differences between Bayes Mean Parameter Estimates (PE) and True Values (TV) by Sample Size.
Table 7.
Differences between Bayes Mean Parameter Estimates (PE) and True Values (TV) by Sample Size.
| Sample Size | |||||||||||||
|---|---|---|---|---|---|---|---|---|---|---|---|---|---|
| 50 | 75 | 100 | 125 | 150 | 200 | 250 | 500 | 750 | 1000 | 1500 | |||
| Parameter | TV | Mean PE -TV | Mean PE -TV | Mean PE -TV | Mean PE -TV | Mean PE -TV | Mean PE -TV | Mean PE -TV | Mean PE -TV | Mean PE -TV | Mean PE -TV | Mean PE -TV | |
| F1 by | Y1 | 1.00 | 0.00 | 0.00 | 0.00 | 0.00 | 0.00 | 0.00 | 0.00 | 0.00 | 0.00 | 0.00 | 0.00 |
| Y2 | 1.00 | 0.24 | 0.09 | 0.06 | 0.05 | 0.03 | 0.02 | 0.02 | 0.01 | 0.01 | 0.01 | 0.00 | |
| Y3 | 1.00 | 0.19 | 0.07 | 0.04 | 0.03 | 0.03 | 0.02 | 0.02 | 0.01 | 0.01 | 0.01 | 0.00 | |
| F2 by | Y4 | 1.00 | 0.00 | 0.00 | 0.00 | 0.00 | 0.00 | 0.00 | 0.00 | 0.00 | 0.00 | 0.00 | 0.00 |
| Y5 | 0.80 | 0.42 | 0.06 | 0.04 | 0.02 | 0.02 | 0.01 | 0.01 | 0.01 | 0.00 | 0.00 | 0.00 | |
| Y6 | 0.80 | 0.33 | 0.06 | 0.03 | 0.01 | 0.01 | 0.01 | 0.00 | 0.00 | 0.00 | 0.00 | 0.00 | |
| F3 by | Y7 | 1.00 | 0.00 | 0.00 | 0.00 | 0.00 | 0.00 | 0.00 | 0.00 | 0.00 | 0.00 | 0.00 | 0.00 |
| Y8 | 0.90 | 0.03 | 0.02 | 0.02 | 0.01 | 0.01 | 0.00 | 0.00 | 0.00 | 0.00 | 0.00 | 0.00 | |
| Y9 | 0.90 | 0.02 | 0.02 | 0.01 | 0.01 | 0.01 | 0.00 | 0.00 | 0.00 | 0.00 | 0.00 | 0.00 | |
| F4 by | Y10 | 1.00 | 0.00 | 0.00 | 0.00 | 0.00 | 0.00 | 0.00 | 0.00 | 0.00 | 0.00 | 0.00 | 0.00 |
| Y11 | 0.70 | 0.01 | 0.00 | 0.00 | 0.00 | 0.01 | 0.01 | 0.00 | 0.00 | 0.00 | 0.00 | 0.00 | |
| Y12 | 0.70 | 0.03 | 0.03 | 0.02 | 0.01 | 0.01 | 0.01 | 0.01 | 0.00 | 0.00 | 0.00 | 0.00 | |
| F4 on | F3 | 0.60 | -0.03 | -0.02 | -0.01 | -0.01 | -0.01 | -0.01 | -0.01 | 0.00 | 0.00 | 0.00 | 0.00 |
| F3 on | F1 | 0.50 | 0.06 | 0.02 | 0.01 | 0.01 | 0.01 | 0.00 | 0.00 | 0.00 | 0.01 | 0.00 | 0.00 |
| F2 | 0.70 | 0.31 | 0.03 | 0.02 | 0.01 | 0.01 | 0.01 | 0.01 | 0.01 | 0.01 | 0.00 | 0.00 | |
Table 8.
Bayes Percentages of Significant Parameter Estimates (PEs).
| Sample Size | ||||||||||||
|---|---|---|---|---|---|---|---|---|---|---|---|---|
| 50 | 75 | 100 | 125 | 150 | 200 | 250 | 500 | 750 | 1000 | 1500 | ||
| Parameter | %Sig. PEs | %Sig. PEs | %Sig. PEs | %Sig. PEs | %Sig. PEs | %Sig. PEs | %Sig. PEs | %Sig. PEs | %Sig. PEs | %Sig. PEs | %Sig. PEs | |
| F1 by | Y1 | 0.0% | 0.0% | 0.0% | 0.0% | 0.0% | 0.0% | 0.0% | 0.0% | 0.0% | 0.0% | 0.0% |
| Y2 | 98.8% | 99.8% | 100.0% | 100.0% | 100.0% | 100.0% | 100.0% | 100.0% | 100.0% | 100.0% | 100.0% | |
| Y3 | 98.2% | 100.0% | 100.0% | 100.0% | 100.0% | 100.0% | 100.0% | 100.0% | 100.0% | 100.0% | 100.0% | |
| F2 by | Y4 | 0.0% | 0.0% | 0.0% | 0.0% | 0.0% | 0.0% | 0.0% | 0.0% | 0.0% | 0.0% | 0.0% |
| Y5 | 93.8% | 99.4% | 99.8% | 100.0% | 100.0% | 100.0% | 100.0% | 100.0% | 100.0% | 100.0% | 100.0% | |
| Y6 | 93.4% | 99.6% | 99.8% | 100.0% | 100.0% | 100.0% | 100.0% | 100.0% | 100.0% | 100.0% | 100.0% | |
| F3 by | Y7 | 0.0% | 0.0% | 0.0% | 0.0% | 0.0% | 0.0% | 0.0% | 0.0% | 0.0% | 0.0% | 0.0% |
| Y8 | 99.4% | 100.0% | 100.0% | 100.0% | 100.0% | 100.0% | 100.0% | 100.0% | 100.0% | 100.0% | 100.0% | |
| Y9 | 99.8% | 100.0% | 100.0% | 100.0% | 100.0% | 100.0% | 100.0% | 100.0% | 100.0% | 100.0% | 100.0% | |
| F4 by | Y10 | 0.0% | 0.0% | 0.0% | 0.0% | 0.0% | 0.0% | 0.0% | 0.0% | 0.0% | 0.0% | 0.0% |
| Y11 | 88.4% | 97.6% | 99.8% | 99.8% | 100.0% | 100.0% | 100.0% | 100.0% | 100.0% | 100.0% | 100.0% | |
| Y12 | 90.8% | 99.0% | 99.8% | 100.0% | 100.0% | 100.0% | 100.0% | 100.0% | 100.0% | 100.0% | 100.0% | |
| F4 on | F3 | 92.8% | 98.8% | 100.0% | 100.0% | 100.0% | 100.0% | 100.0% | 100.0% | 100.0% | 100.0% | 100.0% |
| F3 on | F1 | 69.6% | 87.0% | 95.4% | 99.0% | 99.8% | 100.0% | 100.0% | 100.0% | 100.0% | 100.0% | 100.0% |
| F2 | 89.2% | 98.0% | 99.8% | 100.0% | 100.0% | 100.0% | 100.0% | 100.0% | 100.0% | 100.0% | 100.0% | |
Table 9.
ML Mean Parameter Estimate (PE) by Sample Size.
| Sample Size | |||||||||||||
|---|---|---|---|---|---|---|---|---|---|---|---|---|---|
| 50 | 75 | 100 | 125 | 150 | 200 | 250 | 500 | 750 | 1000 | 1500 | |||
| Parameter | True Value | Mean PE | Mean PE | Mean PE | Mean PE | Mean PE | Mean PE | Mean PE | Mean PE | Mean PE | Mean PE | Mean PE | |
| F1 by | Y1 | 1.00 | 1.00 | 1.00 | 1.00 | 1.00 | 1.00 | 1.00 | 1.00 | 1.00 | 1.00 | 1.00 | 1.00 |
| Y2 | 1.00 | 1.10 | 1.05 | 1.03 | 1.02 | 1.02 | 1.01 | 1.01 | 1.01 | 1.00 | 1.00 | 1.00 | |
| Y3 | 1.00 | 1.08 | 1.05 | 1.03 | 1.01 | 1.01 | 1.01 | 1.01 | 1.00 | 1.00 | 1.00 | 1.00 | |
| F2 by | Y4 | 1.00 | 1.00 | 1.00 | 1.00 | 1.00 | 1.00 | 1.00 | 1.00 | 1.00 | 1.00 | 1.00 | 1.00 |
| Y5 | 0.80 | 0.85 | 0.83 | 0.82 | 0.81 | 0.81 | 0.81 | 0.81 | 0.80 | 0.80 | 0.80 | 0.80 | |
| Y6 | 0.80 | 0.83 | 0.82 | 0.81 | 0.81 | 0.81 | 0.81 | 0.80 | 0.80 | 0.80 | 0.80 | 0.80 | |
| F3 by | Y7 | 1.00 | 1.00 | 1.00 | 1.00 | 1.00 | 1.00 | 1.00 | 1.00 | 1.00 | 1.00 | 1.00 | 1.00 |
| Y8 | 0.90 | 0.93 | 0.92 | 0.92 | 0.92 | 0.92 | 0.91 | 0.91 | 0.91 | 0.91 | 0.91 | 0.90 | |
| Y9 | 0.90 | 0.93 | 0.93 | 0.92 | 0.92 | 0.92 | 0.91 | 0.91 | 0.91 | 0.90 | 0.90 | 0.90 | |
| F4 by | Y10 | 1.00 | 1.00 | 1.00 | 1.00 | 1.00 | 1.00 | 1.00 | 1.00 | 1.00 | 1.00 | 1.00 | 1.00 |
| Y11 | 0.70 | 0.79 | 0.73 | 0.72 | 0.72 | 0.72 | 0.71 | 0.71 | 0.70 | 0.70 | 0.70 | 0.70 | |
| Y12 | 0.70 | 0.75 | 0.73 | 0.71 | 0.71 | 0.71 | 0.70 | 0.70 | 0.70 | 0.70 | 0.70 | 0.70 | |
| F4 on | F3 | 0.60 | 0.60 | 0.61 | 0.61 | 0.61 | 0.61 | 0.61 | 0.61 | 0.61 | 0.61 | 0.60 | 0.60 |
| F3 on | F1 | 0.50 | 0.53 | 0.52 | 0.51 | 0.51 | 0.51 | 0.50 | 0.50 | 0.50 | 0.50 | 0.50 | 0.50 |
| F2 | 0.70 | 0.73 | 0.72 | 0.71 | 0.71 | 0.71 | 0.71 | 0.71 | 0.70 | 0.70 | 0.70 | 0.70 | |
Table 10.
Differences between ML Mean Parameter Estimates (PE) and True Values (TV) by Sample Size.
| Sample Size | |||||||||||||
|---|---|---|---|---|---|---|---|---|---|---|---|---|---|
| 50 | 75 | 100 | 125 | 150 | 200 | 250 | 500 | 750 | 1000 | 1500 | |||
| Parameter | TV | Mean PE - TV | Mean PE - TV | Mean PE - TV | Mean PE - TV | Mean PE - TV | Mean PE - TV | Mean PE - TV | Mean PE - TV | Mean PE - TV | Mean PE - TV | Mean PE - TV | |
| F1 by | Y1 | 1.00 | 0.00 | 0.00 | 0.00 | 0.00 | 0.00 | 0.00 | 0.00 | 0.00 | 0.00 | 0.00 | 0.00 |
| Y2 | 1.00 | 0.10 | 0.05 | 0.03 | 0.02 | 0.02 | 0.01 | 0.01 | 0.01 | 0.00 | 0.00 | 0.00 | |
| Y3 | 1.00 | 0.08 | 0.05 | 0.03 | 0.01 | 0.01 | 0.01 | 0.01 | 0.00 | 0.00 | 0.00 | 0.00 | |
| F2 by | Y4 | 1.00 | 0.00 | 0.00 | 0.00 | 0.00 | 0.00 | 0.00 | 0.00 | 0.00 | 0.00 | 0.00 | 0.00 |
| Y5 | 0.80 | 0.05 | 0.03 | 0.02 | 0.01 | 0.01 | 0.01 | 0.01 | 0.00 | 0.00 | 0.00 | 0.00 | |
| Y6 | 0.80 | 0.03 | 0.02 | 0.01 | 0.01 | 0.01 | 0.01 | 0.00 | 0.00 | 0.00 | 0.00 | 0.00 | |
| F3 by | Y7 | 1.00 | 0.00 | 0.00 | 0.00 | 0.00 | 0.00 | 0.00 | 0.00 | 0.00 | 0.00 | 0.00 | 0.00 |
| Y8 | 0.90 | 0.03 | 0.02 | 0.02 | 0.02 | 0.02 | 0.01 | 0.01 | 0.01 | 0.01 | 0.01 | 0.00 | |
| Y9 | 0.90 | 0.03 | 0.03 | 0.02 | 0.02 | 0.02 | 0.01 | 0.01 | 0.01 | 0.00 | 0.00 | 0.00 | |
| F4 by | Y10 | 1.00 | 0.00 | 0.00 | 0.00 | 0.00 | 0.00 | 0.00 | 0.00 | 0.00 | 0.00 | 0.00 | 0.00 |
| Y11 | 0.70 | 0.09 | 0.03 | 0.02 | 0.02 | 0.02 | 0.01 | 0.01 | 0.00 | 0.00 | 0.00 | 0.00 | |
| Y12 | 0.70 | 0.05 | 0.03 | 0.01 | 0.01 | 0.01 | 0.00 | 0.00 | 0.00 | 0.00 | 0.00 | 0.00 | |
| F4 on | F3 | 0.60 | 0.00 | 0.01 | 0.01 | 0.01 | 0.01 | 0.01 | 0.01 | 0.01 | 0.01 | 0.00 | 0.00 |
| F3 on | F1 | 0.50 | 0.03 | 0.02 | 0.01 | 0.01 | 0.01 | 0.00 | 0.00 | 0.00 | 0.00 | 0.00 | 0.00 |
| F2 | 0.70 | 0.03 | 0.02 | 0.01 | 0.01 | 0.01 | 0.01 | 0.01 | 0.00 | 0.00 | 0.00 | 0.00 | |
Table 11.
ML Percentages of Significant Parameter Estimates (PEs).
| Sample Size | ||||||||||||
|---|---|---|---|---|---|---|---|---|---|---|---|---|
| 50 | 75 | 100 | 125 | 150 | 200 | 250 | 500 | 750 | 1000 | 1500 | ||
| Parameter | %Sig. PEs | %Sig. PEs | %Sig. PEs | %Sig. PEs | %Sig. PEs | %Sig. PEs | %Sig. PEs | %Sig. PEs | %Sig. PEs | %Sig. PEs | %Sig. PEs | |
| F1 by | Y1 | 0.0% | 0.0% | 0.0% | 0.0% | 0.0% | 0.0% | 0.0% | 0.0% | 0.0% | 0.0% | 0.0% |
| Y2 | 95.2% | 99.6% | 100.0% | 100.0% | 100.0% | 100.0% | 100.0% | 100.0% | 100.0% | 100.0% | 100.0% | |
| Y3 | 96.0% | 99.4% | 100.0% | 100.0% | 100.0% | 100.0% | 100.0% | 100.0% | 100.0% | 100.0% | 100.0% | |
| F2 by | Y4 | 0.0% | 0.0% | 0.0% | 0.0% | 0.0% | 0.0% | 0.0% | 0.0% | 0.0% | 0.0% | 0.0% |
| Y5 | 92.8% | 99.6% | 100.0% | 100.0% | 100.0% | 100.0% | 100.0% | 100.0% | 100.0% | 100.0% | 100.0% | |
| Y6 | 92.6% | 99.8% | 100.0% | 100.0% | 100.0% | 100.0% | 100.0% | 100.0% | 100.0% | 100.0% | 100.0% | |
| F3 by | Y7 | 0.0% | 0.0% | 0.0% | 0.0% | 0.0% | 0.0% | 0.0% | 0.0% | 0.0% | 0.0% | 0.0% |
| Y8 | 100.0% | 100.0% | 100.0% | 100.0% | 100.0% | 100.0% | 100.0% | 100.0% | 100.0% | 100.0% | 100.0% | |
| Y9 | 100.0% | 100.0% | 100.0% | 100.0% | 100.0% | 100.0% | 100.0% | 100.0% | 100.0% | 100.0% | 100.0% | |
| F4 by | Y10 | 0.0% | 0.0% | 0.0% | 0.0% | 0.0% | 0.0% | 0.0% | 0.0% | 0.0% | 0.0% | 0.0% |
| Y11 | 83.5% | 95.8% | 99.6% | 100.0% | 100.0% | 100.0% | 100.0% | 100.0% | 100.0% | 100.0% | 100.0% | |
| Y12 | 83.7% | 95.0% | 98.8% | 99.8% | 100.0% | 100.0% | 100.0% | 100.0% | 100.0% | 100.0% | 100.0% | |
| F4 on | F3 | 87.3% | 97.4% | 99.2% | 100.0% | 100.0% | 100.0% | 100.0% | 100.0% | 100.0% | 100.0% | 100.0% |
| F3 on | F1 | 71.5% | 89.0% | 97.6% | 99.2% | 100.0% | 100.0% | 100.0% | 100.0% | 100.0% | 100.0% | 100.0% |
| F2 | 85.7% | 99.2% | 99.6% | 100.0% | 100.0% | 100.0% | 100.0% | 100.0% | 100.0% | 100.0% | 100.0% | |
Disclaimer/Publisher’s Note: The statements, opinions and data contained in all publications are solely those of the individual author(s) and contributor(s) and not of MDPI and/or the editor(s). MDPI and/or the editor(s) disclaim responsibility for any injury to people or property resulting from any ideas, methods, instructions or products referred to in the content. |
© 2024 by the author. Licensee MDPI, Basel, Switzerland. This article is an open access article distributed under the terms and conditions of the Creative Commons Attribution (CC BY) license (https://creativecommons.org/licenses/by/4.0/).
Copyright: This open access article is published under a Creative Commons CC BY 4.0 license, which permit the free download, distribution, and reuse, provided that the author and preprint are cited in any reuse.


