Submitted:
30 April 2024
Posted:
01 May 2024
You are already at the latest version
Abstract
Thermodynamics of protein-ligand interactions seems to be associated to a narrow range of Gibbs Free Energy. As a consequence, a linear enthalpy-entropy relationship showing an apparent Enthalpy-Entropy compensation (EEC) is frequently observed associated to the study of protein-ligand interactions. This EEC affects negatively the design and discovery of new and more efficient drugs capable of binding protein-targets with a higher affinity. Originally attributed to experimental errors, compensation between H and TS values is a real observable fact, although its molecular origin has remained obscure and controversial. Herein we show the results of a data search of G values of 2558 protein-ligand interactions and 3025 “in vivo” ligand concentrations from the Protein Data Bank bind Database and the Metabolome Data Base (2020). These results, together with the mechano-statistical interpretation of the thermodynamic properties leads to the conclusion that the EEC has no basis in statistical thermodynamics. It can be plausibly explained as a consequence of the narrow range of G associated to protein-ligand interactions. The Gaussian distribution of the G values matches very well with that of ligands. These results suggest the hypothesis that the set of G values for the protein-ligand interactions is the result of the evolution of proteins. The conformation versatility of present proteins and the exchange of thousands (even millions) of minute amounts of energy with the environment may have functioned as a homeostatic mechanism to make G of proteins adaptive to changes in availability of ligands, and therefore achieve the maximum regulatory capacity of the protein function. Finally, a plausible strategy to avoid the EEC is suggested.
Keywords:
Enthalpy-Entropy compensation
; Protein Ligand Interactions
; Thermodynamic Parameters
1. Introduction
A linear enthalpy-entropy relationship is frequently observed associated to the thermodynamic study of protein-ligand interactions (Lumry, 2003; Cooper, 1999; Sharp. 2001; Martin and Clements, 2013; Pan et al., 2016; Fox et al., 2018; Peccati and Jiménez-Osés, 2021; Chen and Wang, 2023). When the reaction enthalpy values, ΔHo, associated to any particular set of ligand-protein interactions are plotted against the corresponding changes in entropy values, TΔSo, a straight line with a slope close to 1 is usually obtained. The phenomenon is particularly relevant in studies concerned with design and discovering of new drugs, either by computational docking simulations or by microcalorimetry experiments. Isothermal Titration Calorimetry renders useful ΔHo values in ligand optimization experiments. ΔHo values can be obtained from a panel of ligands composed of modified forms of a lead compound; the more negative values of ΔHo are then expected to yield information about the more favourable chemical modification to gain a higher affinity for the protein target. It is, however, frequently observed that whenever a structural ligand modification causes a more negative (favourable) ΔHo value to form the ligand-protein complex, a more negative (unfavourable) TΔSo value is obtained, therefore yielding no appreciable increase in the affinity (as measured by ΔGo) to form the ligand-protein complex.
Indeed, this apparent compensation between ΔHo and TΔSo is always observed in thermodynamic studies concerning the binding of a group of structurally related ligands to a particular biological macromolecule. But also, is observed in the binding of unrelated ligands to dissimilar macromolecules. Particularly interesting is the report by Olsson et al. (2011) that 171 protein-ligand interactions concerning 32 proteins display a clearly linear enthalpy-entropy relationship. Most interesting is the observation that this behaviour concerning the apparent compensation between ΔHo and TΔSo associated to protein-ligand interactions does not seem to be followed by simple chemical reactions. On the contrary, linearity is found when changes of enthalpy associated to simple chemical reactions, ΔHo , are plotted against the Gibbs free energy, ΔGο, instead of TΔSο.
Results as those of Olsson et al. (2011) reporting a linear enthalpy-entropy relationship for protein-ligand interactions could originally have been attributed to experimental errors in the ΔH measurements, since that most of the ΔHo values were obtained from Van’t Hoff studies of equilibrium constants as a function of temperature. Development of ITC microcalorimeters, however, allows measuring enthalpy values with a precision high enough to discard experimental errors. The apparent compensation between measured ΔHo and TΔSo (EEC) is an observable fact, although its molecular origin remains obscure and controversial. Herein we want to present a plausible explanation to unveil its origin, within the framework of contributing to those studies concerned with design and discovering of new drugs having a higher affinity for their targets
2. Results and Discussion
Protein-ligand interactions. Parts 1A and 1B of Figure 1 show the plots of ΔHo vs TΔSo and ΔHo vs ΔGo corresponding to the set of simple chemical reactions included in Table 1. As can be observed in part 1A of Figure 1, no linear correlation is found between ΔHo and TΔSo. However, a clear linearity ΔHo vs ΔGo can be observed in part 1B of the same figure. This behaviour seems to be frequently observed when the changes in the values of thermodynamic properties of chemical reactions are compared. The first, evident, conclusion that can be drawn from the linear relationship observed in part 1B of Figure 1 is that, according to the equation ΔHo = ΔGo + TΔSo, TΔSo remains practically constant along the set of chemical reactions plotted. If we pay attention to the data in this figure, included in Table 1, the TΔSo values, in fact, do not remain constant. However, when compared with the ΔHo and ΔGo , the TΔSo values are small enough as to acquire a constant behaviour.
According to the statistical interpretation of enthalpy, H:
where U, p and V stand for the internal energy, pressure and system volume respectively. Ue, Uv, Ur, and Ut stand for the different contributions to the internal energy of the system: electronic, vibrational, rotational and translational, respectively.
H=U+pV=Ue+Uv + Ur + Ut + pV
The corresponding ΔH in a chemical transformation, at constant value of pressure, will then be given by:
ΔH = ΔU + pΔV = ΣUe + ΣUv + ΣUr + ΣUt + pΔV.
ΣUe, ΣUv, ΣUr and ΣUt stand for the stoichiometric sum of the electronic, vibrational rotational and translational energy values corresponding to reactants and products. Defining ΔHs as:
equation [2] can be expressed, under standard conditions, as:
ΔHs = ΣUv + ΣUr + ΣUt + pΔV = ΔUso + pΔV
ΔHo = (ΣUe)o + ΔUso + pΔV = (ΣUe)o + ΔHso
We have grouped ΣUv + ΣUr + ΣUt in the term ΔUso because at 298K the differences in energy values between different quantum levels of vibration, rotation and translation energy is small enough to allow for a significant occupation of the different energy levels, therefore contributing to the change in the number of quantum states (or configurations) associated to the chemical transformation. On the other hand, the value of (ΣUe)o corresponds to the energy resulting from the breaking and forming of the bonds -usually covalent- associated to the chemical transformation.
Following the Gibbs free energy, G, definition, G ≡ U + pV -TS, the value of ΔG, at constant values of pressure and temperature will be given, under standard conditions, by:
ΔGo = ΔHo– TΔSo
Using equation (4) we have:
ΔGo = (ΣUe)o + ΔHso -TΔSo
Finally, defining ΔGso as ΔGso ≡ ΔHso -TΔSo and substituting into [6], we have:
ΔGo = (ΣUe)o + ΔGso
Substitution of (4) and (7) into (5) gives:
(ΣUe)o + ΔHso = (ΣUe)o + ΔGso + TΔSo
And solving for ΔHso:
ΔHso = ΔGso + TΔSo
Equations (4) and (7) may explain the linear relationship between the ΔHo and ΔGo values shown in part 1B of Figure 1, as well as the small value of TΔSo observed for the plotted set of chemical reactions. Both parameters, ΔHo and ΔGo, contain the term (ΣUe)o. The value of (ΣUe)o corresponds to the energy resulting from the breaking and forming of the covalent bonds associated to the chemical transformation. Energy values of covalent bonds are within the range of hundreds of kJ/mol. It is an amount of energy much larger than that involved in the changes of vibrational, rotational and translational energies involved in the changes of ΔHso and ΔGso. Therefore, the main contribution to the ΔHo and ΔGo values of a chemical transformation comes from the large values of (ΣUe)o, giving place to the small values of TΔSo and the corresponding linear relationship between ΔHo and ΔGo.
In contrast to the data shown in part 1A of Figure 1, where no correlation is observed between calorimetric values of ΔHo and TΔSo, for different types of chemical reactions, this correlation is, however, frequently found in the thermodynamic study of protein-ligand interactions. Part 1C of the same figure shows the plot of calorimetric ΔHo values vs TΔSο values for 42 examples of protein-ligand interactions, extracted from different studies involving unrelated ligands and dissimilar proteins (Table 2). The plot shows the kind of behaviour usually denoted as an enthalpy-entropy compensation. As mentioned before, this type of behaviour has been repeatedly reported to occur in many experiments concerning protein-ligand interactions. As can be observed in part 1D, it is accompanied by the lack of correlation ΔHo vs ΔGo, which is, in turn, usually found in chemical transformations.
The linear relationship between ΔHo and TΔSo shown in part 1C of Figure 1 leads to an average value of ΔGo, for the set of protein-ligand interactions selected for the plot, of about -30 kJ/mol. A similar results is obtained by Olsson et al., (2011) from a survey of 171 protein-ligand interactions. Following equation [7], this small value of ΔGo, as compared to the values of ΔHo and TΔSo shown in Part 1C of Figure 1 must be the result of small values of (ΣUe)o and ΔGso . ΔGso includes the changes in the values of the enormous number of quantum energy levels corresponding to rotation and normal modes of vibration of protein and ligand, as well as changes in the values of the translational energy derived from the hydrophobic effect, upon formation of the complex. As mentioned above, (ΣUe)o represents the energy resulting from the bonds rearrangement of the molecules involved in the chemical transformation. No covalent bonds are usually involved in the complex formed from a protein-ligand interaction. It is essentially a truism that, with minor exceptions, the number of covalent bonds found in the protein and ligand molecules is the same than that we will find in the protein-ligand complex.
In the absence of covalent bonds, all energies liberated as a consequence of the weak intramolecular interactions involved in the complex stability must be included in (ΣUe)o, including intramolecular hydrogen bonds and those coming from changes in intermolecular hydration, as well as cation Π interactions, ion pairs and dispersion forces, among other weak interactions contributing to the protein stability. All of them must be involved in the breaking of native structures of protein and ligand, as well as in the protein-ligand complex stability, therefore playing the same role as covalent bonds do in molecules reorganization. Finally, the result is that the sum of the thousands of energy contributions included in (ΣUe)o , added to the value of ΔGso results in a very small value of ΔGo. The data included in part 1C of figure 1 are fitted to a straight line with a slope close to 1 and an independent term close to -30 kJ/mol, consistent with the equation
ΔHo = TΔSo + ΔGo
This result suggests a practically constant value for ΔGo close to -30 kJ/mol for all the protein-ligand interactions included in the figure. Most interesting is that, beside the linearity shown by the data, the set of examples selected here displays a similar constant value for ΔGo (about -30 kJ/mol) to that reported by Olsson et al. from a survey of 171 protein-ligand interactions.
Figure 2 shows the normal distribution corresponding to the ΔGo values for a set of 3025 protein-ligand affinities as obtained from the 2020 version of Protein Data Bank bind database (Wang et al., 2004). The average value of the 3025 ΔGo values is -36.5 kJ/mol. As deduced from the standard deviation, about 70 % of the cases are in between -46 to -26 kJ/mol. The immediate consequence of this statistical analysis is that any large enough set of protein-ligand interactions will display the kind of linear relationship shown in part C of Figure 1. It is worth of noting here the similarity between this range of ΔGo values found for protein-ligand interactions and the ranges of ΔGo values reported for the protein unfolding, typically between -20 and -60 kJ/mol (Sánchez-Ruiz, 1995; Liu et al, 2000).
The apparent compensation between ΔHo and TΔSo has usually been observed in thermodynamic studies about the binding of a group of structurally related ligands to a particular biological macromolecule. Within that context, the apparent enthalpy-entropy compensation (EEC) might be understood as a natural mechanism to restore the original protein structure after the attempt to change it to improve the affinity for a ligand. However, it is observed within any set of unrelated proteins and ligands as well as in the protein unfolding. In addition, as derived from the statistical result of 3025 protein-ligand affinities, this apparent EEC seems to be a consequence of the narrow range of ΔGo values displayed by protein-ligand interactions, around the particular value of -36.5 kJ/mol. Taking into consideration that the bond energy of a hydrogen bond -or any other weak interaction- is about -10 to -20 kJ/mol, the energy difference between a protein-ligand-complex and the free protein plus the free ligand must be equivalent to the change of a very small number of weak interactions, resulting from the stoichiometric sum of thousands of small energy changes included in (ΣUe)o + ΔGso .
Ligand concentrations “in vivo”. Beside the information concerning the energy involved in the protein-ligand interaction, the ΔGo value may also contain an important information concerning the functionality of the protein-ligand interaction within the context of metabolic regulation. The following equation may represent the simplest model for a protein-ligand interaction:
where P, L and PL represent protein, ligand and the protein-ligand complex respectively. The equilibrium constant for the complex formation is defined by:
P + L = PL
K ≡ [PL] / [P] [L]
The corresponding protein saturation fraction, Y, for this simple model is defined as:
Y ≡ [PL] / [P]total = [PL] / ([P] + [PL])
Solving for the ligand concentration, L0.5, in equilibrium with a fractional saturation, Y = 0.5, from equation [13] we can obtain:
where Kd is the dissociation constant of the protein-ligand complex, PL. Using the equation ΔGo = -RTlnK, we obtain finally:
L0.5 = 1/K = Kd
ΔGo = 2.3RTlogL0.5
According to the average values of ΔGo (-36.5 kJ/mol) and the standard deviation obtained from the normal distribution in Figure 2, the corresponding values for L0.5 must be within a micromolar range of concentration. An excessive concentration of ligand would produce a permanently bound protein, avoiding the regulatory job of the ligand. On the other hand, a too low ligand concentration would not produce any effect either.
Taking logarithms in [13], and solving for Y, we obtain:
Figure 3 shows the fractional saturation, Y, as a function of log [L]/Kd, according to equation [16]. As can be observed in this Figure, a ligand concentration close to the value of Kd = L0.5 corresponds to a 50% of protein saturated by the ligand. This is the inflection point of the curve. Minor changes in ligand concentration around the L0.5 value can induce large changes in the fractional saturation of the protein. It is the point of maximal response sensitivity of the protein and the consequent maximal regulation sensitivity. According to equation [15], the most relevant meaning of ΔGo , from the point of view of functionality, is probably that its value determines the concentration of the ligand displaying the maximal regulatory sensitivity of the protein-ligand interaction.
We have done a search of ligand concentration using the Metabolome Data Base (Wishart et al., 2022) in order to know how is the “in vivo” ligand concentration from different human sources. Figure 4 shows the normal distribution of 2558 ligands. The ligand concentration data have been transformed to chemical potential by use of an analogous formula to equation [15]: -RT ln 1/[L], where L corresponds to the different concentration values found in the Base. The result would be an energy value equivalent to the ΔGo of a hypothetical protein ligand interaction in which L would be L0.5. As can be observed, the ligand concentrations transformed to chemical potential have a normal distribution with practically the same average value for the energy and standard deviation (-35.0 kJ/mol, SD 8.9) than the corresponding values for the normal distribution of protein affinities shown in Figure 2 (-36.5 kJ/mol, SD 10.4). Figure 5 shows the corresponding gaussian curves for both data collection.
Almost 30 years ago Jack Dunitz highlighted the observation that the EEC had been discussed in many papers over the years (Dunitz, 1995). Linear relationships between ΔHo and TΔSo similar to that shown here in Figure 1C have been repeatedly observed during the last decades since the mid-sixties ( Peccati & Jiménez-Osés, 2021: Khaprunov, 2018; Fox et al., 2018; Cornish-Bowden, 2017; Dragan, 2017; Chen & Wang, 2023). However, the physical origin of that EEC, in the hypothetical case that it may exist, remains controversial. EEC could originally be attributed to errors in the ΔHo measurements. Development of ITC calorimeters, however, allows measuring enthalpy values with the sufficient precision to discard experimental errors. In a teleological sense it has been suggested by A. Cooper (Cooper, 1999) that it may be the result of evolutionary stress; changes in ΔHo, induced by the environment, would be tolerated because ΔGo would no change because of the EEC. Most of recent reports on this subject do emphasis in the role of changes in the weak interactions involved in the structures of protein and protein-ligand complex (Dunitz, 1995), the important role played by changes in the energy of hydrogen bonds, both intramolecular and intermolecular derived from hydration (Fox et al., 2018; Dragan, 2017) and also from the hydrophobic effect (Chen & Wang, 2023).
The abundant bibliography concerning the linear relationship observed between the ΔHo and TΔSo values associated to protein-ligand interactions, together with the fact that most of data comes from ITC experiments rendering ΔHo values with a precision high enough to discard experimental errors, can allow us to affirm that that observation responds to a real phenomenon (Khrapunov, 2018; Cornish-Bowden, 2017). Although most of reports agree in considering that changes in the extent of hydration, together with the energy effects produced by changes in the hydrophobic effect, a clear molecular explanation of the phenomenon is missing. It is not even clear whether EEC is a consequence of the thermodynamic laws or responds to some extra thermodynamic effect.
The linear relationship between ΔHo and TΔSo values for protein-ligand interactions leads to the conclusion that ΔGo value for all the interactions is small enough to appear as a constant value in the equation ΔHo = TΔSo + ΔGo. The results shown by Olsson from 171 protein-ligand interactions and those of Figure 1C coincide in the ΔHo-TΔSo linearity and also in the small value of ΔGo, about -30 kJ/mol. We show herein that the result of a survey of more than three thousands protein-ligand affinities renders an average value for ΔGo of -36.5 kJ/mol. According to the standard deviation, close to 70% of the cases have a ΔGo value in between -26 kJ/mol and -46 kJ/mol. This is a very small amount of energy. The value of -36.5 kJ/mol is equivalent to the formation of about 2 weak interactions as hydrogen bonds or ionic pairs. May be that this result explain the ΔHo-TΔSo linearity, but an explanation for the small value of ΔGo still remains.
According to equation [7], ΔGo is composed of two terms; the first one, (ΣUe)o , represents the stoichiometric sum of the weak interactions changes taken place upon the complex formation. Between them, there are the huge number of H2O molecules breaking and forming hydrogen bonds to form the hydration sphere (or spheres) of the complex. ΔGso represents the stoichiometric sum of the huge number of vibration, rotation and translational energy levels occurring upon the complex formation. Therefore the ΔGo value is the net result of adding a vast number of possibly very small numbers. This result, the average of which over 3025 cases is -36.5 kJ/mol, which is equivalent to the energy liberated by one (or two) weak interaction coincides very well with the average value of more than three thousands values of metabolite concentrations. Figure 5 shows the matching of gaussian curves corresponding to ΔGo for the affinity of protein-ligand interaction and the chemical potential of “in vivo” ligand concentration. These results suggest the temptative hypothesis that the set of ΔGo values for the protein-ligand interactions is the result of the evolutive stress during millions of years. The versatility of present protein conformations and the thousands (even millions) of minute energy values of both signs may act as a homeostatic mechanism to make proteins adaptative to changes in availability of ligands in order to achieve the maximum regulatory capacity of the protein function.
One of the main drawbacks in studies concerning structure-based drug design is the linear relationship between ΔHo and TΔSo, derived from the small value of ΔGo for the protein-ligand interactions. This apparent EEC is probably unavoidable when working with protein-ligand interactions. However, although unavoidable, it might be ignored. ΔHo values can be obtained from a panel of ligands composed of modified forms of a lead compound. It is then assumed that the most negative value of ΔHo may yield information about the most favourable chemical modification to gain a higher affinity for the protein target. The linearity between ΔHo and TΔSo, produce then a frustrating negative value of TΔSo, therefore yielding an almost constant -and small- value of ΔGo. However, from the thermodynamic laws, is relatively easy to obtain the general expression for TΔSo (Denbigh, 1981):
where k, Z, V and T stand for the Boltzmann constant, the system partition function, the system volume and Temperature, respectively. The first term to the right is related to -ΔGo and the second one is related to ΔHo. ΔGo values come from the electronic, vibrational, rotational and translational quantum-energy level values. Although the value of TΔSo depends on both terms, the value of ΔGo only depends on the physical nature of reactants and products. ITC experiments renders very precise values of ΔHo, but also can yield the equilibrium constant and ΔGo with the same precision. The lack of linear correlation between ΔHo and ΔGo for protein-ligand interactions, as shown in part D of Figure 1, together with the possibility of obtaining ΔGo directly from the ITC experiments suggests that instead of looking for the most negative value of ΔHo, it would probably be more profitable to look directly for the most negative value of ΔGo, which directly supply the most favourable chemical modification to gain a higher affinity for the protein target, therefore avoiding the EEC.
TΔSo = kT ΔlnZ + kT2 Δ(d lnZ/dT)V
3. Methods
The set of 2558 metabolite concentrations were built by selecting all data obtained from the Metabolome Data Base (2020) (Wishart et al., 2022) from human fluids, including blood, saliva, cerebrospinal fluid, breast milk, and amniotic fluid, detected and quantified. The data of affinities of Protein-Ligand interactions expressed as ΔGo (kJ/mol) were obtained from the 2020 version of the Protein Data Bank bind Database (Wang et al., 2004). The survey of data correspond to the period 2010-2020 and included 3025 values .
Acknowledgments
The authors thank Jesús Ávila for inviting us to this contribution to Biophysica. Financial support has been provided by Ministerio de Ciencia e Innovación. Proyect PRPPID2021-123859OB-100.
References
- Aggarwal, S.; Tanwar, N.; Singh, A.; Munde, M. Formation of Protamine and Zn−Insulin Assembly: Exploring Biophysical Consequences. ACS Omega 2022, 7, 41044–41057. [Google Scholar] [CrossRef]
- Alberty, R.A. Calculation of Standard Transformed Gibbs Energies and Standard Transformed Enthalpies of Biochemical Reactants. Arch. Biochem. Biophys. 1998, 353, 116–130. [Google Scholar] [CrossRef] [PubMed]
- Atkins, P.; De Paula, J. Physical Chemistry for Life Sciences. Oxford University Press. ( 2006.
- Camero, S. Thermodynamics of the interaction between Alzheimer's disease related tau protein and DNA. PLoS ONE 2014, 9, e104690. [Google Scholar] [CrossRef] [PubMed]
- Chen, S.; Wang, Z-G. Using Implicit-Solvent Potentials to Extract Water Contributions to Enthalpy−Entropy Compensation in Biomolecular Associations. J. Phys. Chem. B 2023, 127, 6825–6832. [Google Scholar] [CrossRef]
- Clarke, C.; et al. Involvement of water in carbohydrate-protein binding. J. Am. Chem. Soc. 2001, 123, 12238–12247. [Google Scholar] [CrossRef] [PubMed]
- Cooper, A. Thermodynamic analysis of biomolecular interactions. Curr. Opin. Chem. Biol. 1999, 3, 557–563. [Google Scholar] [CrossRef]
- Cornish-Bowden, A. Enthalpy–entropy compensation and the isokinetic temperature in enzyme catalysis. J Biosci.
- Crisalli, A.M.; Cai, A.; Cho, B.P. Probing the Interactions of Perfluorocarboxylic Acids of Various Chain Lengths with Human Serum Albumin: Calorimetric and Spectroscopic Investigations. Chem. Res. Toxicol. 2023, 36, 703–713. [Google Scholar] [CrossRef] [PubMed]
- Danesha, N.; Sedighia, Z.N.; Beigolib, S.; Sharifi-Radc, A.; Saberid, M.R. & Chamania, J. Determining the binding site and binding affinity of estradiol to human serum albumin and holo-transferrin: Fluorescence spectroscopic, isothermal titration calorimetry and molecular modeling approaches. Journal of Biomolecular Structure and Dynamics, 2018, 36, 1747–1763. [Google Scholar]
- Denbigh, K. in The Principles of Chemical Equilibrium (Fourth Ed., Cambridge University Press, Cambridge, 1981).
- Dragan, A.I.; Read, C.M.; Crane-Robinson, C. Enthalpy-entropy compensation: The role of solvation. Eur. Biophys. J. 2017, 46, 301–308. [Google Scholar] [CrossRef]
- Dunitz, J.D. Win some, lose some: Enthalpy-entropy compensation in weak intermolecular interactions. Chemistry & Biology 1995, 2, 709–712. [Google Scholar]
- Fox, JM, Zhao, M.; Fink, M.J.; Kang, K.; Whitesides G.M. The Molecular Origin of.
- Enthalpy/Entropy Compensation in Biomolecular Recognition. Annu. Rev. Biophys. 2018, 47, 223–250. [CrossRef] [PubMed]
- Fukada, H.; Sturtevant, J.M.; Quiocho, F.A. Thermodynamics of the binding of L-arabinose and of D-galactose to the L-arabinose-binding protein of Escherichia coli. J. Biol. Chem. 1983, 258, 13193–13198. [Google Scholar] [CrossRef] [PubMed]
- Hamilton, P.D.; Andley, U.P. In vitro interactions of histones and α-crystallin Biochemistry and Biophysics Reports 2018, 15, 7–12. 15.
- Handbook of Chemistry and Physics (D.R. Lide (Ed.) Handbook of Chemistry and Physics (D.R. Lide, Ed.) CRC Press. 85th edition, 2004-2005.
- Hinz, H.J.; Steininger, G.; Schmid, F.; Jaenide, R. Studies on an energy structure-function relationship of dehydrogenases. II. Calorimetric investigations on the interaction of coenzyme fragments with pig skeletal muscle lactate dehydrogenase. FEBS Lett. 1978, 87, 83–86. [Google Scholar]
- Honnappa, S.; Cutting, B.; Jahnke, W.; Seelig, J.; Steinmetz, M.O. Thermodynamics of the Op18/Stathmin-Tubulin Interaction. J. Biol. Chem. 2003, 278, 38926–38934. [Google Scholar] [CrossRef]
- Khrapunov, S. The Enthalpy-entropy Compensation Phenomenon. Limitations for the Use of Some Basic Thermodynamic Equations. Curr Protein Pept Sci, 19, 1088–1091.
- Levine, I.N. in Physical Chemistry (Fith Ed. McGraw Hill, New York, 2002).
- Lewis, G.N.; Randall, M. in Thermodynamics. 2nd Edition. McGraw-Hill.
- Liu, L.; Yang, C.; Guo, Q-X. A study on the enthalpy-entropy compensation in protein unfolding. Biophys. Chem. 2000, 84, 239–251. [Google Scholar] [CrossRef]
- Lumry, R. Uses of enthalpy-entropy compensation in protein research. Biophys.Chem. 2003, 105, 545–557. [Google Scholar] [CrossRef]
- Martin, S.F.; Clements, J.H. . Correlating Structure and Energetics in Protein-Ligand Interactions: Paradigms and Paradoxes. Annu. Rev. Biochem. 2013, 82, 267–293. [Google Scholar] [CrossRef]
- Mateo, P.L.; Barón, C.; López-Mayorga, O.; Jiménez, J.S.; Cortijo, M. AMP and IMP binding to glycogen phosphorylase b. A calorimetric and equilibrium dialysis study. J. Biol. Chem. 1984, 259, 9384–9389. [Google Scholar] [PubMed]
- Olsson, T.S.G.; Ladbury, J.E.; Pitt, W.R.; Williams, M.A. Extent of enthalpy-entropy compensation in protein-ligand interactions. Protein Sci. 2011, 20, 1607–1618. [Google Scholar] [CrossRef]
- Paketurytė V, Linkuvienė V, Krainer G, Chen WY, Matulis D. Repeatability, precision, and accuracy of the enthalpies and Gibbs energies of a protein-ligand binding reaction measured by isothermal titration calorimetry. Eur Biophys J. 48, 139-152.
- Pan, A.; Kar, T.; Rakshit, A.K.; Moulik, S.P. Enthalpy-Entropy Compensation (EEC) Effect: Decisive Role of Free Energy. J. Phys. Chem. B 2016, 120, 10531–10539. [Google Scholar] [CrossRef]
- Peccati, F.; Jiménez-Osés, G. Enthalpy−Entropy Compensation in Biomolecular Recognition: A Computational Perspective. ACS Omega 2021, 6, 11122–11130. [Google Scholar] [CrossRef]
- Sánchez-Ruiz, J.M. Differential scanning calorimetry of proteins. Subcell Biochem 1995, 24, 133–176. [Google Scholar]
- Sharp, K. Entropy-Enthalpy compensation: Fact or artifact. Protein Sci. 2001, 10, 661–667. [Google Scholar] [CrossRef] [PubMed]
- Shi, J.H.; Lou, Y.Y.; Zhou, K.L.; Pan, D.Q. (2018) Elucidation of intermolecular interaction of bovine serum albumin with Fenhexamid: A biophysical prospect. J. Photochem. Photobiol. B, Biol. 2018, 180, 125–133. [Google Scholar] [CrossRef]
- Sobhany, M.; Negishi, M. Characterization of specific donor binding to α1,4Nacteylhexosaminyltransferase EXTL2 using Isothermal Titration Calorimetry. Methods Enzymol. 2006, 416, 3–12. [Google Scholar]
- Sohrabi, Y.; Panahi-Azar, V.; Barzegar, A.; Dolatabadi, J.E.N.; Dehghan, P. Spectroscopic, thermodynamic and molecular docking studies of bovine serum albumin interaction with ascorbyl palmitate food additive. BioImpacts, 2017, 7, 241–246. [Google Scholar] [CrossRef]
- Sun, W.; Zhang, B.; Zheng, H.; Zhuang, C.; Li, X.; Lu, X.; Quan, C.; Dong, Y.; Zheng, Z.; Xiu, Z. Trivaric acid, a new inhibitor of PTP1b with potent beneficial effect on diabetes. Life Sciences 2017, 169, 52–64. [Google Scholar] [CrossRef]
- Timmer, C.M.; Michmerhuizen, N.L.; Witte, A.B.; Van Winkle, M.; Zhou, D.; Sinniah, K. An Isothermal Titration and Differential Scanning Calorimetry Study of the G-Quadruplex DNA−Insulin Interaction. J. Phys. Chem. B 2014, 118, 1784–1790. [Google Scholar] [CrossRef]
- Ueda, I.; Yamanaka, M. Titration calorimetry of anesthetic-protein interaction: Negative enthalpy of binding and anesthetic potency. Biophys. J. 1997, 72, 1812–1817. [Google Scholar] [CrossRef]
- et al. “Selected Values of Chemical Thermodynamic Properties.” Nat. Bur. Stand. Tech. Notes 270-3, 270–274, 270-5, 270–276. 270-7 and 270-8. Washington, (1968-1981).
- Wang, R. Fang, X.; Lu, Y.; Wang, S. The PDB bind Database for Protein-Ligand Complexes with known Three-Dimensional Structures. J. Med. Chem. 2004, 47, 2977–2980. [Google Scholar] [CrossRef]
- Wishart DS, Guo A, Oler E, Wang F, Anjum A, Peters H, Dizon R, Sayeeda Z, Tian S, Lee BL, Berjanskii M, Mah R, Yamamoto M, Jovel J, Torres-Calzada C, Hiebert-Giesbrecht M, Lui VW, Varshavi D, Varshavi D, Allen D, Arndt D, Khetarpal N, Sivakumaran A, Harford K, Sanford S, Yee K, Cao X, Budinski Z, Liigand J, Zhang L, Zheng J, Mandal R, Karu N, Dambrova M, Schiöth HB, Greiner R, Gautam V. the Human Metabolome Database for 2022. Nucleic Acids Res. 2022, 50, D622–D631.
- Ylilauri, M.; Mattila, E.; Nurminen, E.M.; Käpylä, J.; Niinivehmas, S.P.; Määttä, J.A.; Pentikäinen, U.; Ivaska, J.; Pentikäinen, O.T. Molecular mechanism of T-cell protein tyrosine phosphatase (TCPTP) activation by mitoxantrone. Biochimica et Biophysica Acta 2013, 1834, 1988–1997. [Google Scholar] [CrossRef]
Figure 1.
Enthalpy-Entropy and Enthalpy-Free Energy correlations for some conventional reactions and protein-ligand interactions. Parts 1A and 1B: ΔHo vs TΔSo and ΔHo vs ΔGo for some chemical reactions. Parts 1C and 1D: ΔHo vs TΔSo and ΔHo vs ΔGo for a number of protein-ligand interactions.
Figure 1.
Enthalpy-Entropy and Enthalpy-Free Energy correlations for some conventional reactions and protein-ligand interactions. Parts 1A and 1B: ΔHo vs TΔSo and ΔHo vs ΔGo for some chemical reactions. Parts 1C and 1D: ΔHo vs TΔSo and ΔHo vs ΔGo for a number of protein-ligand interactions.
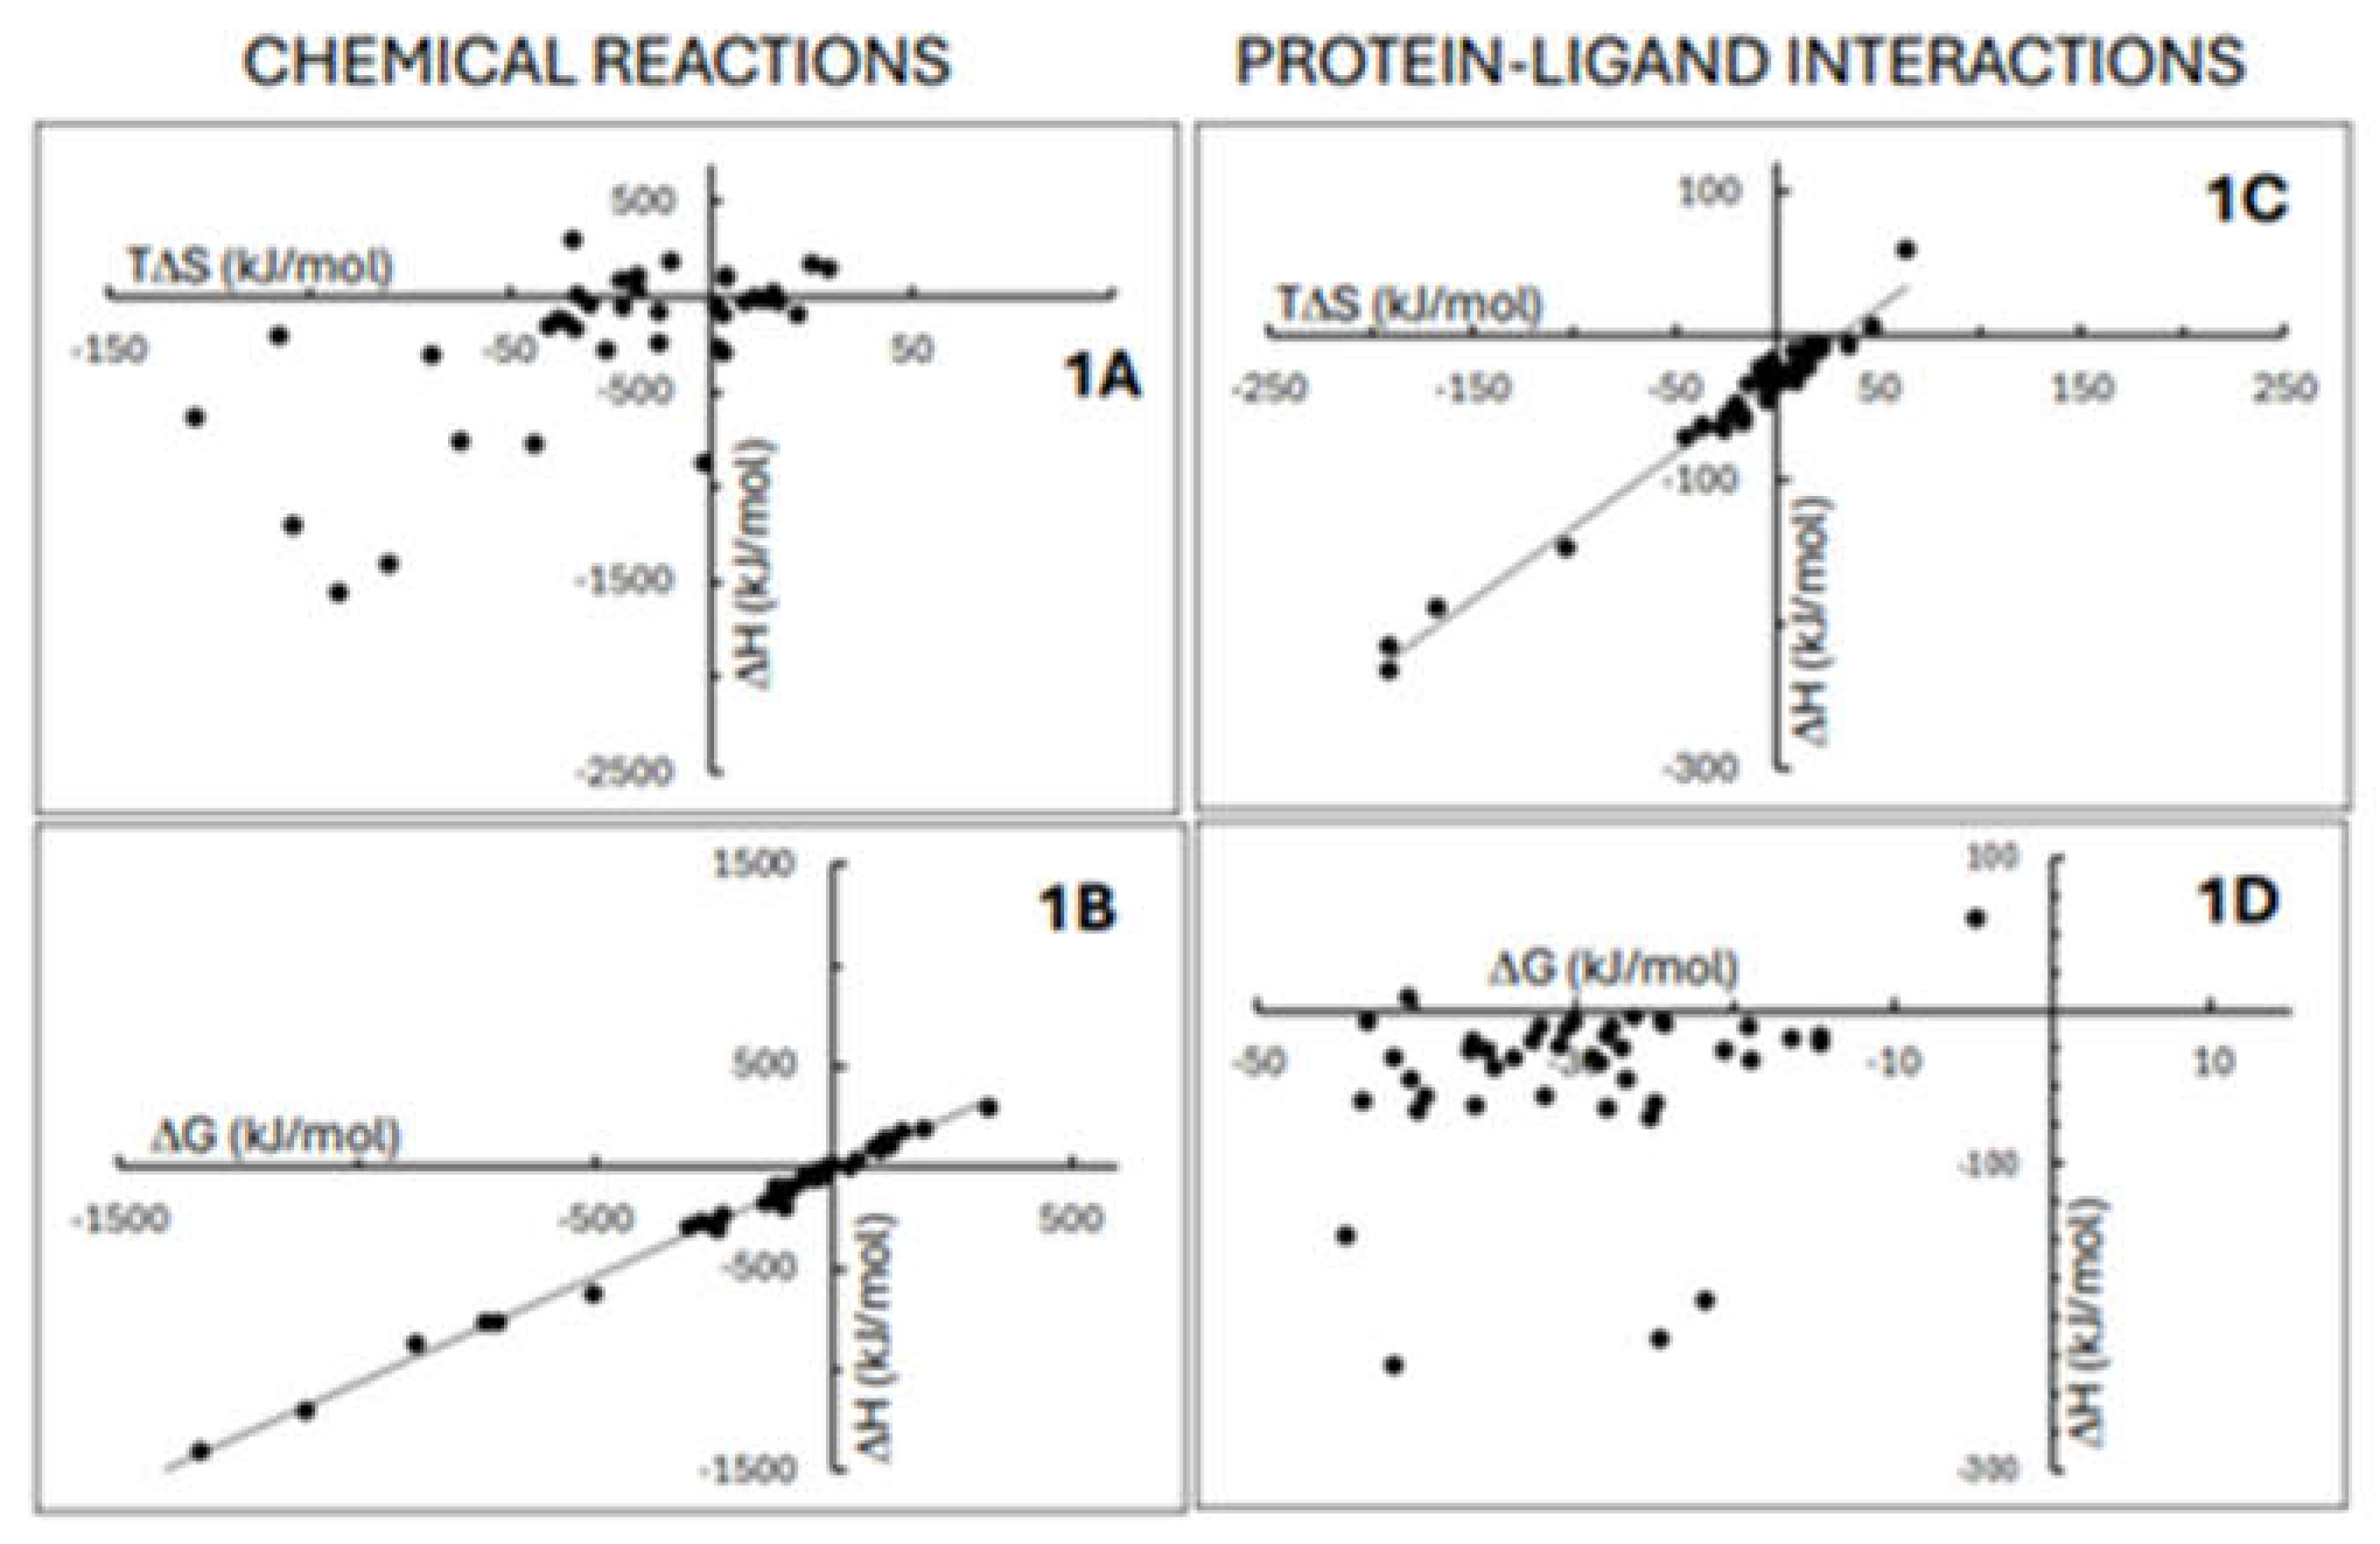
Figure 2.
Normal Distribution for affinities of Protein-Ligand interactions expressed as ΔGo (kJ/mol). The data were obtained from the 2020 version of the Protein Data Bank bind Database. The survey of data correspond to the period 2010-2020 and included 3025 values .
Figure 2.
Normal Distribution for affinities of Protein-Ligand interactions expressed as ΔGo (kJ/mol). The data were obtained from the 2020 version of the Protein Data Bank bind Database. The survey of data correspond to the period 2010-2020 and included 3025 values .
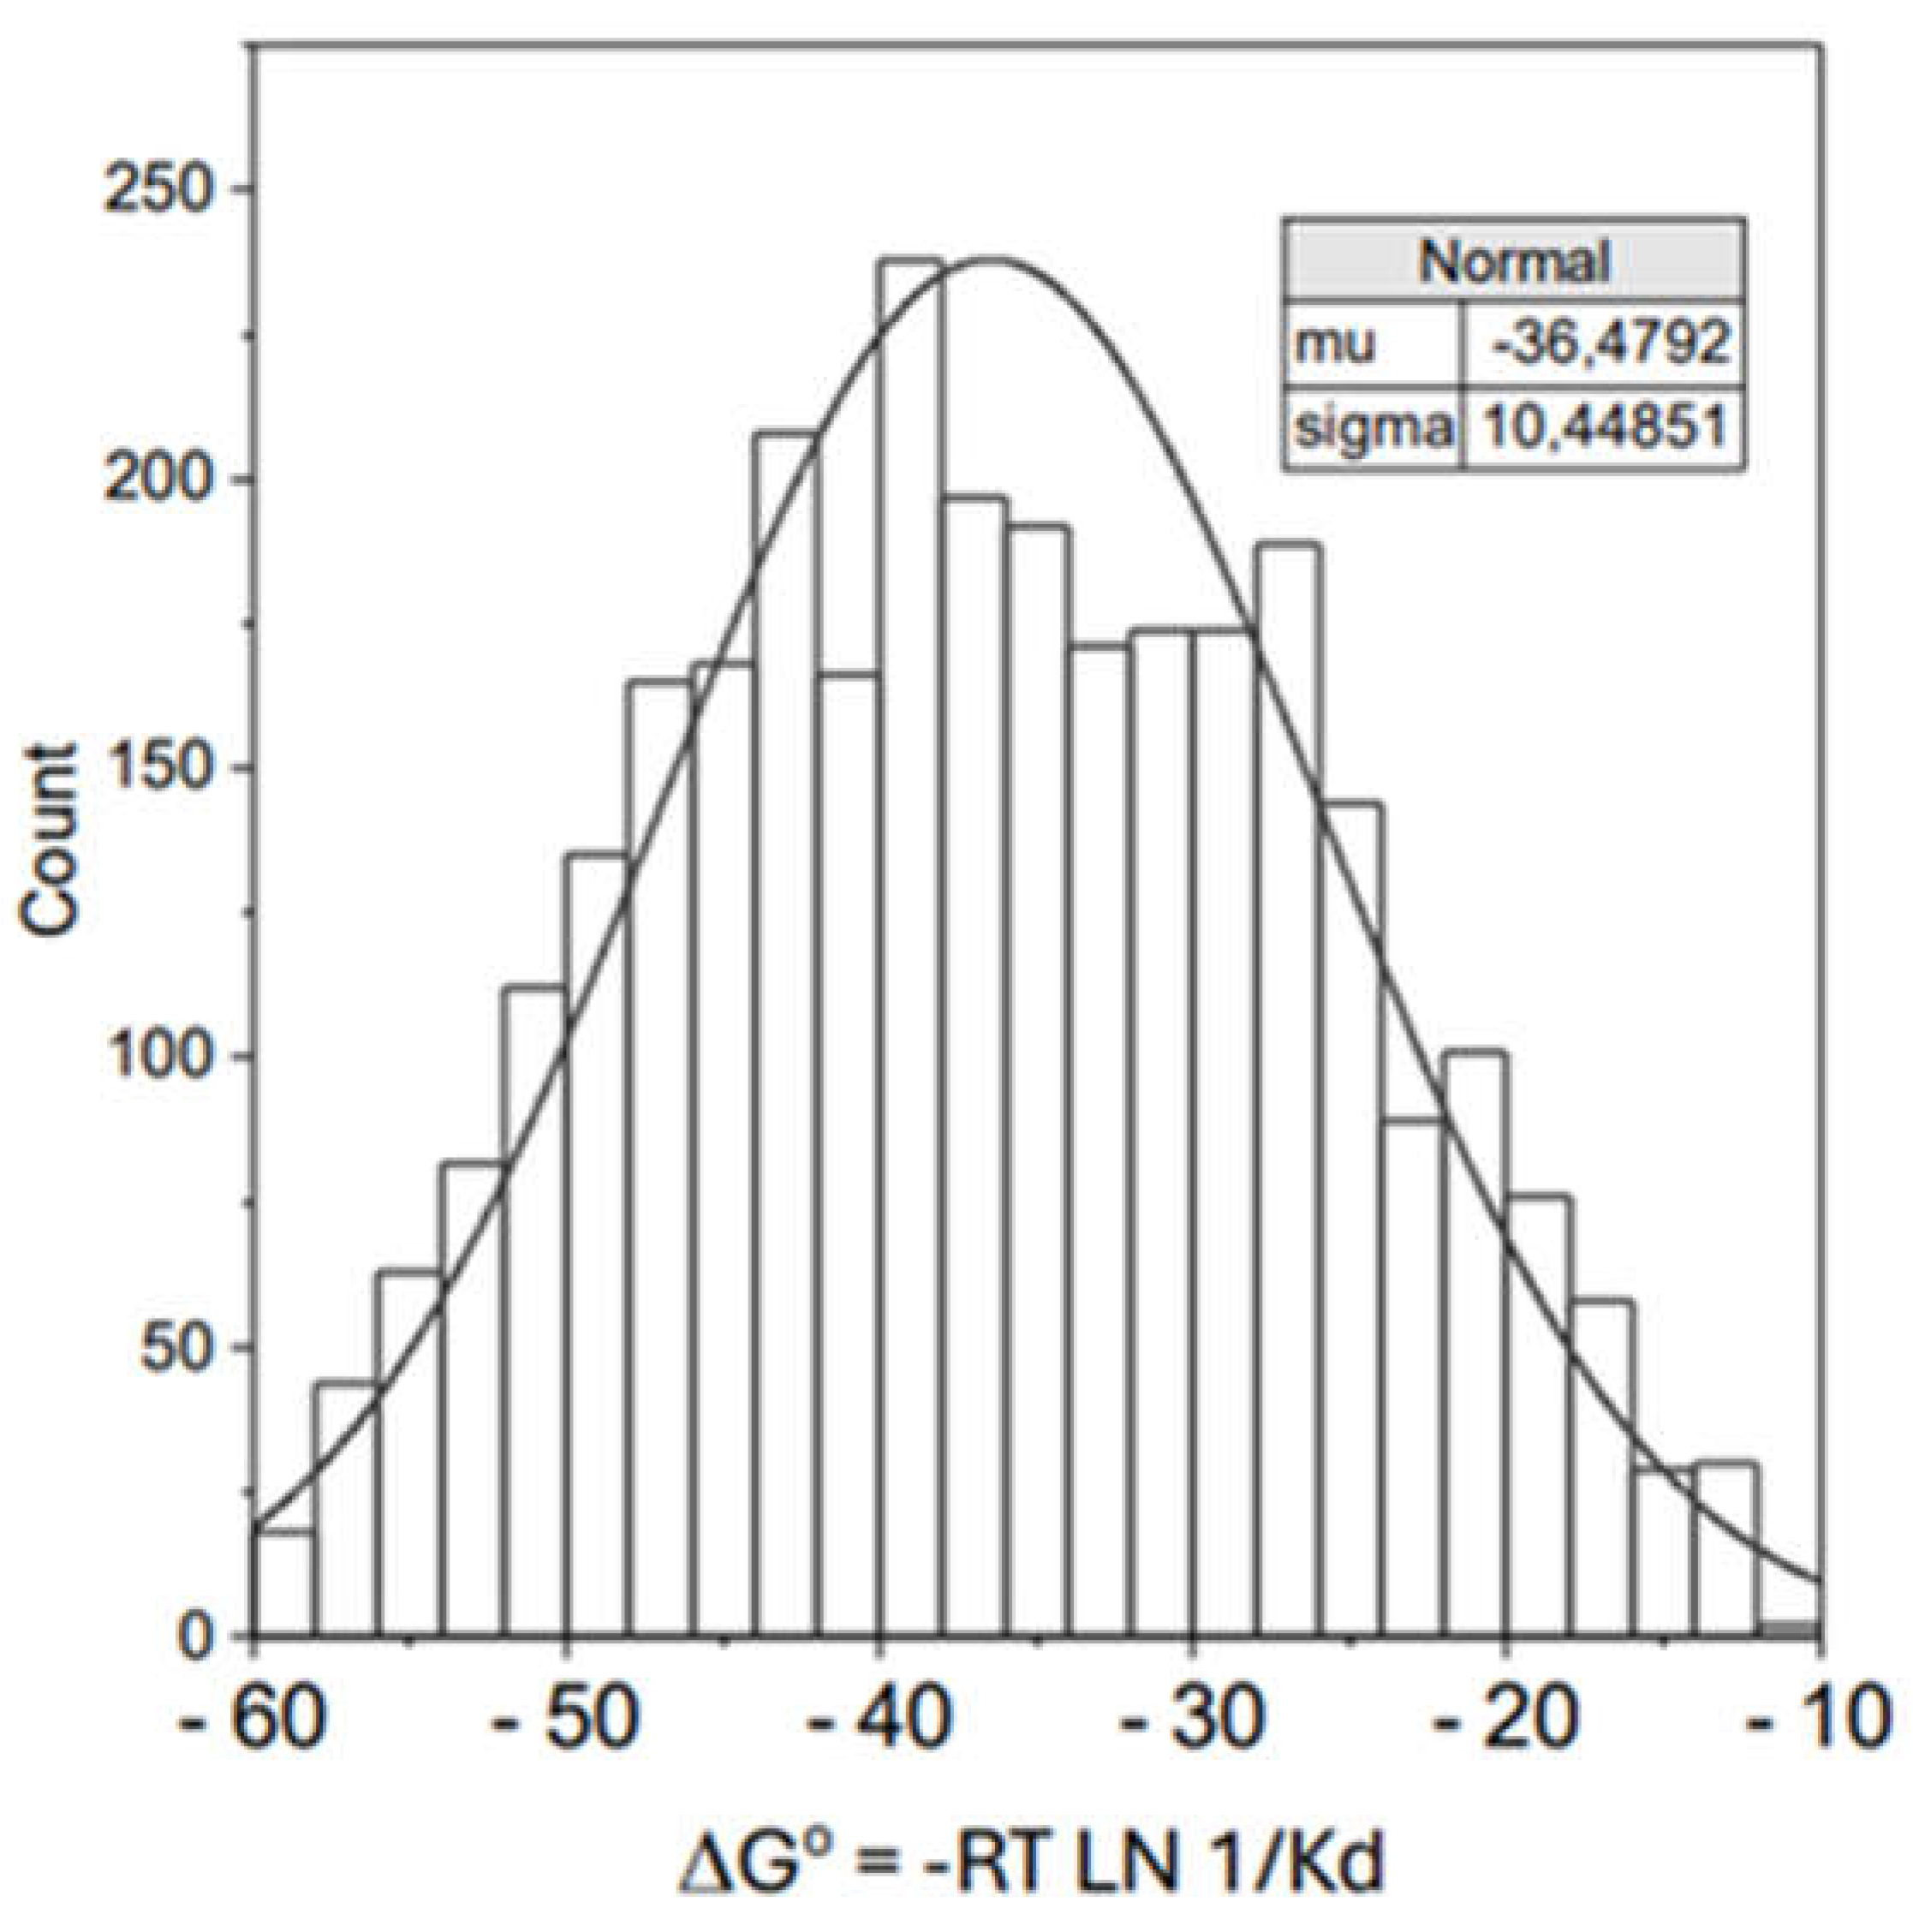
Figure 3.
The fractional protein saturation, Y, as a function of LOG [L]/Kd. Following equation [16], [L] stands for the ligand concentration and Kd (Kd = L0.5) stands for the dissociation constant of the protein-ligand complex.
Figure 3.
The fractional protein saturation, Y, as a function of LOG [L]/Kd. Following equation [16], [L] stands for the ligand concentration and Kd (Kd = L0.5) stands for the dissociation constant of the protein-ligand complex.
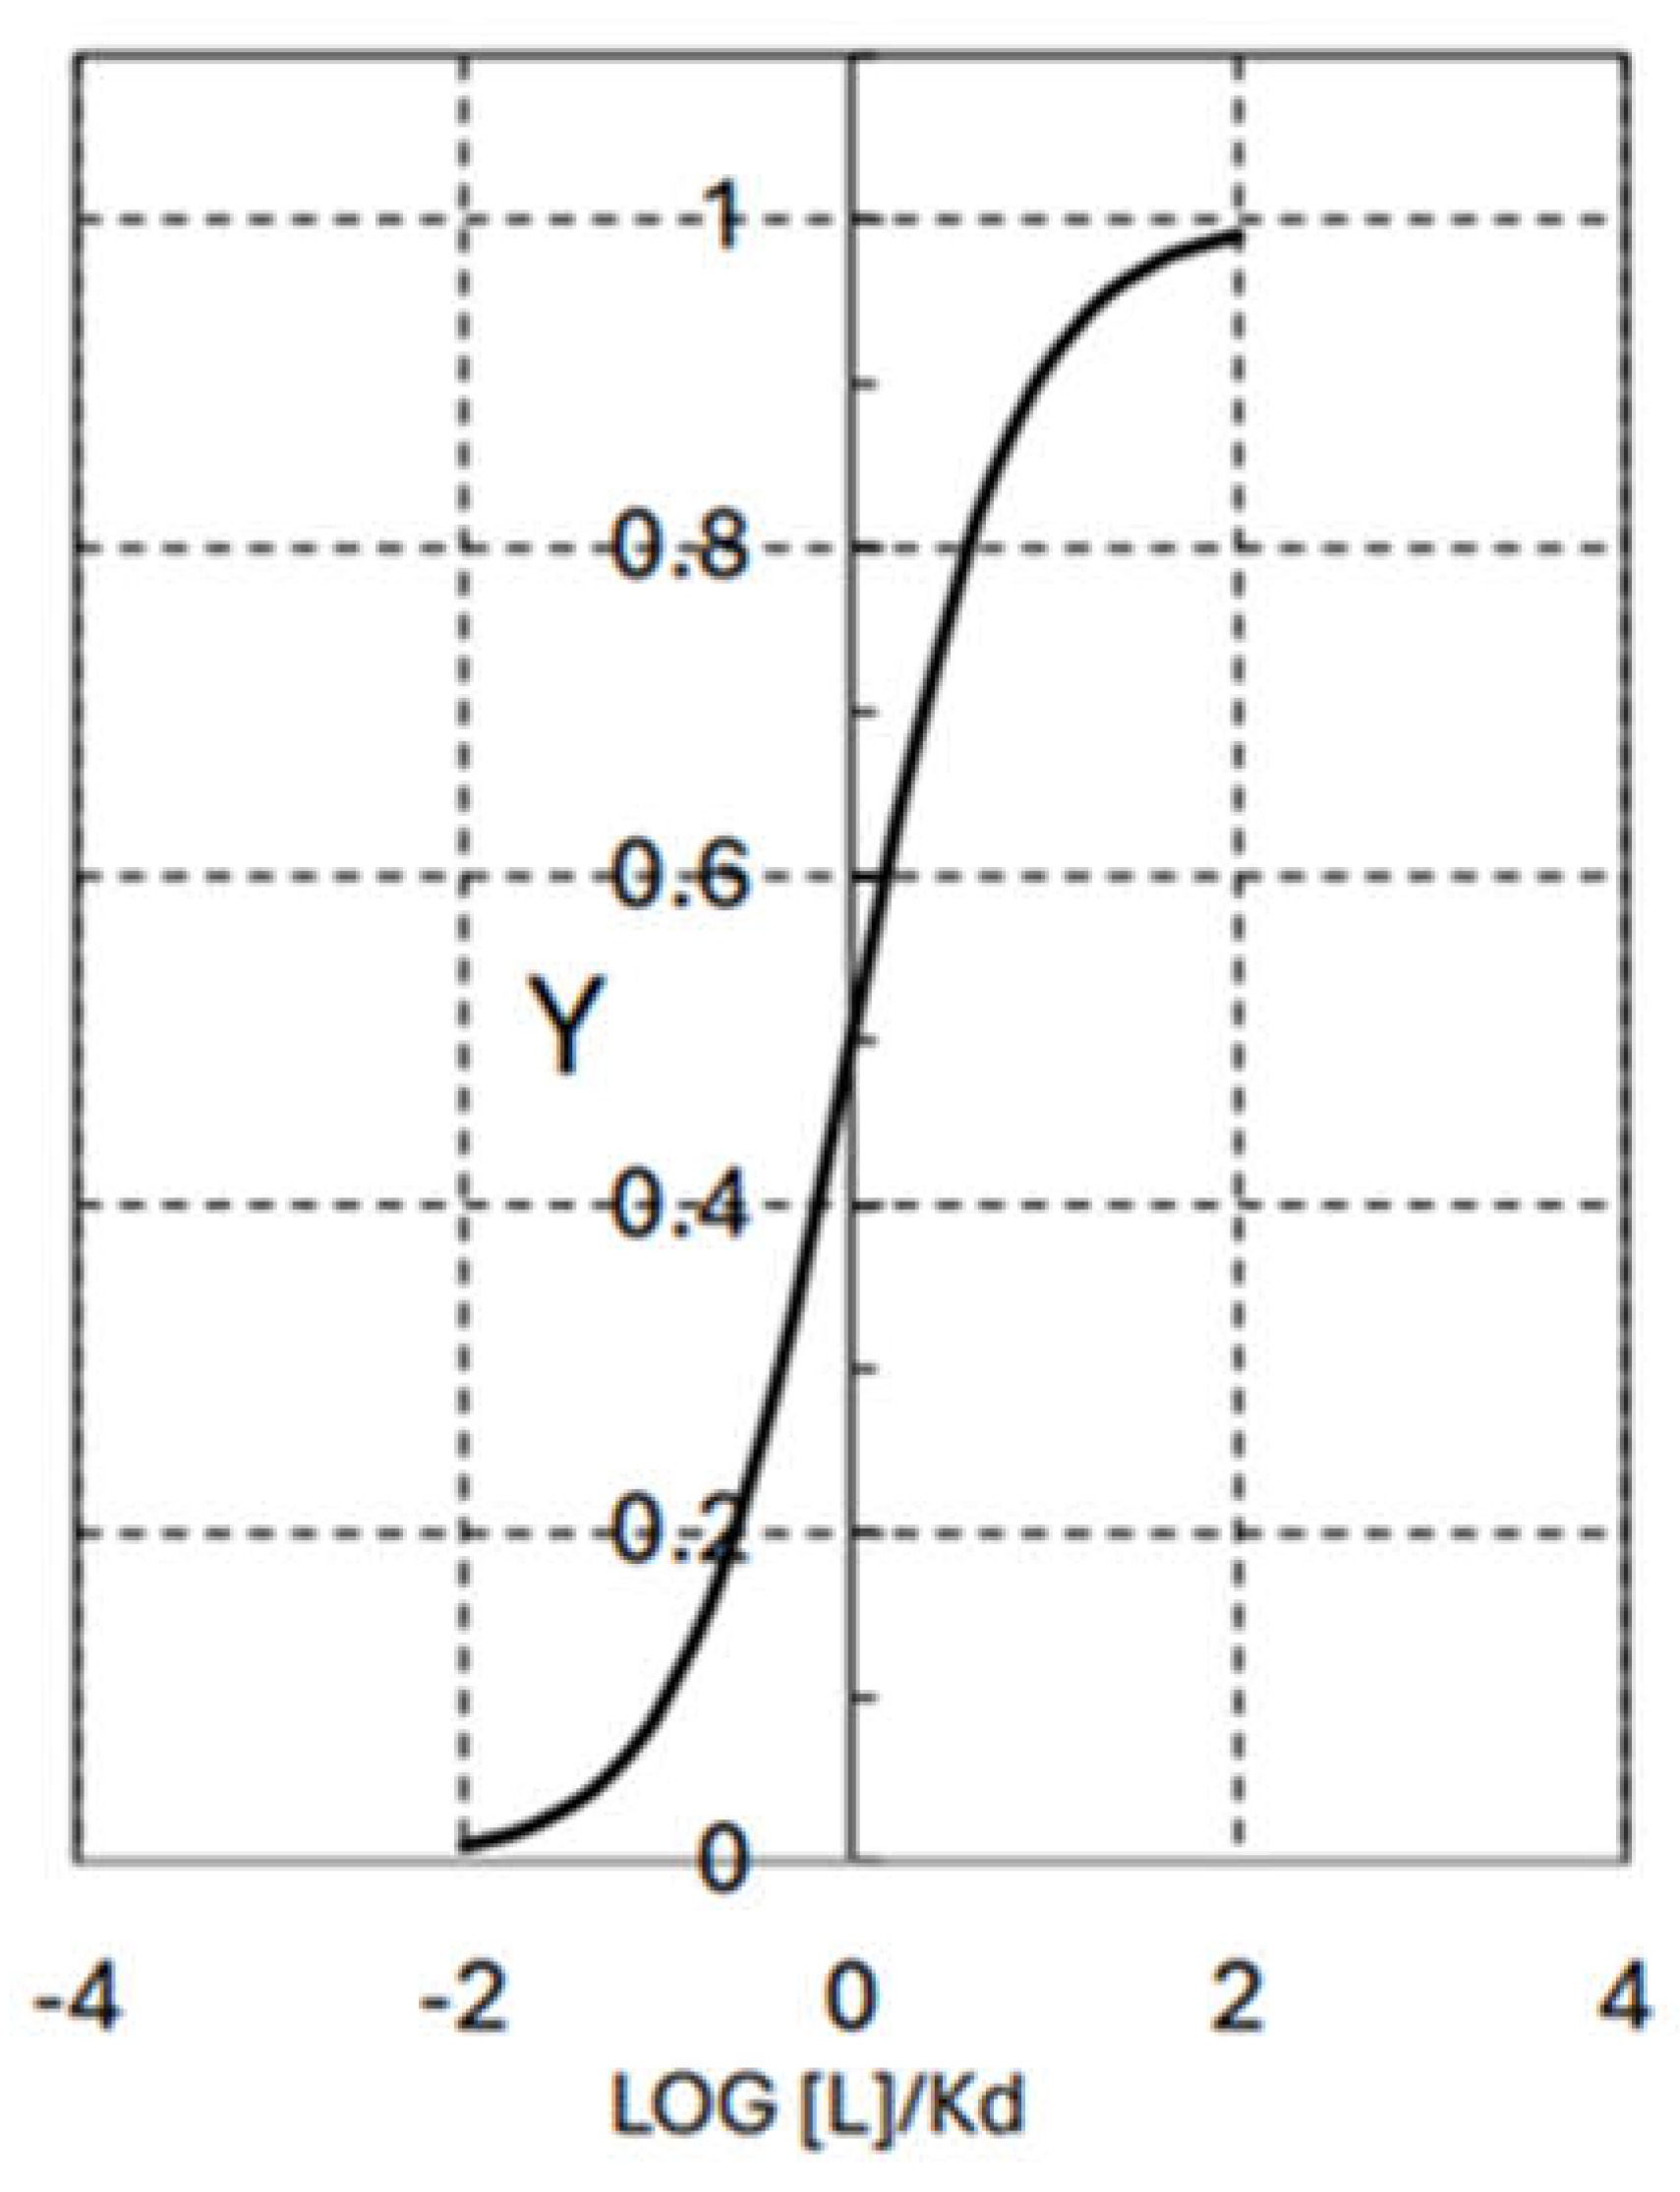
Figure 4.
Normal Distribution for Human Metabolites. The set of data were obtained from the Metabolome Data Base (2020) and contains 2558 elements from human fluids, including blood, saliva, cerebrospinal fluid, breast milk, and amniotic fluid. All the data were expressed as chemical potential, according to the expresion ΔGo = RT LN [L].
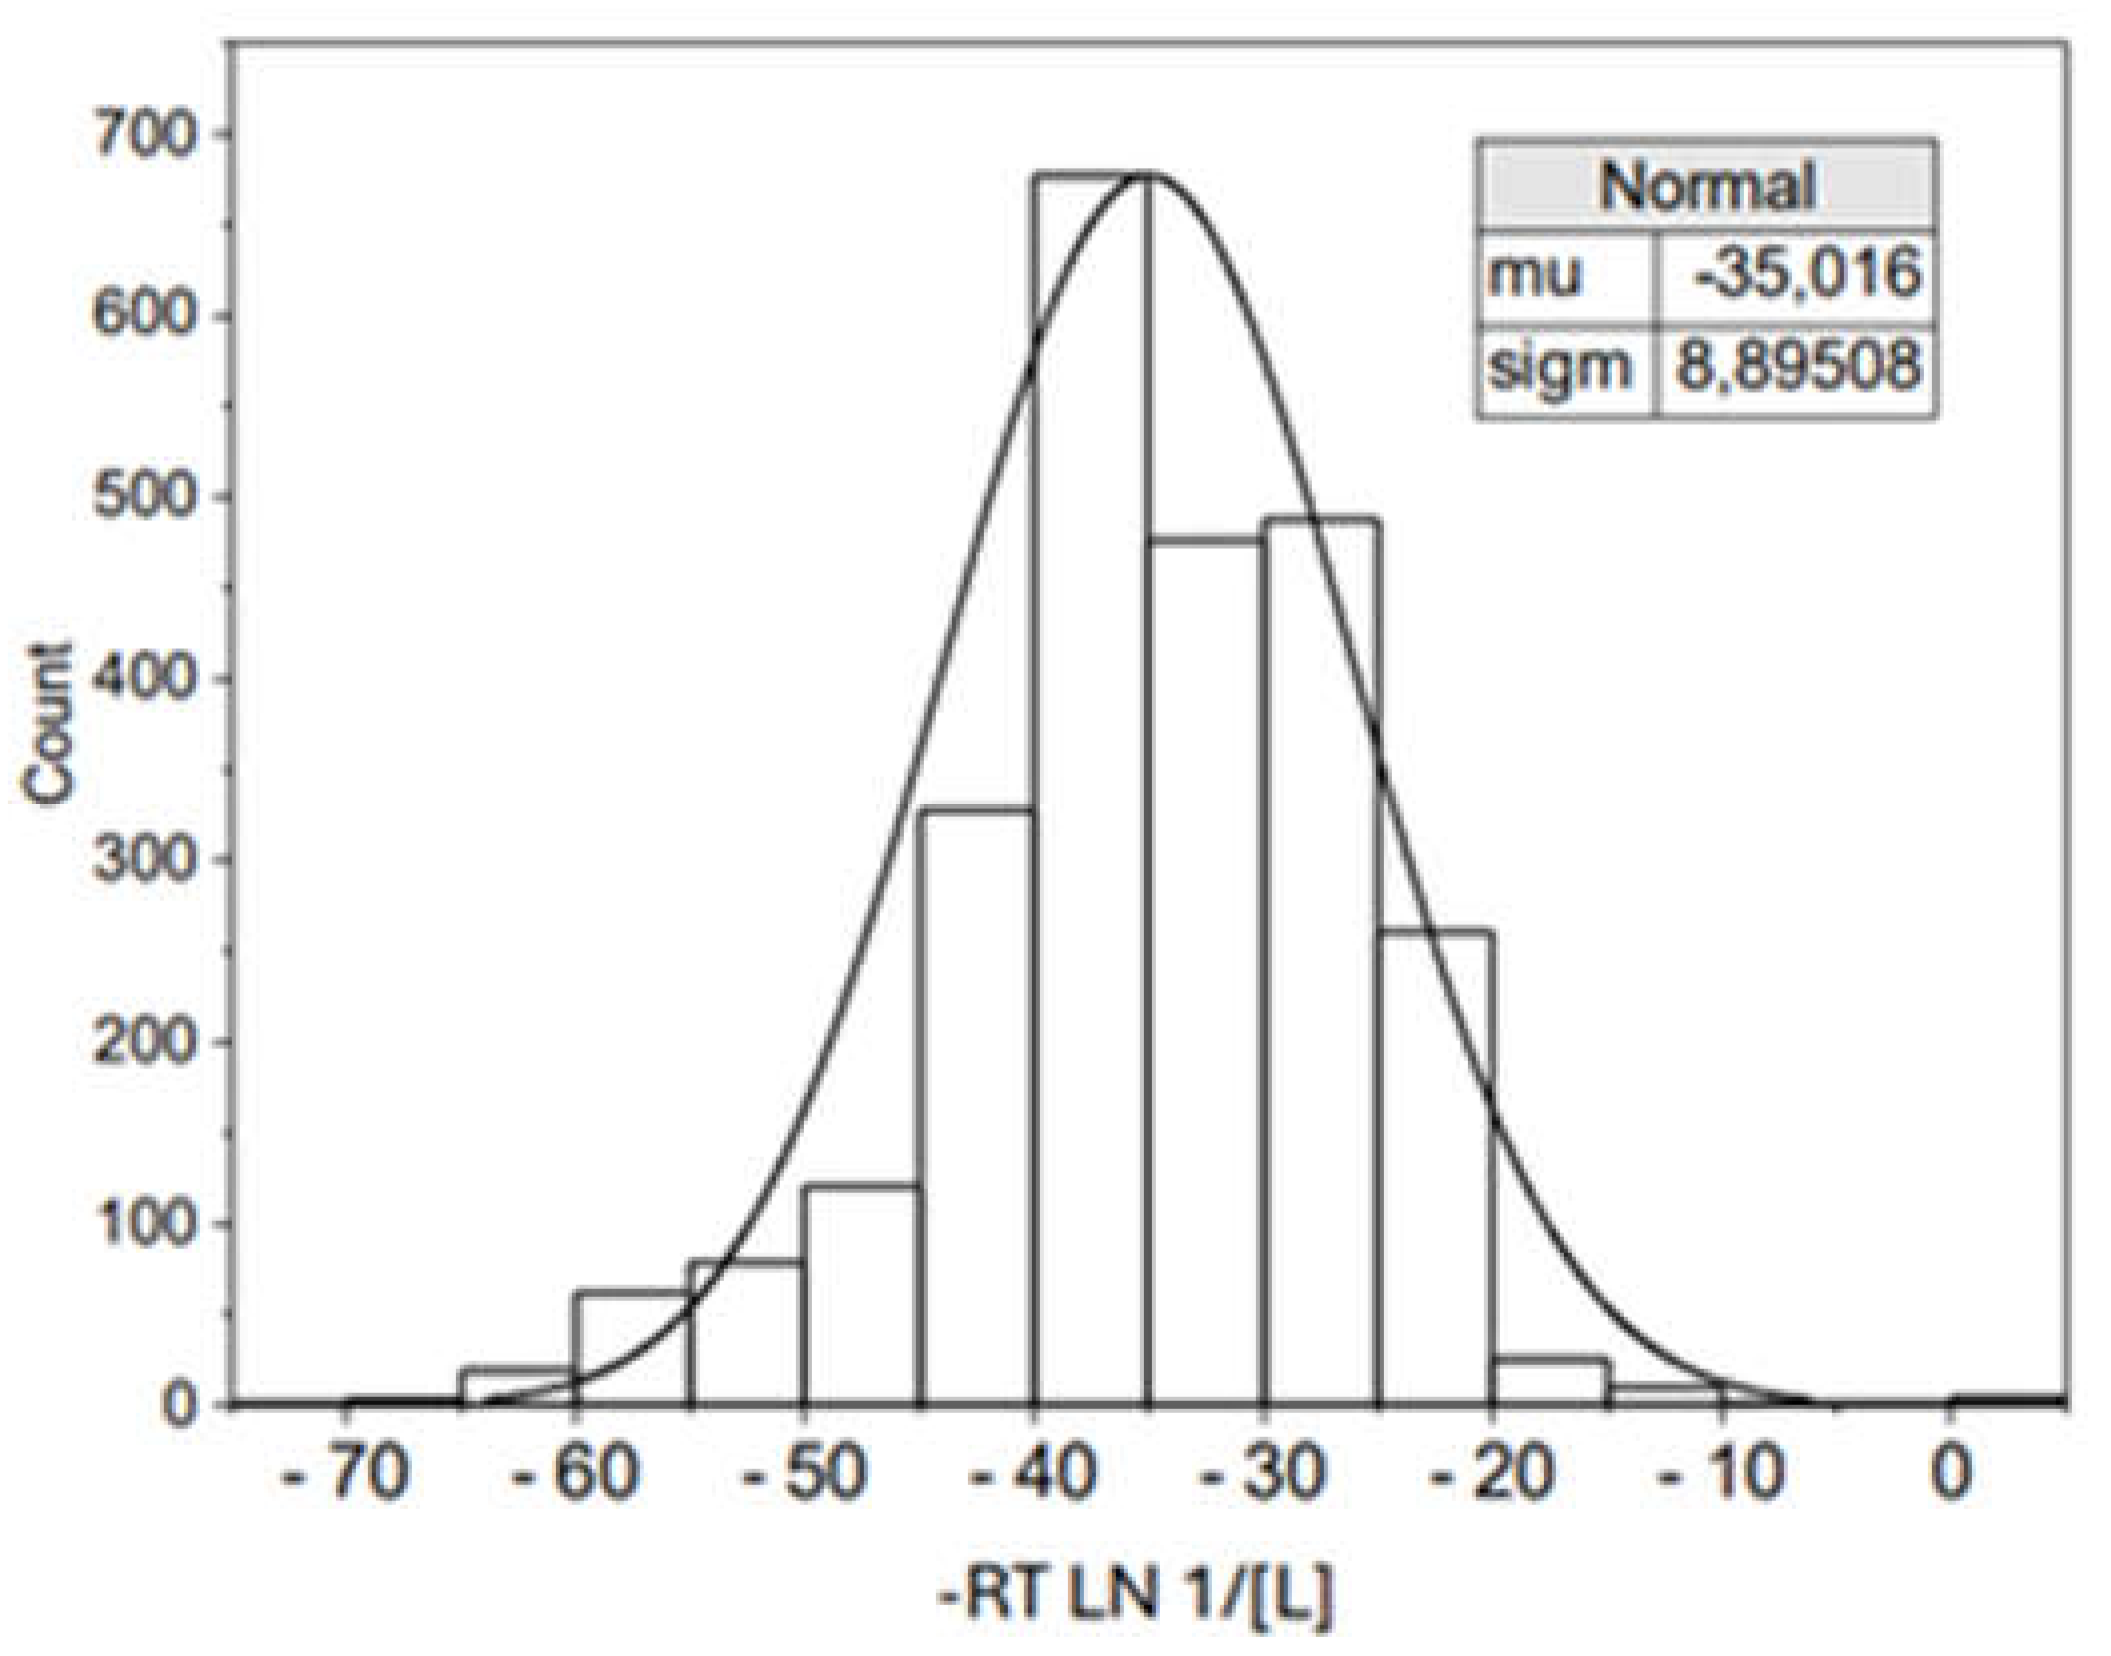
Figure 5.
Gaussian curves for Protein-Ligand affinities and chemical potential for Ligands. Both curves correspond to those shown in Figure 2 and Figure 4. Grey curve, Protein-Ligand affinities, ΔGo = -RT LN 1/Kd. Black curve, Chemical Potential for Ligand concentrations, -RT LN 1/[L].
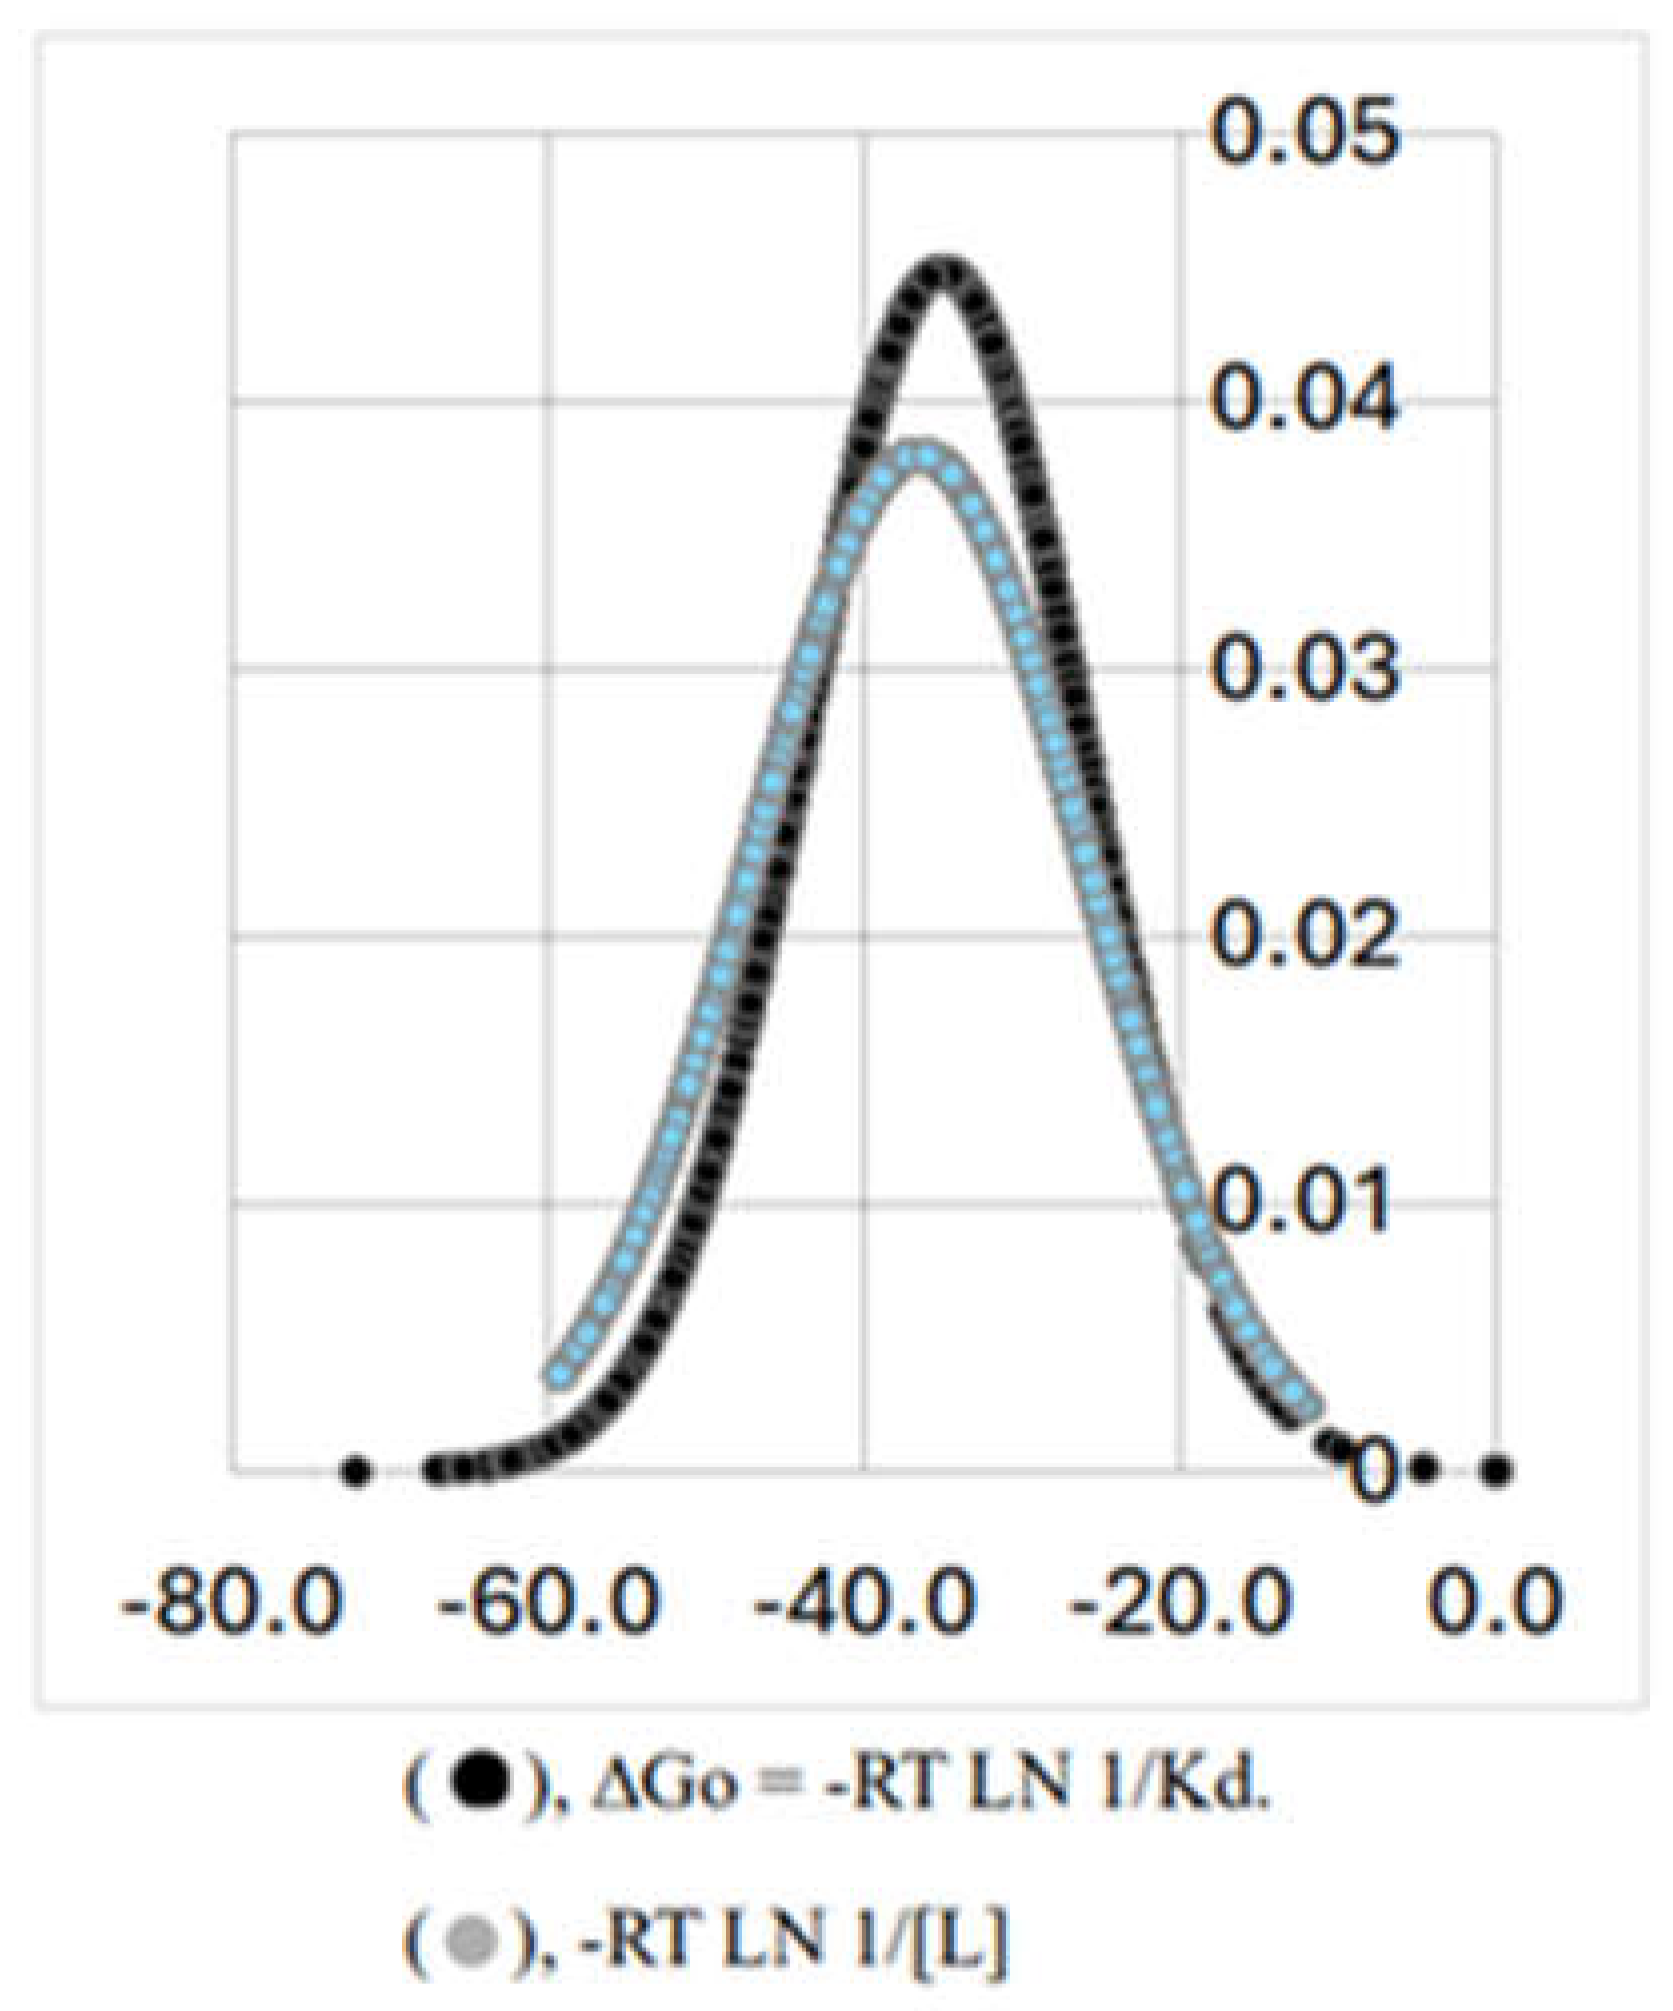

Table 1.
Chemical Reaction.
| ΔHo (kJ/mol) | ΔGo (kJ/mol) | TΔSo (kJ/mol) | |
|---|---|---|---|
| ½ Cl2 + O2 ↔ ClO2 (a) | 102.5 | 120.5 | -18 |
| ½ Cl2 + ½ O2 + ½ H2 ↔ HClO (a) | -78.7 | -66.1 | -12.6 |
| ½ Cl2 + ½ F2 ↔ FCl (a) | -54.5 | -55.9 | 1.4 |
| ½ Cl2 + 3/2 F2 ↔ ClF3 (a) | -163.2 | -123.0 | -40.2 |
| ½ Br2 + ½ Cl2 ↔ BrCl (a) | 14.6 | -0.98 | 15.58 |
| ½ I2 + ½ O2 ↔ IO (a) | 175.0 | 149.8 | 25.2 |
| ½ I2 + ½ F2 ↔ IF (a) | -95.7 | -118.5 | 22.8 |
| S + O2 ↔ SO2 (a) | -296.8 | -300.2 | 3.4 |
| S + ½ H2 ↔ HS (a) | 142.7 | 113.3 | 29.4 |
| S + H2 ↔ H2S (a) | -20.6 | -33.6 | 13 |
| S + 2 F2 ↔ SF4 (a) | -774.9 | -731.3 | -43.6 |
| S + 3 F2 ↔ SF6 (a) | -1209.0 | -1105.3 | -103.7 |
| ½ N2 + O2 ↔ NO2(a) | 33.2 | 51.3 | -18.1 |
| ½ N2 + H2 ↔ NH2 (a) | 184.9 | 194.6 | -9.7 |
| 3/2 N2 + ½ H2 ↔ HN3 (b) | 294.1 | 328.1 | -34 |
| ½ N2 + 3/2 H2 ↔ NH3 (b) | -46.1 | -16.5 | -29.6 |
| ½ H2 + ½ Br2 ↔ HBr (d) | -36.4 | -53.5 | 17.1 |
| H2O + ½ O2 ↔ H2O2 (d) | 98.1 | 116.8 | -18.7 |
| CO + H2 ↔ HCHO (d) | 2.0 | 34.6 | -32.6 |
| NO + ½ O2 ↔ NO2 (d) | -57.1 | -35.2 | -21.9 |
| C2H2 + 2 H2 ↔ C2H6(d) | -311.4 | -242.0 | -69.4 |
| CH3COOH + 2 O2 ↔ 2 CO2 + 2H2O (d) | -874.4 | -873.1 | -1.3 |
| C6H6 + 3 H2 ↔ C6H12 (d) | -205 | -97.5 | -107.5 |
| 3 C2H2 ↔ C6H6 (d) | -631.2 | -503.3 | -127.9 |
| C2H4 + 3 O2 ↔ 2 CO2+ 2 H2O (d) | -1411 | -1331 | -80 |
| CH3OH + 3/2 O2 ↔ CO2 + 2 H2O (d) | -765.0 | -702 | -63 |
| C2H6 + 7/2 O2 ↔ 2 CO2 + 3 H2O (d) | -1560 | -1467 | -93 |
| C2H2 + H2 ↔ C2H4 (b) | -174 | -141 | -33 |
| C2H4 + H2 ↔ C2H6 (b) | -137 | -101 | -36 |
| C4H8 + H2 ↔ C4H10 (b) | -126 | -88.4 | -37.6 |
| ½ H2 + ½ F2 ↔ HF (c) | -271 | -273.3 | 2.3 |
| ½ H2 + ½ Cl2 ↔ HCl (c) | -92.3 | -95.4 | 3.1 |
| ½ N2 + ½ O2 ↔ NO (c) | 90.3 | 86.5 | 3.8 |
| ½ Cl2 + ½ O2 ↔ ClO (f) | 102 | 98.1 | 3.9 |
| CO + ½ O2 ↔ CO2 (c) | -283 | -257 | -26 |
| H2 + ½ O2 ↔ H2O (c) | -242 | -229 | -13 |
| N2 + ½ O2 ↔ N2O (f) | 82.1 | 104.2 | -22.1 |
| ATP + H2O ↔ ADP + P (e) | -24.4 | -37.6 | 13.2 |
| ADP + H2O ↔ AMP + P (e) | -25.7 | -34.4 | 8.7 |
| AMP + H2O ↔ Adenosine + P (e) | -3.23 | -14.4 | 11.17 |
a)Wagman et al. “Selected Values of Chemical Thermodynamic Properties.” Nat. Bur. Stand. Tech. Notes 270-3, 270-4, 270-5, 270-6. 270-7 and 270-8. Washington, (1968-1981). b)Atkins, P. and De Paula, J. “Physical Chemistry for Life Sciences.” Oxford University Press. (2006). c)Levine, I.N. “Physical Chemistry.” McGraw Hill. (2002). d)Handbook of Chemistry and Physics (D.R. Lide, Ed.) CRC Press. 85th edition, 2004-2005. e)Alberty, R.A. “Calculation of Standard Transformed Gibbs Energies and Standard Transformed Enthalpies of Biochemical Reactants” Arch. Biochem. Biophys. 353, 116-130. (1998). f)Lewis, G.N. & Randall, M.in Thermodynamics. 2nd Edition. McGraw-Hill.
Table 2.
Protein + Ligand.
| ΔHo (kJ/mol) | ΔGo (kJ/mol) | TΔSo (kJ/mol) | |
|---|---|---|---|
| PTP1b + Trivaric acid (a) | -189 | -21.8 | -167.2 |
| TCPTP + Mitoxantrone (b) | -31.4 | -33.9 | 2.5 |
| Insulin + Protamine (c) | -64 | -28 | -36 |
| Human Serum Albumin + BA (d) | -4.5 | -26.3 | 21.8 |
| Human Serum Albumin + HxA (d) | -7.8 | -30.1 | 22.3 |
| Human Serum Albumin + HpA (d) | -16.6 | -28 | 11.4 |
| Human Serum Albumin + OA (d) | -20.3 | -32.6 | 12.3 |
| Human Serum Albumin + NA (d) | -27.3 | -35.5 | 8.2 |
| Human Serum Albumin + DA(d) | -214.9 | -24.7 | -190.2 |
| Human Serum Albumin + PFBA (d) | -33.9 | -28.4 | -5.5 |
| Human Serum Albumin + PFHxA (d) | -10.6 | -32.2 | 21.6 |
| Human Serum Albumin + Genx (D) | -11.9 | -30.5 | 18.6 |
| Human Serum Albumin + PFHpA (d) | -21 | -36.6 | 15.6 |
| Human Serum Albumin + PFDA (d) | -23 | -30.9 | 7.9 |
| Bovine Serum Albumin + Chloroform (e) | -10.4 | -19 | 8.6 |
| Lactate Dehydrogenase + NADH (f) | -31.6 | -28.9 | -2.7 |
| Lactate Dehydrogenase + AMP (f) | -16.9 | -14.6 | -2.3 |
| Lactate Dehydrogenase + ADP (f) | -21.9 | -14.5 | -7.4 |
| Phosphorylase b dimers + AMP (g) | -27 | -20.5 | -6.5 |
| Phosphorylase b dimers + AMP (g) | -70 | -25.2 | -44.8 |
| Phosphorylase b dimers + IMP (g) | -18 | -16.4 | -1.6 |
| Phosphorylase b dimers + IMP (g) | -33 | -18.9 | -14.1 |
| Tau protein + DNA (h) | -32 | -41.4 | 9.4 |
| L-Arabinose binding protein + L-Arabinose (i) | -62.7 | -36.3 | -26.4 |
| Carbonic Anhydrase II + Acetazolamide (j) | -59.5 | -43.3 | -16.2 |
| Bovine Serum Albumin + Fenhexamid (k) | -61.6 | -25 | -36.6 |
| Bovine Serum Albumin + Ascorbyl Palmitate (l) | 59.2 | -4.75 | 64 |
| α1,4-N-acetylhexosaminyltransferase + UDP (m) | -25.3 | -27 | 1.7 |
| α1,4-N-acetylhexosaminyltransferase + UDP-GalNAc(m) | -8.8 | -24.4 | 15.6 |
| α1,4-N-acetylhexosaminyltransferase + UDP-GlcNac (m) | -8.3 | -24.5 | 16.2 |
| Concavalin A + Trimannoside 1 (n) | -55.7 | -31.8 | -23.9 |
| Concavalin A + Trimannoside 2 (n) | -46.1 | -26.8 | -19.3 |
| α-Crystallin (o) | -26.3 | -36.5 | 10.2 |
| α-Crystallin + Histones (o) | -7.6 | -43 | 35.4 |
| βL-Crystallin (o) | -44.8 | -40.3 | -4.5 |
| βL-Crystallin + Histones (o) | -37.1 | -35 | -2.1 |
| γ- Crystallin (o) | -55.9 | -39.4 | -16.5 |
| γ- Crystallin + Histones (o) | -65.9 | -39.9 | -26 |
| Insulin + G-Quaduplex DNA (p) | -10.8 | -27.7 | 16.9 |
| Tubulin-GTP + Stathmin (q) | 7.1 | -40.5 | 47.6 |
| Human Serum Albumin + Estradiol (r) | -231.7 | -41.4 | 190.3 |
| Holo-Transferrin + Estradiol (r) | -147.2 | -44.3 | -102.9 |
a)Sun, W., Zhang, B., Zheng, H., Zhuang, C., Li, X., Lu, X., Quan, C., Dong, Y., Zheng, Z. & Xiu, Z. Trivaric acid, a new inhibitor of PTP1b with potent beneficial effect on diabetes. Life Sciences 169, 52-64 (2017). b)Ylilauri, M., Mattila, E., Nurminen, E.M., Käpylä, J., Niinivehmas, S.P., Määttä, J.A., Pentikäinen, U., Ivaska, J. & Pentikäinen, O.T. Molecular mechanism of T-cell protein tyrosine phosphatase (TCPTP) activation by mitoxantrone. Biochimica et Biophysica Acta 1834, 1988-1997 (2013). c)Aggarwal, S., Tanwar, N., Singh, A. & Munde, M. Formation of Protamine and Zn−Insulin Assembly: Exploring Biophysical Consequences. ACS Omega 7, 41044−41057 (2022). d)Crisalli, A.M., Cai, A. & Cho, B. P. Probing the Interactions of Perfluorocarboxylic Acids of Various Chain Lengths with Human Serum Albumin: Calorimetric and Spectroscopic Investigations. Chem. Res. Toxicol. 36, 703−713 (2023). e)Ueda, I. & Yamanaka, M. Titration calorimetry of anesthetic-protein interaction: negative enthalpy of binding and anesthetic potency. Biophys. J. 72, 1812-1817 (1997). f)Hinz, H.J., Steininger, G., Schmid, F. & Jaenide, R. Studies on an energy structure-function relationship of dehydrogenases. II. Calorimetric investigations on the interaction of coenzyme fragments with pig skeletal muscle lactate dehydrogenase. FEBS Lett. 87, 83-86 (1978). g)Mateo, P.L., Barón, C., López-Mayorga, O., Jiménez, J.S. & Cortijo, M. AMP and IMP binding to glycogen phosphorylase b. A calorimetric and equilibrium dialysis study. J. Biol. Chem. 259, 9384-9389 (1984). h)Camero, S. et al. Thermodynamics of the interaction between Alzheimer's disease related tau protein and DNA. PLOS ONE, 9, e104690 (2014). i )Fukada, H., Sturtevant, J.M. & Quiocho, F.A. Thermodynamics of the binding of L-arabinose and of D-galactose to the L-arabinose-binding protein of Escherichia coli. J. Biol. Chem. 258, 13193-13198 (1983). j) Paketurytė V, Linkuvienė V, Krainer G, Chen WY, Matulis D. Repeatability, precision, and accuracy of the enthalpies and Gibbs energies of a protein-ligand binding reaction measured by isothermal titration calorimetry. Eur Biophys J. 48, 139-152. k)Shi, J.H., Lou, Y.Y., Zhou, K.L. & Pan, D.Q. (2018) Elucidation of intermolecular interaction of bovine serum albumin with Fenhexamid: A biophysical prospect. J. Photochem. Photobiol. B, Biol. 180, 125–133 (2018). l) Sohrabi, Y., Panahi-Azar, V., Barzegar, A., Dolatabadi, J.E.N. & Dehghan, P. Spectroscopic, thermodynamic and molecular docking studies of bovine serum albumin interaction with ascorbyl palmitate food additive. BioImpacts, 7, 241-246 (2017). m) Sobhany, M. & Negishi, M. Characterization of specific donor binding to α1,4Nacteylhexosaminyltransferase EXTL2 using Isothermal Titration Calorimetry. Methods Enzymol. 416, 3-12 (2006). n) Clarke, C. et al. Involvement of water in carbohydrate-protein binding. J. Am. Chem. Soc. 123, 12238-12247 (2001). o)Hamilton, P.D. & Andley, U.P. In vitro interactions of histones and α-crystallin Biochemistry and Biophysics Reports 15, 7–12 (2018). p)Timmer, C.M., Michmerhuizen, N.L., Witte, A.B., Van Winkle, M., Zhou, D. & Sinniah, K. An Isothermal Titration and Differential Scanning Calorimetry Study of the G-Quadruplex DNA−Insulin Interaction. J. Phys. Chem. B 118, 1784−1790 (2014). q)Honnappa, S., Cutting, B., Jahnke, W., Seelig, J. & Steinmetz, M.O. Thermodynamics of the Op18/Stathmin-Tubulin Interaction. J. Biol. Chem. 278, 38926–38934 (2003). r)Danesha, N., Sedighia, Z.N., Beigolib, S., Sharifi-Radc, A., Saberid, M.R.& Chamania, J. Determining the binding site and binding affinity of estradiol to human serum albumin and holo-transferrin: fluorescence spectroscopic, isothermal titration calorimetry and molecular modeling approaches. Journal of Biomolecular Structure and Dynamics, 36, 1747–1763 (2018).
Disclaimer/Publisher’s Note: The statements, opinions and data contained in all publications are solely those of the individual author(s) and contributor(s) and not of MDPI and/or the editor(s). MDPI and/or the editor(s) disclaim responsibility for any injury to people or property resulting from any ideas, methods, instructions or products referred to in the content. |
© 2024 by the authors. Licensee MDPI, Basel, Switzerland. This article is an open access article distributed under the terms and conditions of the Creative Commons Attribution (CC BY) license (https://creativecommons.org/licenses/by/4.0/).
Copyright: This open access article is published under a Creative Commons CC BY 4.0 license, which permit the free download, distribution, and reuse, provided that the author and preprint are cited in any reuse.


