Submitted:
29 April 2024
Posted:
01 May 2024
Read the latest preprint version here
Abstract
In this study, the fundamentals of electroencephalography signals, their categorization into frequency sub-bands, the circuitry used for their acquisition, and the impact of noise interference on signal acquisition are examined. Additionally, design specifications for medical-grade and research-grade EEG circuits and a comprehensive analysis of various analog front-end architectures for electroencephalograph (EEG) circuit design are presented. Three distinct selected case studies are examined in terms of comparative evaluation with generic EEG circuit design templates. Moreover, a novel one-channel battery-supplied EEG analog front-end circuit designed to address the requirements of usage protocols containing strong com-pound muscle movements is introduced. Furthermore, a realistic input signal generator circuit is proposed that models the human body and the Electromagnetic Interference from its surroundings. Experimental simulations are conducted in 50 Hz and 60 Hz electrical grid environments to evaluate the performance of the novel design. The results demonstrate the efficacy of the proposed system, particularly in terms of bandwidth, portability, common mode rejection ratio , gain, suppression of muscle movement artifacts, electrostatic discharge and leakage current protection. Conclusively, the novel design is cost-effective and suitable for both commercial and research single-channel EEG applications. It can be easily incorporated in Brain Computer Interfaces and neurofeedback training systems.
Keywords:
electroencephalography
; EEG
; muscle artifacts
; notch filter
; driving right leg
; battery-based EEG signal acquisition system
; biosignal filtering
; low frequency signal
; CMRR
1. Introduction
1.1. Medical Significance of EEG Signals Acquisition
1.1.1. EEG Fundamentals: Understanding Medical Relevance
Electroencephalography, a non-invasive signal acquisition technique in Neuroscience, is employed for recording the brain’s electrical activity via electrodes placed on the scalp. These captured signals are distinguished by their unique frequency, amplitude, and source location characteristics, playing a pivotal role in the diagnosis and monitoring of neurological disorders such as epilepsy, sleep disturbances, brain tumors, cerebral injuries, etc. The high temporal resolution of the Electroencephalograph (in this study, it is denoted by the abbreviation EEG), in contrast with other neuro-imaging modalities such as fMRI, enables the real-time analysis of brain activity, offering valuable insights into cognitive functions and mental states. As a final point, EEG is instrumental in the advancement of Brain-Computer Interfaces (BCIs), contributing significantly to our comprehension of neural dynamics in both healthy and pathological states by enabling telemonitoring of patients, as well as enabling biomedical engineers to create telekinesis applications and neuro-feedback training BCI Systems [1,2].
1.1.2. EEG’s Role in Patient Monitoring
EEG plays a vital role in patient real-time monitoring due to its non-invasive nature in tracking brain activity. For the purpose of diagnosing neurological disorders, evaluating cerebral functioning, measuring the effectiveness of therapy, tracking the course of the disease, and providing prognostic insights, high temporal resolution is crucial. It additionally functions well as a monitoring tool during surgery and can be easily integrated with other methods such as fMRI and fNIRS. In clinical settings and in research, particularly in the domains of neurology and neurosurgery, the precise signal acquisition needs to be as accurate and noise-free as possible to determine the patterns of brainwaves and make diagnostic analysis through EEG [3,4].
1.1.3. Representatives Examples in Realistic Cases in Diagnosing Brain-Related Conditions
The technology that entails EEG is an enormously relevant tool in neurological assessments, whereby an evaluation and assessment of the electrical activity taking place within the brain is done. It helps to identify some kinds of seizures, which helps develop an accurate protocol of treatment. EEG identifies the patterns of brain waves for different stages of sleep; it is very important in the diagnosis of sleep abnormalities like narcolepsy. In patients with head injury who have fallen into a coma, EEG is of paramount importance in the assessment of brain responsiveness and the quantification of damage. It may be used in the determination of early abnormal loci within the brain, loci which may be reflecting the onset of ailments such as epilepsy, dementia, and Alzheimer’s [5,6].
1.2. EEG Signals into Frequency Sub-bands: Comprehensive Categorization
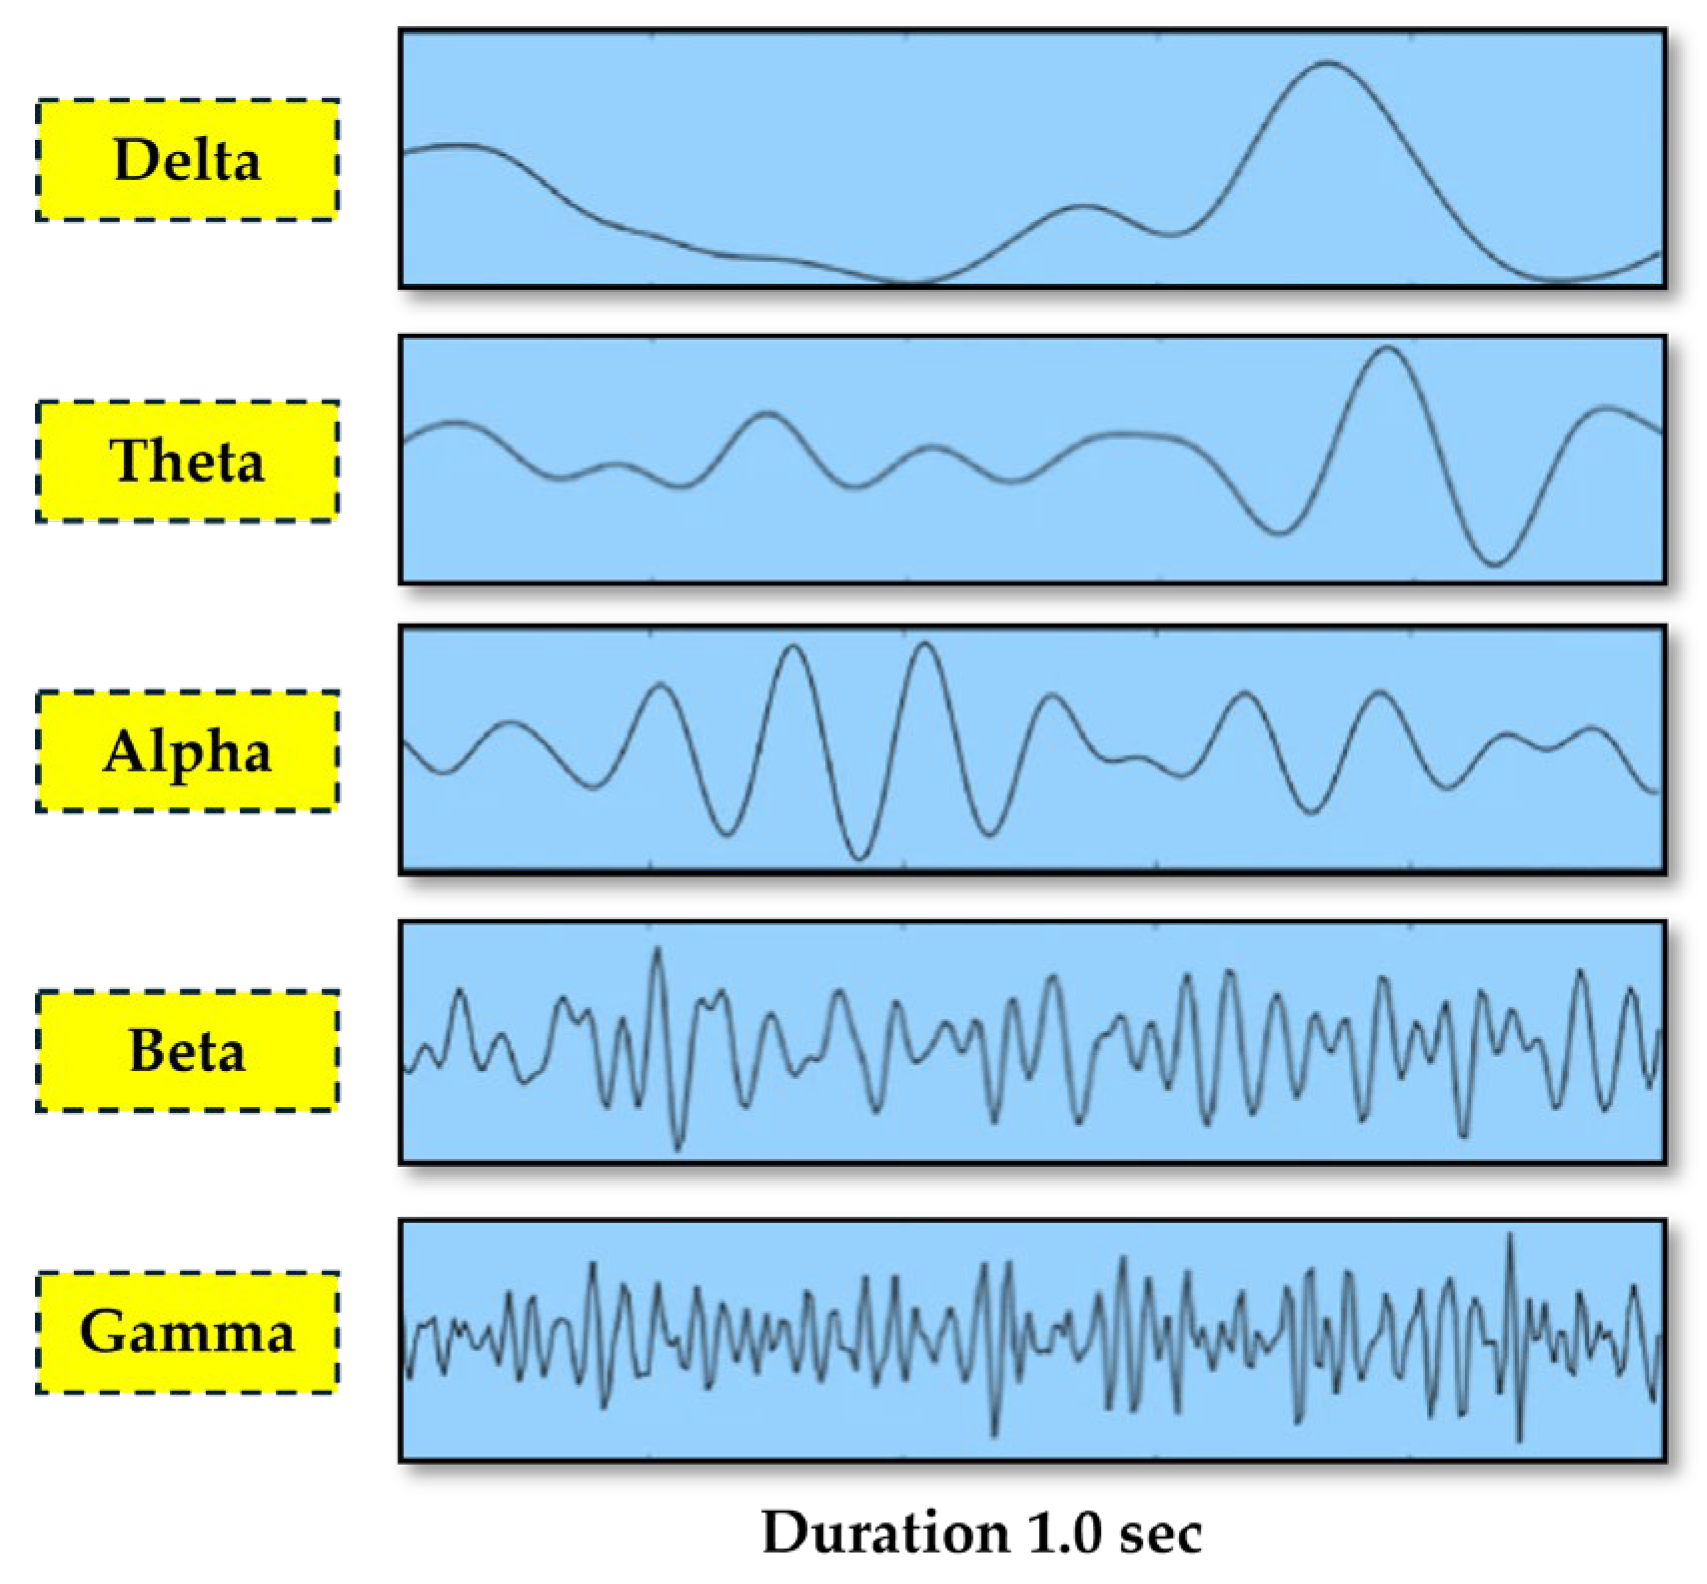
The EEG signals were represented as the linear combination of many frequencies sub-bands in which each of them bores a unique set of brain activity. Normally, delta waves refer to unconsciousness and deep sleep. Theta waves are associated with meditation, creativity, and insomnia, while alpha waves relate to tranquility, relaxation, and reduced concentration. While beta waves are affix to anxiety, concentration, and active, busy, or deep-thinking mental activities, gamma waves are attributed to higher mental activities that involve more consciousness or perception [7,8]. This classification induces structure and reproducibility when employed in clinical and research settings, and it enables healthcare providers to analyze brains and diagnose disorders more efficiently, as outlined in Table 1 [7,8,9].
Figure 1.
EEG Signals Categorization by Frequency Sub-bands.
1.3. Noise Interference in EEG Signal Acquisition
Noise interference presents a considerable challenge in EEG signal acquisition. It creates noise artifacts that are embedded in the raw EEG data that is collected with electrodes and leads to significant challenges to the interpretation of the real brain’s state patterns by practitioners in the fields of Neurology and Neuroscience. EEG captures the brain’s electrical activity indirectly through scalp electrodes because electrodes capture the voltage fluctuation in the skin that is caused by the projection of an electromagnetic field, causing internal neural activity [10]. Unfortunately, along with the brain’s lead field projection in the electrode, the signal that the electrodes capture is also corrupted with unwanted noise artifacts, such as compound muscle movement artifacts, electromagnetic interference, etc. The purpose of the EEG device is to digitize the least amount of possible noise artifacts that are contained within the original raw EEG signal collected from the electrodes while keeping intact the brain-related component of the raw signal. As it becomes apparent from the above, obtaining clear and precise EEG signals is often difficult due to numerous sources of noise interference. Table 2 below lists these noise sources and their corresponding frequency ranges [10,11].
1.4. Design Specifications in Medical-Grade and Research-Grade EEG Generic Circuits Design
In EEG Generic Circuit Design, various subcomponents work together for accurate brainwave signal capturing and denoising. One of the most characteristic examples of them is the Filter subcomponents such as Notch, Anti-Aliasing, High Pass, and Low Pass Filters, which refine signals by eliminating interference and keeping only the frequency bands of interest from the input raw EEG signal [12]. Another example is the Circuit subcomponents, including Chopper Circuits and Electrostatic Discharge Protection (ESD), which minimize low-frequency noise and protect against electrostatic discharge damage. Additionally, the Amplifier subcomponents, such as Operational Amplifiers, Programmable Gain Amplifiers, and Instrumentation Amplifiers, amplify signals with high fidelity [13]. Furthermore, the Analog Multiplexers select signals in multi-channel setups, while the Analog to Digital Converter digitizes the collected signals from the electrodes for further analysis [14]. Moreover, the Drive Right Leg Circuit reduces interference by introducing a feedback loop between the EEG device and the Human Body [12]. Last but not least, the Power Supply subcomponents, such as batteries and regulators, ensure a stable power supply for the device. These integrated subcomponents create a prototypical EEG Generic circuit design for detailed brain activity analysis. The particular order of the subcomponents and the choice of incorporating some of them in the design, along with their multiplicity, are some of the engineering problems of constructing a functional and appropriate EEG device. As it becomes apparent, each engineering decision has trade-offs, that must be well understood for the design to meet its predefined requirements. Table 3 presents a structured overview of the various components involved in EEG circuits, along with their respective functions [12,13,14].
In the design of circuits for medical-grade and research-grade EEG applications, several essential specifications are critical, and specific requirements should be met. These circuits may have a bandwidth ranging from 0.01 Hz to 20 kHz (maximum frequency application—identifying Directional Hearing Cues), covering a broad spectrum of brain activity pertinent to diverse research and medical requirements [15,16]. In addition to the aforementioned point, managing noise levels is crucial, particularly during the initial stages before the first amplification. It’s essential to keep the 0.1 to 10 Hz noise below 1 μVpp [17], and ideally under 0.4 μVpp, to ensure clear signal quality and a high signal-to-noise ratio (SNR) [18]. Furthermore, it must be stated that the EEG signal of interest always appears as an AC differential voltage signal in the raw input EEG data. Consequently, a high Common Mode Rejection Ratio (CMRR) exceeding 90 dB is deemed crucial for filtering out the common components of the input signals that are the major carriers of the noise artifacts and undesirable DC offsets [19]. It’s also important to note that compliance with regulations requires ensuring that no more than 10 μA of current returns to the body, along with mandatory ESD protection. [20,21,22]. The sub-circuits analyzed above are instrumental in achieving signal integrity, thereby ensuring the accuracy and reliability of the data collected. Each design must be tailored to its intended use and optimized for the particular sub-audience that it appeals to in the field of Neuroscience and Medical practice. The technical distinctions in design specifications between medical-grade and research-grade EEG circuits [22] are illustrated in Table 4.
1.5. The Structure of the Present Study
The present manuscript is organized as follows:
- Section 1 (Introduction) highlights the medical importance of acquiring an EEG signal and its role in patient monitoring. It also discusses the sub-bands of frequencies into which the EEG signal is classified and introduces the challenges that noise brings in an acquired EEG signal. This section contains the following sub-sections:
- Section 1.1, Medical Significance of EEG Signals Acquisition: It is highlighted that EEG is a non-invasive technique used to diagnose a variety of neurological disorders.
- Section 1.2, EEG Signals into Frequency Sub-bands: It describes the significance and key topics related to various frequency bands of EEG.
- Section 1.3, Noise Interference in EEG Signal Acquisition: It includes the sources and effects of noise to the acquired EEG signals, together with the reduction measures that can be taken to minimize their effects.
- Section 1.4, Design Specifications in Medical-Grade and Research-Grade EEG Generic Circuits Design: It details the assembly and function of key EEG circuit components—filters, amplifiers, and protection circuits—raising both signal integrity and adaptability among diverse neuroscience applications.
- Section 2 (Related Works in EEG Circuit Design Analog Front-End Architectures) discusses design specifications on medical and research-grade EEG circuits. The selected case studies are elaborated with respect to the comparative analysis of various architectures of EEG AFE. Sub-sections of this Section are:
- Section 2.1, Low-Cost Circuit Design of EEG Analog Front-ends: Case ’1’ elaborates cost-effective designs for EEG AFE.
- Section 2.2, Battery-Powered, Low-Noise Amplifier Circuit Design of EEG Analog Front-ends: Case ’2’ presents the design of a battery-operated, low-noise EEG AFE.
- Section 2.3, Double Notch Filter Circuit Design of EEG Analog Front-ends: Case ’3’ deals with the design and performance of a high-performance EEG AFE having dual-notch filter circuitry.
- Section 3 (Materials and Methods: Novel Proposed EEG Analog Front End Circuit System) puts forth a novel methodology for simulating and evaluating the novel EEG AFE circuitry design against practical cases using MATLAB. This section is organized into several sub-sections:
- Section 3.1, EEG Sub-Circuit Modeling the Electromagnetic Interference of Electric Grid with the Human Body: It presents the modeling of the electromagnetic interference of an electric grid with the human body and its application in designing the sub-circuit for replicating the voltage effect the adjacent electrical grids have on the human body.
- Section 3.2, EEG Sub-circuit Modeling the Human Body Apart from the Brain and Earth: It describes the sub-circuit that simulates the physiological electrical circuits and muscle movement.
- Section 3.3, EEG sub-Circuit Modeling the Brain and the Electrode: It explains how the brain signal voltage could be simulated in any desired circuitry and how the electrode picks up the brain signals.
- Section 3.4, EEG Sub-Circuit Modeling the Battery Supply of the System: It details the design of the battery supply sub-circuit for the EEG circuitry so that the total overall EEG system may be both portable and yet remain very stable.
- Section 3.5, EEG Sub-Circuit Modeling the Driven Right Leg (DRL) Circuit: The DRL circuit function is to maintain signal integrity and user safety.
- Section 3.6, EEG Sub-Circuit Modeling the First Band-Pass Filter: It describes the role of the band-pass filter in the users’ protection and ensuring that there is always the accurate capture of the EEG signal.
- Section 3.7, EEG Sub-Circuit Modeling the ESD Protection and the Instrumentation Amplifier: It will cover the addition of ESD protection and the details of the Instrumentation Amplifier in the EEG circuitry.
- Section 3.8, EEG Sub-Circuit Modeling the Fliedge Notch Filter 50Hz or 60Hz: It analyses how the notch filter will be designed so that the power grid interference is reduced to a minimum.
- Section 3.9, EEG Sub-Circuit Modeling the Second Low Pass Filter: It details of the second low pass filter design and cutoff frequency will be laid down in relation to an actual EEG signal processing system.
- Section 3.10, EEG Sub-Circuit Modeling the Second High Pass Filter before the Analog to Digital Conversion: It describes why, before the analog signal can be converted to digital, there is a need for a second high pass filter to make sure it does not degrade the quality of the signal.
- Section 311, The Overall Novel EEG-B3VS7C1 Circuit Design: A general overview of the entire circuit design for EEG is presented, emphasizing features incorporated and intended performance outcomes.
- Section 4 (Simulation and Results: Comprehensive Analysis) is presented with the objective to compare the theoretical values with the simulated values in a real-world scenario for the given circuit design EEGB3VS7C1. The circuit’s performance is simulated into two of the commonest EEG measurement scenarios: the 50Hz and 60Hz power grid environments that exist outside the shielded lab conditions. This section contains the following sub-sections:
- Section 4.1, Simulation of Novel EEGB3VS7C1 Circuit Design: It provides one example of the simulation of the electronic behavior of the EEGB3VS7C1 circuit model and its assessment against the authors’ pre-defined circuit requirements, which included bandwidth, CMRR, notch depth of the notch filter, and signal integrity of the overall signal in a muscle movement environment. This sub-section contains information about the Simulation in a 50 Hz Electrical Grid Environment, as well as the Simulation in a 60 Hz Electrical Grid Environment.
- Section 4.2, Comparative Analysis of the Simulated EEGB3VS7C1 with Case Studies "1", "2", "3": The novel circuit is compared to the case studies "1", "2", and "3". Specifically, quantities and characteristics CMRR, Bandwidth, Signal Quality and Notch Depth are the bases of comparison.
- Section 5 (Discussion) discusses the practical implications, potential limitations, and future perspectives of the proposed EEG circuit design. Its sub-sections are:
- Section 5.1, Practical Considerations: It considers the practical limitations of the EEG circuit implementation in real-world scenarios.
- Section 5.2, Future Perspectives and Trends: It lists the possible improvement angles for the proposed circuit and its potential applications in BCI Systems.
- Section 6 (Conclusions) summarizes the entire article.
- This study is accompanied by the Appendix A: it is the provision of an in-depth detail on many more EEG applications neither presented in detail in Section 2 nor used for comparisons in Section 4.
- Lastly, a list of the references and relevant bibliographies used in the present study to validate the findings.
2. Related Works: EEG Circuit Design Analog Front-End Architectures
In the subsequent chapter, various EEG Circuit Designs will be examined. These include Neonates-Specific EEG System [23], wireless EEG monitoring circuit with compact amplifiers and signal conditioning modules [24], Single-Chip EEG Signal Sampling Circuits [25], and BCI-Specific EEG [26], etc [further details in Appendix A]. Following this overview of EEG circuits, a special extended analysis will be conducted on three distinct EEG circuit designs (Case ‘’1’’, ‘’2’’ & ‘’3’’), elaborating on their topology, electronic characteristics, and how they could be compared with the EEG Generic Circuit Design. Additionally, specific requirements and specifications essential for efficient EEG signal acquisition will be presented. Finally, simulation and experimental results will be outlined in order to validate the efficacy of these circuits, highlighting their potential impact on advancing EEG technology.
2.1. Low-Cost Circuit Design of EEG Analog Front ends: Case ’’1’’
2.1.1. Description of Topology and Connectivity
The This subsection delineates the topology and connectivity of a cost-effective EEG circuit design, primarily focused on efficient EEG signal amplification and extraction. It incorporates high-definition graphics (block diagrams and circuit schematics) to depict the design’s architecture, offering a clear visual representation of its components and their interconnections. As depicted in Figure 2, the signal is initially boosted in a pre-amplification stage. Subsequently, low-frequency drifts are removed with a high pass filter. Furthermore, electrical interference at 50Hz is eliminated by a notch filter and high-frequency noise is filtered out with a low pass filter. Finally, a post amplification step is used to achieve the final results of enhanced signal integrity [27].
2.1.2. Comparative Evaluation with EEG Generic Circuit Design
The comparison of the low-cost EEG circuit design with the aforementioned generic model in this study underscores the novel aspects of combining multiple filters and amplifier stages. This design is characterized by ease of implementation because advanced design techniques are avoided (e.g., chopping), robust anti-interference capabilities are achieved by the high-pass filters, and high signal amplification from the amplifier is guaranteed by two instead of one amplification stage.
2.1.3. Requirements and Specifications in the EEG Circuit: Case ’’1’’
The given table outlines the exact requirements and specifications for this EEG circuit that include the following: Common Mode Rejection Ratio (CMRR) is greater than 120 dB; hence, high-performance proof in the minimization of noise and interference. Its bandwidth and frequency range are cut with a 3 dB passband from 0.3 to 40 Hz, tailor-made for EEG signals that include ensuring the major relevant frequencies of the brainwaves are effectively captured. This then becomes a demonstration of a low-cost effective circuit. The extracted signal level will be a big gain at low frequency and effectively extracted; this way, the quality of the extracted signal and the level of noise are highly diminished. Table 5 shows the requirement and technical description in case ’’1’’ low cost designed EEG.
2.1.4. Usage-Centric Justification for Design Differentiation: Case ’’1’’
The definition of a low-cost EEG circuit design provides real-time, high-quality, and cost-effective signal processing specifically designed to support the development of advanced Brain-Computer Interface systems (BCI). It is very good in precisely enhancing and optimizing raw EEG signals. In addition, it could serve as a portable detector for EEG signals in a research or medical environment. These features have proved to be high input resistance, high CMRR, high gain, large gains, substantial, low noise, low drift currents, low drift currents, low-frequency response, and substantial estimated SNR.
2.1.5. Simulation - Experimental Results: Case ’’1’’
These experimental results, therefore, indicate that the design of the low-cost EEG circuit can be used for signal extraction and amplification. This further will confirm that the design can maintain stability and performances of the circuits while enhancing the EEG signal, dropping the low frequency, and reducing the power line interference. According to the research of Case "1," it is noted that this assessment is very important and significant, since it will emerge if the design of the project meets the requirements and, on top of that, it will reflect on the development of EEG circuits.
2.2. Battery-Powered, Low-Noise Amplifier Circuit Design of EEG Analog Front ends: Case ’’2’
2.2.1. Description of Topology and Connectivity
This section presents the design of a battery-operated low-noise amplifier for an EEG application; it amplifies the signal of brainwave to some desired value. These designs are tailored toward signal amplification with only two active electrical parts and guaranteeing the high Common Mode Rejection Ratio (CMRR) at a level necessary to properly record the weak and small EEG amplitude signals. The system architecture for the active contains an inverting amplifier and other passive components, as shown in Figure 3. In the use of the device, a filter instrumentation amplifier was applied for low-passing the signals and frequency-dependent gain [28].
2.2.2. Comparative Evaluation with EEG Generic Circuit Design
This study demonstrated the uniqueness of the low-noise, battery-operated EEG amplifier system that has simple filtering in comparison with the Generic model. As a result, this system posts an exact instrumentation and inverting amplifier to come out with minimal design while consuming low power for sustainability and portability, since it’s battery-operated. It also includes superior CMRR and SNR for accurate amplification and reliable readings, high input impedance to prevent signal distortion, and high gain for clear signal interpretation. While it has a low-pass filter to remove high-frequency noise, it deliberately lacks a notch filter. This is attributed to the fact that it is not connected to supply from the main grid, but still, a notch filter could have been of use for tackling EMI from the main grid . Consequently, it can be used to identify neurological irregularities, demonstrating its effectiveness in advanced neurological research.
2.2.3. Requirements and Specifications in EEG Circuit: Case ’’2’’
The specific requirements and specifications of EEG Circuit set in [28] are supplemented with the technical characteristics of the AD8428 amplifier [29] for a thorough analysis. This circuit boasts a notable CMRR of 140 dB, effectively minimizing noise and interference by canceling out the common component of the two input signals. On the contrary, unlike the usual EEG frequency ranges, this circuit is specifically designed for a wide range of frequencies up to 3.5 MHz. Furthermore, the circuit is distinguished by its extremely low-cost design, achieved through the use of merely two components, thereby ensuring affordability. Moreover, the circuit excels in signal quality, with the Vpp noise from 0.1 Hz to 10 Hz being only 50 nV before amplification. Lastly, the circuit provides a variable gain up to 10580K V/V, a gain that is a strictly increasing function of frequency. The requirements and specifications for a battery-powered, low-noise EEG amplifier system are meticulously detailed in Table 6.
2.2.4. Usage-Centric Justification for Design Differentiation: Case ’’2’’
Further, the design of this biomedical device is in consideration of low power consumption; as such, this design befits the requirement for use in most cases of research that will see a long time in practical use. Or even better, the quality of acquired EEG signals is even higher when using a battery to reduce noise from the electric grid and increase the strength of the device because it will, therefore, last longer. Therefore, this circuit is a fine candidate for use in setting up the research protocols where portability, low noise, and low cost of the device are the major issues to be considered.
2.2.5. Simulation - Experimental Results: Case ’’2’’
Results in this study supported and established the role of the tested device, the low-noise battery-powered amplifier, in signal isolation and amplification. In this context, the results validate the ability for accurate records of EEG signals and hence the usefulness of the device in ascertaining a number of research protocols. The asset of low energy usage, the minimally flexible design, and the portability of the BB-ESAS extend its applicability in both home-use and research settings. Nonetheless, the simulation was conducted only with EEG signals of one wave band at a time in the total absence of noise (a nonrealistic signal of brain physiology). This simulation setting makes the usage of this EEG circuit questionable when it is operated in high-EMI environments or in protocols with strong compound muscle movements. Last but not least, this system, though it removes noise from low-amplitude EEG signals, does not handle low-frequency drift and does not involve necessary ESD protection.
2.3. Double Notch Filter Circuit Design of EEG Analog Front ends: Case ’’3’’
2.3.1. Description of Topology and Connectivity
This subsection offers an elaborate examination of the structure of a high-performance EEG signal acquisition System. This device integrates a driven-right-leg feedback circuit, differential amplifier circuits, pre-amplification components, and multiple filters. The design incorporates both a pre-amplifier and a two-stage post-amplifier to efficiently amplify the signal. The circuit uses two low-pass filters and two 50Hz notch filters in order to reduce the occurrence of noise interference present in the raw EEG signal. In the pre-amplification stage, an instrumentation amplifier is used to ensure low levels of noise, minimal changes over time, a high input impedance, and a high CMRR. Moreover, the circuit incorporates a post-amplification stage that employs a high-precision chopper-stabilized operational amplifier. Aside from the post-amplification stage, additional filtration is implemented, namely two notch filters and a low-pass filter, to eradicate high-frequency noise resulting from differential interference [30]. A clarifying overview of this architecture is given in Figure 4 below.
2.3.2. Comparative Evaluation with EEG Generic Circuit Design
The comparison between the dual-notch filter EEG circuit design and the generic one emphasizes the essential variables that contribute to Case ‘’3’’ circuit’s superior performance. This design has the novelty of 1 pre-amplification and 2 amplification stages. In addition, the way in which electrodes are attached to the scalp provides a low-impedance path to achieve minimal common mode interference noise contained in the signal coming from the body. As a result, this eliminates the requirement for protective electric shielding when collecting EEG signals. Moreover, this circuit configuration employs a rare (unorthodox) engineering decision by using two-notch filters, which greatly improves the suppression of electromagnetic interference originating from the power grid.
2.3.3. Requirements and Specifications in EEG Circuit: Case ’’3’’
The specific requirements and specifications for this EEG circuit are well articulated. Although the CMRR is estimated at 110 dB, the circuit’s bandwidth is adeptly configured from 0.5 to 33.86 Hz, which is within the mostly studied EEG signal frequency spectrum between 0.1 and 100 Hz. This illustrates the system’s capability of effectively handling the bandwidth requirements that are essential for EEG signal processing. In terms of signal quality, the pre-amplification error is a minimal 0.74%, rising slightly to 1.75% post-amplification, indicating a high level of signal fidelity. Subsequently, the circuit is a budget-friendly choice due to its low cost. The requirements and specifications for a double notch filter analog front end EEG circuit is meticulously detailed in Table 7.
2.3.4. Usage-Centric Justification for Design Differentiation: Case ’’3’’
First, it is applicable for the clinical diagnoses over fine monitoring of brain diseases with accuracy since it does not require electrical shielding technology, the EEG. The configuration is hence mandatory in the medical settings for proper diagnosis and treatment effectuality. This EEG technology has further important uses: in national defense and aerospace medicine. The industries served by the medical units require systems that are both sturdy and flexible. Most of these systems are easily prone to a host of electromagnetic interference (EMI) sources, including: The human body is biologically eliminated through the use of pre-amplification techniques, driven-right-leg circuits, and biomedical engineering. Such decisions in the design help the effective detection of the EEG signals in environments that lack proper shielding. This development, therefore, significantly eases the logistic problems the conventional methods of data collection in EEG have and, therefore, reduces these constraints for Case ’3’, making them much more feasible and accessible for their implementation in a wide variety of contexts. A brain-computer interface (BCI) device retrieves the signals of EEG. As such, where accuracy of such brain activities is very much necessary, to assure reliability in the systems, this circuit would facilitate essential signal recording.
2.3.5. Simulation - Experimental Results: Case ’’3’’
The experimental output of this specific EEG signal amplifier is demonstrative of its utility to isolate noise and enhance signals effectively. The high CMRR of the main amplifier, the ability to eliminate high-frequency noise and 50Hz frequency interference, and a gain of more than 60,000 V/V produce a low-noise, significantly amplified analog signal that is excellent for digital conversion. This EEG circuit design, by using the pre-amplifier and post-amplifier, along with high-performance filter sets (two low-pass filters and two 50Hz traps), has high performance in effective amplification and extraction, which can be achieved in non-shielded environments, potentially expanding the range of applicability of EEG systems.
3. Materials and Methods: A Novel Proposed EEG Analog Front End Circuit System
To our best knowledge in recent bibliography, there is a lack of EEG circuits that can combine concurrently, on the one hand, the monitoring of the theta, alpha, and beta brain wave frequency bands during usage time in which the user performs strong compound muscle movements (that is, the EEG usage protocol, or protocol named for simplicity in this study), and on the other hand, employing an EEG circuit that is mobile, low-cost, and with sufficient muscle artifact handling.
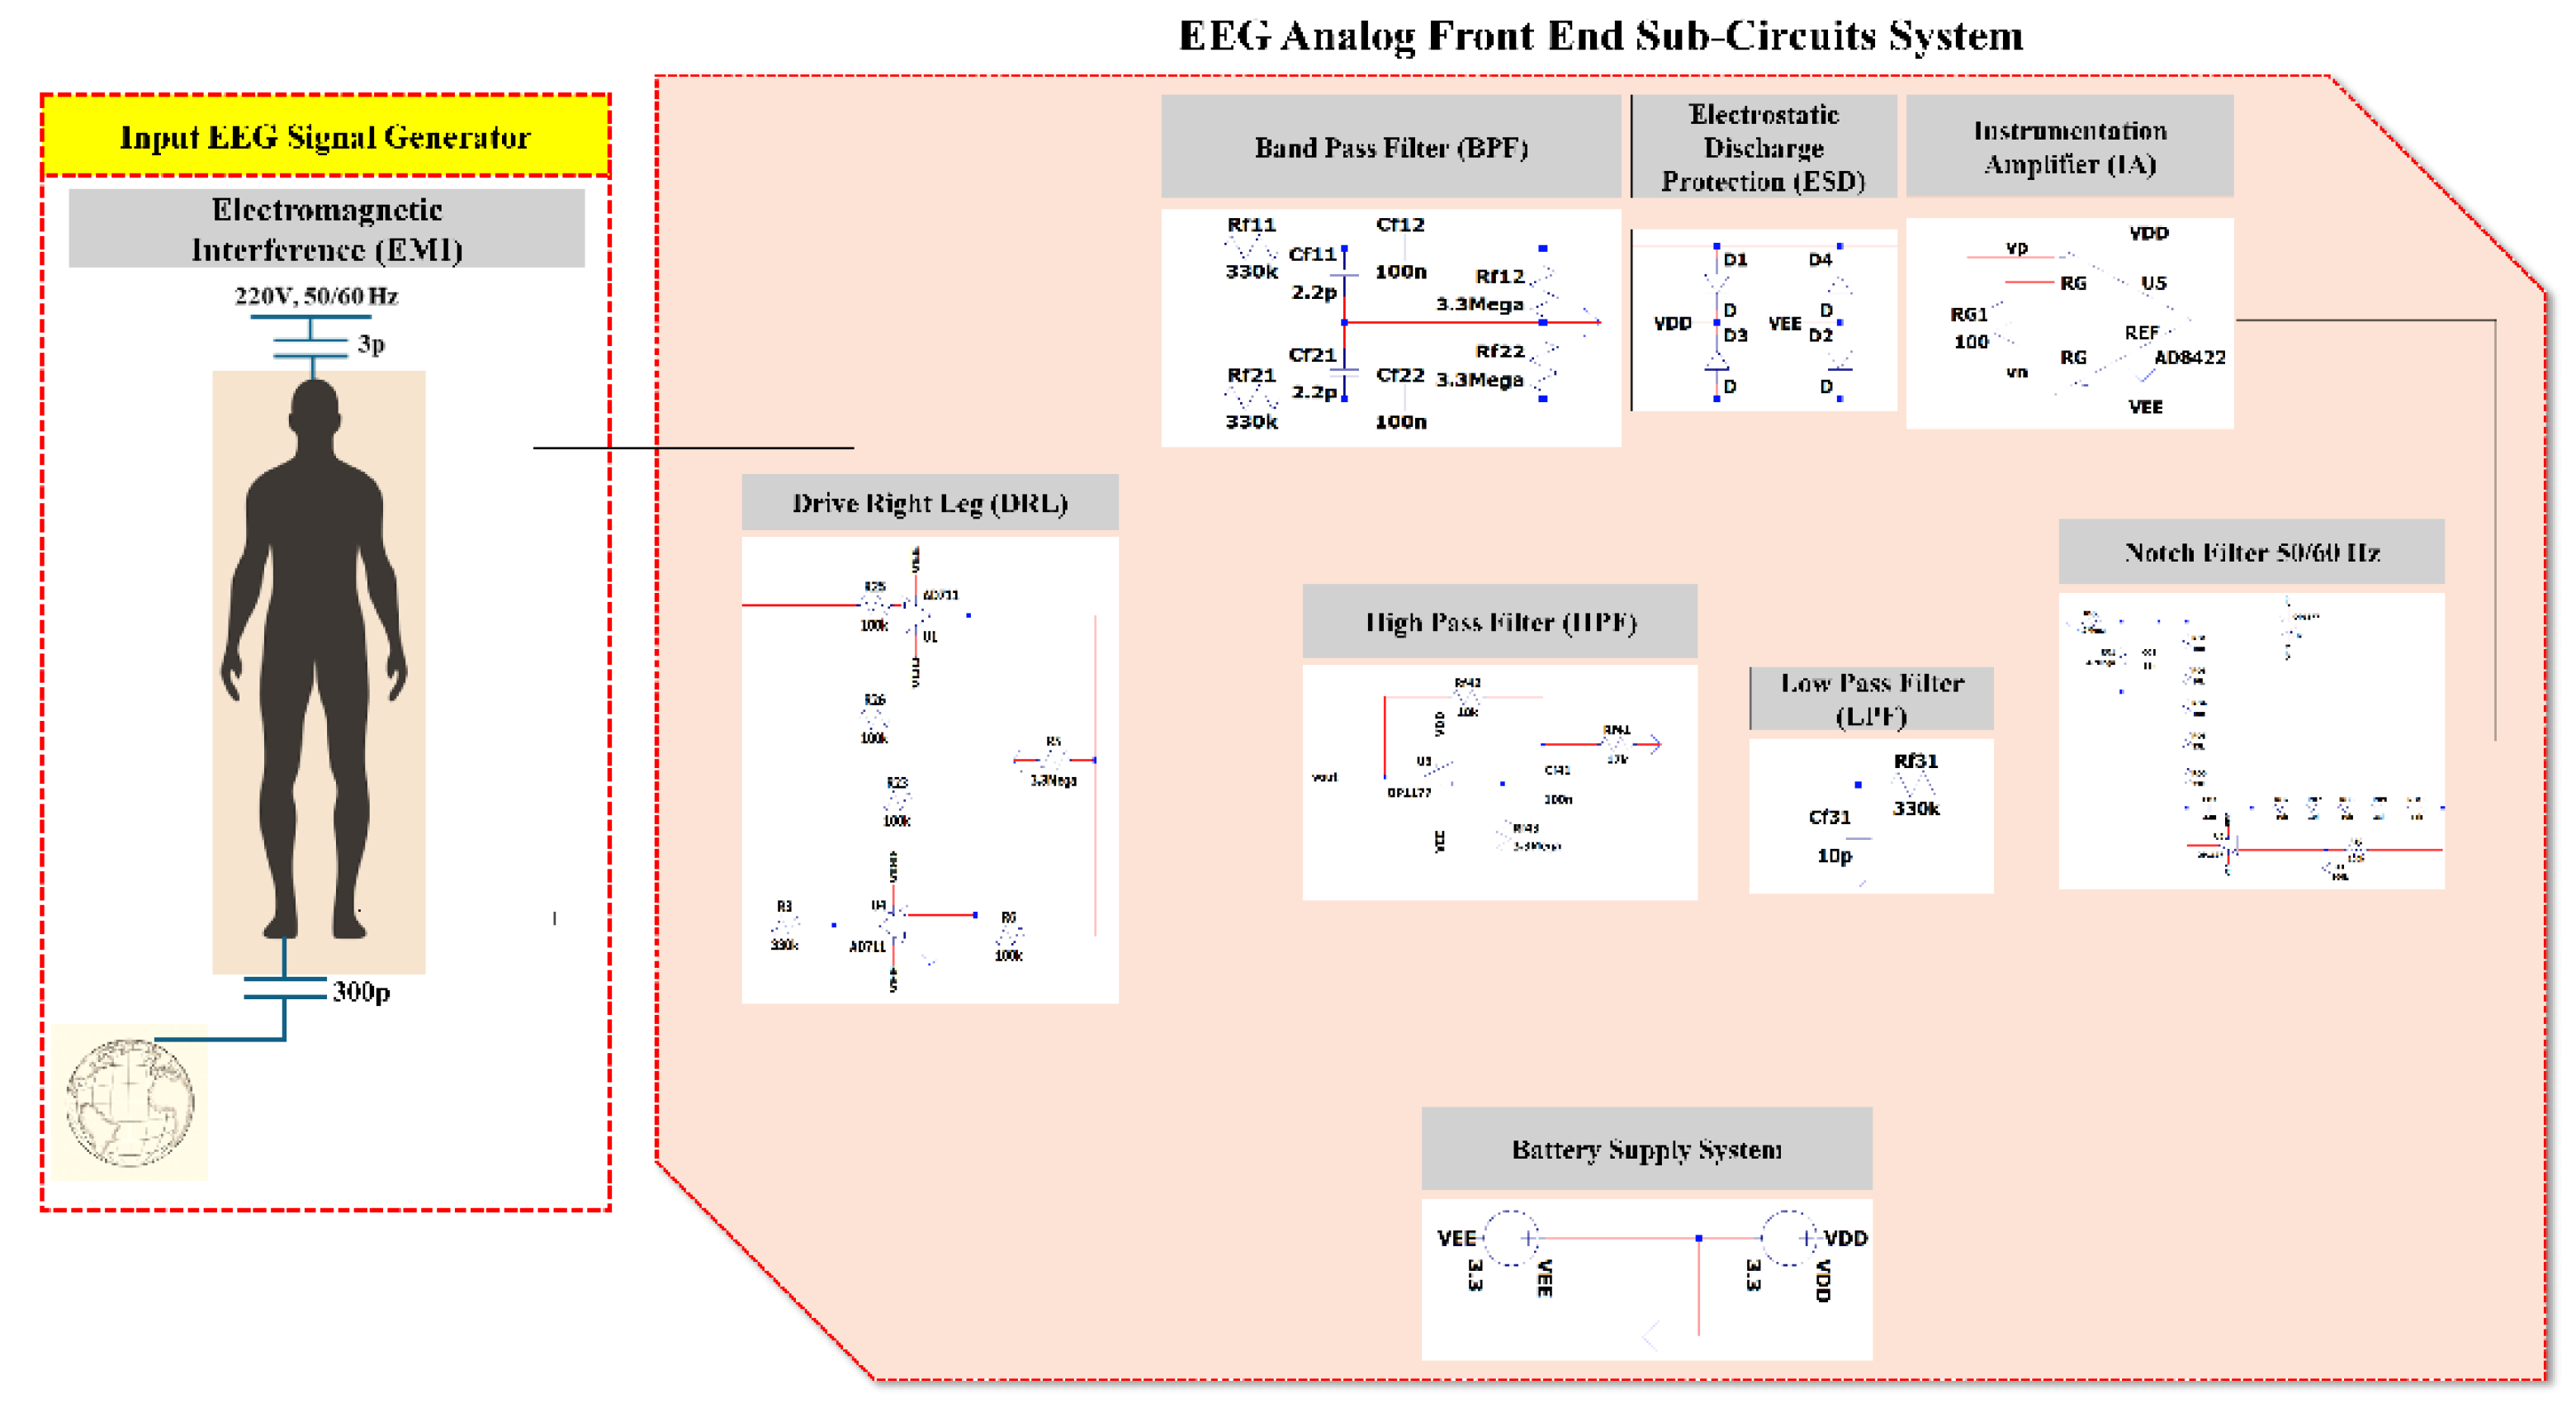
In this study, the design of a novel EEG Analog Front End Circuit System is proposed that can handle the problem; the aforementioned protocols containing compound muscle movements generate substantial muscular artifacts in the raw EEG data [14]. The electronic equipment requirements of this kind of protocol can be satisfied by a proposed System in this study, which is battery supplied in order to cover this mobility demand, uses simple and minimal sub-circuits to retain low cost (complex techniques such as chopping are avoided) and employs the necessary filters before and after the amplification stage to handle muscle artifacts sufficiently. The protocols for which the proposed system is designed could apply in neuro-feedback training, tele-controlling devices using Brain-Computer Interfaces (BCIs) in which the EEG user performs muscle compound movements [1,2]. Additionally, before implementing the simulation test, in this study, a realistic electronic model of the human brain and body is created that considers the factor of EMI from the external environment, in order to produce an accurate and mainly reproducible input signal to avoid the phenomenon of GIGO during the evaluation of System.
Figure 5.
Visualization of Proposed EEG.
The aforementioned proposed EEG circuit design’s requirements will be presented. Firstly, a Common-Mode Rejection Ratio (CMRR) greater than 90 dB is explained in [31]. Furthermore, the noise within the frequency range of 0.1 to 10 Hz is required to remain below approximately 500 nVpp root mean square noise [18]. The bandwidth of the input signal for this novel EEG is desired to denoise accurately, and it is from 0.5 Hz [31] to 3000 Hz in order to include a wide range of brain activity [32], with a specialized focus on the 4 Hz to 30 Hz frequency region. This special range of frequency is essential for monitoring the theta, alpha, and beta brain wave bands. Additionally, the circuit design demands a careful choice of a high input resistance, traversed by a maximum current of less than 10 µV, for human-user safety reasons. This complies with safety standards for medical or research environments. The selection of component values was made with consideration for future design iterations since the Printed Circuit Board (PCB) layouts need capacitors with a maximum value of 100 nF [26]. Prior to conventional designs, the proposed circuit specifically tackles notable issues; including inadequate filtering, limited bandwidth, and additional noise introduction prior to the amplification phase [27,28,30]. Our cost-effective approach aims to encourage research and commercial use while maintaining the high-quality signal integrity required in medical-grade applications. It does this by simplifying the system without the need for complicated techniques such as anti-aliasing filters. The requirements and specifications for the novel proposed circuit EEG design are detailed in Table 8.
In the next section, the proposed EEG design will be presented as a series of sub-circuits for clarity and simplicity.
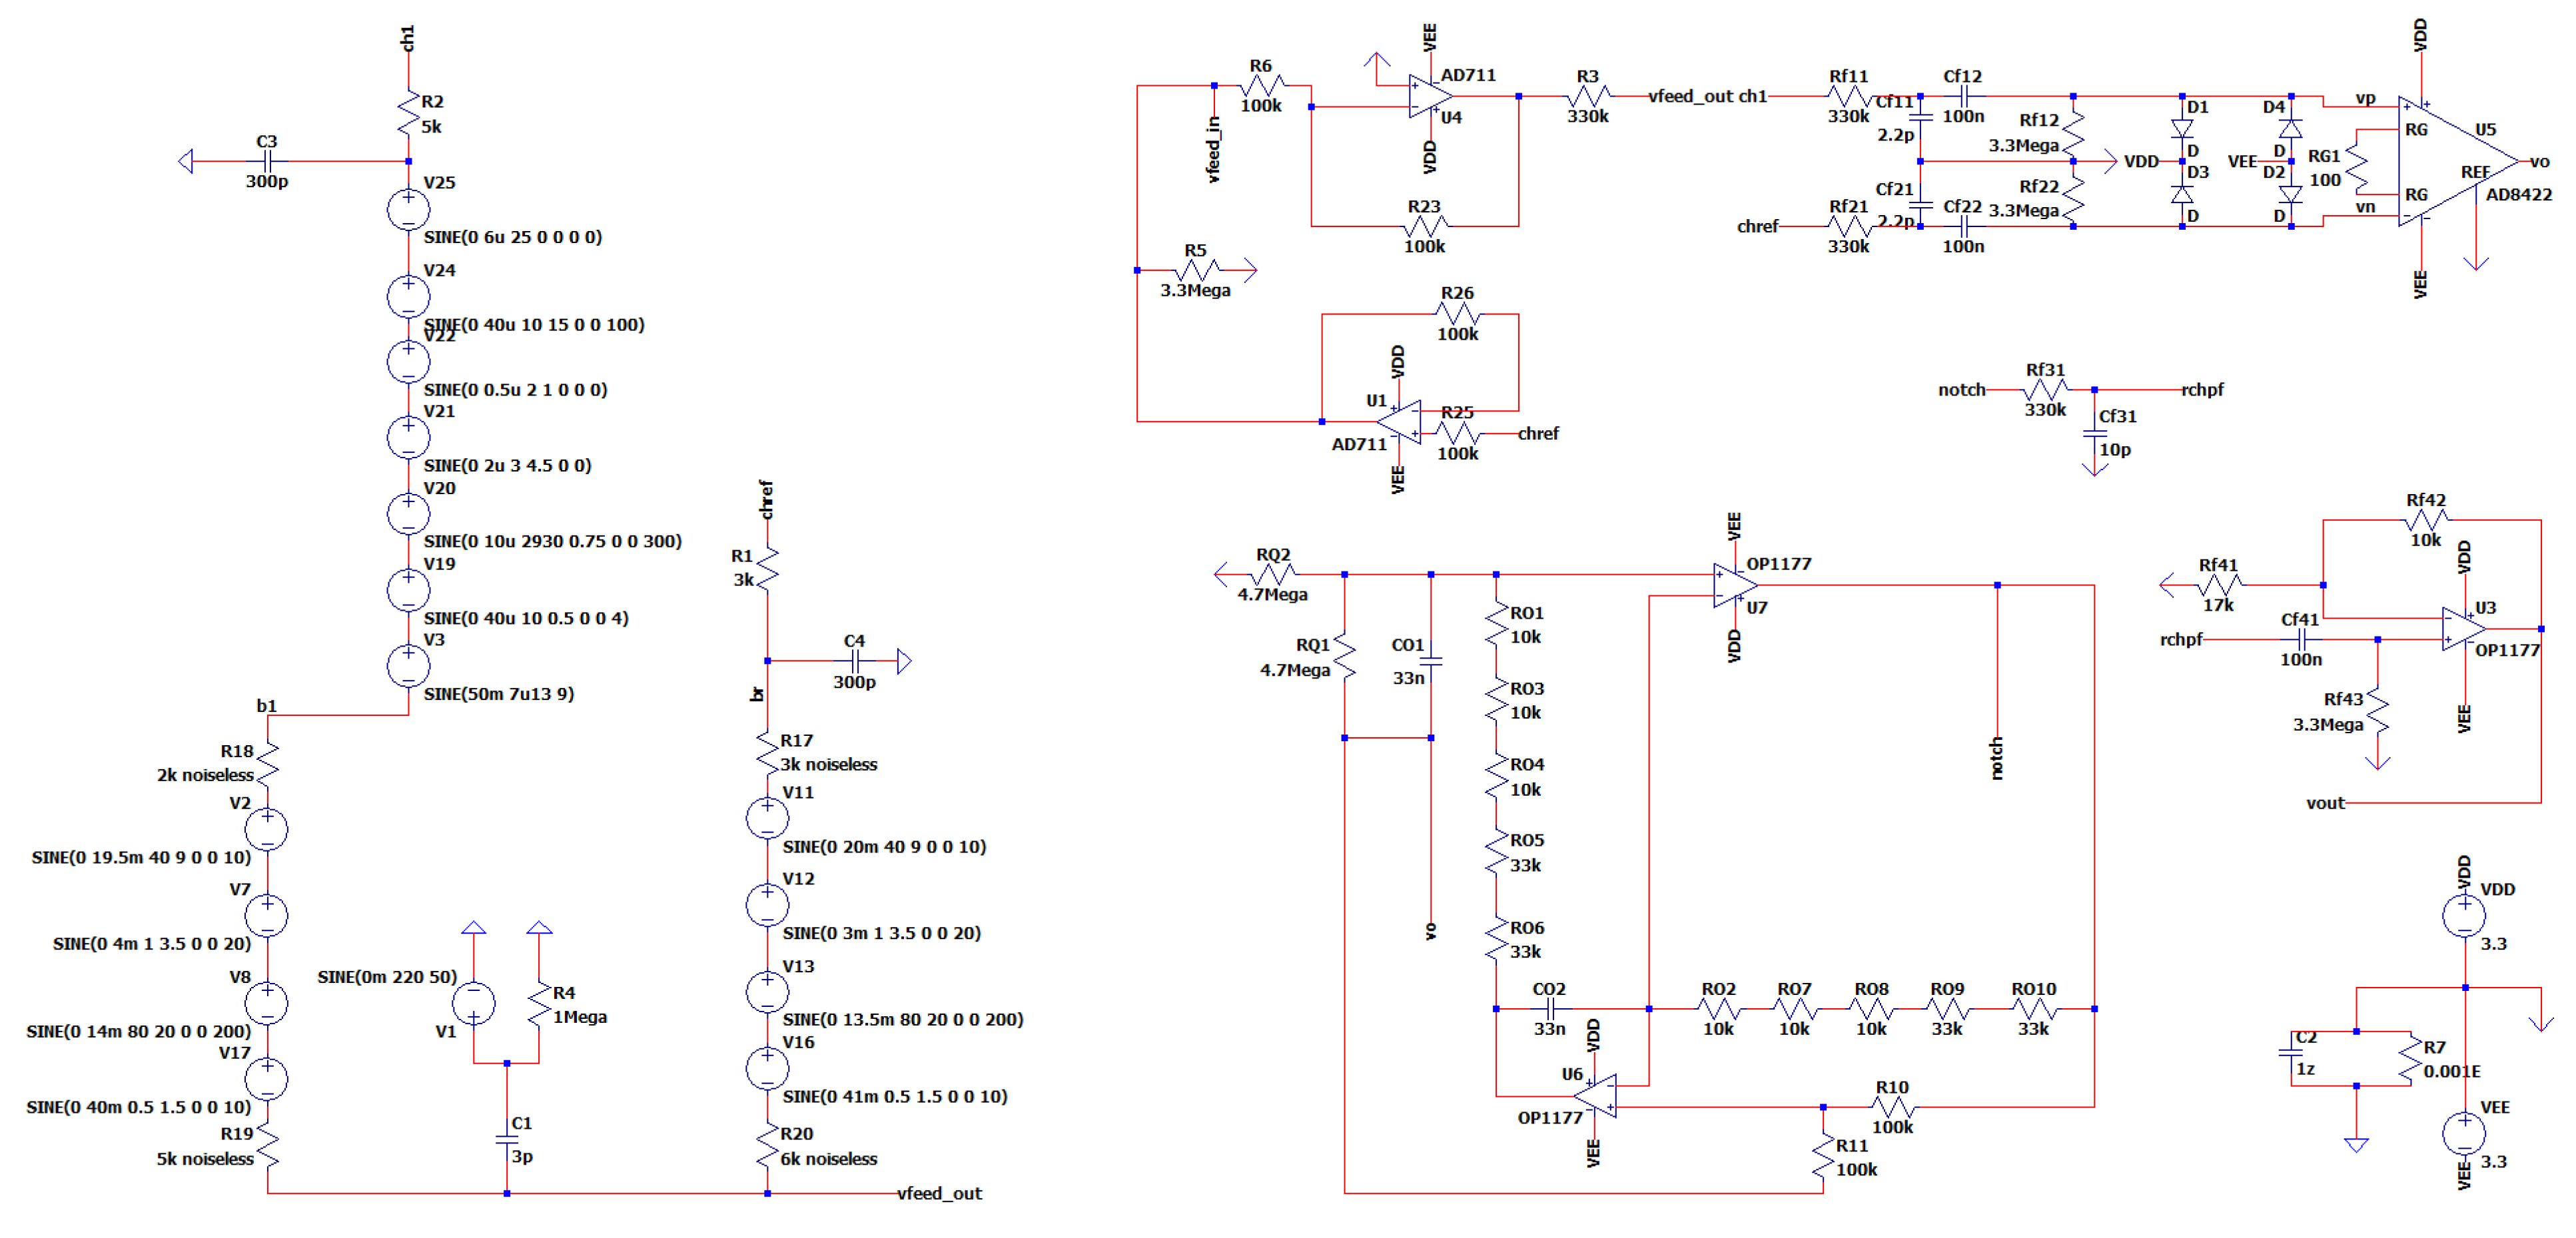
3.1. EEG Sub-Circuit Modeling the Electromagnetic Interference of Electric Grid with the Human Body
This sub-circuit is specifically engineered to replicate the voltage that an individual could encounter due to nearby electrical circuits linked to the power grid. In this model, resistive components symbolize the electrical loads in close proximity to the person, while capacitive components represent the medium of air through which electromagnetic waves propagate towards the human body. This design essentially depicts the network as a source of electromagnetic waves, with the human subject serving as the recipient. The primary purpose of this sub-circuit is to simulate, rather than reduce, electromagnetic interference, hence improving the accuracy of EEG signals by defining patterns of interference. Figure 6 depicts the EEG sub-circuit modeling the EMI in a 50 Hz electric grid.
3.2. EEG Sub-circuit Modeling the Human Body Apart from the Brain and Earth
This sub-circuit models the relationship between the human body and the Earth, including muscle movements and heart activity, which generate electrical interference in the EEG signal. Resistances are crucial for accurately replicating physiological electrical circuits, both between the head and body, and between the body, ground, and reference electrode. Physiological sounds, namely complicated muscle movement artifacts, are identified as having a frequency range of 1-200 Hz and an amplitude range of 0.1–100 mV, based on empirical data and study results [14].
More precisely, the sub-circuit converts muscle noises into voltage sources that occur at various locations throughout the EEG recording process. This is performed in order to compute the mean intensity of the alpha, beta, and theta signals. It mimics biological tissue by using a series of voltage sources and resistors to reduce electrical thermal noise, a phenomenon that is typical in electronic components but absent in actual tissues. According to the empirical results of the experiments related to electrode’s voltage measurement during protocols with compound muscle movement, performed in the ‘’Biomedical Optics & Applied Biophysics Laboratory’’ of the School of Electrical and Computer Engineering of the National Technical University of Athens, the voltage sources are configured within the range of 1-80 Hz and 1-50 mV. The aim of these experiments was to capture peak-to-peak (Vpp) raw EEG signals by employing wet electrodes during the performance of intricate muscle movements, such as jumping and walking.
Furthermore, to simulate the body’s grounding phenomenon, the modeling incorporates resistances across various anatomical regions and 300p capacitors. In particular, these resistances are modeled as noiseless because, in contrast with their electronic counterparts, those in between tissues do not yield thermal noise in the context of our model. The result is a closed-loop system between the Earth and the EMC model of the human body. In Figure 7, the EEG sub-circuit modeling the human body apart from the brain during protocols with strong compound muscle movement is depicted.
3.3. EEG sub-Circuit Modeling the Brain and the Electrode
The objective of this circuit element is to emulate the voltage signals generated by the human brain. The simulation incorporates voltage sources to represent brain signals across the alpha, beta, delta, and theta wave bands, with amplitudes precisely measured in μV. This method enables the precise depiction of the brain’s electrical activity, including a spontaneous event-related potential (ERP) with a high frequency of 2930 Hz. The investigation of such a high-frequency ERP is often conducted using intracranial electrodes, highlighting the advanced nature of our model in accurately representing a wide range of neuronal activity [32].
The deliberate incorporation of test sources containing an extensive range of signals is a strategic decision made to verify the accuracy of our EEG circuit in extracting the specific bands of interest for the intended protocol. When quantifying the alpha, theta, and beta frequencies during complex muscle movements, it is vital to account for this variable. It is possible to integrate wet electrodes with impedances between 1 and 50 kΩ into the circuit, modeled as a simple resistance. However, wet electrodes exhibiting impedances greater than 50 kΩ are customarily excluded from the system as a result of the compromised signal quality. Furthermore, this EEG circuit can be utilized with dry electrodes, which have impedances between 700 kΩ and 1400 MΩ. It must be noted that the impedance values of the electrodes, either wet or dry, are expected not to be equal. In Figure 8 is depicted the EEG sub-circuit modeling the brain and the electrode.
3.4. EEG Sub-Circuit Modeling the Battery Supply of the System
The EEG sub-circuit is designed to model the power supply mechanism of the EEG circuit. This sub-circuit utilizes two 3.3V rechargeable batteries, similar to other battery systems found in contemporary mobile devices. encompasses this duality. Its battery supply system employs a special grounding symbol for representing the circuit’s ground, depicted as an inverted lambda “Λ” Greek alphabetical symbol. This symbol is connected to a RC network, with R = 0.01EΩ and С= 1zF in parallel. This network creates EEG circuit’s ground by being connected to Earth grounding on one end and the intersection between the two batteries and the circuit’s ground on the other end. The design incorporates a closed triangle to represent the Earth’s ground and an open triangle to represent the circuit’s ground. This configuration is a mandatory design requirement, because of the selected simulation software program’s limitations in supporting two Earth symbols (a symbol with precisely 0V AC and 0V DC voltage source references). The circuit’s ground exhibits a DC voltage of 0V and an AC voltage of 200pV; thus, it is safely considered for the rest of this study to be a 0V reference while being independent from the Earth’s ground. In Figure 9, the EEG sub-circuit is depicted, modeling the battery supply of the system.
3.5. EEG Sub-Circuit Modeling the Driven Right Leg (DRL) Circuit
The utility of the DRL circuit is the creation of a feedback loop between the reference electrode and the body. This arrangement incorporates meticulously chosen resistors to protect both the electronics and the user. The circuit utilizes signal inversion and redirects it towards the body in order to ensure that the current remains below the safety threshold of 10μA, as required by IEC-601-1 safety rules [20,21]. This sub-circuit is powered by a battery with a maximum voltage of 3.3V. A 300kΩ resistor is used to regulate the maximum current to 10 μA, although typical operational currents fall within the range of several hundred nA. This configuration showcases our commitment to safety by ensuring that the circuit operates smoothly within predefined limits under normal conditions.
Additionally, a 3.3MΩ resistor serves as a crucial pathway for the movement of leakage current towards the ground in the event of a malfunction. The primary function of this high-resistance component is to operate with a very low level of current, often within the nA range. This guarantees that the EEG signal remains undistorted when it is reintroduced into the body via the dual buffer amplifiers. A 100kΩ resistor is used to optimize the circuit’s efficiency and minimize power consumption. The choice was made to retain the feedback current usage at around 0.5 μA. This strategy not only maintains the longevity of the battery but also ensures minimal energy consumption from the system. The intentional design strategy is opting for a larger resistor rather than a smaller one to attain an optimal equilibrium between power efficiency and operational effectiveness. In Figure 10 is depicted the EEG sub-circuit modeling the driven right leg circuit.
3.6. EEG Sub-Circuit Modeling the First Band-Pass Filter
This sub-circuit is precisely designed to achieve two specific goals: (i) safeguarding the user of the novel EEG circuit, and (ii) simultaneously constructing a traditional RC band-pass filter. The positioning of the high-pass filter at the beginning of the band-pass filter sub-circuit accounts for the fluctuating resistance characteristic of the electrode contact. The high-pass filter has an input resistance of 330 KΩ. The indicated quantity is the minimum requirement to adhere to safety regulations, which restrict the amount of input to the body to a maximum of 10μA, as specified by IEC-601-1 safety rules.
A 2.2 pF capacitor was used to ensure that, despite the dry electrode’s greatest input resistance of 1.4 MΩ in combination with the 330 KΩ resistor, the filter effectively includes the highest frequency of interest, 20 kHz, inside the pass band’s 0 dB gain range. The exact configuration of electrode resistances yields cutoff frequencies ranging from 41.817 kHz (with an input resistance of 1.73 MΩ) to 218.564 kHz (with an input resistance of 331 KΩ).
Furthermore, a first high-pass filter is used at around 0.4822 Hz to eliminate any variations in DC offset and somewhat reduce muscle interference, while having negligible impact on the signal prior to amplification. While a cutoff frequency of 0.05 Hz or lower would be ideal for preventing signal distortion, implementing such a low frequency would necessitate the use of excessively large capacitors. This is especially true in scenarios where there is substantial muscle noise, such as during physical exertion or when experiencing the revival of embodied psychological trauma. Therefore, making slight adjustments to the EEG signals in the delta wave region is an intentional choice that aims to find a compromise between the accuracy of signal capture and the practical limitations imposed by significant muscle interference.
The filter exhibits a Q factor of 0.0014854, a damping ratio of ζ = 336.598, and a center frequency of 324.6667 Hz under the condition that the input resistance is 331 KΩ. The filter exhibits a Q factor of 0.0033969, a damping ratio of ζ = 147.191, and a center frequency of 141.972 Hz under the condition that the input resistance is 1731 KΩ. The considerations described above result in minimal phase distortion within the acceptable frequency range for our amplification needs. The system takes around 30 msec to reach 99.99% of its final value. The equation describing the circuit above is:
In Figure 11 is depicted the EEG sub-circuit modeling the first band-pass filter
3.7. EEG Sub-Circuit Modeling the ESD Protection and the Instrumentation Amplifier
This After the output of the band-pass filter, the design integrates electrostatic discharge (ESD) protection utilizing the circuit proposed in [33]. This sub-circuit guarantees the safety of the EEG circuit and of its user, by creating a path to the positive and negative supplies for transient electrical currents that may arise from contact between objects with disparate electrical charges, known as the ESD protection circuit.
Consequently, the signal is passed to the instrumentation amplifier, which has as input both the channel one electrode and the reference electrode. The amplifier has a gain of 199 V/V and reaches 99.9999% of its maximum value in approximately 15 µsec of settling time. The AD8422 is chosen as an instrumentation amplifier because of its CMR performance. It has a specific CMRR of 110 dB, much over the minimum requirement of 90 dB [19]. The resistance of the gain resistor RG is set to 100 Ω, ensuring a theoretical gain of G = 199 [34].
The equation describing the instrumentation amplifier gain above is:
In Figure 12 is depicted the EEG sub-circuit modeling the ESD protection and the instrumentation amplifier.
3.8. EEG Sub-Circuit Modeling the Fliedge Notch Filter 50Hz or 60Hz
Active notch filters are used to attenuate significant aberrations occurring at 50 and 60 Hz in EEG data. They have shown challenges in terms of adjusting the center frequency, maintaining stability, and achieving repeatability. The maximum goal that the designer could achieve, is a noise level reduction of approximately 40 to 50 dB when simulating the circuits by theoretical calculations. Consequently, this design prioritizes center frequency and Q above notch depth. The Q value of a certain notch filter corresponds to the frequency at which the filter’s response is attenuated by -3 dB, not at the point 3 dB above the notch depth.
This is a dual operational amplifier filter that utilizes just four high-precision components: (i) two resistors (Rο) and (ii) two capacitors (CO). These components are responsible for setting the damping factor and center frequency of the filter. RO resistance is shown as an assemblage of resistances that possess a high level of accuracy. Circuits that are used in a 50Hz grid make use of resistors RO6 and RO10 with a resistance of 33 kΩ as shown in Figure 12. It is necessary to place an extra 33kΩ resistance in parallel with RO6 and one with RO10 respectively, in order to utilize the EEG in a 60Hz grid environment.
The Q factor of the filter may be modified separately from the center frequency by using two resistors of equal value that are not sensitive to changes. The center frequency of the filter may be modified within a defined range without significantly reducing the depth of the notch. A greater Q factor results in a smaller stopband, but this comes at the cost of a reduced depth of notch at the desired center frequency. The equations governing the center frequency fo and Quality factor Q are [35]:
In the case of the 50Hz grid the (3) and (4) yield a center frequency and Quality factor of:
respectively.
In contrast, we employ the 33 kΩ resistance parallel to RO6 and RO10 for the 60Hz grid. (3) and (4) yield a center frequency and Quality factor as follows:
respectively. The proposed notch should theoretically achieve a notch depth of 50 dB at the center frequency calculated above.
In Figure 13 is depicted the EEG sub-circuit modeling the Fliedge notch filter 50hz or 60h.
3.9. EEG Sub-Circuit Modeling the Second Low Pass Filter
This sub-circuit is a simple RC low pass filer. The cut-off frequency is calculated using the equation:
Utilizing (5) in our sub-circuit design, the 3 dB cut-off frequency can be calculated as follows:
This cut-off frequency is in accordance with our design requirements because the input raw EEG signals of interest have maximum frequency of 20 kHz. Indeed, the 20 kHz frequency resides well within 0 dB gain part of the passband of our high-pass filter with upper frequency of 48.2 kHz. The settling time to a steady state value from 0% to 99.99% is achieved after 30.39 ms with this design. In Figure 14 is depicted the EEG sub-circuit modeling the second low pass filter.
3.10. EEG Sub-Circuit Modeling the Second High Pass Filter before the Analog to Digital Conversion
In this section, a Butterworth filter is implemented in order to exploit its characteristic that it does not allow ripples in the passband while also helping us create a further gain of approximately 1.5 V/V in the wave bands of interest [35]. The two important parameters that characterize this filter are AF gain and fl cutoff -3 dB frequency:
Utilizing (6) to our sub-circuit design, the AF gain can be calculated as:
Utilizing (7) to our sub-circuit design, the 3 dB cut-off frequency fl can be calculated as:
If ‘’f ‘’is the frequency of the input signal the magnitude of the voltage gain is:
In Figure 15 is depicted the EEG Sub-Circuit Modeling the Second High Pass Filter before the Analog to Digital Conversion.
3.11. The Overall Novel EEG-B3VS7C1 Circuit Design
The overall EEG Circuit Design has a bandwidth of approximately 0.5 Hz to 10 kHz, an overall gain of 300 V/V in the passband, and a theoretical CMRR of 110 dB. In Figure 16, the overall EEG Circuit Design named EEG-B3VS7C1 (named inspired by the characteristic batteries of 3.3V, 7 sub-circuits, and 1 channel). The noise of our design before the first amplification will be estimated as the total Vpp noise in the equivalent noise bandwidth range of 0.1Hz to 10Hz. This is given by the equation:
where:
- kB is the Boltzmann’s constant,
- T is absolute temperature in Kelvin in our case at room temperature (usually 25oC) and
- R is the real part of the band-pass filter’s impedance.
4. Simulation and Results: Comprehensive Analysis
The initial goal of the simulation is to quantify the difference between theoretical value predictions for the different subcircuits and real-world simulated implementation values of the proposed novel EEGB3VS7C1 circuit design. In particular, this simulation of the circuit’s electronic behavior can assess the design’s efficiency because it provides accurate voltage and current waveform representations, verifying that the authors’ pre-defined requirements for the circuit are met in a satisfactory percentage. Moreover, another goal is to visualize the human body and environment model signal generator’s output, assessing its realisticnesss and its alignment with laboratory experiment results. Furthermore, it is given emphasis on examining the EEG output in the following ways:
- Time domain to make a qualitative commenting in regard to CMRR, power consumption, gain, and noise level before the first amplification.
- Fourier frequency spectrum to validate if the information in the alpha, beta and theta wave bands is preserved.
- Fourier frequency spectrum and time domain to validate that the compound muscle movement artifacts are sufficiently suppressed.
The simulation is carried out both in a 50Hz and 60Hz power grid environment because these frequencies cover the most common EEG signal measurement cases that are not performed in a shielded environment of electromagnetic interference from the power grid [36]. Subsequently, a comprehensive comparison is conducted between the proposed novel EEGB3VS7C1 circuit design’s simulated results and those of the cases |”1”, |”2”, |”3” that were presented previously in this work.
This section is divided into two segments: (A) the simulation of the circuit in the time and Fourier analysis frequency domain, and (B) the comparison of the proposed Circuit (EEGB3VS7C1) with the cases |”1”, |”2”, |”3” as follows.
4.1. Simulation of Novel EEGB3VS7C1 Circuit Design
As it is known by the circuit design section, our circuit includes the reference electrode for calculating the voltage reference of the collected raw EEG signal as well as the Channel 1 electrode for collecting the raw EEG signal. According to their functionality, the first is placed behind the ear, and the other is placed on the Fp1 position (10-20 positioning system) [15]. The main purpose of this test is to simulate the characteristics of the circuit that were deemed important when deciding the requirements of the circuit presented in this study, namely CMRR, bandwidth in the 0.5Hz to 3kHz region, and in particular in the 4Hz to 30Hz alpha, beta, and theta wavebands range. Another crucial element that must be examined in this simulation is the notch depth of the notch filter when it is functioning at approximately either 50Hz or 60Hz frequencies. Finally, a visual representation of both time and frequency responses will be presented further down to showcase the effectiveness of the circuit. In particular, it examines the circuit’s ability to denoise the artifacts of the raw EEG signal acquisition process in the presence of strong compound muscle movements while preserving the signal integrity of the alpha, beta, and theta wavebands.
4.1.1. Simulation in a 50 Hz Electrical Grid Environment
In this part, the simulation in a 50 Hz environment is performed. The CMRR of the circuit was assessed by short-circuiting the two input channels with a voltage source of 0V DC offset and 1V AC amplitude across all frequencies. While performing AC analysis, the CMRR yielded a frequency response function dependent on the frequency variable. In the band of interest of alpha, beta, and theta waves, CMRR was approximately 97 dB. In frequencies greater than 166 Hz, CMRR dropped below 90 dB and at 3 kHz reached 66 dB. Meanwhile, in the area below 1 Hz, CMRR reached levels up to 163 dB at 10 mHz. The simulated notch depth was measured at 48.5 dB, which is a really satisfactory result based on [34], which defines realistic expectations for maximum realizable notch depth between 40 dB and 50 dB. Apart from the above test noise analysis was performed on the circuit. The result of 1.4887µVpp noise in 0.1 Hz to 10Hz before amplification was identified in a 50Hz environment. The total power consumption was measure at approximately 20.5 mWatt. As it will be shown below, the simulation at 50 Hz produces results in the time domain by performing transient analysis (see Figure 17), and consequently, with the use of FFT algorithm, the Fourier transform results in the Fourier plane are also generated (see Figure 18 and Figure 19).
- Simulation at a 50 Hz Electrical Grid Environment in the Time Domain
Initially, the simulation (at 50 Hz) focused on demonstrating that our design was able to generate realistic electrode signals, similar to the ones measured in the laboratory experiments during the performance of compound muscle movements. As it is depicted in Figure 17, the gold waveform is the voltage measured at the reference electrode (Vchref). The purple waveform is the voltage measured at the Channel 1 electrode (Vch1). The red waveform depicts the EEG ground truth signal contained in Channel 1 (Veeg), magnified 300 times for clarity. The blue waveform is the output of the EEGB3VS7C1 circuit design (Vout).
By observing Figure 17 it can be assessed that the output signal clearly resembles the ground truth signal, apart from a 14.5 mV DC offset and some noise artifacts. Indeed, the strong muscle compound movement artifacts are severely suppressed and don’t influence the measurement capability of the proposed circuit.
- Simulation at 50 Hz Electrical Grid Environment at the Fourier’s Spectrum
Subsequently, FFT was performed in the time domain produced by the transient analysis of the simulation (at 50 Hz) to generate the waveforms in the Fourier plane (in a range from 4 Hz to 30 Hz). The frequency response of waveforms in the Fourier plane gives valuable insights into the simulated functionality and performance of the circuit. As it is depicted in Figure 18, the green waveform is the voltage measured at the reference electrode (Vchref). The blue waveform is the voltage measured at the Channel 1 electrode (Vch1). The pink waveform depicts the EEG ground truth signal contained in Channel 1 (Veeg). The cyan waveform is the output of the EEGB3VS7C1 circuit design (Vout). Lastly, the red waveform is the voltage at the output of the instrumentation amplifier (Vvo).
First and foremost, by observing Figure 18, it can be clearly assessed that the ground truth EEG signal integrity is preserved, and simultaneously, the noise artifacts do not affect the appearance of the brain signal peaks. Additionally, it is apparent from the graph that the circuit output gives the magnitude and, after some processing, the energy content for the alpha, beta, and theta wave bands in thirty-second intervals, while the user of the EEG circuit participates in protocols with strong compound muscle movements.
Afterwards, in the same product of FFT analysis from the previous sub-section, the Fourier spectrum was examined in a bigger range from 10 mHz to 3 kHz, studying the same waveforms in the entire circuit’s output bandwidth as was specified in the requirements of the proposed circuit design (0.5 kHz to 3 kHz). The aim of this approach was to confirm that in any range from 0.5 kHz to 3 kHz, including the frequency range of special interest from 4 Hz to 30 Hz, the ground truth EEG signal integrity is maintained, and at the same time, the noise artifacts do not influence the distinctiveness of the brain signal peaks.
As it is depicted in Figure 19, the green waveform is the voltage measured at the reference electrode (Vchref). The blue waveform is the voltage measured at the Channel 1 electrode (Vch1). The pink waveform depicts the EEG ground truth signal contained in Channel 1 (Veeg), magnified 300 times. The cyan waveform is the output of the EEGB3VS7C1 circuit design (Vout). Lastly, the red waveform is the voltage at the output of the instrumentation amplifier (Vvo), magnified 1.5 times.
By observing Figure 19, it can be clearly assessed that the real gain of the high pass filter subcircuit that follows the instrumentation amplifier is approximately 1.5 V/V, very close to the theoretical prediction of 1.588 V/V, verifying the accuracy of our design. Additionally, the real gain of the overall circuit is approximately 300 V/V, very close to the theoretical prediction of 316.012 V/V (199*1.588 = 316.012), which aligns with the predefined design requirements of the proposed circuit design.
4.1.2. Simulation in an Environment with an Electrical Grid with Frequency 60 Hz
The same simulation, as previously analytically described, was performed in a 60 Hz power grid environment. It is obvious that this simulation produced the corresponding time and frequency domain simulation graphs, which are not presented in this subsection, for reasons of space conservation. The overall results were deemed satisfactory. Specifically, the CMRR of the circuit was assessed by short-circuiting the two input channels with a voltage source of 0V DC offset and 1V AC amplitude across all frequencies. While performing AC analysis, the CMRR yielded a frequency response function dependent on the frequency variable. In the band of interest of alpha, beta, and theta waves, CMRR was approximately 98 dB, a slightly better performance than the 50 Hz case. In frequencies greater than 110 Hz, CMRR dropped below 90 dB and, at 3 kHz, reached 62 dB. Meanwhile, in the area below 1 Hz, CMRR reached levels up to 163.5 dB at 10 mHz, similar to the 50 Hz case. The simulated notch depth was measured at 39.5 dB, which is acceptable, based on [34], which defines realistic expectations for maximum realizable notch depth between 40 dB and 50 dB but is not as good as in the 50 Hz scenario.
Apart from the above test noise analysis was performed on the circuit. The result of 1.4887µVpp noise in 0.1 Hz to 10Hz before amplification was identified in a 50Hz environment. The total power consumption was measure at approximately 20.5 mWatt.
4.2. Comparative Analysis of the Simulated EEG-B3VS7C2 with the Cases 1, 2, 3
As depicted in Table 9, with regards to CMRR, the proposed circuit is in alignment with the specification that demands values greater than 90 in the area of interest of the alpha, beta, and theta wavebands. The maximum CMRR in the passband of our output signal is 97 dB and 98 dB at 50 Hz and 60 Hz, respectively.
It must be stated that this proposed circuit has been designed in order to focus on meeting the requirements of protocols with compound muscle movement. The satisfaction of these requirements necessitates filtering of the noise artifacts before the first amplification in order to protect the amplifier from reaching a state of saturation by amplifying undesired muscle artifacts that are present in the raw EEG signal. The introduction of filters at the initial stage limits the possibility of increasing the CMRR in any EEG analog front end. The only technical obligation of the proposed circuit with respect to CMRR is to be only higher than 90 dB in the frequencies of interest, so any values higher than this lower limit are considered acceptable. Thus, even though our CMRR is lower than the ones of the other Cases ‘’1’’, ‘’2’’, and ‘’3’’ (110 dB up to 140 dB), this was a deliberate trade-off. The high CMRR of Cases 1, 2, and 3 is practically useless for the case of muscle movement artifact removal because the aforementioned circuit has neither been tested for this use case nor designed with the accommodation needs of such protocols in mind.
As far as Circuit Bandwidth is concerned, the proposed circuit design covers all the frequencies from 0.1 Hz to 20 kHz, and the bibliographies state that an EEG signal may appear for performing raw EEG data acquisition and artifact removal. More specifically, the proposed circuit is tested to be more than sufficient to process the EEG signal in the wavebands of particular interest in the zone of 4 Hz to 30 Hz. On the one hand, Cases “1” and “3” are designed to collect signals with frequencies from the alpha, beta, delta, and theta wavebands, and they do so efficiently. From the previous two, Case “1” has a greater margin for errors, in terms of the higher cut-off frequency of the low pass filters. On the other hand, Case “2” has such a large bandwidth that it is of no use for the accurate collection of the EEG signal, thus resulting in the collection of unnecessary high frequency noise that would possibly be present in its output signal.
Finally, considering signal quality, all circuits have excellent gains for the respective use cases, with Case “2” having the strong advantage that it possesses the ability for programmable gain. In this work, this was a characteristic that was not a priority to be used in the present study, but programmable gain will be one of the design priorities in future iterations of this circuit that are worked upon by the authors with the goal of being published. As far as noise is concerned and its effect on signal quality, Case “2” has the best performance, with the proposed circuit design coming close as a second. In both cases, the noise level is acceptable. Case “3” chose a non-standard format for presenting their result, and accordingly, it cannot be directly compared with the other cases, but it can be stated that errors pre amplification at a level of around 1% are acceptable for certain types of applications. The use of this circuit should be contained only in those cases that are stated in the respective paper if the user wants guarantees of accuracy in the signal acquisition process. Case “1” did not provide relevant information for the noise level. Lastly, Case “1” and the proposed novel design of this study achieve the same notch depth, while Case “3” does not state notch depth data, and Case “2” does not perform notch filtering at all. The simulation results and comparison between cases 1, 2, and 3 with the proposed circuit design are presented in Table 9.
At this point, a comparative analysis of cases 1, 2, and 3 will be conducted in contrast with the proposed Circuit Design Innovations. Specifically, the Proposed Circuit EEG Design has a series of innovations that overcome the various limitations observed. Starting this analysis with notch filtering, the proposed design has the ability to perform notching either at 50 Hz or 60 Hz, depending on the environment that the circuit is intended to be used in. Cases “1” and “3” accommodate only 50Hz EMI noise removal, and Case ‘’2’’ does not perform any kind of notch filtering at all. Additionally, the protection of sensitive EEG electronics from static electricity is not incorporated in Cases ‘’1’’, ’’2’’, and ‘3’’, in contrast with the ESD protection subcircuit of the proposed design. Moreover, Cases ‘’1’’, ’’2’’, and ‘3’’ have not been tested in conditions with the presence of strong muscle artifacts, while the proposed design is meticulously tested for handling artifacts of such nature. It is worth mentioning, the fact that Cases ‘’1’’, ‘’2’’ and ‘3’’ have not been tested for compliance with the current safety standards, making their real-world usage potentially unsafe for human use. On the contrary, the proposed circuit is in accordance with the medical device standards for EEG user patient’s safety with respect to leakage current levels. Last but not least, in Cases‘’1’’ and ’’3’’, the input data with which their respective circuits were simulated are unknown, and in Case "2,” even though the input data are clearly provided, they are rather ideal non-realistic EEG waveforms, and with certainty, those data do not contain compound muscle movement artifacts. In this study, a highly detailed circuit model of the Human Body and of the EMI that affects the body originates from the surrounding environment. Thus, the input data are transparently generated from the aforementioned modeling circuit, making the simulation results reproducible and reusable. Besides creating the previous asset, the proposed circuit model was adjusted to produce input data that contained muscle movement artifacts that were used to confirm the proposed EEG circuit design is capable of being used to collect raw EEG signals accurately in protocols that contain strong muscle movement. The examination of Cases‘’1’’, ’’2’’, and‘3’’ limitations and the proposed design innovations are thoroughly presented in Table 10.
5. Discussion
5.1. Observed Limitations of the Proposed EEG Circuit Design
The present single-channel arrangement of the EEG circuit is a bottleneck for a complete study of brain activity, as it allows collecting a very limited amount of data. This circuit was designed as a proof of concept for efficient modeling of the modeling of the electronic behavior of the brain and the circuit topology needed for muscle artifacts removal during the EEG signal acquisition process. This problem can only be resolved by designing a multi-channel system that would allow simultaneous monitoring in several brain areas, an attribute that is certainly required for carrying out comprehensive neurological studies.
In addition, the human lack of wireless technology in the integration limits this circuit for use in potential mobile monitoring applications that may otherwise be improved with the inclusion of wireless communication modules. There are also concerns over the continued reliance of the circuit on battery power, which could affect the long-term operational stability and long-term efficiency in power management. Integration of redundancy elements can prove highly effective in reducing the risk of single points of failure, a critical factor in decreasing the risks to medical safety regulation.
To avoid this, the system should be subjected to thorough testing within various environmental conditions, such as low, freezing, and high temperatures, and humidity levels, for assured good performance throughout all the climatic regions. The current prototype still falls short of more advanced methods of noise reduction, such as adaptive filtering, which would be very necessary for effectively responding to environmental noise, particularly from highly interfering sites like hospitals or clinics. The latter may be incorporated with enhanced electromagnetic interference (EMI) shielding in the design stage of the printed circuit board (PCB). Another problem is that the present architecture of the circuit is inflexible and not easily interfaced or integrated with other forms of biomedical equipment. This limitation can be easily overcome with a proper modular design approach that would give a cost-effective way to the implementation of several channels and pave the way for easy future enhancement.
It lacks even encryption or secure data transfer, yet both are paramount to secure the data of patients in medical applications. Lack of provision for real-time data analytics support that is important for on-the-spot, evidence-based medical treatments, and interventions; the physical design of the circuit lacks robustness for use in rough environments.
These can be taken care of by putting a robust design principle in place for the development of systems that are durable enough and are, in fact, portable for everyday harsh weather conditions use, including even a device that is waterproof. The design is not even in compliance with the international regulatory norms. This can limit it from being in place to be considered for use in any medical environment. Allowing for community access and involvement with the design through an open-source framework may possibly result in the improvement of the design and the new development of one.
5.2. Future Perspectives: Possible Updates and Real-World Applications of the Proposed EEG Circuit Design
The proposed multi-component EEG system for BMUBTF and BCI applications will be a great improvement. It will ensure the collection of full-brain activity, thus facilitating better control accuracy and more efficacious neurofeedback. Adaptive filtering methods combined with commercially available ADCs and microcontrollers allow for data collection and its transmission to be made through USB or Wi-Fi to a computer for real-time application. Such methods are implemented with machine learning for the identification and real-time removal of artifacts, promising the higher reliability of the brain-computer interface (BCI) and a better user experience. This will further increase spatial resolution in EEG data by the use of high-definition electrodes to enable accurate brain mapping. Hybrid BCI systems that integrate EEG with other biometric modalities, such as ECG or EMG, may improve user engagement and offer wider monitoring windows.
BCI designs should include a facility for user-specific calibration to consider individual physiological variations, thereby providing a greater level of personalization and effectiveness. This would, therefore, mean that any remote monitoring application should have a secure method by which data gets transmitted to take care of patient information. This translates to a design that allows the cost-effective multi-channel deployments and complies with the legal medical requirements for purposes of facilitating usability in medical settings, promoting further acceptance. Fixing these technological bottlenecks and having the suggestions in mind during the designing process shows that the EEG systems could experience potential improvements for such uses in research and therapeutics. This will lead to high usability and effectiveness in real-world applications.
6. Conclusions
This study introduces a novel EEG Analog Front End Circuit System, distinctively capable of monitoring theta, alpha, and beta brain wavebands during challenging complex EEG usage protocols involving strong compound muscle movements. This capability, which is rarely studied in the field to our best knowledge, addresses a significant gap in existing EEG technologies.
It is worth noting that making the system capable of handling significant muscle artifacts manipulation in raw EEG data, EEG analysis becomes more accurate and reliable. Taking into consideration the effects of environmental electromagnetic interference , our project presents an unprecedented development of a realistic electronic model of the human body and brain, which can handle 50 Hz or 60 Hz power grid EMI . More importantly, the ‘Garbage In, Garbage Out’ (GIGO) problem must be minimized when evaluating such systems. Accurate, realistic, and coherent input signals are needed for system evaluation, and this key can be achieved through advanced modeling . Our approach, which maintains the consistency, accuracy, and reliability of our simulation testing, is essential for increasing the credibility and efficiency of the projected EEG.
The suggested circuit’s primary characteristic is its high mobility, which is facilitated by a battery-powered configuration, allowing for application in a variety of scientific and industrial contexts. It covers a broad frequency spectrum, beginning with 0.5 Hz and reaching 48 kHz as the minimum contour’s frequency. The 0 dB passband ensures a comprehensive compilation of all EEG signals, which falls within 0.5 Hz and 21 kHz. With the high amplification factor of 300 V/V, the signal may increase the signal amplitudes of EEG numerous times, and its high amplifications do not result in signal distortion. Furthermore, low levels of noise production, with a value of 1.58871 μVrms, ensure that the noise levels before amplification ranged between 0.1 Hz and 10 Hz are extremely low.
Significantly enhancing the clarity and quality of raw EEG signal readings can be achieved by reducing noise levels and attaining a 48 dB notch depth at the correct frequency. The idea shows its potential for global acceptability by mitigating Electromagnetic Interference at frequencies of either 50 Hz or 60 Hz, depending on the particular power grid configurations in the region. The circuit follows EEG design principles by achieving a High Common Mode Rejection Ratio above 90 dB when subjected to EEG signals under 110 Hz in 60 Hz EMI environments and under 166 Hz in 50 Hz EMI environments. The design of the medical equipment complies with the set requirements, namely in relation to ensuring patient safety and minimizing leakage current. Furthermore, the integration of a subcircuit specifically engineered to mitigate the risk of Electrostatic Discharge amplifies the system’s robustness and durability.
To recapitulate, the aforementioned attributes lead to the production of results that are almost of medical caliber while necessitating a few electrical components. Importantly, the system retains its cost-effectiveness advantage by employing simple and minimal sub-circuits, deliberately avoiding complex and expensive techniques, and maintaining the cost close to commercial and research-grade device levels. In summary, the system’s capabilities are extensively validated through carefully crafted simulations, and its potential usage extends to advanced applications such as neuro-feedback training and tele-controlling devices via Brain-Computer Interfaces, particularly in usage protocols where the novel device’s users perform strong compound muscle movements.
Supplementary Materials
Not applicable.
Author Contributions
Conceptualization, A.D.; methodology, A.D.; software, A.D.; validation, A.D., G.T. and P.T.; formal analysis, A.D.; investigation, A.D.; resources, A.D., and P.T.; data curation, A.D., and P.T.; writing—original draft preparation, A.D. and G.T.; writing—review and editing, A.D., G.T. and P.T.; visualization, A.D. and G.T.; supervision, P.T.; project administration, A.D. All authors have read and agreed to the published version of the manuscript.
Funding
This research received no external funding.
Institutional Review Board Statement
Not applicable.
Informed Consent Statement
Not applicable.
Data Availability Statement
The original contributions presented in the study are included in the article.
Conflicts of Interest
The authors declare no conflicts of interest.
Appendix A
This Appendix provides an overview of the EEG circuit designs analyzed in this study. It delineates the requisite parameters and technical specifications for the circuits that are not part of the direct comparison with the proposed EEG Circuits and the distinct Cases ‘’1’’, ‘’2’’, and ‘’3’’.
The following Table A1. succinctly presents key aspects of the Neonates-Specific EEG System [23], including the CMRR, signal bandwidth, gain, and filter characteristics:

Table A1.
Parameters and technical specifications in Neonates-Specific EEG System.
| Feature | Description |
|---|---|
| Common Mode Rejection Ratio (CMRR) | The AD620 instrumentation amplifier used in the design has a high CMRR of 110 dB, crucial for minimizing noise and interference in EEG signals. |
| Signal Bandwidth/Frequency Range | Targets neonatal EEG signals, predominantly delta waves, with frequencies from 0.5 to 2 Hz, 100μV amplitude. |
| Gain | Total gain of 17776 V/V. ndividual stage gains:
|
| Filter Characteristics | High pass and low pass filters with cutoff frequencies of 0.16 Hz and 50 Hz, respectively to remove DC offset and power line interference |
The following Table A2 provides a succinct overview of the compact amplifier and signal conditioning module designed for wireless EEG monitoring [24]. This kind of EEG design includes features, relate to variable gain, CMRR, power consumption, portability, components, cost, and signal quality metrics. The design prioritizes low power consumption and portability, utilizing readily available commercial components to achieve a cost-efficient and compact solution.
Table A2.
Wireless EEG Monitoring-Compatible Compact Amplifier and Signal Conditioning Module.
| Feature | Description |
|---|---|
| Common Mode Rejection Ratio (CMRR) | High CMRR suitable for EEG applications |
| Signal Bandwidth | 0.5 to 40 Hz |
| Variable Gain | Between 100 and 7000 |
| Power Consumption | Low |
| Portability | Designed for portability |
| Components | Uses commercially available components |
| Cost | Cost-effective |
| Signal Quality Metrics | Detailed metrics not directly provided |
The following Table A3 systematically organizes the technical parameters of a Single-Chip EEG Signal Sampling Circuit [25], such as Common Mode Rejection Ratio (CMRR), Amplifier Gain, Pass-Band Frequency, and Input Impedance:
Table A3.
Single-Chip EEG Signal Sampling Circuit.
| Feature | Description |
|---|---|
| Common Mode Rejection Ratio (CMRR) | 102 dB, effective in reducing noise and interference from common-mode signal |
| Amplifier Gain | Variable, with options for 5000, 10000, 20000, or 30000 V/V |
| Pass-Band Frequency | Ranges from 0.12Hz to 35.4Hz, accommodating the typical frequency range of EEG signals |
| Input Impedance | 113MΩ, ensuring that the circuit does not significantly load the signal source, preserving signal integrity |
The following Table A4 offers a concise summary of key BCI-Specific EEG [26,37] design elements, such as CMRR, amplifier gain, notch filter, etc. These elements highlight the circuit's ability to deliver accurate amplification and filtering of EEG signals, which are crucial for dependable monitoring of brain activity:
Table A4.
BCI-Specific EEG.
| Feature | Description |
|---|---|
| Common Mode Rejection Ratio (CMRR) | 100 dB for gains ≥ 100, aiming for effective common-mode noise rejection |
| Amplifier Gain | G≥100V/V |
| Modified High-Q Factor Active Twin-T Notch Filter |
60 Hz and a rejection level of -38 dB. |
| PCB Size | Less than 5.5 cm2 |
References
- Sanei, S.; Chambers, J.A. Fundamentals of EEG Signal Processing. EEG Signal Processing 2007, 35–12. [Google Scholar] [CrossRef]
- Tatum, W.O. Ambulatory EEG. In Handbook of EEG Interpretation. Springer Publishing Company 2021. [CrossRef]
- Benbadis, S.R.; Beniczky, S.; Bertram, E.; MacIver, S.; Moshé, S.L. The role of EEG in patients with suspected epilepsy. Epileptic Disorders 2020, 22, 143–155. [Google Scholar] [CrossRef] [PubMed]
- Rubiños, C.; Godoy, D.A. Electroencephalographic monitoring in the critically ill patient: What useful information can it contribute? Medicina Intensiva (English Edition) 2020, 44, 301–309. [Google Scholar] [CrossRef]
- Asadzadeh, S.; Yousefi Rezaii, T.; Beheshti, S.; Delpak, A.; Meshgini, S. A systematic review of EEG source localization techniques and their applications on diagnosis of brain abnormalities. Journal of Neuroscience Methods 2020, 339, 108740. [Google Scholar] [CrossRef] [PubMed]
- Dhar, P.; & Garg, V.K. Brain-Related Diseases and Role of Electroencephalography (EEG) in Diagnosing Brain Disorders. Lecture Notes in Networks and Systems, Springer Singapore 2020, 317–326. [CrossRef]
- Ullah, H.; Mahmud, S.; Chowdhury, R.H. Identification of Brain disorders by Sub-band Decomposition of EEG signals and Measurement of Signal to Noise Ratio. Indonesian Journal of Electrical Engineering and Computer Science 2016, 4, 568. [Google Scholar] [CrossRef]
- Iscan, Z.; Dokur, Z.; Demiralp, T. Classification of electroencephalogram signals with combined time and frequency features. Expert Systems with Applications 2011, 38, 10499–10505. [Google Scholar] [CrossRef]
- Siuly, S.; Li, Y.; Zhang, Y. Electroencephalogram (EEG) and Its Background. EEG Signal Analysis and Classification 2016, 3–21. [Google Scholar] [CrossRef]
- Usakli, A.B. Improvement of EEG Signal Acquisition: An Electrical Aspect for State of the Art of Front End. Computational Intelligence and Neuroscience 2010, 1–7. [Google Scholar] [CrossRef]
- Elsayed, N.; Saad, Z.; Bayoumi, M. Brain Computer Interface: EEG Signal Preprocessing Issues and Solutions. International Journal of Computer Applications 2017, 169, 12–16. [Google Scholar] [CrossRef]
- Alkhorshid, D.R.; Molaeezadeh, S.F.; Alkhorshid, M.R. Analysis: Electroencephalography Acquisition System: Analog Design. Biomedical Instrumentation & Technology 2020, 54, 346–351. [CrossRef]
- Cohen, M.X. Where Does EEG Come From and What Does It Mean? Trends in Neurosciences 2017, 40, 208–218. [Google Scholar] [CrossRef] [PubMed]
- Tankisi, H.; Burke, D.; Cui, L.; de Carvalho, M.; Kuwabara, S.; Nandedkar, S.D.; Rutkove, S.; Stålberg, E.; van Putten, M.J.A.M.; Fuglsang-Frederiksen, A. Standards of instrumentation of EMG. Clinical Neurophysiology 2020, 131, 243–258. [Google Scholar] [CrossRef] [PubMed]
- Vanhatalo, S.; Voipio, J.; Kaila, K. Full-band EEG (FbEEG): an emerging standard in electroencephalography. Clinical Neurophysiology 2005, 116(1), 1–8. [Google Scholar] [CrossRef] [PubMed]
- Hari, R.; Parkkonen, L.; Nangini, C. The brain in time: insights from neuromagnetic recordings. Annals of the New York Academy of Sciences 2010, 1191, 89–109. [Google Scholar] [CrossRef] [PubMed]
- Sullivan, T.J.; Deiss, S.R.; Cauwenberghs, G. A Low-Noise, Non-Contact EEG/ECG Sensor. In Proceeding of IEEE Biomedical Circuits and Systems Conference, Nov. 2007. [Google Scholar] [CrossRef]
- Scheer, H.J.; Sander, T.; Trahms, L. The influence of amplifier, interface and biological noise on signal quality in high-resolution EEG recordings. Physiological Measurement 2005, 27, 109–117. [Google Scholar] [CrossRef] [PubMed]
- Jobert, M.; Wilson, F.J.; Ruigt, G.S.F.; Brunovsky, M.; Prichep, L.S.; Drinkenburg, W.H.I.M. Guidelines for the Recording and Evaluation of Pharmaco-EEG Data in Man: The International Pharmaco-EEG Society (IPEG). Neuropsychobiology 2012, 66, 201–220. [Google Scholar] [CrossRef] [PubMed]
- Wasade, V.S.; Spanaki, M.V. Understanding Epilepsy. Cambridge University Press, 2019. [CrossRef]
- Usakli, A.B. Improvement of EEG Signal Acquisition: An Electrical Aspect for State of the Art of Front End. Computational Intelligence and Neuroscience 2010, 1–7. [Google Scholar] [CrossRef]
- Gardella, P.J.; Baez, E.; Cesaretti, J.M. (2020). Design of ESD protections for ECG applications. In Proceeding of Conference on Electronics (CAE), Argentine, Feb 2020. [CrossRef]
- Kumar, S.C.P.; Chandrasekar, A.; Nagaraj, A.; Gupta, P.; Sekhar, S. Design of an ElectroEncephaloGram (EEG) amplification circuit for neonates. In Proceeding of International Conference on Communication and Signal Processing (ICCSP), Apr. 2016. [CrossRef]
- Whitchurch, A.K.; Abraham, J.K.; Lonkar, M.A.; Varadan, V.K. Design of a Compact Amplifier and Signal Conditioning Module for Wireless EEG Monitoring. In Proceeding of IEEE Region 5 Technical Conference, Apr. 2007. [CrossRef]
- Zhang, X.; Zhang, Z. Design on Sampling Circuit of EEG Signal Based on AT89C2051 Single-Chip. In Proceeding of Fourth International Conference on Innovative Computing, Information and Control (ICICIC), Dec. 2009. [CrossRef]
- Salahuddin Morsalin, S.M.; Lai, S.-C. Front-end circuit design for electroencephalography (EEG) signal. In Proceeding of 2nd International Conference on Computing, Analytics and Networks (ICAN), Indo – Taiwan, Feb 2020. [CrossRef]
- Xu, X.; Wang, P. Low-Cost Circuit Design for EEG Signal Amplification and Extraction. In Proceeding of IEEE Asia-Pacific Conference on Image Processing, Electronics and Computers (IPEC), Apr. 20212021. [CrossRef]
- Choudhary, S.K.; Bera, T.K. Designing of Battery-Based Low Noise Electroencephalography (EEG) Amplifier for Brain Signal Monitoring: A Simulation Study. In Proceeding of IEEE 6th International Conference on Condition Assessment Techniques in Electrical Systems (CATCON), 422-426, Durgapur, India, 2022). [CrossRef]
- Analog Devices, Inc. AD8428: High Gain, High Voltage Instrumentation Amplifier. Data Sheet. Available online: https://www.analog.com/media/en/technical-documentation/data-sheets/ad8428.pdf (accessed on 10 Feb. 2024).
- Yuge, Sun.; Ning, Ye.; Feng, Pan. A novel design of EEG signal amplifier. In Proceeding of 24th Chinese Control and Decision Conference (CCDC), May 2012. [CrossRef]
- Jobert, M.; Wilson, F.J.; Ruigt, G.S.F.; Brunovsky, M.; Prichep, L.S.; Drinkenburg, W.H.I.M. Guidelines for the Recording and Evaluation of Pharmaco-EEG Data in Man: The International Pharmaco-EEG Society (IPEG). Neuropsychobiology 2012, 66, 201–220. [Google Scholar] [CrossRef] [PubMed]
- Alizadeh-Taheri, B.; Smith, R.L.; Knight, R.T. An Active, Microfabricated, Scalp Electrode-array For EEG Recording. In Proceeding of the International Solid-State Sensors and Actuators Conference - TRANSDUCERS ’95. [CrossRef]
- Zhang, L.; Guo, X.; Wu, X.; Zhou, B. Low-cost circuit design of EEG signal acquisition for the brain-computer interface system. In Proceeding of 6th International Conference on Biomedical Engineering and Informatics, Dec. 2013. [CrossRef]
- Analog Devices, Inc. AD8422: 1.8 nV/√Hz, Rail-to-Rail, Low Power Instrumentation Amplifier. Data Sheet. Available online: https://www.analog.com/media/en/technical-documentation/data-sheets/ad8422.pdf. (accessed on 10 Feb. 2024).
- Zumbahlen, H. Analog Filters. Linear Circuit Design Handbook, H. Zumbahlen, Ed. Burlington: Newnes, 2008, 581–679. [CrossRef]
- Wang, J.; Tang, L.; E Bronlund, J. Surface EMG Signal Amplification and Filtering. International Journal of Computer Applications 2013, 82, 15–22. [Google Scholar] [CrossRef]
- Texas Instruments, INA333 Low-Power, Precision Instrumentation Amplifier. Available online: https://www.ti.com/lit/ds/symlink/ina333.pdf (accessed on 12 Feb. 2024).
Figure 2.
Overall structure of low-cost EEG Circuit Design.
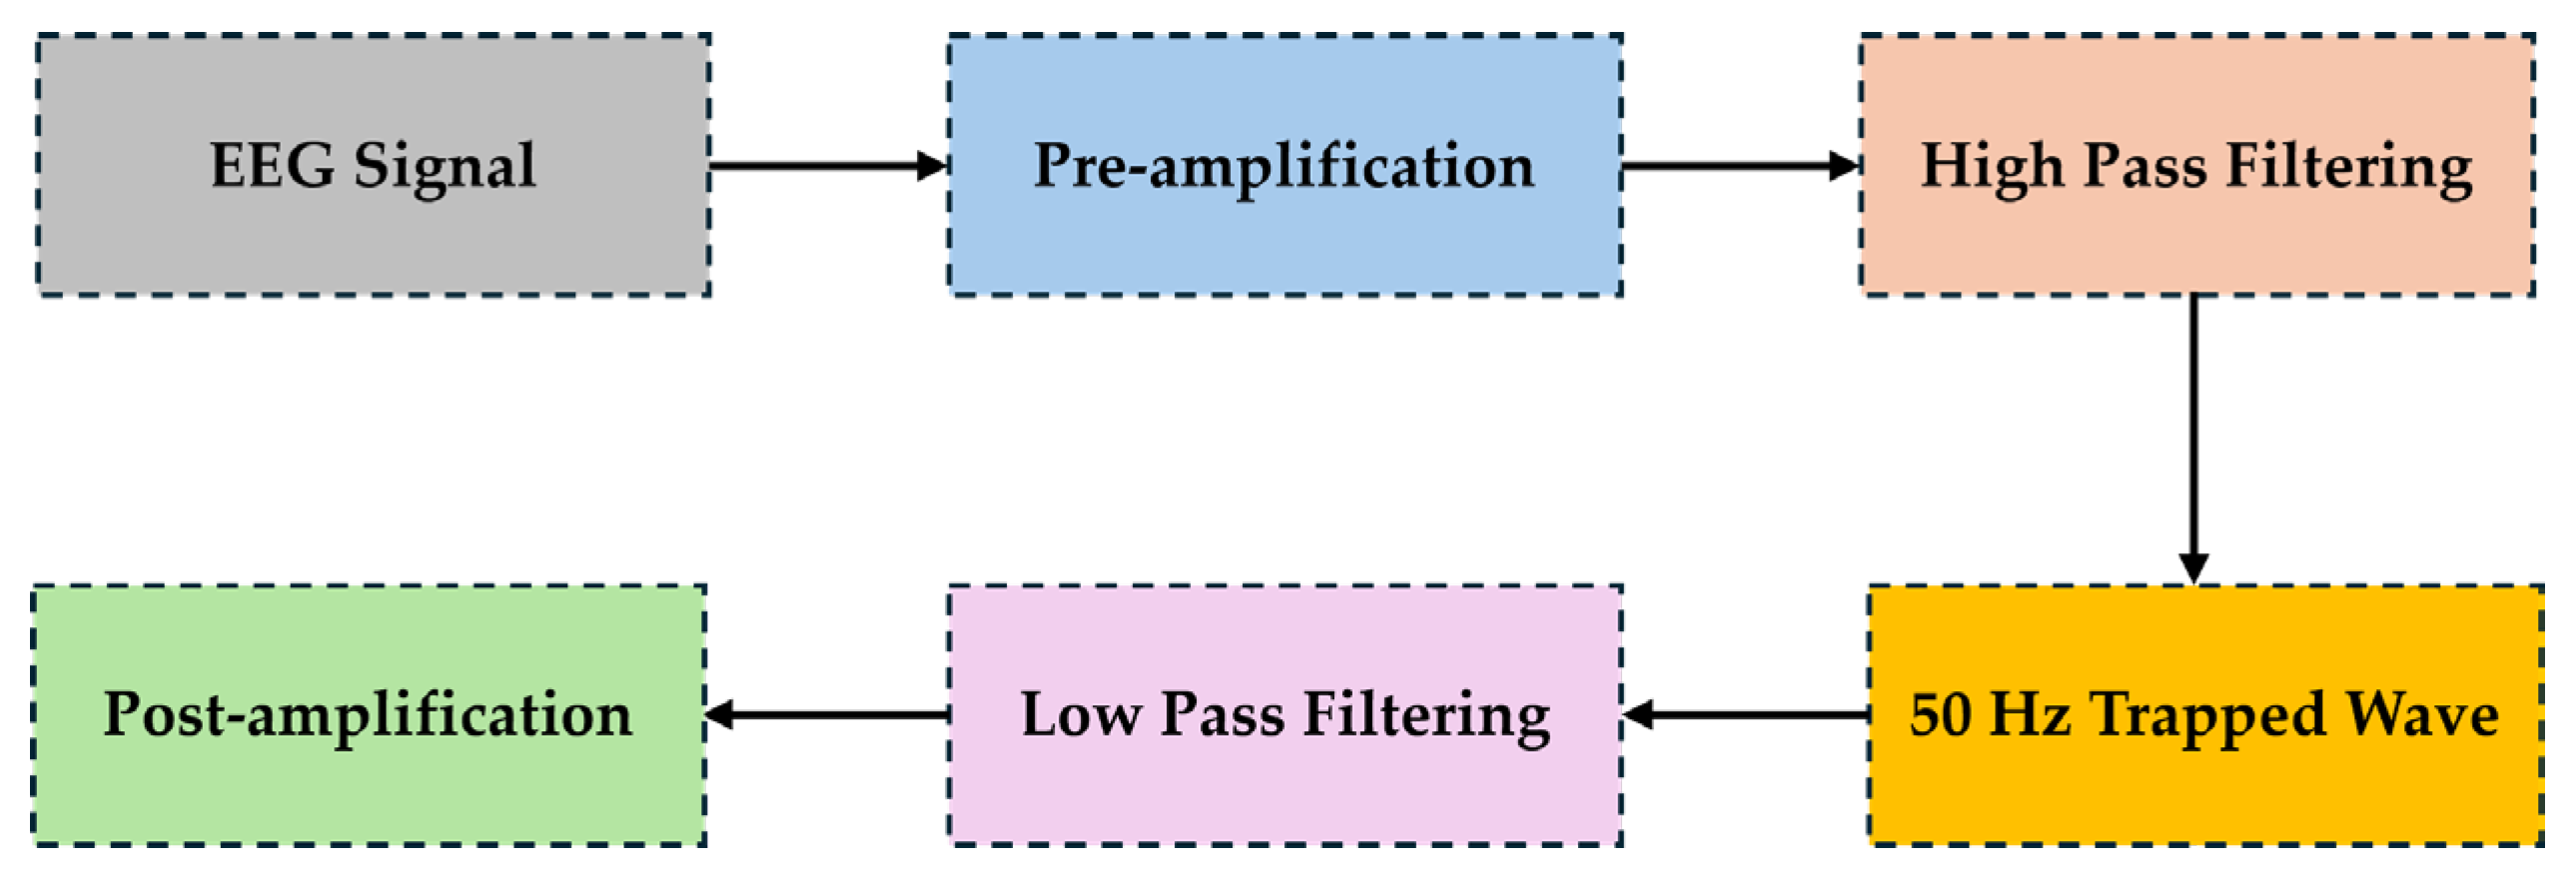
Figure 3.
Battery-based EEG Signal Acquisition System (BB-ESAS).
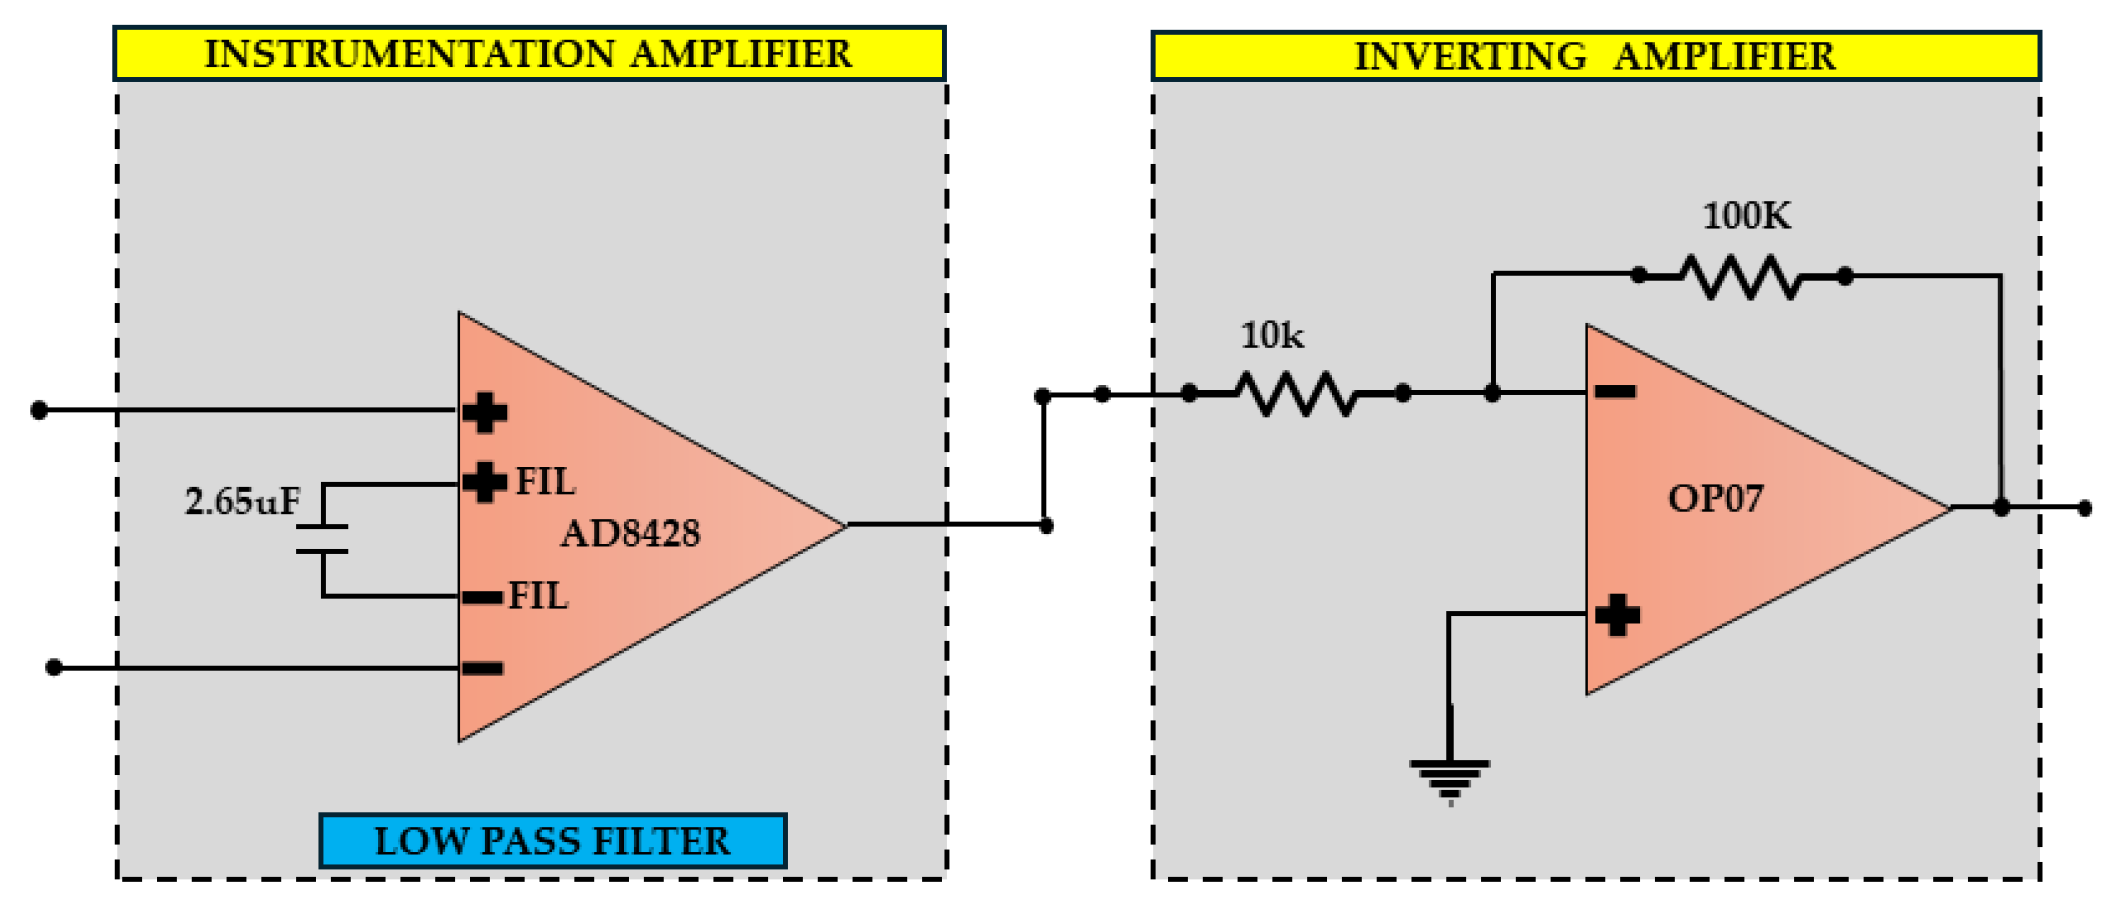
Figure 4.
Double Notch Filter Circuit Design of EEG.
Figure 6.
EEG Sub-Circuit Modeling the EMI in 50 Hz Electric Grid.
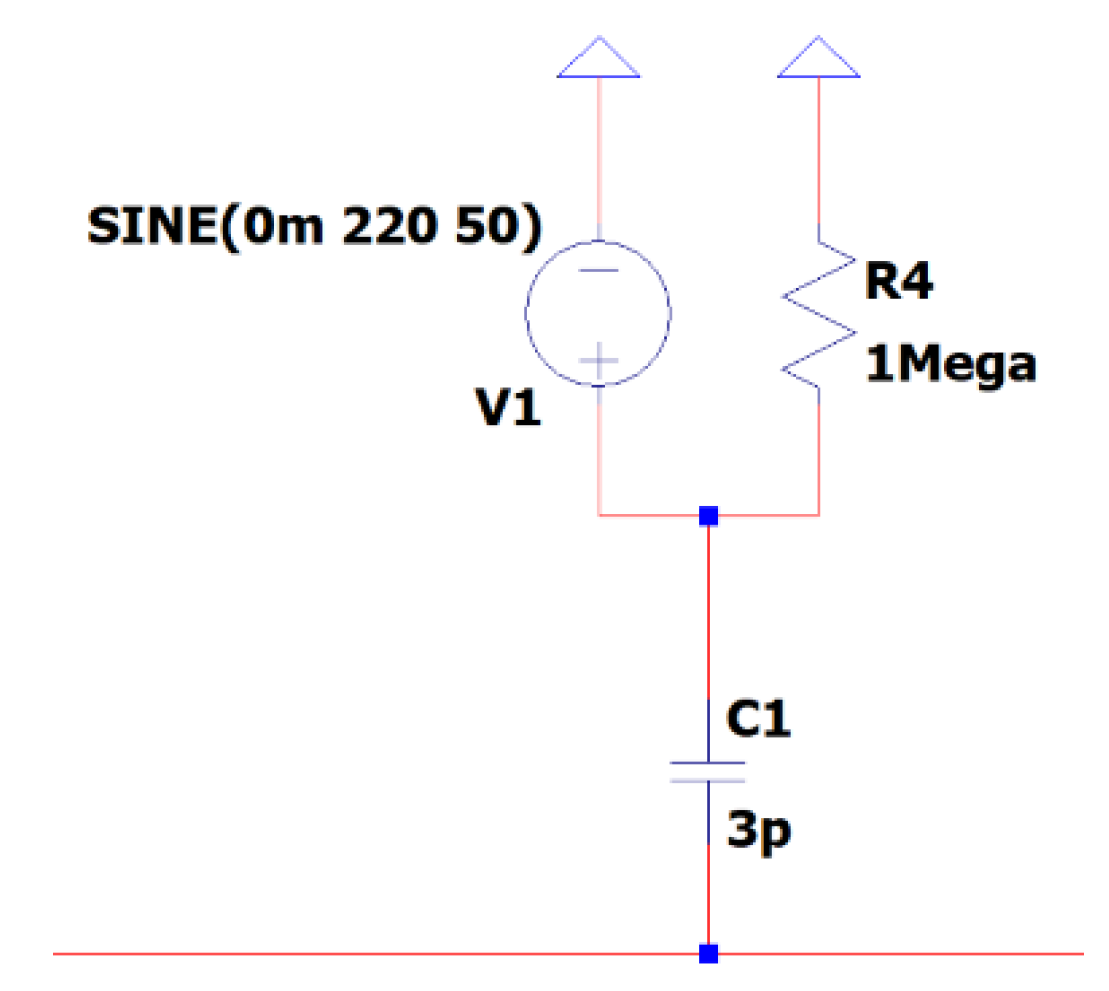
Figure 7.
EEG Sub-circuit Modeling the Human Body Apart from the Brain.
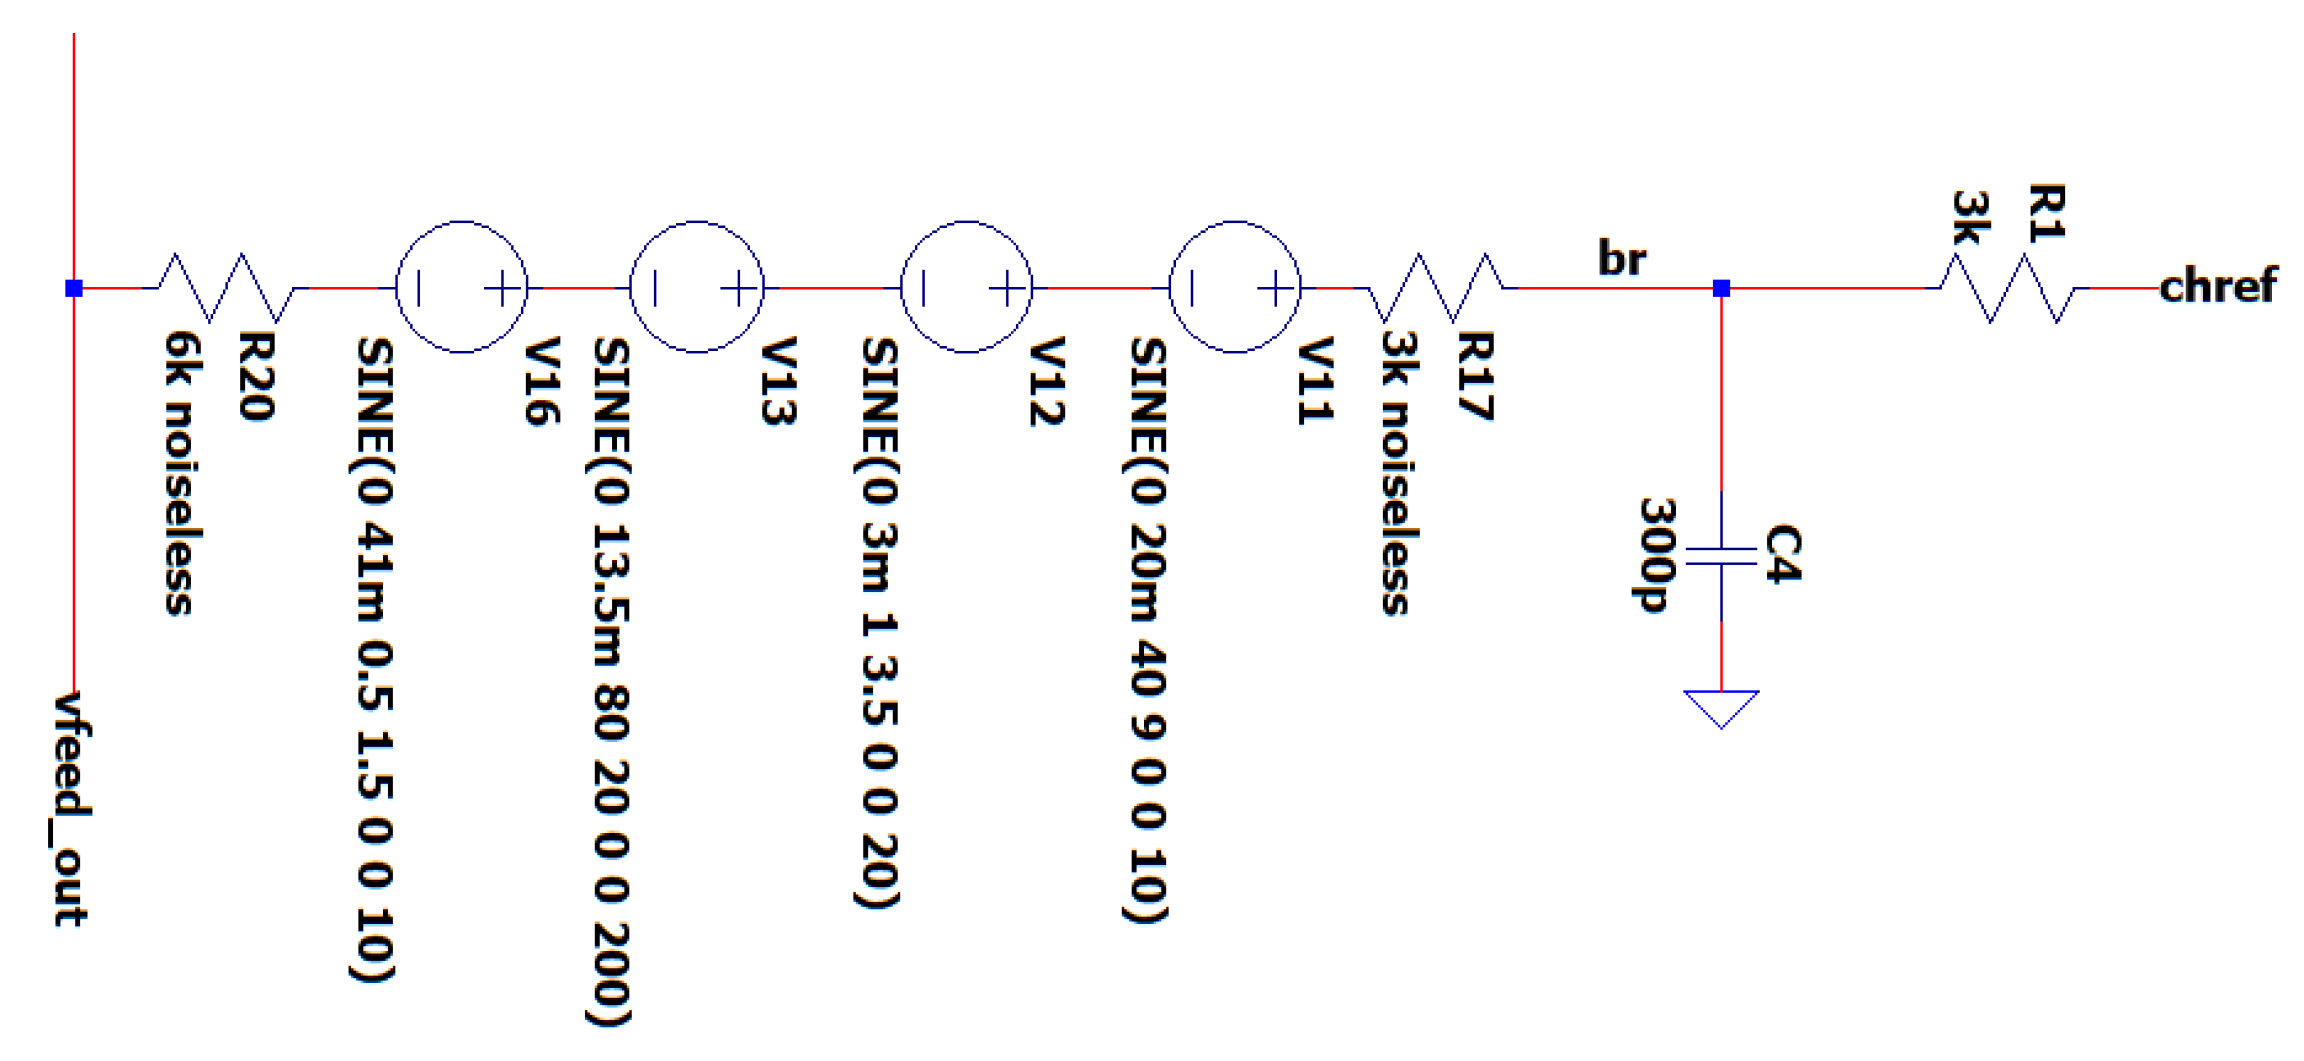
Figure 8.
EEG sub-Circuit Modeling the Brain and the Electrode.
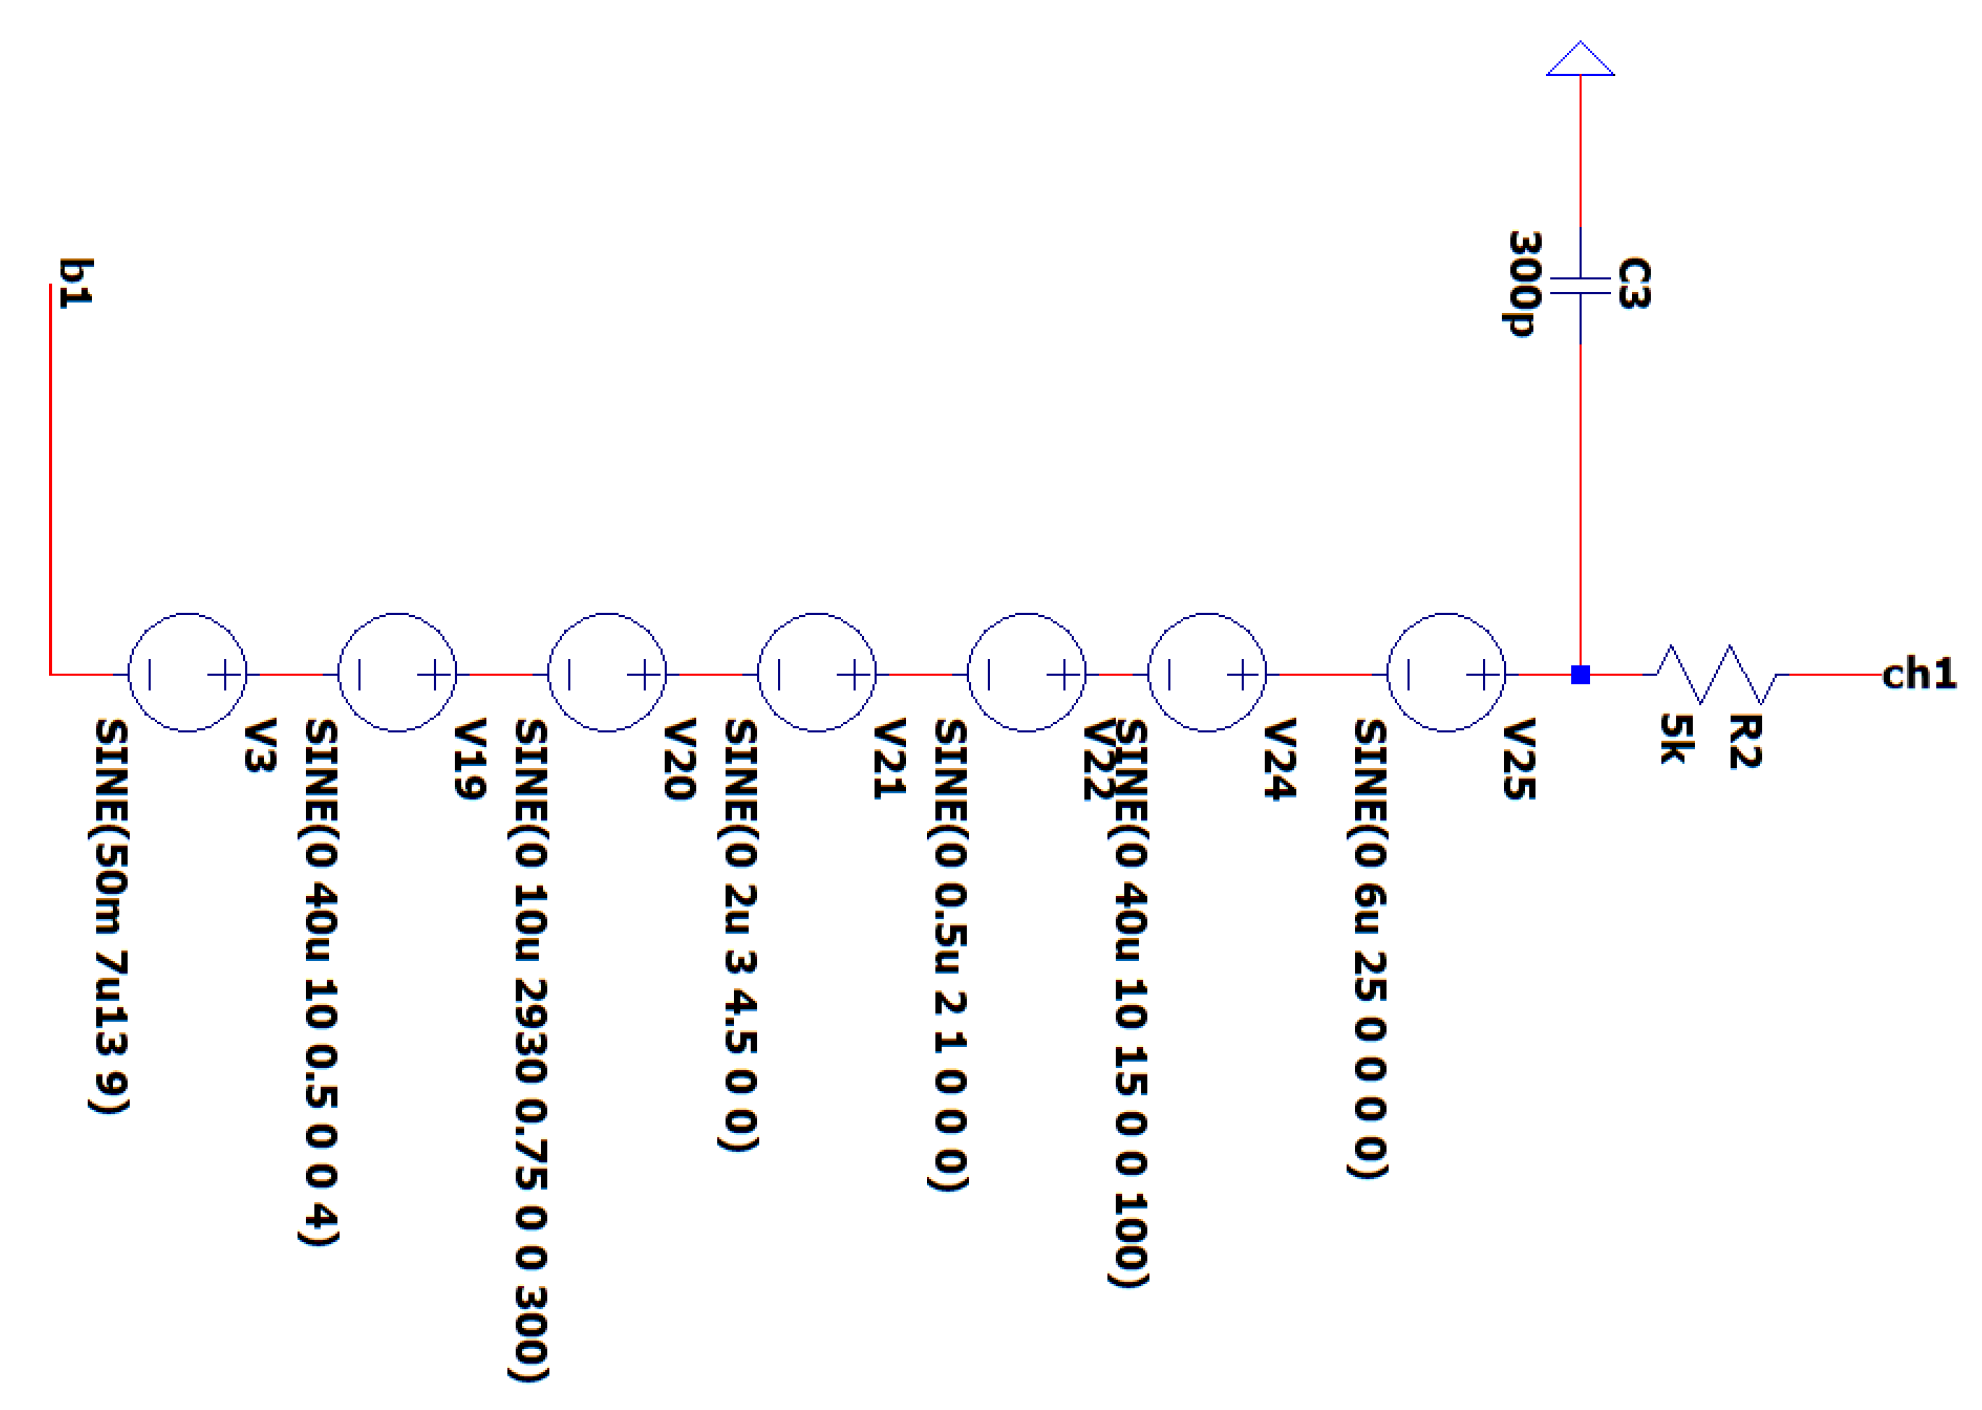
Figure 9.
EEG Sub-Circuit Modeling 3.3V Battery Supply.
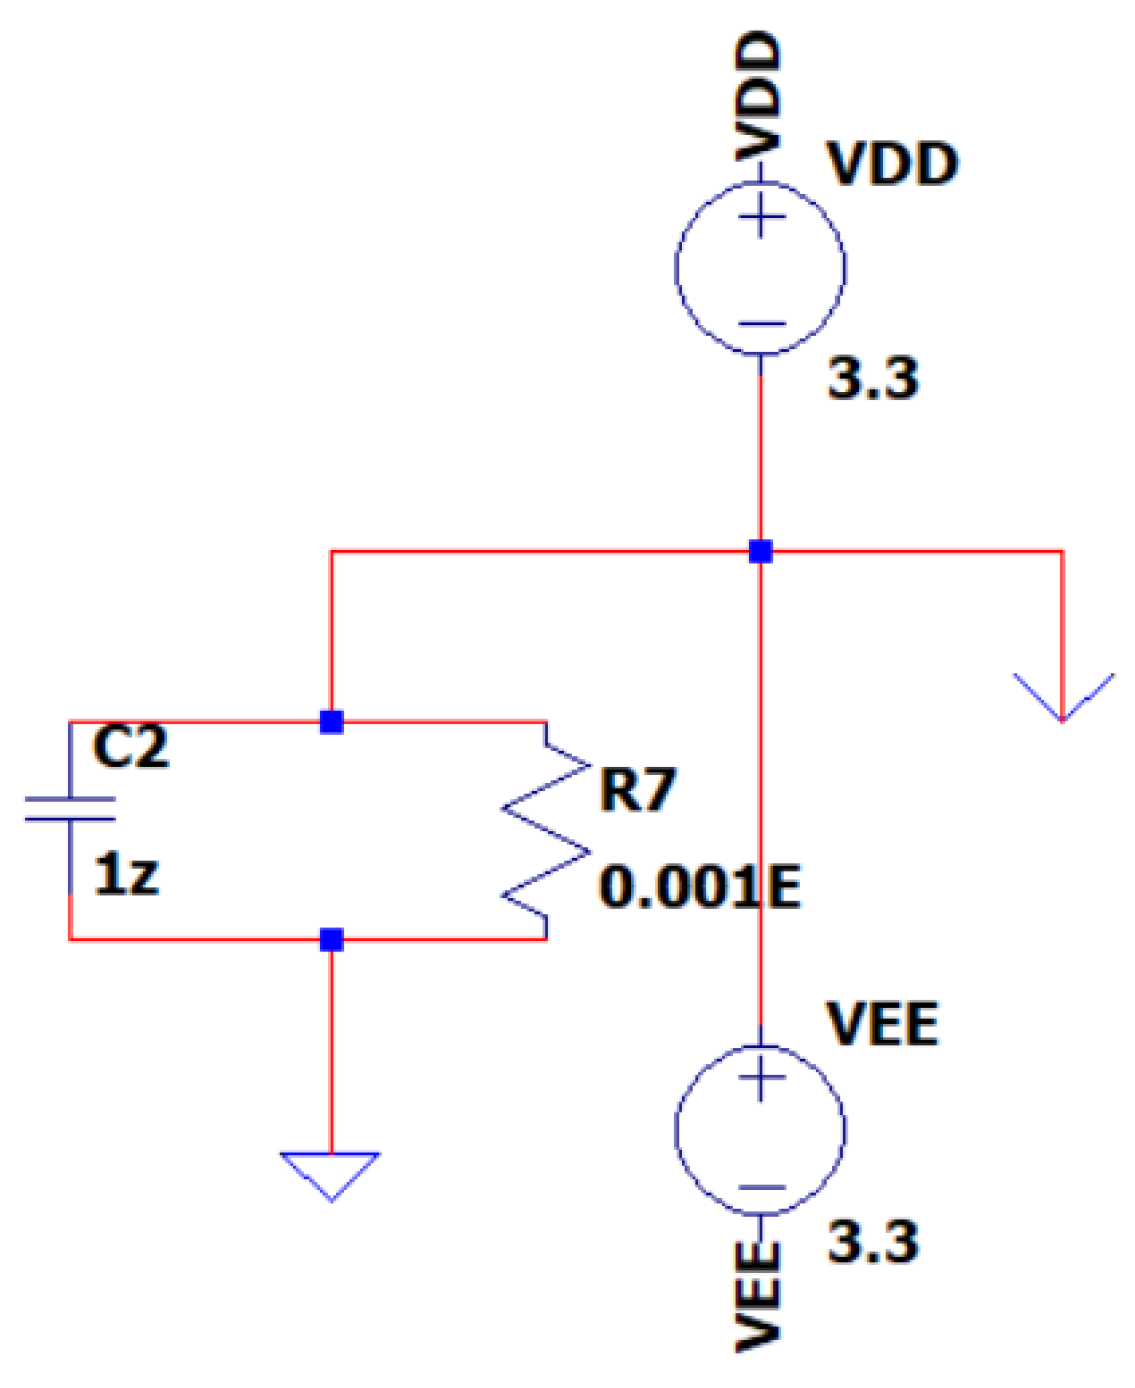
Figure 10.
EEG Sub-Circuit Modeling the DRL Circuit.
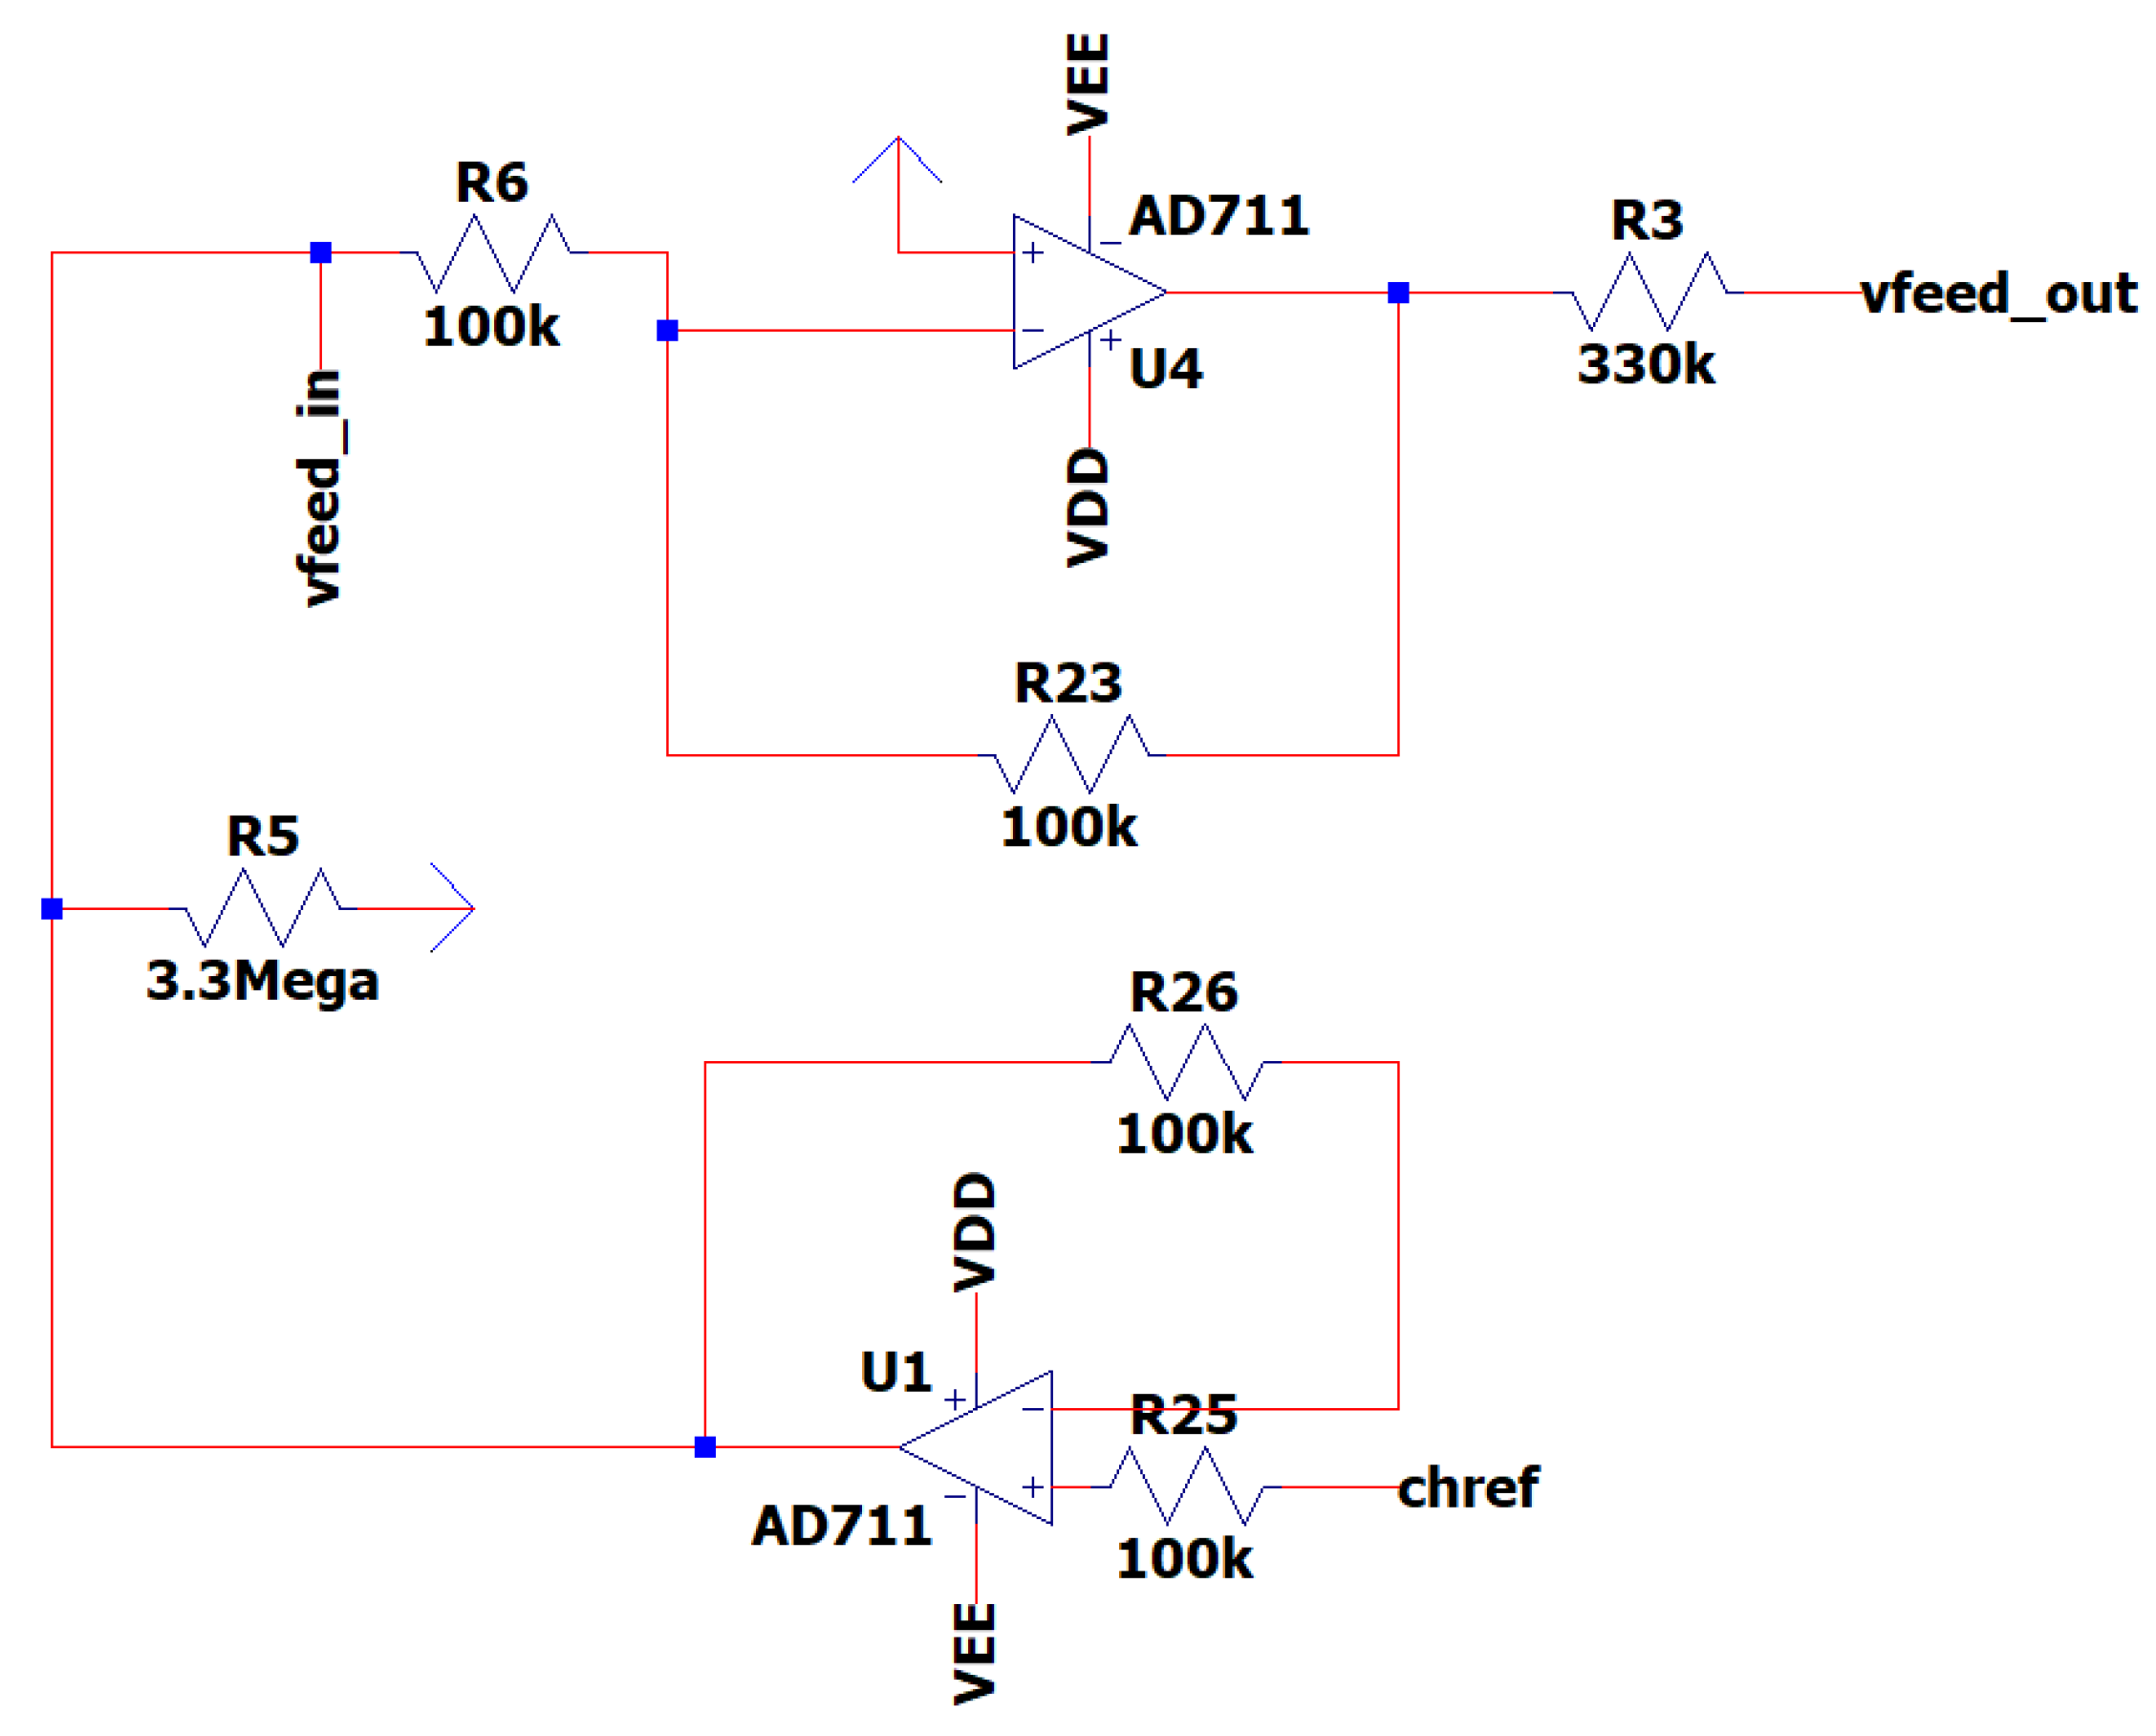
Figure 11.
EEG Sub-Circuit Modeling the First Band-Pass Filter.
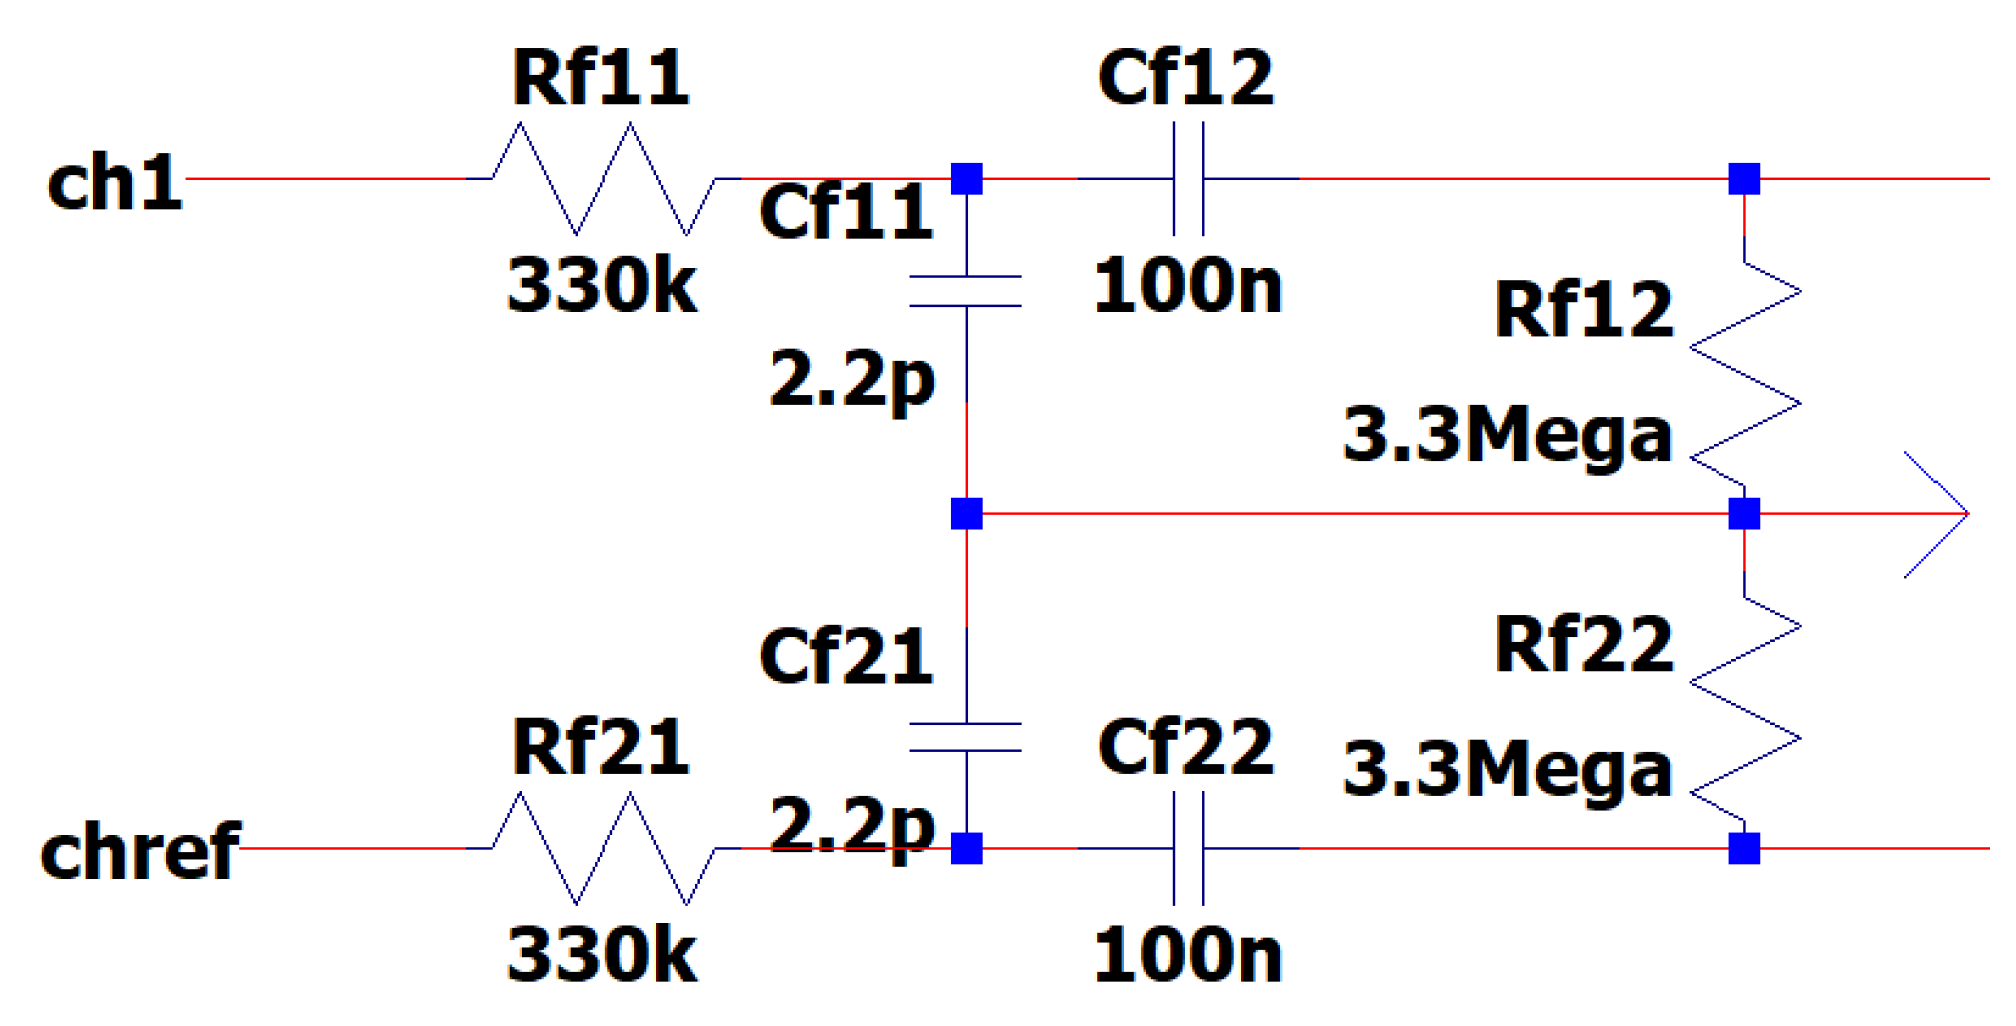
Figure 12.
EEG Sub-Circuit Modeling the ESD Protection and the Instrumentation Amplifier.
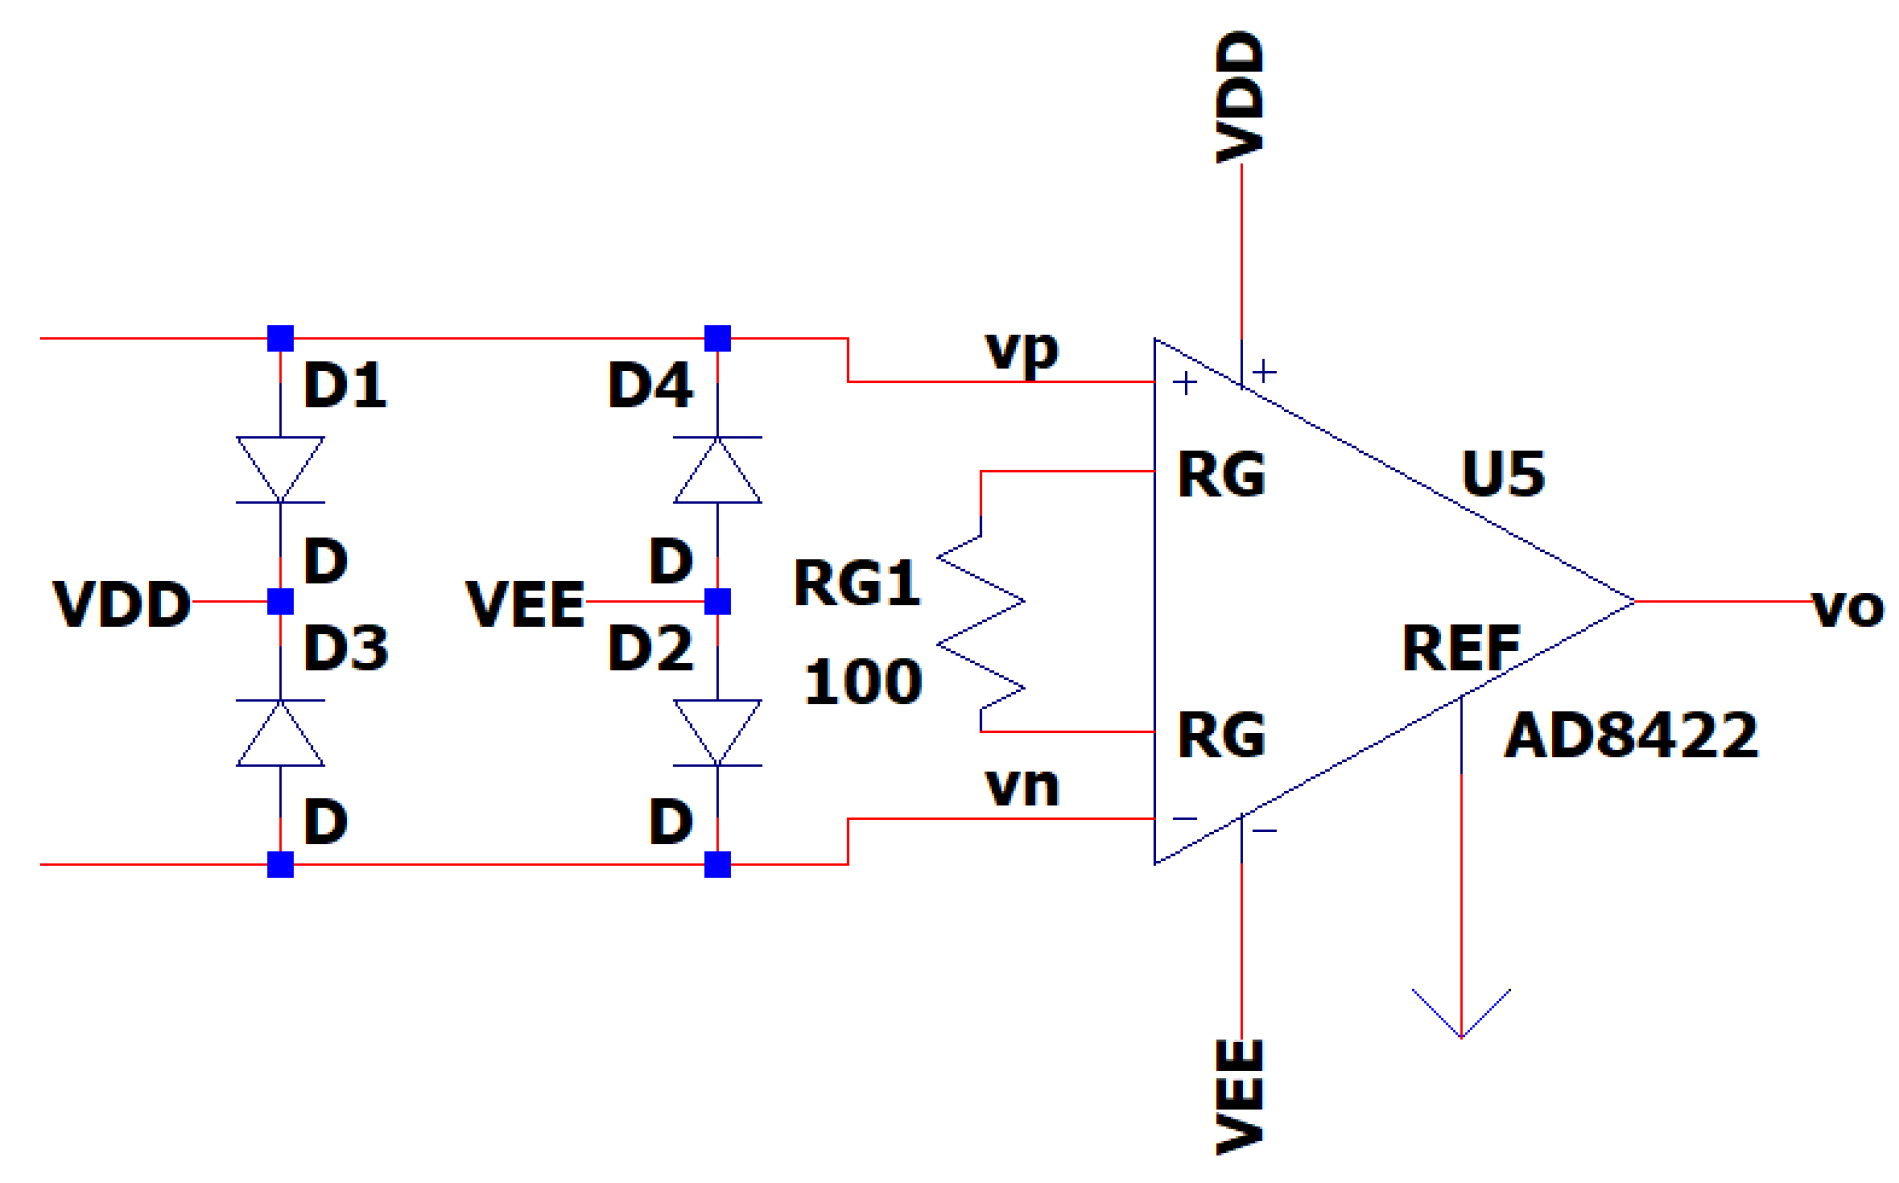
Figure 13.
EEG sub-circuit modeling the Fliedge Notch Filter 50Hz or 60Hz.
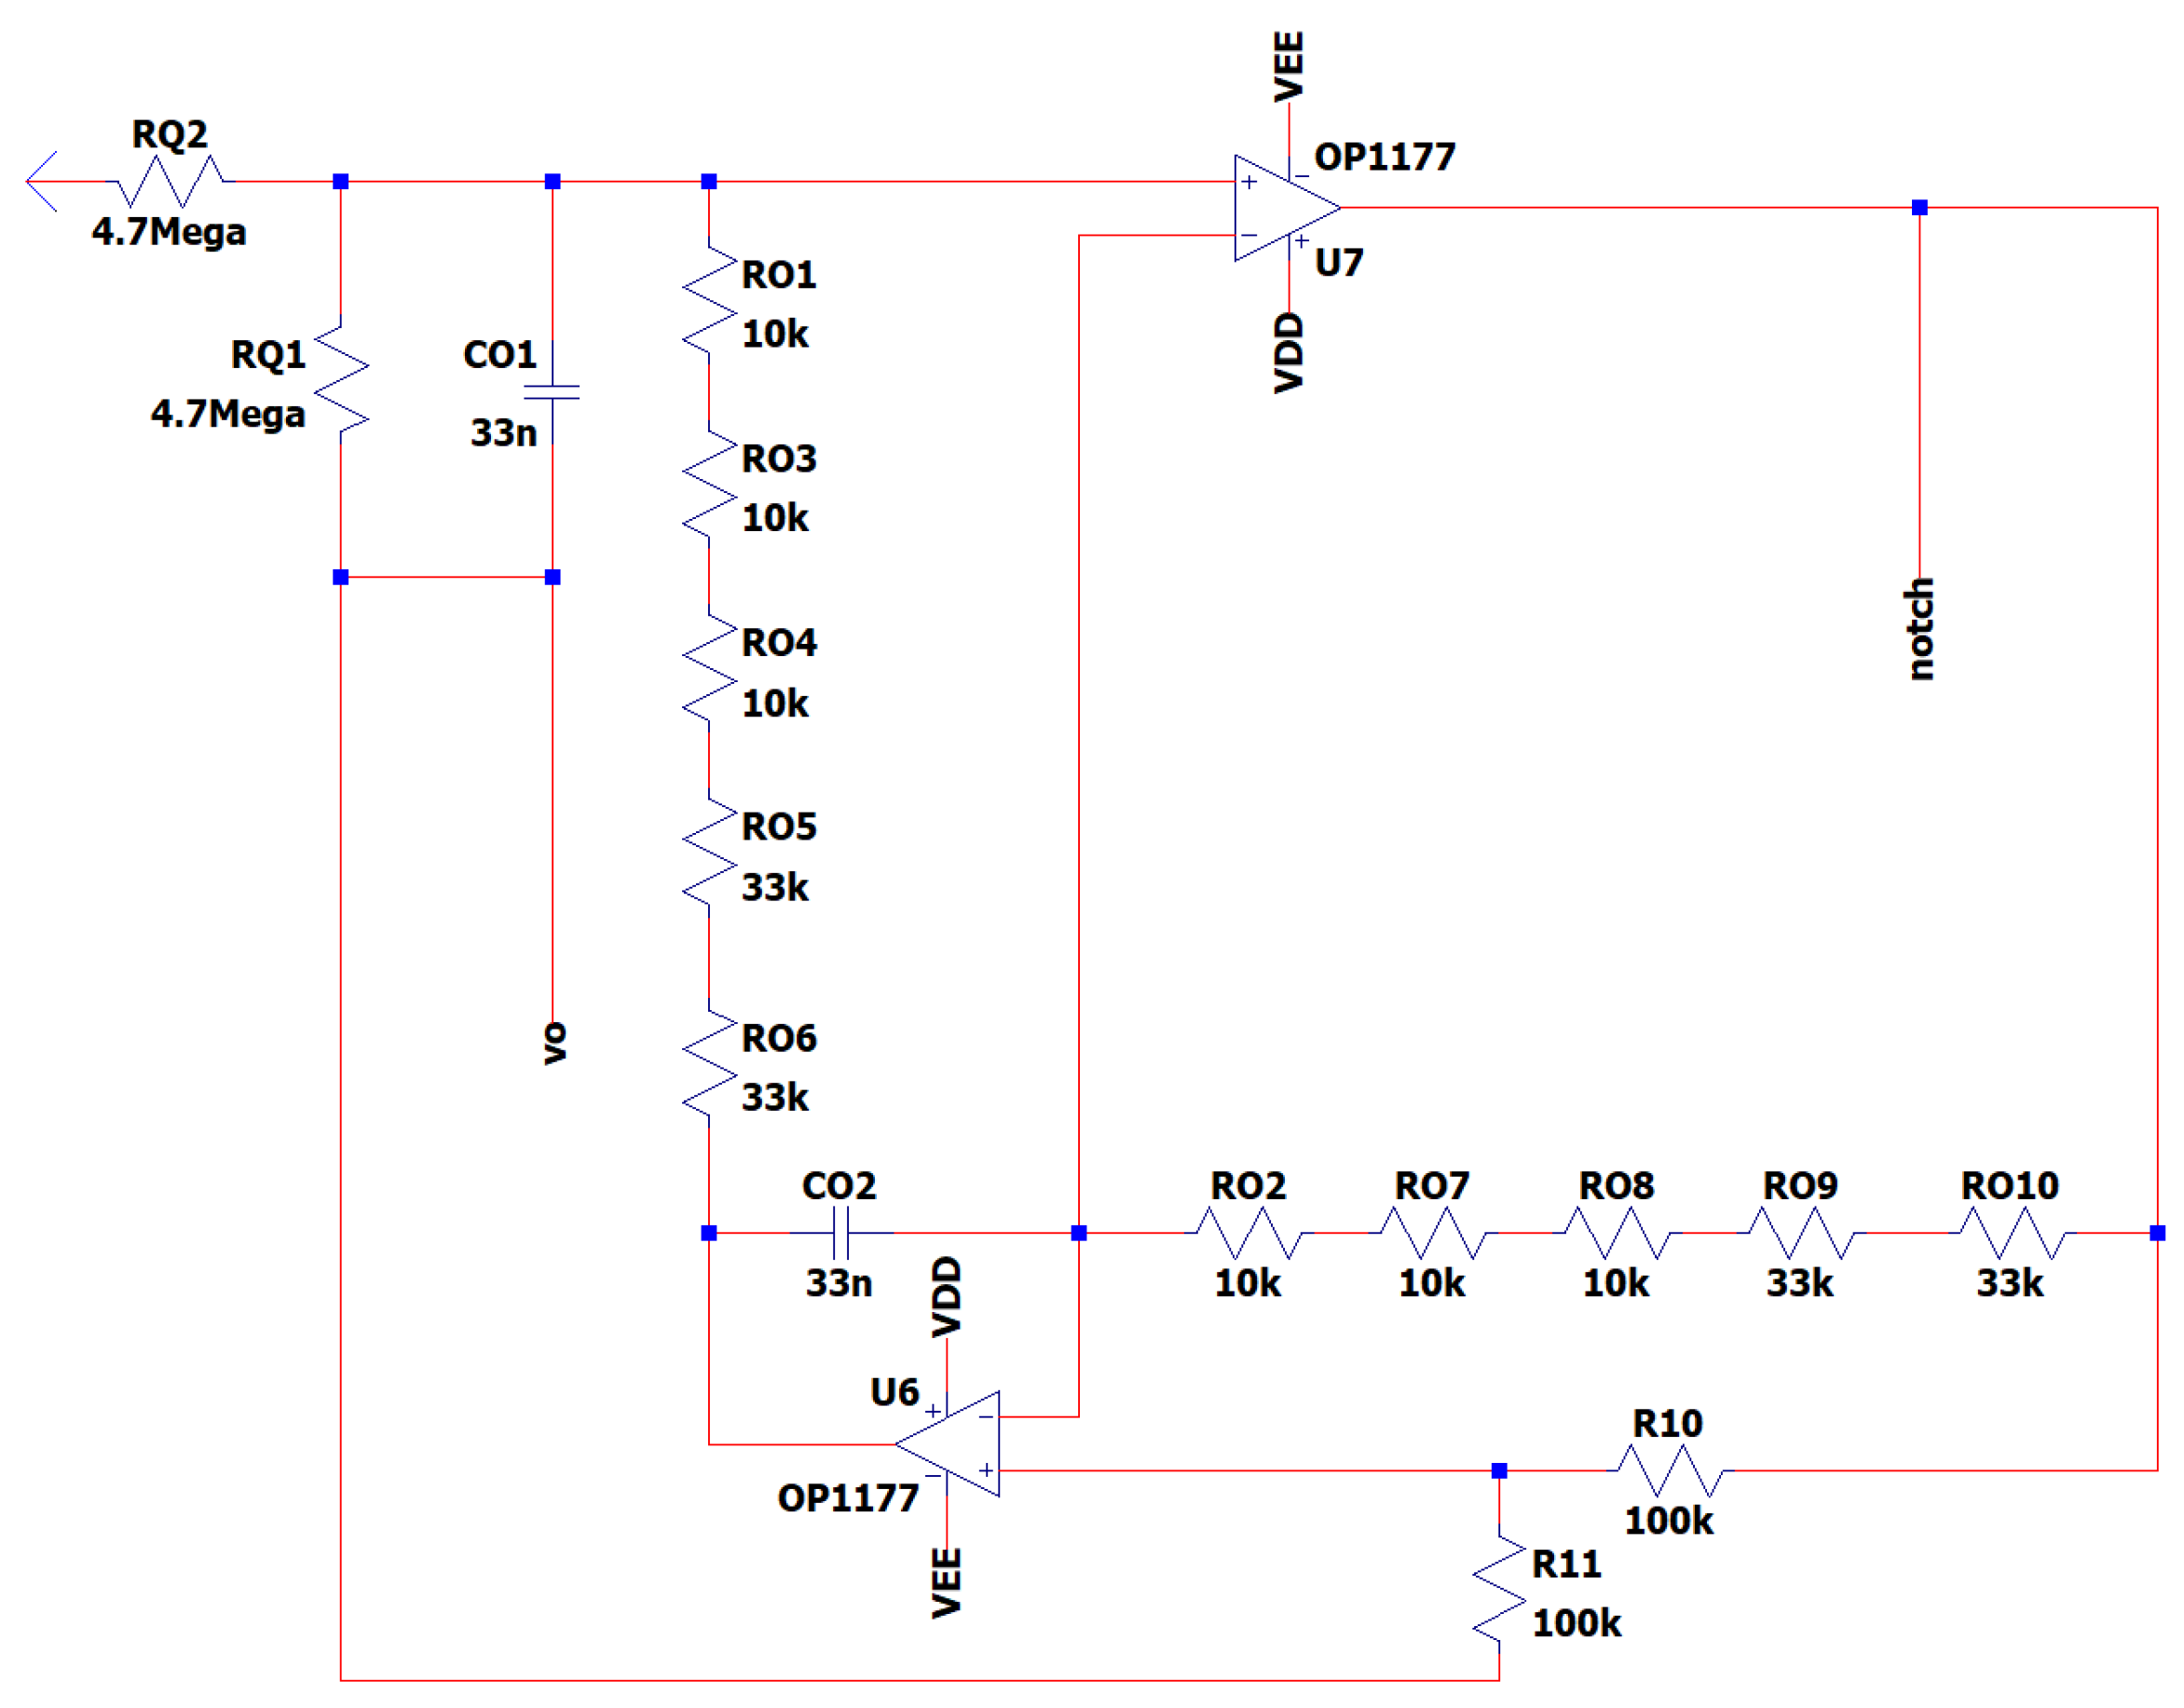
Figure 14.
EEG Sub-Circuit Modeling the Second Low Pass Filter.
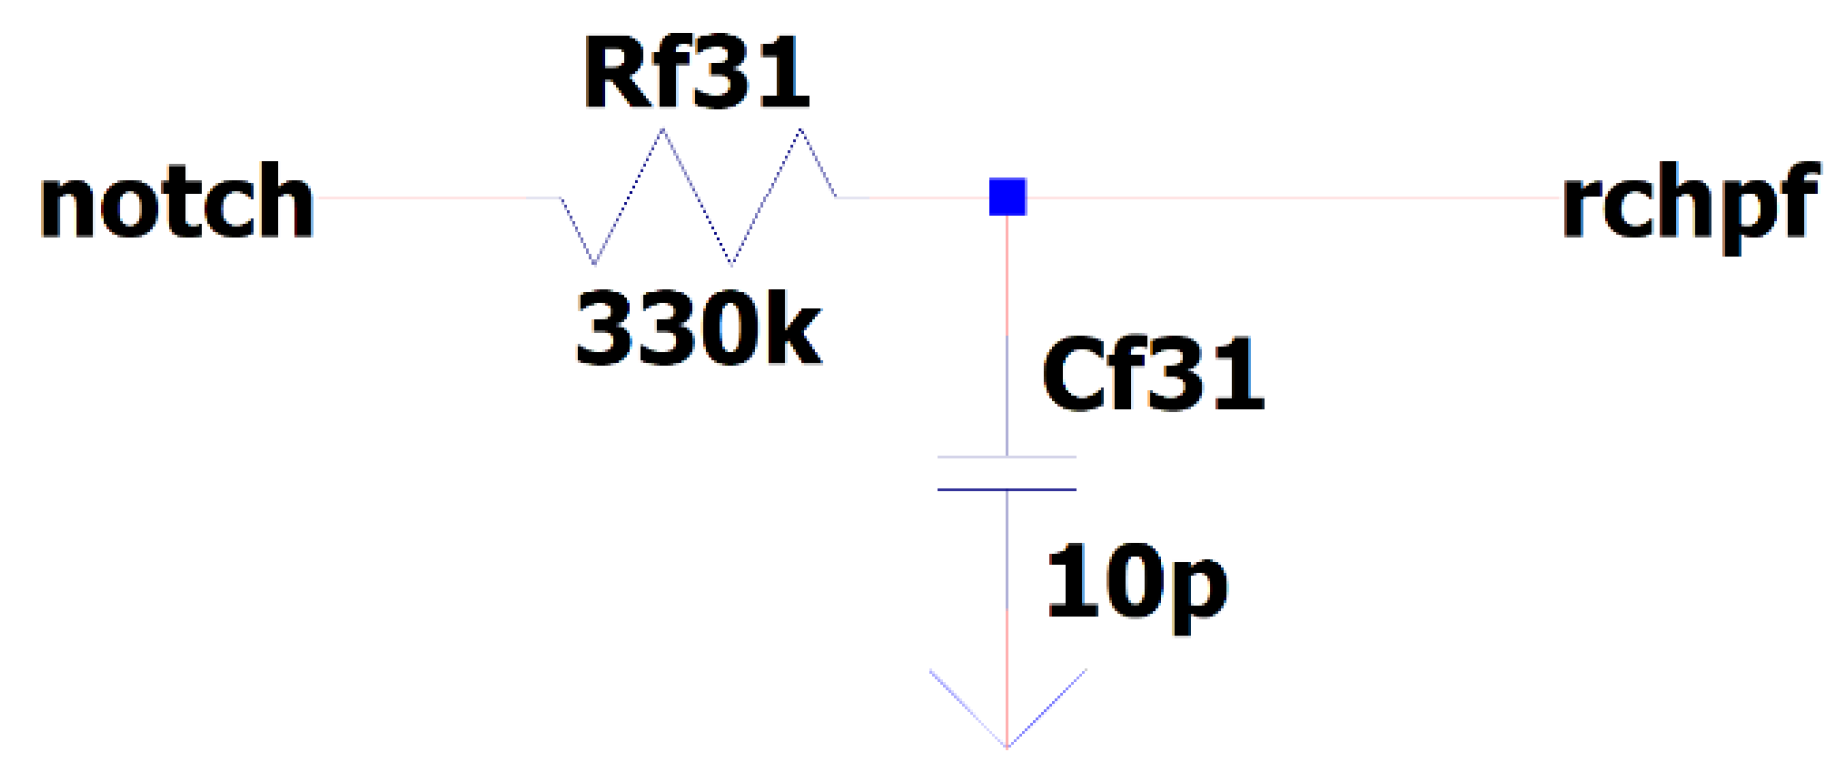
Figure 15.
EEG Sub-Circuit Modeling the Second High Pass Filter.
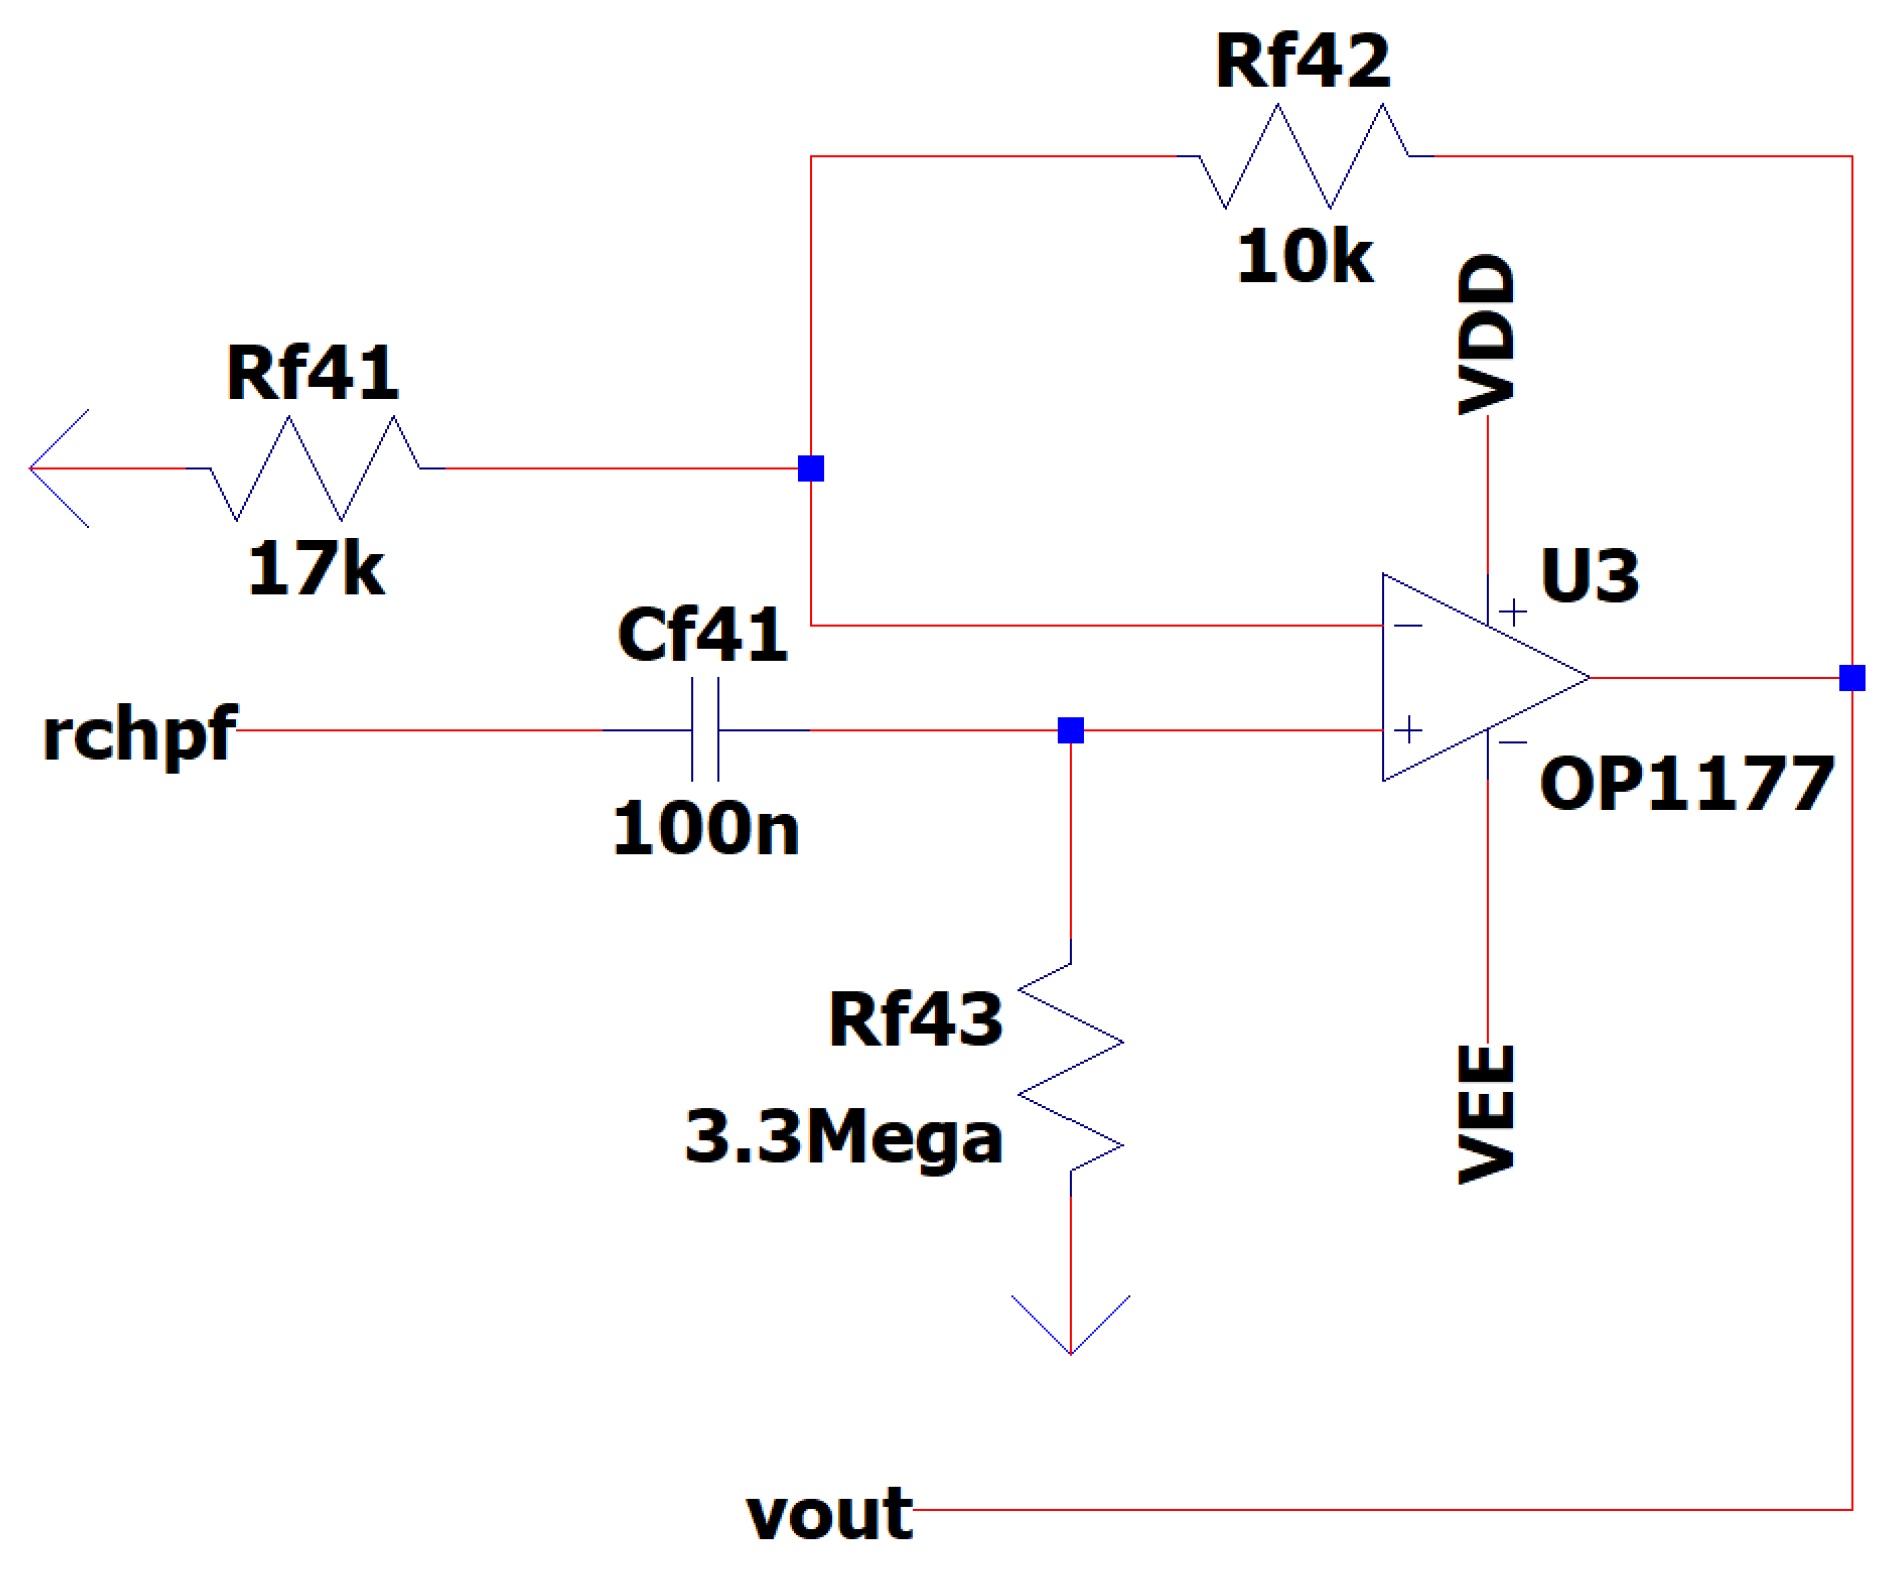
Figure 17.
Time response of the simulation. Waveforms: Raw EEG Channel 1 signal – Purple, Raw EEG reference channel signal – Gold, Ground truth EEG signal - Red, Output of the EEG circuit – Blue.
Figure 17.
Time response of the simulation. Waveforms: Raw EEG Channel 1 signal – Purple, Raw EEG reference channel signal – Gold, Ground truth EEG signal - Red, Output of the EEG circuit – Blue.
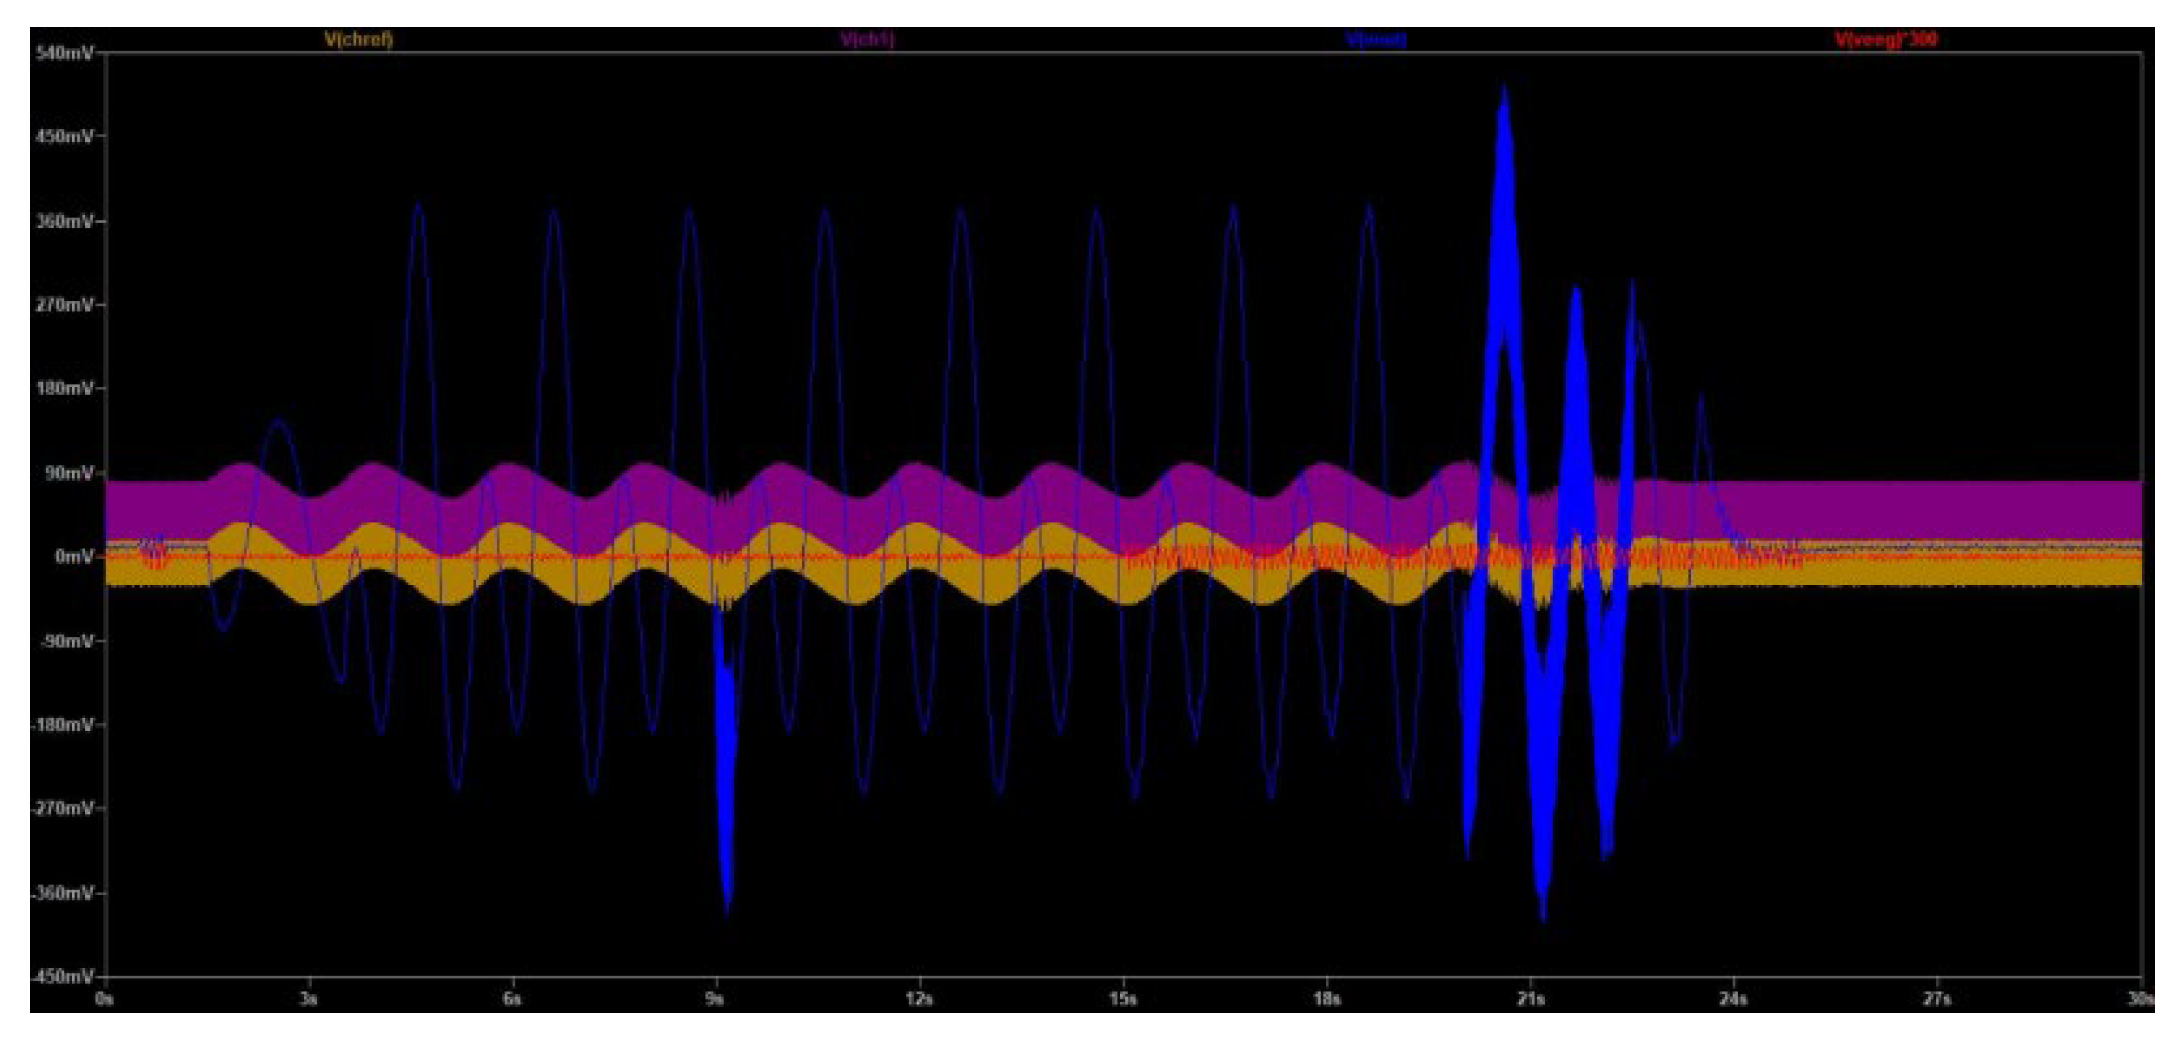
Figure 18.
T Frequency response of the simulation (in a range from 4 Hz to 30 Hz). Waveforms: Raw EEG channel 1 signal - Blue, Raw EEG reference channel signal - Green, Ground truth EEG signal - Pink, Output of the EEG circuit - Cyan, Output of the instrumentation amplifier - Red.
Figure 18.
T Frequency response of the simulation (in a range from 4 Hz to 30 Hz). Waveforms: Raw EEG channel 1 signal - Blue, Raw EEG reference channel signal - Green, Ground truth EEG signal - Pink, Output of the EEG circuit - Cyan, Output of the instrumentation amplifier - Red.
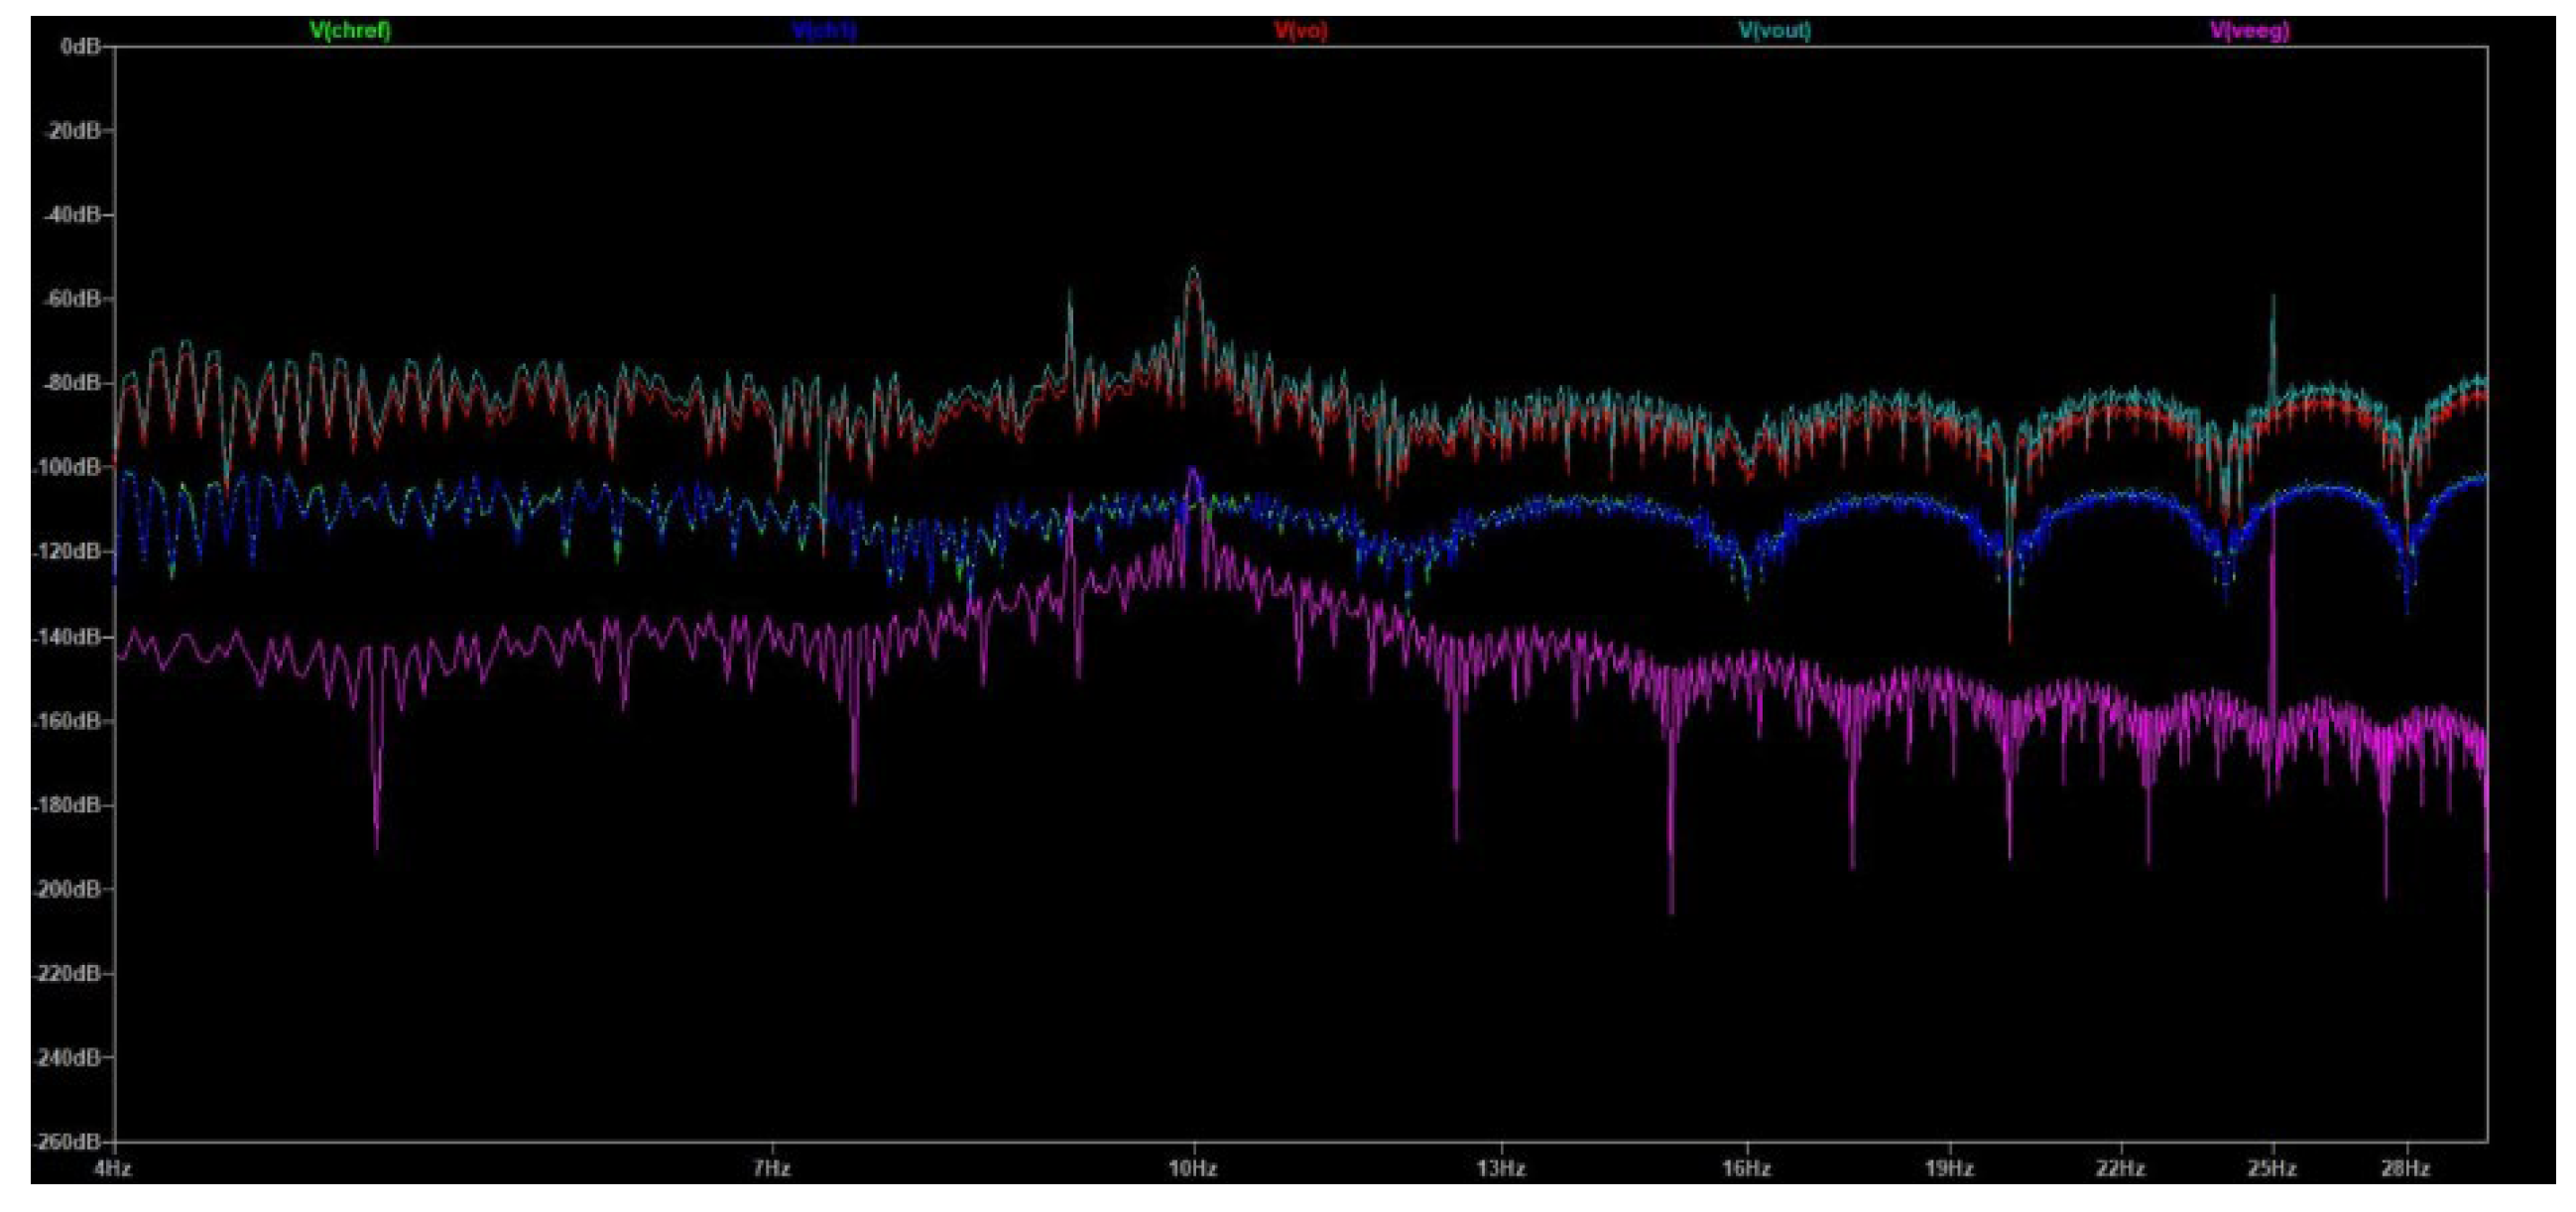
Figure 19.
Frequency response of the simulation (in a range from 10mHz to 3kHz). Waveforms: Raw EEG channel 1 signal - Blue, Raw EEG reference channel signal – Green, Ground truth EEG signal - Pink, Output of the EEG circuit - Cyan, Output of the instrumentation amplifier – Red.
Figure 19.
Frequency response of the simulation (in a range from 10mHz to 3kHz). Waveforms: Raw EEG channel 1 signal - Blue, Raw EEG reference channel signal – Green, Ground truth EEG signal - Pink, Output of the EEG circuit - Cyan, Output of the instrumentation amplifier – Red.
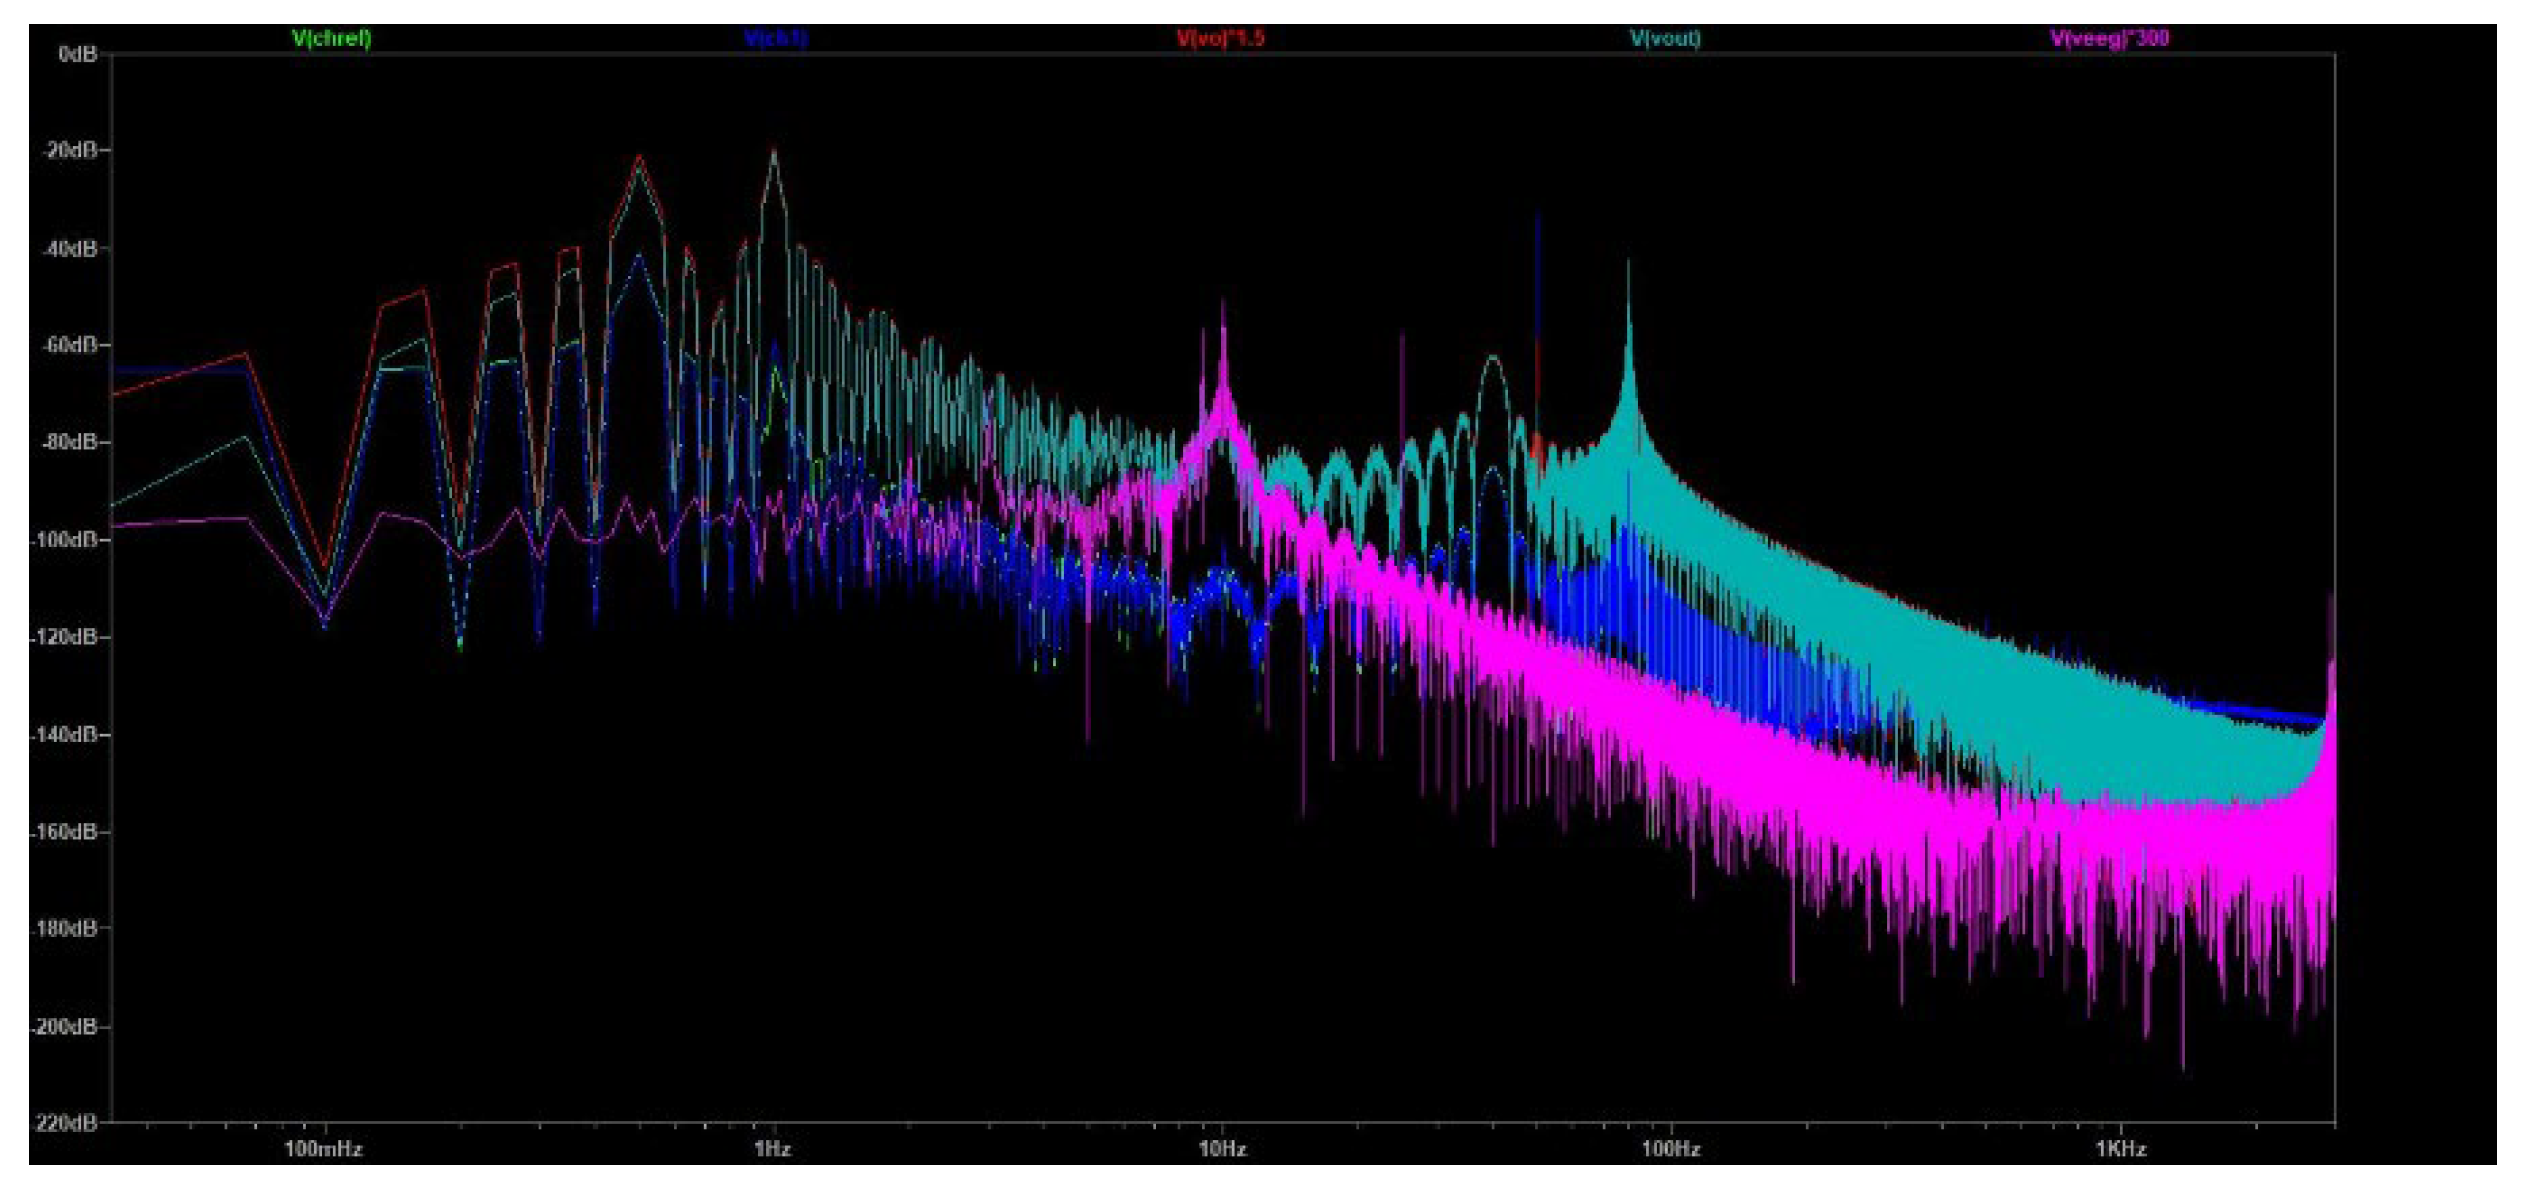
Table 1.
EEG Signals Categorization by Significance and Key Topics.
| Frequency Band | Significance | Key Topics |
|---|---|---|
| Delta (0.5-4 Hz) | Deep Sleep, Unconsciousness | Basics and Beyond, Significance in Sleep and Memory, Methods, and Applications |
| Theta (4-8 Hz) | Creativity, Meditation, Drowsiness | Bridging Consciousness, Thalamic Origins, Practical Insights |
| Alpha (8-13 Hz) | Relaxation, Calmness, Decreased Attention | Indicators of Visual Activation, Enhancing Techniques and Benefits |
| Beta (13-30 Hz) | Active Thinking, Focus, Anxiety | Association with Alertness, Analysis to Application |
| Gamma (30-100 Hz) | Higher Mental Activity, Perception, Consciousness |
Cognitive Functions, Exploring High-Frequency Bands |
Table 2.
Noise Interference in EEG Signal Acquisition.
| Type of Noise | Frequency Range | Source/Characteristics | Impact on EEG Signal | Mitigation Measures |
|---|---|---|---|---|
| Hardware Noise (DC) | 0 Hz (DC) | Originates from wiring and electrical components of the recording system | Values up to a few μV | Use of special gear for noise reduction/isolation |
| Muscle Noise | 0-200 Hz (1-50 Hz most impactful) |
Caused by muscle activity, including minor movements like eye blinking |
Values may exceed 100 mV |
Careful electrode installation, skilled operators for reduction |
| Motion, Breath, Sweat and Cardiac Noise | 0-1.2 Hz | Due to normal physical activities |
Values may reach 10-80 μV |
Proper installation and setup |
| Eye Motion & Electromagnetic Field Noise | 0-16 Hz | Eye motion and intensity of electromagnetic fields | Values between 50-100 μV |
Correct electrode placement, skilled operators |
| Electromagnetic Interference (EMI) & Circuit Noise | 50 Hz (e.g. Greece), 60 Hz (e.g. USA) |
From electrical power lines and nearby electronic devices | Significant distortion possible |
Use of special filters for isolation |
Table 3.
Components involved in EEG Circuits Design (Generic).
| Category | Subcomponent | Function Description |
|---|---|---|
| Filter | Notch Filter | Eliminates power line interference, typically at 50 or 60 Hz. |
| Anti-Aliasing Filter | Prevents aliasing by removing high-frequency components before analog-to-digital conversion. | |
| High Pass Filter | Removes low-frequency components, typically below 0.1 Hz. | |
| Low Pass Filter | Cuts off frequencies higher than a certain threshold to remove high-frequency noise. | |
| Circuit | Chopper Circuit | Reduces low-frequency noise and drift in DC amplifiers by modulating and demodulating the input signal. |
| ESD Protection Circuit | Protects sensitive EEG electronics from static electricity. | |
| Amplifier | Operational Amplifier (Op-Amp) |
Amplifies the EEG signal with high gain and stability. |
| Programmable Gain Amplifier | Allows for adjustment of the amplification level of the EEG signal. |
|
| Instrumentation Amplifier with ntegrated Filter |
Provides high input impedance, and low noise, and includes integrated filters for signal conditioning. | |
| Other Subcomponents | Analog Mux (Multiplexer) | Selects one of several input signals and forwards it into a single line in multi-channel EEG systems. |
| Analog to Digital Converter (ADC) | Converts the analog EEG signal into a digital format for processing and analysis. |
|
| Drive Right Leg Circuit | Reduces common-mode interference in biopotential amplifiers. |
Table 4.
Comparison of the Key Technical Aspects of Medical-Grade & Research-Grade EEG Circuits.
| Aspect | Medical-Grade EEG | Research-Grade EEG |
|---|---|---|
| Accuracy and Resolution | Higher accuracy and resolution for diagnostic purposes | Slightly lower resolution, suitable for studying brain patterns |
| Number of Electrodes | Higher number, standardized layouts (e.g., 10-20 system) |
Fewer electrodes, focusing on specific brain regions |
| Signal Quality and Noise Reduction | Advanced noise reduction for highly accurate readings | Noise reduction present, but may prioritize flexibility in analysis |
| Regulatory Compliance and Certification | Must meet strict regulatory standards (e.g., FDA approval) |
Not subjected to the same level of regulatory scrutiny |
| Durability and Robustness | Designed for frequent and sustained use, more durable | May not be as durable, focuses on flexibility for research |
Table 5.
Comparison of the Key Technical Aspects of Medical-Grade & Research-Grade EEG Circuits.
| Common Mode Rejection Ratio (CMRR) | Circuit Bandwidth | Signal Quality | Common Mode Rejection Ratio (CMRR) |
|---|---|---|---|
| >120 dB | 0.3 to 40 Hz |
|
|
Table 6.
Requirements and specifications in battery-powered, low-noise EEG amplifier system (Case ’’2’’).
Table 6.
Requirements and specifications in battery-powered, low-noise EEG amplifier system (Case ’’2’’).
| Common Mode Rejection Ratio (CMRR) | Circuit Bandwidth | Signal Quality | Common Mode Rejection Ratio (CMRR) |
|---|---|---|---|
| 140 dB | 3.5 MHz |
|
|
Table 7.
Requirements and specifications in Double Notch Filter Circuit Design of EEG (Case ’’3’’).
| Common Mode Rejection Ratio (CMRR) | Circuit Bandwidth | Signal Quality | Common Mode Rejection Ratio (CMRR) |
|---|---|---|---|
| Estimated at 110 dB | 0.5 to 33.86 Hz |
|
|
Table 8.
Requirements and specifications in the Novel Proposed EEG.
| Common Mode Rejection Ratio (CMRR) | Circuit Bandwidth | Signal Quality | Common Mode Rejection Ratio (CMRR) |
|---|---|---|---|
| Greater than 90 dB | 0.5 Hz to 20 kHz |
|
|
Table 9.
Requirements and Specifications results comparison of the performed simulations.
| Requirements/ Specifications | Case ‘’1’’ | Case ‘’2’’ | Case ‘’3’’ | Proposed Circuit EEG Design |
|---|---|---|---|---|
| Common Mode Rejection Ratio (CMRR) | >120 dB | 140 dB | Estimated at 110 dB | Greater than 90 dB below 110Hz |
| Circuit Bandwidth | 0.3 to 40 Hz | 3.5 MHz | 0.5 to 33.86 Hz | 0.5 Hz to 48kHz min (0.5 Hz to 21kHz min 0 dB passband) |
| Signal Quality (Gain and Noise) |
|
|
|
|
Table 10.
Examination of Cases Limitations and Proposed Design Innovations.
| Circuits Comparison |
Case ‘’1’’ Limitation |
Case ‘’2’’ Limitation |
Case ‘’3’’ Limitation |
Proposed Circuit EEG Design Innovation |
|---|---|---|---|---|
| Point of interest |
|
|
|
|
|
|
|
|
|
|
|
|
|
|
|
|
|
|
|
|
|
|
|
Disclaimer/Publisher’s Note: The statements, opinions and data contained in all publications are solely those of the individual author(s) and contributor(s) and not of MDPI and/or the editor(s). MDPI and/or the editor(s) disclaim responsibility for any injury to people or property resulting from any ideas, methods, instructions, or products referred to in the content. |
© 2024 by the authors. Licensee MDPI, Basel, Switzerland. This article is an open access article distributed under the terms and conditions of the Creative Commons Attribution (CC BY) license (http://creativecommons.org/licenses/by/4.0/).
Copyright: This open access article is published under a Creative Commons CC BY 4.0 license, which permit the free download, distribution, and reuse, provided that the author and preprint are cited in any reuse.


