Submitted:
27 April 2024
Posted:
29 April 2024
You are already at the latest version
Abstract
Food insecurity is a multidimensional concept adequately challenging not only the complex operationalization effort but also judgments of who is food secure and who is not. This study aimed to assess the level of household food insecurity in the study area. Both probability and non-probability sampling procedures were employed to draw the 367 respondents, key informants, and focus group discussants. The Consolidated Approach for Reportig Indicators (CARI) console model was constructed with four indicators: Food consumption score, Food energy shortfall, Food expenditure share, and Livelihood asset depletion. Descriptive statistics was used to analyze data in the models. The CARI result revealed that 41.1%, 9.3%, 20.4% and 29.2% of households were food secure, marginally food secure, moderately food insecure and severely food insecure, respectively. The overall prevalence showed that 49.6% households were food insecure and 50.4% were food secure. Moreover, female-headed households and households living the Belg and CHV livelihood zones were more food insecure than their counterparts. The study concluded that the problem of food insecurity is pervasive in the study area in general and Belg and CHV livelihood zones, in particular. Therefore, more attention and intervention should be given by policymakers and concerned development partners to alleviate the problem.
Keywords:
Livelihood zone
; Households
; Food insecurity status
; South wollo
1. Introduction
Food security is a multidimensional concept sufficiently challenging not only the multifaceted operationalization effort but also decisions of who is food secure and who is not [1,2]. Food security, at the global, regional, national, household, and individual levels, is achieved ‘when all people, at all times, have physical and economic access to sufficient, safe and healthy food that meets their nutritional requirements and food preferences for an active and healthy life [3]. However, food insecurity exists when a household does not have enough physical, social, and economic access to sufficient, safe, and nutritious food to meet the dietary needs and food favourites of its members to have an active and healthy life [4]. Due to its complex concepts, direct measurement is difficult, and thus a variety of proxy measures such as consumption and expenditure, nutritional status, and coping strategies are frequently used measures of food security [5].
The latest Global Report on Food Crisis (GRFC) revealed that about 258 million people in the world faced high levels of acute food insecurity and required urgent food assistance in 58 countries in 2022 [6]. This was the highest record of GRFC in seven years’ record. The proportion of the world population facing chronic hunger in 2022 was about 9.2% compared with 7.9% in 2019 [6]. The Food and Agriculture Organization (FAO) estimates that between, 691 and 783 million people will be affected by hunger globally in 2022 [7]. Likewise, as a result of the pandemic, about 49 million people in the world have entered into poverty situations in 2020 [8]. Moreover, in 2022, 27.8% of women and 25.4% of men globally experienced moderate or severe food insecurity [7].
The proportion of the population facing hunger in Africa is much larger compared with the other regions as 20% of the population was facing hunger in Africa in 2022 compared with 8.5% in Asia, 6.5% in Latin America and the Caribbean, and 7.0% in Oceania [9]. About 44.4% of undernourished people in the continent live in Eastern Africa, 26.7% in Western Africa, 20.3%t in Central Africa, 6.2% in Northern Africa, and 2.4% in Southern Africa [10]. In sub-Saharan Africa (SSA), it is projected to rise the number of food-insecure populations from about 254 million in 2013 to 373 million in 2023 (Meade et al., 2013 cited in Tizazu and Menberu [11]. Besides, more than 9.5 million people were displaced internally in 2020, mainly in Sudan, Somalia, Ethiopia, and South Sudan and the region hosted over 4.4 million refugees [12]. Conflict, drought, climate variability and extremes, and economic slowdowns and downturns are the basic drivers in East Africa which raised the level of acute food insecurity by nearly 56.85 million people in eight countries in 2022 [9,10].
Food insecurity is an enduring, critical challenge in Ethiopia which is the second most populous country in Africa after Nigeria with about 123 million people in 2022 [13]. Over 73% of the Ethiopian population live in rural areas and depend on rain-fed agriculture which makes them extremely vulnerable to changes in weather conditions [5,13]. Hence, the scale and severity of food insecurity remain among the worst globally [14]. The number of people facing high levels of acute food insecurity in Ethiopia reached 23.6 million in 2022 [6]. Reviewed studies revealed that more than 35% of its population is chronically undernourished Bezu [15], and 64% of the households in the country are food insecure [16]. As the national survey result, the percentage of food-insecure households never shows a decline in the Ethiopian population, food insecurity continued to be a problem [17].
The Ethiopian people have experienced long periods of food insecurity that might be attributed to several factors. Population growth, occasional droughts, erratic and insufficient rainfall, lack of advanced technology, land degradation, and extended conflict which essentially affects food and fuel prices are still problems in the country [16,18,19]. Likewise, the conflict in Tigray and adjacent areas of Amhara and Afar regions has led to high levels of acute food insecurity, widespread displacement, limited access to services and the destruction of the local economy and Shortages of inputs enhanced the severity of food insecurity [6].
South Wollo, where the study is located, the food security problem is severe due to a high population density, small landholdings per household, heavy dependence on summer rainfall, which is very erratic, and declining soil fertility. According to Mohammed, Yimer [20], the study area can be considered a drought-prone area. Many people in different locations are dependent on food aid as a result of the structural food deficit they are experiencing [21]. Although there have been various studies conducted on the issues of food insecurity in different parts of Ethiopia, many of them employed a single indicator to measure the food insecurity status which could capture only a portion of the whole situation. For instance, Motbainor, Worku [22] and Yehuala, Melak [23] in East Gojjam zones and North Gondar employed Kcal; Tizazu and Menberu [11] and Abdulla [24] in Lay Gayint Woreda and Bule-hora district used Core Food Security Module(CFSM); Endris, Destaw [25] in Tehuledere Woreda used Households Food Insecurity Access Scale (HFIAS), and Mitiku, Fufa [26] in Moyale employed Foster-Greer- Thorbecke (FGT) model. However, the current study utilized multiple food security indicators so that the situation could be understood comprehensively [27]. A Consolidated Approach to Reporting Indicators (CARI) guidelines based on food consumption score/FCS/ and food energy shortfall (Kcal) indicators to measure current status and livelihood coping strategy and the food expenditure share indicators to measure coping capacity. Moreover, to the best of the researchers’ knowledge, there are no studies done examining the Status of food insecurity at the household level in Southern Wollo, at zonal level based on livelihood zone. Therefore, this study was conducted to fill these gaps by sharing vigorous empirical evidence on the status of food insecurity.
The general objective of this study was to examine the Status of food insecurity at the household level in the North-Eastern Highlands of Ethiopia. The specific objectives include (i) Measuring the food insecurity status of households with different indicators (ii) Investigating the food security situations across livelihood zones, and different households’ characteristics.
2. Materials and Methods
2.1. Description of the Study Area
South Wollo, one of the eleven administrative zones of Ethiopia's Amhara National Regional States, is situated between latitudes 10010′ N and 11041′ N and longitudes 380 28′ E and 4005′ E (Figure 1). The Zone is comprised of 19 rural districts and four administrative towns (Haik, Dessie, Mekaneselam and Kombolcha) with a total size of approximately 18,157.48 km2. Bush-lands, grazing land, arable land, forests, and other areas (such as bare land, buildings, and water bodies) make up 18.3, 31.9, 36.3, and 13.5% of the total area, respectively [28].
The South Wollo zone has a very diverse and split topography, which is made up of rocky terrain with steep hills. According to Agidew [29], the elevation ranges from 927 meters in the east (over the dry plain/Arabati) to 4261 meters in the west (Mount Ambaferit) above mean sea level. But the mainland characteristic of South Wollo is its highland regions, which are located between 1,500 and 3,500 meters above sea level [28]. The research area experiences unique climate variations when considering the vertices of the land features, ranging from hot and arid lowlands in the eastern portion of the zone to cold and humid highlands in the western part (Figure 1). Six livelihood zones made up the study area: Meher-Belg, Belg, Abay-Beshilo Basin (ABB), South Wollo and Oromia eastern lowland sorghum and cattle(SWS), Chefa Valley (CHV), and Meher [30].
The mean annual temperature ranges from 5°C in the western highlands to 22°C in the eastern lowlands [5]. The yearly precipitation varies from 1000 mm in the western region to 1200 mm in the eastern region. The research area has a bimodal rainfall pattern that results in two harvest periods: a shorter spring (March-May) and a longer summer (June–August). Mid-latitude and high-latitude regions are greatly influenced by springtime, while midland and low-land regions mostly rely on summer precipitation. Crop production is rain-fed, except for a few pocket locations where small-scale irrigation is used.
Because of the incredibly rough terrain, erosion is a major issue in the research region. Native trees are severely damaged and degraded, yet they are notably abundant in eucalyptus plantations. The western highland regions of the research area are home to alpine species that are exclusive to extremely highland regions. Subsistence farming is the main source of income for the local population. In contrast to other regions of East Africa, where highlands are typically the most food-secure parts of a nation, this is frequently not the case in Ethiopia. One of the most famine-prone regions in the nation is the congested, steeply sloped highlands over 2000 meters, which includes a sizable portion of South Wollo [31]
Based on the estimation of the South Wollo Zone Plan Commission [32], the zone has a total population of nearly 3,132,062 in 2022, of whom 1,591,232 (51%) are males and 1,540,830 (49%) are females [32]. The zone is one of the densely populated areas of the country with a density of 171 persons per km2 though the population density varies within the zone. Out of the total population, 2,711,555 (86.6%) were residing in rural areas while the remaining 420,507 (13.4%) lived in urban areas. The majority of the population 1,735,261 (55.4%) is aged between 15 and 64 years, while the inactive dependent population (less than 15 and above 64 years of age) comprises 1,208,751 (38.6%) and 188,050 (6%), respectively [32]. Based on the age group categorization, the overall dependency ratio is about 0.80. i.e. for every 100 working-age people, there are 80 inactive dependents [32].
Agriculture, manufacturing, and service sectors are the main sources of economic activity in the South Wollo zone. Agriculture and livestock production are the primary sources of income for the community in the zone. A mixed farming system is the main farming system in the zone, just like in other parts of the Ethiopian highlands. Labor wages, small businesses, weaving, and local drink trading are also sources of income for a small portion of the community [33]. Besides, the sale of small livestock, productive assets like pack animals and oxen, and seasonal migration are ways to cope with stress [34].
2.2. Research Methodology
Research design in this study, the pragmatism paradigm research Philosophy that advocates the use of mixed research methods was employed. Within the scope of a single study, pragmatics can incorporate both positivist and interpretivism viewpoints. When quantitative and qualitative methods are used in combination, complement each other and allow a more complete analysis [35]. The study employed a concurrent mixed methods research design based on a cross-sectional descriptive survey on one-time socioeconomic data. A mixed-methods design is useful to capture the best of both quantitative and qualitative approaches on which the researcher bases the inquiry [36,37]. In this study, the mixed method was applied as it enabled the researchers to broaden their investigation with adequate depth and breadth, and can produce a holistic picture that allows for complementary or divergent views and triangulation of the findings.
- Sampling Techniques and Sample size Determination
In this study, both probability and non-probability sampling methods were applied. Specifically, the study employed multi-stage sampling techniques to select the respondents to fill out the questionnaire. To begin with, the study area South Wollo Zone was purposely selected based on the following rationale: First, the Northeastern highlands of Ethiopia, where the present study was specifically located could be considered the epicenter of food insecurity as a result of climate variability, climate extremes such as frequent drought and continuous conflict. The South Wollo Zone, situated in the northern highlands of the country, could be more vulnerable to severe drought conditions due to increased temperatures and reduced rainfall [38]. Second, this study investigated the rural households’ food insecurity status based on the Consolidated Approach to Reporting Indicators (CARI) console model as earlier studies conducted within and around the study area did not emphasize. Third, the principal investigator is familiar with the study area which helps to investigate the issue at in-depth.
The study employed a combination of stratified, simple-random, and systematic sampling techniques. The study area was classified into six livelihood zones (strata) based on stratified sampling and hence each group of livelihood zones formed the stratum for sampling. Next, a simple random sampling technique was utilized to select six sample kebele administrations one from each stratum. The sample kebeles were Maskeraba, Ketetaye, Abahilme, Fito, Hamusit, and Yaya from ABB, SWS, CHV, Meher-Belg, Belg, and Meher the livelihood zones respectively. On top of this, the total sampling frame was 8528 rural household heads in the six sample kebeles. The sample size was determined based on the Yemen (1964) formula.
Where: n=Sample size
N= total number of households=8528
e= Maximum margin of sample error (0.05) at 95% confidence interval
Based on the formula, 382 households were determined to fill out the questionnaire. Besides, the sample size to be taken from each Keble was determined using the proportional stratified sampling method (Table 1). Finally, rural household heads were the sampling units that were selected using a systematic random sampling method based on their list from the respective Kebele administrations.
Furthermore, a purposive sampling technique was employed for qualitative data to recruit participants who can provide in-depth and detailed information about the food insecurity situation at the household level, kebele level, district level, and zonal level. The purposive sampling method is a non-probability sampling in which decisions regarding the individuals to be included in the sample are taken by the researcher, based upon a variety of criteria [39]. Hence, six Kebele-level agricultural developmental agent officers, six community leaders, four district-level food security officers, and one zonal-level food security officer, a total of 17 key informants participated in the interview. Six focus group discussant groups with community leaders, elder people, women’s association leaders, youth association leaders, female-headed household heads, and religious leaders having six to seven members per FGD at each sample.
2.2.1. Data Sources and Data Collection Techniques
Both primary and secondary data sources were utilized in this study. Primary data sources include survey respondents, focus group discussion participants, key informants, and observation. Secondary data sources include internet sources, reports of different administrative levels, reports of the Central Statistical Authority (CSA), and unpublished sources. The survey questionnaire, KI interview, FGD, and observation were data collection instruments. Using a survey questionnaire, data were collected from HH heads using a planned schedule. The survey questionnaires were constructed to acquire questions related to sample households’ food expenditures, socioeconomic conditions, livelihood coping strategies, resource ownership, sources of income, loans, and incidences of drought. Qualitative information from FGD and key informant interviews were also conducted to enrich the results of the survey. Unstructured interview guide checklists were prepared to frame the interview focused on the objectives of the study and allow interviewees flexibility to talk freely. The interview covered issues such as the food security situation of households, source of foods and common foodstuffs taken, farming practices of households, livelihood coping strategies to food insecurity shocks, and causes of drought and food insecurity. The FGD was handled using developed unstructured questions as a guide. One FGD was conducted at each selected livelihood zone kebele to investigate households’ food security status, drought events, causes of food insecurity, food aid, food and non-food expenditures, and livelihood coping strategies. Using observation, the researcher recorded relevant data using observation checklists through transcribing in written form and taking relevant photographs. The data was acquired from the interview and FGD by transcribing in a written form and recording by mobile phone.
2.2.2. Data Analysis Techniques
For this study, both qualitative and quantitative data analysis methods were employed. The qualitative data were analysed using thematic analysis. Thematic analysis is an appropriate method of analysis to understand experiences and thoughts and is flexible to be used within a wide range of theoretical and epistemological frameworks across a data set [40,41]. Therefore, the themes created were deforestation, diminishing land size, decreasing crop production, beekeeping, lack of farm inputs, conflict, and the lack of oxen, infrastructure problems, a decrease in rainfall, and an increase in temperature.
Quantitative data sets were coded and entered into SPSS-version 20 (due to its quality for data management) and exported into STATA-version 14 (due to its quality for executing and using statistical models), and MS-Excel was employed to calculate indexes. Both descriptive and inferential statistics were employed in this study to analyze quantitative data. To summarize and describe data in percentages and frequencies, descriptive statistics were utilized, whereas inferential statistics were utilized to generalize the sample to the larger population in the study area.
This study employed the Consolidated Approach to Reporting Indicators of Food Security (CARI) guidelines developed by the World Food Programme in 2015 for the analysis of food security status WFP [42]. The CARI is a harmonized WFP technique used to classify individual households according to their level of food security based on analysis of primary data from a single household’s food security survey [43]. This new approach combines food security indicators systematically and transparently, which are consistent with internationally accepted food security concepts, whereby households are classified into four descriptive groups: food secure, marginally food secure, moderately food insecure, and severely food insecure. CARI combines current household food access indicators with measures of household coping capacity such as economic vulnerability and asset depletion to determine the food insecurity level of a given population [43]. In this study, the current status domain/CS/ employed food security indicators measure the adequacy of households’ current food consumption. Specifically, this domain is based on the food consumption score/FCS/ and food energy shortfall (Kcal) indicators.
Whereas, the coping capacity domain /CC/ employed indicators measure households’ economic vulnerability and asset depletion which was a combination of the livelihood coping strategy indicator and the food expenditure share indicator (Figure 2). In this study, the development of the CARI console index comprises the following relevant food security indicators:
- a)
- Food Consumption Score (FCS)
This is an index that was established by the World Food Program (WFP) in 1996. The WFP uses the FCS as part of its Comprehensive Food Security & Vulnerability Analysis (CFSVA) tool to measure food security and vulnerability in crisis-prone residents [44]. This approach is one of the only food security indicators that can be equally collected in many different regions, countries, and settings, though other indicators may be more context-specific [45]. The following equation summarizes the method used in the computation of the FCS.
𝐹𝐶𝑆 𝑖 = ∑(𝑤𝑋𝑗)(𝑓𝑋𝑗𝑖)
Where:
𝐹𝐶𝑆 𝑖 = Food consumption score for household 𝑖
𝑤𝑋𝑗 = Nutrition content-based weight for food group 𝑋𝑗
𝑓𝑋𝑗𝑖 = Frequency of consumption (number of days a food group consumed) of a food group 𝑋𝑗 by a household 𝑖
Based on the relative FCS achieved, households can be classified as having "poor," "borderline," or "acceptable" food consumption by applying the WFP's recommended cut-offs to the food consumption score [46]. The recommended cut-offs are ≤ 21 for the poor, 21.5 to 35 for borderline, and ≥ 35.5 for acceptable consumption groups. Moreover, the FCS is an acceptable proxy indicator to measure caloric intake and diet quality at the household level as an indication of the food security status of the household [47].
Thus, based on FCS, the dietary diversity, food frequency, and food security status of households under study were computed from each of the food items consumed. That means the FCS aggregates household-level data on the diversity and frequency of eight (8) food groups (i.e., staples (cereals, starchy tubers, and roots); pulses (legumes and nuts); vegetables; fruits; meat/fish/egg; milk and dairy products; sugar/sweets; and Oils and fats) consumed with a 7-days recall from survey date. Then weighted based on the relative nutritional value of the consumed food groups. Currently, the recommended weights by Vulnerability Assessment and Mapping and WFP (2008) attached the highest weight to foods with relatively high energy, good quality protein, and a wide range of micro-nutrients that can be easily absorbed (Table 2).
The FCS was translated into a food consumption group (FCG), based on equation 2, where the percentage of households in each of the four groups of food security status was determined. Finally, in the current status dimension of CARI, the 4-point scale indicators were considered (Table 4).
- b)
- Food Energy Shortfall Indicator
It is an important indicator of consumption status and the main indicator of food availability and access dimensions. In this case, kilocalorie intake was used as an input to evaluate the household’s status of food consumption [42]. In this study, households’ dietary energy supply measured in kilocalories (kcal) was used to determine the status of food security at the household level; since it is the single most important indicator of food adequacy level [46]. In the calculation of the kcal intake of the sample households, the amounts of calories available to a household were determined using the adjusted version of the regional food balance model used by Smith and Subandoro [48]. The model is:
Where: HHFA = household food availability; Y = own production; FP = food purchased; FA = food aid; R/G = remittance/gift; S = amount of grain sold; SR = seed reserves (5%); and PHL = post-harvest loss (10%).
Using this indicator, the net yearly calorie available for the household through the consumption of different food groups was calculated. Then, the result was divided by 365 (days of the year) and again divided by the adult equivalent to get the average kcal/p/d for the household. The recommended daily calorie consumption of 2100 kcal/p/d was used to compare the results and determine the consumption category and food security status of the surveyed households. Based on the given thresholds by WFP [42] corresponding to food Secure, marginally food secure, moderately food insecure, and severely food insecure.
According to WFP [42], the calculated daily per capita calorie intake must be converted into the corresponding categories of the 4-point CARI console cut-off points as follows. Classifying households with more than 2100 kilocalories per person per day (kcal/p/d) as ‘Food Secure’ and assigning a value of 1; Taking the Minimum Daily Energy Requirement (MDER) for the country and classify households that achieved less than the national MDER kcal/p/d as ‘severely food insecure’ and assigning a value of 4. Determining the mean of the MDER and 2100 kcal/p/d and Classifying households with kcal/p/d above the mean but below 2100 kcal/p/d as ‘Marginally food secure’, and assigning a value of 2. Finally, Classifying households with a kcal/p/d below the mean but, above MDER as ‘Moderately Food Insecure’ and assign a value of 3 (Table 4).
- c)
- Food Expenditure Share (FES)
This is based on the idea that the greater the importance of food within a household’s overall budget (relative to other consumed items/services) the more economically vulnerable the household [42]. The FES indicator is constructed by dividing the total food expenditures by the total household expenditures. However, an important note is that both the numerator and denominator should include the value of non-purchased foods consumed. The measurement of economic vulnerability was concerned chiefly with how much (proportionately) of the household’s total expenditures, is directed to non-food items [42]. Hence, the indicator is applicable for categorizing households with different food-acquisition patterns. Based on equation 4, the calculated result of the FES was converted to the CARI console 4-point scale. Then, households are classified into four groups according to the percentage of their budget that they spend on food households are divided into four groups according to the percentage of their budget that they spend on food (Table 4).
- d)
- Asset Depletion Indicator (ADI)
The livelihood coping strategies indicator was derived from a series of questions regarding the households' experience with livelihood stress and asset depletion during the 30 days before the survey [42]. Responses were used to understand the stress and insecurity faced by households and describe their capacity to cope with future food shortages. All strategies are classified into three broad groups, including stress, crisis, and emergency strategies [42].
According to the CARI scale(Table 4), households that have employed the stress, crisis, or emergency strategies are categorized as borderline food secure, moderately food insecure, or severely food insecure, respectively, while households that have not used any of the chosen strategies are considered to be food secure.
Stress strategies: such as borrowing money or spending savings are those that indicate a reduced ability to deal with future shocks due to a current reduction in resources or an increase in debts.
Crisis strategies: such as selling productive assets, directly reduce future productivity, including human capital formation.
Emergency strategies: such as selling one's land, affect future productivity but are more difficult to reverse or more dramatic in nature.
Finally, this indicator was calculated from the coping strategies used by households in the 30 days before the survey. According to WFP’s recommendation, a total of 10 strategies (4 stress, 3 crisis, and 3 emergency strategies) were considered according to the local context, using the reference list of livelihood-based coping strategies. In this study, the lists of livelihood-based coping strategies employed are shown in Table 3.
Calculating the overall food security classification of the CARI console
Once all the available food security indicators in the console have been converted to the 4-point scale, the overall food security classification for a household was calculated as:
Accordingly, the individual household (i) food security status is the average of current status and coping capacity domain as:
Finally, round to the nearest whole number (this will always fall between 1 and 4) which represents the household’s overall food security outcome.

Table 4.
Current Status and Coping Capacity Dimensions of the CARI Console.
| Domain | Indicator | Indicator score | ||||
|---|---|---|---|---|---|---|
| 1 | 2 | 3 | 4 | |||
|
Current Status |
Food Consumption Score |
Food Consumption group |
Acceptable Consumption ≥ 35.5 |
NA |
Borderline food Consumption 21.5-35 |
Poor food Consumption 0-21 |
| Food Consumption | Food energy shortfall | Kcal/p/d ≥ 2100 | Kcal/p/d<2100 Kcal/p/d≥ mean (MDER*, 2100) (1919 < kcal/p/d <2100) |
Kcal/p/d < mean (MDER, 2100), Kcal/p/d ≥ MDER (1738 < Kcal/p/d <1919) |
Kcal/p/d < MDER (Kcal/p/d <1738) |
|
|
Coping Capacity |
Economic Vulnerability | Food Expenditure Share |
Low food Expenditure Share < 50% |
Medium food Expenditure Share 50-65% |
High food Expenditure Share 65-75%) |
Very high food Expenditure Share >75% |
| Asset Depletion | Livelihood coping strategy categories | None | Employed stress strategies | Employed crisis strategies | Employed emergency strategies | |
| Food Security Index | Food Secure | Marginally Food secure | Moderately food Insecure | Severely food Insecure | ||
* MDER is the minimum daily energy requirement recommended for a country. Hence, the MDER for Ethiopia in 2020 was 1738 [49] and the mean of MDER and 2100 was 1919.
As shown in Table 4, the CARI report of the final summary reveals that the distribution of different food security indicators was obtained from an algorithm based on simple averaging calculations using the scores achieved on the four-point scale. Households with food security ratings of 1, 2, 3, and 4 correspond to those that are food secure, borderline food secure, moderately food insecure, and severely food insecure, respectively. The benchmarks are indicated in the table as per each indicator and the four-point scales. Using descriptive statistics, the percentages of households falling in each scale could be calculated. In this case, the ranking of each household is based on a simple average (See equations 5-7) of the current status score (consumption scores) and the coping capacity scores (average of the food expenditure share score and the asset depletion score). The average obtained was rounded (between 1 and 4) and this figure represents the household's final food security index.
3. Results and Discussions
3.1. Demographic and Socio-Economic Characteristics of Respondents
The food security situation of respondents based on the Kcal indicator per different demographic and socioeconomic characteristics was summarized in Table 5. As can be seen in Table, 67.8% of the respondents involved in the study were males and 32.2% were females. From these, the majority, 51.4% of males and 61% of females were food insecure. The result on age revealed that the majority (88.2%) of respondents were aged between 20 and 65 years in terms of age category. Based on the result, the majority of the households surveyed were found to belong to the productive age group. Moreover, the mean, maximum, and minimum ages were 49, 74, and 29 respectively. Comparing age categories with food security status, the majority (65%) of age groups 20-34 are food insecure followed by age groups 50-64 and 35-49 with 60% and 53% respectively.
The result on marital status showed that the majority of households (74.9%) were married. In the survey, only 6%, 9.5%, and 9.5%) households were single, divorced, or widowed (Table 5). The majority of rural households are taking on the responsibility of farming activities after getting married. Similarly, Mota, Lachore [50] and Doukoro, Abbey [51] confirmed that much of rural agricultural livelihood activities are practiced by married people. Coming to food security status, the majority (71.4%) of Widowed were food insecure followed by single 63.6%. Households who were widowed and single were more exposed to food insecurity than those who were married and divorced. As presented in Table 5, about 74.1% of the respondents had a family size between three and six, while 18.8% had seven and eight household size. The mean household size of the study area was 5.4, which was higher than the regional average of 4.5 and the national average of 4.7 [52]. Similarly, the age dependency ratio was found to be high. There are approximately 68.6 non-productive members per 100 productive individuals. But, it was slightly lower than the national which was 75.5 in 2022 [53]. The food security status of households compared with family size based on the Kcal indicator revealed that food insecurity increased with increasing family size. Thus, for family sizes 1-2, the proportions of food insecurity were 47%, but, for family sizes 7-8 it was 64% (Table 5). Therefore, having a large family size is associated with food insecurity which agrees with the findings of [23].
The educational status in Table 5 showed that nearly 68% of the respondents were not enrolled in any formal education. When this value is broken down, 42.2% were illiterate with no education of any kind, and 25.5% could read and write. The households who attended primary and secondary schools constitute 20.7% and 8.4% respectively. The survey revealed that only 3% of households had diplomas or higher education levels. From this result, it is evident that there is a high illiteracy rate which limits the rural households’ access to different information sources and in turn results in unwillingness to utilize new technologies in their agricultural practices and hence are vulnerable to food insecurity. Thus, a large proportion of illiterate and read and write, and grade 1-8 groups with 56, 60.6, and 57.9% respectively were food insecure. On the contrary, households who had education attainment of grade 9 and above were better food secure (Table 5).
Moreover, the result on farm households’ engagement in different agricultural activities showed that in nearly all surveyed (98.4%) households engaged in farming activities, 98 and 87.7% participated in crop production and livestock rearing (Table 6). However, the percentage of households’ participation in fruit production and beekeeping was found to be minimal which accounted for 20% and 8% respectively. Therefore, a significant proportion of the surveyed households’ livelihood depended on crop production and livestock rearing. Fruit production contributes a greater share (35% & 32% of households participated) in ABB and SWS livelihood zones than in other livelihood zones. Whereas, the proportion of households engaged in beekeeping is found to be better (17%) in the Meher livelihood zone than in others. In this regard, the information from a focus group discussant in the Meher-Belg, livelihood zone, Fito kebele put his opinion as follows:
… Before 20 to 25 years, when I was a youth, my parents used to have a lot of bee hives and could harvest honey every year. We always used to eat honey and prepare drinks from it. My mother used to give the honey to relatives and neighbors while asking for medicine. But, this time my family lost all the bee hives. Bees were frequently dying because of the increasing trends in farmers utilizing pesticides and herbicide chemicals; especially DDT harms the bees and thus significantly reduces their number. Now the price of honey has increased alarmingly, and getting it even for medicine has become very difficult.
3.2. Analysis of the Food Security Index
The CARI console was used to categorize households into four food security levels by converting each food security indicator into a 4-point scale and calculating the average value of the current status and livelihood coping capacity domain of indicators (Table 8).
- Consumption Patterns and Food Security Status Of Households with FCS
The FCS gathers information about dietary diversity, food frequency, and relative nutritional importance of various food groups at the household level [47,54,55]. As part of the analysis leading to the categorized information concerning the household’s food security status, the study examined the consumption patterns of households surveyed in each livelihood zone, and the results were summarized in Table 7. Nearly all surveyed households (84.2%) had consumed main staples (grains/tubers) for six to seven days in the seven days before the survey. None of the households had zero or no consumption of grains and/or tubers. Based on this result and the information acquired through FGD, the most dominant food group consumed by the majority of the households’ was grain/pulse in the form of ‘injera’. A study by Atara, Tolossa [1], in southern Ethiopia, revealed that nearly 99% of the households consumed this food group. Moreover, according to Jateno, Alemu [56], in Ethiopia, the most dominant food group consumed by 96.4% of the households was cereals followed by pulses, with an 82% consumption level.
Only 0.6% of the surveyed households had consumed vegetables for five or more days within the seven days and 6% of the households consumed it for three to four days. Moreover, the great majority (93.4%) of the surveyed households had either no consumption or consumed vegetables only for one to two days. 85.1% of the households consumed pulse for three to seven days and 34.9% for three to four days. The result agrees with the studies by Atara, Tolossa [1] and Jateno, Alemu [56]. Likewise, only 3.1% of households consumed fruit for five days or more, and 48.8% of households consumed it for one to two days, while 40.3% have not eaten this group.
The consumption of livestock products /meat, eggs, and nutritionally related fish) was almost negligible. About 68.4% of the households did not consume it in the seven days before the survey date. Households’ consumption of meat/fish for a maximum of one or two days was 26.1%. When these two groups are combined, it can be said that 94.5% of the households either had not consumed at all or consumed only for a maximum of two days. About 95.9% of the households did not consume milk at all or with only one to two days of consumption. A Similar result was revealed by studies by Jateno, Alemu [56] and Atara, Tolossa [1] in Ethiopia as a whole and in the Sidama zone. These results regarding meat/fish and milk consumption were clear indications of the deterioration of the living conditions of rural households in the North Eastern part of the country/southern wollo) compared to what had been in the past. In relation to this, an elderly key informant from Keteteye kebele (SWS) suggested his opinion in the following ways.
……. During my childhood, there was no issue with the size of the land. I used to cultivate vast fields and harvest considerable quantities of grains. I had large communal pastures and I used to raise as many animals as I could. Besides farming oxen, I used to raise a lot of cows, sheep, goats, and other livestock. My family and I used to drink milk as much as we needed. My family also used to eat meat. It was believed that individuals who grew up drinking milk were considered strong. Currently, due to the rising population, all the lands have been divided and used for farming. The absence of grazing land prevents the raising of cows and other animals other than farm oxen. It's becoming more and more difficult to obtain milk. Obtaining it was impossible, even for children. Even if some people owned cows, they would sell their milk to the town. Slaughter and consumption of sheep and goats have become too costly. Eggs have also become expensive, an average sheep or goat costs more than 10 thousand ET Birr, and an egg costs more than 10 ET Birr, so only a few people can afford these foods.
About 33.2% of the households had consumed oil and fat food groups for at least five days and 21.8% had consumed for three to four days. About 46.1% of the households either did not consume at all or consumed only for one to two days per week. This result seems to be conflicting with what has been reported above concerning livestock product consumption. This is because the majority of households reported their consumption of foods belonging to this group referred to the processed (edible) oil from food aid and market. The consumption of butter was not reported by any household.
The result of the last food group's access to sugar, as one may expect is a food item to which even the urban dwellers have rationed access at present, and related food items such as honey were also very limited. It was only consumed by 9.3% of households for at least five days. About one-third (32.4%) of households had not consumed at all, and 34.9% of the households consumed foods from the sugar group for one to two days within seven days. By combining the two groups, the proportion of households with no sugar consumption or only one to two days was about 67.3%. The result also agrees with the studies by Atara, Tolossa [1] in the Sidama zone of southern Ethiopia.
According to the FCS indicator for household food security status, 48% of the sampled households had an acceptable (≥ 35.5) consumption level. Borderline (21.5-35) consumption and poor (0-21) consumption groups comprised 41.1% and 10.9% of households, respectively. If only those households having acceptable consumption are taken as food secure, which is reasonable treatment and also applied by previous studies such as Gerezgiher [57], INDDEX [58], and Mengesha [59], the food consumption score based on food insecurity incidence of households was 52% and 48% of them were food-secured (Table 8). Even when using this rough approximation or proxy measure, the results showed that the majority of households (52%) had nutritional intake levels that were below acceptable.
Likewise, though a given level of food consumption score can be achieved by various combinations of consumption patterns of different food groups, it is arithmetically possible to achieve the upper bound of the borderline consumption even without consuming milk and meat families that had been rarely consumed in the case of the current study. Regarding the nutrition content, the two food groups /Meat and fish/ have “Highest quality protein, easily absorbable micronutrients (no phytates), energy-dense, fat. Even when consumed in small quantities, improvements to the quality of the diet are large” [55]. Moreover, the same author maintained that “Milk: highest quality protein, micro-nutrients, vitamin A, energy” and assigned the highest weights for the two food groups. The prevalence of 52% reported here for the current study indicates that substantial levels of the study area households are food insecure in terms of consumption of nutritional variety: the proxy of utilization dimension of food insecurity.
Previous studies that employed FCS have also reported high food insecurity prevalence. For instance, Olaimat, Alshami [60] found that the prevalence of food insecurity in Jordan during the COVID-19 Pandemic was 84.1%, Gerezgiher [57] in Werie Leke District in Tigray National Regional State reported a consumption food insecurity prevalence of 59.7%. The peri-urban focused study of Mengesha [59] in Kobo town revealed a food insecurity prevalence of 67.5%. On the other hand, the study by Mezgabu and Tolossa [61] in the Yeka Sub-city of Addis Ababa found that the food insecurity prevalence was 25.6%. The relatively low food insecurity prevalence in the study of Mezgabu and Tolossa [61], could conform to the general argument that food insecurity is more severe in rural Ethiopia than in urban cities Atara, Tolossa [1] and hence does not refute the validity of the finding of the current study, as well as, those others that focused on rural and semi-urban areas.
- b.
- Food Energy Shortfall Indicator
The result of the food energy shortfall indicator of household food security status indicated that 45.5% of sampled households consumed more than 2100 kcal/p/d, indicating that they are considered food secure. The same indicator shows households with moderate and severe food-insecurity status, which consumed 1738-1919 kcal/p/d and <1738 kcal/p/d were 9% and 37.9% respectively (Table 8). As this indicates, 46.9% of the surveyed households were found to be food insecure. However, the result was slightly lower than other related studies using similar indicators such as Arega [62], and Adeniyi and Ojo [63] who found that 74% of surveyed households were food insured in Lay Gaint District and 69.9% of the households were food insecure in southwestern Nigeria respectively. However, the result was higher than the study results by Feyisa [64] in southwestern Ethiopia and Sileshi, Sieber [65] in Ethiopia which were 25.4% and 36.03% respectively.
- c.
- Households’ Food Expenditure Share (FES)
Based on the households’ FES index, 42.2% of households were categorized under low vulnerability (<50%) that indicated, relative to food expenditure, most of the household’s monthly expenditure was allocated to non-food items like clothes, shoes, education, and other services. About 23% of the households were categorized under a very high food expenditure share threshold (>75%), showing that the household’s monthly expenditure was mainly allocated to food items rather than non-food items (Table 8). About 23% of the surveyed households had a higher food expenditure share (65-75%). According to this index, 45.5% of households were found to have food insecurity. When comparing the result with other studies, the study by Yitayew and Seyoum [66] in Enebsie Sar Mider Woreda, East Gojjam Zone found that only 2% of the households fall in the food expenditure category of <50%. 67.2% were falling under the very high food expenditure share threshold (>75%) and the total prevalence of 13.4% food secure and 86.6% food insecure. On the contrary, a study by Doukoro, Abbey [51] in Mali revealed that all the surveyed households were categorized under low vulnerability (<50%) that indicated, relative to food expenditure, most of the household’s monthly expenditure was allocated to non-food items. Thus, the result of the present study lies between the two studies mentioned. In relation to this, a community leader from Fito kebele(Meher) suggested his opinions in the following ways:
…… In the past, when I was a child, my grandparents used to produce a lot of crops. I never saw them buying food grains from the market. In our saying, a farmer who bought food grains from the market was considered lazy. A one-year crop could feed my family for up to two years. My parents were used to drinking milk and eating meat because animals bred were in abundance. But now crop production has decreased significantly, and production produced is not sufficient year-round as a result, my parents sell different commodities and animals to buy food grains. My parents spend most of their income to buy food grains during the year.
A study made by FAO, IFAD [9] indicated that Ethiopia has been categorized among high-food budget countries in which 63% of the total household expenditure is spent on food consumption.
- d.
- Livelihood Coping Strategy Categories
As can be seen in Table 8, 50% of households did not apply any livelihood coping strategies, which indicates that they are food secure. Emergency coping strategies were utilized by 37.9% of households, while 23.9% applied crisis and 9.8% applied stress livelihood coping strategies. The result contradicts the finding of Doukoro, Abbey [51], who found that only 0.2% of the households applied none of the livelihood coping strategies, 64.4% applied emergency coping strategies, and 33.6% applied crisis coping strategies. However, the present study results nearly agree with the finding by Yitayew and Seyoum [66] that 12.5% of households applied none of the strategies, 28.8% emergency, 44.4% crisis, and 14.8 stress strategies. Moreover, the strategies adopted to cope with food stress, crisis, and emergency; the most applied strategies were spending savings (23.2%), harvesting immature crops (28.6%), and selling the last female animals (24.3%), respectively (Appendix 2). Harvesting immature crops as a coping strategy will inevitably deteriorate the future food security status of the surveyed households [67].
Table 8.
The result of the CARI Console (Food security index) n=367.
| Domain | Indicator | Food Secure 1 |
Marginally Food secure 2 |
Moderately food Insecure 3 | Severely food Insecure 4 |
|
|---|---|---|---|---|---|---|
| Current Status |
Food Consumption | Food Consumption group |
Acceptable ≥ 35.5 48% |
NA |
Borderline 21.5-35 41.1% |
Poor 0-21 10.9% |
| Kcal | Food Energy Shortfall | ≥ 2100 45.5% |
>1919<2100 7.6% |
≥1738<1919 9% |
<1738 37.9% |
|
| Coping Capacity | Economic Vulnerability | Food Expenditure Share |
Share <50% 42.2% |
Share 50% - 65% 12.3% |
Share 65% - 75% 22.9% |
Share ˃ 75% 22.6% |
| Asset Depletion | Livelihood Coping Strategy Categories |
None 45.9% |
Stress 9.8% |
Crisis 22.9% |
Emergency 21.5% |
|
| Food Security Index | 41.1% | 9.3% | 20.4% | 29.2% | ||
According to FGD held at Hamusit kebele(Belg), discussants forwarded their opinion concerning the crisis and emergency coping strategies as:
“… During the occurrence of armed conflict in 2021/22 in northern Ethiopia, the majority of us lost most of our assets, migrated from our home leaving our assets and commodities behind, sold the remaining assets and used the income to survive…. Some of the households got remittance from their children and parents migrated and were living abroad and got revived”.
Figure 3 indicates that one household may be food-secure by a single indicator, but not others, which shows the convenience of the model. According to Figure 3, only 41.1% of the total sample households were categorized as food secure. Households classified under this level demonstrate that they are capable of meeting their essential food and non-food needs without using typical coping strategies. However, 9.3% of households were classified as marginally food secure, which means they had minimally adequate food consumption. They did not engage in irreversible coping strategies but were unable to afford some essential non-food expenses. The sampled households contained 20.4% of households that were moderately food insecure. Households that fall under this category have significant food consumption gaps or are only able to meet their minimum food requirements through irreversible coping strategies. The remaining 29.2% of sampled households were categorized as severely food insecure demonstrating that they have experienced significant gaps in their food consumption or the loss of livelihood assets that could result in similar gaps or even worse.
According to WFP [42], the overall prevalence of food insecurity in the population can be calculated by combining the rates of the two most severe categories (‘moderately food insecure’ and 'severely food insecure'). Combining the remaining categories ('food-secure' and 'marginally-secure') could result in the creation of 'food-secure' groups. Therefore, the overall prevalence of food insecurity in the study area was 49.6%, with 50.4% of households deemed food security. This indicates, that nearly half of the households under study are moderately and severely food insecure.
Moreover, an analysis of rural households' food security status based on the CARI console 4-point index was examined across livelihood zones (Table 9). As demonstrated in Table 9, the majority (73.4%) of the surveyed households in the Meher Livelihood zone fall into food security categories. Next to Meher, Meher-Belg and SWS livelihood zones had 46.7% and 43.4% of the households in the food security category respectively. Whereas, coming into the severely food insecure category, the largest (57.4%) record was observed in the Belg livelihood zone followed by CHV with 37.1%. Regarding the moderately food insecure category SWS Livelihood zone was relatively larger (26.3%) followed by Meher-Belg (25%).
The cumulative result shows that 76.5% of households in the Meher livelihood zone were food secured followed by SWS with 60.5%. On the other hand, 78% of sampled households in the Belg livelihood zone were found to be food insecure followed by CHV with 58%. Hence, the Belg livelihood zone was found to be the most food insecure. For this result in the Belg LHZ being the most food insecure, various factors can be mentioned. Some of the factors that contribute to food insecurity are the frequent lag/or absence of spring rain, soil erosion and deforestation, lack of access to infrastructures, increasing temperature, and lack of agricultural inputs. The information acquired from a development agent in the Hamusit kebele(Belg) livelihood zone suggested his opinions as follows:
…. As this area has several problems, most of the households have faced food security problems for many years and are highly dependent on food aid. Among the problems, there is a major infrastructure problem due to the mountainous nature of the land, so households do not have access to basic services. In this kebele, there are high deforestation and soil erosion problems. It is vulnerable to drought due to decreasing rainfall and increasing temperature. It is difficult to produce enough crops due to the lack of agricultural input and especially the lack of spring rains for many consecutive years.
Furthermore, the prevalence of food security was also examined using the CARI console index based on the sex of the household heads (Figure 4). As demonstrated in Figure 4, the result showed that the majority (43.8%) of the surveyed male-headed households were found in the food security category and exceeded the percentage of female-headed households in that category. On the contrary, the percentage of female-headed households in the severely food insecure and moderately food insecure category exceeds the percentage of male-headed households. Cumulatively, the majority (52.2%) of male-headed households fall in the food security category, whereas, 53.5% of female-headed households are in the food insecurity prevalence.
This result might be attributed to the lack of access to land, lack of labor to plow, and lack of oxen for female-headed households. This finding agrees with the study by Arega [62]. He found that female-headed households in the Lay Gaint district were severely food insecure because of asset poverty such as scarcity of oxen, labor, and farmland. Moreover, in this study from the surveyed households that shared cropped out their plot/s to other farmers on an equal basis, about 60% were female-headed households (widowed and divorced). Some of the reasons for sharing cropped out their plot were related to female-headed households and explained as lack of oxen, divorce, lack of labor to plow, and deaths of their husbands. Studies revealed that female head households face various challenges such as shortage of time, shortage of technologies that suit the physical condition and social mobility limitations to perform different activities, culturally defined gender roles, differential ownership of assets, and their responsibility for maintaining the reproductive role rather than a productive role to earn their income [68,69].
4. Conclusions
This study focused on measuring the food insecurity status of households with a CARI console model with different indicators and investigates the food security situations across livelihood zones and different households’ characteristics. The results on the demographic and socioeconomic characteristics with a food security status of the households showed that female-headed households, households with marital status of widowed and single, households having a large family size, and households with the education level of illiterate and read and write were found to be more food insecure. However, the age of the household head did not show a significant difference in food security status among age groups. The analysis of the consumption patterns of food frequency and diversity among food groups shows that main staple grains/tubers were consumed by nearly all of the surveyed households in the week. However, meat/fish, milk, vegetables, and fruits were the least consumed food group which indicated the severity of food insecurity in the study area.
According to the CARI console analysis; the percentage of surveyed households with food secure; marginally food secure; moderately food insecure; and severely food insecure were 41.1; 9.3; 20.4; and 29.2%, respectively. Moreover; 50.4% of the households were food secure and 49.6% of them were food insecure based on the aggregate CARI result. Further more; the finding indicated that households in the Belg livelihood zone had the highest levels of food insecurity; followed by CHV; while households in the Meher livelihood zone had the highest levels of food security; followed by the SWS livelihood zone. Similarly; the majority of food insecure groups were female-headed households; due to the lack of access to land; lack of labor to plow; and lack of oxen for female-headed households
Finally, the prevalence of food insecurity was found to be high in the study area in general and Belg and CHV livelihood zones and female-headed households in particular. Therefore, the concerned government and non-government organizations, development partners, planners, and policymakers should recognize the food security situation at the household level and focus on activities that could improve the food security status of the study area.
Author Contributions
The first author collected data, analyzed it, and wrote the manuscript. The second and third authors gave conceptual advice and technical support with comments for improvement. All authors read, discussed, edited, and approved the contents, methods, and results of the manuscript..
Funding
There is no fund obtained for this study.
Data Availability Statement
The data will be available upon request.
Acknowledgments
We are indebted to greatly acknowledged zonal and district-level food security experts; rural household heads; zonal and district-level agricultural officers, Kebele-level development agents, community leaders, religious leaders, and women and youth association leaders across the livelihood zones for their willingness to provide the necessary information during data collection.
Conflicts of Interest
The authors declared that they have no competing interests.
References
- Atara, A. Tolossa, and B. Denu, Analysis of rural households’ resilience to food insecurity: Does livelihood systems/choice/matter? The case of Boricha woreda of sidama zone in southern Ethiopia. Environmental Development, 2020. 35: p. 100530. [CrossRef]
- Berry, E.M. , et al., Food security and sustainability: can one exist without the other? Public health nutrition, 2015. 18(13): p. 2293-2302. [CrossRef]
- Pinstrup-Andersen, P. , Food security: definition and measurement. Springer Science, 2009. [CrossRef]
- Derso, A. , et al., Food insecurity status and determinants among Urban Productive Safety Net Program beneficiary households in Addis Ababa, Ethiopia. PloS one, 2021. 16(9): p. e0256634. [CrossRef]
- Mohamed, A.A. , Food security situation in Ethiopia: a review study. International journal of health economics and policy, 2017. 2(3): p. 86-96. [CrossRef]
- FSIN, Global Report on food crisis 2023:Joint Analysis for better decision 2023.
- World Bank, The World Bank , Food Security Update, Washington, D.C. 2023.
- UN, The impact of COVID-19 on food security and nutrition. United Nations, 2020: p. 1-22.
- FAO, et al., The State of Food Security and Nutrition in the World 2023. Urbanization, agrifood systems transformation and healthy diets across the rural–urban continuum. Rome, FAO.
- Drammeh, W., N. A. Hamid, and A. Rohana, Determinants of household food insecurity and its association with child malnutrition in Sub-Saharan Africa: A review of the literature. Current Research in Nutrition and Food Science Journal, 2019. 7(3): p. 610-623. [CrossRef]
- Tizazu, G.Z.; Menberu, T. Food Security Status of Rural Households in Lay Gayint Woreda of South Gondar Zone, Amhara Region, Ethiopia. International Journal of African and Asian Studies 2019, 57, 12–26. [Google Scholar]
- FSIN, Global Report on food crisis 2021:Joint Analysis for better decision, F.S.I. Network, Editor. 2021.
- World Bank, World Bank Open Data. The World Bank Group, Washington, D.C. 2023.
- FEWS NET, Food Insecurity Emergency in Ethiopia leads to Second Record-Setting Year of Food Assistance Needs. Famine Early Warning Systems Network, 2023.
- Bezu, D.C. A review of factors affecting food security situation of Ethiopia: From the perspectives of FAD, economic and political economy theories. 2018, 6, 2319–2473. [Google Scholar]
- Abebaw, S.; Betru, T. A review on status and determinants of household food security in Ethiopia. Ethiopian Journal of Environmental Studies & Management 2019, 12. [Google Scholar]
- Sisha, T.A. Household level food insecurity assessment: Evidence from panel data, Ethiopia. Scientific African 2020, 7, e00262. [Google Scholar] [CrossRef]
- Ahmed, J. , The role of small scale irrigation to household food security in Ethiopia: a review paper. 2019. [CrossRef]
- FEWS NET, Ethiopia Food Security Outlook:February to September 2021.Amid high national needs, Tigray remains of greatest concern with conflict driving Emergency outcomes. 2021.
- Mohammed, Y. , et al., Meteorological drought assessment in north east highlands of Ethiopia. International Journal of Climate Change Strategies and Management, 2018. 10(1): p. 142-160. [CrossRef]
- Rosell, S. and B. Holmer, Erratic rainfall and its consequences for the cultivation of teff in two adjacent areas in South Wollo, Ethiopia. Norsk Geografisk Tidsskrift-Norwegian Journal of Geography, 2015. 69(1): p.
- Motbainor, A., A. Worku, and A. Kumie, Level and determinants of food insecurity in East and West Gojjam zones of Amhara Region, Ethiopia: a community based comparative cross-sectional study. BMC public health, 2016. 16(1): p. 1-13. [CrossRef]
- Yehuala, S., D. Melak, and W. Mekuria, The status of household food insecurity: The case of West Belesa, North Gondar, Amhara region, Ethiopia. International Journal of Scientific Research and Management, 2018. 6(6): p. 158-66. [CrossRef]
- Abdulla, A.M. Determinants of household food security and coping strategies: The case of Bule-Hora District, Borana Zone, Oromia, Ethiopia. European Journal of Food Science and Technology 2015, 3, 30–44. [Google Scholar]
- Endris, A.; Destaw, Z.; Ashenafi, M. Household food security status and food safety knowledge, attitude and practice in Tehuledere Woreda, South Wollo, Ethiopia. Ethiopian Journal of Development Research 2019, 41, 25–54. [Google Scholar]
- Mitiku, A.; Fufa, B.; Tadese, B. Empirical analysis of the determinants of rural households food security in Southern Ethiopia: The case of Shashemene District. Basic Research Journal of Agricultural Science and Review 2012, 1, 132–138. [Google Scholar]
- Maxwell, D., J. Coates, and B. Vaitla, How do different indicators of household food security compare? Empirical evidence from Tigray. Medford: Tufts University, 2013.
- Mekonen, A.A., A. B. Berlie, and M.B. Ferede, Spatial and temporal drought incidence analysis in the northeastern highlands of Ethiopia. Geoenvironmental Disasters, 2020. 7(1): p. 1-17. [CrossRef]
- Agidew, A.A. Land suitability evaluation for sorghum and barley crops in South Wollo Zone of Ethiopia. Journal of Economics and Sustainable Development 2015, 6, 14–26. [Google Scholar]
- USAID, Ethiopia Livelihood Zones. 2009.
- Mohammed, Y. , et al., Analysis of smallholder farmers’ vulnerability to climate change and variability in south Wollo, north east highlands of Ethiopia: An agro-ecological system-based approach. 2021. [CrossRef]
- SWZPC, South Wollo Zone Plan Commision: 2022 Budget year Annual Report. Dessie, Ethiopia.. 2022.
- Mitiku;, A., et al., Analysis of Economic ane Labour Environment in South Wollo. Amhara Lot 2:Linking and up scaling for Empowerment. 2019.
- WHO, Report on the Food and Nutrition Situation in South Wollo, Amhara Region, Ethiopia. 2000.
- Greene, J.C. Toward a methodology of mixed methods social inquiry. Research in the Schools 2006, 13, 93–98. [Google Scholar]
- Creswell, J.W. and J.D. Creswell, Research design: Qualitative, quantitative, and mixed methods approaches. 2017: Sage publications.
- Creswell, J.W. , Educational Research:Planning, Conducting, and Evaluating Quantitative and Qualitative Research. Fourth Edition ed. 2012, Manufactured in the United States of America: University of Nebraska–Lincoln. 673.
- Legesse, S.A.; Rao, P.; Rao, M.N. Statistical downscaling of daily temperature and rainfall data from global circulation models: In South Wollo zone, North Central Ethiopia. Abhinav-National Monthly Refereed Journal of Research In Science & Technology 2013, 2, 27–39. [Google Scholar]
- Rai, N. and B. Thapa, A study on purposive sampling method in research. Kathmandu: Kathmandu School of Law, 2015.
- Kiger, M.E. and L. Varpio, Thematic analysis of qualitative data: AMEE Guide No. 131. Medical teacher, 2020. 42(8): p. 846-854. [CrossRef]
- Braun, V. and V. Clarke, Thematic analysis. 2012. [Google Scholar]
- WFP, Consolidated Approach for Reporting Indicators of Food Security (CARI) (2nd edition). Rome: United Nations World Food. 2015.
- WFP, Consolidated Approach for Reporting Indicators of Food Security (CARI) (3rd edition). Rome: United Nations World Food Program. 2021.
- Biederlack, L. Biederlack, L. and J. Rivers, Comprehensive Food Security & Vulnerability Analysis (CFSVA): Ghana. 2009: United Nations World Food Programme.
- McKinney, P., Comprehensive food security & vulnerability analysis. VAM, 2009: p. 57-80.
- INDDEX, INDDEXProject (2018), Data4Diets: Building Blocks for Diet-related Food Security Analysis. Tufts University, Boston, MA. https://inddex.nutrition.tufts.edu/data4diets. Accessed on 25 August 2023. 2018.
- Vhurumuku, E. Food security indicators. in Workshop on integrating nutrition and food security programming for emergency response: Food and Agriculture Organization (FAO). Kenya: Nairobi. 2014.
- Smith, L.C. and A. Subandoro, Measuring food security using household expenditure surveys. Vol. 3. 2007: Intl Food Policy Res Inst.
- FAO, Minimum Dietary Energy Requirement (kcal/person/day): Food and Agriculture Organization: FAO Statistics Division. 2022.
- Mota, A.A., S. T. Lachore, and Y.H. Handiso, Assessment of food insecurity and its determinants in the rural households in Damot Gale Woreda, Wolaita zone, southern Ethiopia. Agriculture & Food Security, 2019. 8(1): p. 1-11. [CrossRef]
- Doukoro, D. , et al., Assessment of Households’ Food Security Situation in Koutiala and San Districts, Mali. Journal of Food Security, 2022. 10(3): p. 97-107. [CrossRef]
- CSA, CSA (Central Statistical Agency) (2019) Ethiopia mini demographic and health survey report, Addis Ababa, Ethiopia. 2019.
- World Bank, Ethiopia's Age Dependency Ratio: Total: Washington D.C. 2023.
- Krishnamurthy, P.K. , et al., Climate risk and food security in Nepal—analysis of climate impacts on food security and livelihoods, in CCAFS Working Paper. 2013.
- WFP, V., Food consumption analysis: calculation and use of the food consumption score in food security analysis. WFP: Rome, Italy, 2008.
- Jateno, W., B. A. Alemu, and M. Shete, Household dietary diversity across regions in Ethiopia: Evidence from Ethiopian socio-economic survey data. PLoS One, 2023. 18(4): p. e0283496. [CrossRef]
- Gerezgiher, A. , Small holder market access in Werie Leke District of Tigray National Regional State, Ethiopia: Implications for poverty reduction and food security. 2016, Addis Ababa university, Addis Ababa Ethiopia.
- INDDEX, Food Insecurity Experience Scale (FIES). International Dietary Data Expansion ProjectData4 Diets: Building Blocks for Diet-related Food Security Analysis 2022.
- Mengesha, G.S. , Food security status of peri-urban modern small scale irrigation project beneficiary female headed households in Kobo Town, Ethiopia. Journal of Food Security, 2017. 5(6): p. 259-272. [CrossRef]
- Olaimat, A.N. , et al., Food insecurity, dietary diversity, and coping strategies in Jordan during the COVID-19 pandemic: a cross-sectional study. Nutrients, 2022. 14(11): p. 2252. [CrossRef]
- Mezgabu, F.; Tolossa, D. The contribution of urban agriculture to food security of individual urban farmers in Yeka sub city, Addis Ababa. Ethiopian Journal of Development Research 2015, 37, 177_207–177_207. [Google Scholar]
- Arega, B.B. , Determinants of rural household food security in drought-prone areas of Ethiopia: case study in Lay Gaint District, Amhara Region. 2013. [CrossRef]
- Adeniyi, O.R.; Ojo, O.A. Food security status of rural farming households in Iwo, Ayedire and Ayedaade local government areas of Osun State, South-Western Nigeria. African Journal of Food, Agriculture, Nutrition and Development 2013, 13, 8209–8223. [Google Scholar] [CrossRef]
- Feyisa, M.N. , Determinants of food insecurity among rural households of South Western Ethiopia. Journal of development and agricultural economics, 2018. 10(12): p. 404-412. [CrossRef]
- Sileshi, M. Drivers of rural households’ food insecurity in Ethiopia: a comprehensive approach of calorie intake and food consumption score. Agrekon, 2023: p. 1-12.
- Yitayew, B.; Seyoum, A. Determinants of rural households’ food insecurity status and associated coping strategies in enebsie sar Mider Woreda, East Gojjam Zone of Amhara National Regional State, Ethiopia. Ethiopian Journal of Development Research 2022, 44, 77–102. [Google Scholar]
- Maniriho, A., E. Musabanganji, and P. Lebailly, Food security status and coping strategies among small-scale crop farmers in Volcanic Highlands in Rwanda. Journal of Central European Agriculture, 2022. 23(1): p. 165-178. [CrossRef]
- Tigistu, S.; Hegena, B. Determinants of food insecurity in food aid receiving communities in Ethiopia. Journal of Agriculture and Food Research 2022, 10, 100391. [Google Scholar] [CrossRef]
- Getaneh, Y. , et al., Food security status and determinants in North-Eastern rift valley of Ethiopia. Journal of Agriculture and Food Research, 2022. 8: p. 100290. [CrossRef]
Figure 1.
Location map of livelihood zones of the study area. ABB= Abay-Beshilo Basin, CHV= Chefa Valley, and SWS= South Wollo and Oromia eastern lowland sorghum and cattle.
Figure 1.
Location map of livelihood zones of the study area. ABB= Abay-Beshilo Basin, CHV= Chefa Valley, and SWS= South Wollo and Oromia eastern lowland sorghum and cattle.
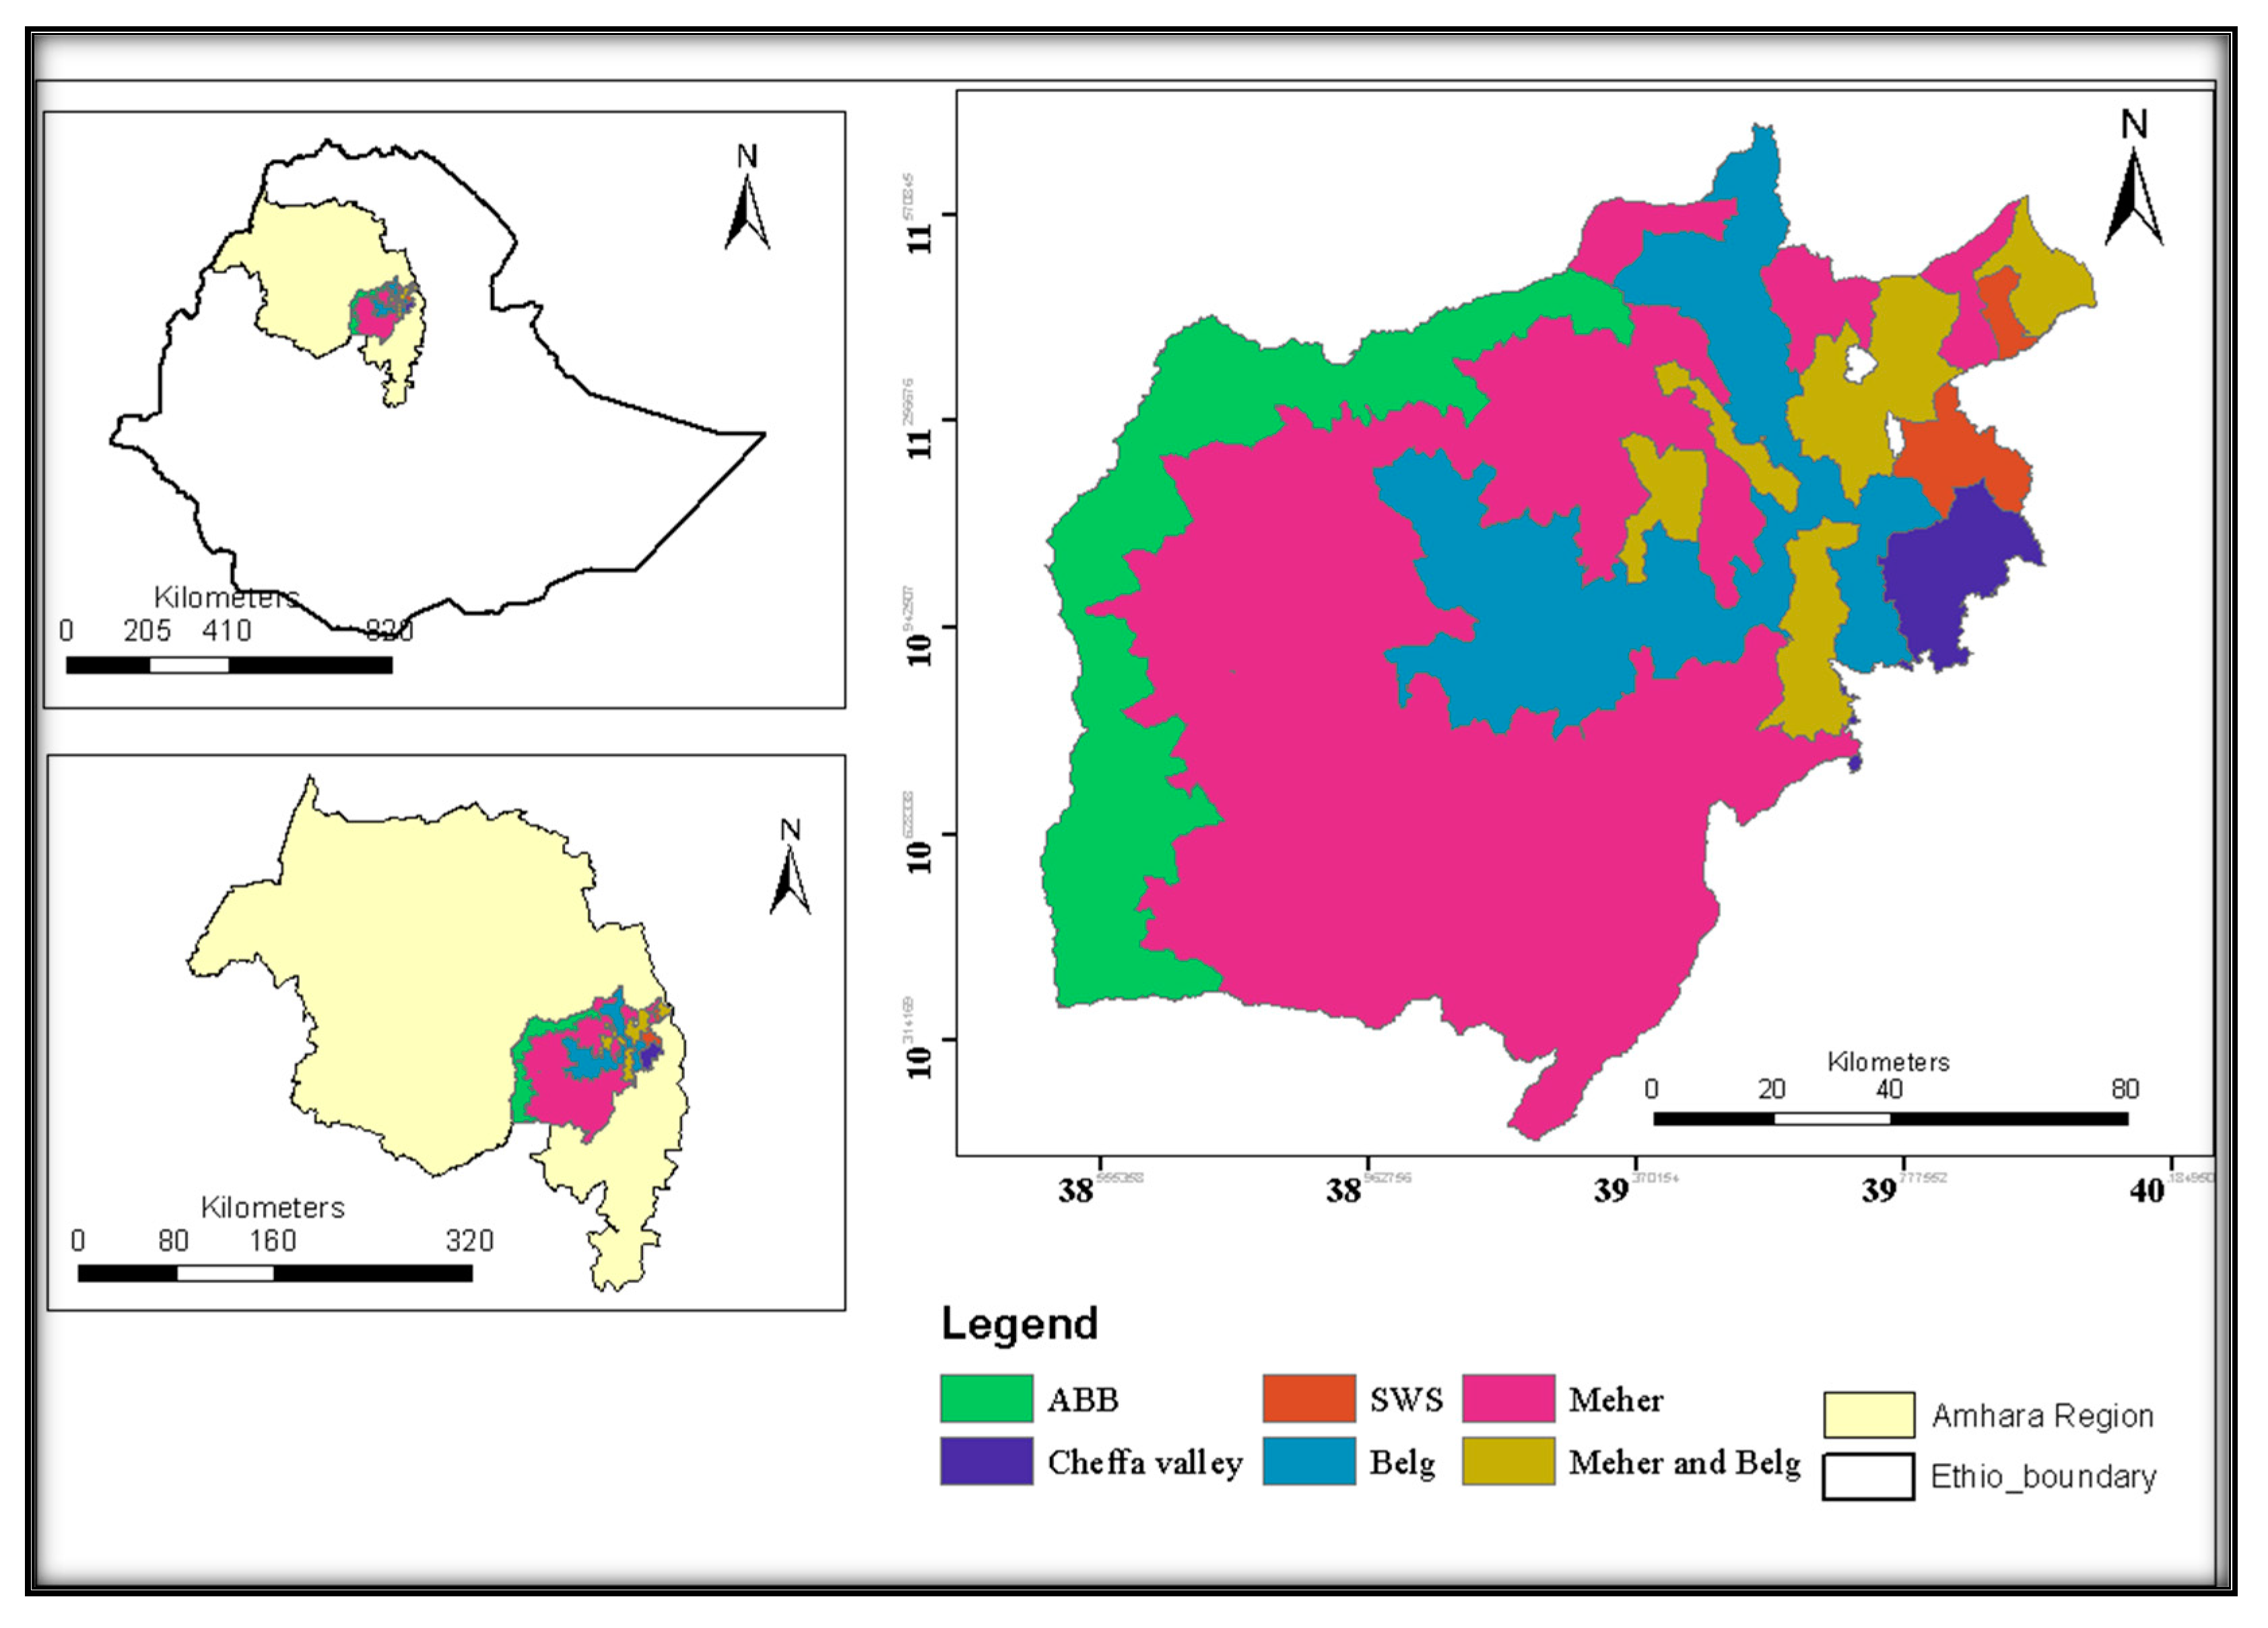
Figure 2.
Flow-graph of the CARI console components [42].
Figure 2.
Flow-graph of the CARI console components [42].
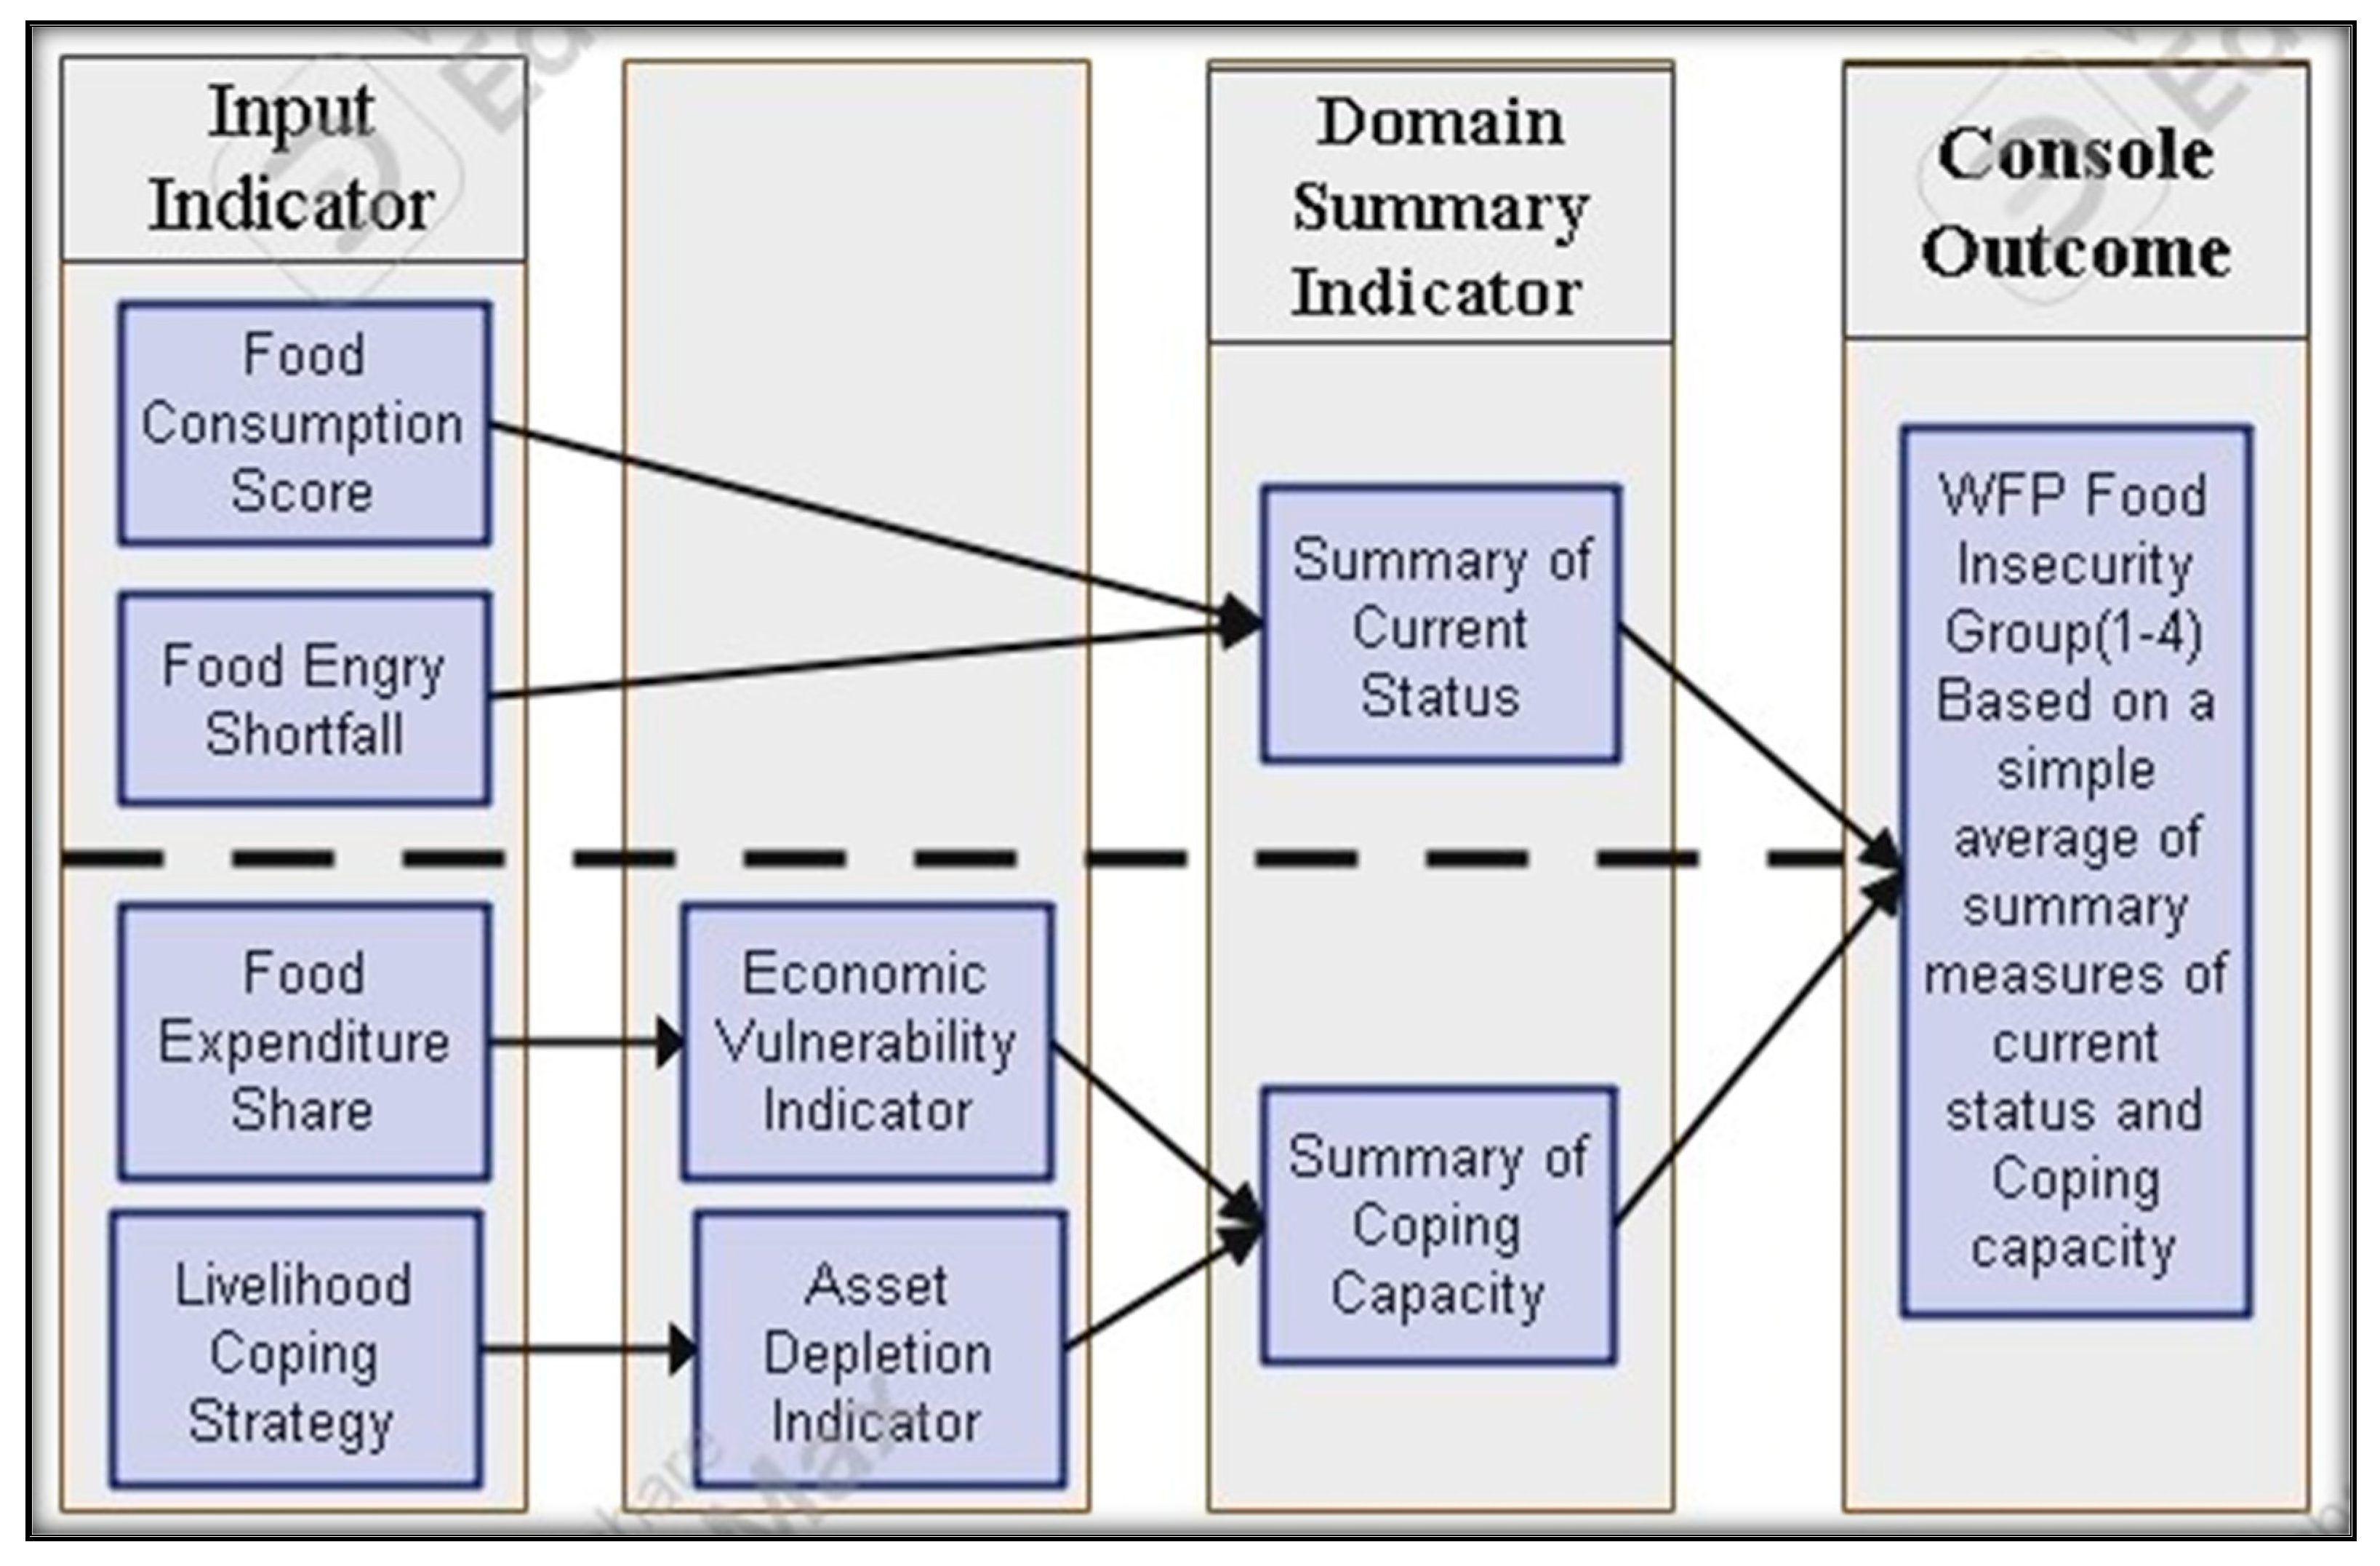
Figure 3.
The CARI console summary result of the food security index.
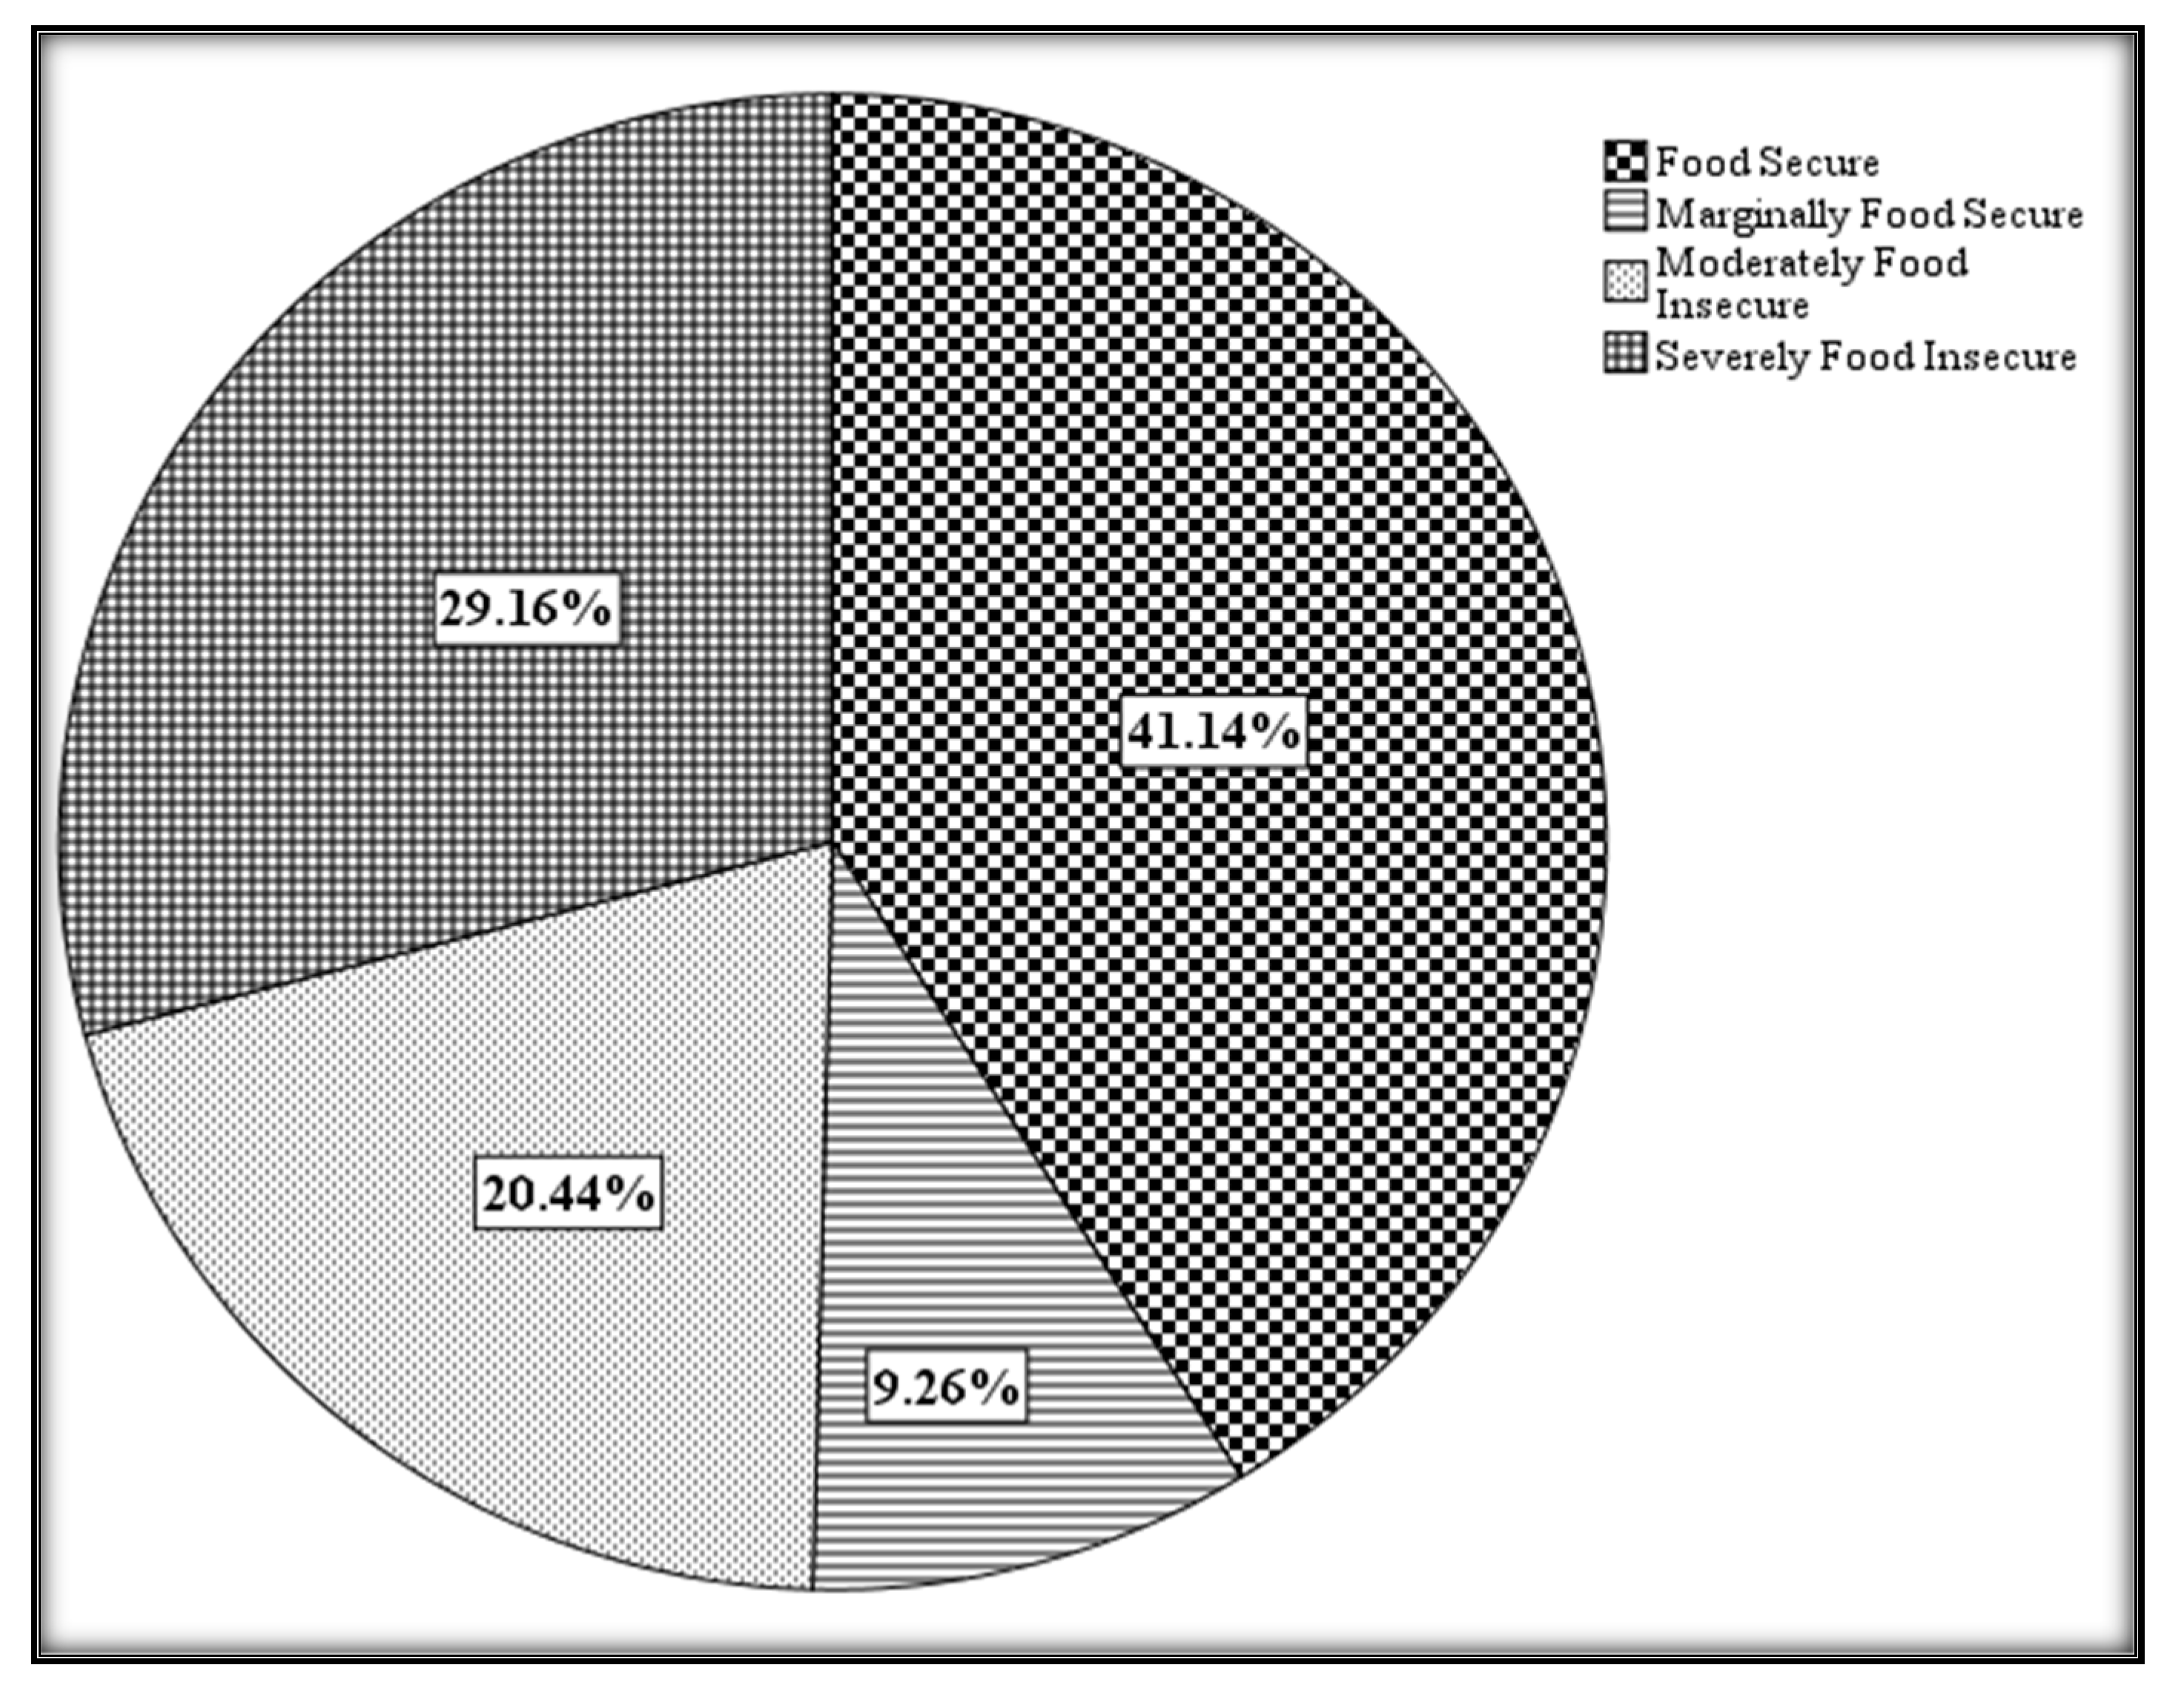
Figure 4.
Food Security status based on the Sex of the household head.
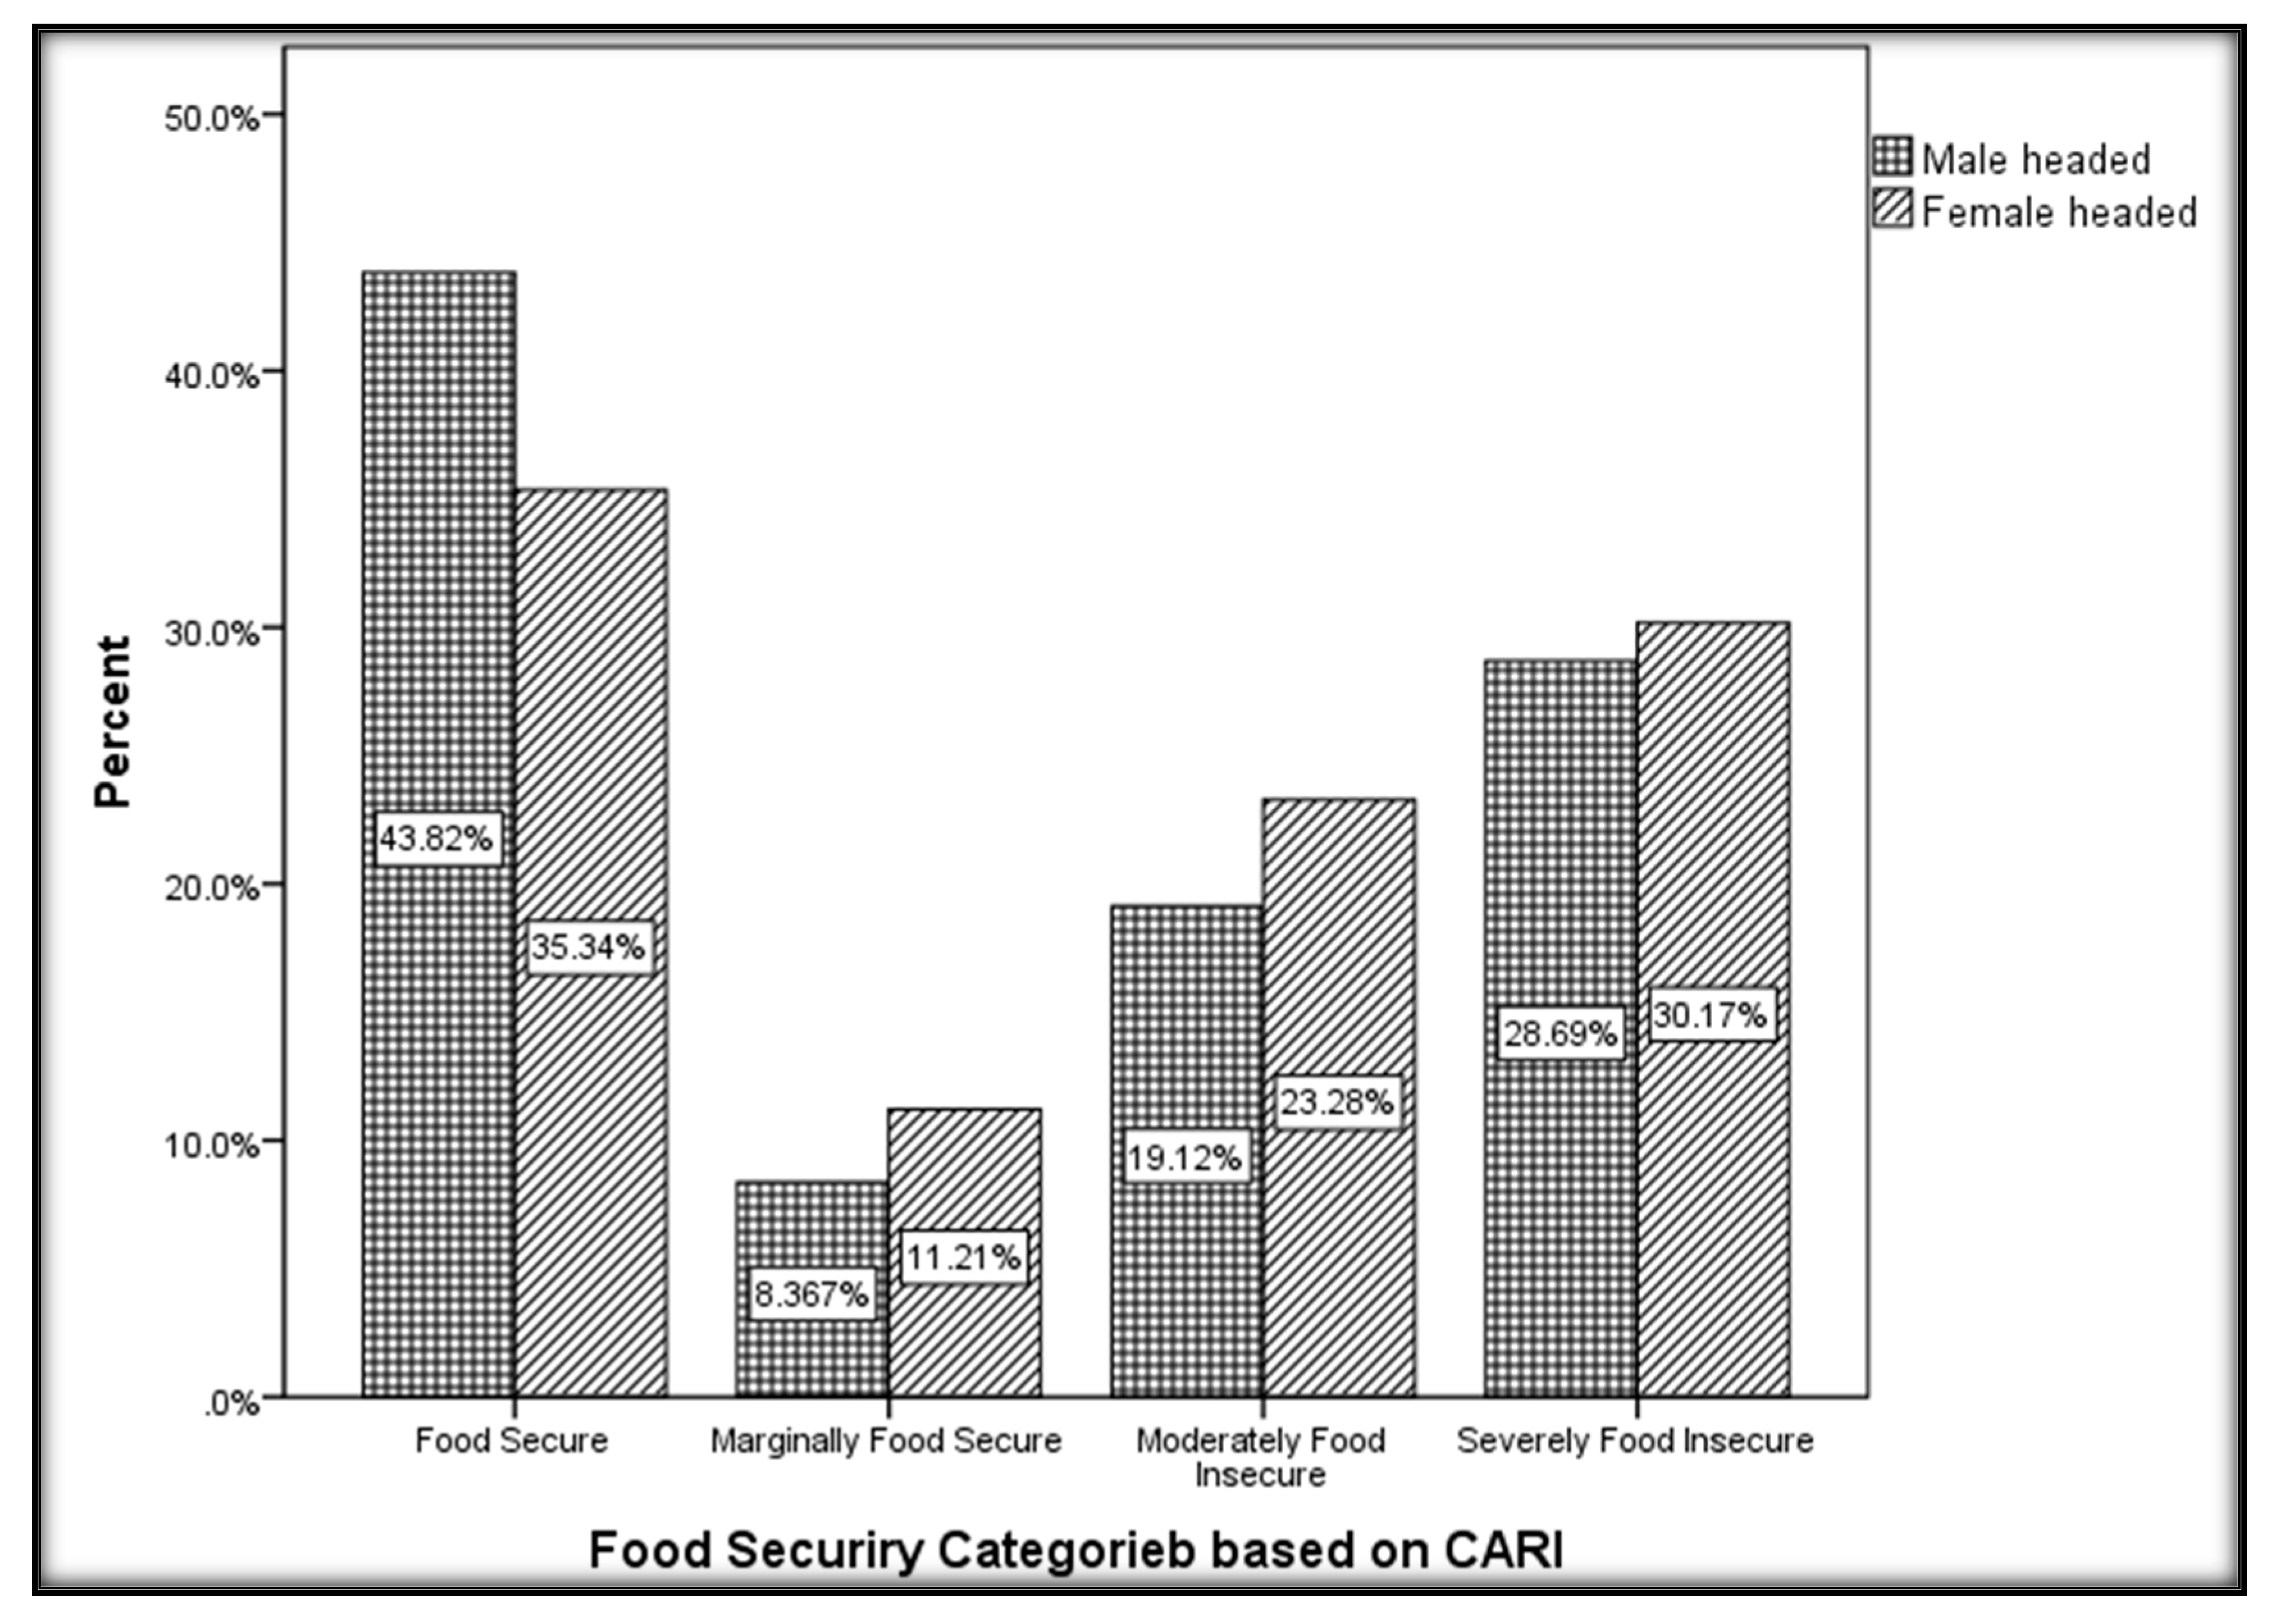
Table 1.
Summary Table for Sample Livelihood zones, kebeles, and sample size.
| Livelihood zones |
Sample Kebele |
No of Households |
Sample units and distributed questionnaires | Returned Questionnaires | |
|---|---|---|---|---|---|
| No. | % | ||||
| Abay-Beshilo Basin (ABB) | Maskeraba | 878 | 39 | 37 | 95 |
| South Wollo and Oromia eastern lowland sorghum and cattle (SWS) |
Keteteye | 1747 | 78 | 76 | 97 |
| Chefa Valley (CHV) | Abahilme | 1458 | 65 | 62 | 95 |
| Meher-Belg | Fito | 1403 | 63 | 60 | 95 |
| Belg | Hamusit | 1593 | 72 | 68 | 94 |
| Meher | Yaya | 1449 | 65 | 64 | 98 |
| Total | 8528 | 382 | 367 | 96 | |
Table 2.
The FCS Food Groups, Weights, and Justification.
| Food Group | Weights | Justifications |
|---|---|---|
| Main staples (cereals, starchy tubers, and roots) | 2 | Energy-dense, usually eaten in large quantities. The protein content is lower and poorer quality than legumes, and micro-nutrients (bound by phytates) |
| Pulses (legumes and nuts) | 3 | Energy-dense, high amount of protein content but lower quality than animal protein, micronutrients (bound by phytates), low fat |
| Animal protein (meat, fish, and eggs) | 4 | Highest quality protein, micronutrients, vitamin A, energy phytates, energy-dense. Even when consumed in small quantities, improvements to the quality of the diet are large |
| Vegetables | 1 | Low energy, low protein, no fat, micronutrients |
| Fruits | 1 | Low energy, low protein, no fat, micronutrients |
| Milk & dairy products | 4 | Highest quality protein, micronutrients, Vitamin A, energy |
| Oils and fats | 0.5 | Energy-dense, but usually no other micronutrients |
| Sugar/sweets | 0.5 | Empty calories |
| Condiments | 0 | Eaten in very small quantities and have no impact on the overall diet |
Source: INDDEX [46].
Table 3.
List of strategies selected for the livelihoods-based coping strategies.
| Strategies | Categories |
|---|---|
| 1. Sold household assets/goods (radio, furniture, refrigerator, television, Jewelry, etc...) | Stress |
| 2. Sold more animals (non-productive) than usual | Stress |
| 2. Spent savings | Stress |
| 3. Purchased food on credit or borrowed food | Stress |
| 4. Reduced non-food expenses on health (including drugs) and education | Crisis |
| 5. Harvested immature crops (e.g. green maize) | Crisis |
| 6. Withdrew children from school | Crisis |
| 7. Sold last female animals | Emergency |
| 8. Begging | Emergency |
| 9. Sold house or land | Emergency |
Table 5.
Demographic and socio-economic characteristics of respondents and food security status with Kcal (n=367).
Table 5.
Demographic and socio-economic characteristics of respondents and food security status with Kcal (n=367).
| Variables | Category | Food security status based on Kcal (%) | Of the total (%) |
Test statistic with Kcal (P-Value) |
|
|---|---|---|---|---|---|
| Food secure | Food insecure | ||||
| Age group | 20 - 34 | 35 | 65 | 4.5 | 0.035** One-way Anova |
| 35 - 49 | 47 | 53 | 47.6 | ||
| 50 - 64 | 40 | 60 | 36.1 | ||
| ≥ 65 | 58 | 42 | 11.6 | ||
| Family size | 1-2 | 53 | 47 | 4.6 | 0.001*** One-way Anova |
| 3-4 | 52 | 48 | 22.6 | ||
| 5-6 | 45 | 55 | 51.5 | ||
| 7-8 | 36 | 64 | 18.8 | ||
| >9 | 56 | 44 | 2.5 | ||
| Sex | Male | 48.6 | 51.4 | 67.8 | 0.000*** T-Test |
| Female | 39.0 | 61.0 | 32.2 | ||
| Marital status | Married | 47.6 | 52.4 | 74.9 | 0.007*** One-way Anova |
| Single | 36.4 | 63.6 | 6.0 | ||
| Divorced | 51.4 | 48.6 | 9.5 | ||
| Widowed | 28.6 | 71.4 | 9.5 | ||
| Education level | Illiterate | 43.9 | 56.1 | 42.2 | 0.000*** One-way Anova |
| Read and Write | 39.4 | 60.6 | 25.6 | ||
| Grade 1-8 | 42.1 | 57.9 | 20.7 | ||
| Grade 9-12 | 74.2 | 25.8 | 8.4 | ||
| Diploma and above | 63.6 | 36.4 | 3.0 | ||
***, **, * significant at P<0.01, P<0.05, and P<0.1 respectively.
Table 6.
Households’ Participation in Farming Activities (%).
| Farming activities | Livelihood zone | Total | |||||
|---|---|---|---|---|---|---|---|
| BB | SWS | CHV | Meher-Belg | Belg | Meher | ||
| Engagement in farming | 100.0 | 100.0 | 95.2 | 100.0 | 97.1 | 98.4 | 98.4 |
| Crop production | 100.0 | 100.0 | 95.2 | 100.0 | 95.6 | 98.4 | 98.1 |
| Livestock Rearing | 100.0 | 96.1 | 64.5 | 98.3 | 80.9 | 90.6 | 87.7 |
| Fruit Production | 35.1 | 31.6 | 9.7 | 13.3 | 2.9 | 31.2 | 19.9 |
| Beekeeping | 0 | 13.2 | 0 | 1.7 | 11.8 | 17.2 | 8.2 |
| Other Farming activities | 0 | 0 | 0 | 0 | 0 | 1.6 | 0.3 |
Table 7.
Summary of the frequency of the food intake from different food groups during seven days before the start of the survey (n=367).
Table 7.
Summary of the frequency of the food intake from different food groups during seven days before the start of the survey (n=367).
| Food groups | Percentage of households with intake for (number of days per week) | |||||||
|---|---|---|---|---|---|---|---|---|
| 0 day | 1 day | 2 days | 3 days | 4 days | 5days | 6 days | 7 days | |
| Grains/ Tubers | 0 | 0 | 1.1 | 1.9 | 3.8 | 9.0 | 12.5 | 71.7 |
| Vegetables | 44.1 | 36.8 | 12.5 | 4.9 | 1.1 | 0.3 | 0 | 0.3 |
| Pulses | 4.6 | 5.7 | 7.6 | 21.0 | 13.9 | 12.3 | 13.6 | 21.3 |
| Fruits | 40.3 | 33.0 | 15.8 | 5.2 | 2.7 | 1.4 | 0.3 | 1.4 |
| Meat/ fish | 68.4 | 15.5 | 10.6 | 4.1 | 0.5 | 0.5 | 0.3 | 0 |
| Milk | 69.2 | 10.6 | 16.1 | 2.2 | 0.3 | 0.8 | 0 | 0.8 |
| Oil and Fat | 25.9 | 2.5 | 17.7 | 14.4 | 7.4 | 5.7 | 1.4 | 25.1 |
| Sugar | 32.4 | 7.1 | 27.8 | 16.3 | 7.1 | 1.1 | 1.9 | 6.3 |
Table 9.
Food security Status within the Livelihood zone based on the CARI Console.
| Livelihood zones | Food Security Status within Livelihood Zone (%) |
Total % |
|||||
|---|---|---|---|---|---|---|---|
| Food Secure | Marginally Food Secure | Total Food Secure | Moderately Food Insecure | Severely Food Insecure | Total food Insecure | ||
| ABB | 32.4 | 16.2 | 48.6 | 16.2 | 35.1 | 51.3 | 100.0 |
| SWS | 43.4 | 17.1 | 60.5 | 26.3 | 13.2 | 39.5 | 100.0 |
| CHV | 32.3 | 9.7 | 42.0 | 21.0 | 37.1 | 58.1 | 100.0 |
| Meher-Belg | 46.7 | 5.0 | 51.7 | 25.0 | 23.3 | 48.3 | 100.0 |
| Belg | 16.2 | 5.9 | 22.1 | 20.6 | 57.4 | 78.0 | 100.0 |
| Meher | 73.4 | 3.1 | 76.5 | 10.9 | 12.5 | 23.4 | 100.0 |
| Total | 41.1 | 9.3 | 50.4 | 20.4 | 29.2 | 49.6 | 100.0 |
Disclaimer/Publisher’s Note: The statements, opinions and data contained in all publications are solely those of the individual author(s) and contributor(s) and not of MDPI and/or the editor(s). MDPI and/or the editor(s) disclaim responsibility for any injury to people or property resulting from any ideas, methods, instructions or products referred to in the content. |
© 2024 by the authors. Licensee MDPI, Basel, Switzerland. This article is an open access article distributed under the terms and conditions of the Creative Commons Attribution (CC BY) license (http://creativecommons.org/licenses/by/4.0/).
Copyright: This open access article is published under a Creative Commons CC BY 4.0 license, which permit the free download, distribution, and reuse, provided that the author and preprint are cited in any reuse.


