
Submitted:
28 April 2024
Posted:
29 April 2024
You are already at the latest version
Abstract
Cytokine and AMH profiling were done in prepubertal Murrah buffalo heifers post-progesterone supplementation and co-synchronization protocol. Cytokines: IFNγ, IL6, IL1, IL13, TNFα, and TGFβ, and, AMH, Progesterone and Estrogen hormone estimations were done. Ovarian follicular pattern and fertility outcome were recorded. Eighteen prepubertal heifers, 15-17 months of age, 250-300 kg BWt were randomly divided into 3 groups, Group1: n=6, supplemented with altrenogest 0.044mg/kg/day/heifer orally for 14 days along with Co-synch programme; Group2: n=6, administered CIDR for 14 days and co-synch programme, Group3: n=6, received co-synch programme. Ultrasonography was done to ovarian follicle status on respective days of sampling. Pregnancy diagnosis was done around 45 and 60 post-AI. Estradiol 17-β level remained constant in altrenogest group, CIDR implanted and Control groups during the Progesterone treatment and Co-synch treatment. Estradiol levels during Co-synch were significantly less on day 9 of Co-synch (14.41 ± 1.97 pg/mL) than day 0 and on day7 in pre pubertal buffalo heifers in altrenogest group. However, no significance was observed in other groups. Progesterone levels in buffalo heifers subjected to synchronisation protocols varied significantly (P< 0.05) on day 7 of P4 treatment between altrenogest supplemented and CIDR implanted groups, as well as, Co-synch groups. Supplementation of altrenogest showed a significant (P= 0.043) increase in Progesterone levels by day 14 of altrenogest treatment. Progesterone varied significantly in all Groups on day 9 of co synch protocol [ Group 1 (P= 0.02), Group 2 (P= 0.041) and Group 3 (P= 0.007)]. Cytokine IFN-γ showed high correlation with progesterone, indicating the role of IFN-γ in puberty in buffalo heifers (r= 0.626, P< 0.01). AMH had a significant positive correlation supplemented with altrenogest with IFN-γ (r= 0.673, P< 0.01) and TGF-β (r= 0.463, P< 0.01), whereas, with TNF-α it was a negatively correlated (r= -0.34, P< 0.05). Based on Karl Pearson correlation coefficients, IL-13 and TGF-β could be considered as markers for puberty in buffalo heifers.
Keywords:
AMH
; buffalo
; cytokines
; estrogen
; heifers
; progesterone
; puberty
; Karl Pearson correlation
1. Introduction
Buffaloes are a vital pillar of the Indian economy, contributing significantly to the country’s position as the world’s leading milk producer, propelling the country to the top position in global milk production with a staggering contribution of 91.82 million tonnes out of the total world production of 127.66 million tonnes. India boasts a significant buffalo population, comprising 114.15 million out of approximately 208.1 million worldwide [1]. Their remarkable productivity stems from superior feed conversion efficiency and disease resistance compared to cattle [2], rendering them well-suited for Indian dairy farming conditions. However, despite their economic importance, buffaloes face challenges related to reproduction, including delayed puberty, late breeding, seasonal breeding patterns, and subtle estrus signs. These factors hinder calf production, impacting both breeders and veterinarians.
This article focuses on puberty, a crucial stage in a buffalo’s life that determines its breeding readiness. Delayed puberty, particularly prepubertal anoestrus, lengthens the interval between first calving and lactation, affecting overall productivity and longevity.
Puberty marks the gradual initiation of reproductive capabilities. The hypothalamus acts as a central regulator, triggering the maturation of the endocrine and reproductive systems for successful breeding [3]. Age, breed, genetics, body weight, growth rate, and nutritional factors all influence the timing of puberty onset. For buffaloes, puberty typically occurs between 16 and 40 months, with sexual maturity generally achieved after 2.5 years. Specific breeds like Murrah and Surti experience even later puberty, averaging 33 and 45.5 months, respectively [4]. This delayed puberty directly impacts the animal’s potential for milk production.
This article delves deeper into the factors influencing puberty in buffaloes, including the role of cytokines - signalling proteins that regulate immune pathways and growth factors [5-7]. Interleukins and (Transforming Growth Factor) TGFβ family cytokines play a pivotal role in facilitating communication between female germ cells and their surroundings to regulate follicle survival and apoptosis [8]. Within the ovary, immune effector cells secrete specific cytokines that contribute to oocyte development, ovulation, and hormone production [9]. These cytokines are produced locally within the gonads and are released in minute concentrations with a short half-life, diffusing in a paracrine or autocrine manner after secretion [10]. They also play a significant role in pubertal onset, and nutritional factors can influence the balance between pro-inflammatory and anti-inflammatory cytokines, which are essential for growth and reproduction. The intricate network of inflammatory cytokines is involved in crucial reproductive processes such as ovulation, embryo development, and implantation [11].
AMH, a glycoprotein dimer weighing 140 kDa and part of the TGFβ family, is expressed in the gonads. In male fetuses, it is produced by Sertoli cells, leading to regression of the Mullerian ducts [12]. AMH has been found to inhibit the recruitment of primordial follicles into the pool of growing follicles, thereby preventing premature exhaustion of the ovarian follicular reserve [13, 14]. It also reduces the responsiveness of growing follicles to FSH, indicating its significant role in follicle development [15]. In the ovary, AMH expression is observed in the granulosa cells of growing follicles in various species including cattle, sheep, rat, human, and mouse [16,17,18,19,20,21,22,23,24,25]. Assisted Reproductive Techniques (ART), AMH has been proposed as an endocrine marker for ovarian reserves of growing follicles [26,27,28]. Low levels of AMH have been associated with ovarian aging and polycystic ovarian syndrome, while high levels are indicative of high AMH [29,30]. It has been identified as the most reliable predictive marker for oocyte retrieval in response to ovarian stimulation [31]. Granulosa cells from bovine and ovine species have been found to produce immunoreactive and bioactive AMH [19].
Improvements in diet and reproductive management can lead to a reduction in the pubertal age of buffaloes. Exogenous hormones are often employed to induce cyclicity and accelerate puberty. Progestogens are effective in inducing cyclicity in prepubertal heifers, particularly when combined with a higher energy diet [32]. A protocol involving the administration of 1000 IU of eCG along with P4 (CIDR) and GnRH has been found to effectively trigger and synchronize puberty in buffalo heifers that have reached pubertal age [33]. Additionally, the administration of GnRH and estradiol benzoate, alongside CIDR treatment, has shown favourable outcomes in Nili-Ravi buffaloes, including the emergence of follicular waves, estrus occurrence, ovulation, and pregnancy rates [34]. Administering the Altrenogest supplement along with a modified Ovsynch regimen has been observed to induce early estrus and reduce the age of puberty in pre-pubertal heifers [35]. Additionally, heifers fed nutritional blocks containing MGA exhibited increased pregnancy rates [36].
We explore the function of Anti-Mullerian Hormone (AMH) in follicle development and its potential as a marker for ovarian reserves. Finally, we discuss potential strategies to improve reproductive efficiency in buffaloes, including dietary modifications, hormonal interventions, and estrus synchronization protocols. By exploring these aspects, this article aims to provide valuable insights for evaluating the effectiveness of different hormone protocols on stimulating puberty and enhancing pregnancy rates in prepubertal buffalo heifers.
2. Materials and Methods
2.1. Place of Study
The research took place at the Directorate of Livestock Farms, GADVASU, Ludhiana (latitude 31o 6’ 5” N and longitude 76 o 27’ 26” E), from March to October 2023. A total of 18 prepubertal buffaloes, aged between 15 and 17 months, were chosen for the study. These animals were housed in optimal conditions, received sufficient nutrition, and were subjected to appropriate health management practices.
2.2. Selection and Management of Pre-Pubertal Buffaloes
The study involved three groups of buffalo heifers, all housed in semi-intensive systems with access to both indoor and outdoor areas. These heifers were aged 15 months, with weights ranging between 250 and 300 kg. Diet primarily consisted of green fodder or silage, supplemented with wheat straw, concentrates, and a mineral mixture, depending on availability. Each buffalo was ear-tagged for identification and underwent thorough health checks, including transrectal examinations to ensure there were no reproductive abnormalities. Only heifers with a body condition score of at least 3 on a 5-point scale [37] and confirmed good health were included in the study.
2.3. Study Design
Eighteen prepubertal buffalo heifers, aged between 15 and 17 months and weighing 250-300 kg, were randomly assigned to three groups (Table 1). Progesterone assays were conducted on day 10 and day 2 prior to initiating treatment to verify their prepubertal status.
Group I comprised six heifers chosen for the study. To confirm their prepubertal status, blood samples were taken on the 10th and 2nd days before the start of the experiment and analyzed for progesterone levels. Subsequently, each animal received oral altrenogest at a dosage of 0.044 mg/kg body weight per day for 14 consecutive days, starting on day 0. On days 26 and 36, the heifers received an intramuscular injection of a GnRH analogue (20µg Buserlin acetate). Additionally, on day 33, a PGF2α analogue (500µg Cloprostenol sodium) was administered, followed by fixed-time artificial insemination (AI) on day 36. For a detailed representation of the experimental protocol, please refer to Figure 1.
Group II consisted of six heifers that underwent blood sampling on the 10th and 2nd days preceding the experiment to assess progesterone levels and confirm their prepubertal status. Subsequently, each heifer had a CIDR applicator intravaginally inserted for 14 days, starting on day 0. On days 23 and 33, all heifers received an intramuscular injection of a GnRH analogue (20 µg Buserlin acetate). Furthermore, on day 30, all heifers were administered an intramuscular injection of a PGF2α analogue (500 µg Cloprostenol sodium). Fixed-time artificial insemination (AI) was then conducted on day 33, as outlined in Figure 2.
Group III comprised six heifers that underwent blood sampling on the 10th and 2nd days prior to the experiment to analyze progesterone levels and confirm their prepubertal status. Subsequently, the heifers received intramuscular injections of a GnRH analogue (20 µg Buserlin acetate) on days 23 and 33. Additionally, on days 30 and 33, all heifers were administered an intramuscular injection of a PGF2α analogue (500 µg Cloprostenol sodium), followed by fixed-time artificial insemination (AI) on day 33. Please refer to Figure 3 for a detailed depiction of the experimental protocol.
2.4. Observations and Sampling
2.4.1. Blood Collection
Blood samples (5ml) were obtained via jugular venipuncture using polystyrene vacutainer tubes containing heparin (1:1000) anticoagulant before each transrectal ultrasonography examination. To confirm the prepubertal status, blood samples were collected ten and two days before the initiation of progesterone treatment. These blood samplings occurred on days: 0, 7, 14, 23/26, 30, and 33/36 (Table 2). The tubes were promptly placed on ice and transported to the laboratory. Plasma was separated by centrifugation (3000 rpm, 15 minutes) and stored at -20°C until analysis. Plasma estradiol, plasma progesterone, and levels of six cytokines (IFNγ, IL6, IL1, IL13, TNFα, and TGFβ) were measured using specific ELISA kits on different days.
2.4.2. Ultrasonographic Observations
Eighteen buffalo heifers underwent transrectal examination and ultrasonography to evaluate the location and size of ovarian follicles. Ultrasonography was conducted on designated days to monitor the growth of the dominant follicle, regression of the corpus luteum, and the presence of a corpus luteum or pregnancy. Ovarian activity was assessed using an Easy Scan ultrasound machine equipped with a versatile 5/7.5 MHz linear array rectal transducer (ALR, 575 probe).
2.4.3. Pregnancy Diagnosis
Pregnancy confirmation was conducted using B-mode ultrasonography on days 45 and 60 post artificial insemination. The presence of a fetus, observed as an echogenic structure surrounded by a non-echogenic area, indicated a successful pregnancy [38].
2.4.4. Hormone Estimation
The quantification of serum progesterone levels was performed using the XEMA progesterone enzyme immunoassay kit. Estradiol and cytokines were estimated using BT lab kits.
2.5. Statistical Analysis
Data generated from various ELISA estimations were presented as Mean ± Standard Error of the Mean (SEM). Statistical analysis was conducted using SPSS Statistical 22.0. Within day comparisons were performed using repeated measures ANOVA, followed by pairwise comparisons using the least significant difference test. Between groups comparison was done by using one-way ANOVA followed by Duncan Multiple range for finding out which of the groups are significantly different. Karl Pearson’s correlation coefficients were determined to establish the relationship between various cytokines and AMH.
3. Results
3.1.Estradiol 17-β
The levels of estradiol 17-β estimated at the start (day 0) of experiment were 16.57 ± 2.05 pg/mL, 15.09 ± 2.47 pg/mL and 17.45 ± 0.98 pg/mL in Group 1, 2 and 3, respectively During the Progesterone supplementation, the values were 18.52 ± 1.15pg/mL and 19.26 ± 0.72 pg/mL on days 7 and 14, respectively in Group 1. In Group 2, the respective values for estradiol 17-β on 7 and 14 days of CIDR placement were 18.35 ± 1.22 pg/mL and 16.26 ± 1.79 pg/mL, respectively. Group 3, buffalo heifers served as control, where the estradiol 17-β values were 17.02 ± 1.03pg/mL on day 7 and 17.8 ± 1.29 pg/mL on day 14. Estradiol 17-β in all the Groups during progesterone supplementation didn’t differ statistically. However, slight elevation was seen in heifers fed altrenogest, 19.26 ± 0.72 pg/mL compared to Group 2, 16.26 ± 1.79pg/mL, and Group 3, 17.8 ± 1.29 pg/mL (Table 3).
At the start of Co-synch programme, on day 26 in Group 1 and day 23 in Group 2 and 3 the values for estradiol 17-β were 20.11 ± 0.36 pg/mL, 20.07 ± 0.35 pg/mL and 15.83 ± 3.19 pg/mL, respectively. Estradiol 17-β didn’t differ statistically at GnRH I administration. On day 7, post-GnRH I treatment and at the time of prostaglandin administration, the values were 19.77 ± 0.34 pg/mL, 19.6 ± 0.55 pg/mL and 19.77 ± 0.57 pg/mL in Group 1,2 and 3, respectively. Estradiol 17-β did not differ between the Groups on day 7, but in altrenogest Group they showed a decreasing trend. On day 9 (day of estrus and GnRH II administration) the values reported for Group 1, 2 and 3 were 14.41 ± 1.97 pg/mL, 16.2 ± 3.14 pg/mL and 19.94 ± 0.44 pg/mL respectively. Estradiol 17-β didn’t differ between Groups but the values were significantly lower in altrenogest Groups followed by CIDR then Co-synch. However, Estradiol 17-β levels in altrenogest Group on day 9 (14.41b ± 1.97 pg/mL) were significantly lower as compared to levels on day 7(19.77 ± 0.34 pg/mL) and day 0 (20.11 ± 0.36 pg/mL) of start of Co-synch programme (Table 3). The values of estradiol 17-β didn’t differ in CIDR an control Group at Co synch programme.
3.2. Progesterone
Progesterone levels were similar in all the 3 Groups (0.68 ± 0.06 ng/mL, 0.68 ± 0.10 ng/mL and 0.68 ± 0.09 ng/mL respectively in Group 1,2 and 3) at the start of progesterone supplementation. During the course of progesterone supplementation in Group 1, the levels of Progesterone varied from 0.59 ± 0.15ng/mL on day 7 to 0.97 ± 0.15ng/mL on day 14 and differed significantly (P<0.05). In Group 2, on days 7 and 14 during CIDR treatment, there was a significant change in progesterone level on day 7, 2.66 ± 1.00ng/mL and then reduced slightly to 1.03 ± 0.18ng/mL on day 14 and didn’t differ significantly. In Group 3, the values ranged from 0.81± 0.12 ng/mL on day 7 to 1.21 ± 0.29 ng/mL on day 14 of progesterone treatment. The level of progesterone in CIDR group on day 7 differ significantly (P<0.05) (Table 4) among the correspondence.
During Co-synch protocol, levels of progesterone varied from 0.63 ± 0.16 ng/mL on day 0 to 1.33 ± 0.36 ng/mL on day7 and 1.17 ± 0.18 ng/mL on day 9 in the altrenogest group. In CIDR group, the values reported were 0.96 ± 0.36ng/mL on day 0, followed by 1.37 ± 0.20 on day 7 and 0.46 ± 0.08 ng/mL on day 9. Similarly, for Co synch group, progesterone varied from 0.88 ± 0.23 ng/mL on day 0, followed by 1.91 ± 0.39 ng/mL on day 7 and 0.51 ± 0.10 ng/mL on day 9.
The values of Progesterone reported during Co- synch group didn’t differ significantly between the groups on day 0 and 7, whereas on day 9, the values for progesterone in Group1 were significantly higher (P<0.01) as compared to group 2 and group3. On the other hand, progesterone levels in Group 2 differed significantly on day 7(P<0.05) on day 7 as compared to days 0 and 9, whereas in Group3, the values of day 7 were significantly higher as compared to day 0 and day 9 (P<0.01) (Table 4).
3.3. Anti Mullerian Hormone
During the days of Progesterone treatment, the AMH value in Group 1, 2 and 3 were almost similar across the days. However, in Group1, on day 14 of Altrenogest treatment, AMH was significantly high (6.60 ± 1.17 ng/L) as compared to day 7 (2.73 ± 0.51ng/L) and day 0 (1.61 ± 0.41 ng/L) (Table 5).
During the period of Co – Synchronization, AMH was almost similar within the groups, as well as, within the days. AMH was lower than the values reported for buffalo calves in another study on Murrah buffalo calves at our place indicative of the role of AMH in the onset of puberty (Table 5).
3.4. Interferon-γ (IFNγ)
IFNγ concentrations during the period of Progesterone supplementation in Group 1 ranged from 227.23 ± 31.83ng/L at the start of progesterone supplementation, followed by 202.14 ± 23.82ng/L on day 7 and 237.03 ± 47.15ng/L on day 14. The corresponding values for Group 2 were 347.67 ± 85.28ng/L on day 0 to 255.48 ± 68.02ng/on day 7 and 342.22 ± 73.24ng/L on day 14. and in the control Group 3, the values for IFNγ were 207.12 ± 55.29ng/L on day 0, 170.83 ± 35.39ng/L on day 7 and 202.78 ± 43.09ng/L on day 14, (Table 6). The values of IFNγ didn’t differ statistically between the groups and within the groups over the period of treatment.
IFN- γ levels during the Co-synch protocol varied from 204.92 ± 20.2ng/L on day 0 to 382.12 ± 85.01ng/L on day 7 and 203.82 ± 30.26 ng/L on day 9 in altrenogest Group. In CIDR Group, the values observed were 324.46 ± 63.5ng/L on day 0, followed by 296.78 ± 66.16ng/L on day 7 and 296.7 ± 59.79ng/L on day 9. Likely, for Co-synch Group, IFNγ values were 205.07 ± 20.32 ng/L on day 0, followed by 269.05 ± 38.47ng/L on day 7 166.96 ± 24.47ng/L on day 9. The IFNγ values didn’t differ significantly between the groups on any days of treatment. On the other hand, the IFNγ values with Group3 differed significantly (P<0.05) on day 9 compared to 0 and 7 (Table 6).
IFN- γ levels during the Co-synch protocol varied from 204.92 ± 20.2ng/L on day 0 to 382.12 ± 85.01ng/L on day 7 and 203.82 ± 30.26 ng/L on day 9 in altrenogest Group. In CIDR Group, the values observed were 324.46 ± 63.5ng/L on day 0, followed by 296.78 ± 66.16ng/L on day 7 and 296.7 ± 59.79ng/L on day 9. Likely, for Co-synch Group, IFNγ values were 205.07 ± 20.32 ng/L on day 0, followed by 269.05 ± 38.47ng/L on day 7 166.96 ± 24.47ng/L on day 9. The IFNγ values didn’t differ significantly between the groups on any days of treatment. On the other hand, the IFNγ values with Group3 differed significantly (P<0.05) on day 9 compared to 0 and 7 (Table 6).
3.5. Interleukin-1 (IL1)
IL1 levels during the period of progesterone supplementation was 717.68 ± 298.27ng/L on start of progesterone treatment to 742.89 ± 199.48ng/L on day 7 and 684.37 ± 197.41ng/L on day 14. The values of Group2 were 742.49 ± 159.75ng/L on day 0, followed by 604.83 ± 120.69ng/L on day 7 and 536.46 ± 116.87ng/L on day 14. In the control Group 3, the levels of IL1 were 392.41 ± 148.93ng/L on day 0, followed by 706.03 ± 202.09ng/L on day 7 and 412.39 ± 83.11ng/L on day 14. During the progesterone supplementation IL1 didn’t differ between the groups and within the groups across days (Table 7).
During Co-Synch programme, levels varied from 382.31 ± 123.55ng/L on day the start of Co-synch programme to 755.16 ± 195.41ng/L on day 7 and 723.14 ± 232.52ng/L on day 9. In Group2, the values ranged from 370.57 ± 67.56ng/L on day 0 to 339.81± 112.94ng/L on day 7 and 279.01 ± 84.73ng/L on day 9. here as in Group3, the concentrations of IL1 were concentrations of IL1 were 438.02 ± 169.26ng/L on day 0, 231.12 ± 70.39ng/L on day 7 and 229.04 ± 77.33ng/L on day 9.
However, the levels in altrenogest supplemented group during co synch period differed significantly (P = 0.043) and were more compared to start of co synch. The increase in IL1 levels across day 7 (P= 0.038) and 9 (P= 0.024) were significantly higher in altrenogest supplemented group as compared to CIDR treatment and Co synch alone. But the values of IL1 didn’t differ between CIDR treatment and Co synch alone (Table 7).
3.6. Interleukin-6 (IL6)
IL6 serum concentrations at the start of Progesterone treatment were 138.61 ± 41.45ng/mL, 103.07 ± 48.04ng/mL and 55.47 ± 14.58ng/mL in Group 1,2 and 3, respectively. The concentrations apparently were more in all Groups by day 7,170.17 ± 60.18ng/L, 137.77 ± 46.80ng/L and123.35 ± 49.20ng/L in Group 1, 2 and 3 respectively. On day 14, IL6 levels remained almost similar in Group 1, 172.84 ± 37.35 ng/L but reduction was observed in Group 2, 101.29 ± 48.80ng/mL and 3, 56.43 ± 21.84 ng/L (Table 8).
IL6 levels in Group1 varied from 152.22 ± 54.79ng/mL on day of start of Co synch to 127.89 ± 28.67ng/mL on day 7, followed by 160.38 ± 37.55ng/mL on day 9. But they were statistically not different. In Group2, the values at the start of Co synch were 119.34± 33.00ng/mL, which was significantly different (P = 0.012) than those observed on day 7 (69.30 ± 16.99 ng/mL) and day 9 (163.03 ± 38.61ng/mL). In co synch Group, no significant difference across the days was evident. (Table 8).
3.7. Interleukin-13 (IL13)
IL13 recorded in buffalo heifers was 60.36 ± 30.27, 69.22 ± 20.39ng/L and46.89 ± 11.42ng/L in Groups 1, 2 and 3, respectively on the start of progesterone supplementation. By day 7, the levels of IL 13 were 50.44 ± 15.18ng/L, 93.42 ± 24.3ng/L and 60.26 ± 23.34ng/L in respective groups. It was observed that with the values were changing from 60.36 ± 30.27 ng/L on day 0 to 40.37 ± 9.06 on day 14 in Group 1. But the values were almost similar. However, there was a slight reduction. The values of IL13 across the days of Progesterone supplementation didn’t differ statistically between the groups as well as across the days (Table 9).
During the period of co-synch, IL13 levels varied from 37.83 ± 18.78ng/L at the start of co-synch to 86.84 ± 21.66 ng/L in Group 1. But the values were statistically similar. However, an increasing trend on day 9 was observed. In Group2 and 3, the values didn’t differ significantly across the days nor did they show any increasing or decreasing trend (Table 9).
3.8. Transforming Growth Factor-β (TGFβ)
TGFβ levels were 17.25 ± 7.04ng/mL, 36.15 ± 6.24ng/mL and 23.31 ± 4.39 ng/mL in Groups 1, 2 and 3, respectively on the start of progesterone treatment. By day 7, the values indicated an increasing trend in all the Groups (22.27 ± 6.63ng/mL, 44.51 ± 2.95ng/mL and 32.46 ± 7.32ng/mL in Groups 1, 2, and 3, respectively). On day 14, the values reduced to (21.00 ± 6.05ng/mL, 43.07 ± 2.51ng/mL and 34.52 ± 7.29 ng/mL in Group 1, 2 and 3, respectively and different significantly (P = 0.044) (Table 10).
TGFβ ranged as 23.76 ± 6.13ng/mL, 32.08 ± 5.35ng/mL and 30.44 ± 8.63ng/ mL in Group 1, Group 2, and Group 3, respectively at the start of Co-Synch protocol (day 0). The values of TGFβ were 16.51 ± 6.25ng/mL, 34.23 ± 6 ng/mL and 32.97 ± 4.74ng/mL in Group1, 2 and 3, respectively on day 7 of start of Co-synch protocol and the values across the days and between the groups were almost similar. 6.01ng/mL) (Table 10).
3.9. Tumor Necrosis Factor-α (TNFα)
TNFα concentrations were 19.85 ± 2.47ng/mL in Group 1, 29.18 ± 3.96ng/mL in Group 2 and 27.92 ± 1.61 ng/mL in Group 3 on start of progesterone treatment. By day 7 TNFα values were 18.67 ± 2.73ng/mL, 32.68 ± 2.83ng/mL and 26.91 ± 4.62 ng/mL in the respective groups. TNFα values were almost similar across the days in the respective groups but on day 7 and day 14, they were statistically different between the groups showing lower levels in altrenogest group, followed by control and highest in Group2 (Table 11).
TNFα values at the start of Co- synch were 17.75± 2.34ng/mL, 29.81 ± 2.50ng/mL and 23.08 ± 2.44 in Group 1, 2, 3 respectively and were significantly more in Group2 followed by Group3 and Group1 (P = 0.011). At day 7 and day 9 of co-synchronization, there was no difference in TNFα between the groups and across the days (Table 11).
3.10. Size of Largest Follicle
At the start of Progesterone treatment, the size of follicles was 3.08 ± 0.33mm in Group 1, 3.00 ± 0.45mm in Group 2 and 2.71 ± 0.36mm in Group 3. The size of follicle was almost similar ranging from 2.71 ± 0.36mm to 3.08 ± 0.33mm in all the groups. On day 7 of the progesterone treatment in Group1, the size was (6.83 ± 0.70mm in Group1 and 7.17 ± 0.79mm in Group 2 whereas, in the control group 4.00 ± 0.52mm indicating better follicular growth in progesterone supplemented group as compared to control (P = 0.009). By day 14 of progesterone supplementation, the follicle size was 8.17 ± 0.70mm in the altrenogest group, followed by 6.67 ± 1.4mm in CIDR and 6.83 ± 0.75mm in the control group. The difference in size was non-significant between the groups. However, the size of the follicle in altrenogest group was significantly better on day 14 (P<0.001). In CIDR group, no doubt the follicle was increased on day 14, but it was not statistically different. Looking into the control group, the follicle size at day 14, day7 and day 0 differed significantly (P = 0.010) (Table 12).
During Co synchronization programme on day 0,7 and 9, the size of follicle across the days in three groups were almost similar. However, within the altrenogest group, the size was more on day 7 and 9 of Co-synch programme (p = 0.018). But in the CIDR group, the follicle size was almost similar on day 7 and 9, but significantly more as compared to day of start of Co synch programme. In control group also, the size of follicle was better as compared to day 0 post co- synchronization (P = 0.008) (Table 12).
3.11. Pregnancy Outcome and Cyclicity
The current study utilized the Co-Synch protocol along with altrenogest supplementation at a dosage of 0.044 mg per kg of body weight per day. The objective was to assess whether a short-term supplementation (14 days) of a progesterone analogue to pre-pubertal buffalo heifers, followed by withdrawal, would induce estrous behavior. All six (100%) buffalo heifers subjected to the Altrenogest-Modified Co-Synch protocol (Group 1) displayed estrus, mirroring the outcomes observed in six buffalo heifers in Group 2 following the CIDR-Co-Synch protocol, as well as in the six individuals in the control group (Co-Synch) (Group 3). Behavioral signs of estrus were most evident on the day of Fixed-Time Artificial Insemination (FTAI).
In Group 1 of pre-pubertal heifers, the pregnancy rate was 33.33 percent, with two out of six buffalo heifers conceiving, while 33.33 percent and 0 percent of heifers conceived in Group 2 and 3, respectively. Additionally, two more animals exhibited estrus in the next cycle in Group 1, whereas it was absent in Group 2 and 3, revealing the benefits of altrenogest feeding.
3.12. Karl Pearson Correlation Coefficient within Hormones, Cytokines and Follicular Size
3.12.1. Altrenogest Group
AMH had positive correlation with cytokines, hormones and follicle size, but the correlations were not stastically significant. For estradiol 17-β, there existed a positive correlation with cytokines except IL13 and TNFα. Further estradiol 17-β was negatively correlated with progesterone as well as the follicle size. However, the correlations were not stastically significant. Progesterone hormone had positive correlations with cytokines, AMH and follicle size but the correlation with IFNγ was significantly positive (r = 0.626, P<0.01). Estradiol 17-β had negative correlation with progesterone which also non-significant. The follicle size of the largest follicle showed positive correlation with cytokines, IFNγ and IL13 and negative correlations with cytokines IL1, IL6, TGFβ, TNFα, but they were not significantly on positive or negative correlation (Table 13).
3.12.2. Controlled Internal Drug Release (CIDR) Group
AMH revealed significantly high positive correlation with IFNγ (r = 0.673, P<0.01) and TGFβ (r= 0.463, P<0.01) and indicated negative correlation with all other cytokines and hormones, but the correlations were not significantly negative except for TNFα (r= -0.342, P<0.05), where it was showing significant negative correlation. Estradiol 17-β indicated significant negative correlation with IFNγ (r = -0.348, P<0.01) but all other correlations were not significantly negative or positive. Progesterone had a significant negative correlation with IFNγ (r = -0.454,P <0.01) whereas, all other correlations were not significant. Among the cytokines, TGFβ had significant positive correlation with IFNγ (r= 0.439, P<0.01). TNFα was positively correlated (P, 0.01) with IL1 (r = 0.466), IL6 (r= 0.486) and IL13 (r = 0.507) whereas, it was negatively correlated with IFNγ (r= -0.373, P<0.05) (Table 14).
3.12.3. Co-Synch Group
Evaluation of Karl Pearson correlation coefficients during Co synch programme, without progesterone supplementation, revealed are present in Table 23. Significant positive correlation between AMH and TGFβ (r= 0.408, P<0.05) was evident. There existed positive correlations between AMH and IL1, IL6 but all other correlations were negative. Estradiol 17- β had significant positive correlations with follicle size (r= 0.341, P< 0.05) whereas progesterone showed significant negative correlation with IL6 (r= -0.349, P<0.05). Between the cytokines IL13 and IL6 showed a high positive correlation (r= 0.349, P<0.05). Also IL13(r= 0.037, P<0.05) and TGFβ were highly positively correlated. Also, TNFα showed significantly positive correlation (r= 0.391, P<0.05) with IL1. (Table 15)
4. Discussion
4.1. Estradiol 17β
Estradiol 17β concentrations observed in the present study were similar to the findings of Aulakh and coworkers [35]. Our study, which involved prepubertal heifers aged 15 months, recorded lower estradiol levels compared to the study mentioned, which involved heifers aged 18 months. At the initial GnRH injection, estradiol levels ranged from 2.5 to 9.05 pg/mL and increased to 6.7 to 13.02 pg/mL, as documented by Roy and Prakash in 2009. GnRH is thought to stimulate follicle growth by inducing gonadotropin production, thereby promoting the synthesis of estrogen and estradiol 17β before ovulation.
4.2. Progesterone
During the 15-day altrenogest treatment period, progesterone levels increased from 0.30 ± 0.01 ng/mL to 3.93 ± 0.05 ng/mL were similar to the earlier findings [35]. In heifers subjected to the Ovsynch protocol, progesterone levels ranged from 0.70 ng/mL to 2.72 ng/mL [39]. Plasma progesterone levels remained low, between 0.20 and 0.30 ng/mL, from 7 months and 4 days before the onset of puberty. A transient elevation in progesterone levels in buffalo heifers occurred 16 ± 4 days before puberty onset, with a mean of 0.60 ± 0.21 ng/mL and a range of 0.55–1.58 ng/mL [40]. When progesterone concentrations remained above 1 ng/mL for at least three consecutive samples taken at three-day intervals, the second rise in progesterone concentrations (4.27 ± 0.23 ng/mL) indicated the initiation of cyclicity [40]. Before treatment initiation, progesterone values in all groups remained below 1 ng/mL, indicating non-initiation of cyclicity in these heifers, which rose to around 1 ng/mL by day 14 of progesterone treatment in these groups. Subsequently, treatment with Co-synch induced a notable change in progesterone levels by day 9 of the Co-synch program, indicating the resumption of cyclicity in these heifers post-treatment.
4.3. Anti-Mullerian Hormone
AMH concentrations remain relatively stable throughout the estrous cycle in both adult cows and heifers [41, 42]. AMH inhibits the early recruitment of primordial follicles into the growing pool of follicles [13]. By reducing the responsiveness of small antral follicles to FSH, AMH helps regulate antral follicle development by slowing their growth rate and preventing premature ovulation [23]. AMH also plays a role in promoting the atresia of small antral follicles that are not destined for ovulation, ensuring the survival of the healthiest and most viable follicles [43]. It is involved in follicle selection, ensuring dominance of one follicle for ovulation while inhibiting others [44]. AMH concentrations are closely linked to follicle size, with variations observed among individual animals in adult cows and goats [45]. Although the precise mechanisms underlying fluctuations in AMH during the estrous cycle remain unclear, AMH is believed to play a role in the timing of ovulation and synchronization of follicular development. Overall, AMH helps regulate the pace of follicular formation and contributes to maintaining the ovarian reserve [13].
4.4. Interferon-γ (IFNγ)
IFNγ plays a role in controlling the production of inflammatory mediators and proteases associated with follicle rupture and oocyte release [46]. Dysregulation of IFNγ signaling can disrupt folliculogenesis and lead to ovarian dysfunction [47]. By modulating the expression and activity of key enzymes involved in steroid hormone synthesis, such as cytochrome P450 enzymes, IFNγ can influence ovarian steroidogenesis [48]. Additionally, IFNγ can impact the functions of immune cells involved in maintaining ovarian homeostasis and function, including macrophages and T cells [49].
4.5. Interleukin-1 (IL1)
IL1 plays a significant role in regulating gonadotropin activity in the reproductive system and affects granulosa cells. It promotes granulosa cell proliferation and differentiation, thereby intricately modulating follicular dynamics [50]. IL1 halts granulosa cell luteinization during the follicular phase without compromising cell viability, indicating a nuanced regulatory role [51]. IL1 blocks basal progesterone secretion and LH-induced progesterone secretion, preventing the appearance of granulosa cell receptors for LH [52,53]. This modulation highlights its potential as a factor inhibiting luteinization of follicles, with limited impact on hormone secretion by differentiated luteal cells [54]. IL1 also affects thecal and interstitial cells, reducing androgen synthesis induced by gonadotropins, and potentially influencing estrogen synthesis [50]. Estradiol and progesterone regulate IL1 secretion by macrophages, with low doses stimulating production and high concentrations inhibiting it [55]. The transcription of IL1 genes increases in response to gonadotropins during pre-ovulation, coinciding with its inflammatory effects such as prostaglandin biosynthesis and activation of plasminogen and collagen activators [50]. IL1 prompts tissue remodelling and lesions necessary for follicle rupture, requiring coordination between theca and granulosa cells [56]. IL1 stimulates the production of nitric oxide, suggesting its involvement in ovulation mechanisms [57]. Natural IL1 receptor antagonists inhibit ovulation in experimental models, underscoring the importance of balanced IL1 signalling by various cellular contributors such as macrophages, granulosa cells, and potentially the maturing oocyte.
4.6. Interleukin-6 (IL6)
The current study investigating IL6 in relation to reproductive outcomes, combined with synchronization programs, has not been previously documented in literature. However, research in humans and other species has shed light on its role in enhancing follicular growth. IL6 plays a crucial role in the complex process of follicle development, including folliculogenesis. It modulates cell proliferation, differentiation, follicle survival, atresia, and oocyte maturation along with other cytokines [58]. IL6 levels in follicular fluid exceed those in serum, indicating its significance within the ovarian microenvironment [59]. Several clinical studies have explored the potential impact of IL6 on human oocyte maturation and embryo development. Elevated IL6 levels have been associated with improved clinical pregnancies by enhancing embryo implantation [60, 61]. Conversely, elevated IL6 levels have been linked to diminished embryo quality and decreased likelihood of successful pregnancies [62]. In swine, IL6 receptors have been identified as promoters of granulosa cell survival [63]. In humans, the interaction between IL6 and its soluble receptor, IL6(sR), is implicated in regulating follicle growth and atresia [60]. IL6 is thought to exert autocrine control over ovarian function and cumulus-cell expansion in mice by inducing the expression of genes critical for extracellular matrix formation/stability and immune cell function [64].
4.7. Interleukin-13 (IL13)
IL13 cytokine levels in buffalo calves and heifers have not been investigated previously. This study aimed to assess IL13 levels, given its role as an anti-inflammatory cytokine. Previous research in human ovarian tissue has shown elevated IL13 levels during the luteal phase, primarily within granulosa cells and theca cells [65]. The simultaneous increase in ovarian IL13 expression alongside elevated gonadotropin hormone levels suggests potential hormonal regulation of these interleukins in a cell-specific manner [66]. Additionally, the increased proliferation and differentiation of human granulosa cells and theca cells during follicular growth, along with immune cell trafficking during the menstrual cycle, coincide with the heightened ovarian expression of IL13 [66].
4.8. Transforming Growth Factor-β (TGFβ)
The literature lacks reports on TGFβ levels in buffalo heifers following Progesterone supplementation and Co-synchronization programs. The TGFβ superfamily encompasses various cytokines such as bone morphogenetic proteins, growth differentiation factors, inhibin, activin, follistatin, and AMH. These factors orchestrate follicular growth through a bidirectional communication system involving paracrine and autocrine mechanisms. Kristen and colleagues noted that TGFβ superfamily pathways are involved in the intrafollicular events marking the onset of follicular growth in early human folliculogenesis. The TGFβ superfamily includes oocyte-secreted factors that shape the microenvironment of developing follicles, actively contributing to folliculogenesis through paracrine and autocrine pathways [67]. TGFβ superfamily growth factors play a role in regulating early human folliculogenesis and hold promise for the treatment and prevention of female infertility [68]. TGFβ signaling assists in maintaining a balance between follicle development and atresia [69]. The TGFβ family impacts the recruitment of primordial follicles, granulosa cell proliferation, differentiation, and apoptosis, among other phases of folliculogenesis [8]. TGFβ regulates the production of progesterone and estrogen by granulosa and luteal cells in conjunction with other growth factors and hormones [70]. In the present study, TGFβ values remained relatively consistent across sampling days, suggesting a potential role in the follicle recruitment process.
4.9. Tumor Necrosis Factor-α (TNFα)
To date, there have been no reported TNFα in buffalo calves and heifers in the literature. The current study observed lower TNFα values in the altrenogest supplemented group, suggesting a potential role in folliculogenesis. Steroids may regulate TNFα secretion in the ovary, with stimulation at low concentrations and inhibition at high concentrations [55]. IL1 and TNFα, produced by macrophages, induce the production of oxygen-derived radicals through the endothelium [57]. TNFα, in addition to its cytotoxic effects, triggers coagulation in the capillaries surrounding the follicles upon binding to specific receptors [71]. This dual action of TNFα results in endothelial cell damage and subsequent reduction in vascularization, ultimately leading to atresia.
4.10. Size of Largest Follicle
The size of the dominant or largest subordinate follicles remained consistent as the first ovulatory cycle approached, and there was no notable expansion during subsequent ovulatory cycles. The growth rates of follicles (1.4 ± 0.1 mm/day) and regression rates (1.2 ± 0.1 mm/day) did not vary as the animals matured, and the inter-wave interval increased until the occurrence of the first ovulation, consistent with findings by Evans and co-workers in 1994. These observations regarding the size of the dominant follicle in the present study align with the results of Imwalle and co-workers in 1998, who investigated the effects of melgesterol acetate (MGA) on follicles in prepubertal heifers compared to controls. The administration of MGA between Days 0 and 7 led to an increase in the diameter of the largest follicle between Days -1 and 8 (p = 0.01) in MGA-treated heifers, while no significant change was observed in control heifers (p = 0.933). The diameter of the largest follicle did not differ significantly between groups on Days -1 (p = 0.616) and 3 (p = 0.506), but it was larger in MGA-treated heifers on Day 6 (p = 0.002). By Day 8, the diameter of the largest follicle was no longer significantly different from controls (p = 0.201). These findings are consistent with those reported by Aulakh (2020)[76], who noted an increase in the number of large-sized follicles (>8 mm) in Group 1 on day 10 of altrenogest feeding, reaching 1.26 ± 0.12 by day 15.
4.11. Pregnancy Outcome and Cyclicity
Squires and co-workers in 1983 conducted field trials involving 449 mares to assess the efficacy of orally administered altrenogest at a dosage of 27 mg daily for 15 days. Results showed that all mares resumed estrus within 10 days following altrenogest treatment, with 56% of them conceiving within 18 days, and 80% conceiving within 45 days. However, altrenogest, dissolved in neobee oil and orally administered at a dosage of 0.044 mg per kg of body weight for 15 days, did not induce estrus or ovulation in mares [72]. Davis and associated in 1985 compared the fertility rates of 104 artificially inseminated gilts following estrous synchronization with altrenogest administered at a dosage of 15 mg per gilt per day for 18 days. The results indicated that 72.8 percent of the gilts successfully gave birth. Beef heifers orally administered altrenogest at a rate of 0.044 mg per kg body weight per head per day for seven to fifteen days, followed by PGF2α injection on the seventh day. Seventy percent of the beef heifers in the altrenogest-treated group exhibited standing behavioral estrus. The pregnancy rates achieved by the altrenogest treatment group were 66% (27 out of 41) [73]. CIDR-treated heifers exhibited a significantly higher proportion displaying signs of estrus within 120 hours after the removal of the progestin compared to MGA-treated heifers. CIDR-treated heifers displayed estrus and were inseminated within 60 hours of PGF2a compared to heifers treated with MGA. However, the percentage of pregnant heifers did not differ significantly between those treated with MGA (66%) and CIDR (62%) [74]. Ferguson and coworkers in 2010 assessed altrenogest (ALT) efficacy in estrus synchronization in 135 crossbred heifers. The ALT-treated group exhibited a higher percentage (66%) of heifers displaying behavioral estrus compared to the MGA-treated group (48%). However, pregnancy and calving rates were similar between the two groups (66%). In guinea pigs, synchronization on farms following altrenogest administration (0.1 mL po once daily) for 15 days resulted in ovulation within 4.43 ± 0.13 days in females, followed by mating [75]. Hinglak fed oral altrenogest at a dose of 0.44 mg per kg body weight per day to pubertal heifers, of which nine displayed estrus and five were able to conceive, yielding a pregnancy rate of 35.7%. Buffalo heifers fed altrenogest at 0.044mg/kg bwt/day for 13 days in combination with the Ovsynch Protocol revealed a higher pregnancy rate and early estrus induction [76]. Altrenogest decreased the percentage of primordial and atretic small follicles while increasing the number of large antral follicles in prepubertal gilts compared to the control. It also reduced the percentage of primary follicles and increased the total number of antral follicles in mature gilts. Furthermore, altrenogest negatively impacted follicular fluid progesterone concentration and decreased levels of prostaglandin (PG) E2 in prepubertal gilts and PGF2α metabolite in mature gilts. Additionally, it down-regulated CYP17A1 mRNA in the prepubertal theca layer and PGF2α synthase expression in the granulosa and theca layer of mature gilts [77].
4.12. Karl Pearson Correlation Coefficient between Hormones, Cytokines and Follicular Size
4.12.1. Altrenogest Supplementation Group
The Karl pearson correlation coefficient analysis indicates that IFNγ which was positively correlated with Progesterone can be taken as indicator for ensuing puberty and follicular growth. Follicular growth as demonstrated by immune modulating effects of progesterone especially during pregnancy, baby rejection by the immune system [78].
Progesterone, a hormone, can influence the activity of immune cells and the production of cytokines like IFNγ, thereby impacting the immunological response. Progesterone regulates the expression of IFNγ by immune cells, suggesting a direct hormonal influence on IFNγ levels [79]. Fluctuations in hormone levels can affect the production of IFNγ, which plays a role in inflammatory processes and the body’s response to infections. Progesterone’s influence on IFNγ expression is particularly notable in inflammatory conditions, indicating its regulatory role in controlling IFNγ-mediated inflammation [80]. Throughout the menstrual cycle and pregnancy, IFNγ levels fluctuate, suggesting potential interactions between progesterone and IFNγ in the reproductive process [81].
4.12.2. CIDR Group
Significant positive correlation of AMH with IFNγ and TGFβ reveals that AMH is important in immunomodulation and tissue remodelling effecting immunological responses and inflammation. The relationship reveals a positive association of these two molecules with AMH [82].
Negative associations between AMH and TNFα interprets that TNFα-mediated inflammatory processes, implicated in a number of reproductive diseases, are adversely correlated with AMH levels [83]. Positive relationship between AMH and TGFβ) is indicative of the fact that IFNγ may influence immunological responses and ovarian function [84].
On the other hand, reverse association with progesterone and estradiol 17-β reveals that that IFNγ inhibits the synthesis of ovarian steroid hormones [85]. TNFα is a pro-inflammatory cytokine that can stimulate the production of other inflammatory cytokines including IL1, IL6, and IL13 resulted in positive correlation between TNFα and IL1, IL6, and IL13.
4.12.3. Co-Synch Group
AMH serves as an indicator of ovarian reserve and influences TGFβ-mediated processes involved in tissue remodeling and follicular development. Studies have indicated a positive correlation between AMH and TGFβ levels [82]. Estradiol 17-β, a hormone crucial for follicular growth and development, is likely associated with follicle quantity or maturity, as suggested by its positive correlation with estradiol levels [86]. Pro-inflammatory cytokines TNFα and IFNγ often cooperate to regulate inflammation and immune responses, reflecting their coordinated functions in inflammatory processes [87]. TNFα and IL1, both pro-inflammatory cytokines, mutually reinforce each other’s production, amplifying inflammatory responses through positive feedback loops [88]. The positive relationship between IL6 and IL13 levels may indicate shared signaling pathways or regulatory systems [89]. IL6 can suppress progesterone synthesis and activity through various mechanisms, resulting in a negative association between their levels [90]. TGFβ levels may be influenced by IL13 activation or expression, providing a potential explanation for the positive association between their levels [91].
5. Conclusions
Altrenogest supplementation during synchronization protocols resulted in significantly lower estradiol levels compared to the control and CIDR groups on Day 9 of Co-synch treatment. This suggests a potential effect of altrenogest on estradiol regulation during puberty induction in buffalo heifers.
Progesterone levels differed significantly between groups, particularly on Day 7 of both P4 and Co-synch treatments. Altrenogest supplementation led to a notable increase in progesterone by Day 14 of treatment, suggesting its influence on progesterone production. Additionally, all groups showed significant variations in progesterone on Day 9 of Co-synch, indicating a potential role for the protocol itself in regulating progesterone levels during puberty induction.
A strong positive correlation was observed between interferon-gamma (IFNγ) and progesterone, suggesting that IFNγ plays a role in buffalo heifer puberty. Furthermore, altrenogest supplementation with AMH showed significant positive correlations with IFNγ and TGFβ, while exhibiting a negative correlation with TNFα. These findings suggest complex interactions between AMH and specific cytokines during puberty induction with altrenogest.
Based on the correlation analysis, IL13 and TGFβ emerged as potential markers for buffalo heifer puberty. Future research exploring these factors in a larger study population could be beneficial.
Author Contributions
Sneha SH is the first author and made significant contributions to the entire research process. This includes: Conceptualization: Developing the core idea and research question. Methodology: Designing the experiment and choosing the methods. Validation: Ensuring the soundness of the research design and methods. Formal analysis: Analyzing the collected data using appropriate statistical methods. Investigation: Conducting the experiment and collecting data. Writing - Original Draft: Preparing the first and main draft of the manuscript. Dr. Prahlad Singh served as the major advisor and provided substantial guidance throughout the research: Conceptualization: Contributing to the development of the research question. Methodology: Offering advice on designing the experiment. Resources: Securing the necessary resources for the research. Data Curation: Overseeing the collection and storage of data. Reviewing & Editing: Providing critical feedback on the manuscript. Supervision: Guiding and mentoring the research work. Project Administration: Managing the overall research project. Funding Acquisition: Securing funding to support the research. Drs. Navdeep Singh Ratta, Chanchal Singh, and Mrigank Honparkhe provided valuable expertise during the research process: Discussion: Offering insights on the methodology, references, supervision, and interpretation of results.
Funding
Authors gratefully acknowledge the invaluable support and funding provided by the Indian Council of Agricultural Research (ICAR), New Delhi, under the auspices of the All India Coordinated Research Project (AICRP) on Nutritional and Physiological Interventions for Enhancing Reproductive Performance in Animals (Project Number ICAR-19). Work is a part of students Master’s research.
Institutional Review Board Statement
The study, conducted between March and October 2023 at the Directorate of Livestock Farms, Guru Angad Dev Veterinary and Animal Sciences University (GADVASU) in Ludhiana, employed a rigorous approach to animal welfare. Buffalo calves and heifers selected for the experiment were housed in optimized environments that met their specific needs. This included providing them with adequate and balanced nutrition to support their growth and development, along with implementing comprehensive health management practices to ensure their well-being. To further ensure ethical treatment, the study received prior approval from the Institutional Animal Ethics Committee (IAEC) vide letter no. GADVASU/2023/IAEC/69/11 dated 22/05/2023.
Acknowledgments
Authors gratefully acknowledge the invaluable support and funding provided by the Indian Council of Agricultural Research (ICAR), New Delhi, under the auspices of the All India Coordinated Research Project (AICRP) on Nutritional and Physiological Interventions for Enhancing Reproductive Performance in Animals (Project Number ICAR-19). Work is a part of students Master’s research.
Conflicts of Interest
The authors declare no conflicts of interest.
References
- Minervino, A. H. H., Zava, M., Vecchio, D., Borghese, A. Bubalus bubalis: A short story. Front. Vet. Sci. 2020. 570413, 9-12. [CrossRef]
- Kumar, R., Singh, P., Goyal, R.K., Hb, S., Kumhar, B.L. Existing housing and feeding management practices of buffaloes in Firozabad district of Uttar Pradesh, India. Int. J. Curr. Microbiol. Appli. Sci. 2017, 6, 1831-1838. [CrossRef]
- Vasantha, S. K. I., Kona, S. S. R. Physiology of puberty in females: A review. Int. J. Vet. Sci. Anim. Hus. 2016, 2, 23-26.
- Gupta, S.K., Singh, P., Shinde, K.P., Lone, S.M., Kumar, N., Kumar, A. Strategies for attaining early puberty in cattle and buffalo:a review. Agri.Rev. 2016, 37, 160-167. [CrossRef]
- Orsi, N. M., Tribe, R. M. Cytokine networks and the regulation of uterine function in pregnancy and parturition. J. Neuroendocrinol. 2008, 4, 462-469. [CrossRef]
- Arsenescu, R., Arsenescu, V., De Villiers, W. J. TNFα and the development of the neonatal immune system: Implications for inhibitor use in pregnancy. Offic. J Am. Col. Gastroenterol.| 2011, 4, 559-562. [CrossRef]
- Witkin, S. S., Linhares, I. M., Bongiovanni, A. M., Herway, C., Skupski, D. Unique alterations in infection-induced immune activation during pregnancy. BJOG: Int. J. Obst. Gynae. 2011, 2, 145-153. [CrossRef]
- Knight, P. G., Glister, C. TGFβ superfamily members and ovarian follicle development. Reprod. 2006, 2, 191-206. [CrossRef]
- Wu, R., Van der Hoek, K. H., Ryan, N. K., Norman, R. J., Robker, R. L. Macrophage contributions to ovarian function. Hum. Reprod. 2004, 12, 119-133. [CrossRef]
- Tarrant, J. M. Blood cytokines as biomarkers of in vivo toxicity in preclinical safety assessment: Considerations for their use. Toxicol. Sci. 2010., 1, 4-16. [CrossRef]
- Casazza, K., Hanks, L. J., Alvarez, J. A. Role of various cytokines and growth factors in pubertal development. Cytokines, Growth Mediators and Physical Activity in Children during Puberty. 2010, 55, 14-31. [CrossRef]
- Jost, A., Vigier, B., PrÉPin, J., Perchellet, J. P. Studies on sex differentiation in mammals. 1973. In Proceedings of the 1972 Laurentian Hormone Conference (pp. 1-41). Academic Press. [CrossRef]
- Durlinger, A., Visser, J., Themmen, A. Regulation of ovarian function: The role of anti-Mullerian hormone. Reprod. 2002, 5, 601-609. http://hdl. handle.net/1765/10008.
- Gigli, I., Cushman, R. A., Wahl, C. M., Fortune, J. E. Evidence for a role for anti-Müllerian hormone in the suppression of follicle activation in mouse ovaries and bovine ovarian cortex grafted beneath the chick chorioallantoic membrane. Mol. Reprod Dev. 2005, 4, 480-488. [CrossRef]
- Durlinger, A. L., Gruijters, M. J., Kramer, P., Karels, B., Kumar, T. R., Matzuk, M. M., Themmen, A. P. Anti-Mullerian hormone attenuates the effects of FSH on follicle development in the mouse ovary. Endocrinol. 2001, 11, 4891-4899. [CrossRef]
- Vigier, B., Picard, J. Y., Tran, D., Legeai, L., and Josso, N. Production of anti-Müllerian hormone: Another homology between Sertoli and granulosa cells. Endocrinol. 1984. 4, 1315-1320. [CrossRef]
- Takahashi, M., Hayashi, M., Manganaro, T. F., Donahoe, P. K. The ontogeny of mullerian inhibiting substance in granulosa cells of the bovine ovarian follicle. Bio. Reprod. 1986, 35(2), 447-453. [CrossRef]
- Monniaux, D., Clemente, N. D., Touzé, J. L., Belville, C., Rico, C., Bontoux, M., Fabre, S. Intrafollicular steroids and anti-Müllerian hormone during normal and cystic ovarian follicular development in the cow. Bio. Reprod. 2008, 79(2), 387-396. [CrossRef]
- Bezard, J., Vigier, B., Tran, D., Mauleon, P., Josso, N. Immunocytochemical study of anti-Müllerian hormone in sheep ovarian follicles during fetal and post-natal development. Reprod. 1987, 2, 509-516. [CrossRef]
- Ueno, S., Takahashi, M., Manganaro, T. F., Ragin, R. C., Donahoe, P. K. Cellular localization of mullerian inhibiting substance in the developing rat ovary. Endocrinol. 1989, 2, 1000-1006. [CrossRef]
- Hirobe, S. E. I. I. C. H. I., He, W. W., Lee, M. M., Donahoe, P. K. Mullerian inhibiting substance messenger ribonucleic acid expression in granulosa and Sertoli cells coincides with their mitotic activity. Endocrinol. 1992, 2, 854-862. [CrossRef]
- Rajpert-De Meyts, E., Jørgensen, N., Græm, N., Müller, J., Cate, R. L., Skakkebæk, N. E. Expression of anti-Mullerian hormone during normal and pathological gonadal development: Association with differentiation of Sertoli and granulosa cells. J. Clin. Endocrinol. Metab. 1999, 10, 3836-3844. [CrossRef]
- Weenen, C., Laven, J. S., Von Bergh, A. R., Cranfield, M., Groome, N. P., Visser, J. A.,and Themmen, A. P. 2004. Anti-Müllerian hormone expression pattern in the human ovary: Potential implications for initial and cyclic follicle recruitment. Mol. Hum.Reprod. 2, 77-83. [CrossRef]
- Dutertre, M., Gouédard, L., Xavier, F., Long, W. Q., di Clemente, N., Picard, J. Y., Rey, R. Ovarian granulosa cell tumors express a functional membrane receptor for anti-Mullerian hormone in transgenic mice. Endocrinol. 2001, 9, 4040-4046. [CrossRef]
- Salmon, N. A., Handyside, A. H., Joyce, I. M. Oocyte regulation of anti-Müllerian hormone expression in granulosa cells during ovarian follicle development in mice. Dev. Bio. 2004, 1, 201-208. [CrossRef]
- Seifer, D. B., MacLaughlin, D. T., Christian, B. P., Feng, B., Shelden, R. M. Early follicular serum müllerian-inhibiting substance levels are associated with ovarian response during assisted reproductive technology cycles. Fertil. and Steril. 2002, 3, 468-471. [CrossRef]
- Van Rooij, I. A. J., Broekmans, F. J. M., Te Velde, E. R., Fauser, B. C. J. M., Bancsi, L. F. J. M. M., Jong, F. D., Themmen, A. P. N. Serum anti-Müllerian hormone levels: A novel measure of ovarian reserve. Hum. Reprod. 2002, 12, 3065-3071. [CrossRef]
- Fanchin, R., Taieb, J., Lozano, D. H. M., Ducot, B., Frydman, R., Bouyer, J. High reproducibility of serum anti-Müllerian hormone measurements suggests a multi-staged follicular secretion and strengthens its role in the assessment of ovarian follicular status. Hum. Reprod. 2005, 4, 923-927. [CrossRef]
- Pigny, P., Merlen, E., Robert, Y., Cortet-Rudelli, C., Decanter, C., Jonard, S., Dewailly, D. Elevated serum level of anti-mullerian hormone in patients with polycystic ovary syndrome: Relationship to the ovarian follicle excess and to the follicular arrest. J. Clin. Endocrinol. Metab. 2003, 12, 5957-5962. [CrossRef]
- Laven, J. S., Mulders, A. G., Visser, J. A., Themmen, A. P., De Jong, F. H., Fauser, B. C. Anti-Mullerian hormone serum concentrations in normoovulatory and anovulatory women of reproductive age. J. Clin. Endocrinol. Metab. 2004, 1, 318-323. [CrossRef]
- Broer, S. L., Dólleman, M., Opmeer, B. C., Fauser, B. C., Mol, B. W., Broekmans, F. J. M. AMH and AFC as predictors of excessive response in controlled ovarian hyperstimulation: A meta-analysis. Hum. Reprod. 2011, 1, 46-54. [CrossRef]
- Hinglak, S. 2013. Studies on reducing age at first calving by oral progesterone feeding in pubertal murrah buffalo heifers. (M.V.Sc. Thesis, submitted to Guru Angad Dev Veterinary and Animal Sciences University, Ludhiana, India).
- Abouel-Ghaitb, H. Progesterone-based hormonal treatments to induce and synchronize the onset of puberty in buffalo-heifers. Kafrelsheikh Vet. Med.l J. 2021, 1:20-25. [CrossRef]
- Naseer, Z., Ahmad, N., Khan, M. I. R., Ahmad, E., Tahir, M. Z., Singh, J. Effect of GnRH and estradiol benzoate on follicular wave emergence, estrus, ovulation and pregnancy rate in CIDR treated Nili-Ravi buffaloes. J. Anim. Plant Sci. 2012, 3, 142-146.
- Aulakh, A. S., Singh, P., Singh, G., Dhindsa, S. S., Honparkhe, M. Kaur, A. Effect of altrenogest feeding in prepubertal buffalo heifers vis-a-vis plasma estrogen-progesterone levels and biochemical profile. Int. J. Curr. Microbiol. Appli. Sci. 2020. 8, 2337-2347.
- Mingoti, G. Z., Neves, T. V., Silva, J. C. B., Oliveira, L. O. F., Nogueira, E.. Use of Melengestrol Acetate in nutritional blocks for heifers under extensive pastures. Anim. Reprod. 2018, 3, 316.
- Anitha, A., Rao, K. S., Suresh, J., Moorthy, P.S., Reddy, Y. K. A body condition score (BCS) system in Murrah buffaloes. Buff. Bull. 2011, 31, 79-99. https://www.researchgate.net/publication/286531067.
- Pierson, R. A., Ginther, O. J. Ultrasonographic appearance of the bovine uterus during the estrous cycle. J. Am. Vet. Med. 1987, 8, 995-1001.
- Roy, K. S., and Prakash, B. S. Changes in endocrine profiles during ovsynch and ovsynch plus norprolac treatment in Murrah buffalo heifers at hot summer season. Trop. Anim. Health Prod. 2009. 41, 677-687. [CrossRef]
- Haldar, A., Prakash, B. S. Growth hormone-releasing factor (GRF) induced growth hormone advances puberty in female buffaloes. Anim. Reprod. Sci. 2006, 92, 254-267. [CrossRef]
- Rico, C., Fabre, S., Médigue, C., Clemente, N. D., Clément, F., Bontoux, M., Monniaux, DAnti-Müllerian hormone is an endocrine marker of ovarian gonadotropin-responsive follicles and can help to predict superovulatory responses in the cow. Bio. Reprod. 2009, 1, 50-59. [CrossRef]
- Ireland, J. J., Smith, G. W., Scheetz, D., Jimenez-Krassel, F., Folger, J. K., Ireland, J. L. H., Evans, A. C. O. Does size matter in females? An overview of the impact of the high variation in the ovarian reserve on ovarian function and fertility, utility of anti-Müllerian hormone as a diagnostic marker for fertility and causes of variation in the ovarian reserve in cattle. Reprod. Fertil. Dev. 2010, 1, 1-14. [CrossRef]
- Carlsson, I. B., Scott, J. E., Visser, J. A., Ritvos, O., Themmen, A. P. N., Hovatta, O. Anti-Müllerian hormone inhibits initiation of growth of human primordial ovarian follicles in vitro. Hum. Reprod. 2006, 9, 2223-2227. [CrossRef]
- Pellatt, L., Rice, S., Dilaver, N., Heshri, A., Galea, R., Brincat, M., Mason, H. D. Anti-Müllerian hormone reduces follicle sensitivity to follicle-stimulating hormone in human granulosa cells. Fertil. Steril. 2011, 5, 1246-1251. [CrossRef]
- Monniaux, D., Drouilhet, L., Rico, C., Estienne, A., Jarrier, P., Touzé, J. L. Fabre, S. Regulation of anti-Müllerian hormone production in domestic animals. Reprod. Fertil. Dev. 2012 1, 1-16. [CrossRef]
- Zhang, Y., Proenca, R., Maffei, M., Barone, M., Leopold, L., Friedman, J. M. Positional cloning of the mouse obese gene and its human homologue. Nature, 1994, 6505, 425-432.
- Yeung, E. H., Sundaram, R., Ghassabian, A., Xie, Y., Buck Louis, G. Parental obesity and early childhood development. Pediatrics, 2017, 2. [CrossRef]
- Simon, L., Spiewak, K. A., Ekman, G. C. Regulation and action of interferon-γ in the mouse testis. Endocrinol. 2010, 151, 1470-1481.
- Huber, R., Pietsch, D., Günther, J., Welz, B., Vogt, N., Brand, K. Regulation of monocyte differentiation by specific signaling modules and associated transcription factor networks. Cell. Mol. life Sci. 2014, 71, 63-92.
- Hurwitz, A., Payne, D. W., Packman, J. N., Andreani, C. L., Resnick, C. E., Hernandez, E. R., Adashi, E. Y. Cytokine-mediated regulation of ovarian function: Interleukin-1 inhibits gonadotropin-induced androgen biosynthesis. Endocrinol. 1991, 129, 1250-1256. [CrossRef]
- Fukuoka, M., Mori, T., Taii, S., Yasuda, K. Interleukin-1 inhibits luteinization of porcine granulosa cells in culture. Endocrinol. 1988. 122, 367-369. [CrossRef]
- Barak, V., Yanai, P., Treves, A. J., Roisman, I., Simon, A., Laufer, N. Interleukin-1: Local production and modulation of human granulosa luteal cells steroidogenesis. Fertil. Steril. 1992, 58, 719-725. [CrossRef]
- Gottschall, P. E., Katsuura, G., Hoffmann, S. T., Arimura, A. Interleukin 1: An inhibitor of luteinizing hormone receptor formation in cultured rat granulosa cells. FASEB J. 1988, 9, 2492-2496. [CrossRef]
- Fukuoka, M., Yasuda, K., Emi, N., Fujiwara, H., Iwai, M., Takakura, K., Mori, T. A. K. A. H. I. D. E. Cytokine modulation of progesterone and estradiol secretion in cultures of luteinized human granulosa cells. J. Clin. Endocrinol.Metab. 1992, 75, 254-258. [CrossRef]
- Polan, M. L., Daniele, A., Kuo, A. Gonadal steroids modulate human monocyte interleukin-1 (IL1) activity. Fertil. Steril. 1998, 49, 964-968. [CrossRef]
- Hurwitz, A. R. Y. E., Dushnik, M. A. T. A. T., Solomon, H. A. I. M., Ben-Chetrit, A., Finci-Yeheskel, Z. V. E. Z. D. A. N. A., Milwidsky, A. R. I. E. L., Yagel, S. I. M. C. H. A. Cytokine-mediated regulation of rat ovarian function: Interleukin-1 stimulates the accumulation of a 92-kilodalton gelatinase. Endocrinol. 1993 132, 2709-2714. [CrossRef]
- Ben-Shlomo, I., Adashi, E. Y., Payne, D. W. The morphogenic/cytotoxic and prostaglandin-stimulating activities of interleukin-1 beta in the rat ovary are nitric oxide independent. J. Clin. Invest. 1994, 94, 1463-1469.
- Ghodsi, M., Hojati, V., Attaranzade, A., Saifi, B. A Cross-sectional study on the follicular fluid concentration of some interleukins and clinical factors in polycystic ovary syndrome patients. Int. J. Womens Health Reprod. Sci. 2021, 9, 124-9.
- Kollmann, Z., Schneider, S., Fux, M., Bersinger, N. A., von Wolff, M. Gonadotrophin stimulation in IVF alters the immune cell profile in follicular fluid and the cytokine concentrations in follicular fluid and serum. Hum.Reprod. 2017, 32, 820-831. [CrossRef]
- Kawasaki, F., Kawano, Y., Kosay Hasan, Z., Narahara, H., Miyakawa, I. The clinical role of interleukin-6 and interleukin-6 soluble receptor in human follicular fluids. Clin. Exp. Med. 2003, 3, 27-31.
- Qin, L., Xu, W., Li, X., Meng, W., Hu, L., Luo, Z., Li, S. Differential expression profile of immunological cytokines in local ovary in patients with polycystic ovarian syndrome: Analysis by flow cytometry. Eur. J. Obstet. Gynecol. Reprod. Biol. 2016, 197, 136-141. [CrossRef]
- Bou Nemer, L., Shi, H., Carr, B. R., Word, R. A., Bukulmez, O. Effect of single-dose ibuprofen on follicular fluid levels of interleukins in poor responders undergoing in vitro fertilization. Syst. Biol. Reprod. Med. 2019, 65, 48-53. [CrossRef]
- Maeda, A., Goto, Y., Matsuda-Minehata, F., Cheng, Y., Inoue, N., Manabe, N. Changes in expression of interleukin-6 receptors in granulosa cells during follicular atresia in pig ovaries. J. Reprod. Dev. 2007, 53, 727-736. [CrossRef]
- Liu, Z., de Matos, D. G., Fan, H. Y., Shimada, M., Palmer, S., Richards, J. S. Interleukin-6: An autocrine regulator of the mouse cumulus cell-oocyte complex expansion process. Endocrinol. 2009, 150, 3360-3368.
- Ripley, D., Shoup, B., Majewski, A., Chegini, N. Differential expression of interleukins IL13 and IL15 in normal ovarian tissue and ovarian carcinomas. Gynecol. Oncol. 2004,92, 761-768.
- Richards, J. S., Russell, D. L., Ochsner, S., Hsieh, M., Doyle, K. H., Falender, A. E., Sharma, S. C. Novel signaling pathways that control ovarian follicular development, ovulation, and luteinization. Recent Prog. Horm. Res. 2002, 57, 195-220.
- Chang, H., Brown, C. W., Matzuk, M. M. Genetic analysis of the mammalian transforming growth factor-β superfamily. Endocr. Rev., 2002a, 23, 787-823. [CrossRef]
- Kristensen, S. G., Rasmussen, A., Byskov, A. G., Andersen, C. Y. Isolation of pre-antral follicles from human ovarian medulla tissue. Hum. Reprod. 2011, 26, 157-166. [CrossRef]
- Pangas, S. A., Matzuk, M. M. The TGF-beta Family in the Reproductive Tract. Cold Spring Harbor Monograph Series, 2008, 50, 861.
- Chen, Y. G. Endocytic regulation of TGFβ signaling. Cell Res. 2009, 19(1), 58-70.
- Azmi, T. I., O’shea, J. D. Mechanism of deletion of endothelial cells during regression of the corpus luteum. Lab. Invest.; J. Tech. Met. Path.1984, 51, 206-217.
- Squires, E. L., Heesemann, C. P., Webel, S. K., Shideler, R. K., Voss, J. L. Relationship of altrenogest to ovarian activity, hormone concentrations and fertility of mares. J. Anim. Sci. 1983, 56, 901-910. [CrossRef]
- Clarence, E. F. 2004. The use of altrenogest to control reproductive function in beef cattle. (Ph.D. Dissertation, Faculty of Louisiana State University and Agricultural and Mechanical College, The Interdepartmental Program in Animal and Dairy Sciences).
- Tauck, S. A., Wilkinson, J. R. C., Olsen, J. R., Janitell, J. N., Berardinelli, J. G. Comparison of controlled internal drug release device and melengesterol acetate as progestin sources in an estrous synchronization protocol for beef heifers. Theriogenology, 2007, 68, 162-167. [CrossRef]
- Grégoire, A., Allard, A., Huamán, E., León, S., Silva, R. M., Buff, S., Joly, T. Control of the estrous cycle in guinea-pig (Cavia porcellus). Theriogenology, 2012, 78, 842-847. [CrossRef]
- Aulakh, A. S. 2020. Effect of altrenogest feeding vis-à-vis ovsynch regimen in prepubertal buffalo heifers. (M.V.Sc. Thesis, submitted to Guru Angad Dev Veterinary and Animal Sciences University, Ludhiana, India).
- Ziecik, A. J., Drzewiecka, K., Gromadzka-Hliwa, K., Klos, J., Witek, P., Knapczyk-Stwora, K., Kaczmarek, M. M. Altrenogest affects the development and endocrine milieu of ovarian follicles in prepubertal and mature gilts. Bio. Reprod. 2020, 103, 1069-1084. [CrossRef]
- Szekeres-Bartho, J., Wegmann, T. G. A progesterone-dependent immunomodulatory protein alters the Th1Th2 balance. J. of Reprod.Immun., 1996, 31, 81-95. [CrossRef]
- Piccinni, M. P., Giudizi, M. G., Biagiotti, R., Beloni, L., Giannarini, L., Sampognaro, S., Livi, C. Progesterone favors the development of human T helper cells producing Th2-type cytokines and promotes both IL-4 production and membrane CD30 expression in established Th1 cell clones. J. Immune. 1995, 155, 128-133. [CrossRef]
- Oertelt-Prigione, S., Regitz-Zagrosek, V. Progesterone: A critical hormone in modulating the immune response. In Female Immune Response 2009, 151-166. Springer, Berlin, Heidelberg.
- Singh, P. M., Garg, K. Interferon-γ and progesterone levels in women with luteal phase deficiency: A comparative study. J. Hum. Reprod. Sci. 2014, 7, 247–252.
- Dewailly, D., Andersen, C. Y., Balen, A., Broekmans, F., Dilaver, N., Fanchin, R., Anderson, R. A. The physiology and clinical utility of anti-Müllerian hormone in women. Hum. Reprod. 2014, 20, 370-385. [CrossRef]
- Visser, J. A., Themmen, A. P. Anti-Müllerian hormone and folliculogenesis. Mol. Cell. Endocrinol. 2005, 234, 81-86. [CrossRef]
- Sengupta, J., Lalitkumar, P. G., Najwa, A. R., Ghosh, D., Saha, S., Gupta, S. K. Impact of locally released interferon-γ on ovarian steroidogenesis and corpus luteum function in the rat. Mol.Cel. Endocrinol. 2013, 372, 21-30.
- Ledee-Bataille, N., Olivennes, F., Lefaix, J. L., Chaouat, G., Frydman, R., Delanian, S. Combined treatment by pentoxifylline and tocopherol for recipient women with a thin endometrium enrolled in an oocyte donation programme. Hum. Reprod. 2002, 17, 1249-1253. [CrossRef]
- Fanchin, R., Schonäuer, L. M., Righini, C., Guibourdenche, J., Frydman, R., Taieb, J. Serum anti-Müllerian hormone is more strongly related to ovarian follicular status than serum inhibin B, estradiol, FSH and LH on day 3. Hum. Reprod. 2003, 18, 323-327. [CrossRef]
- Cope, A. P., Liblau, R. S. T-cell therapy in the treatment of autoimmune disease. Immunology, 2008, 123, 6-14.
- Dinarello, C. A. 2009. Immunological and inflammatory functions of the interleukin-1 family. Ann. rev. Immunol. 27, 519-550. [CrossRef]
- Grunig, G., Warnock, M., Wakil, A. E., Venkayya, R., Brombacher, F., Rennick, D. M., Corry, D. B. 1998. Requirement for IL13 independently of IL-4 in experimental asthma. Science, 282, 2261-2263.
- Petraglia, F., Florio, P., Nappi, C., Genazzani, A. R. Peptide signaling in human placenta and membranes: Autocrine, paracrine, and endocrine mechanisms. Endo. Rev. 1996, 17, 156-186. [CrossRef]
- Kuperman, D. A., Huang, X., Koth, L. L., Chang, G. H., Dolganov, G. M., Zhu, Z., Erle, D. J. Direct effects of interleukin-13 on epithelial cells cause airway hyperreactivity and mucus overproduction in asthma. Nature Med. 2002, 8, 885-889.
Figure 1.
Altrenogest therapy and Co-synchronization schedule for prepubertal buffalo heifers.
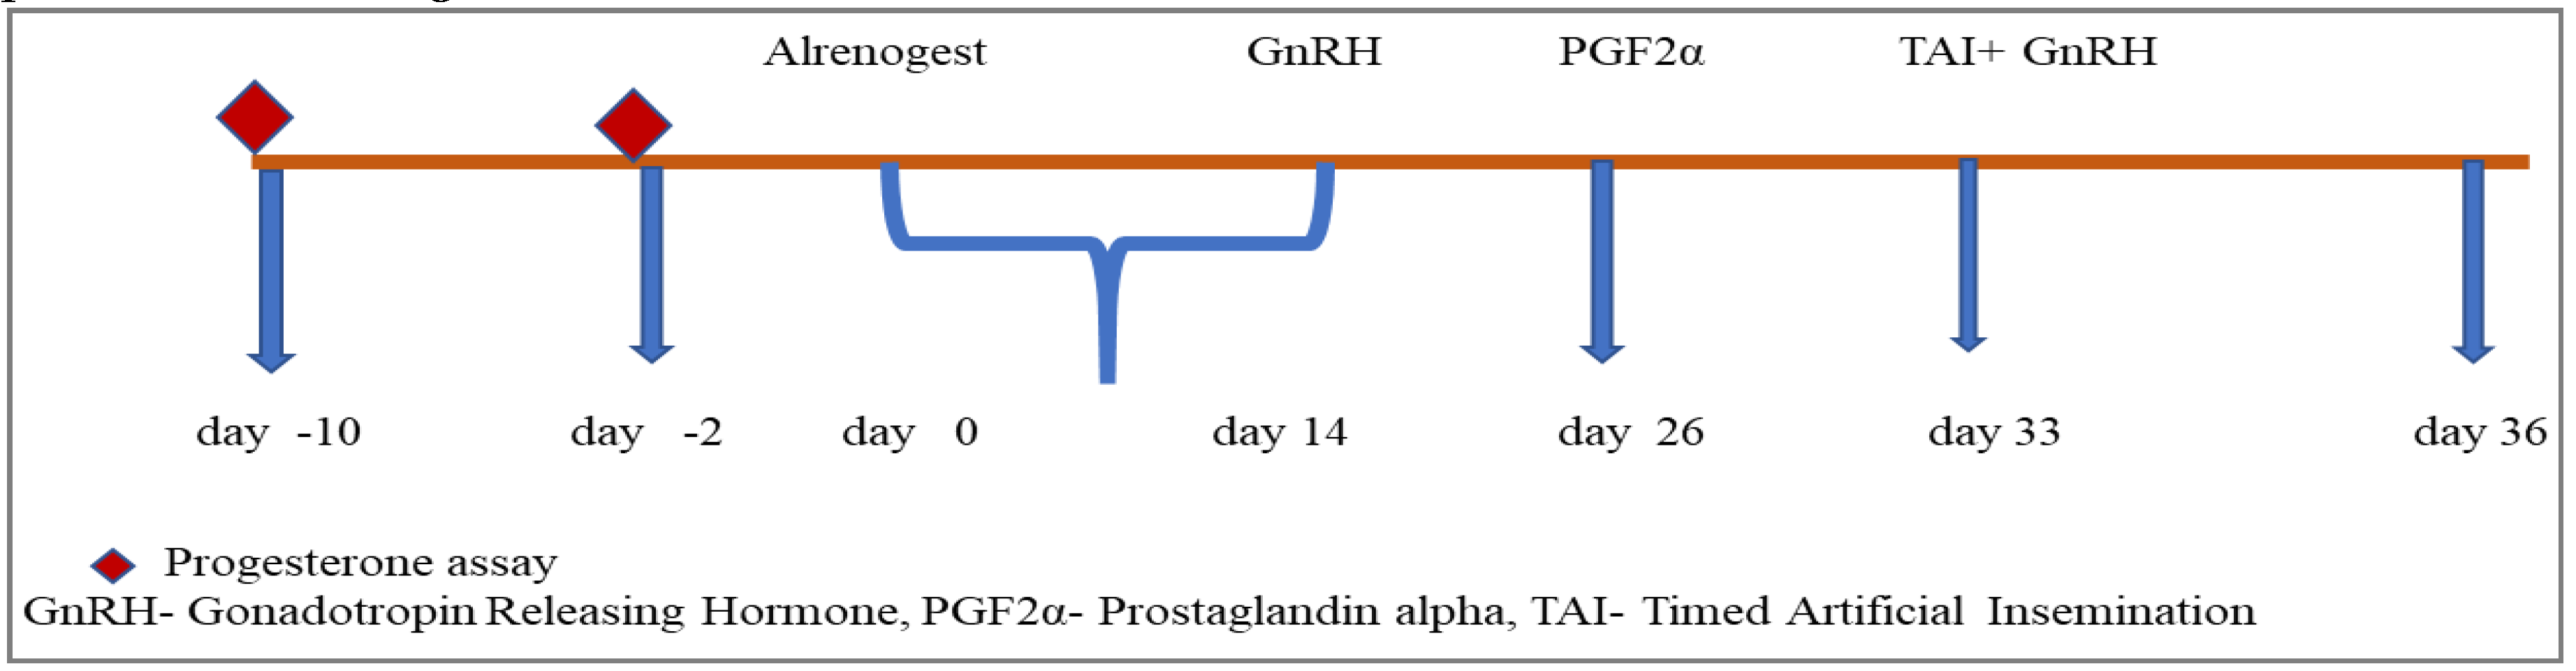
Figure 2.
CIDR and Co-synchronization schedule for prepubertal buffalo heifers.
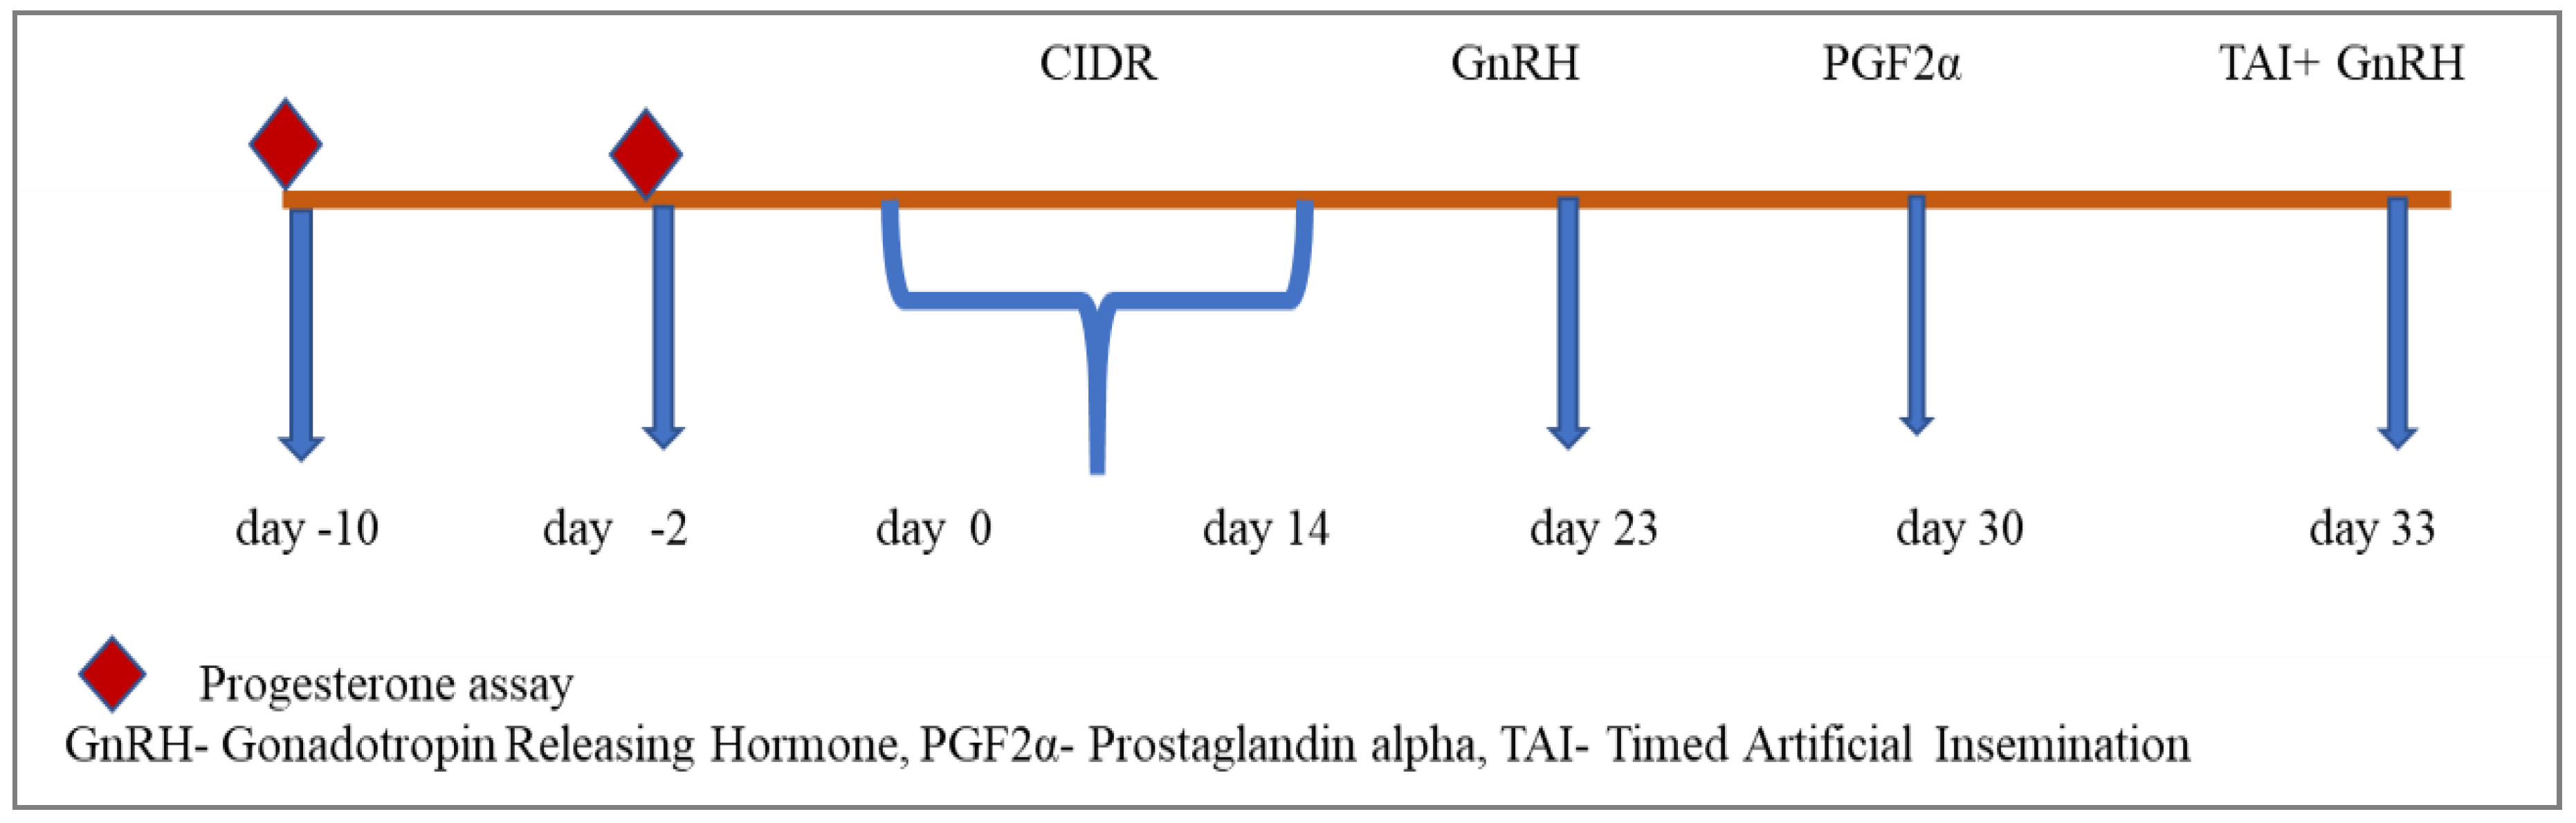
Figure 3.
Co-synchronization schedule for prepubertal buffalo heifers.
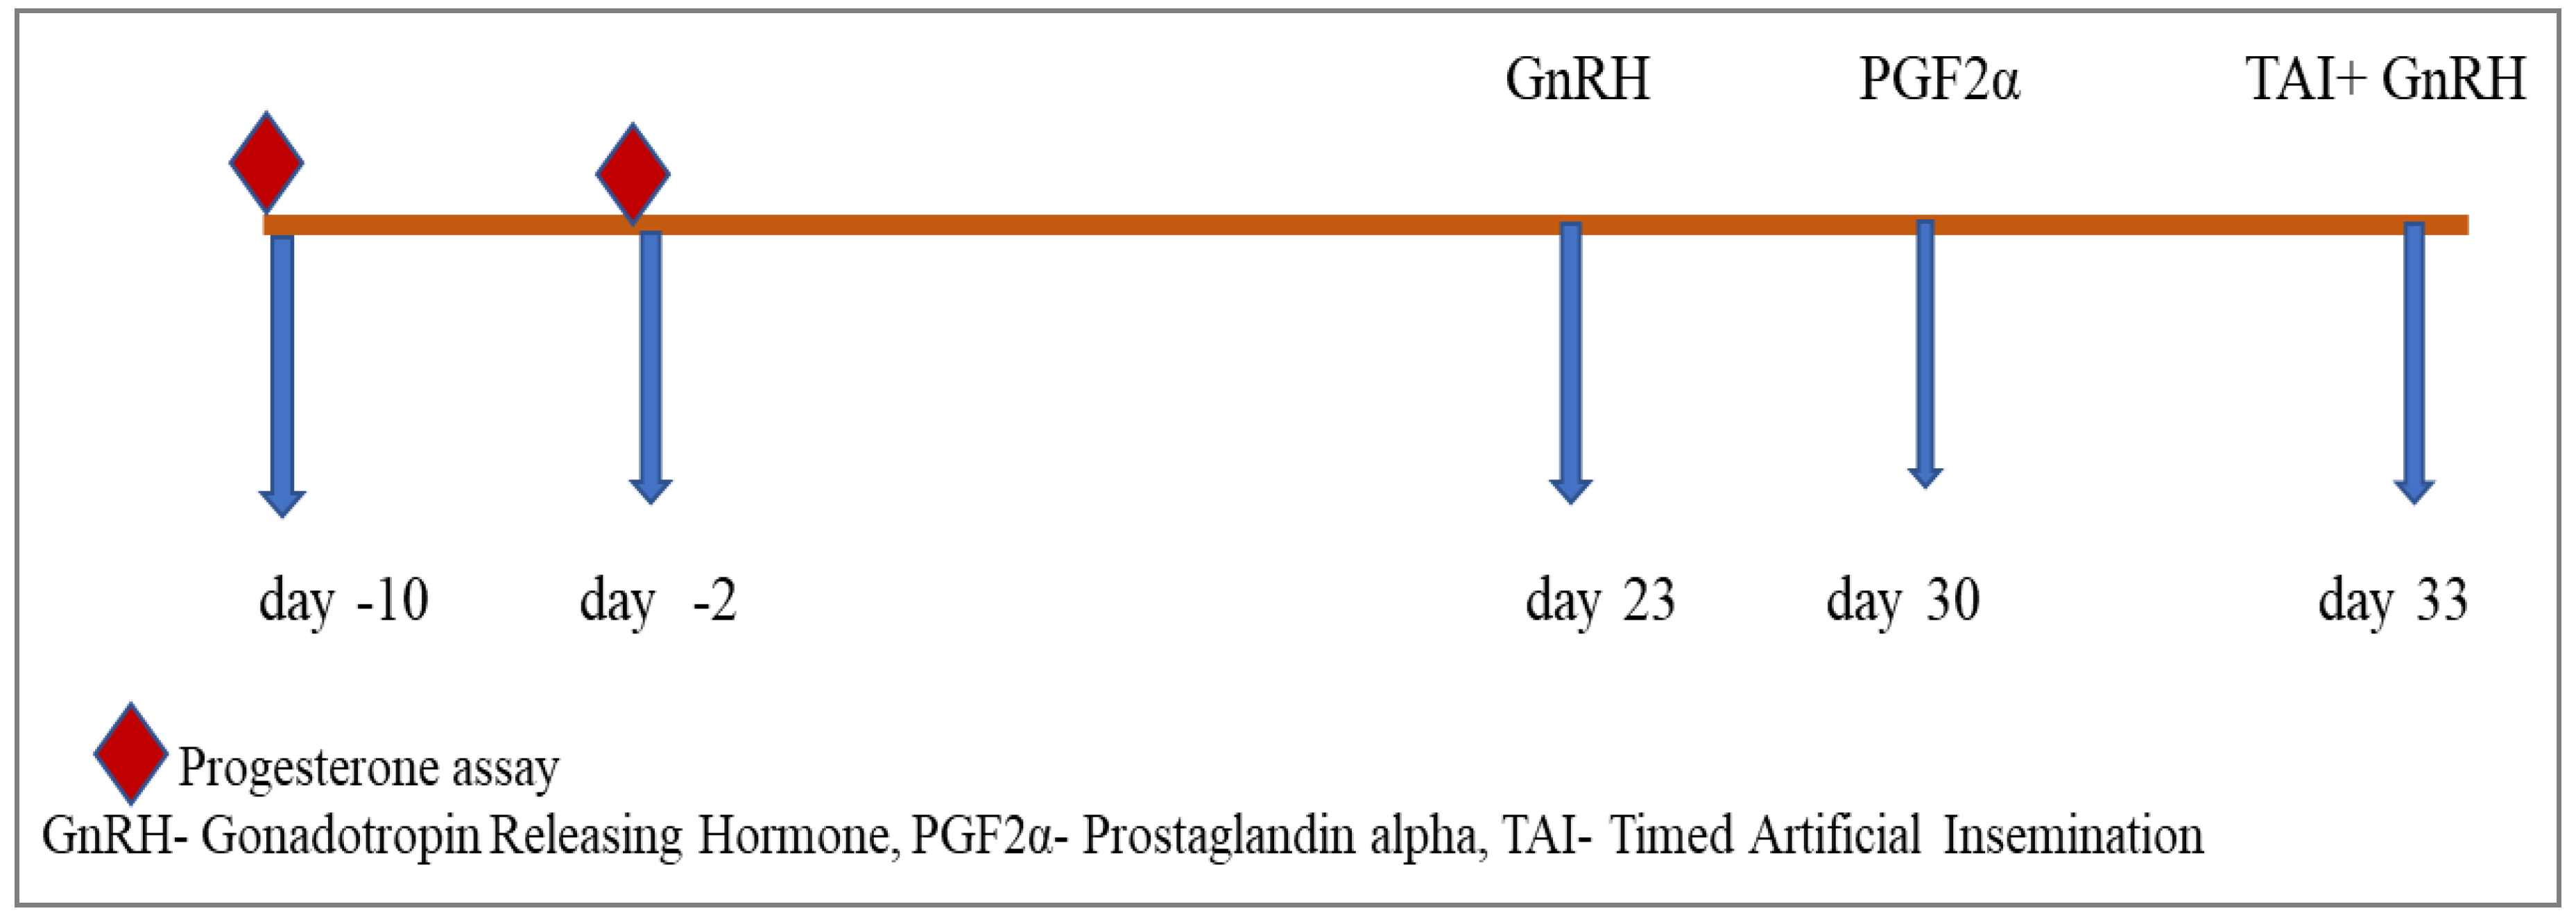

Table 1.
Grouping of prepubertal buffalo heifers as per the treatment administered.
| Group | Number of heifers (n) |
Treatment |
|---|---|---|
| Group I | 6 | Altrenogest @ 0.044mg/kg/day/animal for 14 days plus Modified Co-Synch (Figure 1) |
| Group II | 6 | CIDR plus Co-Synch (Figure 2) |
| Group III | 6 | Co-Synch (Figure 3) |
Table 2.
Sampling (days) across groups of buffalo heifers subjected to Co-synch Protocol.
| Day of sampling (day) | Treatment | Group 1 | Group 2 | Group 3 (Control) |
|---|---|---|---|---|
| 0 | Altrenogest/CIDR | Day 0 | Day 0 | Day 0 |
| 7 | Day 7 | Day 7 | Day 7 | |
| 14 | Day 14 | Day 14 | Day 14 | |
| 23 | Co-Synch | - | Day 0 | Day 0 |
| 26 | Day 0 | - | - | |
| 30 | - | Day 7 | Day 7 | |
| 33 | Day 7 | Day 9 | Day 9 | |
| 36 | Day 9 | - | - |
Table 3.
Estradiol 17-β (Mean ± SEM) pg/mL in buffalo heifers subjected to synchronisation protocols.
Table 3.
Estradiol 17-β (Mean ± SEM) pg/mL in buffalo heifers subjected to synchronisation protocols.
| Period | day | Altrenogest (Group 1) |
CIDR (Group 2) |
Co synch (Group 3) |
P-value |
|---|---|---|---|---|---|
| Day of P4 treatment | 0 (start of P4 treatment) |
16.57±2.05 | 15.09±2.47 | 17.45±0.98 | 0.691 |
| 7 | 18.52±1.15 | 18.35±1.22 | 17.02±1.03 | 0.604 | |
| 14 | 19.26±0.72 | 16.26±1.79 | 17.8±1.29 | 0.313 | |
| P-value | 0.361 | 0.126 | 0.640 | ||
|
During Co-synch |
0 (start of Co-synch) |
20.11a±0.36 | 20.07±0.35 | 15.83±3.19 | 0.210 |
| 7 | 19.77a±0.34 | 19.6±0.55 | 19.77±0.57 | 0.961 | |
| 9 | 14.41b±1.97 | 16.2±3.14 | 19.94±0.44 | 0.213 | |
| P-value | 0.024 | 0.303 | 0.304 |
P< 0.05 level; Means having different letters as superscripts differ significantly within a column of each period.
Table 4.
Progesterone (Mean ± SEM) (ng/ml) in buffalo heifers subjected to synchronisation protocols.
Table 4.
Progesterone (Mean ± SEM) (ng/ml) in buffalo heifers subjected to synchronisation protocols.
| Period | day | Altrenogest (Group 1) | CIDR (Group 2) | Co synch (Group 3) |
P-value |
|---|---|---|---|---|---|
|
Day of P4 treatment |
0 (start of P4 treatment) |
0.68ab±0.06 | 0.68±0.10 | 0.68±0.09 | 0.998 |
| 7 | 0.59bB±0.15 | 2.66A±1.00 | 0.81B±0.12 | 0.048 | |
| 14 | 0.97a±0.15 | 1.03±0.18 | 1.21±0.29 | 0.706 | |
| P-value | 0.043 | 0.064 | 0.096 | ||
|
During Co-synch |
0 (Start of Co-Synch |
0.63±0.16 | 0.96ab±0.36 | 0.88ab±0.23 | 0.664 |
| 7 | 1.33±0.36 | 1.37a±0.20 | 1.91a±0.39 | 0.386 | |
| 9 | 1.17A±0.18 | 0.46bB±0.08 | 0.51bB±0.10 | 0.002 | |
| P-value | 0.159 | 0.041 | 0.007 |
** P< 0.01 level; * P< 0.05 level; Means having different small letters as superscript differ significantly within a column of each period, Means having different capital letter as superscript differ significantly within a row.
Table 5.
AMH (Mean ± SEM) ng/L in buffalo heifers subjected to synchronization protocols.
| Period | day | Altrenogest (Group 1) |
CIDR (Group 2) |
Co synch (Group 3) |
P-value |
|---|---|---|---|---|---|
| Day of P4 treatment | 0 | 1.61b ± 0.41 | 12.4 ± 6.15 | 11.24 ± 4.03 | 0.177 |
| 7 | 2.73b ± 0.51 | 11.63 ± 6.37 | 36.38 ± 29.78 | 0.397 | |
| 14 | 6.60a ± 1.17 | 10.23 ± 4.23 | 31.85 ± 25.89 | 0.463 | |
| P-value | 0.001 | 0.910 | 0.507 | ||
|
During Co-synch |
0 | 4.61 ± 0.61 | 13.96 ± 6.74 | 34.28 ± 26.85 | 0.427 |
| 7 | 5.07 ± 0.95 | 12.02 ± 5.17 | 32.9 ± 26.87 | 0.451 | |
| 9 | 4.68 ± 1.08 | 11.23 ± 4.21 | 7.76 ± 3.25 | 0.360 | |
| P-value | 0.909 | 0.737 | 0.374 |
** P< 0.01 level; ns non-significant, Means having different letter as super script differ significantly within a column of each period.
Table 6.
IFNγ (Mean ± SEM) ng/L in buffalo heifers subjected to synchronisation protocols.
| Period | day | Altrenogest (Group 1) | CIDR (Group 2) | Co synch (Group 3) | P-value |
|---|---|---|---|---|---|
| Days of P4 treatment | 0 (Start of P4 treatment) | 227.23±31.83 | 347.67±85.28 | 207.12±55.29 | 0.249 |
| 7 | 202.14±23.82 | 255.48±68.02 | 170.83±35.39 | 0.446 | |
| 14 | 237.03±47.15 | 342.22±73.24 | 202.78±43.09 | 0.220 | |
| P-value | 0.789 | 0.066 | 0.628 | ||
|
During Co-synch |
0 (Start of Co-Synch) | 204.92±20.2 | 324.46±63.5 | 205.07ab±20.32 | 0.084 |
| 7 | 382.12±85.01 | 296.78±66.16 | 269.05a±38.47 | 0.469 | |
| 9 | 203.82±30.26 | 296.7±59.79 | 166.96b±24.47 | 0.105 | |
| P-value | 0.059 | 0.683 | 0.033 |
* P<0.05 level; ns non-significant, Means having different letters as super script differ significantly within a column of each period.
Table 7.
IL1 levels (Mean±SEM) ng/L in buffalo heifers subjected to synchronisation protocols.
| Period | Day | Altrenogest (Group 1) | CIDR (Group 2) | Co synch (Group 3) | P-value |
|---|---|---|---|---|---|
| Day of P4 treatment | 0 (Start of P4 treatment) |
717.68±298.27 | 742.49±159.75 | 392.41±148.93 | 0.452 |
| 7 | 742.89±199.48 | 604.83±120.69 | 706.03±202.09 | 0.853 | |
| 14 | 684.37±197.41 | 536.46±116.87 | 412.39±83.11 | 0.415 | |
| P-value | 0.960 | 0.505 | 0.282 | ||
|
During Co-synch |
0 (Start of Co-Synch) |
382.31b±123.55 | 370.57±67.56 | 438.02±169.26 | 0.923 |
| 7 | 755.16aA±195.41 | 339.81B±112.94 | 231.12B±70.39 | 0.038 | |
| 9 | 723.14aA±232.52 | 279.01B±84.73 | 229.04B±77.33 | 0.024 | |
| P-value | 0.043 | 0.727 | 0.327 |
* P<0.05 level; ns non-significant, Means having different letters as superscript differ significantly within a column of each period.
Table 8.
IL6 (Mean ± SEM) ng/L in buffalo heifers subjected to synchronisation protocols.
| Period | day | Altrenogest (Group 1) | CIDR (Group 2) |
Co synch (Group 3) | P-value |
|---|---|---|---|---|---|
| Days of P4 treatment | 0 (Start of P4 treatment) | 138.61±41.45 | 103.07±48.04 | 55.47±14.58 | 0.320 |
| 7 | 170.17±60.18 | 137.77±46.80 | 123.35±49.20 | 0.813 | |
| 14 | 172.84±37.35 | 101.29±48.80 | 56.43±21.84 | 0.122 | |
| P-value | 0.788 | 0.820 | 0.316 | ||
|
During Co-synch |
0 (Start of Co-Synch) | 152.22±54.79 | 119.34ab±33.00 | 53.17±15.26 | 0.205ns |
| 7 | 127.89±28.67 | 69.30b±16.99 | 51.20±16.51 | 0.057ns | |
| 9 | 160.38±37.55 | 163.03a±38.61 | 109.6±39.41 | 0.556ns | |
| P-value | 0.823 | 0.012 | 0.148 |
* P<0.05 level; Means having different letter as super script differ significantly within a column of each period.
Table 9.
IL13 (Mean ± SEM) ng/L in buffalo heifers subjected to synchronization protocols.
| Period | Day | Altrenogest (Group 1) | CIDR (Group 2) |
Co-synch (Group 3) | P-value |
|---|---|---|---|---|---|
| Days of P4 treatment | 0 (Start of P4 treatment) |
60.36±30.27 | 69.22±20.39 | 46.89±11.42 | 0.775 |
| 7 | 50.44±15.18 | 93.42±24.3 | 60.26±23.34 | 0.354 | |
| 14 | 40.37±9.06 | 84.09±25.17 | 37.93±11.92 | 0.129 | |
| P-value | 0.568 | 0.124 | 0.620 | ||
|
During Co-synch |
0 (Start of Co-Synch) |
37.83±18.78 | 64.72±6.78 | 42.25±10.09 | 0.316 |
| 7 | 64.11±23.91 | 56.45±8.22 | 40.30±13.50 | 0.594 | |
| 9 | 86.84±21.66 | 45.17±2.90 | 48.69±21.65 | 0.217 | |
| P-value | 0.155 | 0.068 | 0.782 |
* P<0.05 level; ns non-significant, Means having different letters as superscript differ significantly within a column of each period.
Table 10.
TGFβ (Mean ± SEM) ng/mL in buffalo heifers subjected to synchronisation protocols.
| Period | day | Altrenogest (Group 1) | CIDR (Group 2) | Co synch (Group 3) | P-value |
|---|---|---|---|---|---|
| Days of P4 treatment | 0 (Start of P4 treatment) |
17.25±7.04 | 36.15±6.24 | 23.31±4.39 | 0.108 |
| 7 | 22.27±6.63 | 44.51±2.95 | 32.46±7.32 | 0.057 | |
| 14 | 21.00B±6.05 | 43.07A±2.51 | 34.52AB±7.29 | 0.044 | |
| P-value | 0.721 | 0.195 | 0.251 | ||
|
During Co-synch |
0 (Start of Co-Synch) |
23.76±6.13 | 32.08±5.35 | 30.44±8.63 | 0.668 |
| 7 | 16.51±6.25 | 34.23±6 | 32.97±4.74 | 0.080 | |
| 9 | 19.48±8.44 | 35.06±3.2 | 26.67±6.01 | 0.245 | |
| P-value | 0.753 | 0.901 | 0.803 |
* P<0.05 level; Means having different letters as superscript differ significantly within a column of each period.
Table 11.
TNFα (Mean ± SEM) ng/mL in buffalo heifers subjected to synchronization protocols.
| Period | day | Altrenogest (Group 1) | CIDR (Group 2) | Co synch (Group 3) | P-value |
|---|---|---|---|---|---|
| Days of P4 treatment | 0 (Start of P4 treatment) |
19.85±2.47 | 29.18±3.96 | 27.92±1.61 | 0.072 |
| 7 | 18.67B±2.73 | 32.68A±2.83 | 26.91AB±4.62 | 0.039 | |
| 14 | 22.32B±1.95 | 33.67A±3.14 | 24.10B±2.75 | 0.018 | |
| P-value | 0.451 | 0.452 | 0.548 | ||
|
During Co-synch |
0 (Start of Co-Synch) |
17.75B±2.34 | 29.81A±2.50 | 23.08AB±2.44 | 0.011 |
| 7 | 20.55±2.26 | 23.9±2.36 | 22.41±4.43 | 0.760 | |
| 9 | 20.78±3.94 | 25.15±3.36 | 19.72±1.86 | 0.459 | |
| P-value | 0.653 | 0.297 | 0.699 |
* P<0.05 level; Means having different letter as super script differ significantly within a column of each period .
Table 12.
Largest follicle (Mean ± SEM) mm in buffalo heifers subjected to synchronisation protocols.
Table 12.
Largest follicle (Mean ± SEM) mm in buffalo heifers subjected to synchronisation protocols.
| Period | day | Altrenogest (Group 1) | CIDR (Group 2) | Co synch (Group 3) | P-value |
|---|---|---|---|---|---|
| Day of P4 treatment | 0 (Start of P4 treatment) |
3.08b±0.33 | 3.00±0.45 | 2.71b±0.36 | 0.768 |
| 7 | 6.83aA±0.70 | 7.17A±0.79 | 4.00abB±0.52 | 0.009 | |
| 14 | 8.17a±0.70 | 6.67±1.41 | 6.83a±0.75 | 0.527 | |
| P-value | <0.001 | 0.093 | 0.010 | ||
|
During Co-synch |
0 (Start of Co-Synch) |
5.83b±0.48 | 4.67±0.92 | 4.17b±0.60 | 0.248 |
| 7 | 9.00a±1.00 | 11.00±3.11 | 6.17a±0.60 | 0.234 | |
| 9 | 10.83a±1.82 | 8.75±1.26 | 8.50a±1.52 | 0.520 | |
| P-value | 0.018 | 0.135 | 0.008 |
** P<0.01 level; Means having different small letters as superscript differ significantly within a column of each period, Means having different capital letters as superscript differ significantly within a raw.
Table 13.
Karl Pearson correlation coefficients between hormones, cytokines and follicular size in Buffalo heifers with altrenogest supplementation.
Table 13.
Karl Pearson correlation coefficients between hormones, cytokines and follicular size in Buffalo heifers with altrenogest supplementation.
| Variable | AMH | Estradiol 17-β | IFNγ | IL1 | IL6 | IL13 | Progesterone | TGFβ | TNFα | Follicle size |
|---|---|---|---|---|---|---|---|---|---|---|
| AMH | 1 | 0.049 | 0.103 | -0.046 | 0.012 | 0.007 | 0.272 | 0.158 | 0.134 | 0.132 |
| Estradiol 17 -β | 0.049 | 1 | 0.036 | 0.001 | 0.023 | -0.073 | -0.173 | 0.211 | -0.264 | -0.172 |
| IFNγ | 0.103 | 0.036 | 1 | 0.164 | 0.188 | 0.251 | 0.626** | -0.020 | 0.123 | 0.168 |
| IL1 | -0.046 | 0.001 | 0.164 | 1 | 0.098 | 0.182 | 0.118 | 0.015 | -0.088 | -0.022 |
| IL6 | 0.012 | 0.023 | 0.188 | 0.098 | 1 | -0.175 | 0.055 | 0.010 | 0.202 | -0.109 |
| IL13 | 0.007 | -0.073 | 0.251 | 0.182 | -0.175 | 1 | 0.306 | -0.022 | -0.031 | 0.150 |
| Progesterone | 0.272 | -0.173 | 0.626** | 0.118 | 0.055 | 0.306 | 1 | 0.069 | 0.150 | 0.246 |
| TGFβ | 0.158 | 0.211 | -0.020 | 0.015 | 0.010 | -0.022 | 0.069 | 1 | 0.236 | -0.191 |
| TNF -α | 0.134 | -0.264 | 0.123 | -0.088 | 0.202 | -0.031 | 0.150 | 0.236 | 1 | -0.210 |
| Follicle size | 0.132 | -0.172 | 0.168 | -0.022 | -0.109 | 0.150 | 0.246 | -0.191 | -0.210 | 1 |
**P< 0.01.
Table 14.
Karl Pearson correlation coefficients between hormones, cytokines and and Follicular size in CIDR Group.
Table 14.
Karl Pearson correlation coefficients between hormones, cytokines and and Follicular size in CIDR Group.
| Variable | AMH | Estradiol 17-β | IFNγ | IL1 | IL6 | IL13 | Progesterone | TGFβ | TNFα | Follicle size |
|---|---|---|---|---|---|---|---|---|---|---|
| AMH | 1 | -0.307 | 0.673** | -0.120 | -0.176 | -0.181 | -0.247 | 0.463** | -0.342* | -0.067 |
| Estradiol 17-β | -0.307 | 1 | -0.348* | 0.072 | 0.314 | 0.229 | 0.184 | -0.168 | 0.269 | 0.197 |
| IFNγ | 0.673** | -0.348* | 1 | -0.167 | -0.252 | 0.017 | -0.454** | 0.439** | -0.373* | -0.117 |
| IL1 | -0.120 | 0.072 | -0.167 | 1 | 0.168 | 0.082 | 0.001 | 0.089 | 0.466** | -0.291 |
| IL6 | -0.176 | 0.314 | -0.252 | 0.168 | 1 | 0.322 | 0.118 | 0.139 | 0.483** | 0.062 |
| IL13 | -0.181 | 0.229 | 0.017 | 0.082 | 0.322 | 1 | 0.315 | 0.188 | 0.507** | 0.101 |
| Progesterone | -0.247 | 0.184 | -0.454** | 0.001 | 0.118 | 0.315 | 1 | -0.096 | 0.243 | 0.095 |
| TGFβ | 0.463** | -0.168 | 0.439** | 0.089 | 0.139 | 0.188 | -0.096 | 1 | 0.169 | -0.058 |
| TNFα | -0.342* | 0.269 | -0.373* | 0.466** | 0.483** | 0.507** | 0.243 | 0.169 | 1 | -0.034 |
| Follicle size | -0.067 | 0.197 | -0.117 | -0.291 | 0.062 | 0.101 | 0.095 | -0.058 | -0.034 | 1 |
** P< 0.01 level; * P< 0.05 level.
Table 15.
Karl Pearson correlation coefficients between hormones, cytokines and and Follicular size in Co synch Group.
Table 15.
Karl Pearson correlation coefficients between hormones, cytokines and and Follicular size in Co synch Group.
| Variable | AMH | Estradiol 17-β | IFNγ | IL1 | IL6 | IL13 | Progesterone | TGFβ | TNFα | Follicle size |
|---|---|---|---|---|---|---|---|---|---|---|
| AMH | 1 | -0.255 | -0.047 | 0.256 | 0.026 | -0.093 | 0.181 | 0.408* | -0.041 | -0.168 |
| Estradiol 17-β | -0.255 | 1 | 0.007 | -0.231 | -0.044 | 0.035 | 0.017 | -0.199 | -0.049 | 0.351* |
| IFNγ | -0.047 | 0.007 | 1 | 0.083 | -0.080 | 0.061 | -0.029 | 0.173 | 0.392* | -0.076 |
| IL1 | 0.256 | -0.231 | 0.083 | 1 | -0.034 | -0.202 | -0.100 | -0.023 | 0.391* | -0.210 |
| IL6 | 0.026 | -0.044 | -0.08 | -0.034 | 1 | 0.394* | -0.349* | 0.015 | 0.035 | -0.286 |
| IL13 | -0.093 | 0.035 | 0.061 | -0.202 | 0.394* | 1 | -0.150 | 0.377* | 0.265 | -0.034 |
| Progesterone | 0.181 | 0.017 | -0.029 | -0.100 | -0.349* | -0.15 | 1 | -0.053 | -0.250 | 0.249 |
| TGFβ | 0.408* | -0.199 | 0.173 | -0.023 | 0.015 | 0.377* | -0.053 | 1 | 0.012 | 0.131 |
| TNFα | -0.041 | -0.049 | 0.392* | 0.391* | 0.035 | 0.265 | -0.250 | 0.012 | 1 | -0.278 |
| Follicle size | -0.168 | 0.351* | -0.076 | -0.210 | -0.286 | -0.034 | 0.249 | 0.131 | -0.278 | 1 |
* Significant at 0.05 level.
Disclaimer/Publisher’s Note: The statements, opinions and data contained in all publications are solely those of the individual author(s) and contributor(s) and not of MDPI and/or the editor(s). MDPI and/or the editor(s) disclaim responsibility for any injury to people or property resulting from any ideas, methods, instructions or products referred to in the content. |
© 2024 by the authors. Licensee MDPI, Basel, Switzerland. This article is an open access article distributed under the terms and conditions of the Creative Commons Attribution (CC BY) license (http://creativecommons.org/licenses/by/4.0/).
Copyright: This open access article is published under a Creative Commons CC BY 4.0 license, which permit the free download, distribution, and reuse, provided that the author and preprint are cited in any reuse.


