Submitted:
25 April 2024
Posted:
26 April 2024
Read the latest preprint version here
Abstract
The sound power LW of wind turbines (WTs) over the past decades has developed in relation to their electric power P as LW ∝ logP. The spectral distribution of the sound did not change significantly over time. This applies to the average performance of wind turbines, with differences between individual WT types. Because of the expected growth of onshore wind energy, a greater number of people will be living close to wind farms. This sustains the need for sound reduction. Sound reduction measures, such as serrations, reduced tip speed and low noise modes, may counteract the development of higher sound power from ever bigger WTs. To investigate this, the sound production of WT types over the last decades is analysed in relation to their size and electric power and the application of sound reduction measures. The analysis includes the broad band A-weighted and low frequency sound power levels as well as more detailed spectral distributions. Results show that the sound power level of wind turbines above 3 MW on average increases less with size than smaller turbines did. This is due to a lower blade tip speed and the use of sound reducing serrations. The spectral content of wind turbine sound, including the lower frequencies, has not changed significantly.
Keywords:
wind turbine
; sound power
; acoustic production
; serrations
; environmental sound level
1. Introduction
Since the 1980’s onshore wind turbines have developed tenfold in size: from about 20 m rotor diameter to present diameters of around 200 m. Maximum electric power (Pmax, here used as synonym for rated power) in that period has grown ten times faster: from about 50 to 5000 kW. A similar trend was observed in sound power level with an increase proportional to log(Pmax). In public debates on wind energy plans it is often mentioned that higher wind turbines must be louder and should therefore be placed at a larger distance from residences. In contrast, over the last years developers did not observe a clear increase in sound power level and thus saw no need to place wind turbines at larger distances. Earlier studies showed that the sound power level at maximum electric power (LWA,max) of wind turbines from less than 100 kW up to 3 MW did increase with size. Relations found between LWA,max and Pmax were close to LWA,max ∝ 10*log(Pmax) [1,2,3]. Individual turbine types could deviate from this relation up to about ±3 dB. There is reason to think that larger and more powerful wind turbines may deviate from this trend. One reason is that there is a continuous effort to reduce aerodynamic noise, e.g. by applying and improving serrations to the trailing edge of the blades. Another reason is that the operational design may change as the blades of a higher turbine are at greater heights where wind speed on average is higher. This study aims to show whether changes in wind turbine technology have affected the existing relation between size and sound power. The focus here is on the development of sound power levels of onshore wind turbines and their spectral distribution, not on tonal sound or amplitude modulation.
2. Wind Turbine Sound Sources
The main audible components of wind turbine sound are trailing edge sound and in-flow turbulent sound. Descriptions are available in many papers and reports e.g. [4,5,6] from which a summary is given in this section.
2.1. Dominant Sources
The rotational speed of a modern pitch-controlled wind turbine is proportional to the incoming wind speed Vwind until a maximum is reached determined by the capacity of the generator. At wind speeds below that maximum the rotor speed is proportional to the wind speed and optimized for electric power yield. Above the maximum rotational speed the pitch of the blades is changed to keep electric power production constant in order to not overload the generator.
Trailing edge sound is produced by the turbulent layer of air that develops at the surface of a rotor blade towards the downstream (trailing) edge. This sound is relatively high pitched and is the dominant audible sound from modern turbines at close range. Trailing edge sound level is proportional to 50·logVin, where Vin is the velocity of air relative to and impinging on the blade. Air speed relative to the blade is the resultant of the incoming wind speed (in operational mode typically in the range of 5 to 15 m/s) and local blade speed which increases towards the blade tip to reach values up to about 90 m/s, equivalent to Mach 0.25. The strong dependence of sound level on incoming air velocity is the reason that most sound is produced near the tip. At the tip itself the turbulent air will flow sideways from the pressure to the suction side of the blade, leading to a continuous vortex streaming from the tip in the downwind direction. Tip sound is similar to, and therefore not easily distinguished from, trailing edge sound. Though not negligible, it is not considered a main component of wind turbine sound.
When the angle of attack increases from its optimal value after maximum power output is reached, the turbulent boundary layer on the suction (low pressure) side grows in thickness. For high angles of attack this eventually can lead to ‘stall’: a dramatic increase of boundary layer thickness, drag and sound level causing a decrease of lift and power performance of a blade.
Apart from this turbulence near the rear edge of the blade, there is also turbulence present in the atmosphere and the interaction of this atmospheric turbulence hitting the blade surface produces in-flow turbulent sound, also known as leading edge sound. It is relatively low-pitched and because high frequencies are more strongly attenuated by the atmosphere, in-flow turbulent sound becomes more dominant at larger distances (where at the same time the overall sound level decreases due to geometrical spreading). The increase is proportional to 50·logVin for leading edge noise resulting from small scale atmospheric turbulence (turbulence size less than the blade width). For larger size turbulence it depends on the strength of atmospheric turbulence and may increase up to 60·logVin.
Thus, the sound spectrum of a modern wind turbine is predominantly the sum of two (overlapping) regions corresponding to the two mechanisms mentioned: higher frequency trailing edge sound and lower frequency in-flow turbulent sound. Several numerical models can be used, separately for each mechanism, to calculate the sound emitted by each blade section. Figure 1, from Bertagnolio and Fischer [7], gives an example of the calculated A-weighted sound level in 1/3 octave bands at a position 100 m downstream from a typical 2 MW wind turbine.
In measurements a third sound component may be detected when there are sudden changes in local wind speed due to a substantial change in wind speed with height, the wake of another wind turbine or the presence of the turbine tower or other obstacle. This thickness sound is visible as regularly occurring peaks at infrasound (< 20 Hz) frequencies. It is not relevant for residents as it is far below the perception threshold at residential distances.
Sound mitigation at wind turbines is realized by two different measures. One is to reduce the blade speed and thus lower sound production. This is used in ‘low noise’ modes, often to meet noise limits in specific conditions. Another measure is the application of noise reducing extensions on or adaptations of the blades. In practice trailing edge serrations (TES) are attached to the blades. TES thus reduce trailing edge sound but have no effect on leading edge sound.
2.2. Relation with Size
According to the Betz law a wind turbine extracts an optimum amount of energy from wind at a tip speed ratio λopt that is equal to 4π/N with N the number of blades; λ is the ratio of blade tip speed Vtip and undisturbed wind speed Vwind. For a three-bladed turbine λopt = 4π/3 ≈ 4.2, so Vtip ≈ 4.2*Vwind. In practice it is 25-30% higher: λopt ≈ 5.4 [8]. For variable speed wind turbines Vtip increases with Vwind until maximum electric power is reached and then is constant for higher Vwind until the turbine is stopped to prevent storm damage. In practice, the tip speed at maximum electrical power, averaged over a large number of wind turbines and diameters ranging from 40 to 126 m, historically increased from 62 to 86 m/s or with 0,28 m/s per m diameter [9].
For modern, pitch regulated wind turbines sound power increases strongly with wind speed until rotational speed reaches a maximum value. At higher wind speeds sound power may still increase slightly. One reason is that wind speed relative to the blade still increases, the other is that at the suction side of the trailing edge the turbulent layer thickness increases, which implies a higher sound production [4].
3. Data Selection
The main body of data was provided from the WindPRO database by EMD International A/S early in 2023. This database contains over 1000 wind turbine types. Selected for this study were 1) all onshore, wind turbine types of 2 MW and more (suitable for a 50 Hz grid), and 2) all wind turbine types placed in the Netherlands to compare with older and smaller (< 2 MW) turbines. For the second selection a list of types was provided by Bosch & van Rijn. The two selections overlap for the ≥ 2 MW types. Some types in the WindPRO database have no noise data and were therefore excluded. The resulting wind turbines add up to a total of 238. Some of the largest turbine types have not been built yet, which means the noise data are in some cases based on an estimate and not on actual measurements; in these cases the sound data (and especially spectral data) may be less reliable. Not for all the turbine types a complete dataset was available. Some of the missing data could be supplemented based on manufacturers documentation. Additionally, a set of 8 complementing wind turbine types up to 6.3 MW was added based on manufacturers documentation available from Arcadis. Wind turbine types over 6.3 MW in the Arcadis data set were not used, since due to the very limited number of turbines in this class data may be directly traceable to a specific turbine type or manufacturer; in such cases it was not allowed to present data derived from manufacturers documentation due to nondisclosure agreements. Wind turbine types over 6.3 MW from the WindPRO database were included in the analysis since these data already were public. Exceptions to this are the analyses regarding the overall sound power level compared to the low frequency sound power level and regarding the effect of serrations. For these analyses all turbine types over 6.3 MW were excluded, because it is not clear how representative the comparison would be due to the very limited number of such large turbine types.
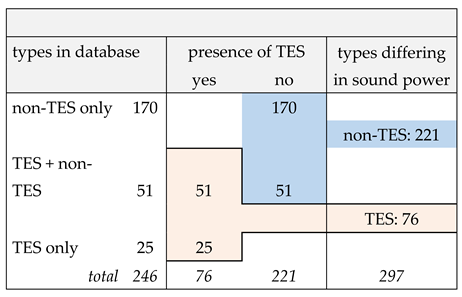
Of the resulting 246 turbine types, 51 types include noise data both with and without trailing edge serrations (TES). A total of 76 types with TES are included in the database. In this paper, a turbine type available with and without serrations is only in sound analyses considered as two separate types. As illustrated in table 1, this has led to a database consisting of 297 wind turbine types regarding sound power level and 246 wind turbine types with regard to other turbine characteristics (rated power, diameter, speed).

Table 1.
number of wind turbine types in present analysis in relation to presence of trailing edge serrations (TES).
Table 1.
number of wind turbine types in present analysis in relation to presence of trailing edge serrations (TES).
Data Description
The dataset provides data on a number of wind turbine parameters, including: rated power, rotor diameter, rotational speed (rpm) at rated power and apparent sound power level (LWA) at varying wind speeds. All sound data in the dataset and the present paper are in A-weighted decibel and sound levels are expressed in dB(A). Differences in level are given in decibel (dB). Nominal wind speed is where electric power reaches its full capacity (rated or maximum power). From the available parameters, blade tip velocity and swept rotor area were calculated. Furthermore, a total of 123 turbine types have a sound spectrum included at nominal wind speed in 1/1-octave bands ranging from 63 to 8000 Hz. For these types the maximum low frequency sound power level (LWA,LF) was calculated as the sum of the 63 and 125 Hz octave band levels. The range in size of the wind turbines and in their parameters is large. For example, the smallest turbine has a rated power of 80 kW, while this is 7580 kW for the largest. To be consistent, the octave band levels at maximum sound power level (LWA,max) produced by each turbine was used for analysis. Not all parameters are specified for all turbines. Therefore, each figure in the text below includes a specification of the number of available data points, i.e. turbine types.
Earlier studies [1,3] have used 2 MW as the boundary between smaller and bigger wind turbines. The same boundary will be used when results from the present study are compared to results from these earlier studies. However, as results will show, with regard to sound production there is in fact no sharp boundary but a transition zone between 2 and 3 MW. When the development of earlier (smaller) is compared to later (bigger) wind turbines without reference to earlier studies, this transition zone will be excluded.
4. Development of Rotor Size
Influence of Size
Size can be expressed as diameter or swept area of the rotor, as height of the turbine (including or excluding blade length) or as electric power capacity. Rotor size is related to electric power as a larger rotor catches more wind to be converted to electric energy. Figure 2 shows the relation between the area that is swept by the rotor blades (short: the ‘rotor area’, Arotor) and the electric power capacity (Pmax). The correlation coefficient (c.c.) between Arotor and Pmax is high (squared c.c.: r2 = 0.96), which means that the electric power capacity is to a high degree related to the rotor area. The best linear fit in a least squares approximation to the data points equals Pmax = 0.284*Arotor, where it was assumed that this relation includes the origin (point 0,0). Thus, on average every square meter rotor area yields a maximum electric power of 284 W.
Though the technology is quite different from solar energy, coincidentally this is in the same order of magnitude as the 218-228 W/m2 peak power produced by the best performing home solar panels [10].
Earlier studies showed that the acoustic or sound power level of a wind turbine is proportional to the logarithm of the electric power: LWA ∝ log(Pmax). Thus, because of the linear relation between Pmax and Arotor, the sound power level is expected to be proportional to the rotor area: LWA,max ∝ log(Arotor). Figure 3A shows the relation between maximum sound power level LWA,max and rotor area and a best logarithmic fit to the data. To see if the actual data indeed approach a logarithmic fit, a local best fit is applied (LOWESS or Locally Weighted Scatterplot Smoothing) to obtain a smooth line without any assumption about the form of the best fit. This local fit is comparable to a moving average: it is based on a division of all data points in subsequent bands and a low-order polynomial fit is calculated for each band. The fit shows that there is a transition from a steeper gradient below about 7000 m2 (≈ 90 m diameter) to a less steep gradient above about 10000 m2 (≈ 110 m diameter). The data points for only the larger turbine types (≥ 3 MW: figure 3B) show that, although over time the sound power level of earlier wind turbines (< 3 MW) on average increased with about 10 dB, the average increase over the entire rotor area range of the larger types (≥ 3 MW) is about 1.5 dB. Individual differences between the larger types are large (up to 8 dB) and not related to size. This is reflected in the low correlation coefficient (r2 = 0.05), indicating that geometric size has almost no influence on the sound power level for wind turbines ≥ 3 MW.
As blade tip velocity is the most important factor in sound production, a possible reason for the low correlation between the size of the larger turbine types and their sound power level is that blade velocity is less clearly related to turbine size. Figure 4 shows that rotational speed decreases with size for most turbine types and is highly correlated to size (r2 = 0.93) when one exceptional turbine (18 m diameter, 120 rpm at rated power) is neglected. Even for the earlier smaller turbine types there is a clear tendency that larger wind turbines rotate at lower rotational speeds.
A consequence of a lower rotational speed is not necessarily a lower blade tip speed as this also depends on rotor diameter. Most of the sound of a wind turbine is produced near the blade tips, and Figure 5A shows that for smaller turbines blade tip speed on average clearly increased. However, for turbines over about 90 m diameter tip speed increases more slowly with rotor diameter. The local fit in Figure 5A shows a transition from a steeper to a less steep gradient when the diameter is about 85 - 95 m (corresponding to about 2 MW). For the larger turbine types (3 – 6.3 MW; Figure 5B) the average tip speed increases (from 78.4 to 82.0 m/s) with 3.6 m/s or 4,45%. Theoretically, this would lead to a 0.95 dB (= 50*log(1,0445) increase in sound power level.
5. Development of Sound Power Level
The relation between maximum sound power level and maximum electric power is plotted in Figure 6. Over the entire range the best logarithmic approximation to the data points is:
where Pmax is in kW.
LWA,max = 6.8*log(Pmax) + 82 dB(A)
The local fit shows to what degree the actual data agree with a logarithmic fit. It shows that between 2 and 3 MW a transition is apparent from a steeper to a less steep slope. In fact, above 4 MW the average becomes almost a constant 106.7 dB(A), likely as a consequence of the constant average blade tip speed for the biggest turbine types (Figure 5A). Including only turbine types below 2 MW, the best logarithmic fit is:
LWA,max = 8.9*log(Pmax) + 75 dB(A)
For types ≥ 2 MW the local fit again closely fits a logarithmic function:
LWA,max = 3.0*log(Pmax) + 95 dB(A)
The correlation between sound power level and rated power is strong (r2 = 0.72) for the turbine types < 2 MW, but very weak (r2 = 0.06) for the larger types. This means that for the larger types the maximum electric power is not at all a good predictor of the maximum sound power level. Over the entire electric power range from 2 to 7.6 MW the average increase in sound power is only 1.7 dB, whereas the differences between turbines types can be up to 8 dB. For turbines with rated power increasing from 3 to 6.3 MW, the increase predicted from the increase in blade tip speed is 0.95 dB. According to the expression for LWA,max above, the increase in sound power level is 0.97 dB.
Møller and Pedersen [3] concluded that with the increase of wind turbine size the contribution of the low frequency part increases relative to the contribution of all frequencies combined. This can be analysed here by comparing the contribution of the two low frequency octave bands (63 and 125 Hz) that are available in the present data to the overall sound power level. The sum of these frequency bands (LWA,LF) is calculated for the same conditions as the sound power level at rated power (LWA,max).
The result is shown in Figure 7 for the entire range of turbine types with sufficient data. The logarithmic fits for the smaller types (< 2 MW) show that the increase of sound power level with rated power was somewhat larger for the LF level when compared to the broad band level: the difference over a tenfold increase in rated power amounts to 1.4 dB with a moderately strong correlation (r2 ≈ 0.65). For the larger turbine types the difference is less (and in fact reversed), but irrelevant due to the very weak correlation (r2< 0.06). Here the differences between broad band and low frequency power sound level vary between 11.3 and 11.6 dB.
The blade tip speed of a modern pitch-controlled wind turbine is proportional to wind speed (section 2.2), but above a maximum value the pitch of the blades is changed to keep electric power production constant. Figure 8 shows the relation between sound power level and wind speed for all turbine types (with and without serrations). For both groups the increase of sound power level with wind speed is close to the expected slope from 50∙log(Vwind) for wind speeds from 5 to 8 m/s (plotted as a dashed line in Figure 8). At higher values the average sound power converges to a constant value.
6. Sound Power Spectra
All available sound power octave band spectra of wind turbines in the database are shown in Figure 9A, including the (arithmetic) average. The spectra are at nominal wind speed. In Figure 9B each of these spectra is normalized to the sound power LWA,max of each wind turbine type; the advantage of normalized spectra is the independence of the broad band sound level and thus represent only spectral shape. Normalized spectral levels fall into a bandwidth of 6 up to 12 dB at most frequencies except at the highest frequency. The larger spread at 8 kHz may be a consequence of the distance between rotor and measurement site (according to IEC 61400-11 [11]) in combination with the high atmospheric attenuation at 8 kHz for which no correction is applied when determining the sound power level from measurements. This attenuation depends on temperature and relative humidity and varies, in the range of 0 – 20 °C and 80-100% relative humidity, from 0.06 to 0.15 dB/m [12]. Thus, the attenuation for sound coming from maximum tip height (hub + blade length), which is in the range of 140 to 250 m (with sound path length 140√2 to 250√2 m), can vary from 11.8 to 52.5 dB depending on turbine height and weather conditions.
In Figure 10 the average normalized octave band spectrum of all turbines with sufficient spectral data (including with or without serrations) is compared to those from earlier studies. The standard deviations are derived from Figure 14 from Møller and Pedersen [2] and Figure 3 (for 1/3 octave levels) from Sondergaard [1] (who only shows these for turbines > 2 MW). Standard deviations (s.d.) of the differences in Figure 10B are calculated as the square root of the sum of both individual squared s.d.’s. Although in the present study the most dominant levels (500 and 1000 Hz) are somewhat higher compared to earlier studies, the differences at all frequencies are not significant. Also, in the present study the spectral differences between turbines with rated power below and above 2 MW is within 2 dB, but again these differences are not significant.
7. Effect of Serrations on Sound Power Level
The database includes 74 turbine types with trailing edge serrations (TES) and 218 without serrations (non-TES) with relevant data. In Figure 11 these selections are plotted separately and this shows that serrations do have an effect on sound power level. When compared to all types together (Figure 6), the non-TES types on average have a higher, the TES types a lower maximum sound power level. Figure 7 also shows that TES only have been applied to the larger turbines (> 2 MW).
Based on the logarithmic fits in Figure 11 the average effect of TES (= difference between non-TES and TES sound power level fits) increases with rated power from 1.2 to 2.3 dB. This increase in effect is in part due to a larger share of TES turbines at higher rated powers. The average effect over each 1 MW interval is 1.5 dB.
A detailed view of the spectral differences between non-TES and TES wind turbines can be based on spectral data that are available for 11 turbine types each with and without serrations, of 2 manufacturers. Figure 12 shows these 1/3 octave band spectra and the average value of individual differences (same turbine with/without TES). The broad band level difference is 2.4 dB (s.d. 0.5 dB), determined by frequencies in the range where trailing edge sound is dominant (400-1600 Hz). For most spectral bands in this range the effect of TES is significant and amounts to 2.5 to 3.0 dB. At lower and higher frequencies the differences in level are not significant.
Figure 12 implies that serrations on average have less effect on the low frequency part of wind turbine sound. Without serrations the difference between broad band (LWA,max) and low frequency power sound level (LWA,LF) is 11.4 ± 0.25 dB, with serrations this is 11.0 ± 0.8 dB, close to the overall value of 11.4 ± 0.15 dB (Figure 7). Because serrations predominantly have effect on the higher frequency trailing edge sound, they are likely to change the spectral balance of the emitted sound: with serrations the low frequency part are expected to be slightly higher relative to the broad band level.
8. Effect of Noise Mode
Several turbine types have a ‘noise mode’ where the rotational speed is reduced with the aim to reduce sound emission. A noise mode is usually set in steps of about 1 dB with a variation in number of steps depending on the manufacturer. Here a noise reduction of 3 dB (± 0,5 dB) is chosen to compare its effect to the standard 0 dB mode. For this comparison 16 turbine types were available with spectral data for a standard mode and a 3 ± 0,5 dB noise mode, all with a rated power between 3 and 6.3 MW. The average sound power level LWA,max for the two groups was 105.6 and 102.7 dBA, with an average noise reduction of 2.9 dB. The noise reduction appears to have no effect on spectral distribution: for all 1/3 octave band frequencies from 6.3 to 10,000 Hz the reduction is 2.9 ± 0.2 dB. Leading edge noise thus is reduced as much as trailing edge noise. One could expect a somewhat lesser decrease in trailing edge noise, because with the increasing pitch angle the turbulent layer thickness at the suction side of the trailing edge increases, which would imply more sound production. However, results show there is no evidence for this effect.
Using a noise mode has a price in loss of power production. For all available noise modes of 21 wind turbines the loss in rated power, relative to the standard mode, is shown in Figure 13. The reduction in rated power is 5% per dB noise reduction and for noise reductions up to 5 dB both are strongly correlated (r2 = 0.82).
9. Effect of Serrations and Spectral Content at Residential Neighbours
The analysis in section 7 concerns the effect of trailing edge serrations on the sound power level of wind turbines at the source, without any influence of the environment. At residential locations the sound level will be lower because of geometrical spreading, but also the spectral content will change as higher frequencies will be attenuated more than lower frequencies. To assess such propagation effects, the immission sound levels within two kilometres of five types of large wind turbines (3 to 6 MW) with and without serrations have been calculated. The ISO 9613 calculation model is used with a ground factor of 0.5 in a downwind situation, over flat ground at typical temperate weather conditions. Immission height is 1.5 (‘ear at ground floor’) and 4 m (ditto first floor). The turbine types were selected for differences in ‘spectral balance’: the relative strength of the low frequency content, based on the difference between the sound levels of the 1000 Hz and 63 Hz octave bands: a low difference means a relatively high LF content. The turbine types, marked as A through E, will be denoted as ‘highest’ and ‘lowest’ with respect to relative LF content. The middle three types have intermediate values. Table 2 shows these differences as well as the sound power level of the five types with and without serrations. The third column shows the spectral balance according to the difference L1kHz - L63Hz. It is remarkable that adding serrations almost reverses the spectral balance order of these five turbine types. The differences in the spectral balance as a result of adding serrations is in the lower third of column 3; this shows that serrations reduce LF content for A and B, and increase LF content for C, D and E. The order is the same if the difference between the 1/3 octave band levels at 1000 Hz and 63 Hz was used. In table 2 also immisson levels are shown at two specific distances (500 and 1000 m) and distances where a specific sound level (30 and 40 dB(A)) is reached. The distance where an immission sound level of 40 dB(A) is reached depends on the sound power level of the turbine, but with serrations this distance is most reduced when the LF content is low. The effect is even greater for a 30 dB(A) immission level, where distance is reduced with 380 m (29% relative to turbine without serrations) for a low(est) LF content in sound power level.
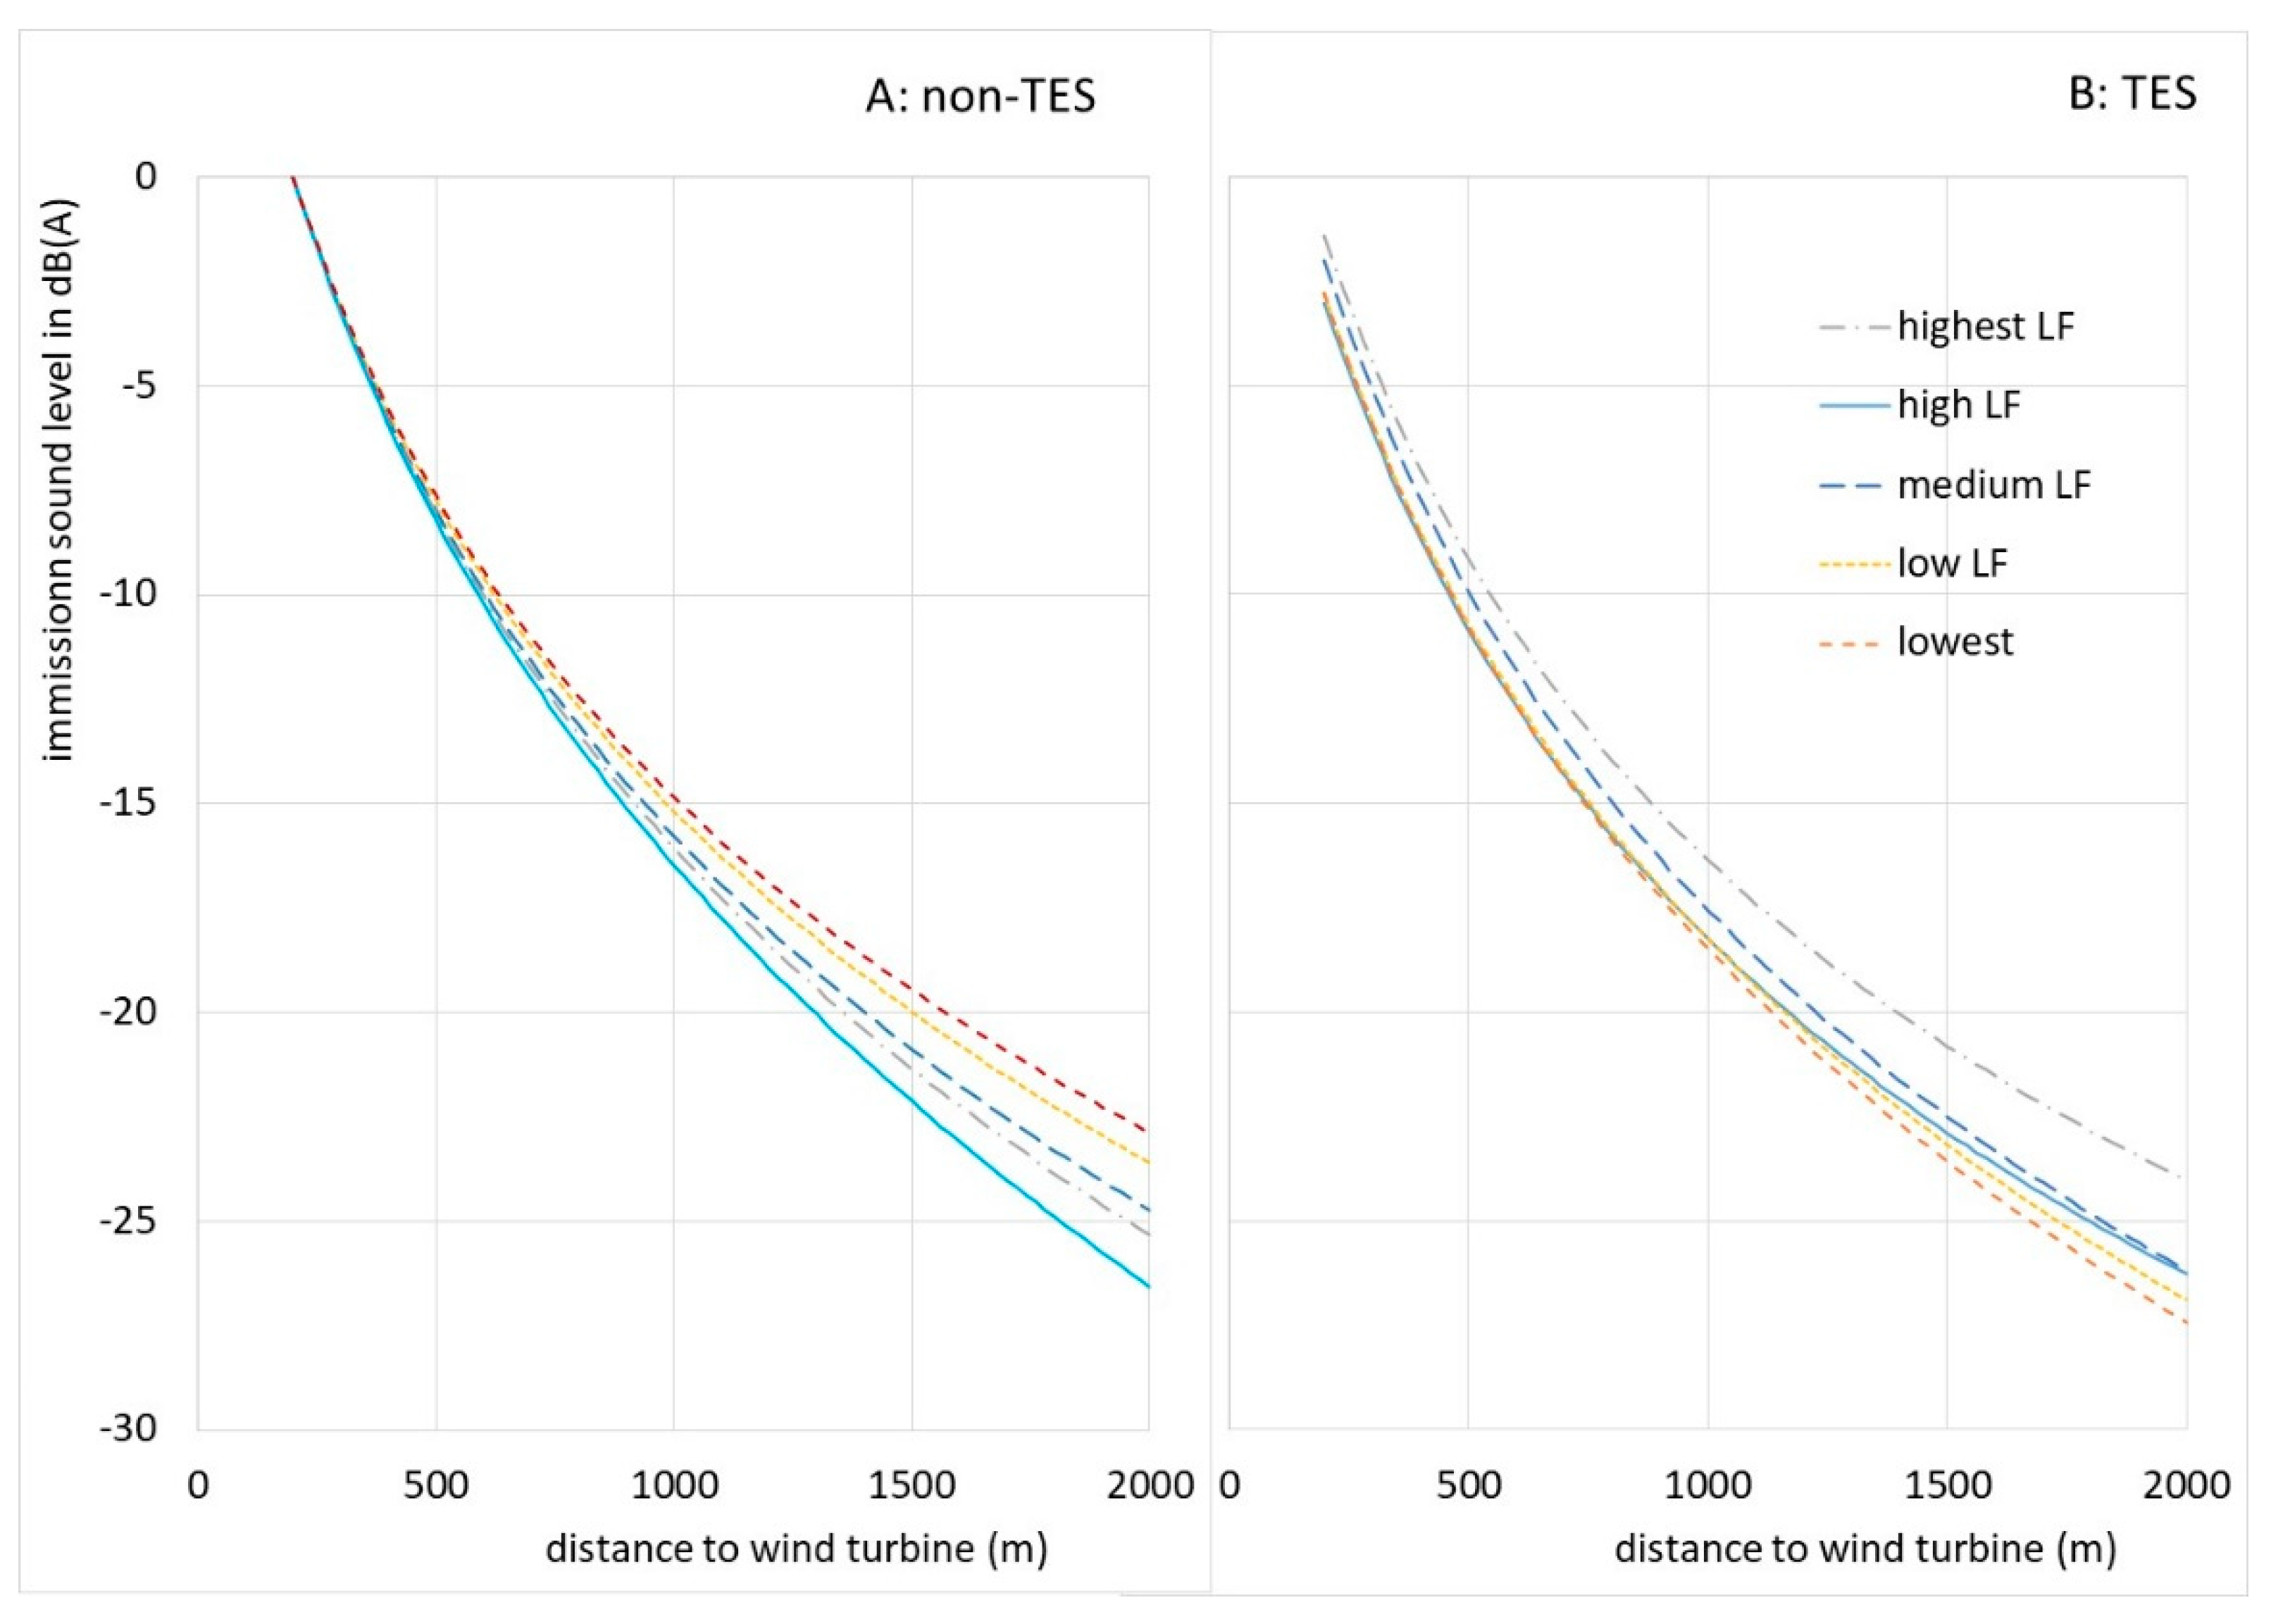
Figure 14 compares the attenuation without and with serrations relative to the immission level at 200 m from the unserrated wind turbine (which is set at 0 dB). Attenuation is less when LF content of the sound power level is higher. The comparison also shows that serrations can even correct an unfavourable spectral balance of the unserrated wind turbine.
Figure 14.
Attenuation (with reference 0 dB at 200 m of non-TES turbine type) at distances up to 2 km from five wind turbine types without (A, left) and with trailing edge serrations (B, left). Relative low frequency content in sound power levels of five turbine types with serrations is high(est), medium or low(est).
The effect of serrations over the distance range of 200 m to 2 km is depicted in Figure 15 for the 5 turbine types for receiver heights of 1.5 m and 4 m; differences between these heights amount to less than 0.5 dB. The effect depends on the spectral balance of the sound power level. When the LF content (with serrations) is low or medium, the effect of serrations is close to constant from the turbine up to 1000 m (change ≤ 0.3 dB). For the lowest LF content the effect even increases with distance (from 2.8 at source to 3.7 dB at 1000 m), and vice versa is reduced when the LF content is high (from 1.4 to 0.1 dB) or highest (3.0 to 2.1 dB).
10. Discussion and Conclusions
This study includes all wind turbine types with rated power > 2 MW and a smaller number of turbines < 2MW that were available in the WindPro dataset early in the year 2023. The average behaviour of these turbine types is described where it must be kept in mind that individual types can differ up to about 3 - 4 dB from the average. The WindPro dataset includes sound data usually obtained in accordance with the measurement standard IEC 61400-11 [11], but for some new types the sound data seem to be derived from calculations. Individual turbines may deviate (slightly) from the type specifications, but this is not relevant in the statistic approach in this study.
The results show that over a time of several decades sound power level averaged over all wind turbine types appears to increase with rated electric power. This can be expressed as a log-relation: LWA,max ∝ y*log(Pmax), where the constant y is the slope in this proportionality. This increase has changed over time: there is a transition zone from a higher slope for turbine types < 2 MW to a lower slope for types ≥ 2 MW. In 2008 Van den Berg et al. [2] found a slope of 9.9 and 10.0 for sound power levels at 7 and 8 m/s respectively (i.e. near rating power), based on 78 turbine types ranging from 75 to 3000 kW. A few years later, Møller and Pedersen [3] found a slope of 11.0 (according to their Figure 13) based on 44 wind turbines ranging from 450 to 3600 kW. Finally, in 2015, Søndergaard [1] found a slope of 8.9 based on wind turbines (no number mentioned) ranging from about 300 kW to 3000 kW. For the development of wind turbines from 3 to 6.3 MW this means that an increase of sound power level of 2.9 – 3.5 dB was expected (based on a slope of 8.9 – 11.0). In contrast, the present study shows the actual average increase is 1.0 dB (based on a slope of 3.0).
One reason for the later development appears to be the use of trailing edge serrations (TES) on turbine types of 2 MW and above. Averaged over all turbine types with or without TES they lead to a sound reduction of 1.5 dB. Focusing on detailed data from turbine types that can be equipped with or without serrations, adding serrations add a reduction of 2.4 dB. The increased use of TES has led to a lower increase with rated power. However, also the larger turbine types that do not use TES have a lower slope than found before: 4.4 instead of 8.9 - 11.0. And also for the larger turbine types with TES the slope is 5.6, again lower than 8.9 - 11.0. A reason for this appears to be a slower increase of blade tip speed with size. The transition to a smaller increase in sound power level is accompanied by a similar transition in blade tip speed. For the larger turbine types (3 – 6.3 MW) the average tip speed increases with 3.8 m/s or 4.5%. This increase in tip speed leads to an expected increase in sound level of 1 dB which is exactly the increase found over this range of diameters. Table 3 gives an overview of the sound power levels of turbine types between 1 and 7 MW and its spectral composition in absolute (LWA,max) and relative (LWA,max subtracted) terms and separately for wind turbine types without and with trailing edge serration (TES). At 31.5 Hz less data are available compared to the other frequencies. Møller and Pedersen [3] expected for turbines in the 5 MW class a sound power level at rated power of 108.8 dB(A), but the present results show that the average sound power level of the 3-5 and 5-7 MW types without serrations (106.7-106.9 dB(A)) are about 2 dB, with serrations (105.4 – 105.8) about 3 dB below their estimate.
Møller and Pedersen [3] analysed data from 48 wind turbines, of which 11 at a rated power > 2 MW, and found that the increase of the low frequency part of the sound power level LWA,LF was slightly but significantly higher than the broad band level LWA. On average LWA exceeded LWA,LF with 11.6 dB for the smaller turbines and 9.7 dB for the larger turbines (taken from their figure 1 [3]). Møller and Pedersen used the 10-160 Hz 1/3-octave bands as a low frequency range, the present study uses the 63 and 125 Hz 1/1-octave bands which include the 50-160 Hz 1/3-octave bands, but not the lower 1/3-octave bands (10-40 Hz). However, the levels in the range 10-40 Hz are so low they can be considered negligible, based on the spectral distribution in the present study (17 dB below the upper part of the LF range). Søndergaard [1] repeated the analysis of Møller and Pedersen with more larger turbines and found similar excesses of LWA over LWA,LF (12.0 dB for small, 10.3 dB for large turbines), but the difference between smaller and larger turbines was not significant. The present study finds an excess of LWA over LWA,LF of 11.9 ± 0.5 dB for turbines < 2 MW and 11.6 ± 0.2 dB for turbines > 3 MW: a small and nonsignificant difference. For the smaller turbines the excess of LWA,LF over LWA is similar to earlier results, but the difference for larger turbines is the same and not smaller as in earlier results.
The present study shows that the spectral content of the sound of modern three bladed, pitch regulated wind turbines has not changed significantly over time and this includes the contribution of the low frequency part. Normalized octave band levels of all individual wind turbine types are within ± 5 dB of the average values with the exception of a larger spread (± 12 dB) at the highest frequency. The larger spread at 8 kHz may be a consequence of not taking atmospheric attenuation into account when determining sound power levels, which has also been noted by Junker and Quillet [13]. For large turbines, with blade tip heights up to 250 m, the attenuation along the propagation path to the measurement position is determined by size and weather conditions and can be substantial. This may also explain the lower average 8 kHz octave band level, when compared to earlier results.
The results show that the size of wind turbines of 3 MW and above has a small effect on their sound emission. Sound emission is predominantly determined by the choice of wind turbine manufacturer or type. To mitigate sound emission, trailing edge serrations have proven to be effective. Spectral analysis shows that they are most effective at 400 to 1600 Hz and indeed reduce the higher frequency trailing edge sound, not the relatively low frequency leading edge sound. To reduce sound emission at specific times or in specific conditions a low noise mode can be applied to a wind turbine. On average this has an effect on sound level, but not on its spectral distribution.
When the sound propagates to neighbouring locations, atmospheric and ground absorption reduce higher frequencies more effectively than lower frequencies. As a consequence, for a specific A-weighted sound power level, residential noise levels will be higher if that sound has a higher low frequency content. When a wind turbine sound power level has a relatively high low frequency content, calculations show that the effect of serrations becomes less and even nil or negative at larger distances. In contrast, when the low frequency content is low, the effect of serrations can even increase with distance.
Noise limits determine the maximum sound level at residential locations and are a major spatial constraint for wind farm planning. If no other constraints apply, especially for visual intrusion, reduction of wind turbine sound power but meeting the same noise limit will lead to wind turbines that may be placed closer to residences. As a result, visual intrusion will have more impact. Over time this may add to social resistance. Social resistance already has a major influence on the expansion of onshore wind energy and can only be addressed successfully if authorities, developers and operators include residential interests in the planning and operation of wind farms [14].
Author Contributions
Conceptualization, FvdB and EK; methodology, FvdB; analysis, JB and MES; writing—original draft preparation, editing, FvdB; review, FvdB, EK, JB and MES; supervision, FvdB and EK; project administration, JB and MES. All authors have read and agreed to the published version of the manuscript.
Funding
This research received no external funding.
Acknowledgments
The authors thank Casper van Wezel, former intern at Arcadis, for the analysis of part of the data, and Steven Velthuijsen of Bosch & Van Rijn for his help in setting up this study.
Conflicts of Interest
The authors declare no conflict of interest.
References
- Søndergaard, B (2015) Low frequency noise from wind turbines: do the Danish regulations have any impact? An analysis of noise measurements. Aeroacoustics 14(5 & 6), 909-915. [CrossRef]
- van den Berg, F., Pedersen, E., Bouma, J., Bakker, R. (2008) WINDFARMperception: Visual and acoustic impact of wind turbine farms on residents. Final report FP6-2005-Science-and-Society-20, EU Specific Support Action Project no. 044628.
- Møller, H, Pedersen, CS (2011) Low-frequency noise from large wind turbines. J. Acoust. Soc. Am. 129 (6), 3727-3744. [CrossRef]
- Oerlemans, S (2011) Wind turbine noise: primary noise sources. Report no.NLR-TP-2011-066 National Aerospace Laboratory NLR.
- Van den Berg, F (2006). The sound of high winds: the effect of atmospheric stability on wind turbine sound and microphone noise. Thesis University of Groningen.
- Stoevesandt B, Schepers, G, Fuglsang, P, Sun, Y (ed.) (2022). Handbook of wind energy aerodynamics, Springer.
- Bertagnolio, F, Fischer, A (2022). Wind turbine aerodynamic noise sources. In: Stoevesandt et al. (ed.) (2022), Handbook of wind energy aerodynamics, Springer. [CrossRef]
- Ragheb, M, Ragheb, AM (2011). Wind turbines theory – The Betz equation and optimal rotor tip speed ratio. In: Carriveau, R (ed.) Fundamental and advanced topics in wind power. InTech.
- EWEA (2008?) Tip Speed Trends. wind-energy-the-facts.org/tip-speed-trends-7.html, consulted 6-3-2023.
- Aggarwal, V. How much energy does a solar panel produce? https://www.energysage.com/solar/solar-panel-output (consulted 22-4-2024).
- IEC (2018). International standard 61400-11: Wind turbines – Part 11: Acoustic noise measurement techniques.
- ISO (2013). Standard 9613-1. Acoustics - Attenuation of sound during propagation outdoors. Part 1: Calculation of the absorption of sound by the atmosphere.
- Junker, F, Quillet, T (2023). Practical application of standard 61400-11: lessons learned on a case study. 10th Intern Conf Wind Turbine noise, Dublin.
- van den Berg, Frits (GP) (2022). A Proposal to Use Determinants of Annoyance in Wind Farm Planning and Management. Wind 2, no. 3: 571-585. [CrossRef]
Figure 1.
1/3-octave band sound pressure levels due to turbulent inflow and trailing edge noise 100 m downstream from a 2 MW wind turbine (figure taken from [7]).
Figure 1.
1/3-octave band sound pressure levels due to turbulent inflow and trailing edge noise 100 m downstream from a 2 MW wind turbine (figure taken from [7]).
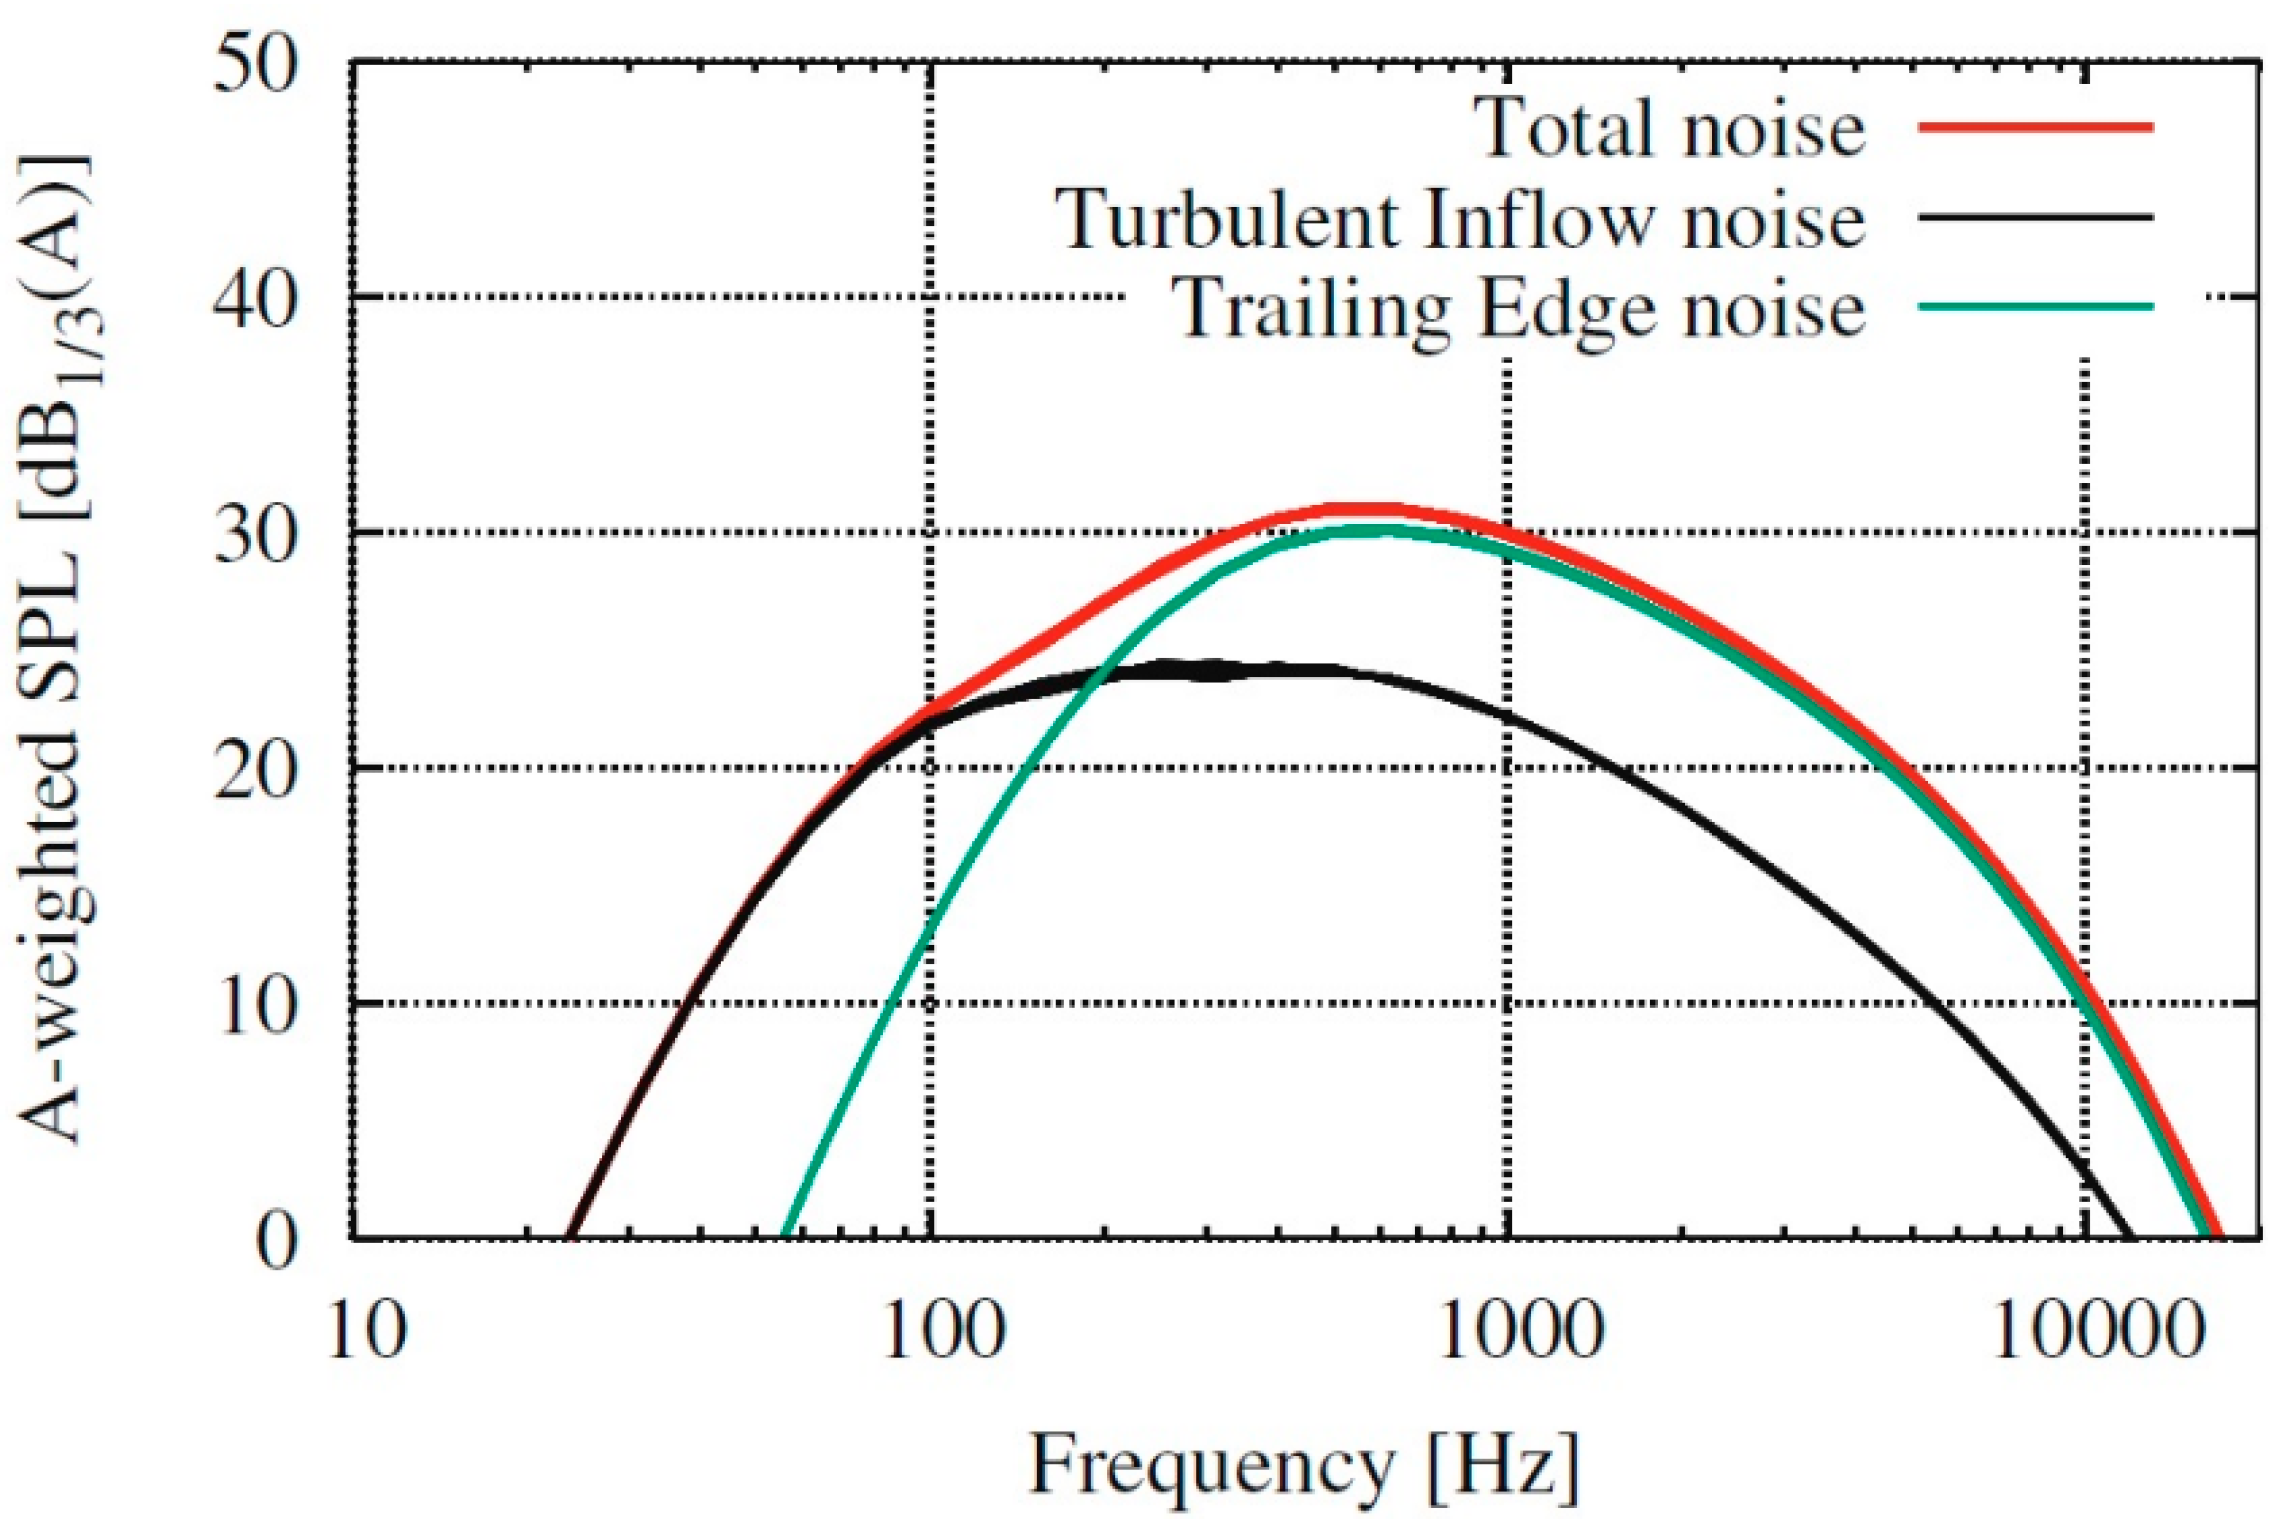
Figure 2.
Maximum electric power plotted versus swept area of rotor for 246 turbine types and best linear approximation (dotted line).
Figure 2.
Maximum electric power plotted versus swept area of rotor for 246 turbine types and best linear approximation (dotted line).
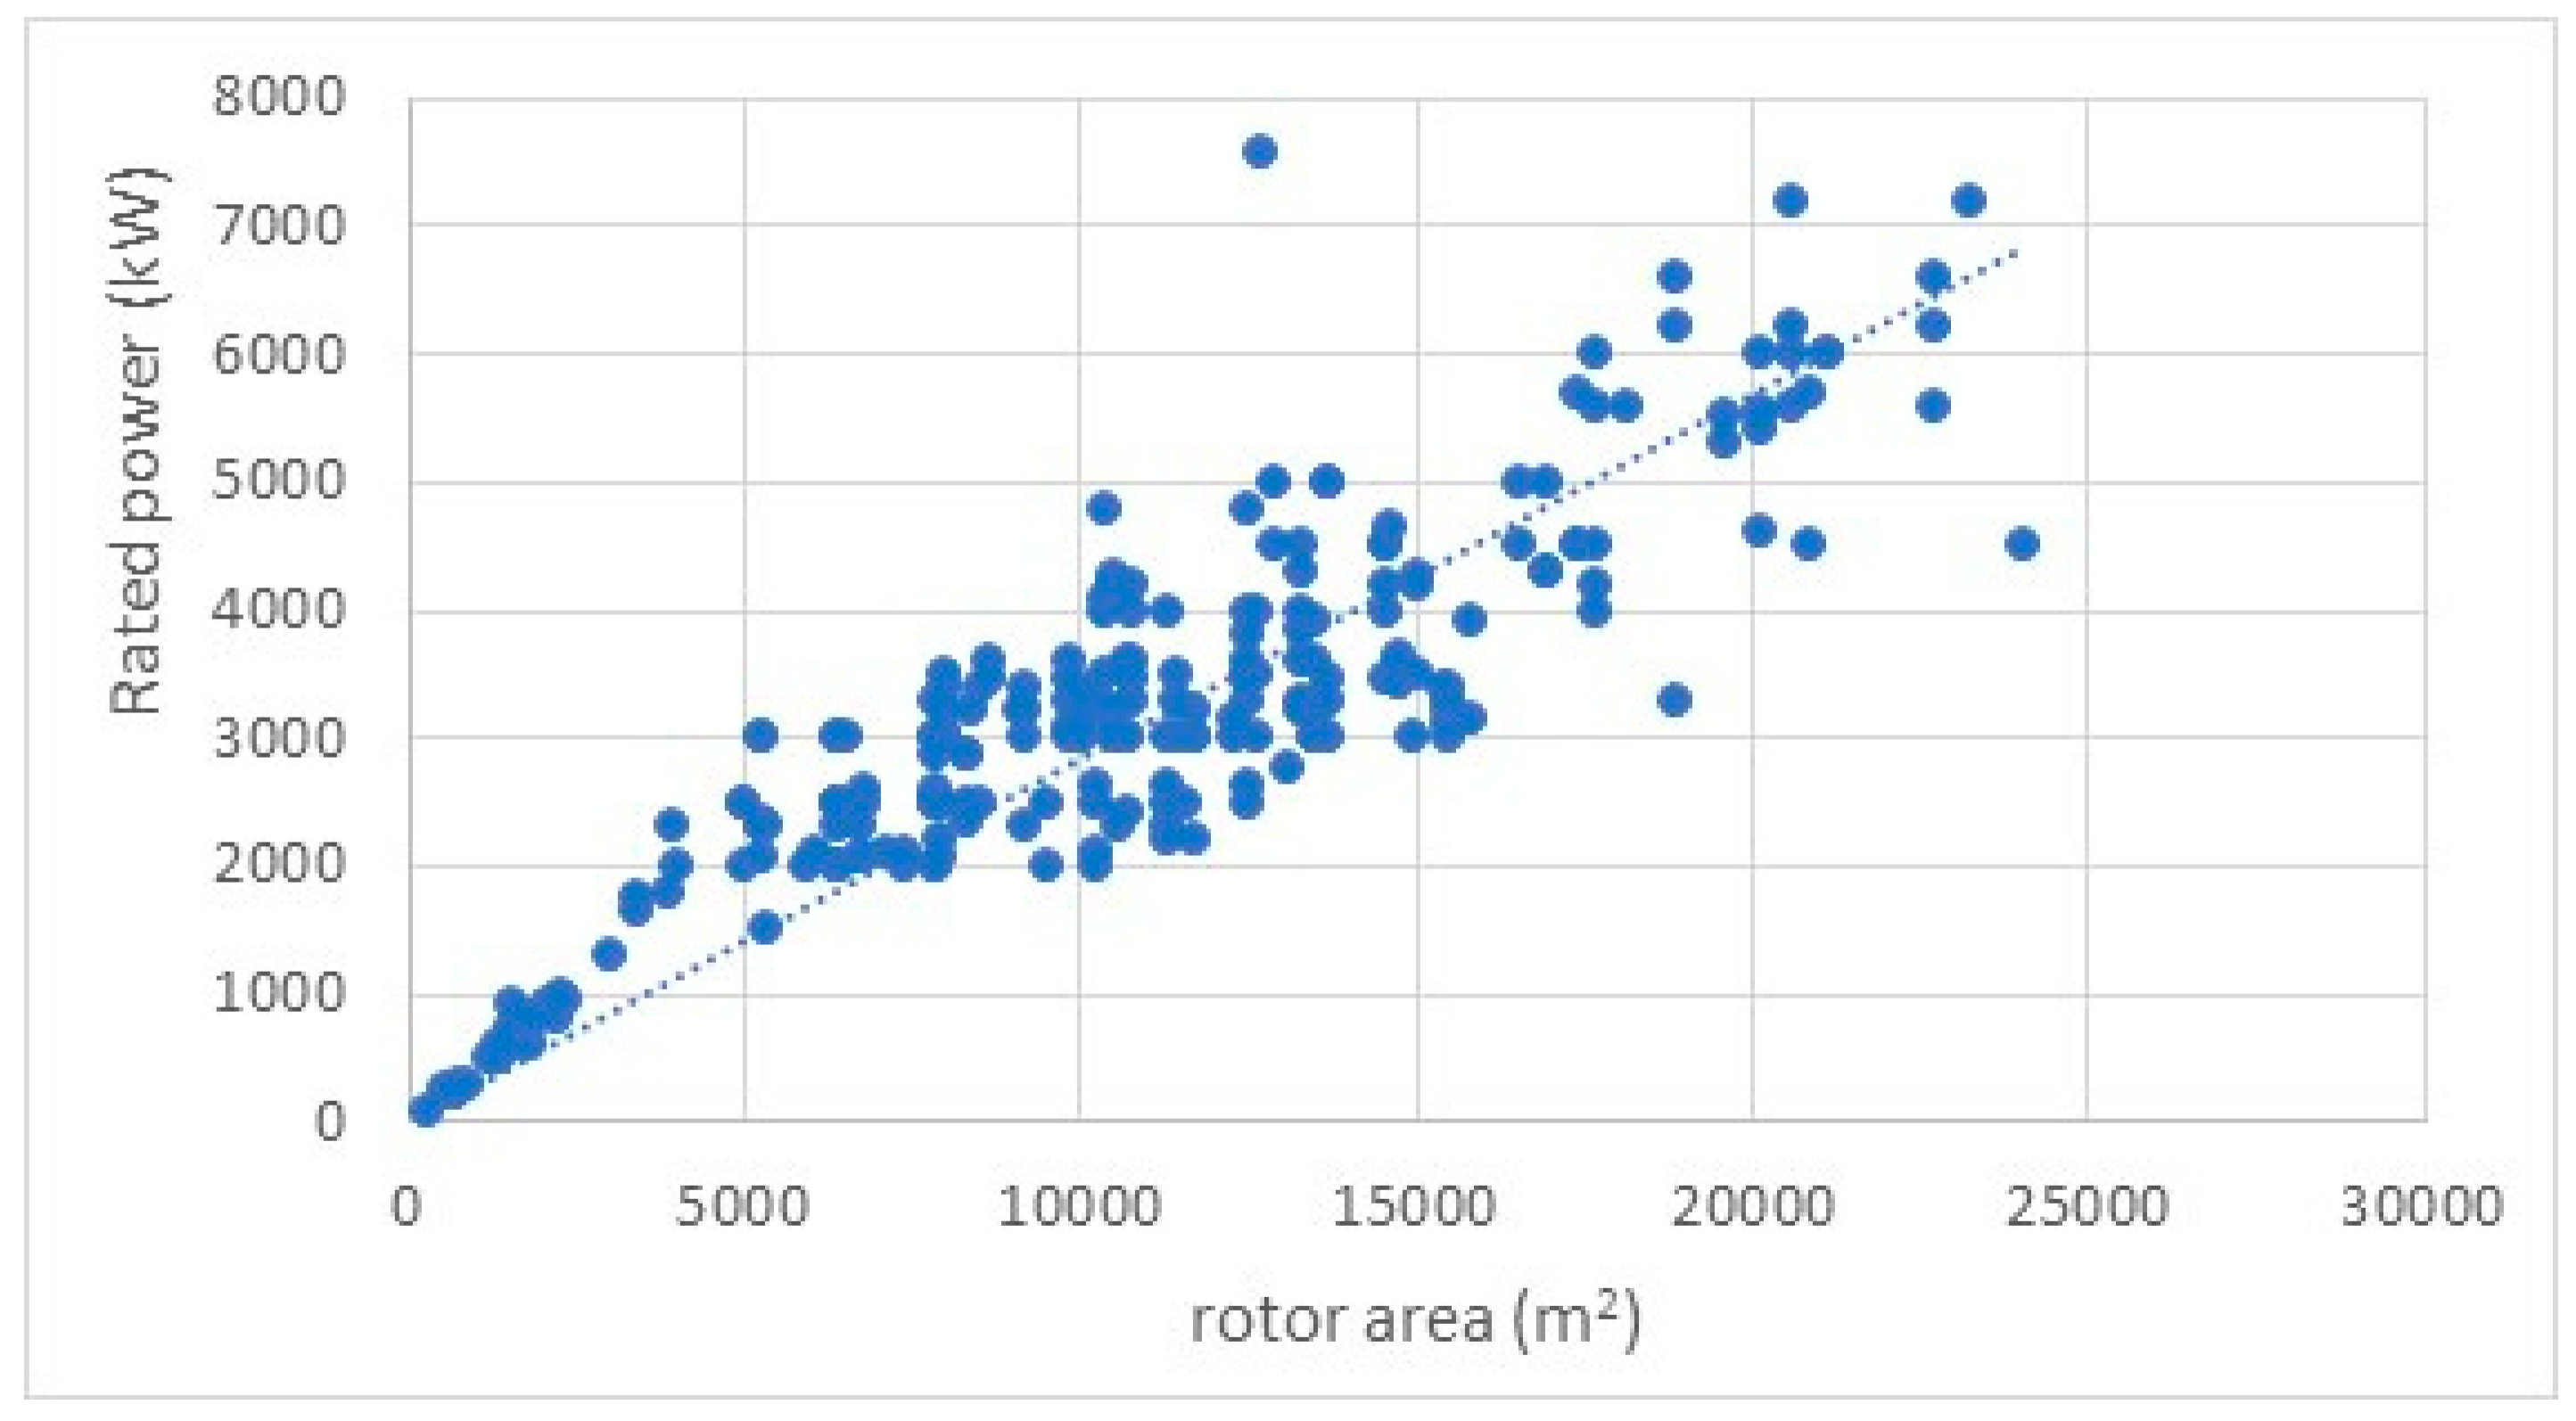
Figure 3.
Maximum sound power plotted versus swept area of rotor for 297 turbine types (A, left) and 195 types ≥ 3000 kW (B, right); best logarithmic approximations (dotted lines); best local fit (left: solid red line). Mind the differences in vertical axes.
Figure 3.
Maximum sound power plotted versus swept area of rotor for 297 turbine types (A, left) and 195 types ≥ 3000 kW (B, right); best logarithmic approximations (dotted lines); best local fit (left: solid red line). Mind the differences in vertical axes.
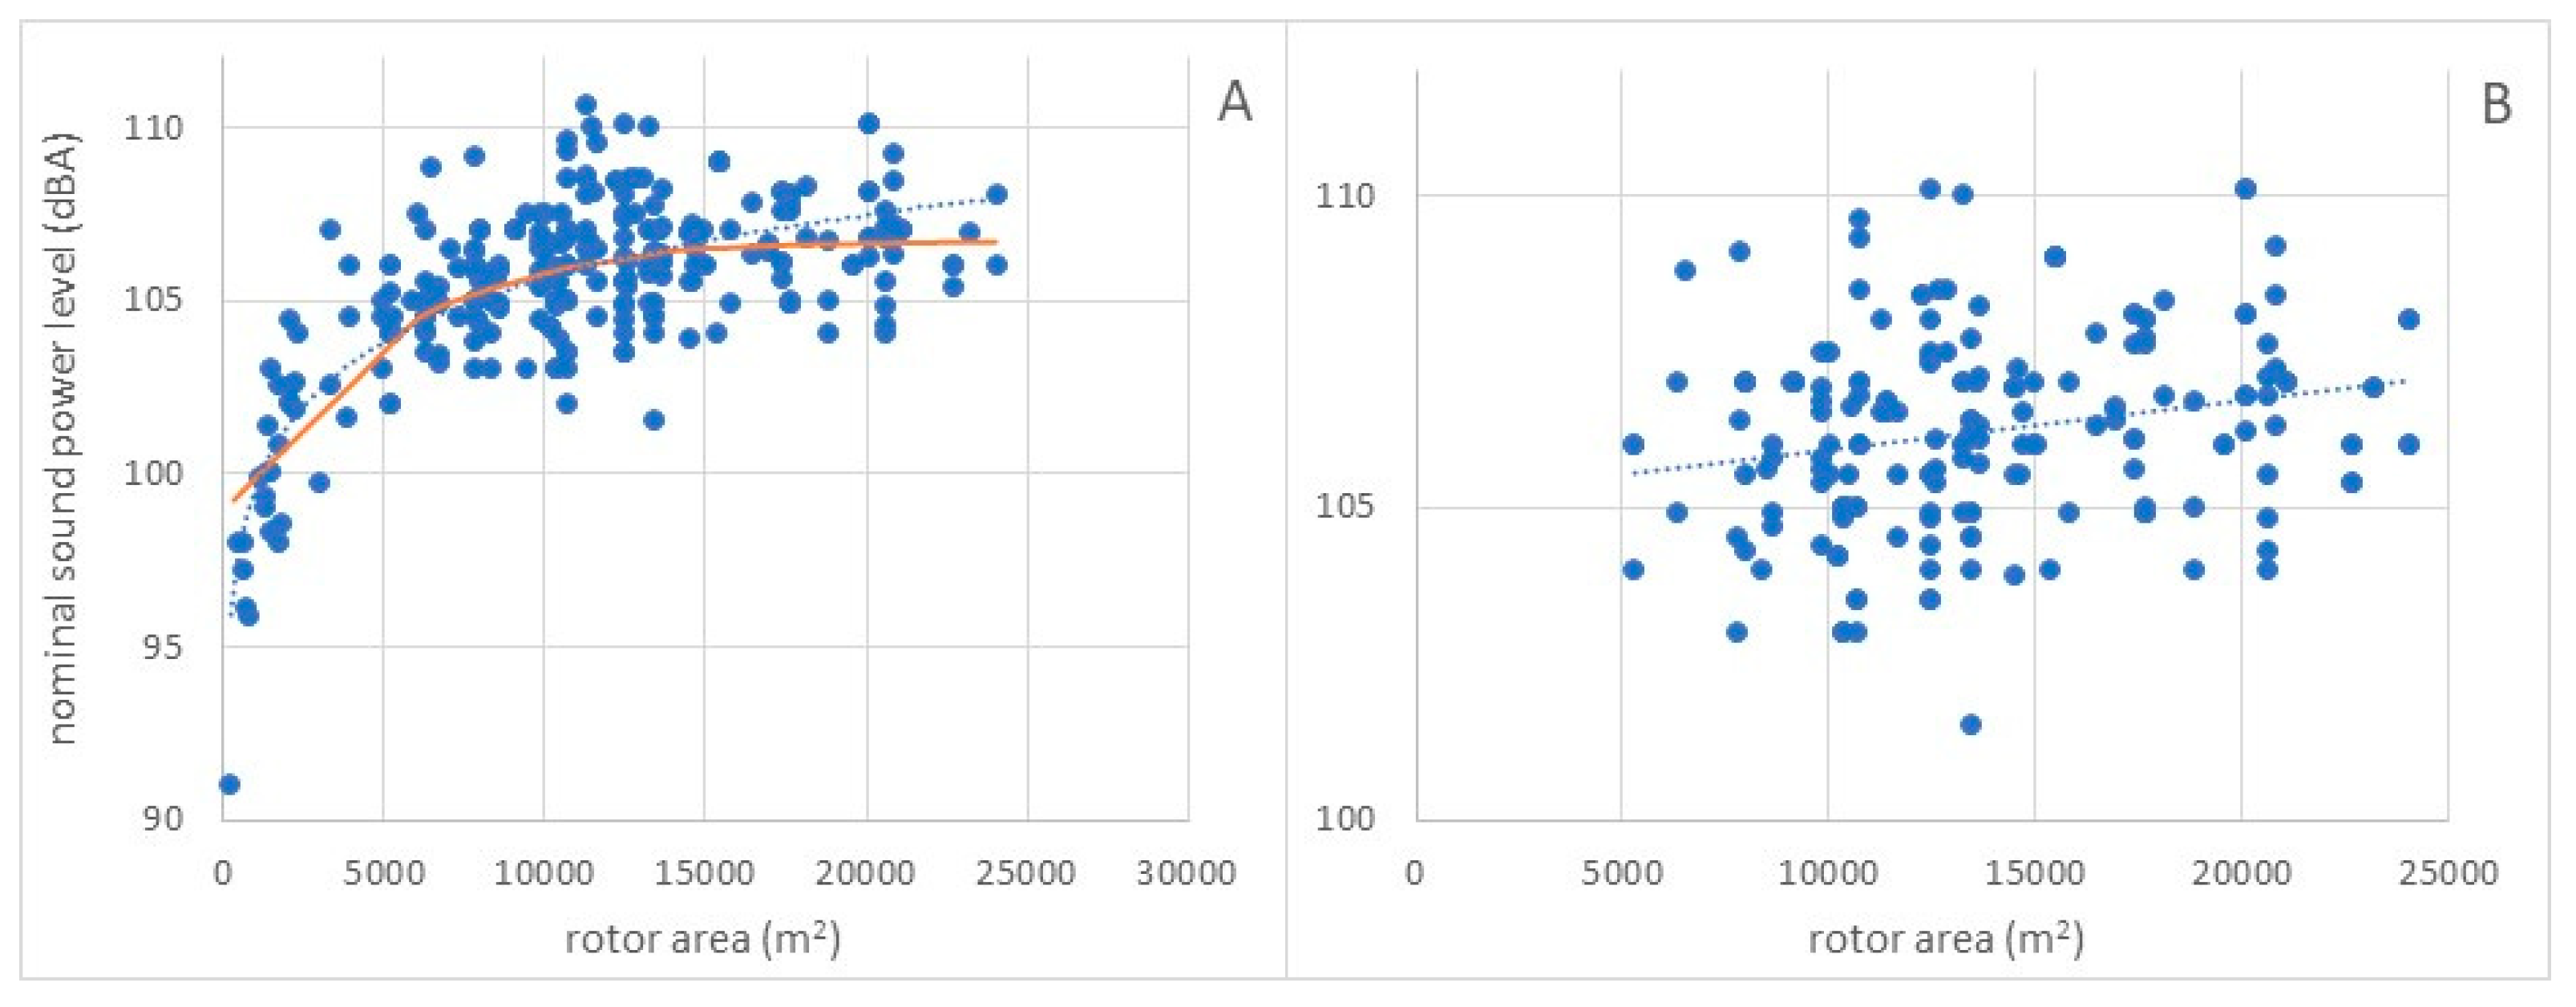
Figure 4.
Rotational speed (in rotations per minute or RPM) of 221 turbine types plotted versus rotor diameter and best exponential approximation (dotted line). Exceptional turbine (18 m diameter, 120 rpm) excluded.
Figure 4.
Rotational speed (in rotations per minute or RPM) of 221 turbine types plotted versus rotor diameter and best exponential approximation (dotted line). Exceptional turbine (18 m diameter, 120 rpm) excluded.
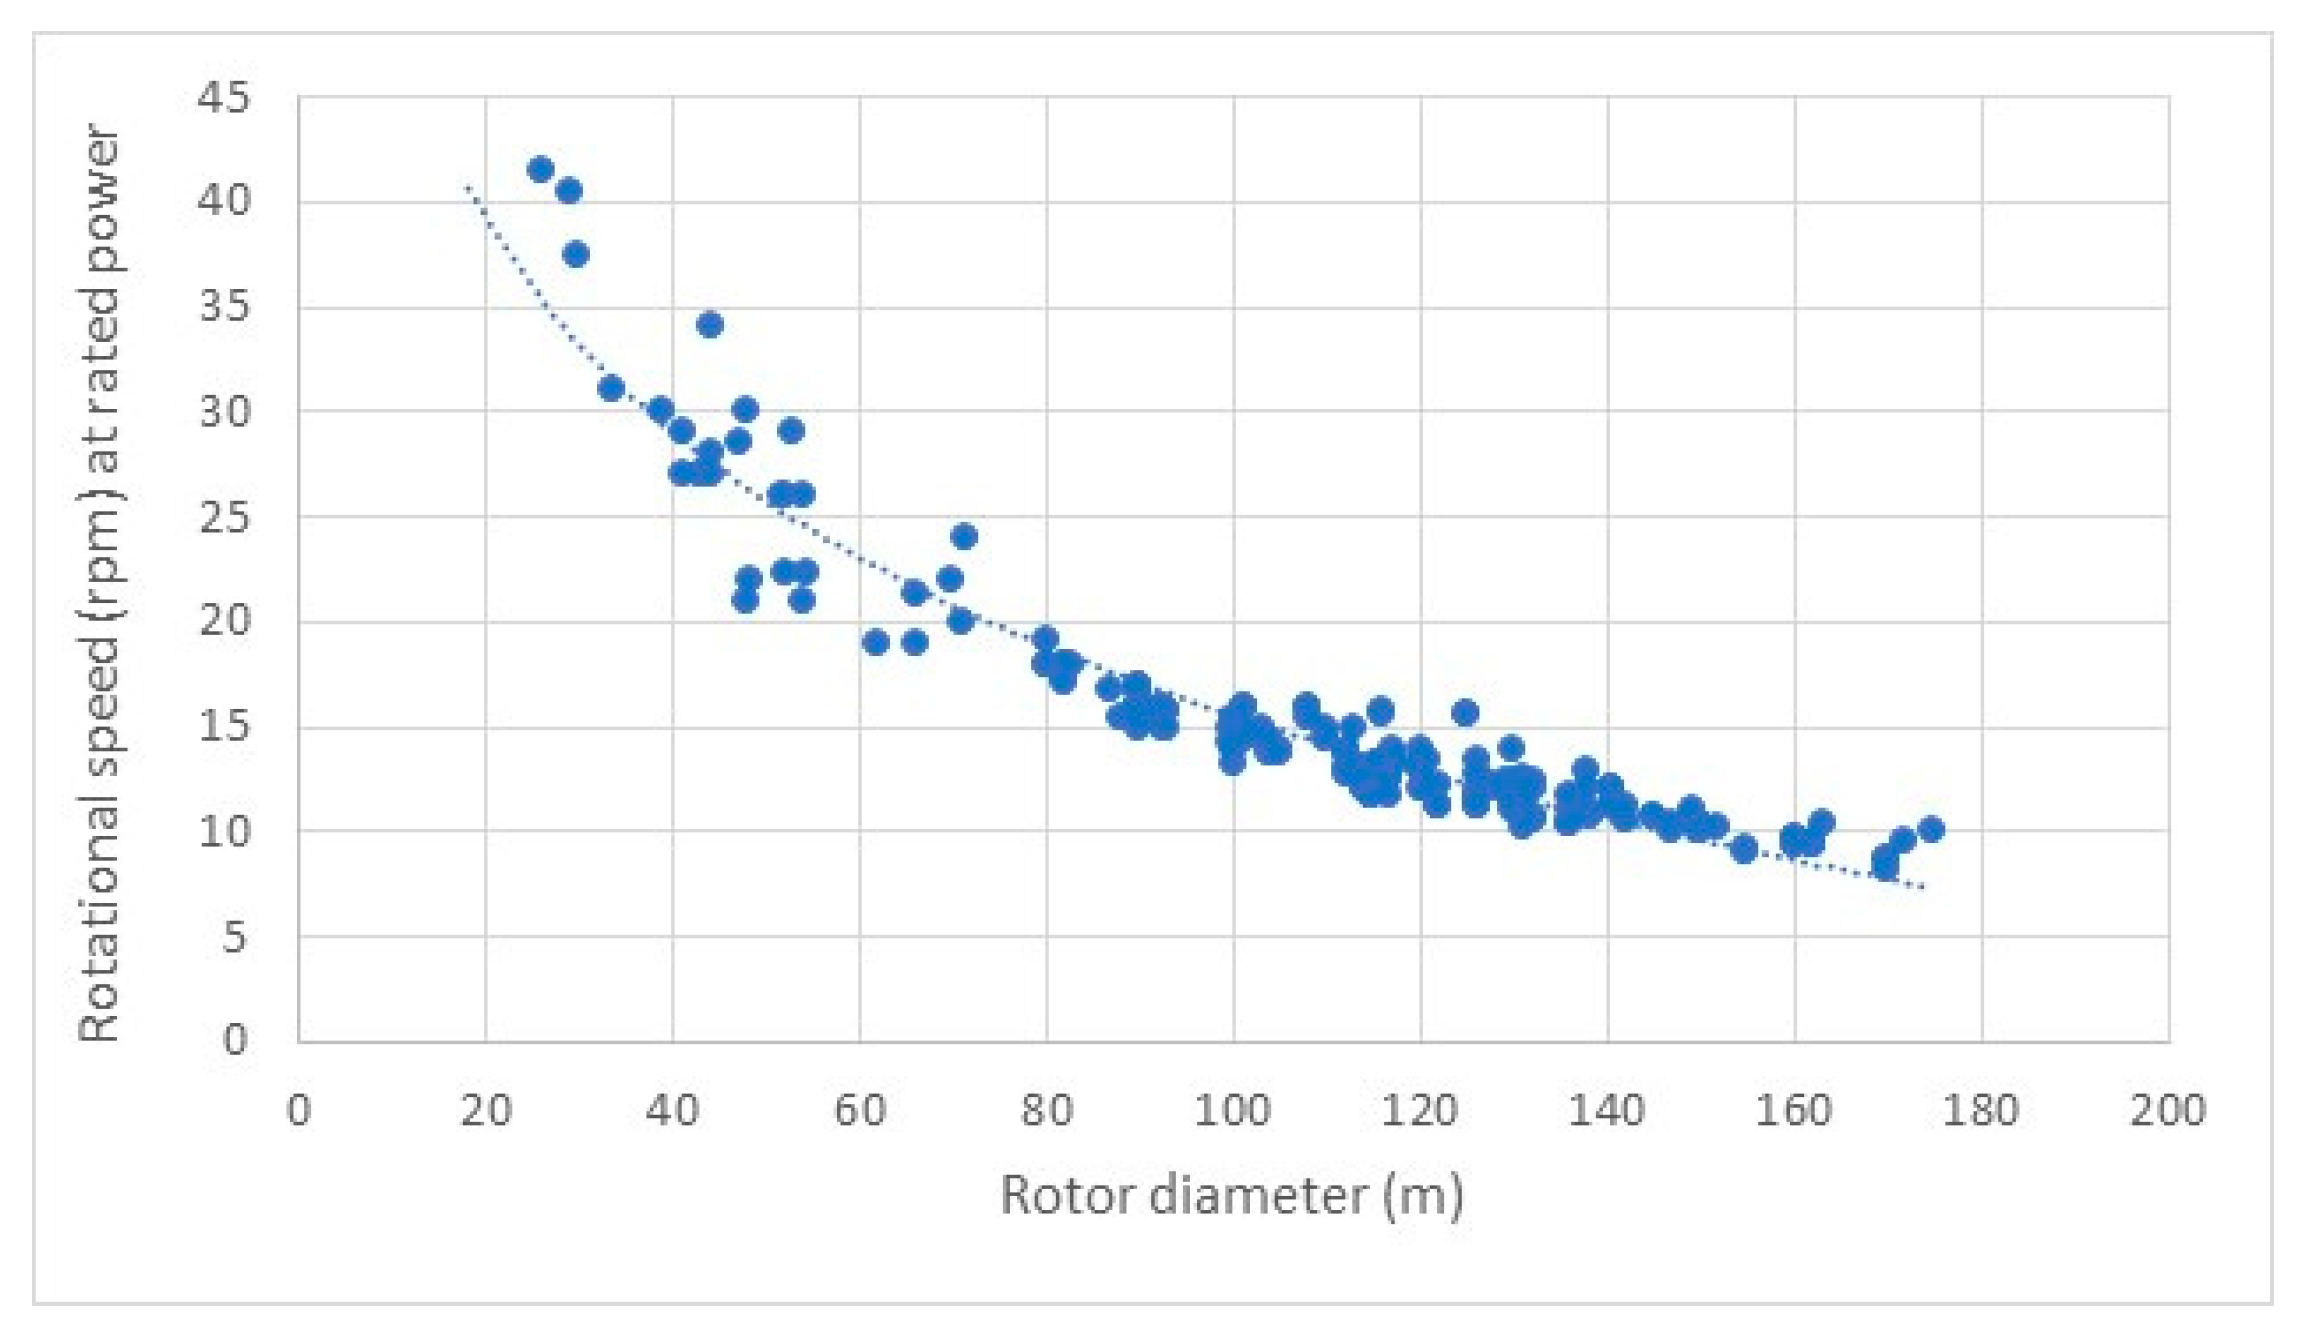
Figure 5.
Blade tip speed plotted versus rotor diameter for 221 types (A, left) and for 108 types ≥ 3000 kW (B, right); best local fit (left: solid red line) and best logarithmic approximation (right: dotted line). Exceptional turbine at top left (red dot) not included in fit.
Figure 5.
Blade tip speed plotted versus rotor diameter for 221 types (A, left) and for 108 types ≥ 3000 kW (B, right); best local fit (left: solid red line) and best logarithmic approximation (right: dotted line). Exceptional turbine at top left (red dot) not included in fit.
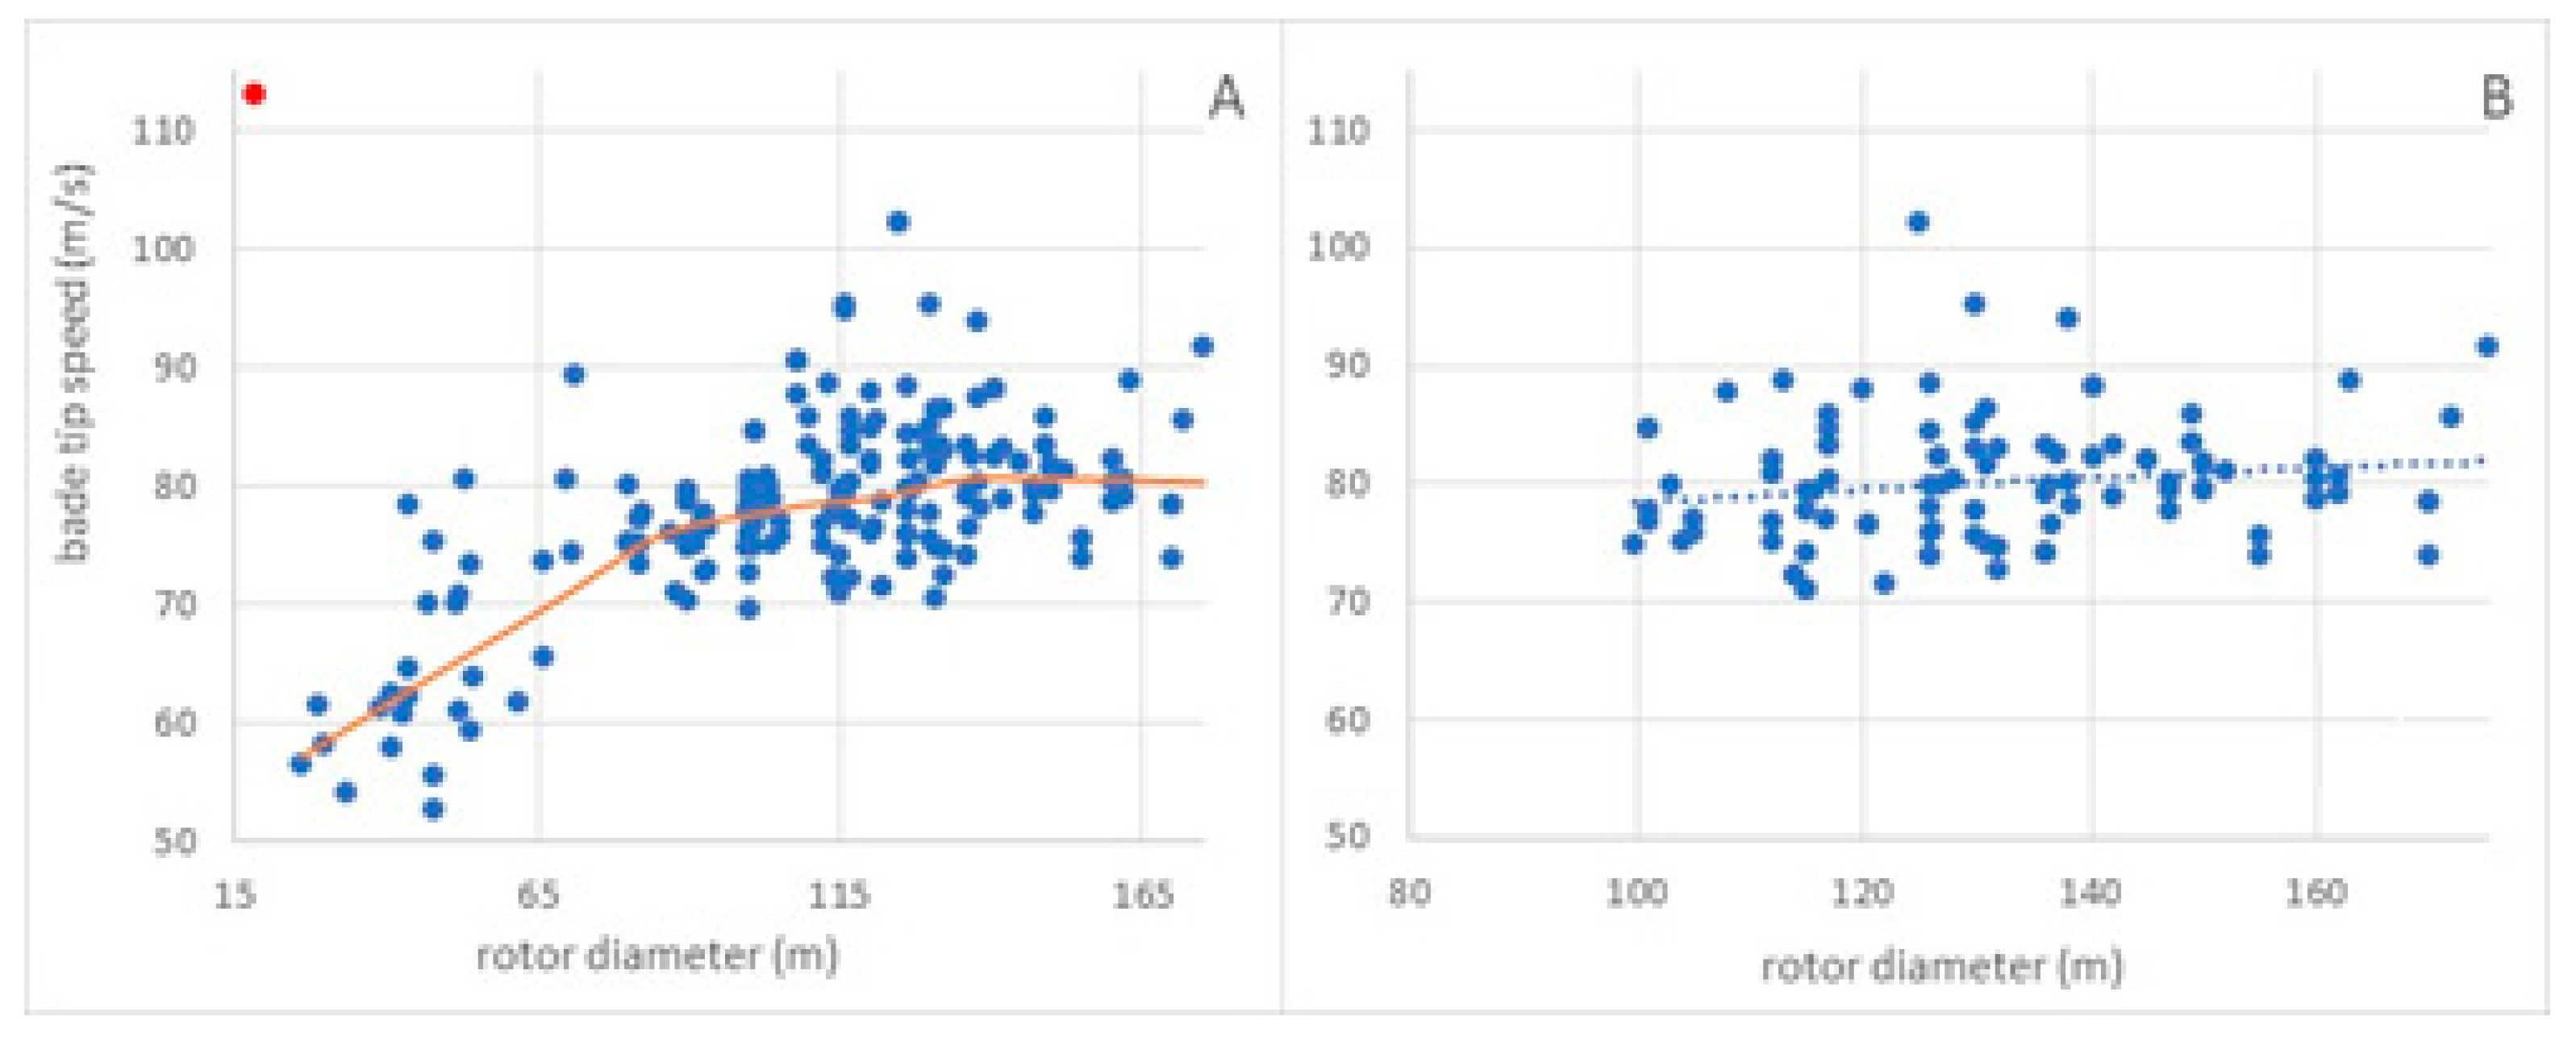
Figure 6.
Maximum sound power level plotted versus electric power capacity for all 297 turbine types; best overall logarithmic approximation (dotted line) and local fit to data (solid red line).
Figure 6.
Maximum sound power level plotted versus electric power capacity for all 297 turbine types; best overall logarithmic approximation (dotted line) and local fit to data (solid red line).
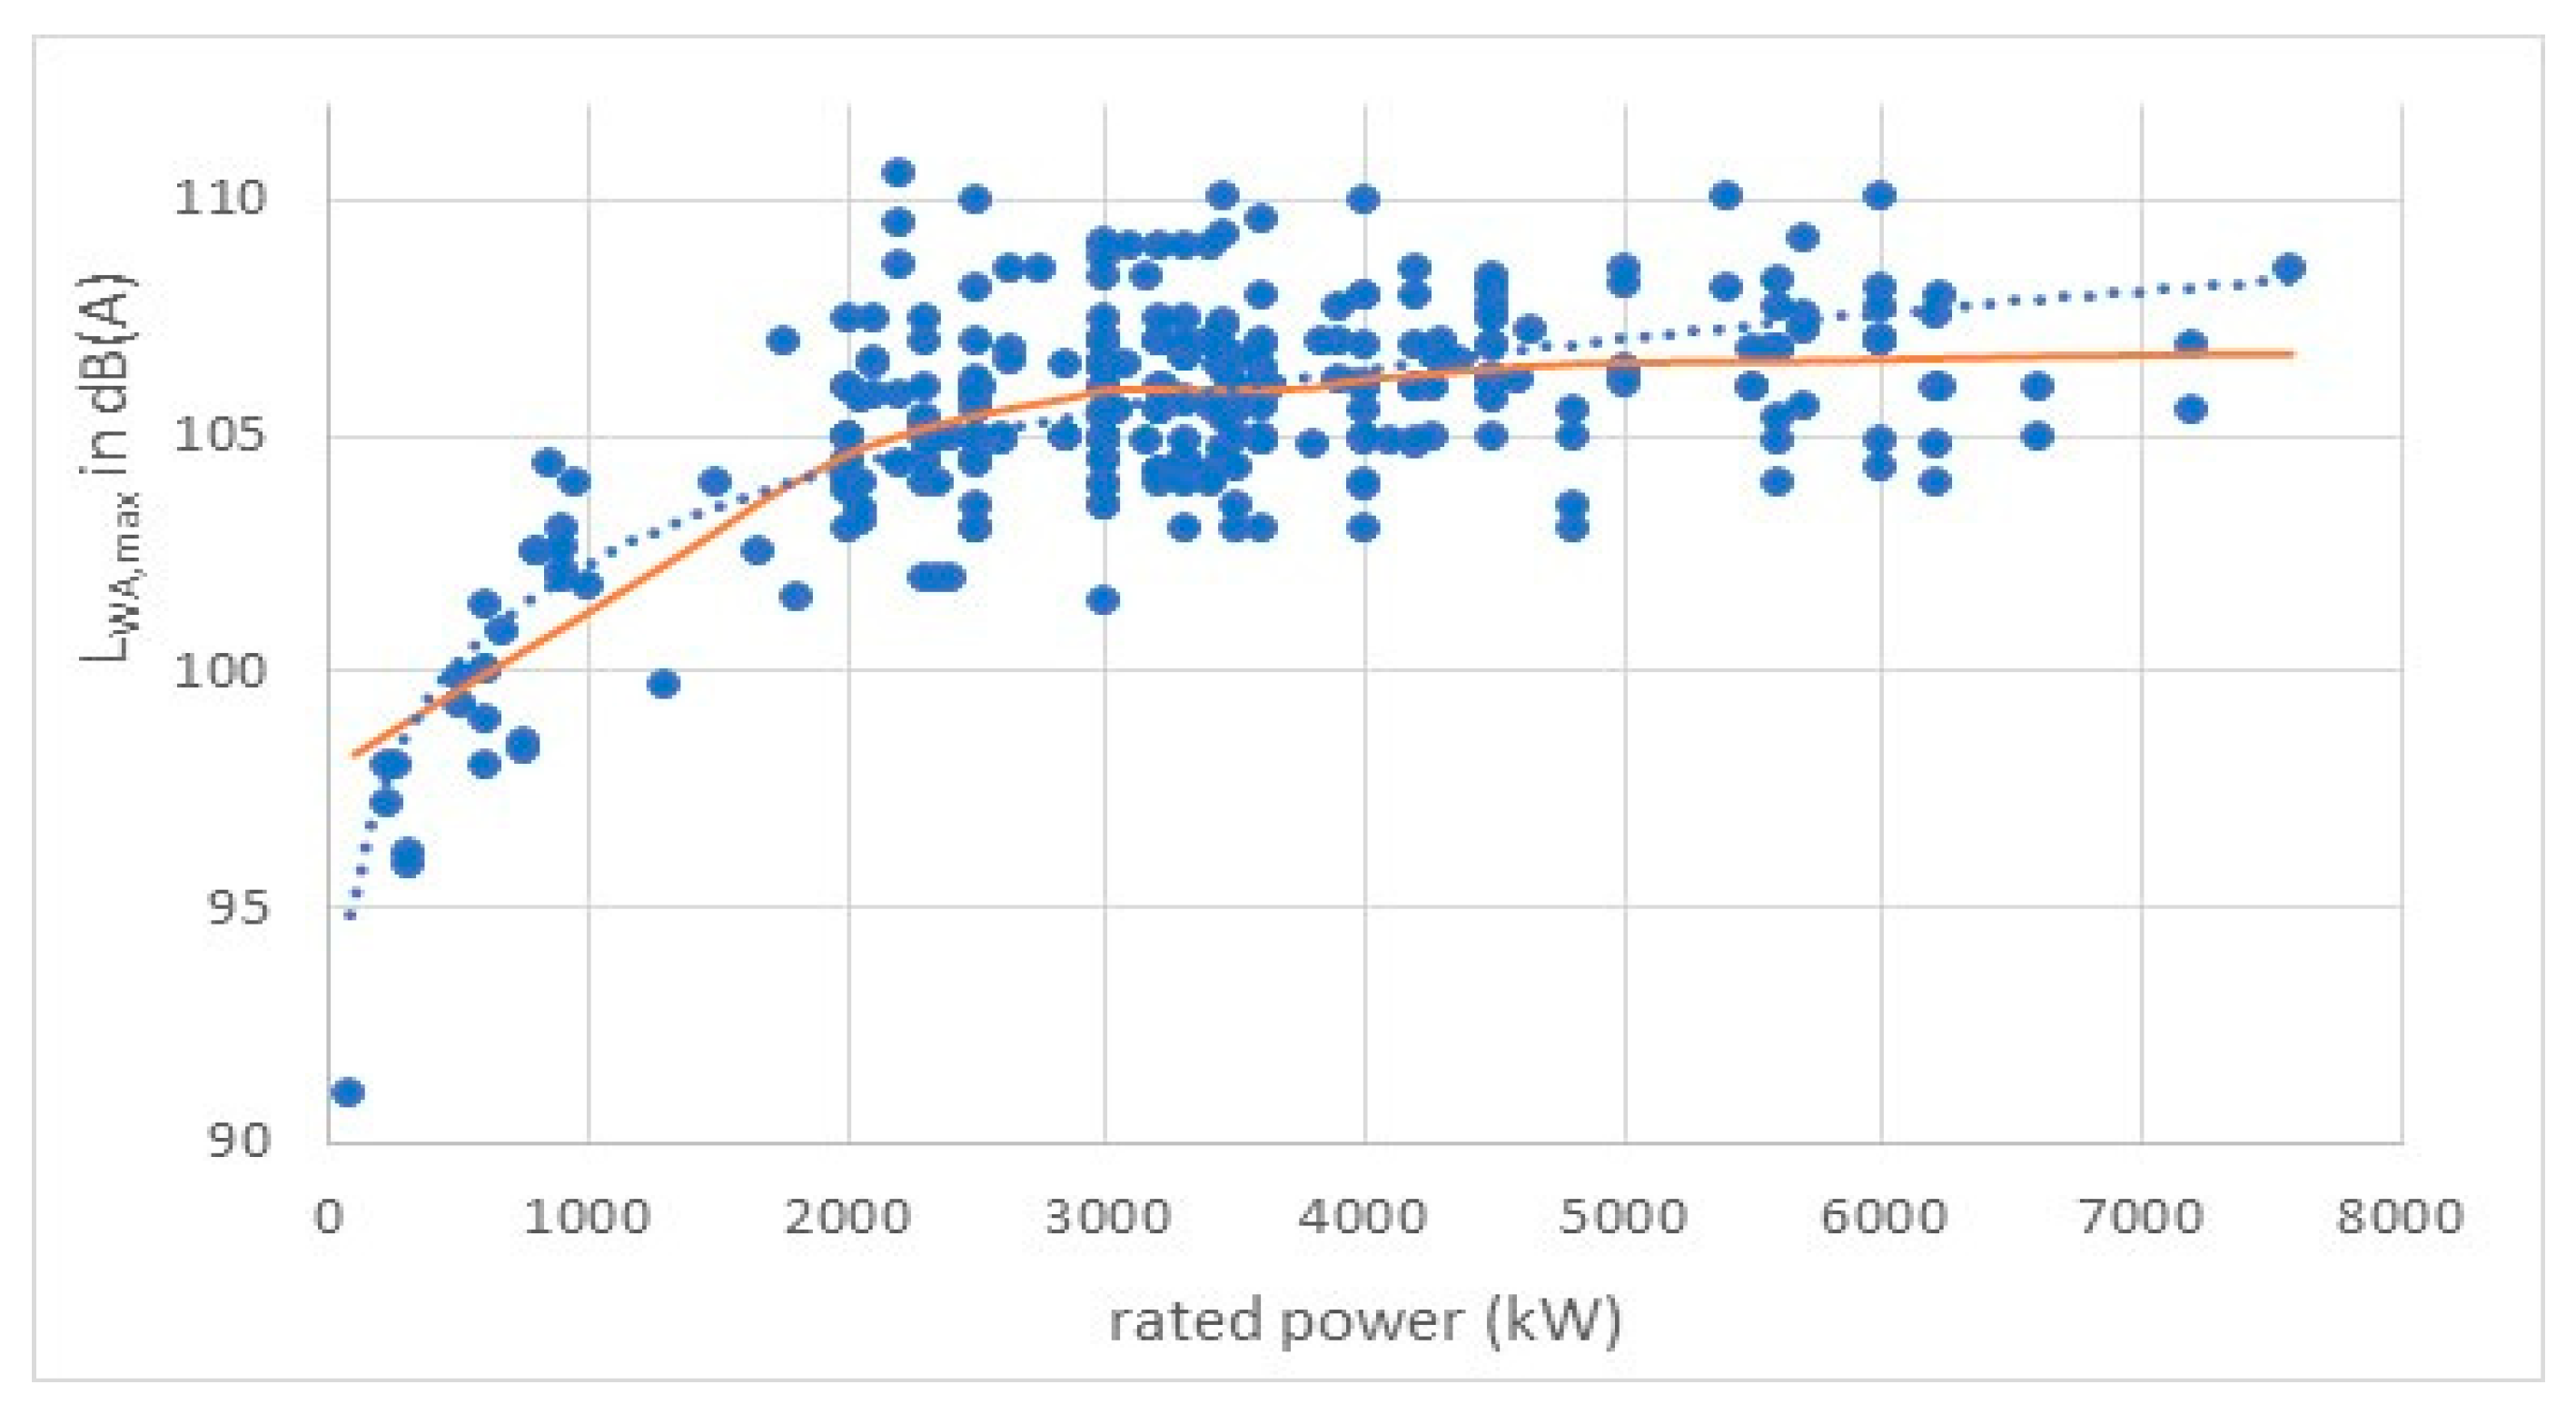
Figure 7.
Maximum sound power level (circles) and maximum low frequency sound power level (triangles) versus electric power capacity; best logarithmic approximations (dotted/dashed lines) based on 30 (LWA) and 18 (LWA,LF) turbine types < 2 MW and similarly 262/144 for ≥ 2 MW.
Figure 7.
Maximum sound power level (circles) and maximum low frequency sound power level (triangles) versus electric power capacity; best logarithmic approximations (dotted/dashed lines) based on 30 (LWA) and 18 (LWA,LF) turbine types < 2 MW and similarly 262/144 for ≥ 2 MW.
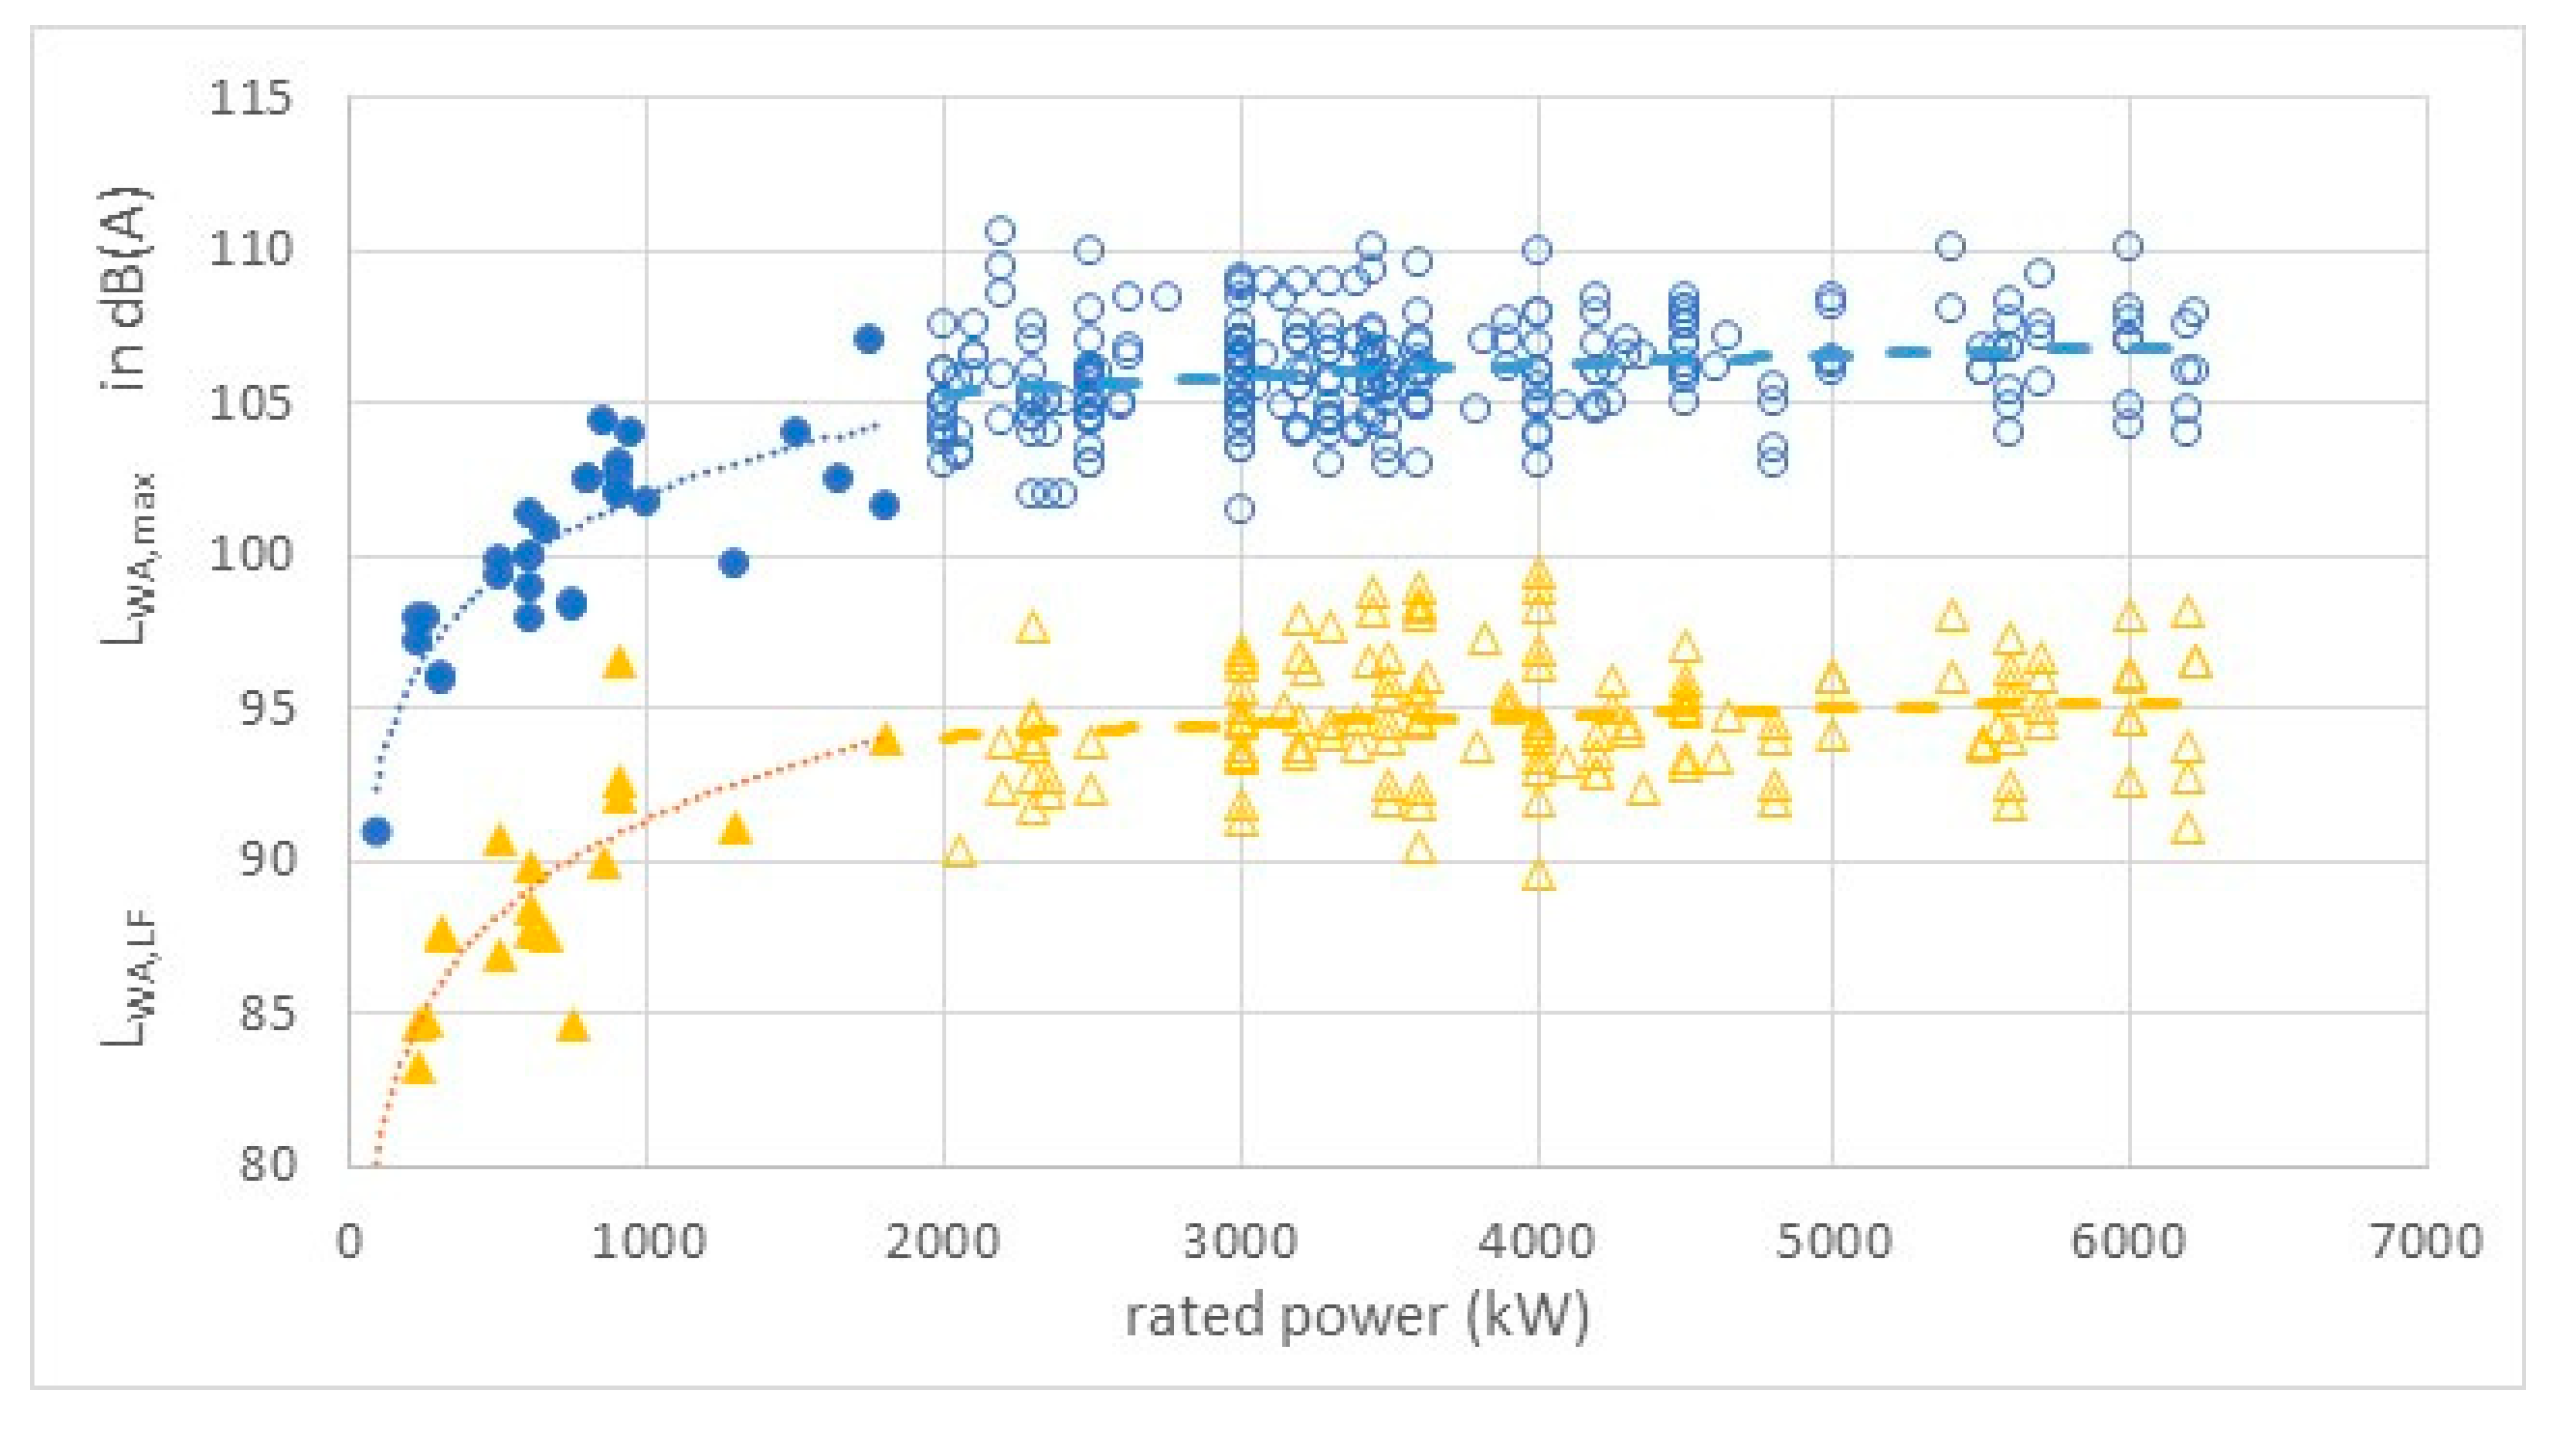
Figure 8.
Sound power level LWA in relation to incoming wind speed Vwind averaged for wind turbine types with (filled blue circles) and without (open orange circles) serrations. Green dashed line shows proportionality 50∙log(Vwind), based on data from 76 turbine types with and 221 without serrations. Curves shifted 0.03 m/s right or left to separate standard deviation error bars.
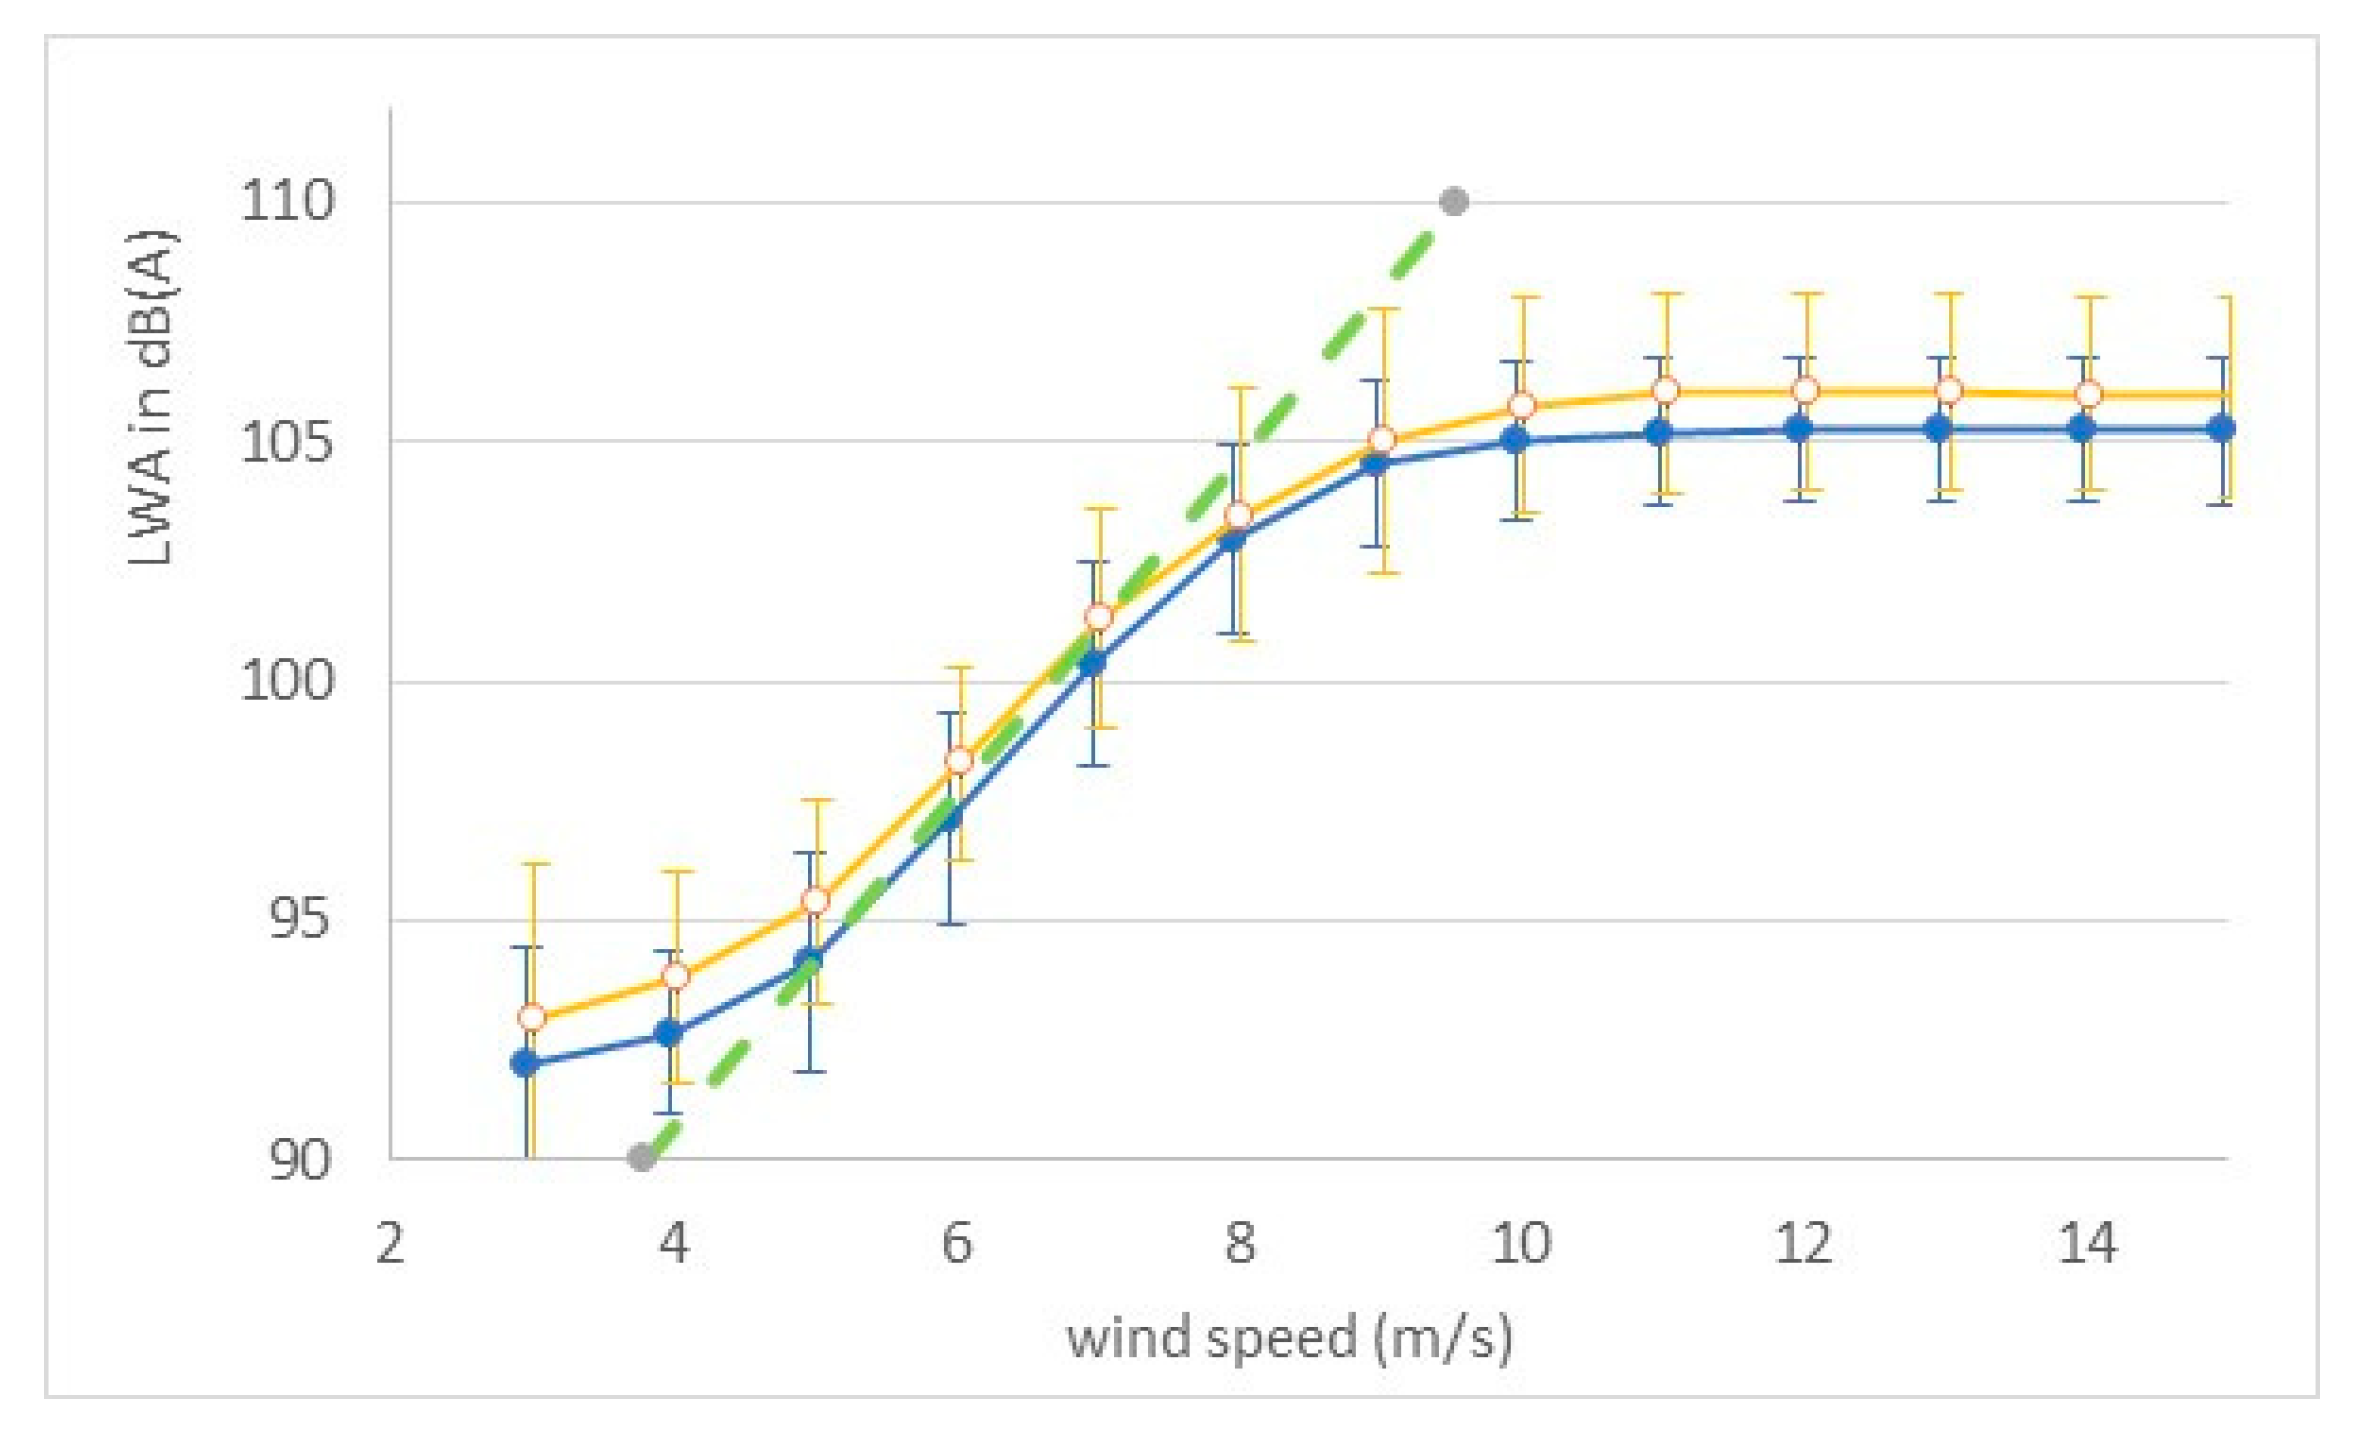
Figure 9.
Sound power octave band spectra at rated power (A, left) and normalized to individual sound power level LWA,max (B, right), with arithmetic means (bold lines with markers). Based on data from 123 turbine types.
Figure 9.
Sound power octave band spectra at rated power (A, left) and normalized to individual sound power level LWA,max (B, right), with arithmetic means (bold lines with markers). Based on data from 123 turbine types.
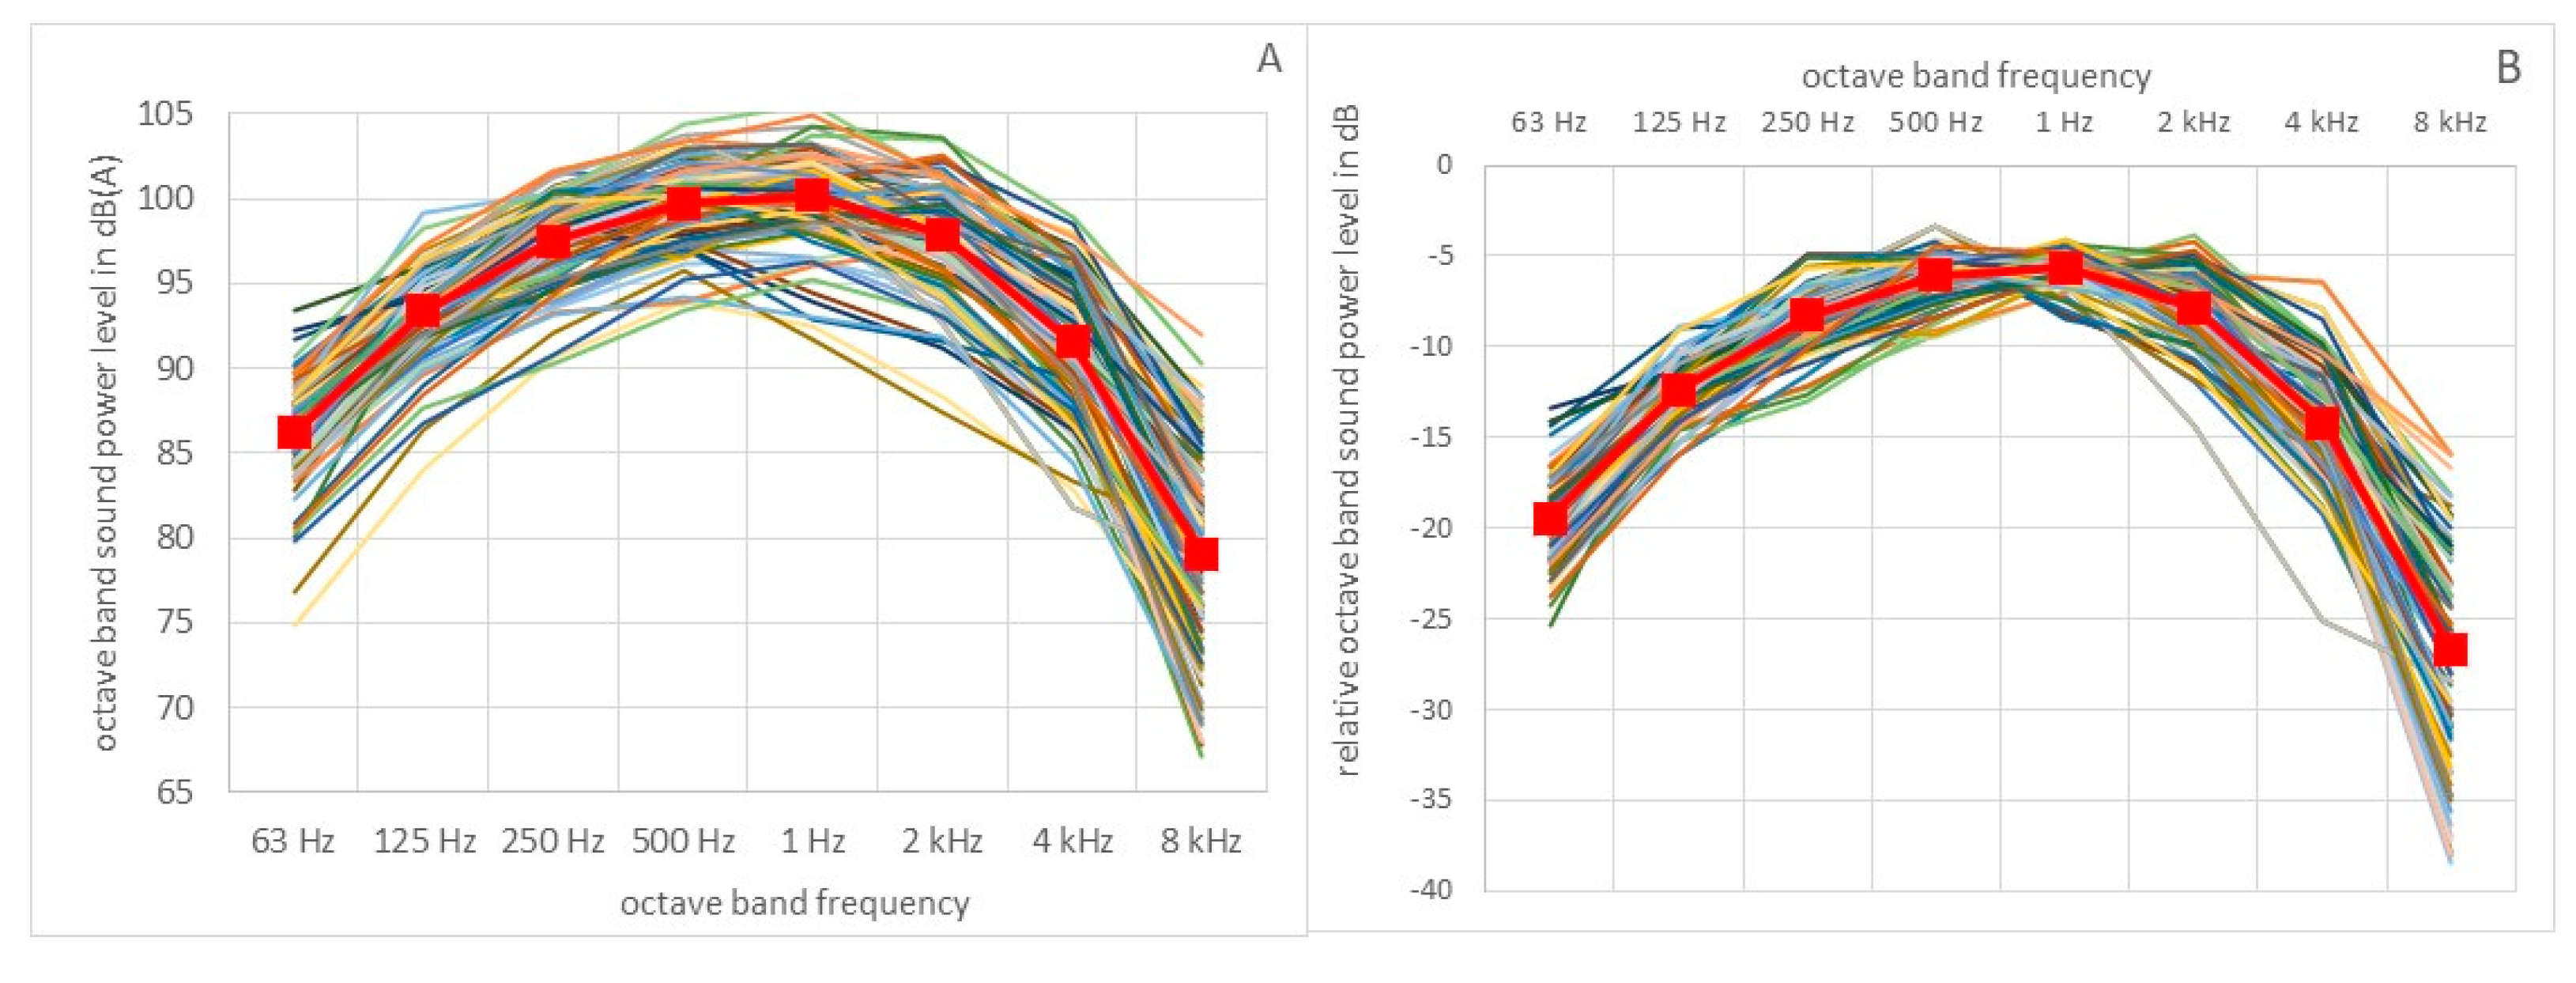
Figure 10.
Above: average normalized octave band sound power spectra for wind turbines < 2 MW (A, left) and > 2 MW (B, right) in the present study compared to spectra from Sondergaard [1] and Møller and Pedersen [3]. Below: differences between earlier and present spectral levels, at right with 1 s.d. error bars; positive difference means present value is lower. Present study based on 9 turbines < 2 MW and 114 > 2 MW, the latter include 25 turbines with serrations.
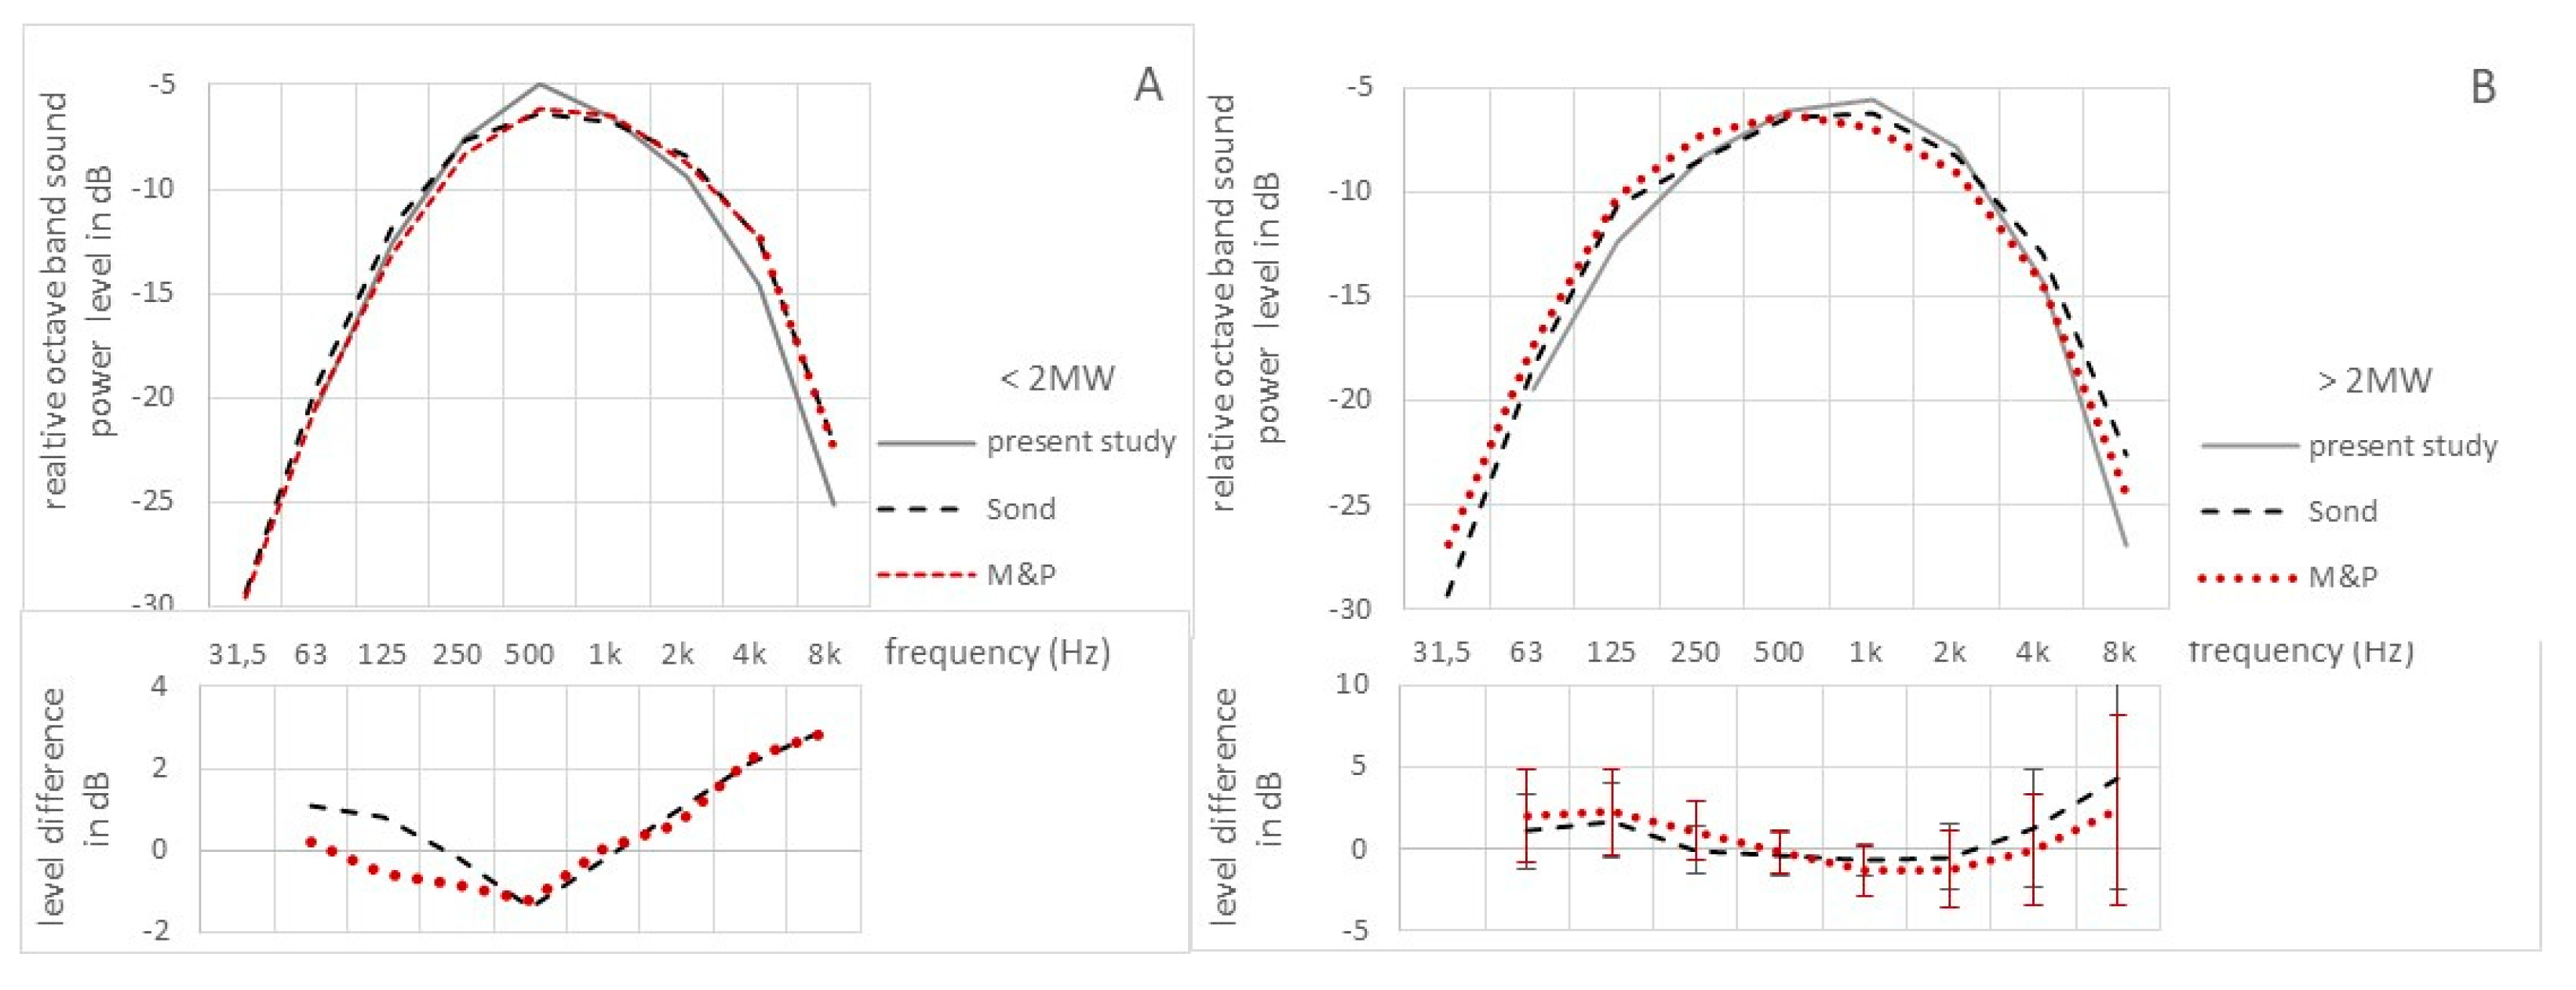
Figure 11.
Maximum sound power level of turbine types with serrations (orange diamonds) and without (blue circles) versus rated power, with best logarithmic approximations (dotted lines) based on 218 (without) and 74 (with serrations) turbine types.
Figure 11.
Maximum sound power level of turbine types with serrations (orange diamonds) and without (blue circles) versus rated power, with best logarithmic approximations (dotted lines) based on 218 (without) and 74 (with serrations) turbine types.
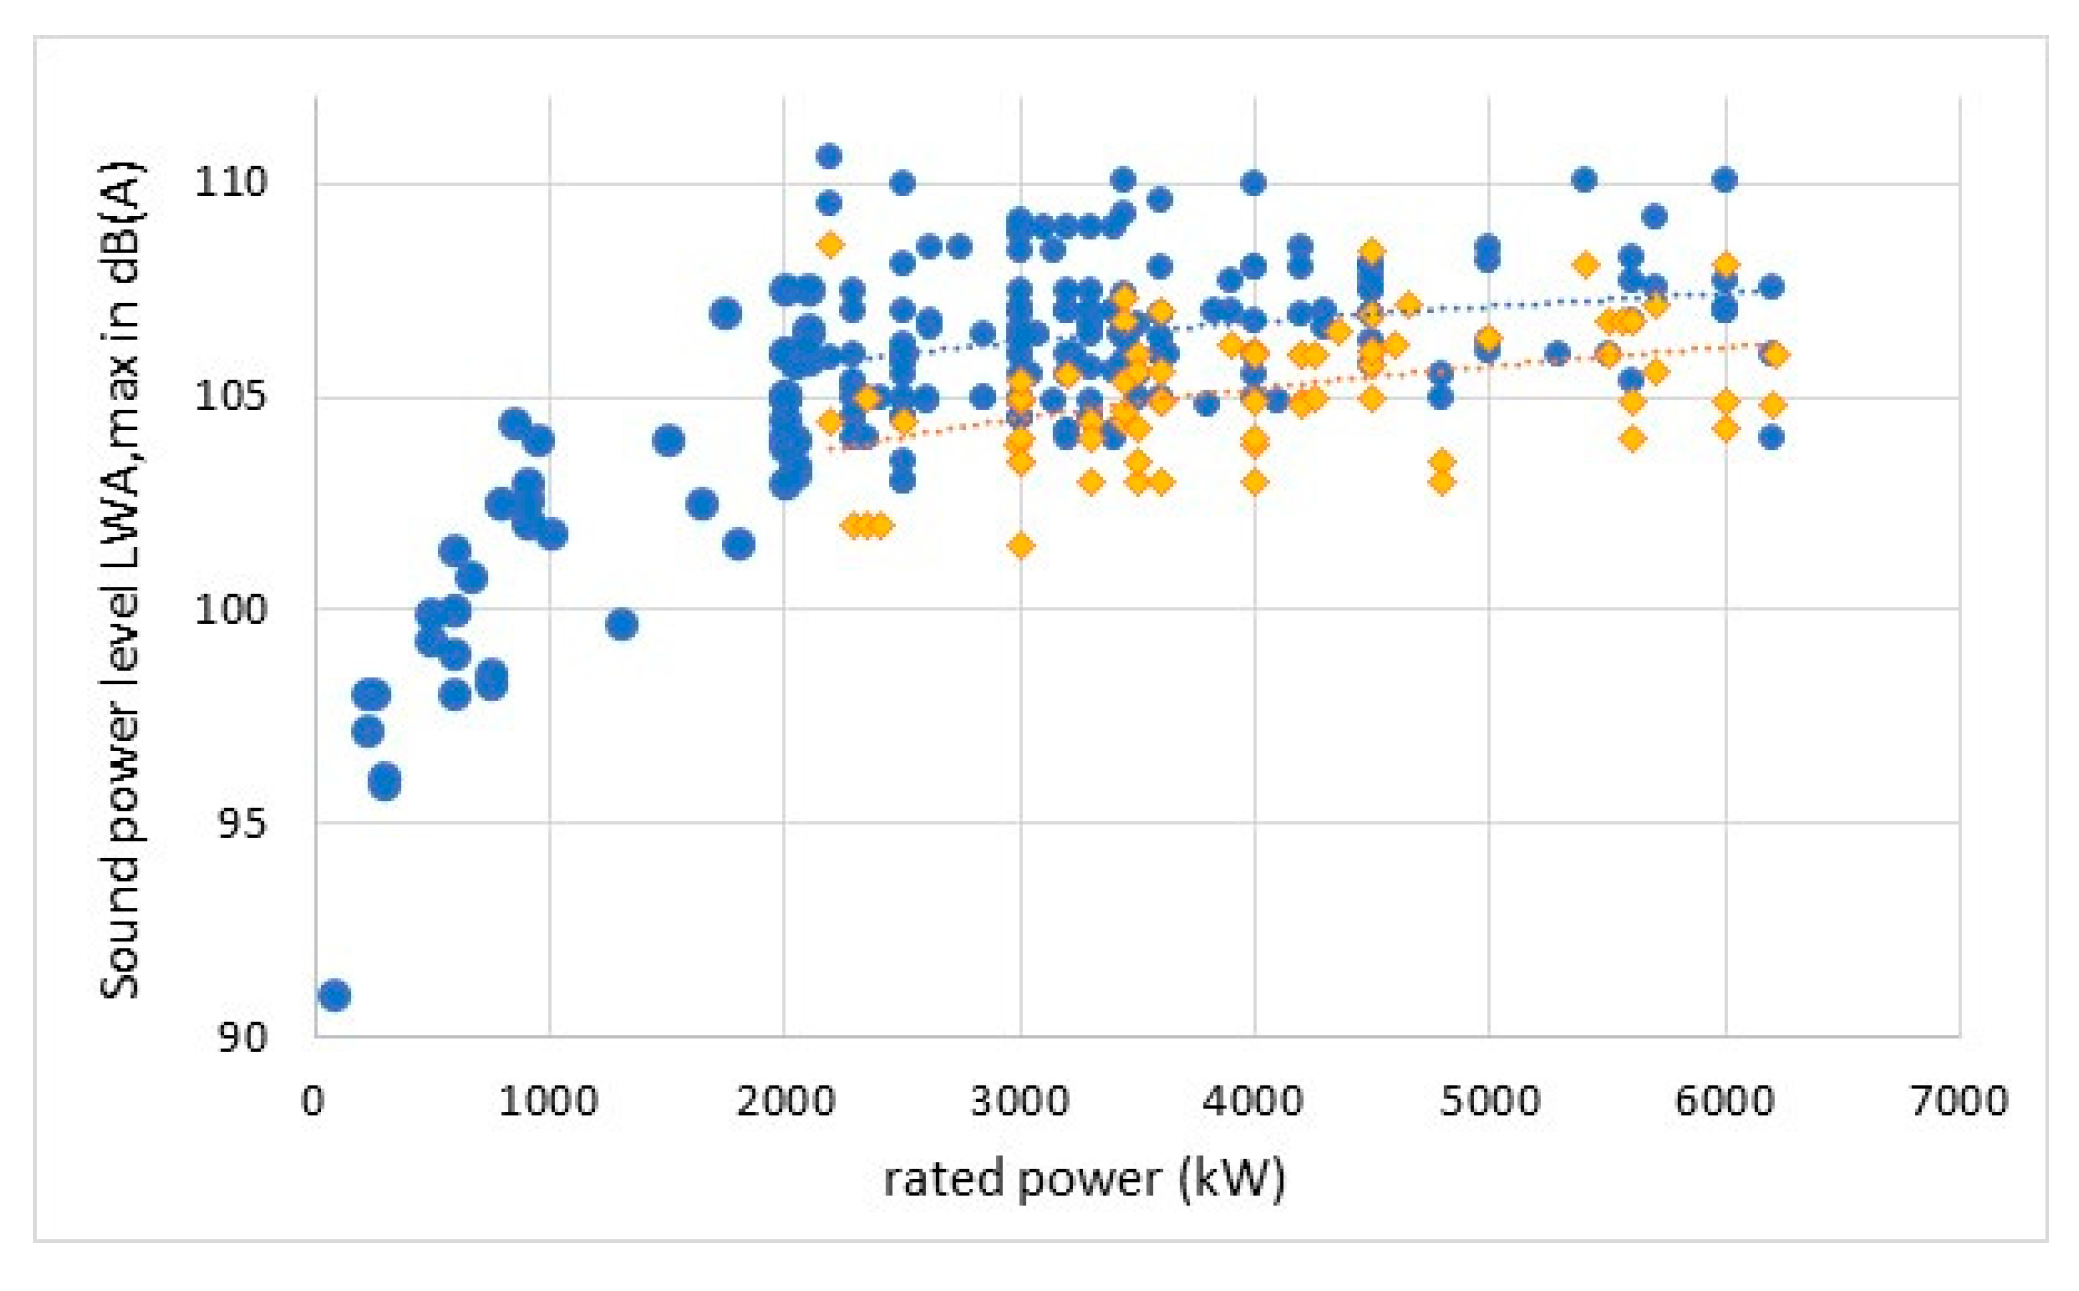
Figure 12.
Above: 1/3 octave band spectra of 11 turbine types with serrations (dotted red line) and without (solid black line). Below: difference between non-TES and TES spectral levels. Vertical bars: standard deviation.
Figure 12.
Above: 1/3 octave band spectra of 11 turbine types with serrations (dotted red line) and without (solid black line). Below: difference between non-TES and TES spectral levels. Vertical bars: standard deviation.
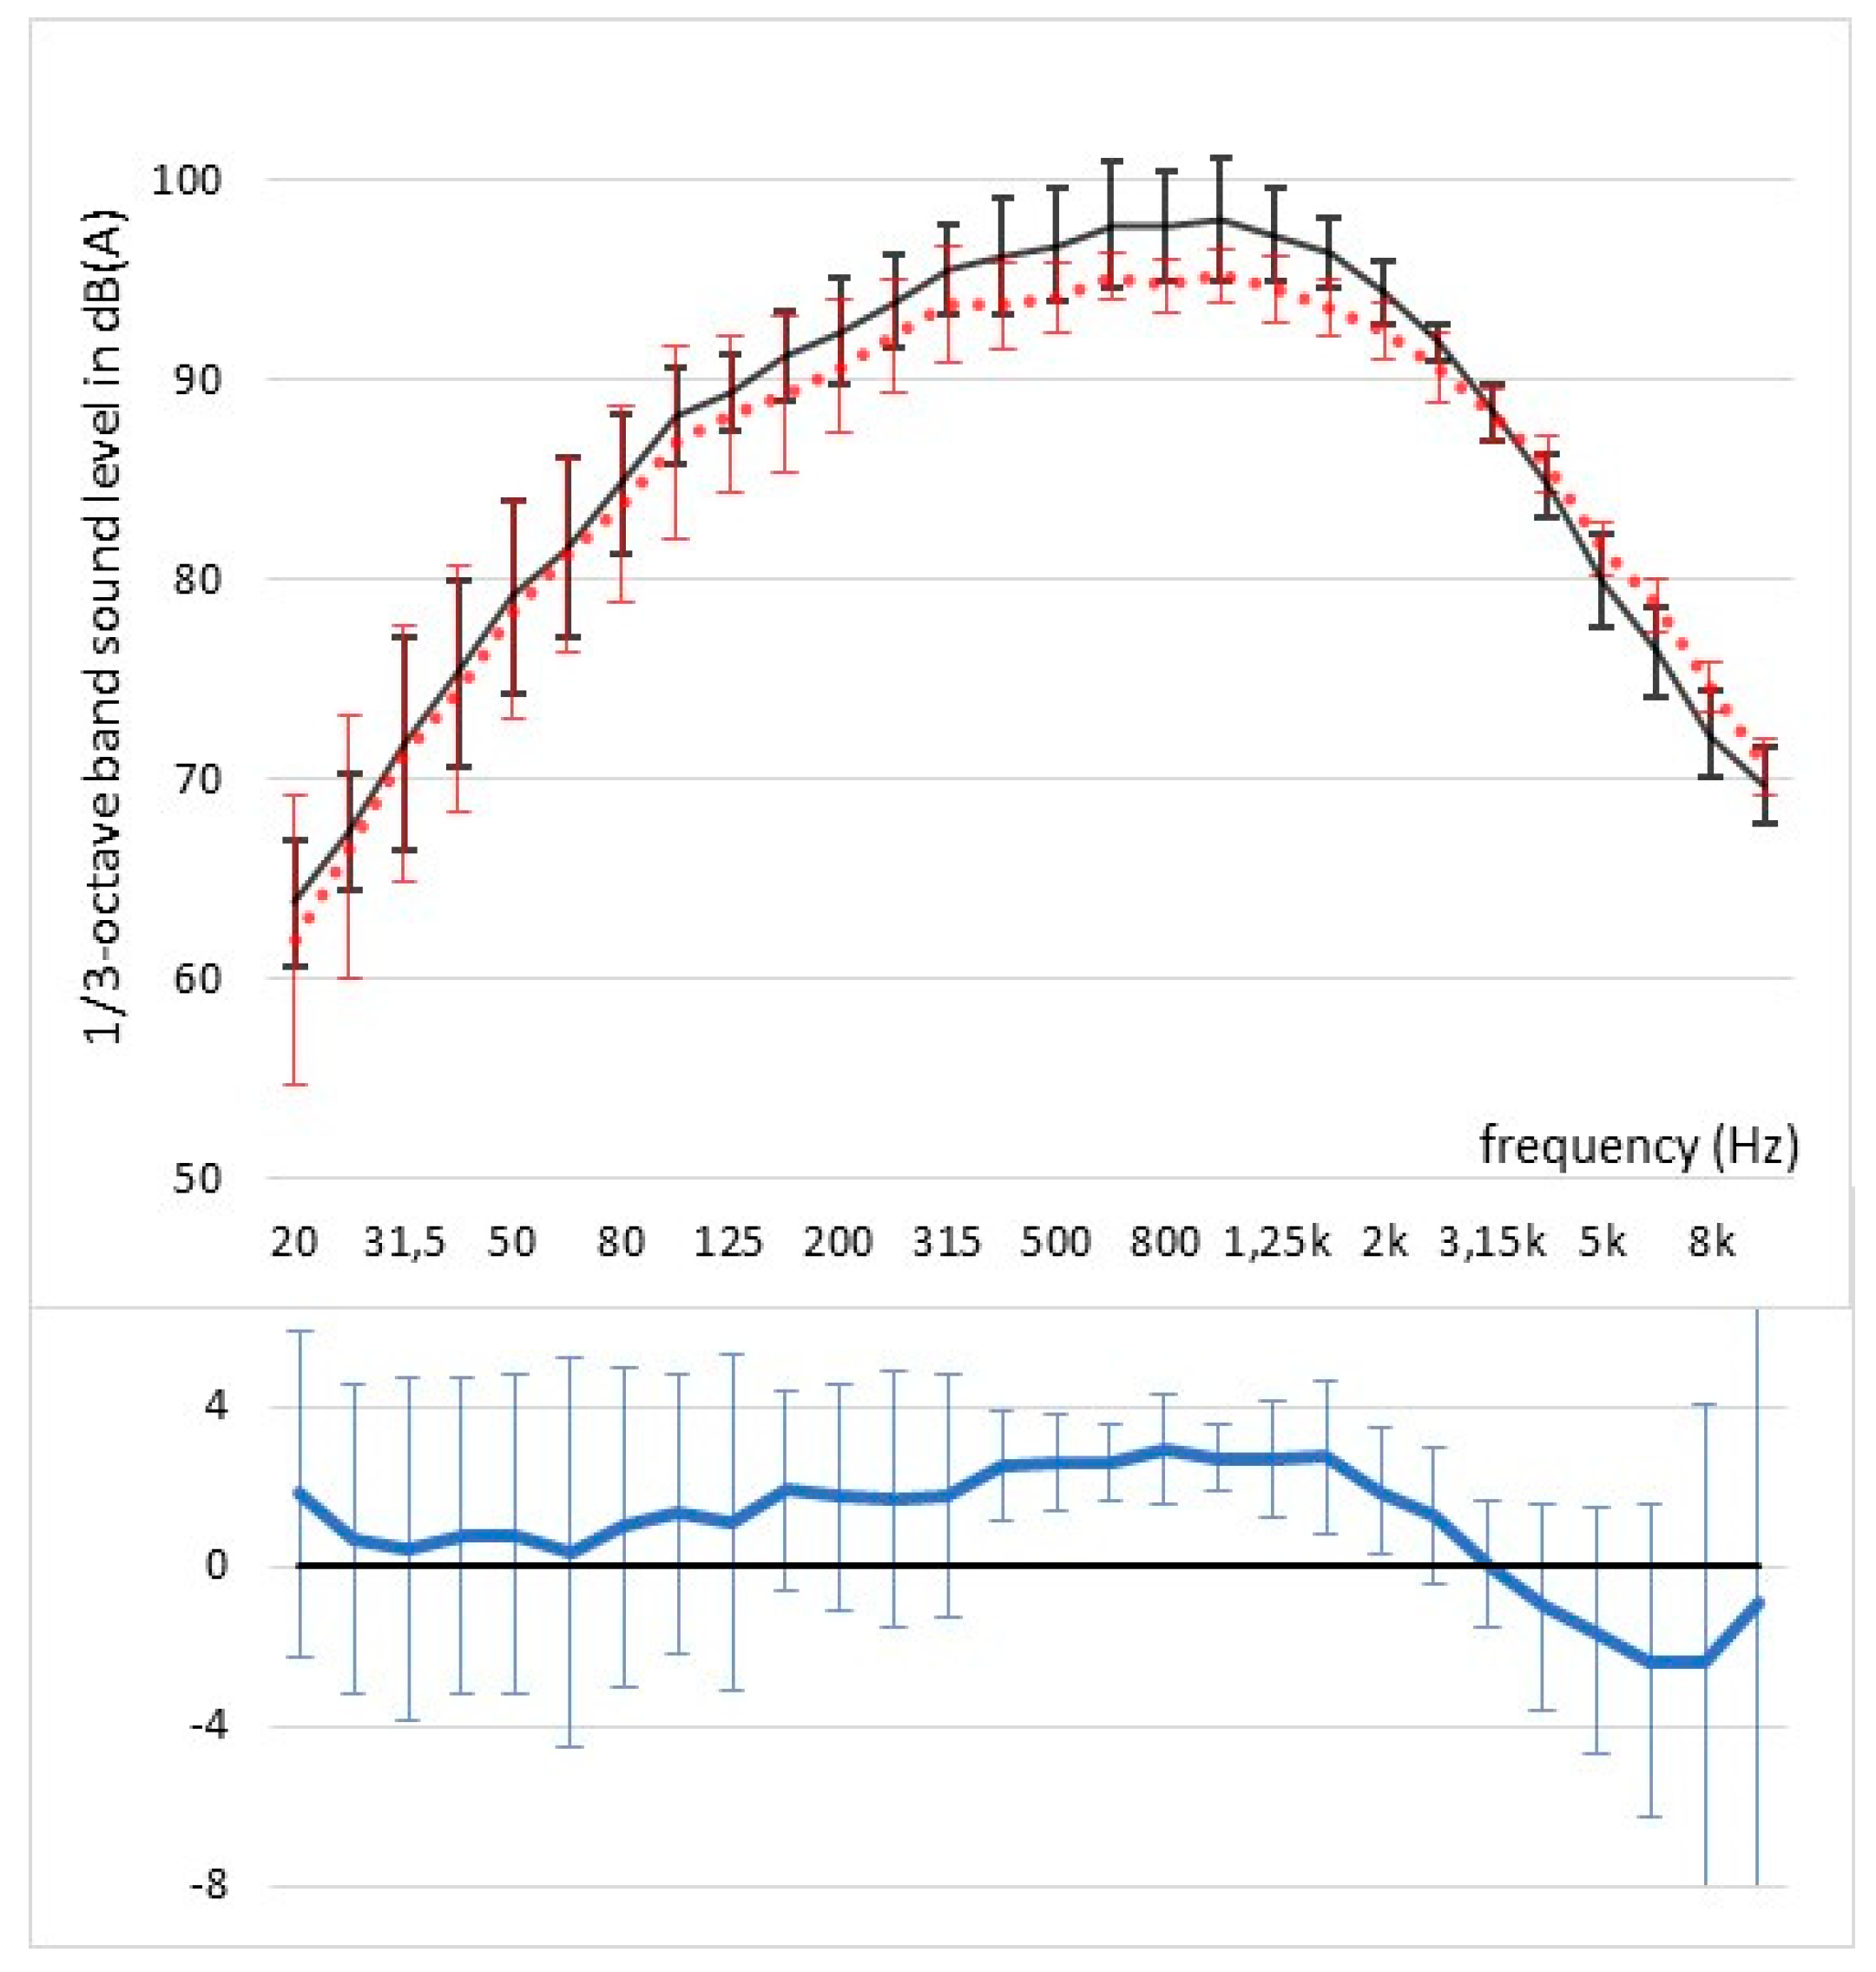
Figure 13.
Loss in power production in relation to sound reduction through use of noise mode settings, based on 21 turbine types.
Figure 13.
Loss in power production in relation to sound reduction through use of noise mode settings, based on 21 turbine types.
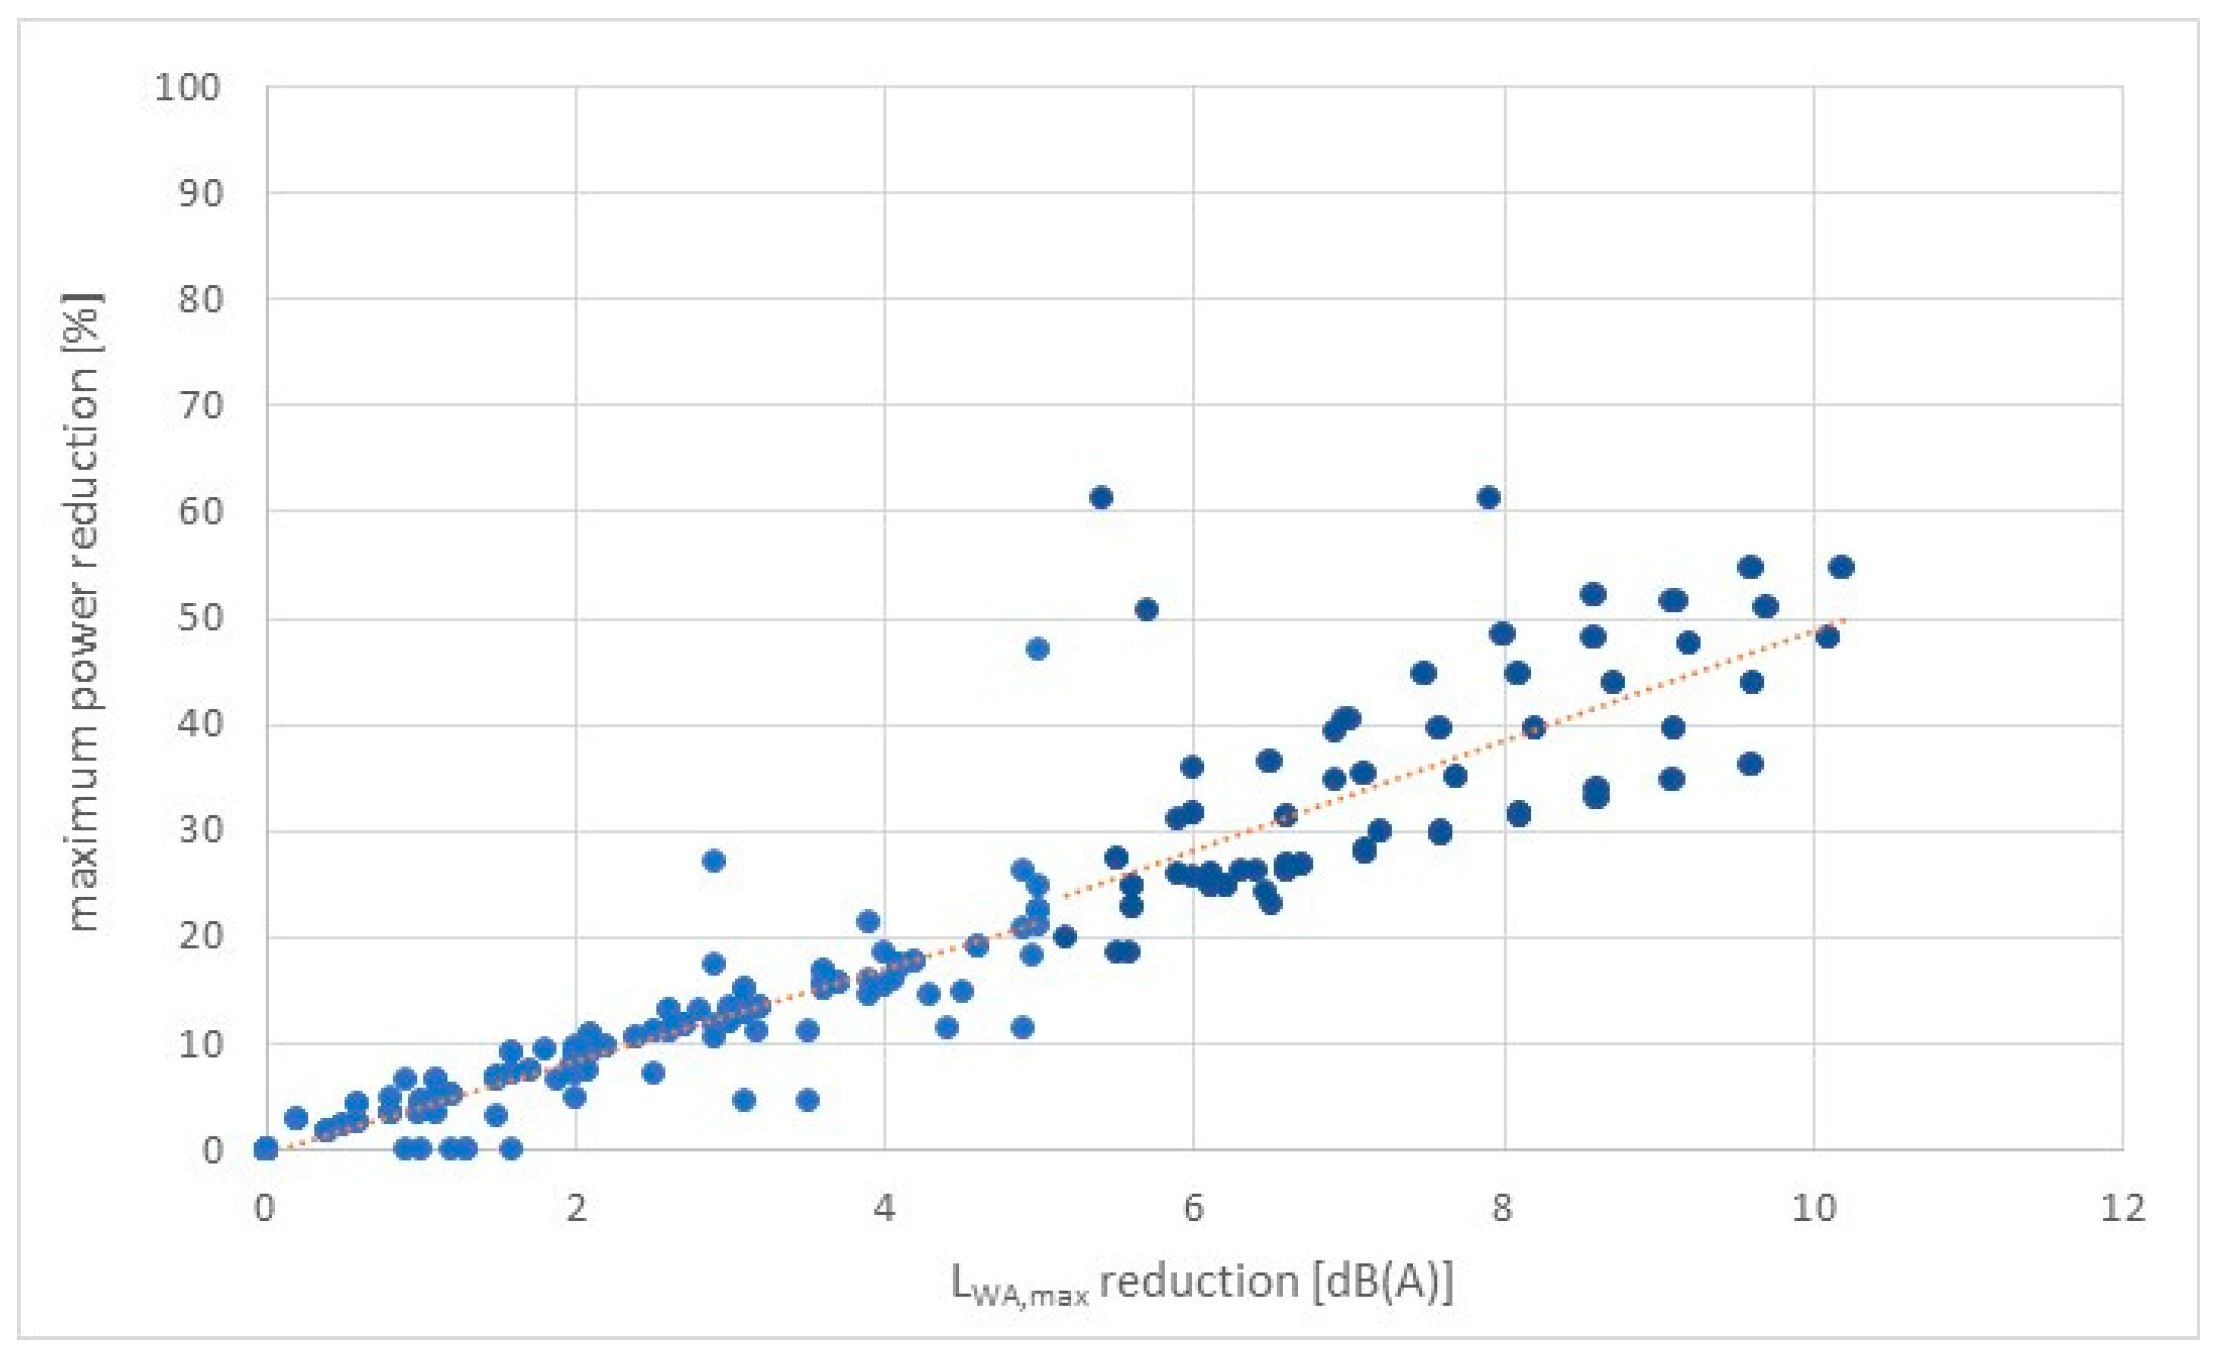
Figure 15.
Effect of adding serrations to five wind turbine types (A through E) as a function of distance to the turbine for receiver heights of 1.5 m (thick lines) and 4 m (thin lines). With serrations relative low frequency content in sound level increases from types A to E.
Figure 15.
Effect of adding serrations to five wind turbine types (A through E) as a function of distance to the turbine for receiver heights of 1.5 m (thick lines) and 4 m (thin lines). With serrations relative low frequency content in sound level increases from types A to E.
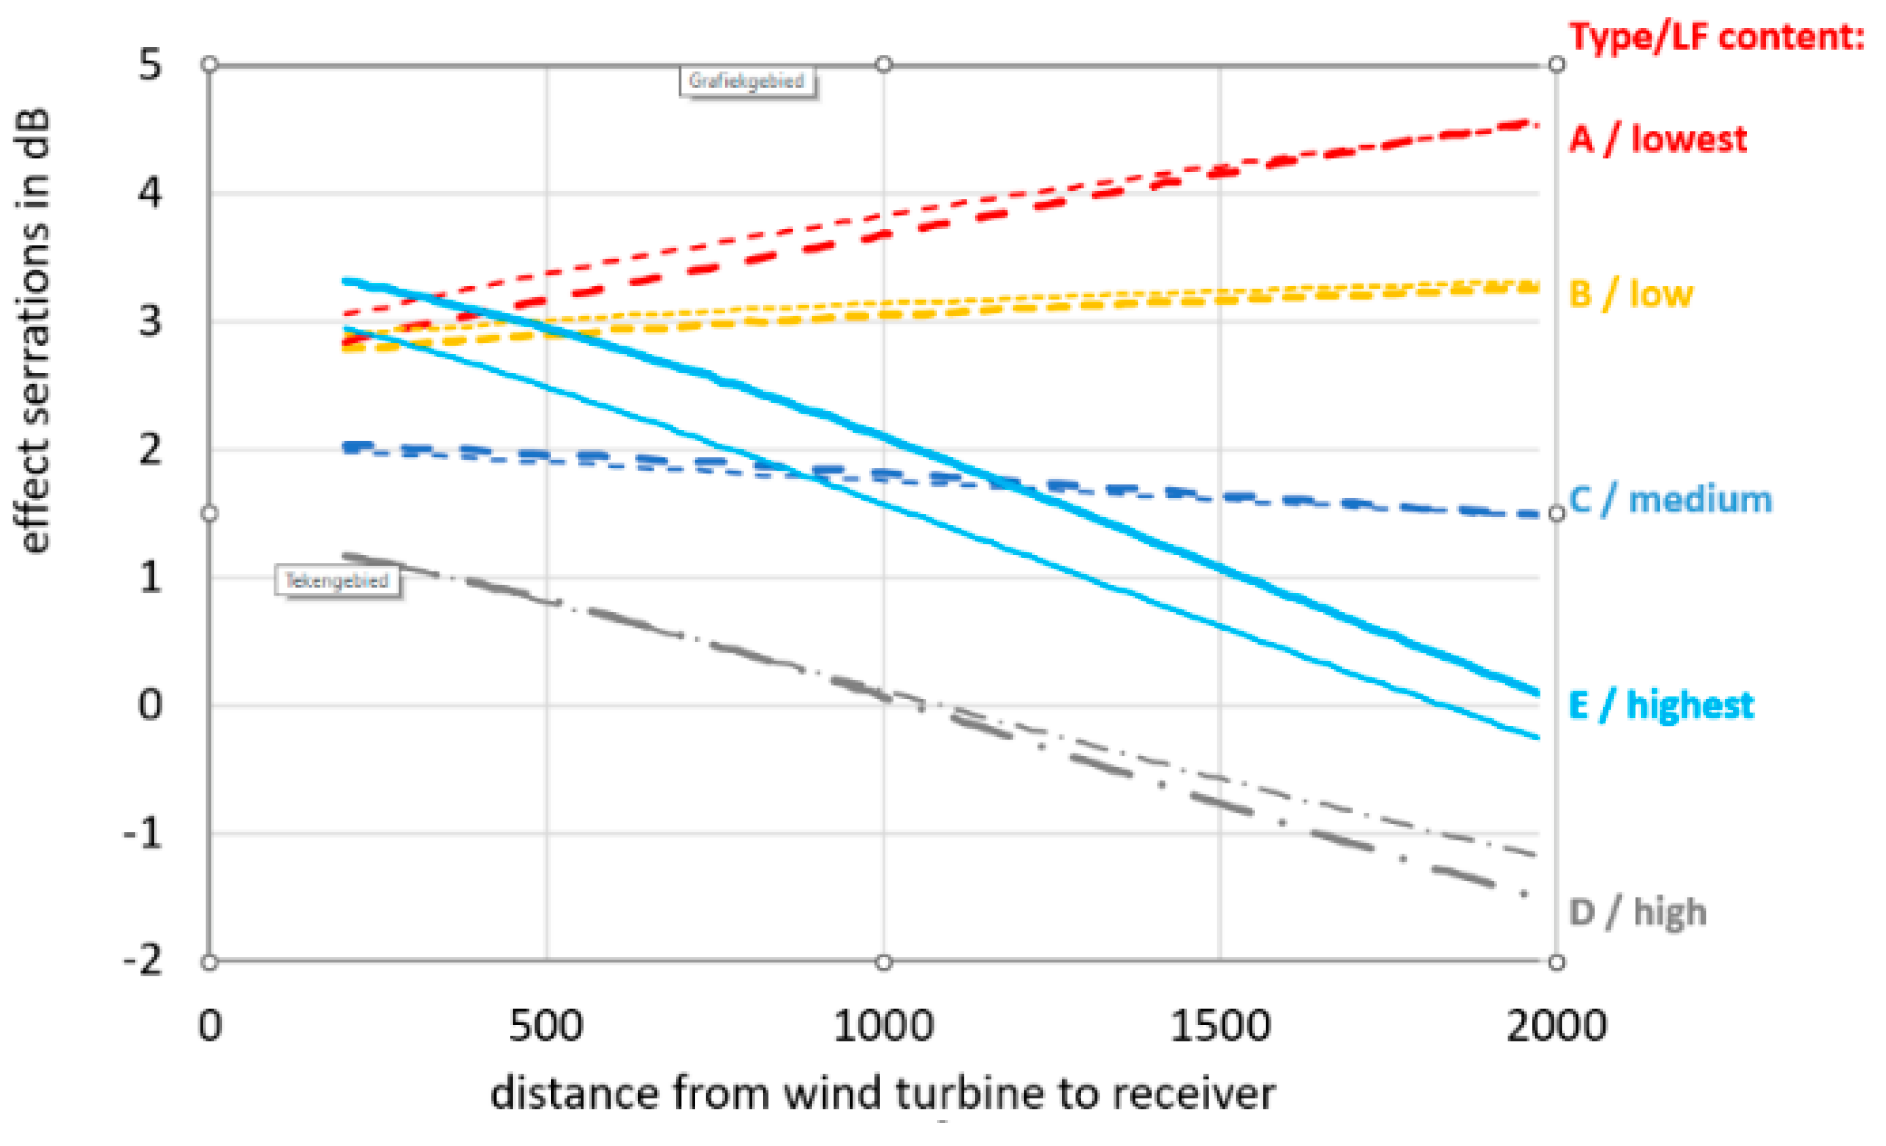
Table 2.
Effect of serrations and of low frequency content of sound power level on immission levels distant from five wind turbine types (A through E) of 3 to 6 MW.
Table 2.
Effect of serrations and of low frequency content of sound power level on immission levels distant from five wind turbine types (A through E) of 3 to 6 MW.
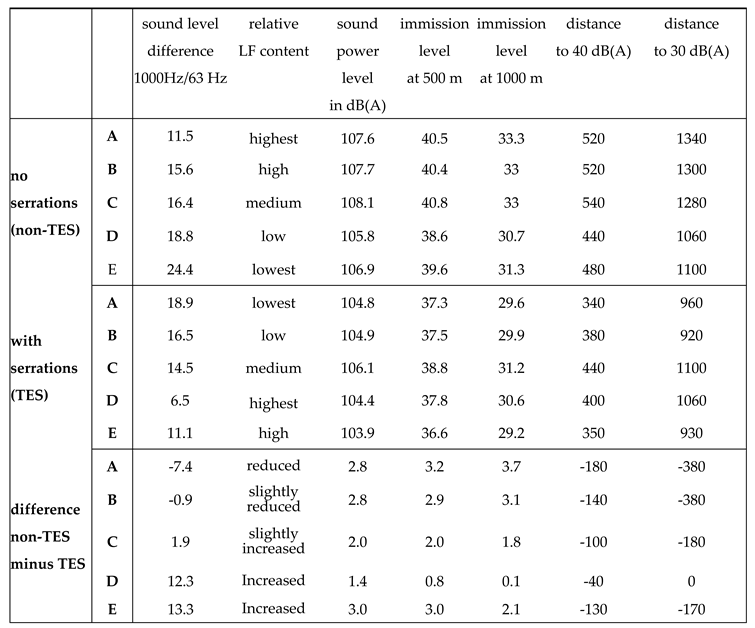
Table 3.
Absolute and relative sound power octave band levels in dB(A) for turbine types without and with trailing edge serrations.
Table 3.
Absolute and relative sound power octave band levels in dB(A) for turbine types without and with trailing edge serrations.
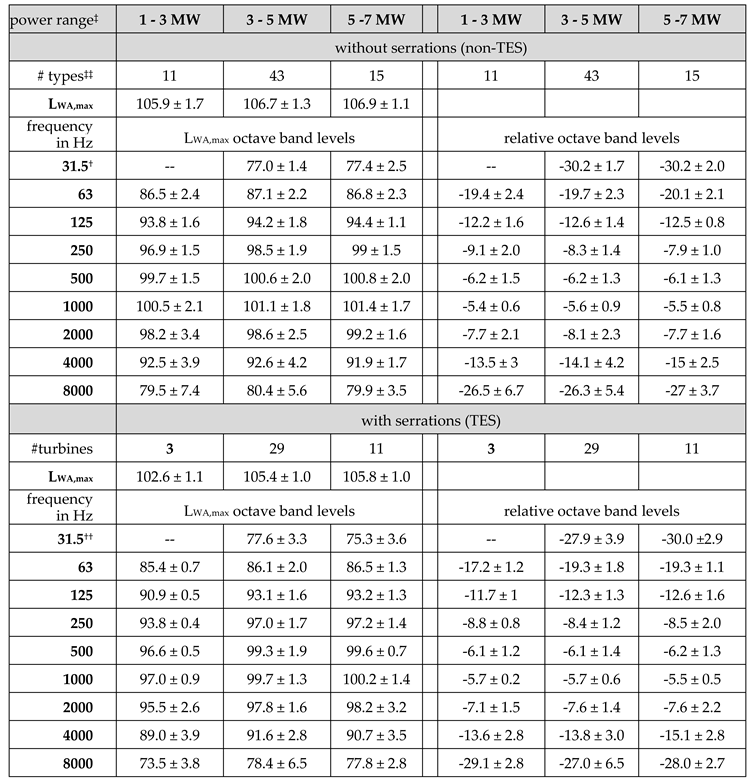
‡ 1 - 3 MW includes 1 MW and excludes 3 MW, etc. ‡‡ numbers do not apply for 31.5 Hz. †0 based on 4 and 8 types, respectively; †† based on 11 and 9 types, respectively.
Disclaimer/Publisher’s Note: The statements, opinions and data contained in all publications are solely those of the individual author(s) and contributor(s) and not of MDPI and/or the editor(s). MDPI and/or the editor(s) disclaim responsibility for any injury to people or property resulting from any ideas, methods, instructions or products referred to in the content. |
© 2024 by the authors. Licensee MDPI, Basel, Switzerland. This article is an open access article distributed under the terms and conditions of the Creative Commons Attribution (CC BY) license (http://creativecommons.org/licenses/by/4.0/).
Copyright: This open access article is published under a Creative Commons CC BY 4.0 license, which permit the free download, distribution, and reuse, provided that the author and preprint are cited in any reuse.


