
Submitted:
26 April 2024
Posted:
26 April 2024
You are already at the latest version
Preprints on COVID-19 and SARS-CoV-2
Abstract
For this research we are selected three indicators of wheat: yield (t/ha), producer price (USD/t) and share of the harvested area under wheat in relation to the total land area of country (%). The mentioned indicators were analyzed for the period 2006-2021 in thirty-two European countries. The purpose of the research is to determine which of the mentioned indicators achieve average annual growth/decrease rates, what is the correlation between them, how European countries are grouped with their similarities and differences. The research examines the impact of the COVID-19 pandemic on the mentioned indicators in a two time phases: Phase I, before the pandemic (2006-2019); Phase II, during the pandemic (2020-2021). The methodological approach to the research topic involved the application of descriptive statistics, as the method of principal components analysis (abbr. PCA) with graphics. A positive correlation exists only between the yield of wheat and the share of the harvested area under wheat in the total area of the land (0.291). PCA method showed that countries are grouped differently depending on the observed indicator and the analyzed time phase.
Keywords:
yield of wheat
; producer prices of wheat
; harvested area under wheat
; loading plot
; biplot
; PCA method
; COVID-19
1. Introduction
Agriculture is important for all countries of the world, and the sustainable development of agriculture is the need of the whole nation [1].
Wheat (Triticum aestivum) represents one of the main agricultural crops, whose production is widespread, given that it is grown in different regions and at different altitudes (up to 4,570 m above sea level) [2]. This possibility can be attributed to the good agronomic adaptability of wheat, simple storage and easy processing of the grain. At EU level, more than 30% of arable land is occupied with winter wheat) [3]. It is considered that, along with wheat, which is an essential plant crop, corn and rice occupy an important place, primarily from the aspect of their position in the food chain [4].
Organizing the production of wheat is a required job, because one must know the organizational, economic and natural characteristics of the seed and the natural environment for its cultivation. Depending on the degree of fulfillment of these conditions, the value of the realized income and accompanying production costs will also depend [5]. We know that the yield of wheat is most affected by the application of adequate fertilizers and pesticides, which is also the case with other crops. Some authors [6] investigated the factors that most affect wheat yields in European countries and observed that the applied technology in production, the type and number of treatments with fertilizers and pesticides, etc., are equally important. They found an insignificant correlation between applied nitrogen, phosphorus, potassium, and average wheat production in countries like Spain and Italy, while in Romania and Hungary this correlation is very strong. If we look at the caloric value of wheat intended for human consumption, it is observed that this crop contains the highest caloric value and reaches as much as 20.4% (data for 2009) [7,8].Observing the level of the European Union (EU), we confirm the fact that there are measures financed by the so-called measures of the Common Agricultural Policy (abbr. CAP), both for member states of the union, and for European countries that have acquired the status of EU membership [9]). This fact should always be taken into account in view of the constant increase in the population in the world, which is why it is necessary to increase the area under wheat [10,11]. Countries that have acquired the status of candidates for EU membership are recommended to constantly build and strengthen the legislative framework and to constantly work on monitoring the implementation of support for public policy measures) [12,13].
Wheat is the third most widely produced grain in the world after rice and corn [14,15,16], while as a food culture it is in a high second position. Otherwise, bread wheat occupies 95% of the world’s surface [17].
In the total turnover of all grains in the world, wheat participates with 50%, while in production with 30% [18]. Therefore, this crop represents one of the most important crops in the world economy, and its market and prices often have a significant impact on the global economy and trade. According to International Food Policy Research Institute (abbr. IFPRI) projections, the demand for wheat in the world has grown rapidly, so it is expected that in 2050. will be about 60% higher compared to 2020 [19,20]. Regarding to the fact that the importance of wheat in the global food system is significant, any impact on production, such as droughts, wars, and pandemics, reflects on the indicators of wheat at the world level [21]. Accordingly, due to the emergence of the COVID-19 pandemic, the prices of certain agricultural products have become unstable, while some agricultural crops record a constant increase in prices [22].
Average per year, share of agricultural land in land area worldwide from years 2006 to 2021 was 36.8%, and if we observe this share by continent we will see that Asia is dominant with 53.41%, and the least is in Europe with 21.02% [23]. According to the same source and the analyzed time period, in the first three countries of the world that achieved the highest average annual share of agricultural land in land area are the Falkland Islands (Malvinas) with 92.7%, Uruguay 82.19%, Saudi Arabia 80.73%, while in the tenth place is Nigeria with 74.13%.
The harvested area under wheat at the level of the world and Europe was analyzed and it was determined that in the past sixteen years the average area was about 218,533,677 ha, and in Europe 59,636,190 [23]. The largest area under wheat in Europe is recorded in Russia, which had 25,362,334 ha on average per year, but only 1.5% average annual share of harvested area under wheat in the total area of the country. In second place is Ukraine, which had 6,434,256 ha under wheat on average per year, but with a significantly higher share of harvested area under wheat in the total area of the country, reaching a value of 10.7% on average per year. According to the representation of the area under wheat, France is in third place with 5,280,948 ha, i.e., with 9.6% share in the total area of the country. According to the order of countries, and based on the harvested area under wheat, Serbia is in the seventeenth position with 569,537 ha and 6.5% of the annual average share of this area in the total area of the country. Of the analyzed thirty-two European countries, Slovenia had the smallest harvested area under wheat with 30,874 ha with a share of only 1.5% in the total area of the country (as well as Russia).
On the Figure 1 is given an overview of the realized average annual rate of change (abbr. AARC) of selected European countries in the observed period according to the analyzed variables.
On the Graph. 1. we observed that the highest average annual growth rate of yield and area under wheat was achieved by Lithuania of 4.4%, i.e., 7.7% average annual growth, while the highest average annual producer price growth rate was recorded in Ukraine with an average annual growth of 5.6%. On the graph, we can see that there are countries that have achieved negative average annual rates of change, specifically Portugal with an average annual decrease in the area under wheat with -8.3% and Switzerland with a -0.9% average annual decrease in yield.
In general, based on the given graphic representation, we conclude that the producer prices of wheat did not record negative average annual rates of change in the observed period and according to the analyzed countries, which means that the producer prices of wheat tend to increase. The remaining two observed indicators show significant fluctuations in the past period.
The COVID-19 pandemic has changed the dynamics of the overall economy, affecting many economic activities [24]. Therefore, in the continuation of the work, an analysis of the movement of selected indicators of wheat in selected European countries in the period from 2006 to 2021 will be carried out. Certainly, the authors believe that this research has its limitations, because other indicators of wheat in the world can be included, both in the period before the COVID-19 pandemic, and in the period during and after the pandemic. These changes and impacts vary from country to country.
This research is significant because it contributes to a better understanding of ways to overcome possible problems that may arise after the COVID-19 pandemic. In other words, the creators of economic and agrarian policy can apply their acquired scientific knowledge in solving specific problems, which is also the opinion of the group of authors [25]. In this sense, the applied measure will give positive results only if it is implemented in a timely and adequate manner.
2. Materials and Methods
The collection of empirical data for research on the movements of selected indicators was carried out through the open database of Food and Agriculture Organization of the United Nations (abbr. FAOSTAT).
At the beginning of the research, the indicators of wheat production at the world and European level were analyzed, as well as the changes that occurred in the past period in terms of yields, producer prices and the share of the area under wheat in the total area of the country. In the continuation of the work, we passed to the interpretation of the results of descriptive statistics that provide information on the movement of the achieved average yield, price and share of wheat in the total area of the country from 2006 to 2021. in the analyzed European countries, but also about the values of the standard deviation. There were also results obtained based on the values shown in the correlation matrix in the analyzed time according to the observed variables and European countries. The basic characteristics of the observed sample are shown in Table 1.
The authors defined the following starting hypotheses:
- the analyzed variables are in mutual correlation;
- the yield, the producer price and the share of the harvested area of wheat in the total area of the land changed in the observed time phases;
- the visual presentation of the results of the application of the PCA method shows visible changes in the graphs regarding the distribution of European countries according to the observed variables and time phases.
The aim of this research was to determine if there is a correlation between the selected indicators of wheat in the analyzed European countries, and by applying the PCA method to show in what relation are characteristics of wheat correlated with the observed European countries depending on the period of observation (before and during the COVID-19 pandemic). Also, the goal of the research is to see which European countries are mutually similar or different according to the observed variables in the mentioned time groups and whether changes have occurred, and for the purposes of this analysis the PCA method was used. Changes in the values of the variables according to the countries are also shown using histograms, which are shown according to the formed time clusters, and the resulting changes are adequately interpreted.
After applying the PCA method to the formed time phases and selected European countries, we presented the results using Loading plot and Biplot. This method was applied to reduce the number of variables to a smaller number of new variables [26,27,28,29,30,31,32,33]. In this way, we explain the largest amount of variance of the original variables with a smaller number of principal components for easier understanding of the data [34]. Based on the display of the position of the vectors on the graphs and the angle they make, adequate comments are given.
In addition to the FAOSTAT database, adequate scientific literature was also used as the main source of data for this research, which shows the positive results of applying the PCA method in agriculture and economics. Thus, the group of authors [35] applied the PCA method to determine the sources of groundwater pollution with nitrates found in agricultural areas in Qingdao (China). They concluded that the main sources of agricultural land pollution are manure, fertilizers and sewage. Groundwater pollution has been analyzed because it is considered a necessary resource for the economic and social development of a country [36,37]. The authors [38] observed the quantitative indicators of drought tolerance of bread wheat in Iran, and with the application of the PCA method they managed to reduce the number of these indicators. Authors [39] used the PCA method to investigate the classification of treated wheat grains against rice weevil in order to assess which elements of technological quality contribute the most to this classification. Authors [40] using the PCA method determined wheat genotypes that are resistant to drought. The results of applying the PCA method to the wheat cultivation system in a semi-arid environment (Mediterranean environment) showed that most of the variability of the yield and quality of wheat depend on the weather conditions in the season and the choice of variety [41]
The scientific justification of research is reflected in the deepening and expansion of knowledge. The results will be verifiable because we are confirming the scientific knowledge already acquired.
3. Results and Discussion
The initial research consisted of an analysis of the basic parameters of descriptive statistics with its results (Table 2) and the correlation matrix of the observed variables (Table 3).
The results of descriptive statistics show us that in the period 2006-2021 in the analyzed European countries, the average yield of wheat was 4.8 t/ha, the average producer price was 226.3 USD/t, and the average share of the harvested area under wheat in relation to the total area of the country was 5.6%. The deviation from the calculated average value, which is defined by the standard deviation, in the observed variables is the most noticeable in producer prices and ranges up to 78 USD/t, while the deviation of the yield (1.8 t/ha) and the share of harvested area under wheat (3.8%) is very weak expressed.
A weak positive correlation between the observed variables in the analyzed time period on the example of European countries was observed only between the yield and the share of the harvested area under wheat in the total land area and amounts 0.291. Other correlations record negative relationships, ie. the increase of one variable will affect the decrease of the other. With this, we rejected the initial hypothesis that there are no correlations between the observed variables.
In the next table (Table 4) the variability of the data according to the observed components is presented.
The variability of the observed data can be explained only on the basis of the first two components, which make up 79.9% of the total observed variability. In other words, out of the total variations (100%), the first component (PC1) explains 46,912%, and the second (PC2) 33,012% of the variability.
The following is a graphic representation (Loading plot) of established correlations and variations between observed variables (Figure 2), whereby we kept the two Eigenvalues that are shown on the X (PC1) and Y (PC2) axes.
Display on Figure 2 confirms the previous conclusion, which is that there is a correlation between the yield and the share of the harvested area under wheat in the total area of the land, because a sharp angle made by these variables is clearly observed. Accordingly, we confirmed the initial hypothesis. This conclusion is also logical due to the fact that the greater the share of harvested area under wheat in the structure of a country, the higher the yield of wheat in that country.
Considering the relationships and the angle made by the remaining variables, we can see on the Loading plot that the relationships between individual variables have a negative correlation or are not correlated. Accordingly, if we look at the relationship between the producer price and the share of the area under wheat in the country’s surface, we conclude that there is a negative correlation. We explain this situation that if the share of the harvested area under wheat increases in a country, the producer price of wheat decreases to that extent. Also, from the Loading plot, we can observe that there is no correlation between the realized yield and the producer prices of wheat.
Variability of the observed variables according to the analyzed European countries in the period 2006-2021 years are represented by Biplot (Figure 3 and Figure 4). Biplot allows us to graphically see the relationships between variables and principal components by means of a graphical display. Due to the volume of data and better interpretation and visualization of the obtained results, it was decided to display the biplot in two parts, where each part contains the results of similarities and differences between the sixteen European countries according to the observed components and arranged according to the alphabet of the country names. With such a graphical presentation, we reject the initial hypothesis and we conclude that the biplot can be used to show the distribution of European countries according to variables and time phases.
On the Figure 3 and Figure 4 we notice that the following countries achieved the highest yields of wheat before the corona: United Kingdom, Netherlands, Denmark, Czechia and Belgium, while the lowest wheat yield was achieved in countries such as the Russian Federation, Portugal, North Macedonia, Estonia and Greece. In the years during the COVID-19 pandemic, the countries with the highest yield were Denmark, France, Belgium, Sweden and the Netherlands. The lowest yield was recorded in Greece and Estonia. Consequently, the initial hypothesis was confirmed because changes were observed in terms of wheat yields between countries and according to observation periods.
If we analyze the positions of countries from the aspect of producer prices, we notice that the highest producer prices before and during the pandemic were achieved by Switzerland, Norway and Italy. In contrast to them, in the period before the pandemic, the lowest producer prices of wheat were recorded in Ukraine, Bulgaria, Hungary and Latvia, and during the pandemic in Ukraine, Romania and Serbia. Therefore, the initial hypothesis was confirmed because there were significant changes in the value of producer prices of the observed countries in the analyzed periods.
The European countries that in the years before the pandemic had the highest achieved share of the area under wheat in the total area of the country are Denmark, France, Sweden and Czechia, and Portugal, Finland and Greece the least. During the pandemic, Italy and Slovenia recorded the lowest share of the area under wheat in the total area of the country. Accordingly, the initial hypothesis is accepted because changes in the value of this variable were noticed in the observed countries according to the defined time phases.
In accordance with the afore mentioned conclusions, the authors conclude that the visual presentation of the results of the application of the PCA method contributed to the observation of differences in the distribution of the observed countries according to different time phases and variables, which confirmed the initial hypothesis.
The following Figures (Figure 5, Figure 6 and Figure 7) show the changes in variables that occurred in the observed European countries in the analyzed period.
In 80% of the analyzed European countries (25 of them), a higher wheat yield was observed during the COVID-19 pandemic than in the years before the pandemic. In the remaining five countries, the yield is mostly reduced, and only in one country (Germany) is the yield at an unchanged level according to the observed time groups. Also, from the graph, we can notice that Belgium, the Netherlands and the United Kingdom achieved the highest returns in the years before and during the COVID-19 pandemic.
Regarding producer prices, there are no big differences in the years during the pandemic compared to the period before the pandemic, except for Italy, where there was a significant increase in prices during the period during COVID-19. From Graph 6, we can see that Switzerland and Norway had the highest producer prices for wheat in the observed period.
In the analyzed countries, during the COVID-19 pandemic, there was generally a decrease in the share of areas under wheat in the total area of the country compared to the observed time period before the pandemic.
In the period before corona, Denmark, Ukraine and Hungary had the largest share of the area under wheat in the total area of the country. A significant increase in the area under wheat during the pandemic was observed in Lithuania, and a significant decrease in Denmark.
The limitation of the research is contained in the fact that there is no complete geographical comparability of the observed European countries due to mutual differences regarding the representation of wheat in a certain country, but also due to the surface of the country itself. Also, there are many objective factors that can influence the formation of the producer price of wheat, which primarily depends on the level of development of the observed country. In general, it is difficult to draw adequate conclusions in the social sciences because there are many influences that can appear as causes of change, and not all of them can be included and analyzed. If we have in mind and awareness that the results of science should be applicable for practical purposes, then we believe that the results of our research can help align the CAP measures of the countries that are in the pre-accession phase with the economic and agro-economic problems of these countries in the post-COVID period.
4. Conclusions
Through the conducted research, we came to the following conclusions:
- the observed variables enabled the application of the PCA method;
- positive correlation of the observed variables in the analyzed time period on the example of European countries exists only between the yield and the share of the harvested area under wheat in the total land area (0.291), while other correlations have negative values;
- reducing selected indicators of wheat from three to two components (yield and producer price) we are explained total variability;
- PCA analysis is useful for describing changes in observed selected indicators of wheat.
Through research, we observed that in 80% of the observed European countries, during the pandemic, a higher yield of wheat was achieved than before the COVID-19 pandemic. In terms of producer prices, a sharp increase in the period during the pandemic compared to the period before the pandemic was recorded in Italy, and Switzerland and Norway had the highest values of producer prices in both time periods. If we look at the share of the area under wheat in the total land area during the pandemic in relation to the time period before the pandemic, we can see that this share has decreased in 70% of the analyzed European countries.
Such research can be a good starting point for the analysis of agricultural production during and during crisis situations, in this case a pandemic. The application of the PCA method proved to be an effective method for the analysis of selected indicators within the agrarian, economic and social components. We can conclude that the conducted research has certain limitations, and bearing in mind other indicators that were not analyzed: the value of wheat produced in the country; the value of wheat imports; the value of wheat exports; consumer prices etc. Future research could also include these parameters of wheat, because they can significantly influence the distribution of countries in Europe and the world.
The recommendations for the creators of economic and agrarian policies of the observed European countries are that they should adapt as much as possible to the CAP measures implemented by the EU, that all participants whose activities are related to the manipulation of wheat should be networked, as well as that smaller agricultural producers are provided with constant incentive (financial) support.
Author Contributions
Conceptualization, B.G.V and I.M.; methodology, B.G.V and I.M.; software, B.G.V.; validation, B.G.V., I.M. and N.Ć.; formal analysis, B.G.V.; investigation, B.G.V.; resources, B.G.V.; data curation, B.G.V.; writing—original draft preparation, B.G.V.; writing—review and editing, B.G.V., I.M. and N.Ć.; visualization, B.G.V.; supervision, B.G.V. All authors have read and agreed to the published version of the manuscript.
Funding
This research received no external funding.
Institutional Review Board Statement
Not applicable.
Informed Consent Statement
Not applicable.
Data Availability Statement
The data presented in this study are available on request from the corresponding author.
Acknowledgements
Article as research is supported by the Ministry of Science, Technological Development and Innovation of the Republic of Serbia no. 451-03-66/2024-03/200009 from 05.02.2024, no. 451-03-66/2024-03/200054, and result on project no. U 01/2023 Green economy in the era of digitization, Faculty of Finance, Banking, and Auditing, Alpha BK University in Belgrade, Serbia.
Conflicts of Interest
The authors declare no conflicts of interest.
References
- Grujić Vučkovski, B.; Simonović, Z.; Ćurčić, N.; Miletić, V. The role of agriculture in the economic structure of Serbia and budget support for rural development of Kladovo municipality. Economic of Agriculture 2022, No. 3/2022, 863–876. [Google Scholar] [CrossRef]
- Tadesse, W.; Sanchez-Garcia, M.; Assefa, S. G.; Amri, A.; Bishaw, Z.; Ogbonnaya, F. C.; Baum, M. Genetic gains in wheat breeding and its role in feeding the world. Crop Breeding, Genetics and Genomics. 2019, 1, 1–28. [Google Scholar]
- Teodor, C.; Bran, M.; STRAT, V. A. X. The influence of land structure on performance of wheat production. The case of the Romanian counties-challenging the changes. Economic Computation & Economic Cybernetics Studies & Research 2018, 52, 59–76. [Google Scholar]
- Ali, Y.; Khan, M. A.; Hussain, M.; Atiq, M.; Ahmad, J. N. X. An assessment of the genetic diversity in selected wheat lines using molecular markers and PCA-based cluster analysis. Applied Ecology & Environmental Research 2019, 17, 931–950. [Google Scholar]
- Grujić, B.; Kljajić, N. The significance of creating a network diagram (CPM method) in the production of wheat, Thematic proceedings “Sustainble agriculture and rural development in terms of the Republic of Serbia strategic goals realization within the Danube region” – preservation of rural values, Institute of Agricultural Economics, Belgrade, Serbia, 2012, pp. 1061–1076.
- Tudor, V. C.; Stoicea, P.; Chiurciu, I. A.; Soare, E.; Iorga, A. M.; Dinu, T. A.;... & Dumitru, E. A. The Use of Fertilizers and Pesticides in Wheat Production in the Main European Countries. Sustainability 2023, 15, 3038. [CrossRef]
- D’Odorico, P.; Carr, J.; Laio, F.; Ridolfi, L.; Vandoni, S. Feeding humanity through global food trade. Earth’s Future 2014, 2, 458–469. [Google Scholar] [CrossRef]
- Gutiérrez-Moya, E.; Adenso-Díaz, B.; Lozano, S. Analysis and vulnerability of the international wheat trade network. Food security 2021, 13, 113–128. [Google Scholar] [CrossRef] [PubMed]
- Grujić, B.; Vuković, P. Agrarian policy in the European Union and financial support to Serbia, Proceedings of the International Scientific Conference “The Common Agricultural Policy of the European Union – the present and the future”, 5-7 December 2017, Stare Jabłonki, Poland, Institute of agricultural and food economics – National research institute, Warsaw, Poland, 2018, pp. 38–55.
- Ziegler, C.; Fiegenbaum, T. D. P.; Ueda, R. M.; Lirio, V. W.; Souza, A. M. Estimation of cropland prices in Rio Grande do Sul by multiple linear regression and principal component analysis. Ciência Rural 2023, 53, e20210436. [Google Scholar] [CrossRef]
- Silveira, V. C. P.; González, J. A.; Fonseca, E. L. D. Land use changes after the period commodities rising price in the Rio Grande do Sul State, Brazil. Ciência Rural 2017, 47, e20160647. [Google Scholar] [CrossRef]
- Grujić, B.; Joksimović, M. Cooperation of the National Bank of Serbia (NBS) with International Funds and European Countries, chapter 3 in the book - Serbia: Current Political, Economic and Social Issues and Challenges, Nova Publisher, 2019, pp. 43–61.
- Popović, V.; Grujić, B. Agricultural subsidies in the budget of the Republic of Serbia, Economics of Agriculture, 2015, No 2/2015, pp. 513-525. [CrossRef]
- Dončić, D.; Popović, V.; Lakić, Ž.; Popović, D.; Petković, Z. Economic analysis of wheat production and applied marketing management. in Agriculture & Forestry, University of Montenegro. 2019, 65, 91–100. [Google Scholar] [CrossRef]
- Brbaklić, L. S. Molecular and association analysis of spike-related traits in wheat (Triticum aestivum L.), 2015, Doctoral dissertation, Faculty of biology, University of Belgrade.
- Jovović, Z.; Mandić, D.; Pržulj, N.; Velimirović, A.; Dolijanović, Ž. Genetic Resources of Wheat (Triticum Sp.) in Montenegro. in 22. Biotechnology consulting with international participation, Čačak, 10-11.03.2017., 2017, https://hdl.handle.net/21.15107/rcub_agrospace_5638.
- Mastrangelo, A. M.; Cattivelli, L. What makes bread and durum wheat different? Trends in Plant Science 2021, 26, 677–684. [Google Scholar] [CrossRef] [PubMed]
- Nahid, N.; Zaib, P.; Shaheen, T.; Shaukat, K.; U. Issayeva, A.; Ansari, M. R. Introductory Chapter: Current Trends in Wheat Research, chapter in a book Current Trends in Wheat Research, 2022, IntechOpen. https://www.intechopen.com/chapters/81199. [CrossRef]
- Hossain, A.; Teixeira da Silva, J.; Phenology, growth and yield of three wheat (Triticum aestivum L.) varieties as affected by high temperature stress. Not. Sci. Biol., 2012, 4 (3), 97–109.
- Mousavi-Baygi, M.; Bannayan, M.; Ashraf, B.; Asadi Oskuei, E. Assessment of climatic indices limiting rainfed wheat yield. Ecological indicators 2016, 62, 298–305. [Google Scholar] [CrossRef]
- Schmidhuber, J.; Mustafa, S.; Qiao, B. The war in Ukraine and the risks it poses for global food commodity markets (FAO report). Food Outlook, June 2022, pp. 65–73.
- Bobriková, M. Price risk management in the wheat market using option strategies. Economic of Agriculture 2021, 68, 449–461. [Google Scholar] [CrossRef]
- FAOSTAT. Land, inputs, and sustainability. Land use https://www.fao.org/faostat/en/#data/RL/visualize (accessed on 19.02. 2023.
- Daglis, T.; Konstantakis, K. N.; Michaelides, P. G. The impact of Covid-19 on agriculture: evidence from oats and wheat markets. Studies in Agricultural Economics 2020, 122, 132–139. [Google Scholar]
- Paraušić, V.; Kolašinac, S.; Muça, E.; Šarić, B. B. Competencies of Western Balkan farmers for participating in short food supply chains: Honey case study. New medit: Mediterranean journal of economics, agriculture and environment 2023, 22, 73–89. [Google Scholar] [CrossRef]
- Fatima, S. U.; Khan, M. A.; Siddiqui, F.; Mahmood, N.; Salman, N.; Alamgir, A.; Shaukat, S. S. Geospatial assessment of water quality using principal components analysis (PCA) and water quality index (WQI) in Basho Valley, Gilgit Baltistan (Northern Areas of Pakistan). Environmental Monitoring and Assessment 2022, 194, 151. [Google Scholar] [CrossRef] [PubMed]
- Marina, I.; Grujić Vučkovski, B.; Jovanović Todorović, M. Distribution of Mechanization by Regions and Areas in the Republic of Serbia (Chapter 6). In Sustainable Growth and Global Social Development in Competitive Economies, IGI Global, 2023, pp. 97–121.
- Paul, L. C.; Suman, A. A.; Sultan, N. Methodological analysis of principal component analysis (PCA) method. International Journal of Computational Engineering & Management 2013, 16, 32–38. [Google Scholar]
- Jafarzadegan, M.; Safi-Esfahani, F.; Beheshti, Z. Combining hierarchical clustering approaches using the PCA method. Expert Systems with Applications 2019, 137, 1–10. [Google Scholar] [CrossRef]
- Li, T.; Zhang, H.; Yuan, C.; Liu, Z.; Fan, C. A PCA-based method for construction of composite sustainability indicators. The International Journal of Life Cycle Assessment 2012, 17, 593–603. [Google Scholar] [CrossRef]
- Garcia, D. P.; Caraschi, J. C.; Ventorim, G.; Vieira, F. H. A.; de Paula Protásio, T. Assessment of plant biomass for pellet production using multivariate statistics (PCA and HCA). Renewable Energy 2019, 139, 796–805. [Google Scholar] [CrossRef]
- Al-Dahidi, S.; Alrbai, M.; Al-Ghussain, L.; Alahmer, A.; Hayajneh, H. S. Data-driven analysis and prediction of wastewater treatment plant performance: Insights and forecasting for sustainable operations. Bioresource Technology 2024, 391, 129937. [Google Scholar] [CrossRef]
- Mahmoudi, R.; Emrouznejad, A.; Khosroshahi, H.; Khashei, M.; Rajabi, P. Performance evaluation of thermal power plants considering CO2 emission: A multistage PCA, clustering, game theory and data envelopment analysis. Journal of cleaner production 2019, 223, 641–650. [Google Scholar] [CrossRef]
- Abdi, H.; Williams, J. L. Computational statistics: Principal component analysis. Wiley Interdisciplinary Reviews Computational Statistics 2010, 2, 433–459. [Google Scholar] [CrossRef]
- Yuan, R.; Zheng, T.; Zheng, X.; Liu, D.; Xin, J.; Yu, L.; Liu, G. Identification of groundwater nitrate pollution sources in agricultural area using PCA and SIAR methods. Episodes Journal of International Geoscience 2020, 43, 739–749. [Google Scholar] [CrossRef]
- Lee, J.Y.; Kwon, K.D.; Park, Y.C.; Jeon, W.H. Unexpected nationwide nitrate decline in groundwater of Korea. Hydrological Processes 2017, 4693–4704. [Google Scholar] [CrossRef]
- Wang, L.Y.; Zheng, X.L.; Tian, F.F.; Xin, J.; Nei, H. Soluble organic nitrogen cycling in soils after application of chemical/organic amendments and groundwater pollution implications. Journal of Contaminant Hydrology 2018, 43–51. [Google Scholar] [CrossRef] [PubMed]
- Farshadfar, E.; Elyasi, P. Screening quantitative indicators of drought tolerance in bread wheat (Triticum aestivum L.) landraces. European Journal of Experimental Biology 2012, 2, 577–584. [Google Scholar]
- Bodroža-Solarov, M.; Kljajić, P.; Andrić, G.; Filipčev, B.; Šimurina, O.; Pražić Golić, M.; Adamović, M. Application of principal component analysis in assessment of relation between the parameters of technological quality of wheat grains treated with inert dusts against rice weevil (Sitophilus oryzae L. ). Pestic. Phytomed 2011, 26, 385–391. [Google Scholar] [CrossRef]
- Wen, P.; Meng, Y.; Gao, C.; Guan, X.; Wang, T.; Feng, W. Field identification of drought tolerant wheat genotypes using canopy vegetation indices instead of plant physiological and biochemical traits. Ecological Indicators 2023, 154, 110781. [Google Scholar] [CrossRef]
- Carucci, F.; Gatta, G.; Gagliardi, A.; Bregaglio, S.; Giuliani, M. M. Individuation of the best agronomic practices for organic durum wheat cultivation in the Mediterranean environment: a multivariate approach. Agriculture & Food Security 2023, 12, 1–11. [Google Scholar]
Figure 1.
AARC of yield, producer price and share of the harvested area under wheat in the total land area by observed european countries, 2006-2021 (in %).
Figure 1.
AARC of yield, producer price and share of the harvested area under wheat in the total land area by observed european countries, 2006-2021 (in %).
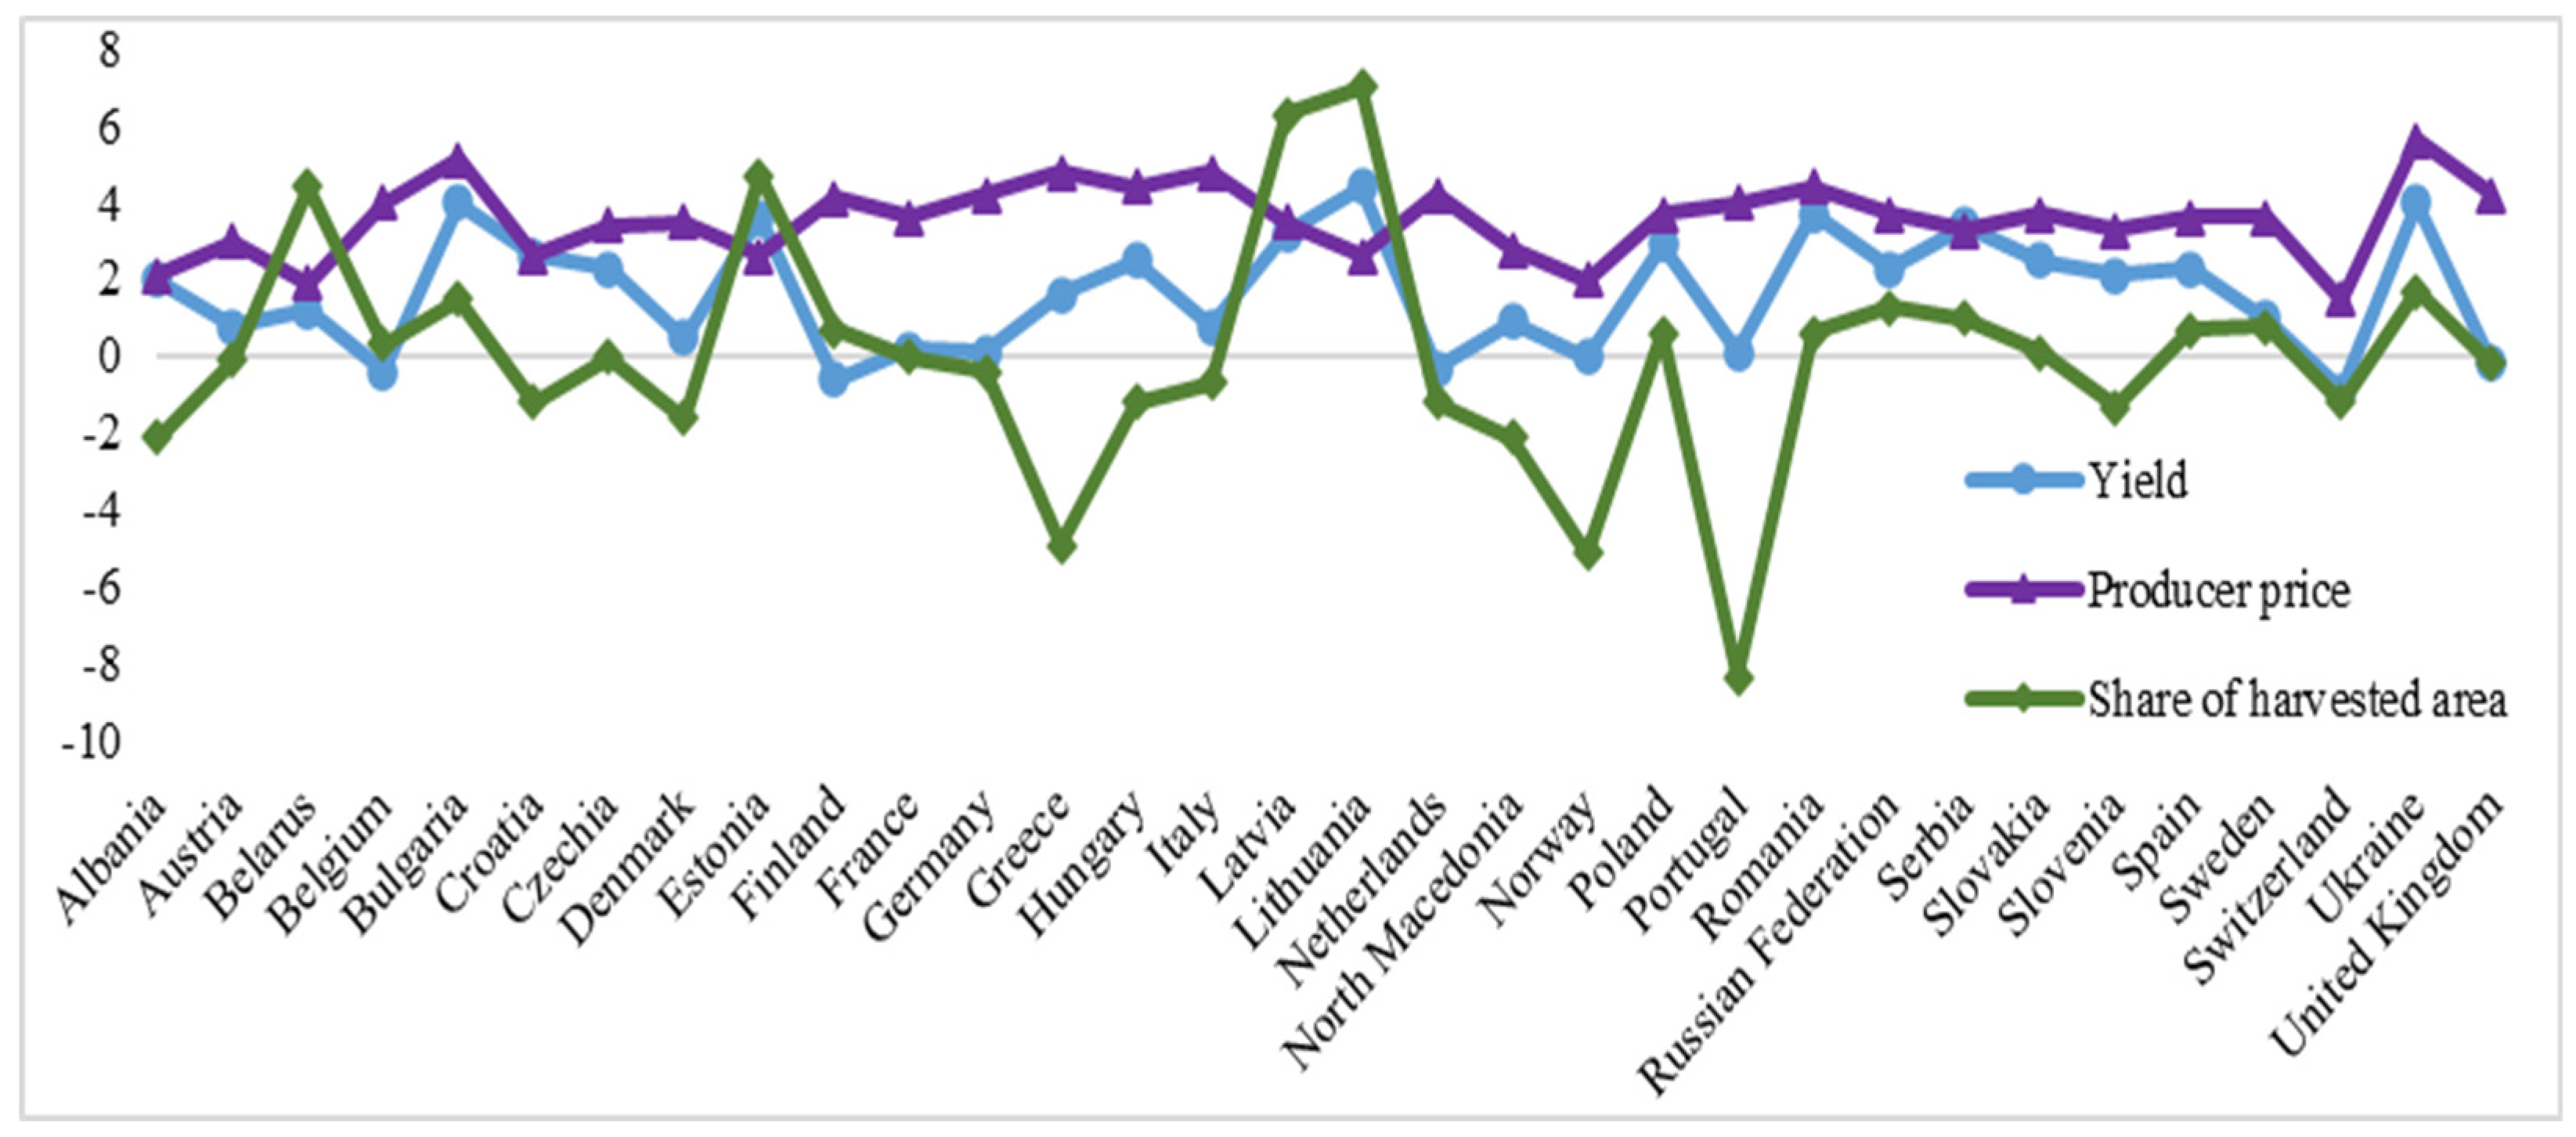
Figure 2.
Loading plot of observed variables.
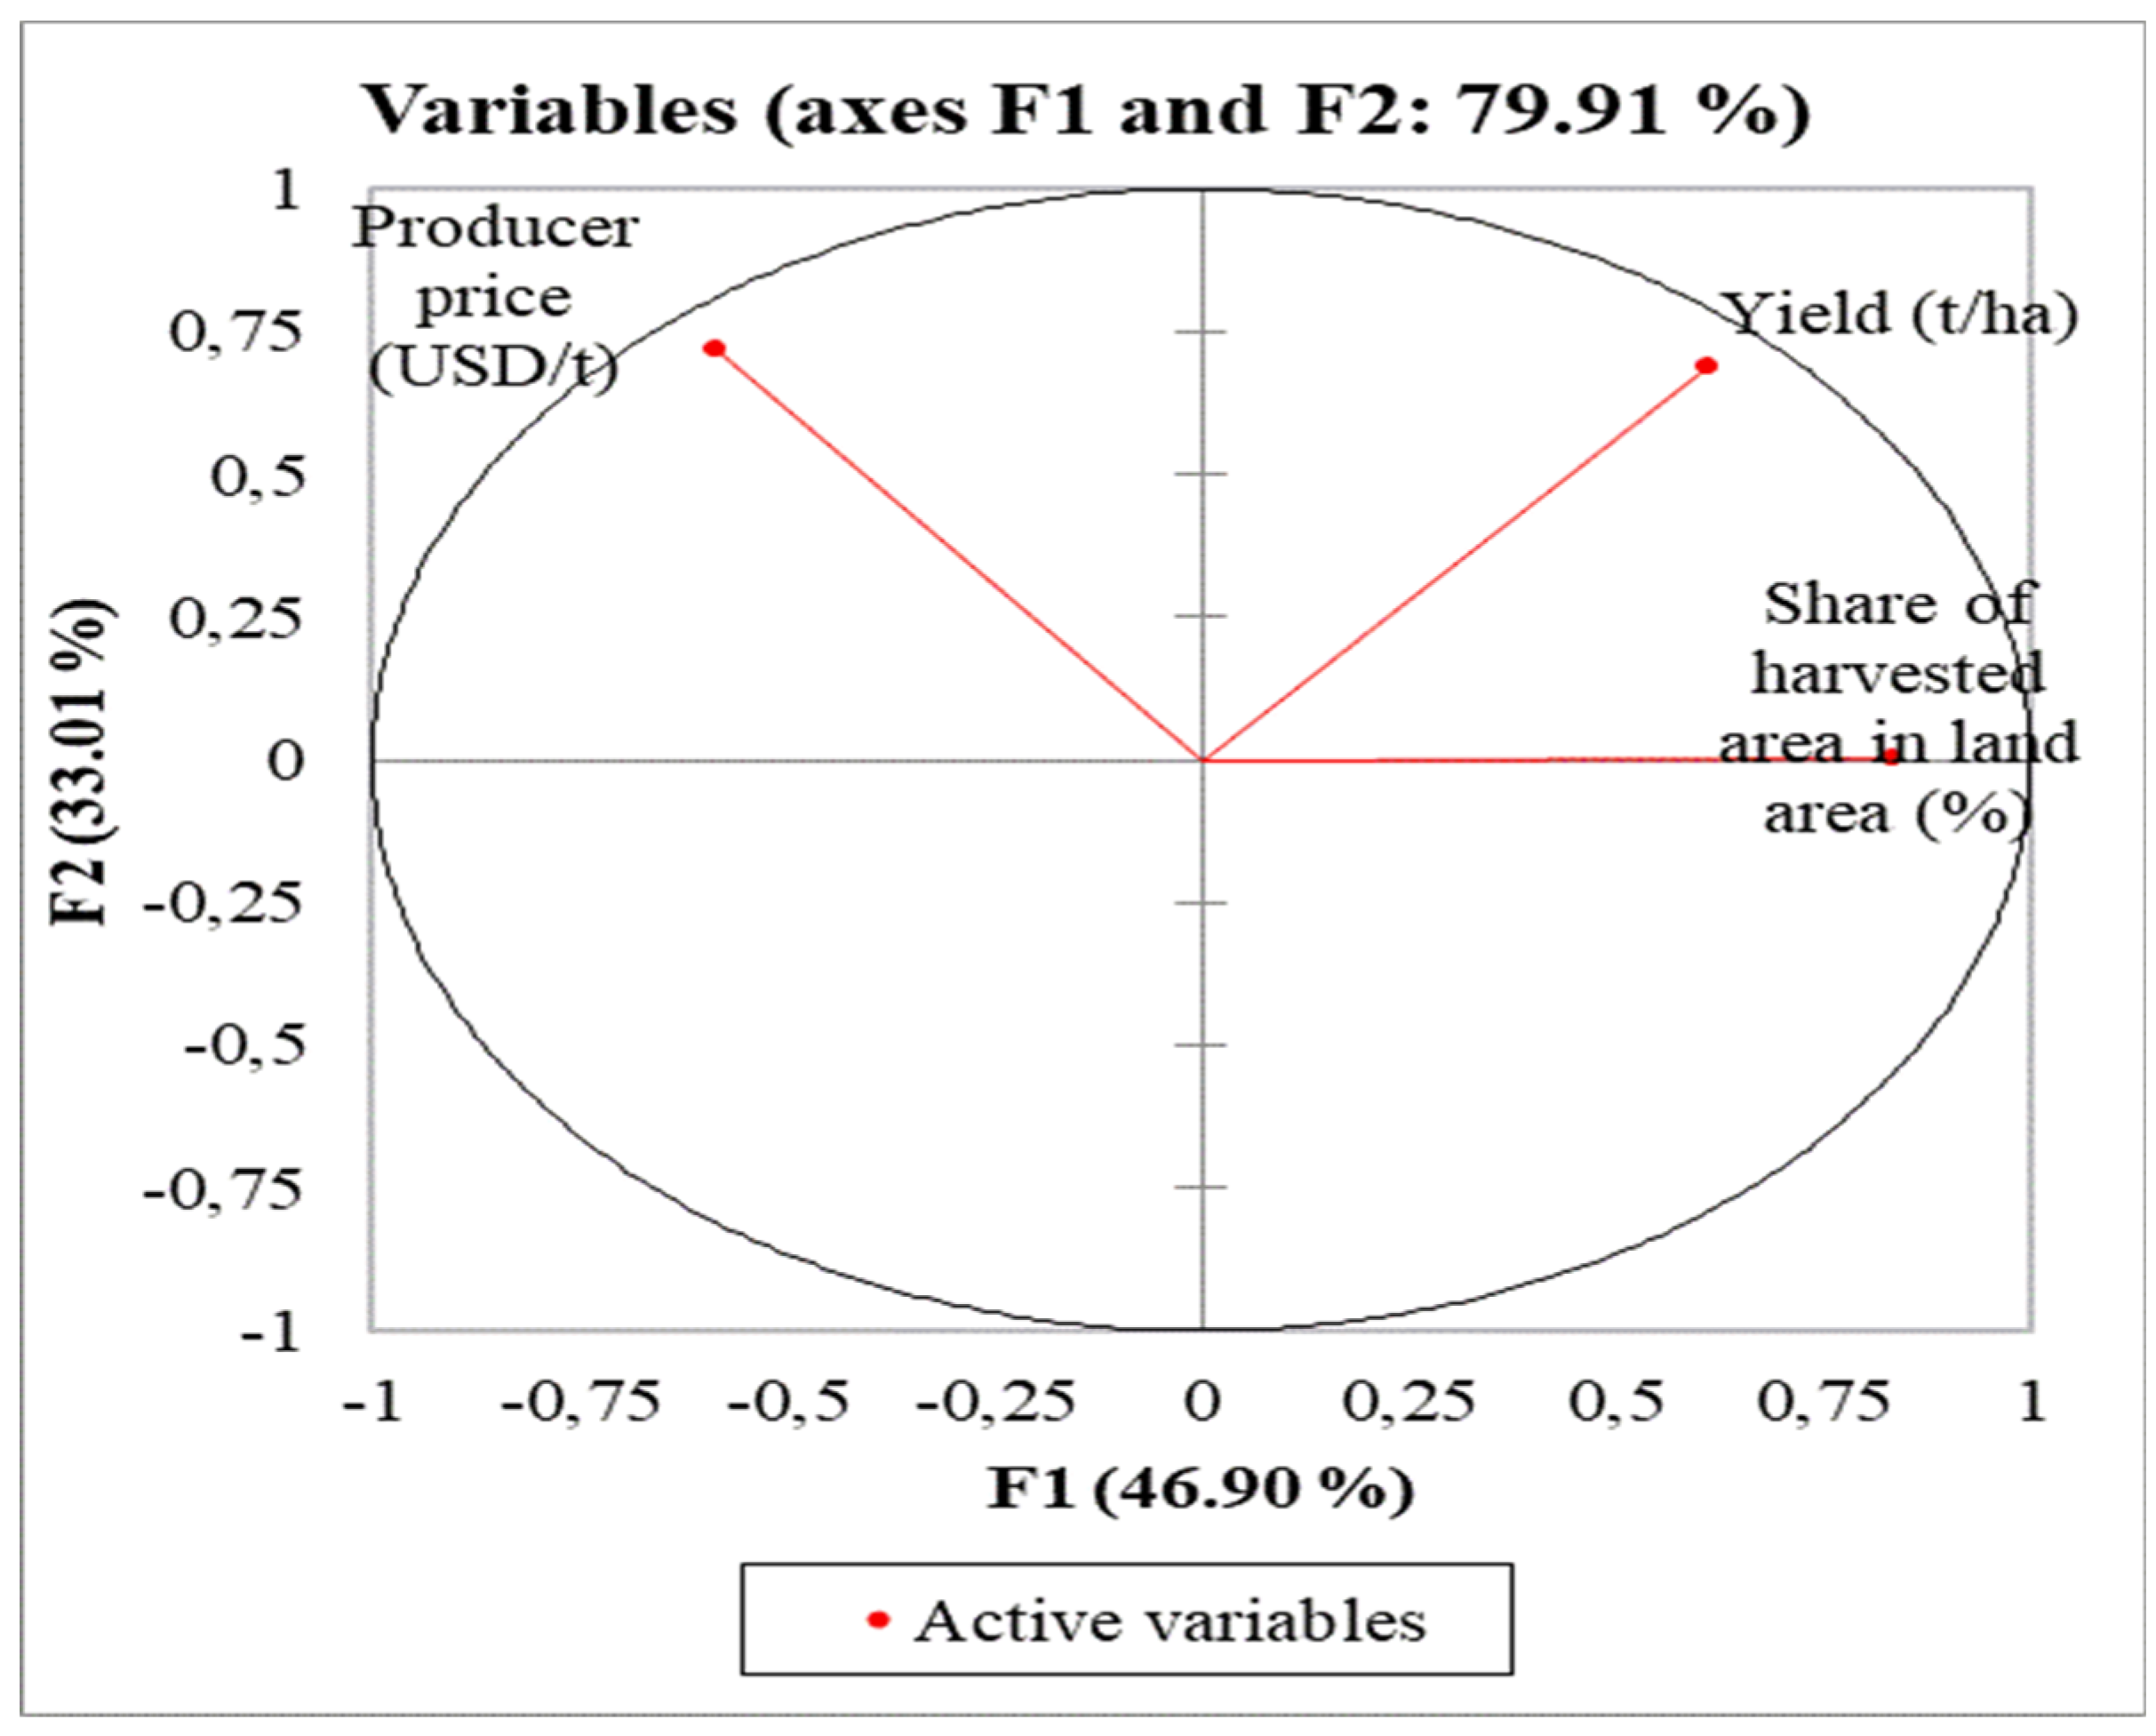
Figure 3.
Biplot of observed variables in analized period (first sixteen European countries).
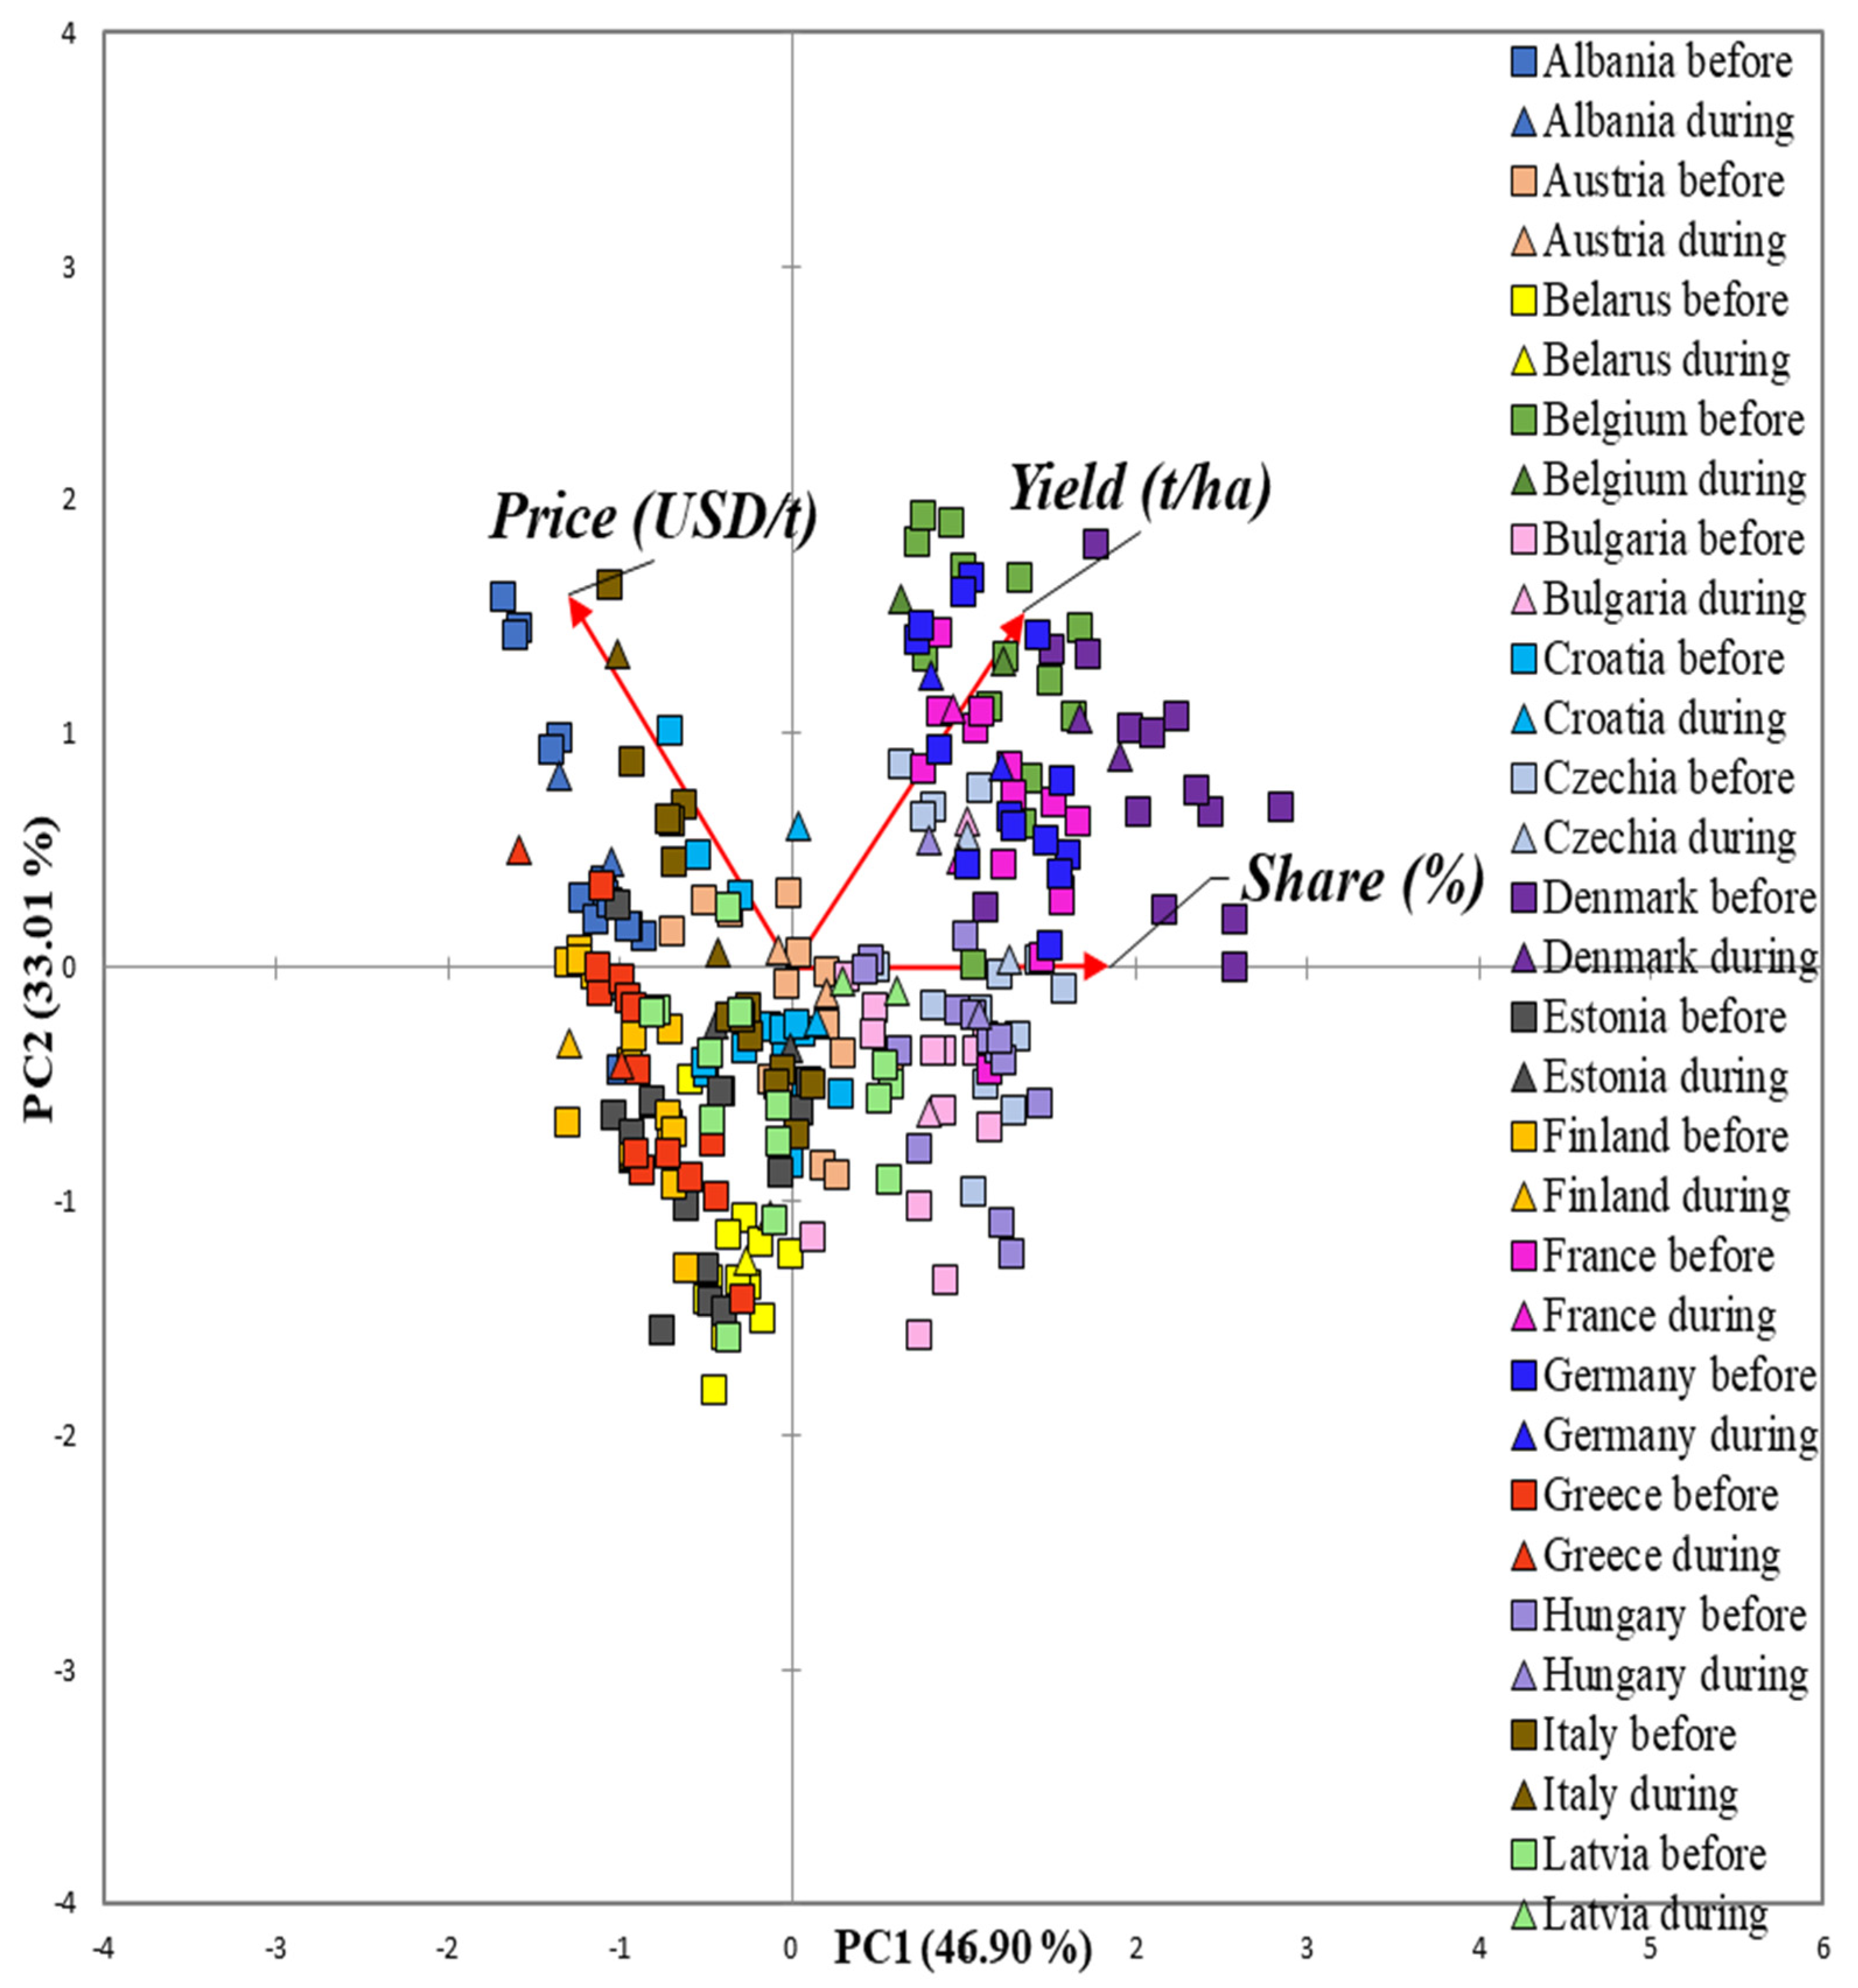
Figure 4.
Biplot of observed variables in analized period (second sixteen European countries).
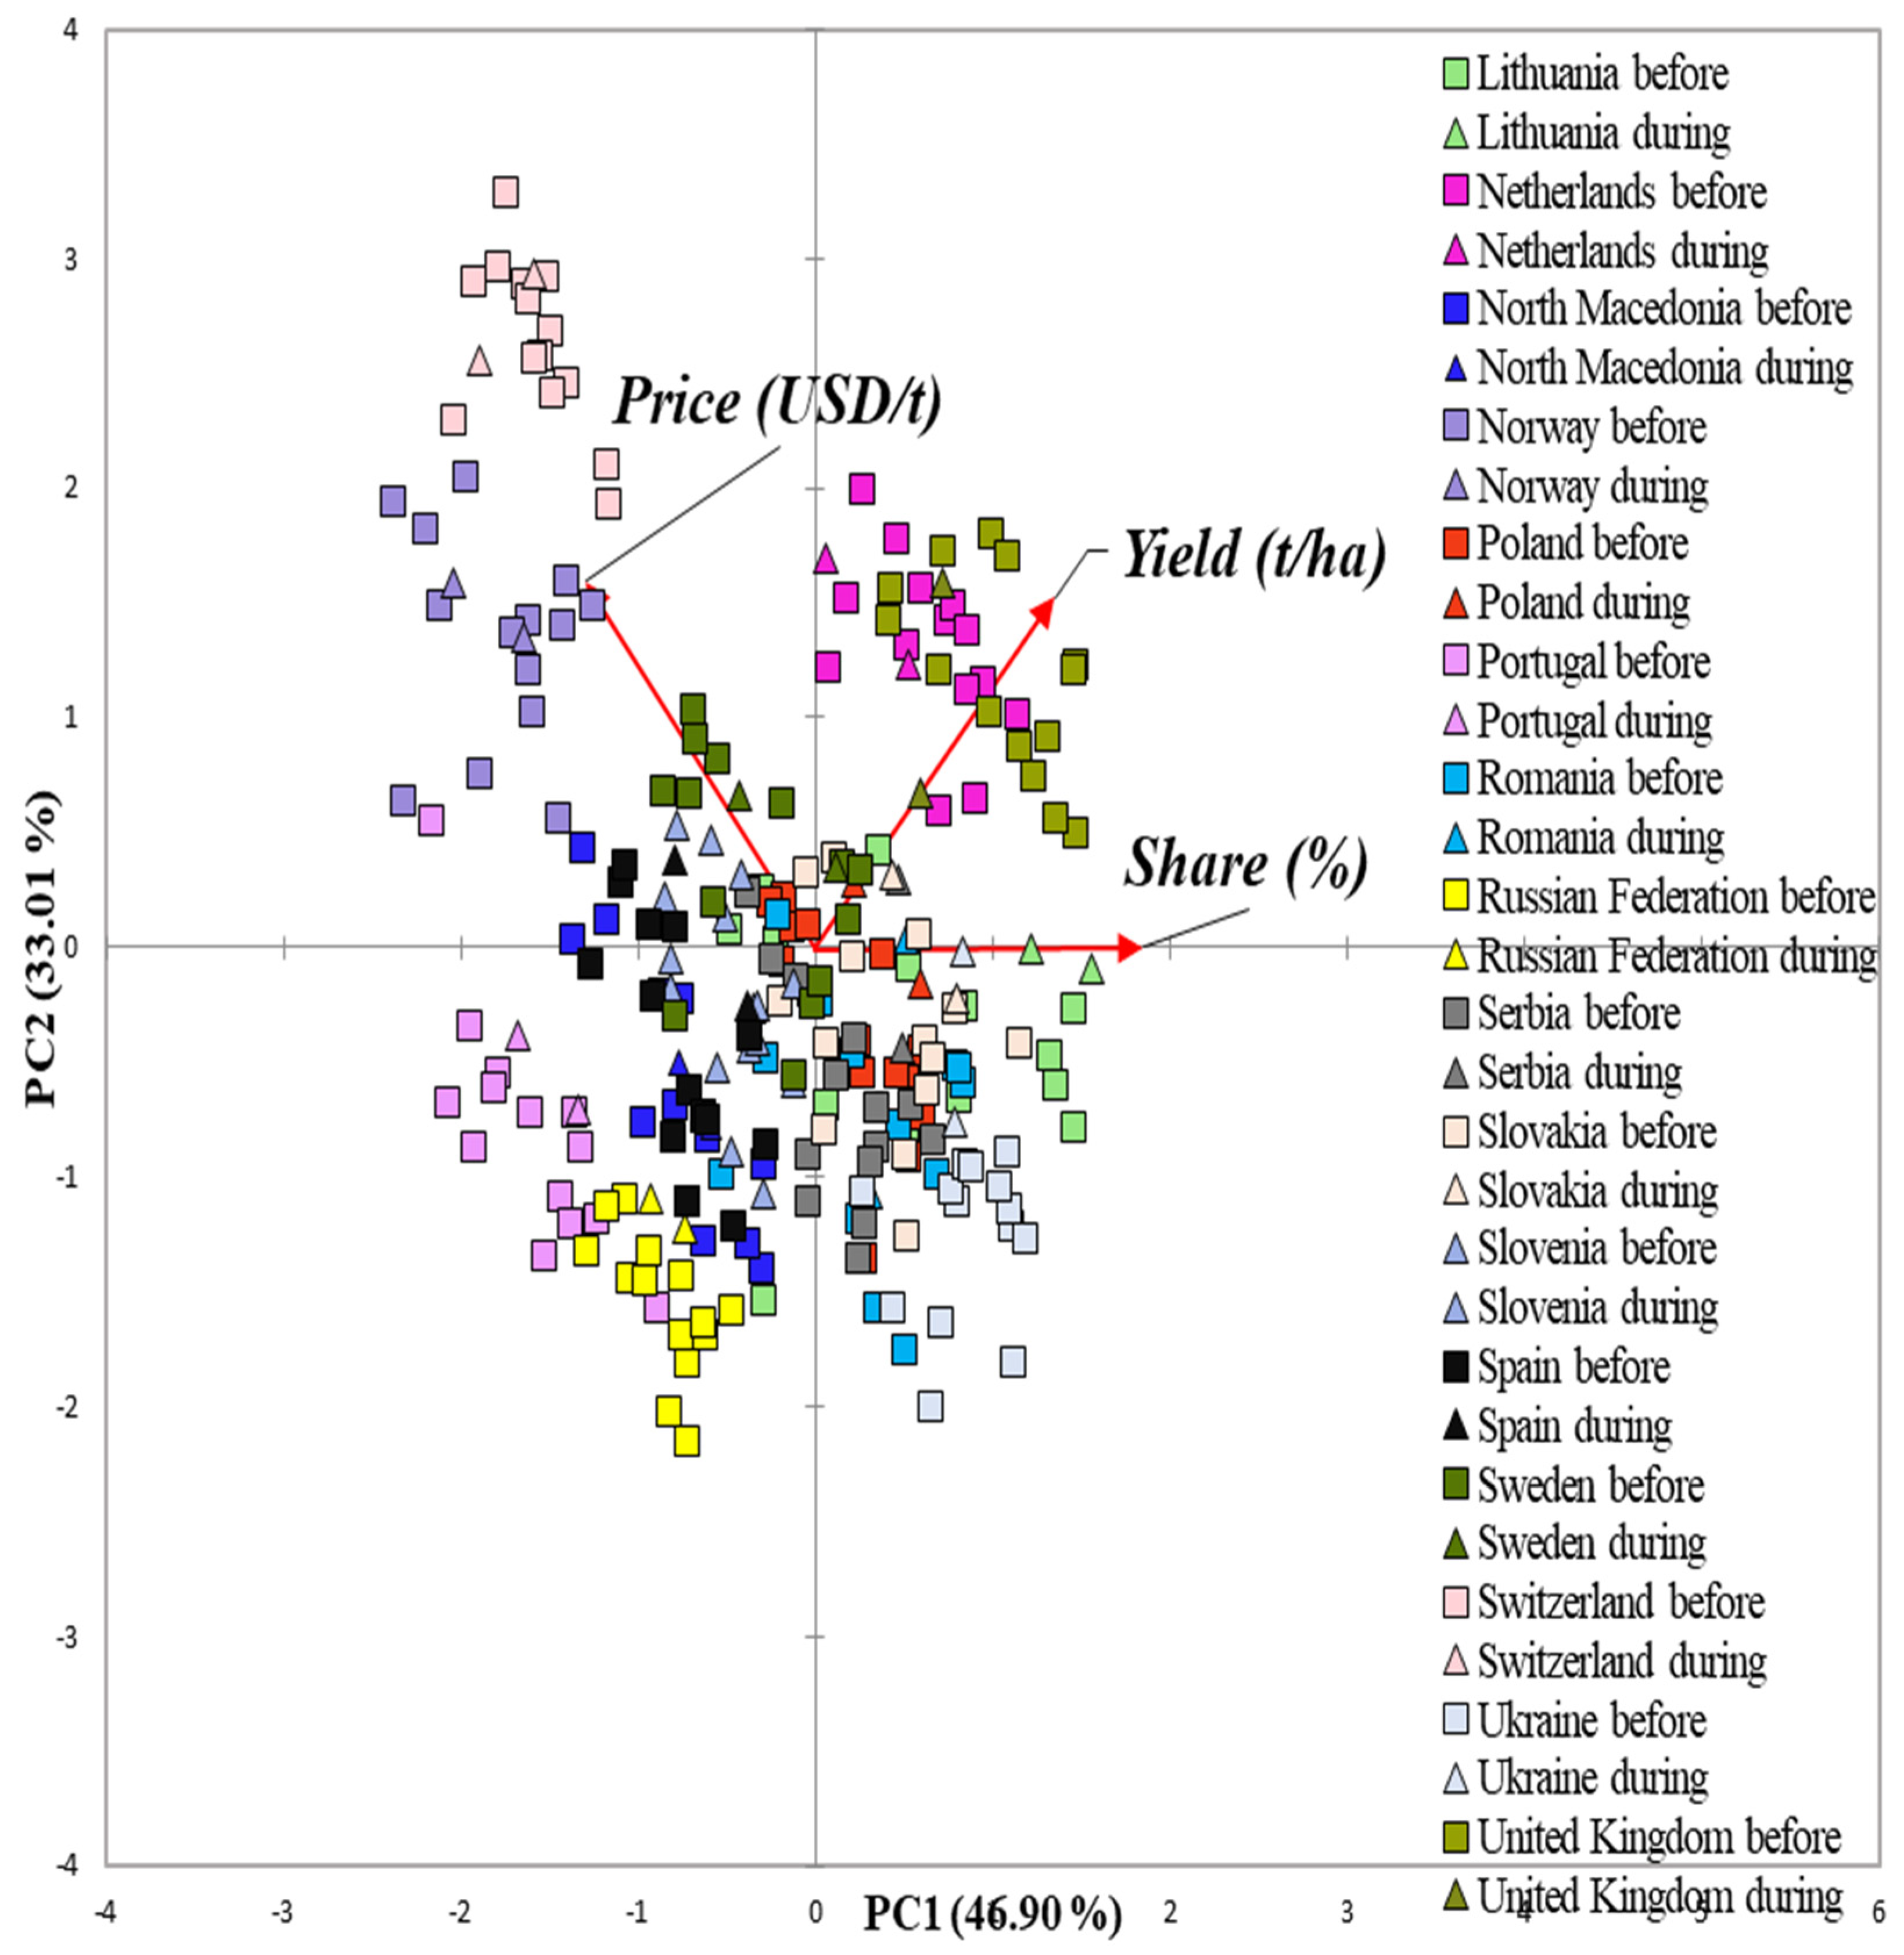
Figure 5.
Changes in yield of wheat according to European countries in the years before and during the COVID-19 pandemic (2006-2021).
Figure 5.
Changes in yield of wheat according to European countries in the years before and during the COVID-19 pandemic (2006-2021).

Figure 6.
Changes in producer price of wheat according to European countries in the years before and during the COVID-19 pandemic (2006-2021).
Figure 6.
Changes in producer price of wheat according to European countries in the years before and during the COVID-19 pandemic (2006-2021).
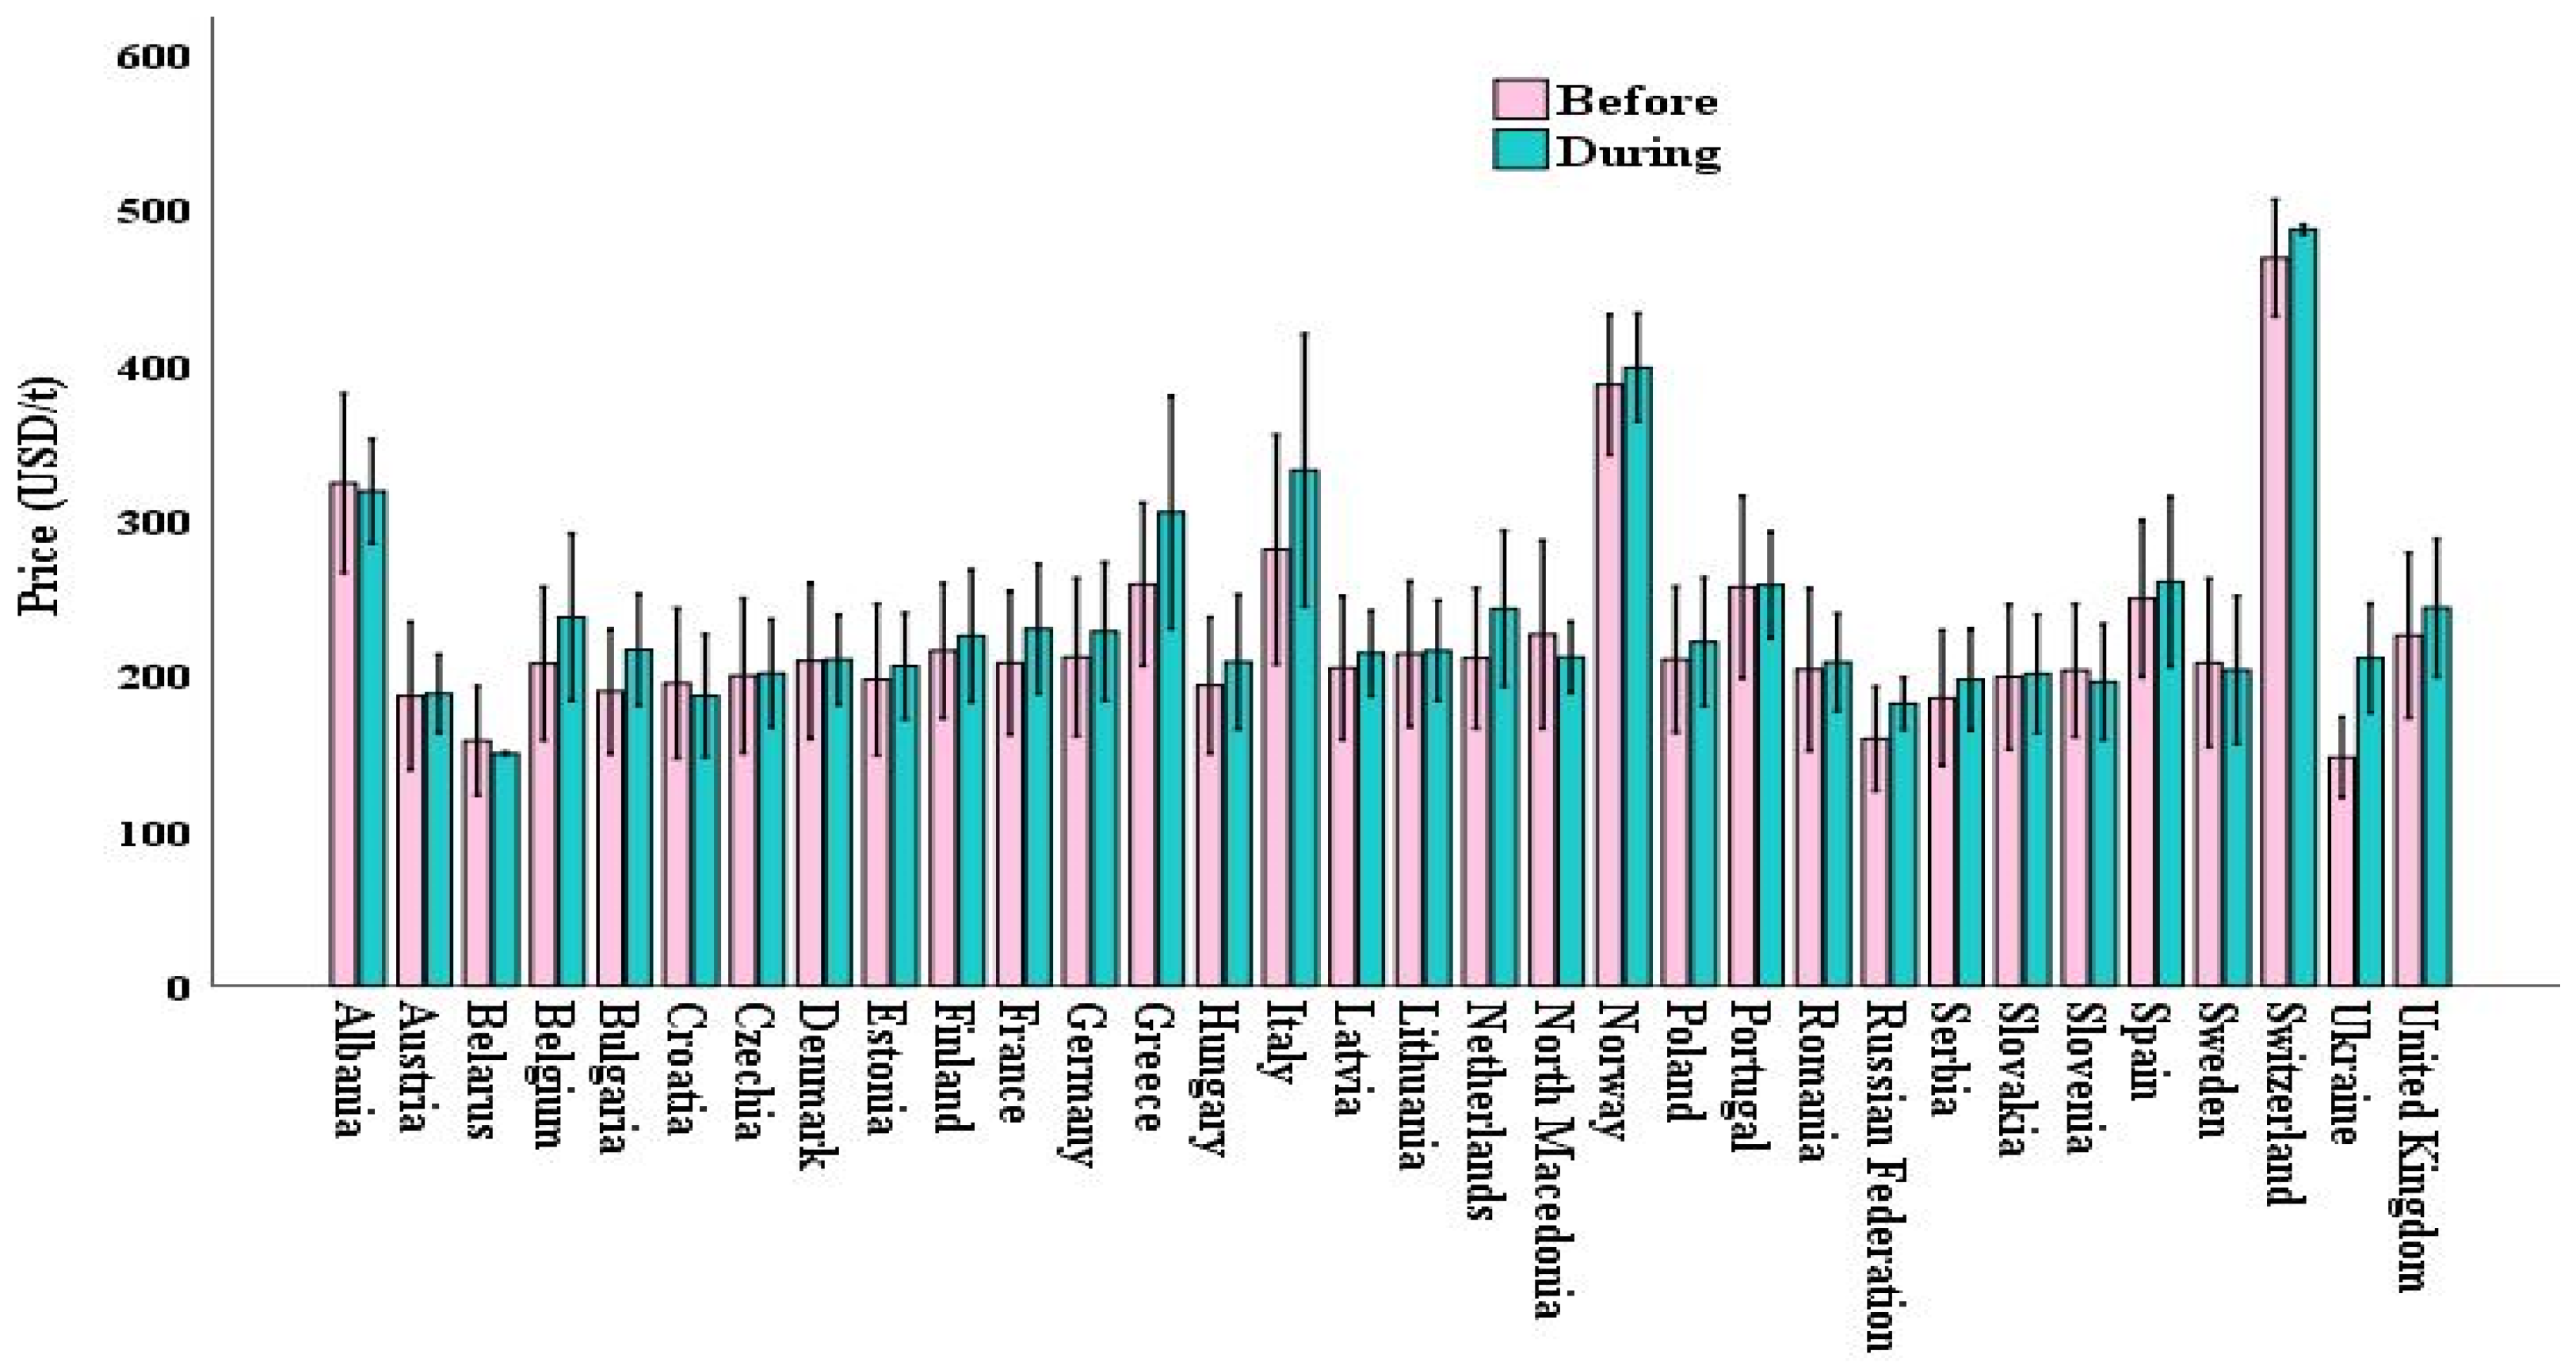
Figure 7.
Changes in share of the harvested area under wheat in the total area of the country according to European countries in the years before and during the COVID-19 pandemic (2006-2021).
Figure 7.
Changes in share of the harvested area under wheat in the total area of the country according to European countries in the years before and during the COVID-19 pandemic (2006-2021).
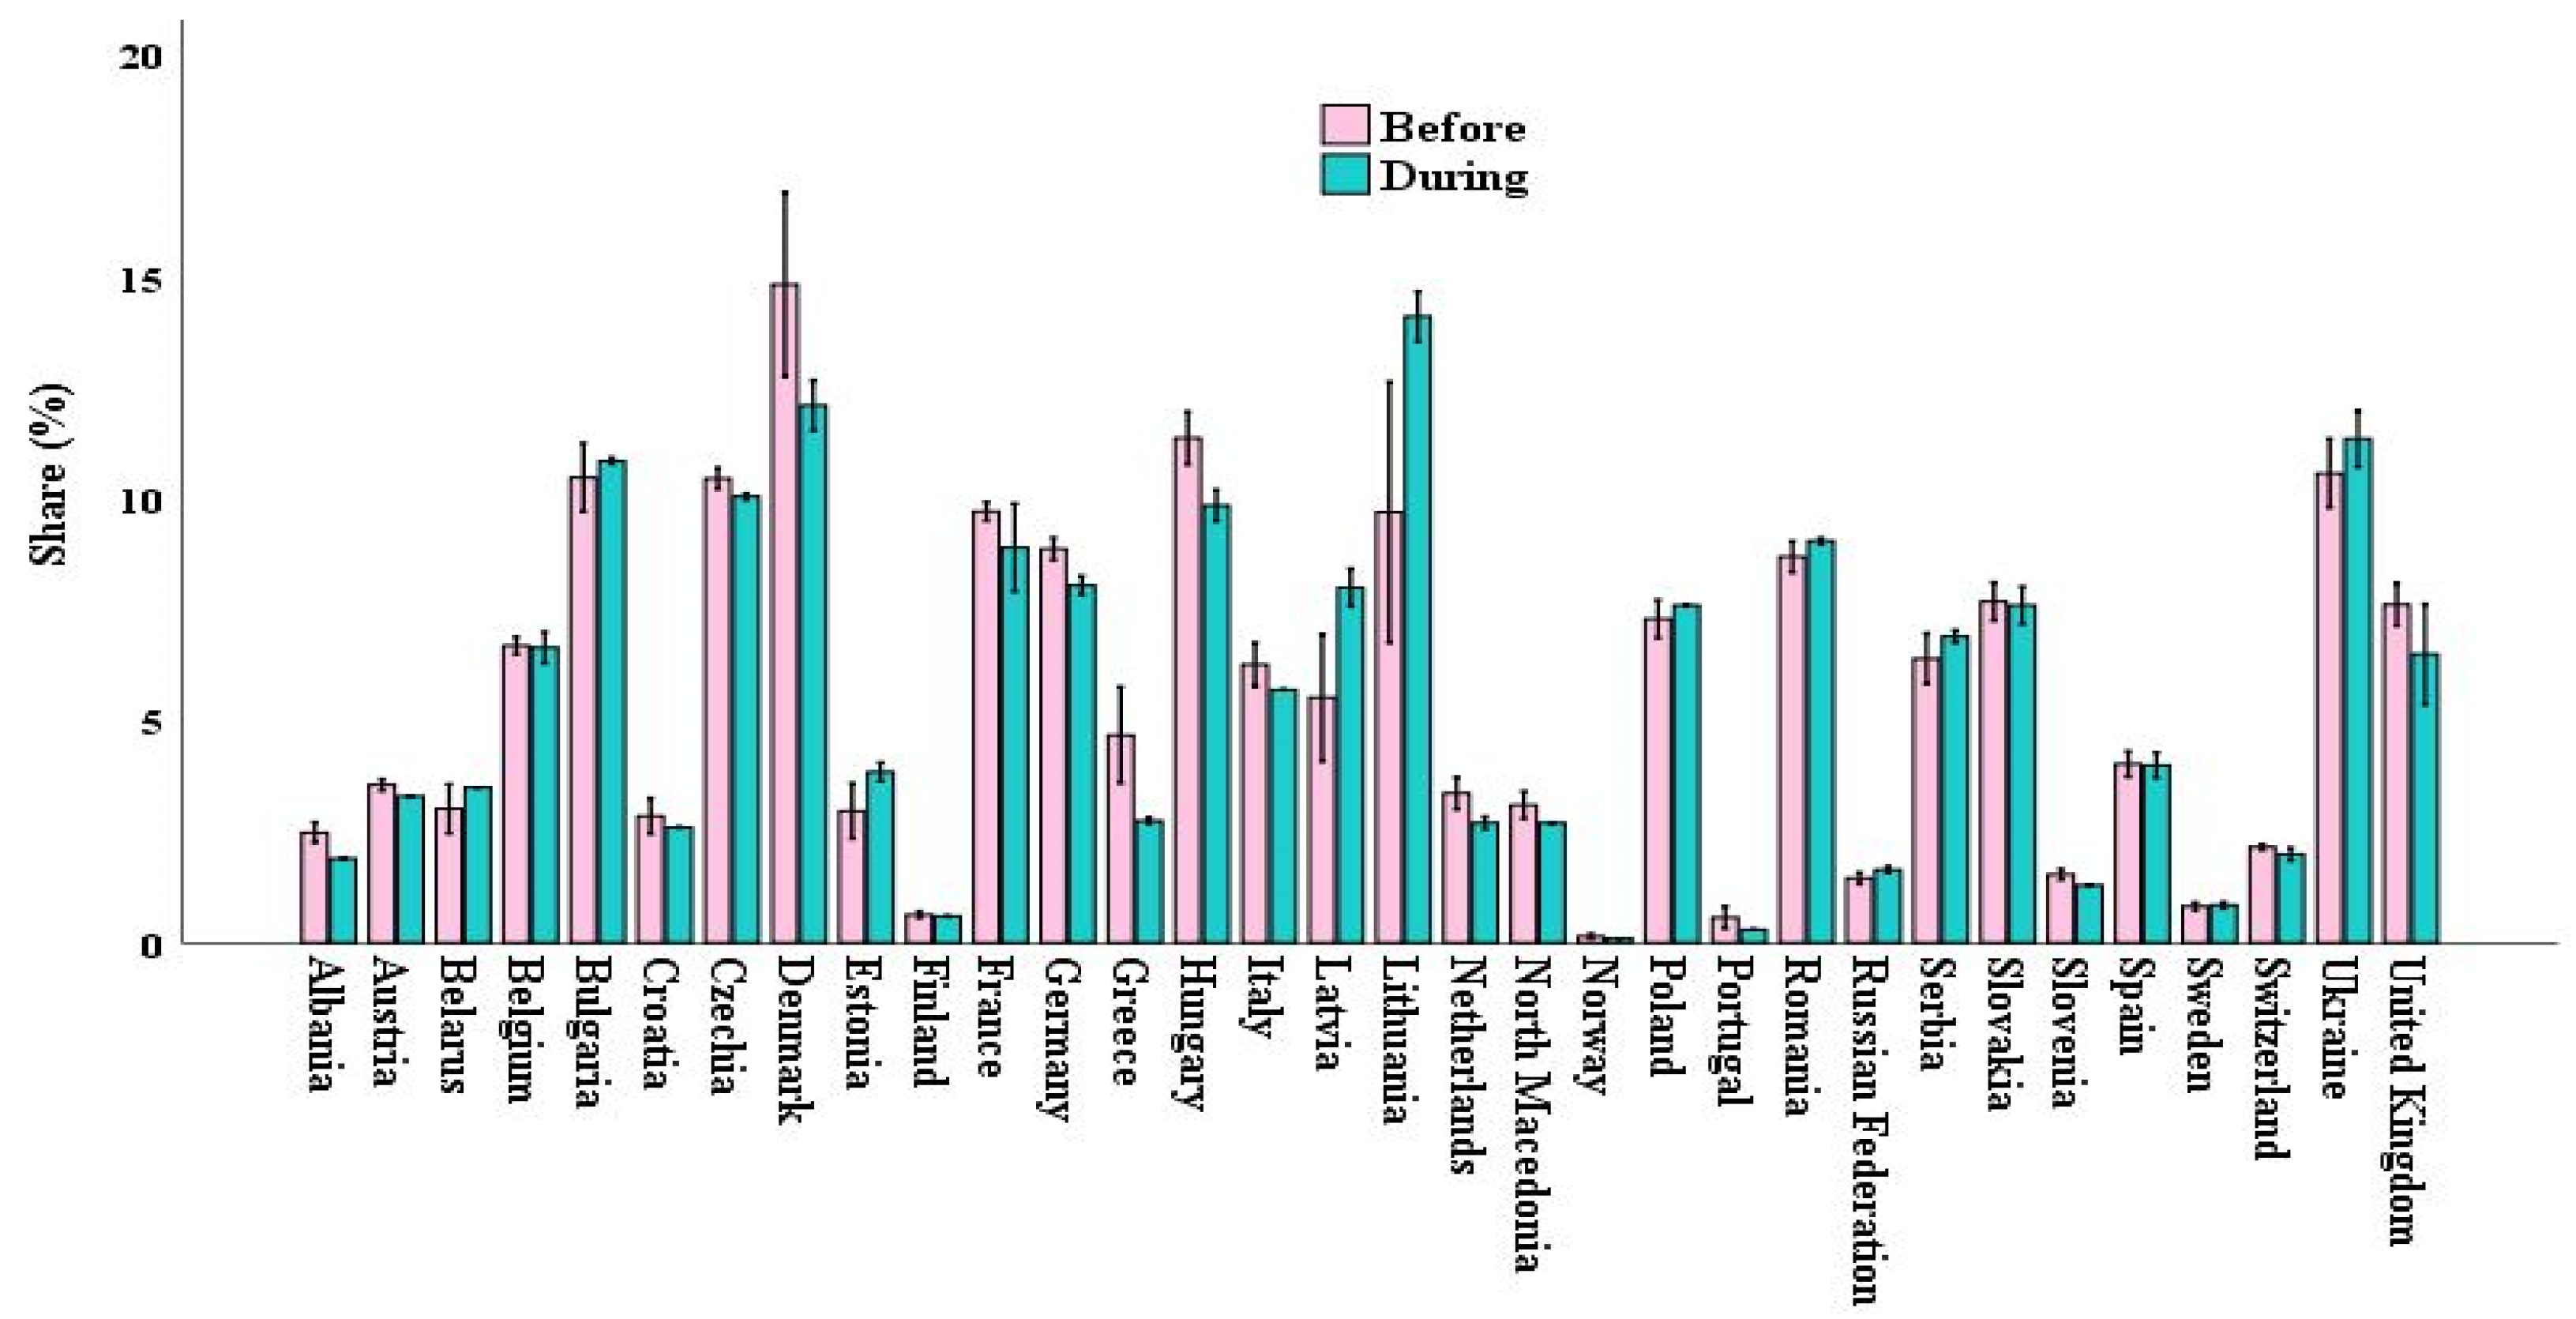

Table 1.
Characteristics of the observed sample.
| Data sources | In addition to the FAOSTAT Database, relevant scientific and professional literature that is in line with the researched topic was also used. |
| Study area | European countries |
| Countries | Albania, Austria, Belarus, Belgium, Bulgaria, Croatia, Czechia, Denmark, Estonia, Finland, France, Germany, Greece, Hungary, Italy, Latvia, Lithuania, Netherlands, North Macedonia, Norway, Poland, Portugal, Romania, Russian Federation, Serbia, Slovakia, Slovenia, Spain, Sweden, Switzerland, Ukraine, and United Kingdom. |
| Time period | 2006-2021 |
| Frequency of collected empirical databases | Annualy |
| Time series | I phase from 2006 to 2019 – before pandemic COVID-19; II phase from 2020 to 2021 – during pandemic COVID-19; |
| Analyzed sectors | 1) Production - Crops primary; 2) Prices - Producer prices; 3) Land, Inputs and Sustainability – Land use. |
| Variables | 1) Yield of wheat (https://www.fao.org/faostat/en/#data/QCL); 2) Producer prices (https://www.fao.org/faostat/en/#data/PP); 3) Share of the area under wheat in relation to the total area of the land (https://www.fao.org/faostat/en/#data/RL/visualize) |
| Unit of measures for variables | 1) Yield of wheat is expressed in t/ha; 2) Producer price is expressed in USD/t; 3) Share of the area under wheat in relation to the total area of the land is expressed in %. |
| Implemented method | Descriptive statistic and Principal component analysis (abbr. PCA) |
| Output indicators | 1) Values of correlation matrix; 2) Values of descriptive statistics; 3) Loading plot; 4) Biplot; 5) Histogram. |
| Used software package | SPSS and XLSTAT |
| Comment | Not all European countries were included in the research, which can be explained by the fact that there is no published data for the analyzed time series according to the given variables. |
Table 2.
Descriptive statistics.
| Mean | Std. Deviation | |
|---|---|---|
| Yield (t/ha) | 4.821 | 1.8380 |
| Producer price (USD/t) | 226.316 | 78.0235 |
| Share of harvested area (%) | 5.603 | 3.8556 |
Table 3.
Correlation matrix of observed variables.
| Yield (t/ha) | Producer_Price (USD/t) | Harvested_area (%) | ||
|---|---|---|---|---|
| Correlation | Yield (t/ha) | 1.000 | -.010 | .291 |
| Producer price (USD/t) | -.010 | 1.000 | -.278 | |
| Share of harvested area (%) | .291 | -.278 | 1.000 | |
Table 4.
Total Variance Explained by variables.
| Component | Initial Eigenvalues | Extraction Sums of Squared Loadings | ||||
|---|---|---|---|---|---|---|
| Total | % of Variance | Cumulative % | Total | % of Variance | Cumulative % | |
| 1 | 1.407 | 46.912 | 46.912 | 1.407 | 46.912 | 46.912 |
| 2 | .990 | 33.012 | 79.924 | .990 | 33.012 | 79.924 |
| 3 | .602 | 20.076 | 100.000 | |||
Disclaimer/Publisher’s Note: The statements, opinions and data contained in all publications are solely those of the individual author(s) and contributor(s) and not of MDPI and/or the editor(s). MDPI and/or the editor(s) disclaim responsibility for any injury to people or property resulting from any ideas, methods, instructions or products referred to in the content. |
© 2024 by the authors. Licensee MDPI, Basel, Switzerland. This article is an open access article distributed under the terms and conditions of the Creative Commons Attribution (CC BY) license (http://creativecommons.org/licenses/by/4.0/).
Copyright: This open access article is published under a Creative Commons CC BY 4.0 license, which permit the free download, distribution, and reuse, provided that the author and preprint are cited in any reuse.


