Submitted:
25 April 2024
Posted:
26 April 2024
You are already at the latest version
Abstract
Alcoholic liver disease (ALD) develops when the immunotolerant environment of the liver is compromised due to excessive alcohol consumption. ALD progression involves variations in the expression of multiple genes, resulting in liver inflammation and the development of a leaky gut. Molecular mechanism involved for ALD progression is still unclear, and due to that there are currently no FDA-approved drugs available for its treatment. In this study, the protective effects of Graphene oxide nanoparticles (GO) was investigated against ethanol-induced damage in the gut-liver axis in in vitro. GO was synthesized using a modified Hummer's method and characterization was done. Given the general concerns regarding nanoparticle toxicity, assessment of cell viability, lipid accumulation, DNA damage, cell death, and the generation of reactive oxygen species (ROS) were conducted using various techniques. Furthermore, gene expression of pro- and anti-inflammatory cytokines was done using RT-qPCR. The findings revealed that GOs promoted cell viability even against ethanol treatment. Additionally, lipid accumulation significantly decreased when cells were treated with GO alongside ethanol compared to ethanol treatment alone, with similar trends observed for other assays. Gene expression analysis indicated that GO treatment reduced the expression of proinflammatory cytokines while enhancing the expression of antioxidant genes. Moreover, GO treatment led to improvements in gut permeability and a reduction in proinflammatory cytokines in colon cells damaged by ethanol. These findings suggest that GO holds promise as a drug carrier, exhibiting no observed toxic effects. By shedding light on the protective effects of GO against ethanol-induced damage, this study contributes to the burgeoning field of nanoparticle-mediated therapy for ALD.
Keywords:
Graphene oxide nanoparticles
; Gut - liver axis
; Alcoholic liver disease
; Inflammation
; Lipolysis
1. Introduction
ALD is one the major life style related disorder and it is responsible for approximately 4% liver related death worldwide [1]. When the blood alcohol concentration is below 10 M/L, the alcohol dehydrogenase (ADH) pathway becomes activated, metabolizing ethanol. However, if the concentration surpasses this threshold, the Microsomal ethanol oxidizing system (MEOS) pathway is triggered, involving the activation of cytochrome P450E1 (CYP2E1) and catalase pathways. These pathways, in turn, generate higher levels of reactive oxygen/nitrogen species, leading to activation of stress mechanisms [2]. Furthermore, liver does not get damaged due to ethanol only but also due to change in gut homeostasis. Increased ethanol consumption is associated with gut dysbiosis, disrupting gut homeostasis and, consequently, impacting liver homeostasis by producing elevated levels of exotoxins [3]. Persistent and excessive alcohol consumption over an extended period may lead to the development of fatty liver disease. As severity progresses, inflammation and fibrosis ensue, eventually advancing to the early stage of liver disease known as liver cirrhosis. Hepatocellular carcinoma (HCC) is the advanced stage of ALD [4]. It is crucial to recognize that continuous and high-volume alcohol intake can have profound implications on liver health, progressing through various stages of pathology.
There are various treatments available but none are FDA approved. The majority of clinicians advise patients to improve their lifestyle by include nutrition in their diet and exercising [5]. These would help in early disease condition but for later stages steroids like corticosteroid and prednisolone are prescribed but they are discontinued if their side effects are increased. Furthermore, the doctor may recommend going to rehab or taking medication to aid with alcohol withdrawal. In the final stages of the disease, there is only one feasible alternative to survival: liver transplantation. [6]. Even after transplantation, maintaining abstinence is crucial for an extended period. Research on ALD and its treatment is ongoing, but due to a lack of understanding of its precise mechanisms, only a few drugs or herbal materials have demonstrated protective activity. Many herbal materials are water-insoluble, leading to reduced efficacy. There are several research is going on for nanoparticles as protective model and from that PEG nanoparticles are FDA approved [7]. Few studies have even demonstrated the preventive role of nanoformulation, such as Rapamycin-mPEG-PLGA nanoformulation, in Non-alcoholic fatty liver disease. These indicate that the incorporation of a nanoparticle-mediated therapy may result in a better rate of amelioration [8].
Here, we chose GO nanoparticles due to its higher bioavailability [9]. Although GO has been researched for many years for various activities, its protective activity remains relatively unexplored. Our hypothesis aimed to assess the activity of GO for ALD in an in vitro model induced by ethanol. In certain instances, GO exhibited no toxic effects and even contributed to cell proliferation, suggesting potential benefits in this context. To investigate further, a series of experiments were conducted.
2. Materials and Methods
2.1. Methods:
Graphite powder, H2SO4 from LOBA chemicals, H3PO4 from Himedia, and KMnO4 from SRL. DAPI was purchased from Sigma Aldrich, H2-DCFDA from Merck, Acridine Orange (AO) and Ethidium bromide (EtBr) from SRL, and Oil Red O powder from Himedia. Cell line HepG2 and Caco2 were procured from NCCS, Pune, MEM media were purchased from Himedia and Gibco, Trypsin EDTA, Antibiotic and antimycotic mixture and fetal bovine serum were purchased from Gibco.
2.2. Methods:
2.2.1. Synthesis and Characterization of Graphene Oxide Nanoparticle (GO):
The mixture of H2SO4 and H3PO4 were prepared in 9:1 ratio. In cooling condition this mixture was added on 1g of graphite powder and 9g of KMnO4. This reaction is exothermic. After the mixture is ready, it was kept on stirring condition for 12 h and 60°C temperature maintained. After 12h of stirring the oxidation reaction was ceased using of ice cold distilled water. To see the oxidation, 10 mL of 30% H2O2 was added to the mixture. As H2O2 was added and it created bubble in solution. Then the mixture is first filtered through Whatman filter paper 1. Then collected filtrate was washed with distilled water, 30% HCl solution. HCl wash was given till the sulphate and manganese impurities were removed. After washing with HCl again water wash was given. To get raw material the collected pellet was air dried for 12 h at 50°C. then the material was exfoliated using sonication method [10,11].
After exfoliation sample was again air dried for 12 h at 50°C then characterization of the material was done using UV visible spectrophotometer, Scanning Electron Microscopy, and Fourier Transform Infrared Resonance. For FTIR, KBr palate were prepared and transmission were analyzed.
2.2.2. Cell Culture Studies:
HepG2 and Caco2 cell line were procured from NCCS, Pune. HepG2 cell line was maintained using 10% FBS and MEM media with 1X non-essential amino acid while for Caco2, 20% FBS and DMEM low glucose was used. For the experimentation purpose cells were treated with low serum media. Both the cell line 1X antibiotic and antimycotic mixture was used which contained penicillin, streptomycin and amphotericin.
- (A)
- Toxicity study:
In brief, cells were seeded in adequate amount to 96 well plate. As the confluency reach to 60-70% they were treated with different amount of GO (10 to 100 μg/mL). The concentration was in increasing amount. Next day, GO media was removed and cells were washed with 1X PBS thoroughly as unremoved GO can interact with MTT and might give false positive result [12]. As the cells were washed, they were treated with final concentration of 0.5 mg/mL MTT. After 60-90 mins MTT containing media removed and formazan crystals were dissolved in 100% DMSO. Then results were observed in multimode reader at 570 nm.
- (B)
- Cell damage analysis:
DAPI staining:
For DAPI, cells were seeded in 96 well plate (HepG2 25,000 cell/well and Caco2 10,000 cells/well) and next day cells were treated with 10 and 50 μg/mL GO and 0.1M ethanol. After treatment, cells were incubated and their growth characteristics were observed after 24h. Next day, cells were washed with 1X PBS and fixed with 4% neutral buffered saline (NBS). After fixation cells were washed with distilled water till the traces of fixative agent was removed. Further they were incubated for 15min with 100 µM DAPI stain in dark condition for 15 min. After incubation, extra DAPI solution was removed and cells were further washed with PBS. After wash cells were observed under fluorescent microscopy in DAPI filter. Their excitation and emission was also noted via multimode reader [13].
AO-EtBr staining:
Acridine orange and ethidium bromide were used to check cell death. For which live cells were observed under fluorescent microscope. Initially in 96 well plate, cells were seeded (HepG2 25,000 cell/well) and following day they were treated with of 10 and 50 μg/mL GO and 0.1M ethanol. On the next day, cells were washed with PBS and encountered with 100 μg/mL AO/EtBr solution and immediately observed under FITC (485 excitation /595nm emission) and TRITC (540 excitation /590 nm emission) filter. In merged channel, image cells were observed and up to 300 cells were counted to screen live and dead cells [14,15].
Lipid Accumulation study:
Due to ethanol, cells produces more amount of lipid and transferred near to cell membrane [16]. Cells were seeded in 96 well plate and next day treated with 0.1M ethanol and 10 and 50 μg/mL GO. After 24 h of treatment they were washed with PBS and incubated for fixation in NBS for 15-30 mins. Then, cells were washed with Distilled Water and incubated for 15 min with working Oil red O (ORO) solution. After incubation, extra ORO was removed by washing cells with Phosphate Buffered Saline (PBS) and observed under light microscope. Further to take absorbance, PBS was removed and 100% IPA was added in each well and shaken for few minutes to extract stain from cells and solution was taken in empty well. Absorbance was taken at 570 nm and relative fold change over basal was measured [17,18].
ROS study:
H2-DCFDA is used to check ROS level. Cells were seeded in 96 well plate as mentioned previously and after 24hrs, they were treated with ethanol and 10 and 50 μg/mL GO. After 24h of the treatment, cells were washed with PBS and fixed. After that cells were incubated with 20μM concentration of H2-DCFDA for 1hr. Further, cells were washed to remove excessive dye. Fluorescence were observed using microplate reader, Perkin Almer at fluorescent excitation at 484/30 nm and emission at 535/30 nm. Fold over basal change graph for both the cell lines were prepared [19].
Gene Expression:
For gene expression analysis, cells were first seeded in 6 well plate and then in their exponential phase, they were treated with ethanol and 10 and 50μg/mL GO. After 24hrs of the treatment, RNA isolation was done manually by using RNAisoplus solution, TAKARA. In brief, cells were removed from plate by RNAisoplus solution and incubated with chloroform following centrifugation at 12,000g for 15min. Further, pellet was washed with 100% IPA and incubated at room temperature for 15mins. After that pellet was centrifuged at 12,000g for 10min and then collected pellet were again washed with 70% ethanol. Clear pellet was then resuspended in nuclease free water and stored at -80°C for future use. Purity of RNA was checked using Nanodrop. Further purified RNA was used for cDNA synthesis. cDNA was synthesized using kit and after that RT-qPCR was performed for gene expression study.
For gene expression, 2X SYBR green enzyme mix, 500 nM primer and 5ng concentration of cDNA were used. To activate SYBR green enzyme, first initial 95°C temp was given to final prepared solution. Further PCR was carried out at 95°C denaturation for 30 sec, 60°C for 45 sec annealing and 72°C for 1min extension.
Fold change over basal were calculated by 2-ΔΔCt method, and mRNA expression were evaluated for HepG2 and Caco2 cells. 18s rRNA were used as reference gene.

Table 1.
List of Human primers for RT-qPCR.
| Gene Name | Forward Primer | Reverse Primer |
|---|---|---|
| 18S | GATGGTAGTCGCCGTGCC | GCCTGCTGCCTTCCTTGG |
| CYP2E1 | AACTGTCCCCGGGACCTC | GCGCTCTGCACTGTGCTTT |
| EGR1 | AGCCCTACGAGCACCTGAC | GGGCAGTCGAGTGGTTTG |
| SREBP2 | CTCCATTGACTCTGAGCCAGGA | GAATCCGTGAGCGGTCTACCAT |
| Il6 | CATCCTCGACGGCATCTCAG | GCAGAAGAGAGCCAACCAAC |
| TNF | CTCTTCTGCCTGCTGCACTTG | ATGGGCTACAGCTTGTCACTC |
| Il10 | ACTGCTAACCGACTCCTTA | TAAGGAGTCGGTTAGCAGT |
| AMPK | AGGAAGAATCCTGTGACAAGCAC | CCGATCTCTGTGGAGTAGCAGT |
| NrF2 | GAGAGCCCAGTCTTCATTGC | TGCTCAATGTCCTGTTGCAT |
| HO1 | AAGCCGAGAATGCTGAGTTCA | CGGGTGTAGATATGGTACAAGGA |
| Occludin | CTCGAGAAAGTGCTGAGTGCCTGGAC | AAGCTTTCGGTGACCAATTCACCTGA |
| ZO-1 | TATTATGGCACATCAGCACG | TGGGCAAACAGACCAAGC |
| PPAR | GGCTTCATGACAAGGGAGTTTC | AACTCAAACTTGGGCTCCATAAAG |
2.3. Stastical Analysis
All experiments were performed atleast thrice. Data were analyzed by using Graph Pad prism software 9.0. Data were analyzed using two way ANOVA method with multiple comparison method.
3. Results
3.1. Characterisation of the Nanoparticles:
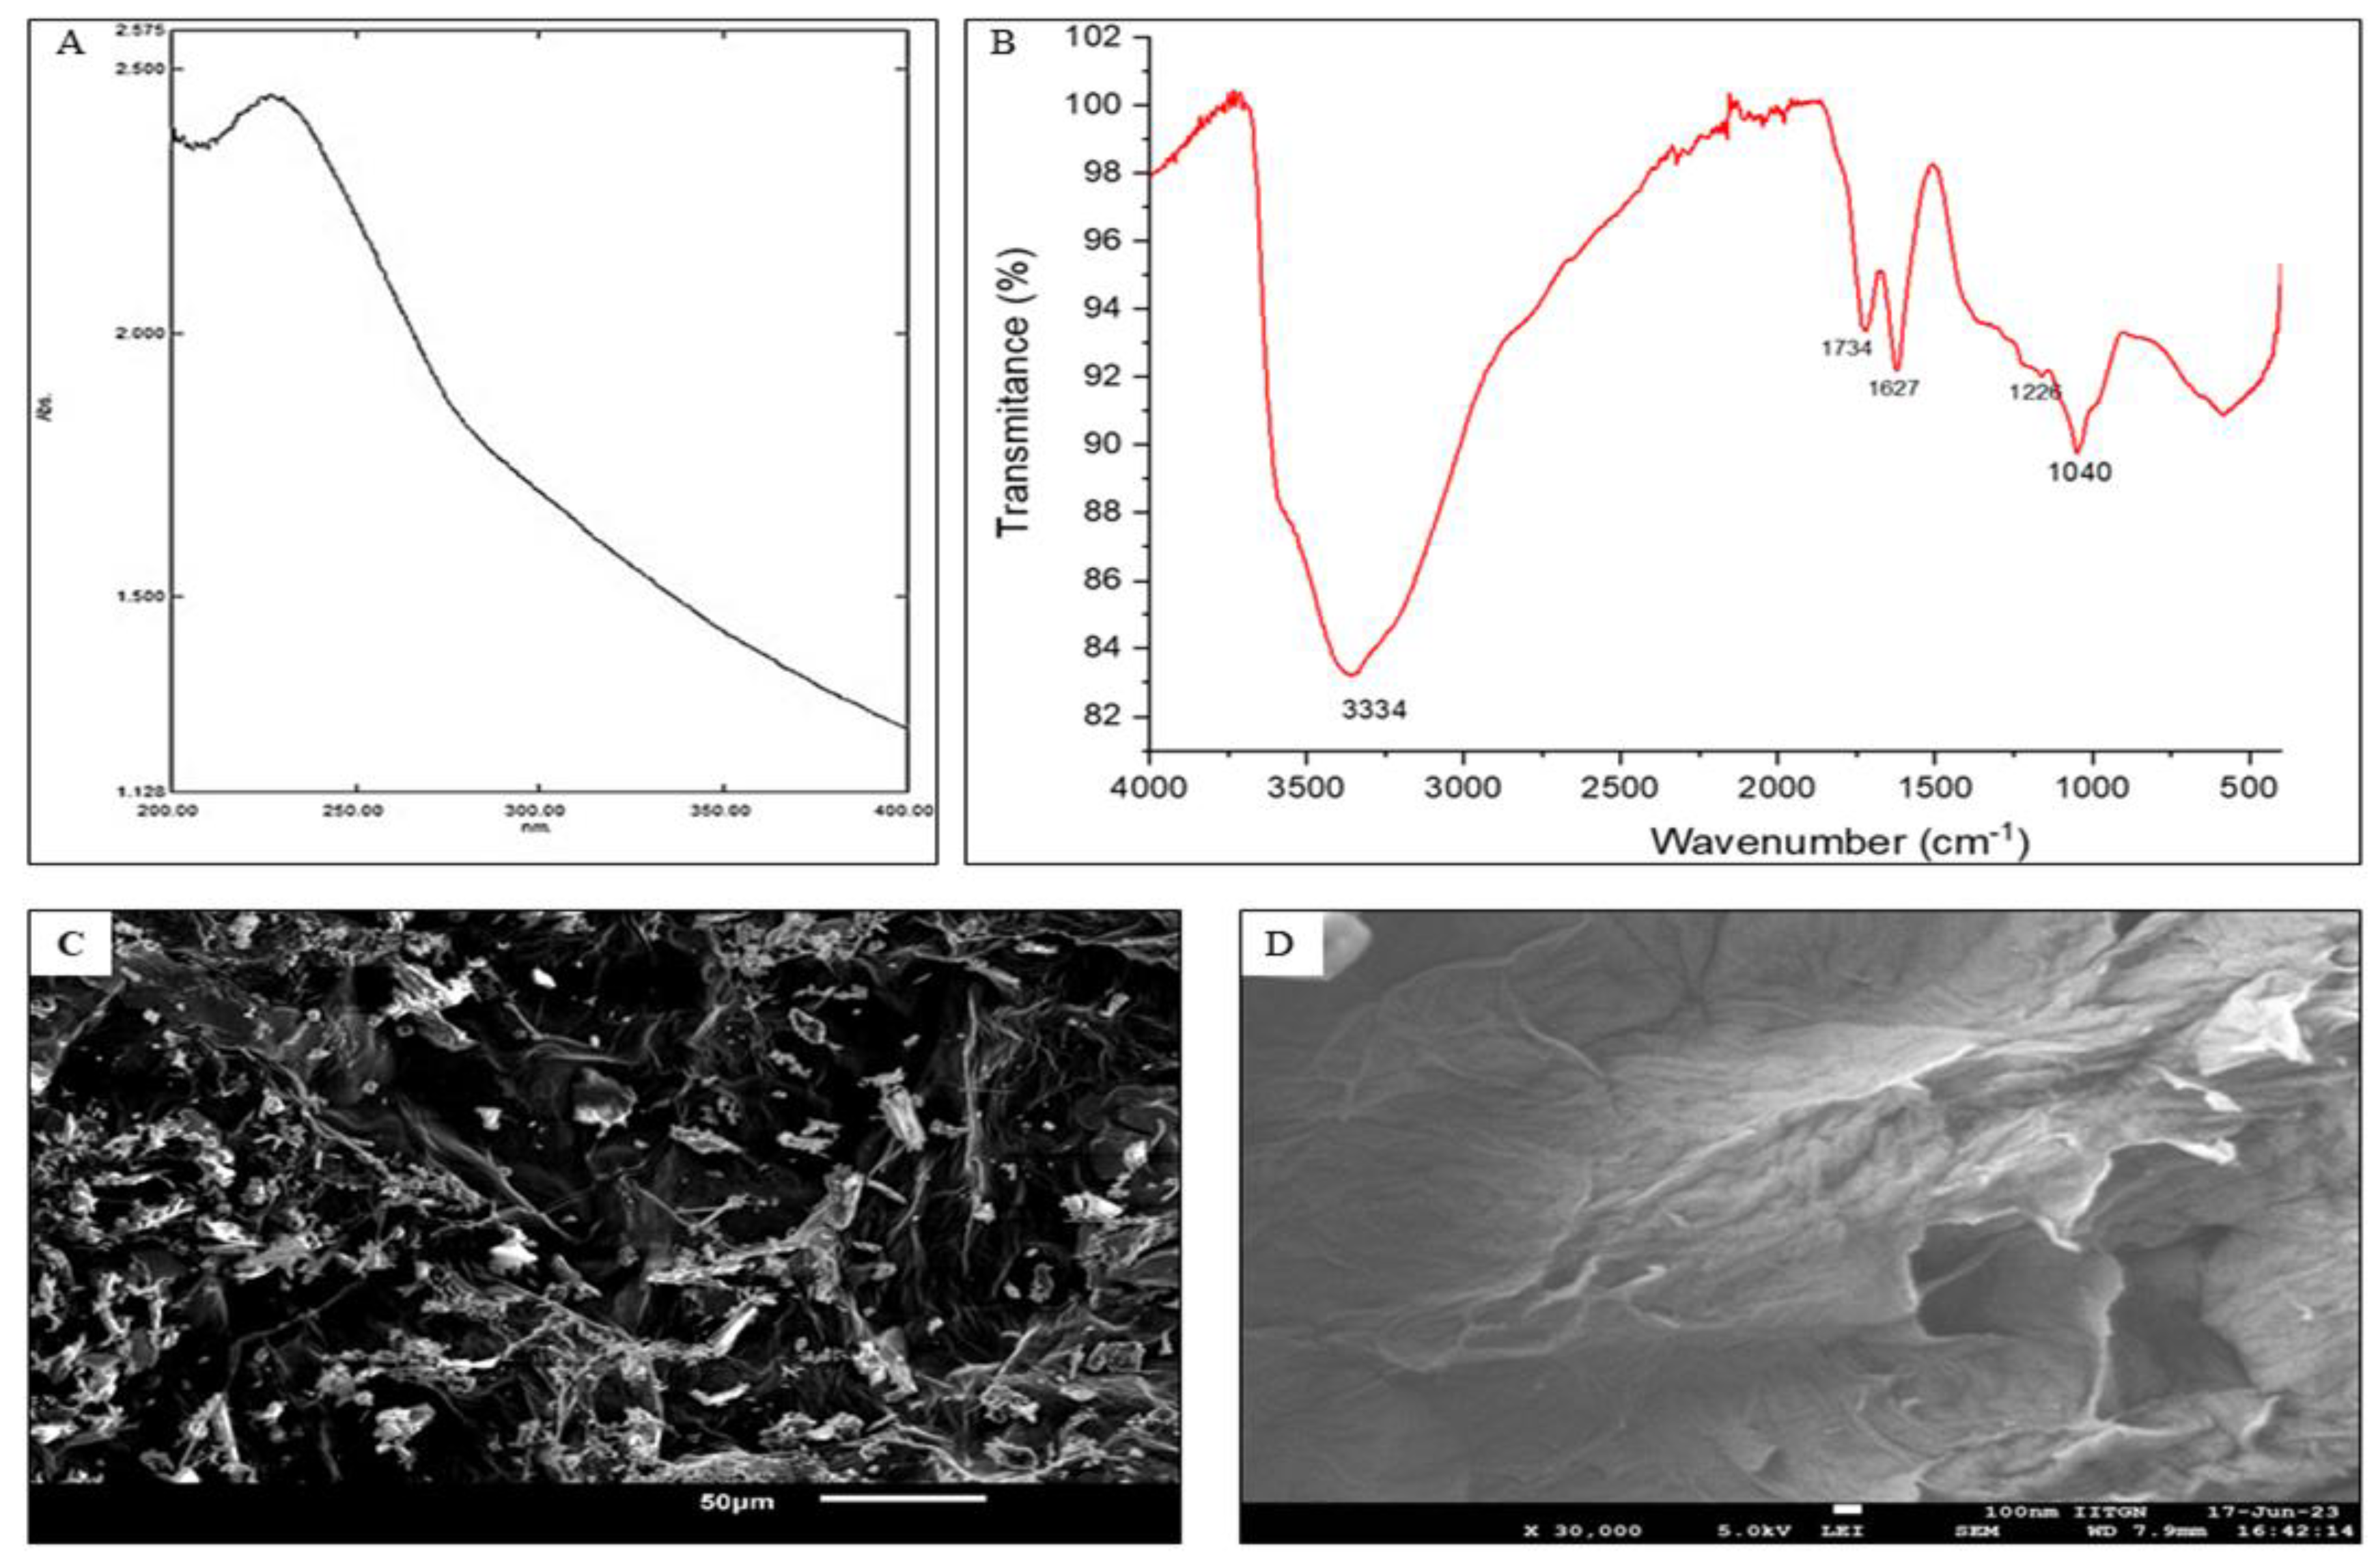
Graphene oxide is the material which is mainly made up with carbon and oxygen. Graphene oxide has hexagonal carbon structure which stacks with one another by π- π interaction which attributes to van der Waals interaction. C=C interaction were observed at near 224 nm. There is a bond between carbon and oxygen as well where oxygen tends to donate electron to form a stable structure which is n- π* interaction. This interaction can be observed in UV visible analysis near to 300 nm. It shows weak interaction that is attributed to C=O [20].
Fourier transform infrared spectroscopy (FTIR) is used to identify chemical bond present in the molecule. GO is mainly made up with carbon, oxygen and hydrogen. Together all three form various bonds which can be detected using FTIR. In FTIR analysis, bonds at 3334, 1734, 1627, 1230 and 1040 cm-1 were observed. All are attributed to different chemical group stretching. Stretching near 3334 cm-1 is attributed to carbonyl/ O-H stretching. Peak near to 1734 and 1627 cm-1 are attributed to carboxyl and carbonyl group respectively. Band near to 1230 cm-1 indicates the presence of C-O-C functional group. Vibration at 1040 cm-1 indicates the activity of C-O group [21,22,23,24].
Further SEM and FESEM analysis of GO were done to observe structural orientation. In SEM images sheet like structure of GO was observed which was further analysed in FESEM. In FESEM, layered structured was visualised properly. Thickness was analysed using ImageJ software which showed thickness of the sheet near to 0.8 to 1nm. It showed a flaky morphology [25].
Figure 1.
Characterization of GO. If there are multiple panels, they should be listed as: (a) Description of what is contained in the first panel; (b) Description of what is contained in the second panel. Figures should be placed in the main text near to the first time they are cited.
Figure 1.
Characterization of GO. If there are multiple panels, they should be listed as: (a) Description of what is contained in the first panel; (b) Description of what is contained in the second panel. Figures should be placed in the main text near to the first time they are cited.
3.2. Activity in In Vitro Model:
3.2.1. Cell Viability Study:
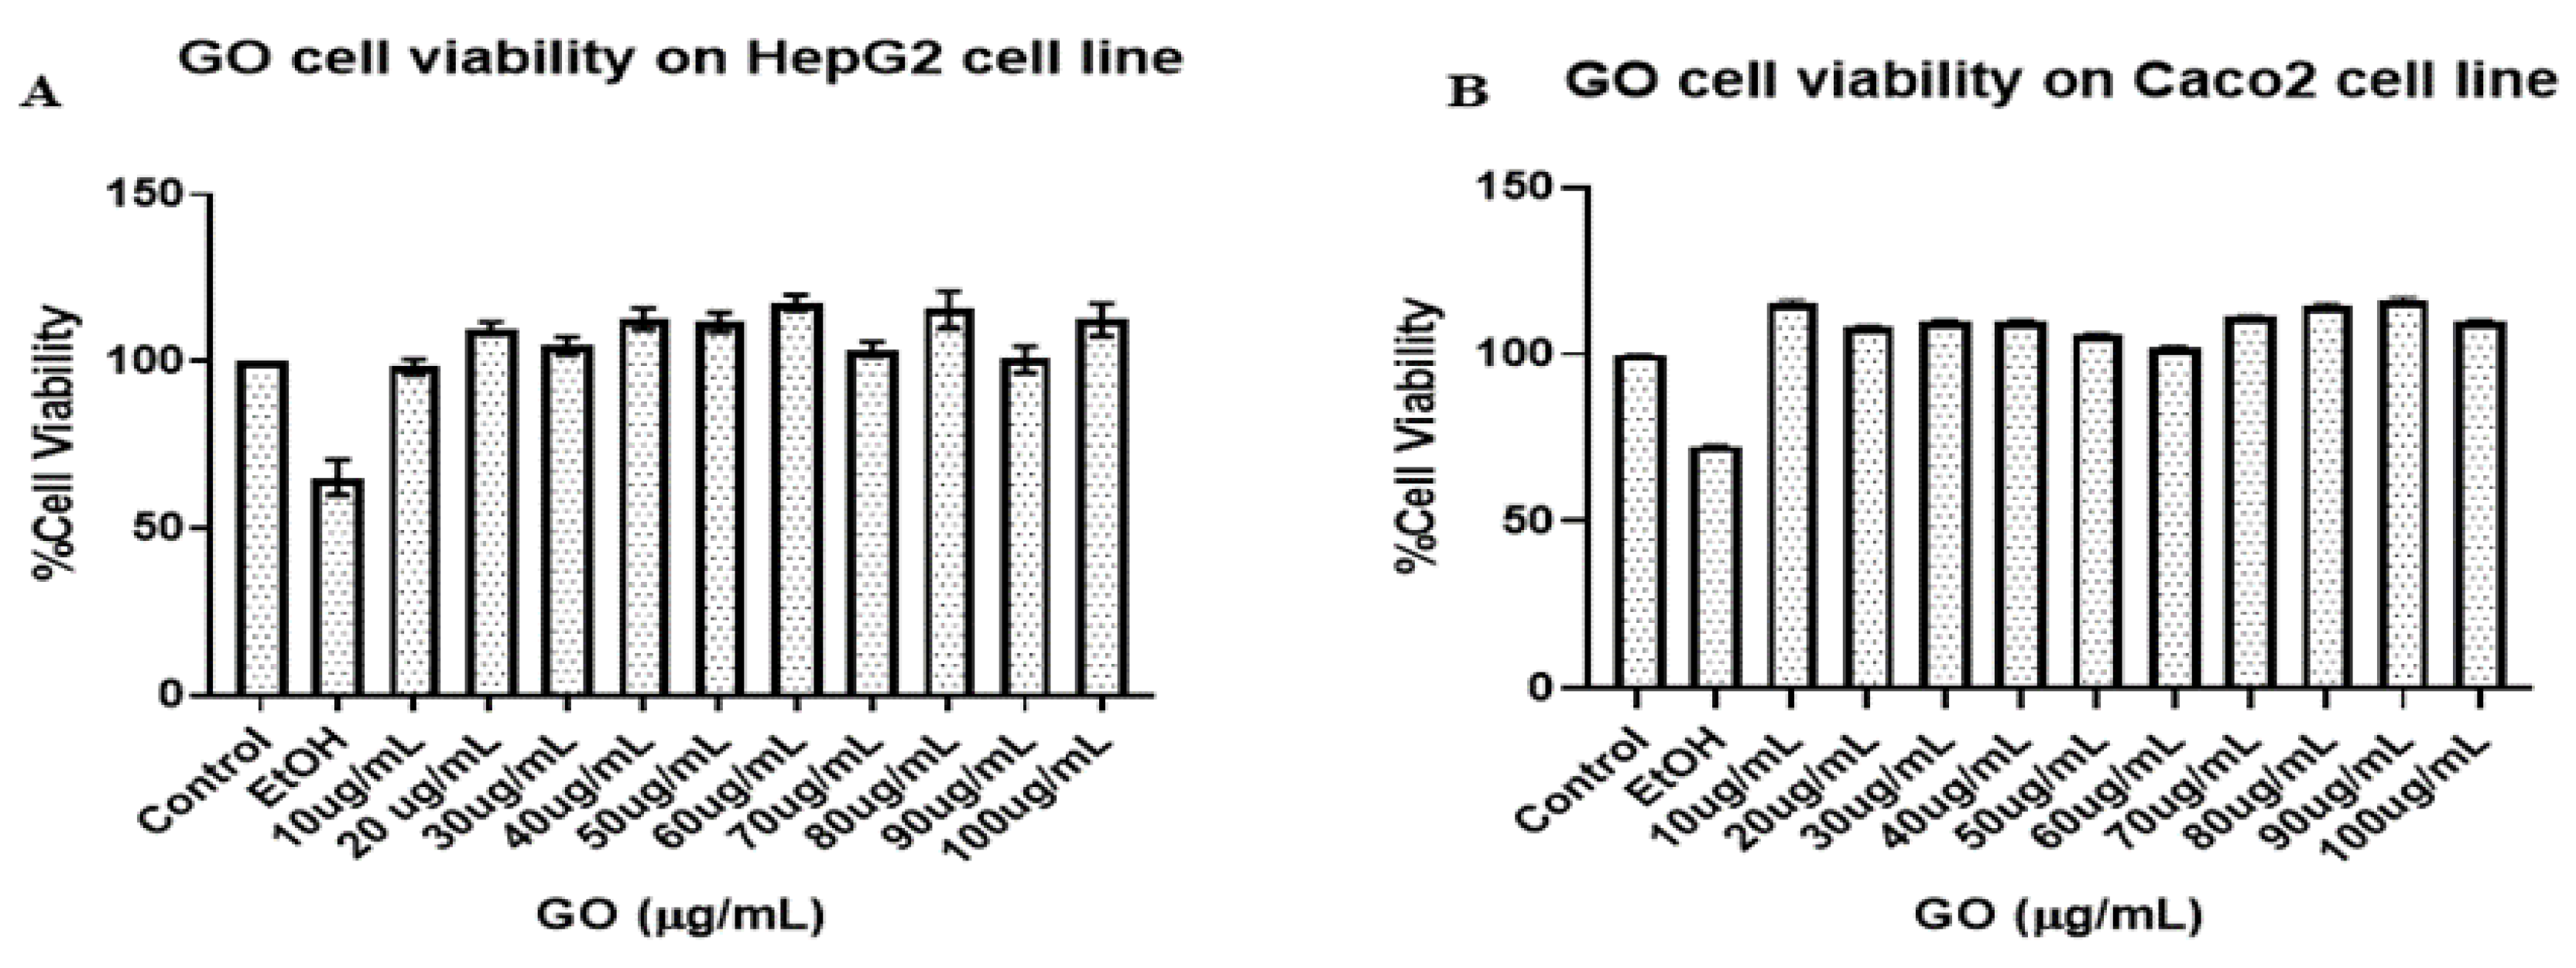
Cells were treated with different concentration of GO ranging from 10 to 100 μg/mL. 100 mM ethanol was taken as negative control in which almost 30 to 40 % cell death observed for both the cell line while 100% viability was observed even at the highest concentration of GO treatment. To have proper results cells were washed with 1X PBS before treating with MTT.
Figure 2.
A) % cell viability for HepG2 cells. B) % cell viability for Caco2 cells. Values represents the mean ± SD of six individual experiments.
Figure 2.
A) % cell viability for HepG2 cells. B) % cell viability for Caco2 cells. Values represents the mean ± SD of six individual experiments.
3.2.1. Cell damage study:
- A)
- AO-EtBr and DAPI staining:
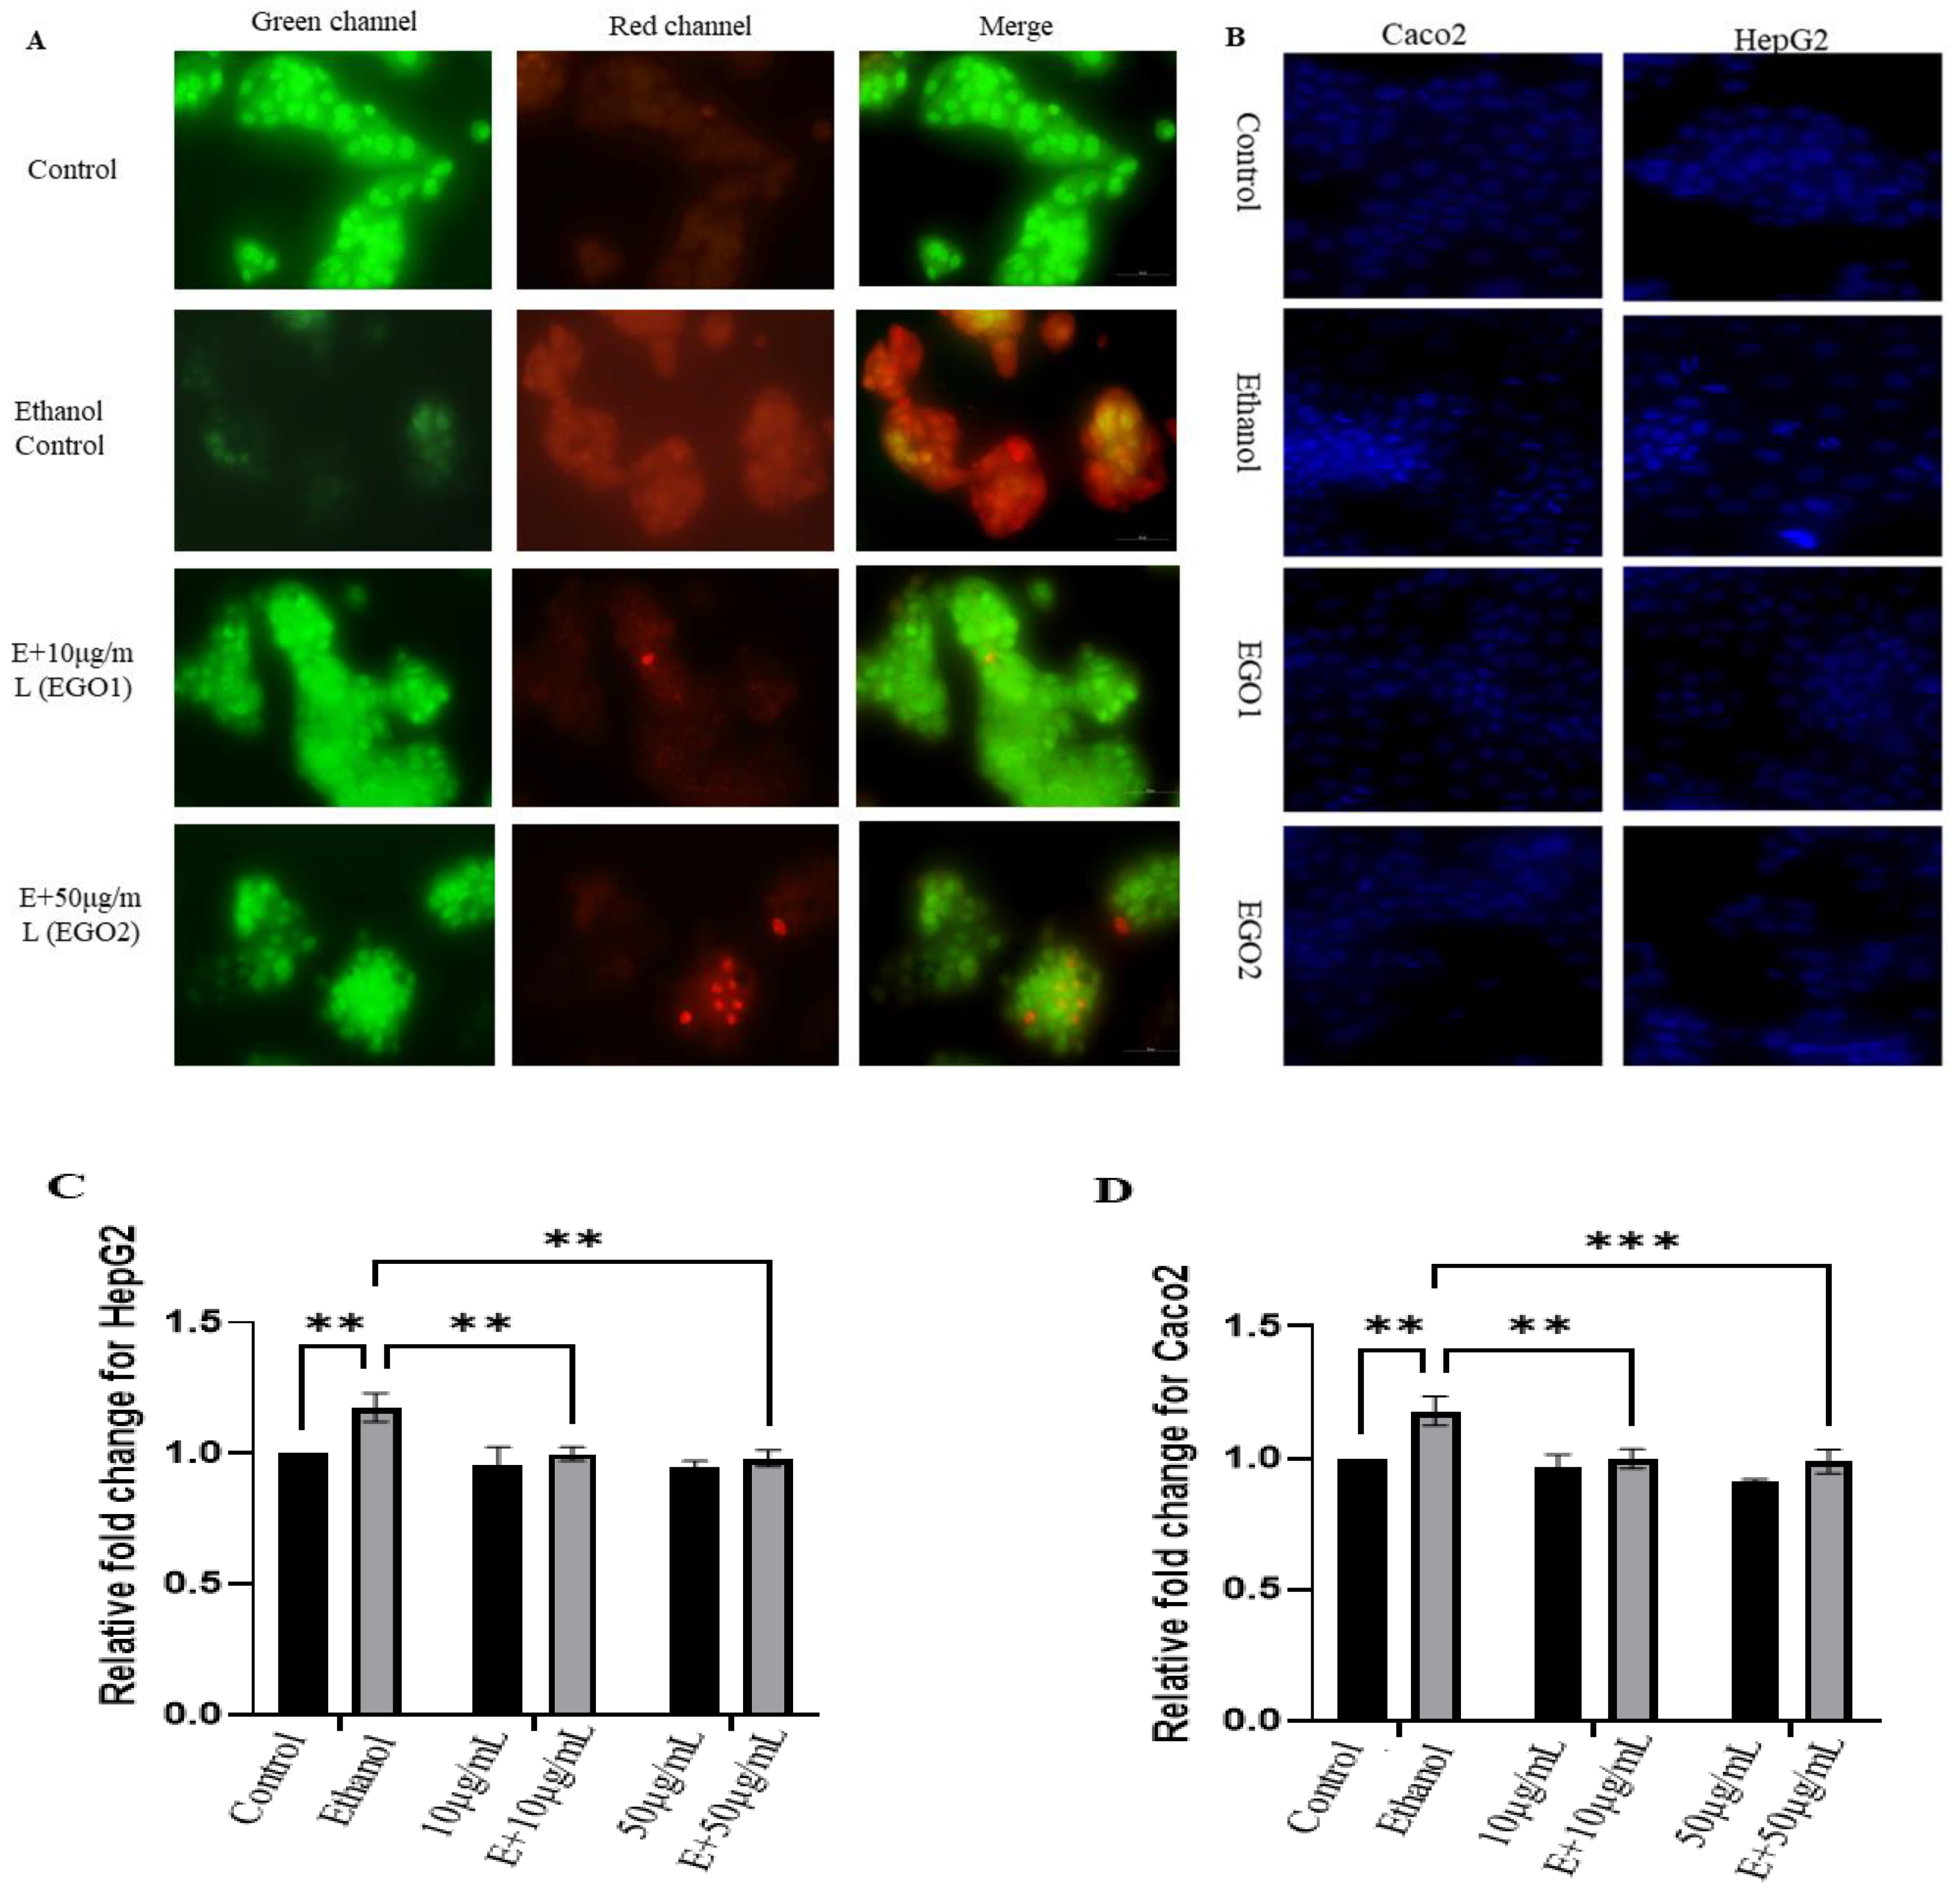
Cell damage was analysed using AO-EtBr staining and DAPI staining. AO EtBr analysis was done for HepG2 cells. Acridine orange and Ethidium bromide staining was used to detect live and dead cell. Dead cells were stained due to EtBr because of ruptured membrane [26]. The cells were counted in merged channel where first green fluorescence was taken and then red fluorescence was taken. In merged image, approximately 300 cells were counted. Form that 300 cells, in normal control group showed 10±5 dead cells but in ethanol control, 80±5 cells were observed red or orange in colour. It was seen that in treatment cells which were treated with both ethanol and nanoparticles showed decreased cell death.
DAPI staining is used to assess cell activity. HepG2 and Caco2 both cells were stained after 24hrs of treatment. Fluorescence images were analysed and fluorescence spectra were also measured. In both the cases, ethanol treated cells were more damaged than control cells but damage were decreased. In ethanol treated cells, chromatin condensation were increased. From 100 cells, 15±2 cells were damaged and showed higher fluorescence. Fluorescence of treatment cells were decreased and was almost near to control untreated cells. Furthermore, from approx 100 cells there were very less cells found damaged.
Figure 3.
A) AO EtBr staining in HepG2 cell line. B) DAPI staining in HepG2 and Caco2 cell line. Relative fold change was analysed for both the cell lines. Statistical significance was carried out by two way ANOVA followed by multiple group comparison where *p<0.05, **p<0.01, ***p<0.001 and ****p<0.0001. Values represents the mean ± SD of three individual experiments. The above figures are illustrative 10x objective images of three individual experiments.
- (B)
- Lipid Accumulation Study:
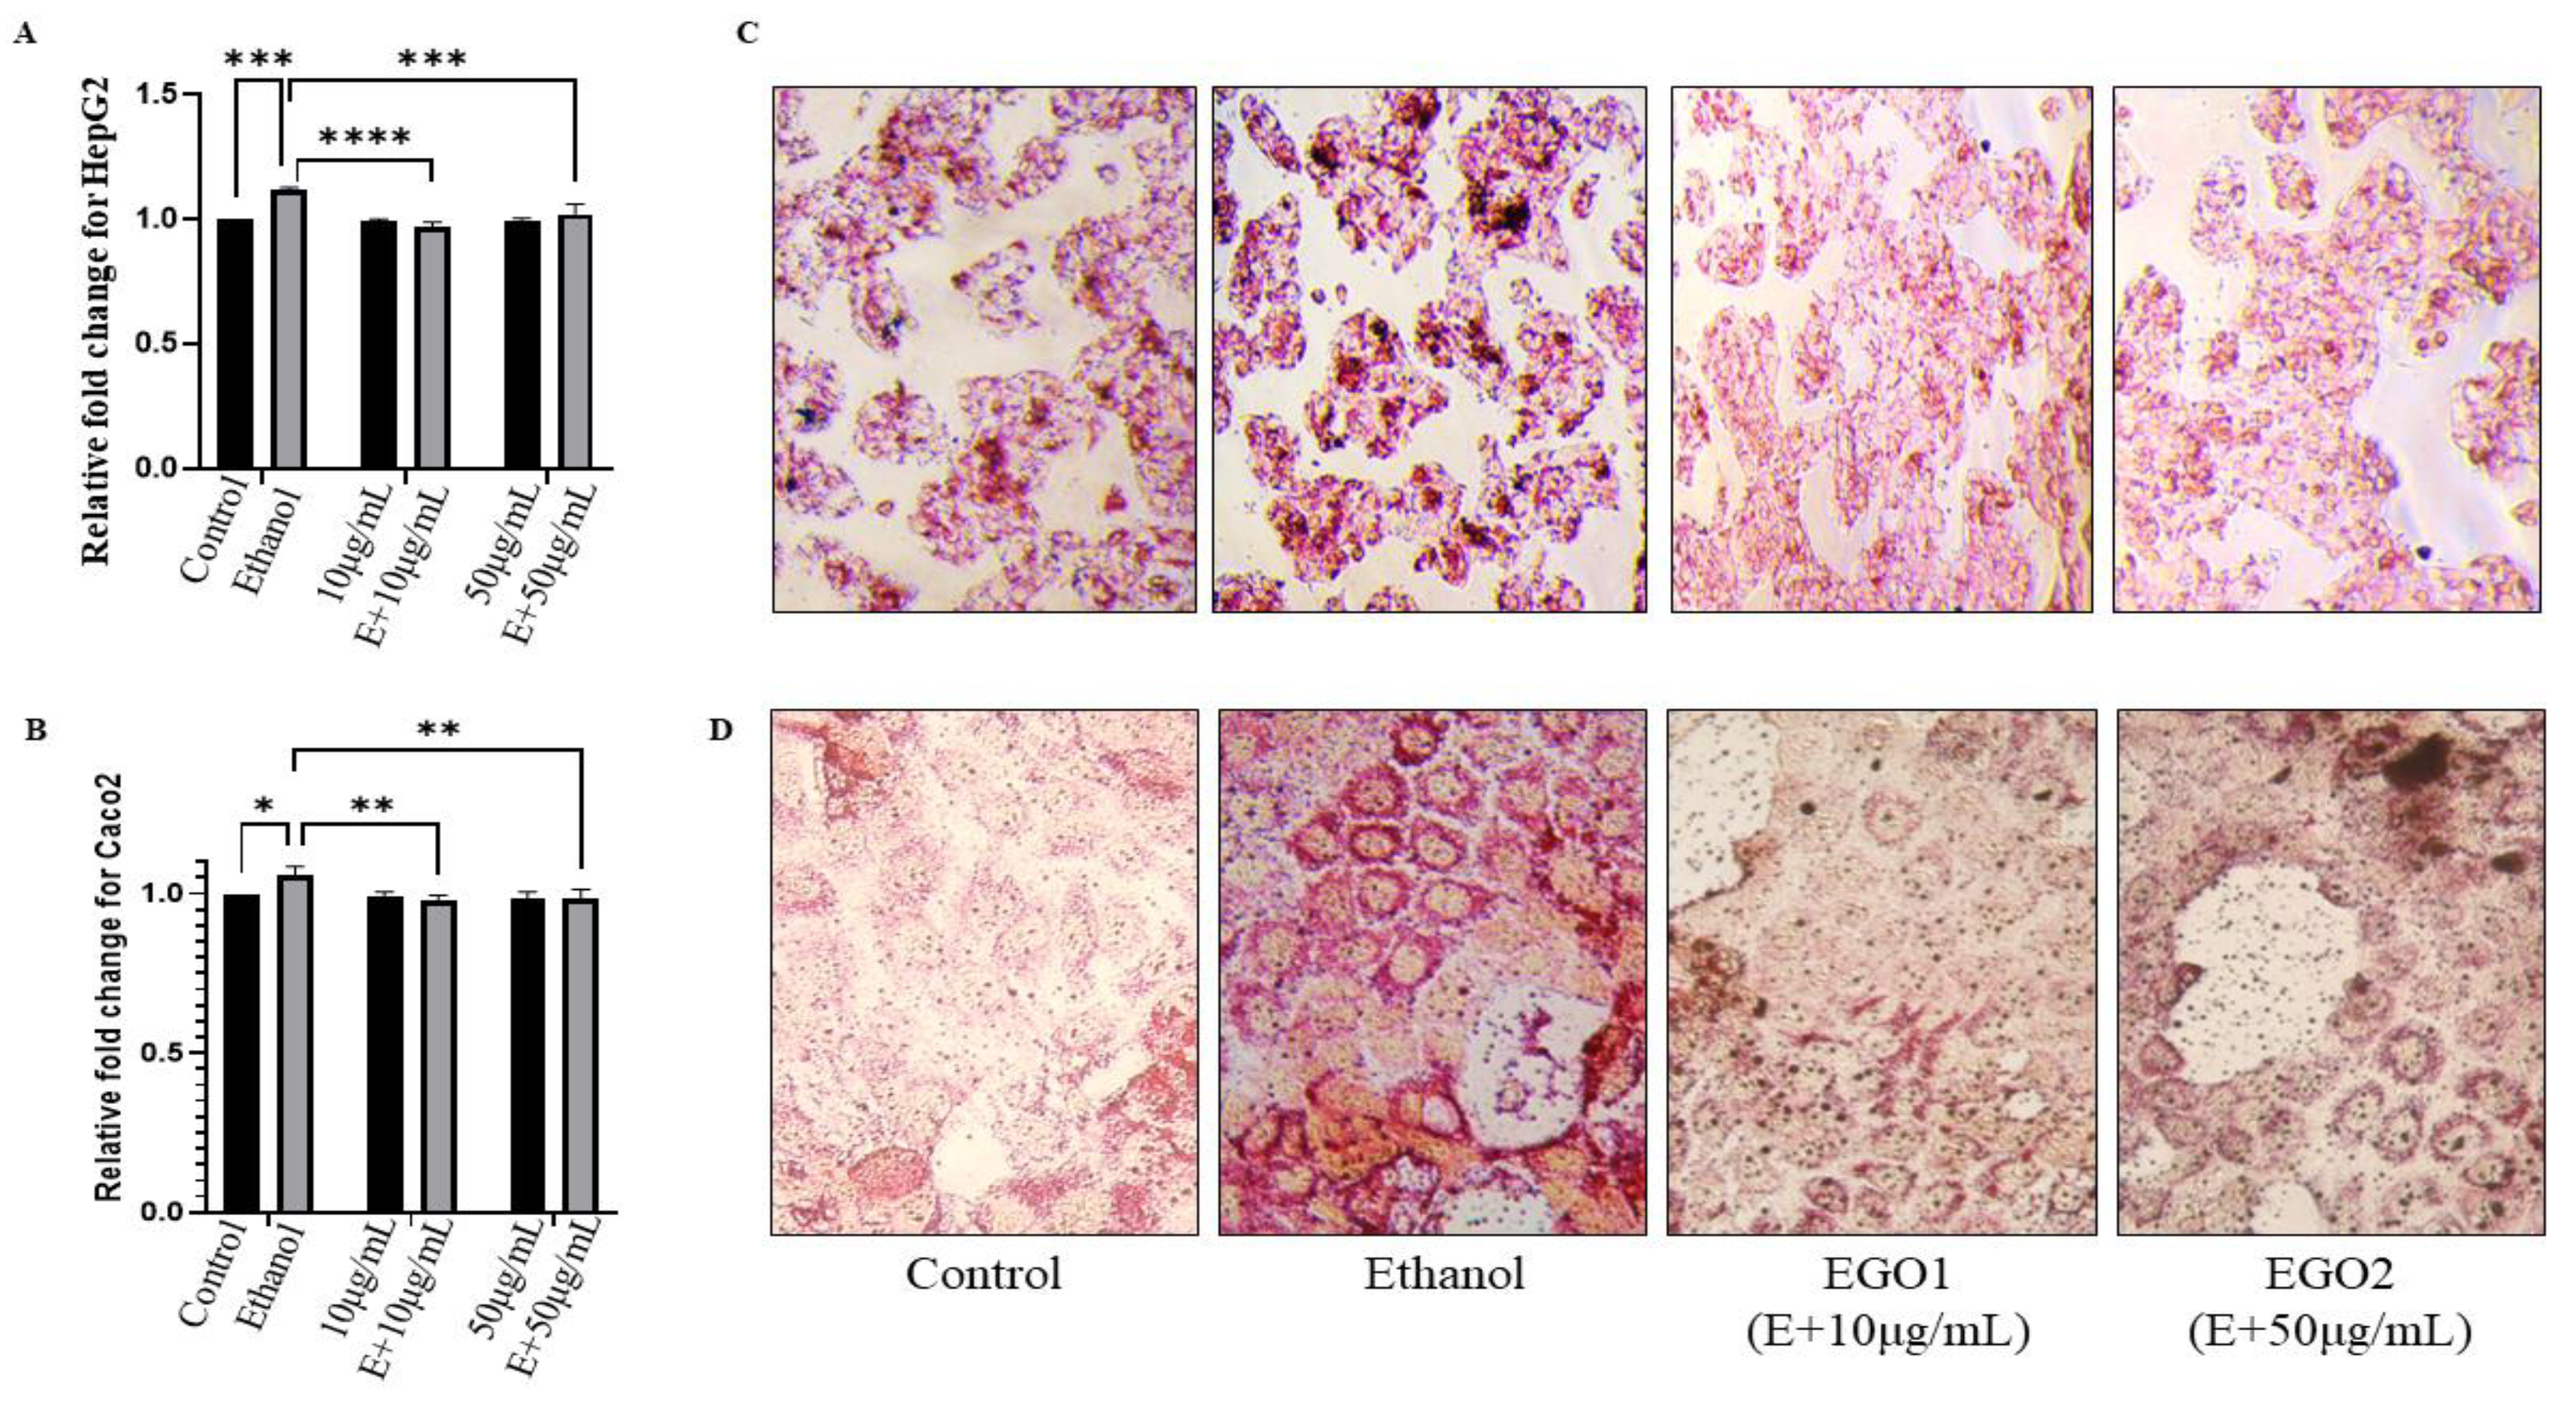
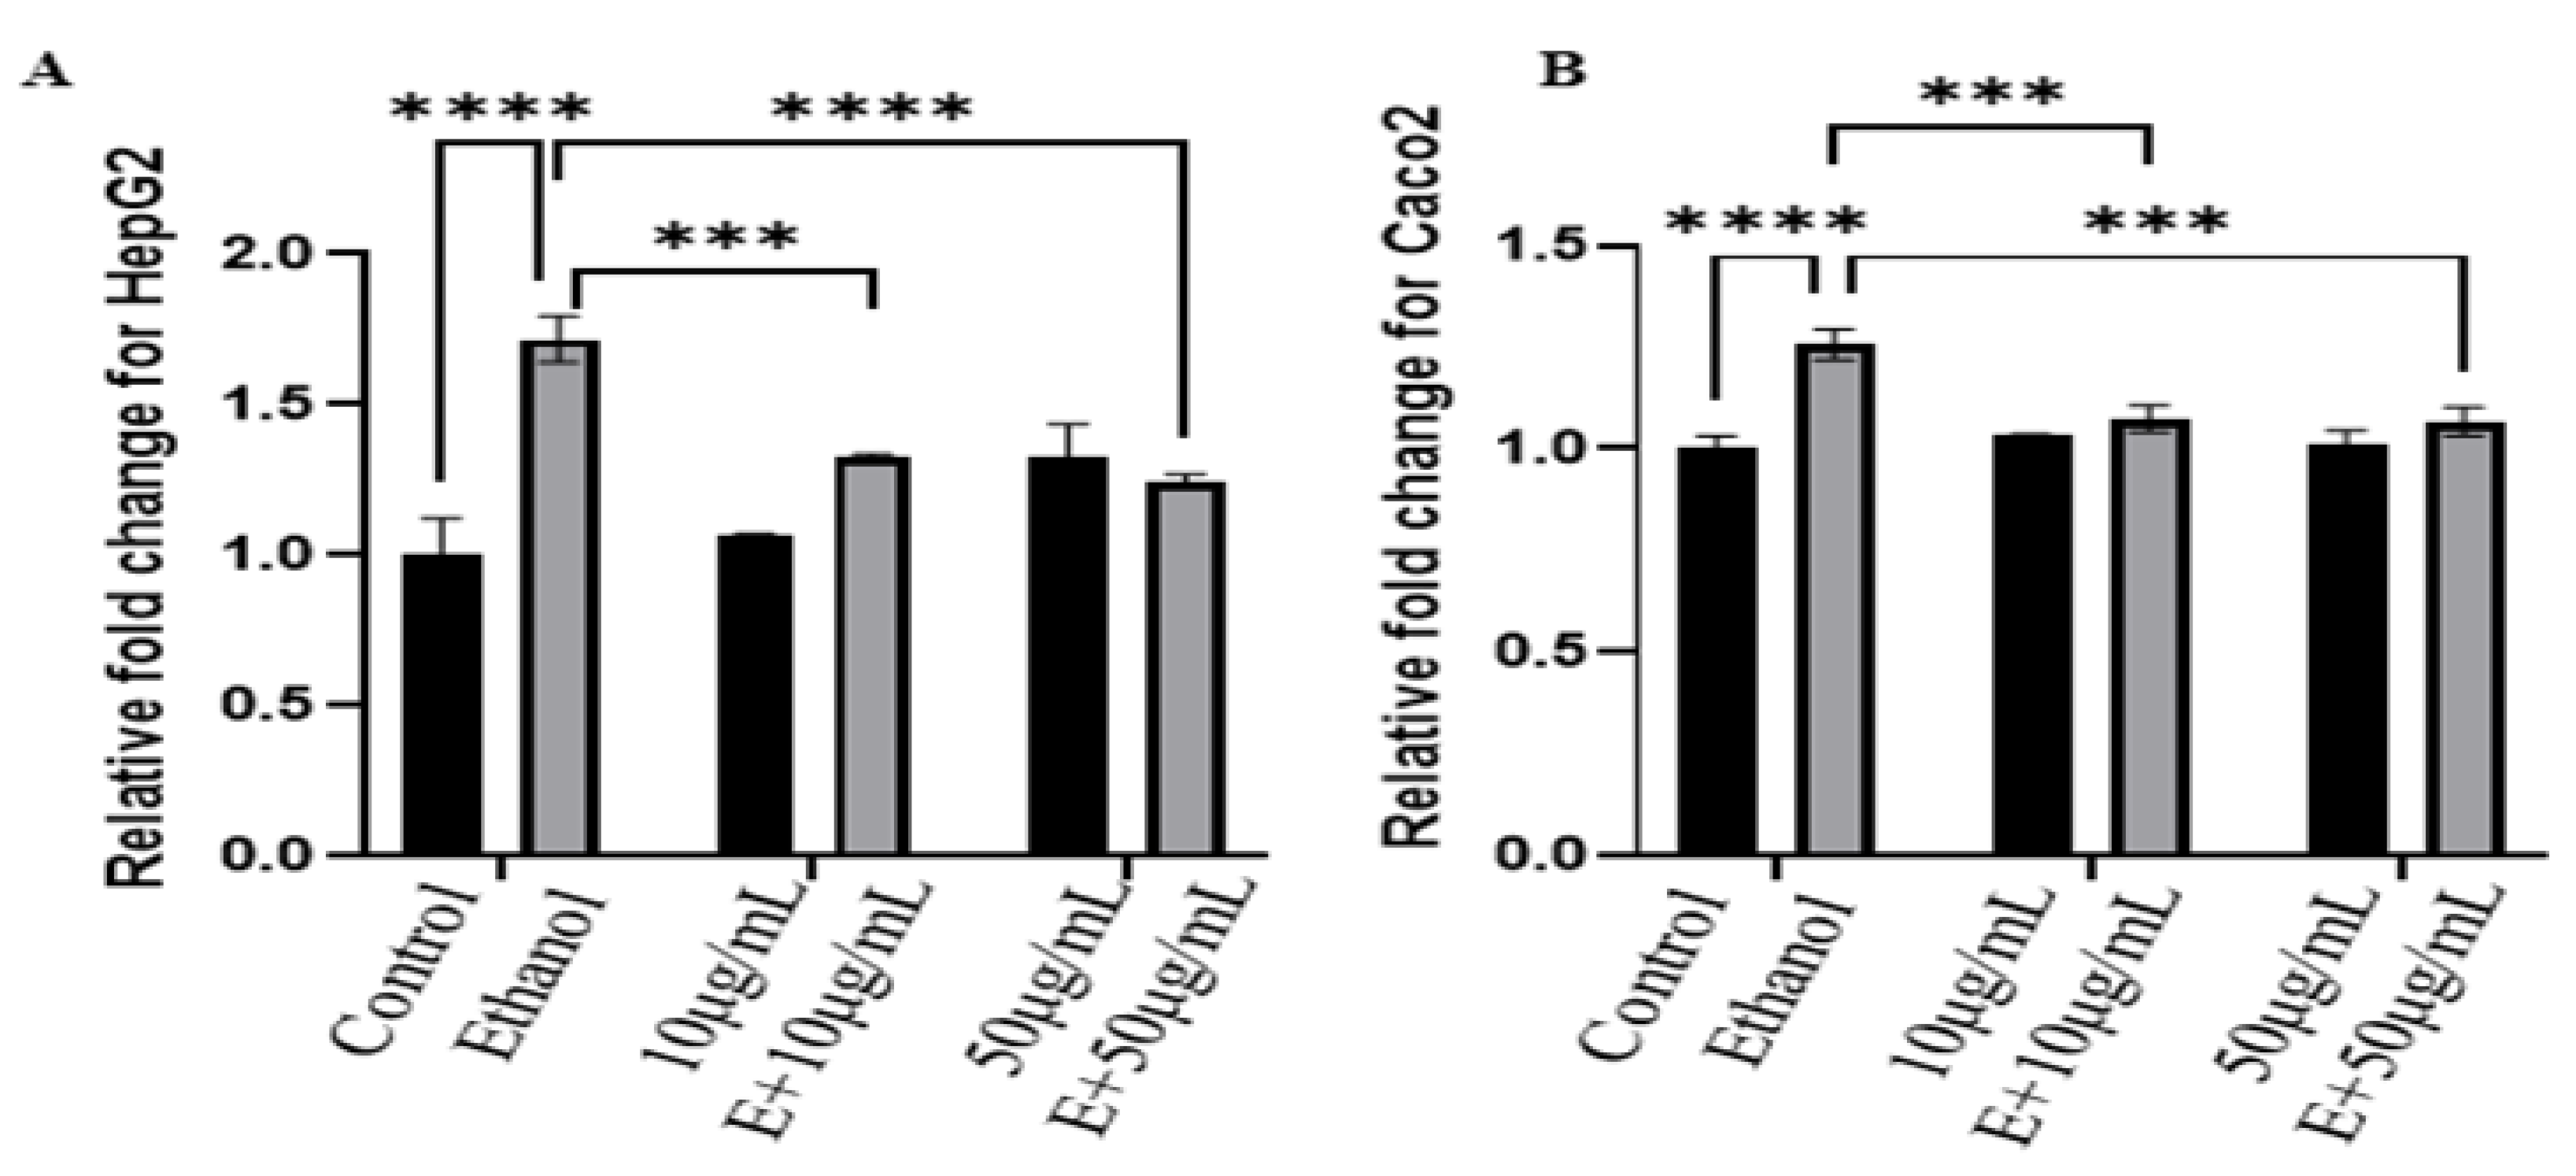
Due to ethanol activity, lipid accumulation is increased in cells which can be observed via Oil Red O staining. Cells were analyzed microscopically by Nikon microscope and were further quantified using a spectrophotometer. Oil red O stain was extracted from cells by treating cells with 100 % isopropanol [18]. Then the extracted stain was quantified using spectrophotometer by taking absorbance at 570 nm. Due to ethanol treatment in both the cell type, lipid accumulation was increased. Increased lipogenesis was further confirmed by taking absorbance at 570nm. In treatment cells, lipid accumulation was decreased and it showed similar activity like control untreated cells. Relative fold change was done for absorbance and comparison were done in reference to ethanol treated cells.
Figure 4.
Lipid accumulation. A) Relative fold change in absorbance were calculated for HepG2 cells and images was captured in phase contrast microscope. B) Relative fold change in absorbance was calculated for Caco2 cells and images were captured in phase contrast microscope. C) Images of HepG2 cell line at 10x. D) Images of Caco2 cell line at 40x. For both cell line, ethanol treated cells showed higher lipid accumulation. Statistical significance was carried out by two way ANOVA followed by multiple group comparison where *p<0.05, **p<0.01, ***p<0.001 and ****p<0.0001. The above figures are illustrative 10x objective images of three individual experiments.
- (C)
- Reactive oxygen spices analysis:
Cells exposed to ethanol produce an increased amount of reactive oxygen species (ROS) through the activation of cytochrome p450E1. The 2',7'-dichlorofluorescin diacetate (H2DCFDA) reagent can be used to analyse this phenomenon. H2DCFDA is a non-fluorescent compound that easily enters cells. In the presence of esterase, it is converted into a non-fluorescent compound called 2'7'-dichlorofluorescin. Due to the presence of ROS, these non-fluorescent compounds quickly transform into a highly fluorescent compound known as 2',7'-Dichlorodihydrofluorescein. This fluorescence can be detected using fluorescent spectroscopy at an excitation wavelength of 484/20 nm and an emission wavelength of 535/20 nm. In this study, a Perkin Elmer spectrophotometer was used to detect fluorescence. The ethanol control group exhibited higher fluorescence compared to the control/untreated group for both cell types, but this trend was reversed in the treatment group. The relative fold change was measured for both cell types, demonstrating that ethanol-treated cells exhibited greater fluorescence compared to the treatment group.
Figure 5.
ROS estimation. A) Relative fold change in fluorescence of H2DCFDA stain for HepG2. B) Relative fold change in fluorescence of H2DCFDA stain for Caco2. Statistical significance were carried out by two way ANOVA followed by multiple group comparison where *p<0.05, **p<0.01, ***p<0.001 and ****p<0.0001. Values represents the mean ± SD of three individual experiments.
- (D)
- Gene Expression Analysis:
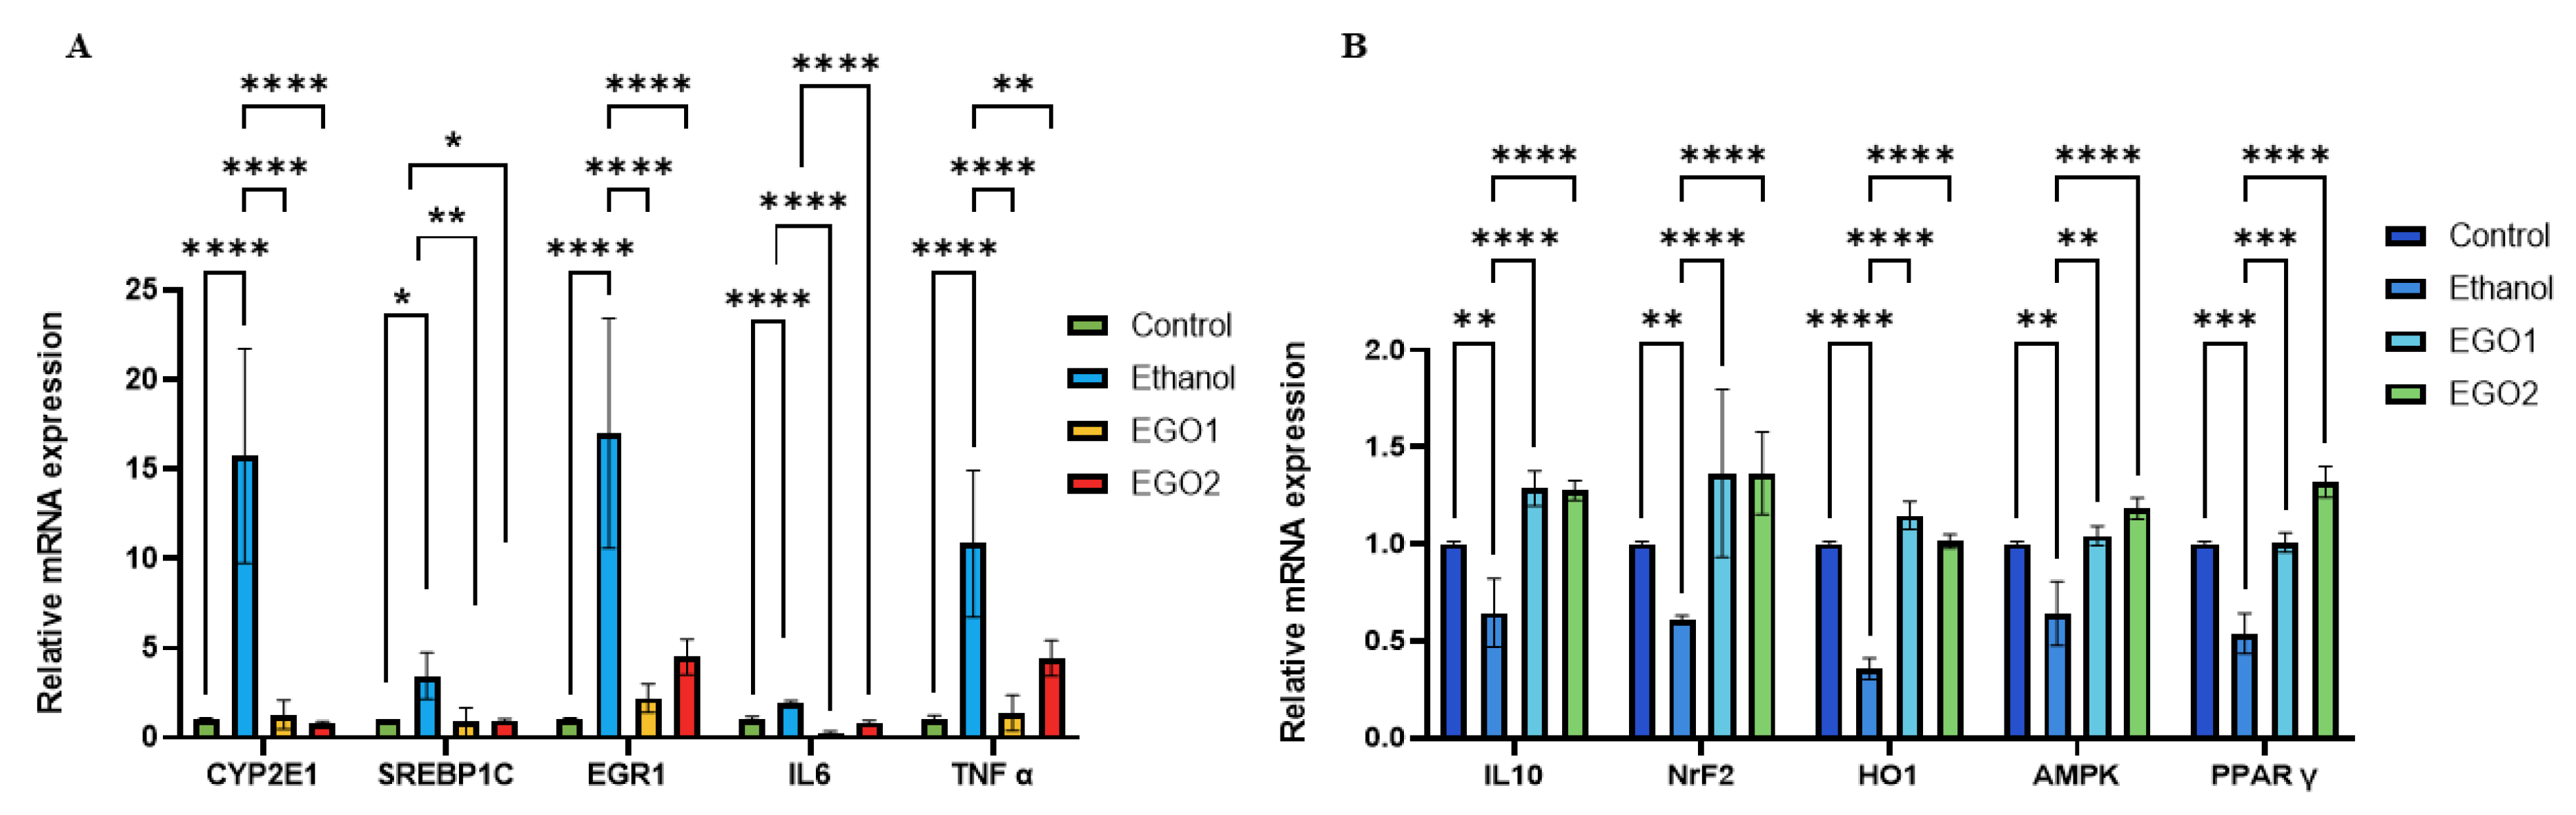
Excess ethanol in the body system causes various changes in gene expression, leading to increased inflammation. According to figure 6, treatment with ethanol in cells increases the expression of genes responsible for ROS production, fat accumulation, and inflammation, while treatment with GO decreases their expression. Additionally, ethanol downregulates lipolytic genes such as PPAR family protein, which were upregulated in the treatment group. Furthermore, ethanol increases the antioxidant activity of cells by upregulating the expression of AMPK, NrF2, and HO-1, which were downregulated due to ethanol exposure. It also increases IL10 anti-inflammatory regulation to reduce inflammation.
Ethanol-induced damage to the gut permeability results in secondary damage to the liver [28]. GO helps to restore gut permeability by upregulating the expression of tight junction proteins, which are downregulated due to ethanol exposure. Moreover, it decreases inflammation by reducing the activity of TNFα.
Figure 6.
Gene expression study was carried for both cell line. A) Proinflammatory and lipolytic gene expression fold change for HepG2 cells. B) Anti-oxidant and Anti-inflammatory gene expression fold change for HepG2 cells. C) Tight junction activity of Caco2 cells. D) proinflammatory TNFα activity in Caco2 cells. (EGO1-ethanol+10 μg/mL GO, EGO2- ethanol+50 μg/mL GO). Statistical significance were carried out by two way ANOVA followed by multiple group comparison where *p<0.05, **p<0.01, ***p<0.001 and ****p<0.0001. Values represents the mean ± SD of three individual experiments.

4. Discussion
The liver is an immunotolerant organ [27]. Disruption of this immunotolerant environment, often caused by an unhealthy lifestyle, can result in various diseases, such as non-alcoholic fatty liver disease and alcoholic liver disease, which are both associated with metabolic disorders. Prolonged and excessive alcohol consumption can have detrimental effects on the body's metabolism and immune system [28,29]. The liver is particularly susceptible to the negative impacts of alcohol, as it is responsible for metabolizing approximately 90% of ethanol [28]. In the presence of excessive amount of ethanol, metabolism occurs via MEOS pathway which include the activation of CYP2E1 and catalase. [30]. Due to activation of upregulation of CYP2E, elevation of reactive oxygen spices (ROS) also take place resulting in increased inflammation and oxidative stress [31]. Increased CYP2E1 activity, is responsible for the expression of sterol regulatory binding protein gene (SREBP1C) which in turn activates of the fatty acid synthase (FAS) and acetyl co-A carboxylase (ACC) [32]. The sterol regulatory gene is also accountable for inflammation as it enhances the activity of tumor necrosis factor (TNF α) [6].
The liver is damaged not only due to ethanol exposure but also due to gut dysbiosis. Heavy alcohol consumption alters the gut microbiota, leading to gut dysbiosis [33]. This serves as a secondary hit model. As a result of gut dysbiosis, toxins produced by the altered microbiota enter the portal vein and reach the liver, where they activate TLR4-mediated inflammation by activating liver resident Kupffer cells [34]. Heavy alcohol exposure disrupts gut permeability by affecting the tight junction activity of gut epithelial cells. Because of decreased gut permeability, toxic material or microbes can travel to other organ and induce inflammation [35]. There are various mechanisms which are known for alcohol related liver disease but very less are explored for generating therapeutic activity. There are a few medications available, but none are FDA approved.
Here, we investigated the activity of graphene oxide (GO) nanosheets, which were synthesized using the modified Hummer's method involving various chemical reactions. GO is well-known for its biocompatibility and finds applications in drug delivery, biosensors, and cancer treatment [36]. Additionally, it is recognized for its antioxidant and anti-inflammatory properties [37].
GO is synthesized using the modified Hummer's method, which does not produce any toxic gases that could be harmful to individuals [10]. Since GO primarily consists of carbon, oxygen, and hydrogen, various bonds are formed between these elements, such as carboxyl, carbonyl, and hydroxyl groups, which can be detected through FTIR peaks. Additionally, electron microscope images (Figure 1 (C) and (D)) reveal that GO nanosheets have a flaky nature and exhibit a sheet-like structure. The presence of acids during the oxidation process leads to the formation of these sheet-like structures [38]. These sheets possess a higher surface-to-volume ratio, making them particularly interesting for studying their biological activity [39].
Further in vitro studies were conducted to analyze the effects of GO on cell viability. Results showed that at a concentration of 100 μg/mL, GO exhibited 100% cell viability for both cell types. Previous research [40] has also reported that concentrations up to 40 μg/mL do not induce any toxic activity in cells. Furthermore, GO has been studied Caco2, HT29 and 3T3 cell lines and they showed cell proliferative activity [40,41,42,43]. Interestingly, in our study, it was observed that excess GO was present in the media, yet the cells remained unharmed even at higher concentrations. Additionally, the interaction of GO with cell lines was analyzed, and its anti-inflammatory and anti-oxidant activities were assessed through gene expression analysis. GO is known for its diverse range of activities, one of which is its radical scavenging ability. Studies [44] have demonstrated that GO, along with other Graphene-based materials, exhibit significant radical scavenging activity. In our study, we observed that due to exposure to ethanol, cells produced higher amounts of ROS, as shown in Figure 5. However, GO's structure and scavenging activity effectively reduced ROS production. Furthermore, GO was found to increase superoxide dismutase activity [45] resulting in decreased ROS production. This led to an increase in the antioxidant mechanisms involving AMPK, NrF2, and HO-1 in the treated cells. ROS-induced damage contributes to cellular dysfunction through various mechanisms, including apoptosis. Ethanol exposure is known to induce both apoptosis and necrosis, as depicted in Figure 3. As GO demonstrated its scavenging activity against ROS, it also mitigated cell damage. These findings suggest that GO may possess anti-apoptotic activity, which contributes to its ability to reduce oxidative stress.
As GO has shown to decrease ROS activity, it also has a positive effect on lipolysis. Several carbon-based materials with graphene as their core structure have been found to exhibit lipolytic activity. In a recent study [46], the researchers observed lipolysis activity in a graphene-based material and concluded that the presence of graphene as the core structure contributes to significant lipolytic activity by binding with adipocyte integrin β1. Similarly, in the current study, GO demonstrated the downregulation of SREBP1C, a key regulator of lipid accumulation. Through gene expression analysis and Oil Red O staining, it can be inferred that ethanol-treated cells experienced increased lipid accumulation due to heightened SREBP1C activity. However, when the cells were treated with a graphene-based material, the lipid accumulation was reduced. Moreover, the activity of SREBP1C was found to be influenced by CYP2E1, and it displayed a negative correlation with genes from the PPAR family [47]. In ethanol-treated HepG2 cells, CYP2E1 expression was found to be increased, which subsequently led to an increase in SREBP1C activity. Nevertheless, in the treated cells, the expression of CYP2E1 was decreased, contributing to enhanced ROS scavenging activity.
SREBP1C is also responsible for inflammation through the activation of TNFα [48]. During lipolysis, potential mechanisms for anti-inflammation are also activated. In terms of gene expression, the activity of IL6 and TNFα decreased when cells were treated with GO along with ethanol. This decrease in TNFα activity also contributes to barrier function. It has been reported that Graphene-based materials are safe and aid in maintaining blood barrier integrity [49]. Similarly, in the Caco2 cell line, GO demonstrated increased expression of TJ proteins such as ZO-1, claudin, and occludin. Together, these proteins contribute to gut permeability and protect against ethanol-induced damage.
In summary, it can be stated that the structural composition of GO grants it the potential to serve as a scavenging material, aiding in the reduction of ROS accumulation. This, in turn, contributes to the downregulation of proinflammatory cytokines and the upregulation of anti-inflammatory cytokines such as IL10. Additionally, GO has displayed lipolytic activity, which facilitates the decrease in SREBP1C expression. Moreover, it plays a role in the maintenance of TJ and provides protection against secondary damage.
5. Conclusions
Alcohol-related liver disease is a major contributor to chronic liver diseases globally and is associated with a higher mortality rate. In this study, we aim to investigate the potential of GO in ameliorating the gut-liver axis. GO is widely recognized for its biocompatibility and has been extensively studied in various fields. In this research, we assessed its effectiveness against an in vitro model of alcohol-related liver disease. The results demonstrated that GO exhibited a protective effect by effectively scavenging radicals and promoting lipolysis, both of which are crucial for mitigating the disease. Additionally, gene expression analysis validated the protective properties of GO. These findings indicate that GO holds promise as a drug delivery agent or nanoformulation for enhancing disease amelioration.
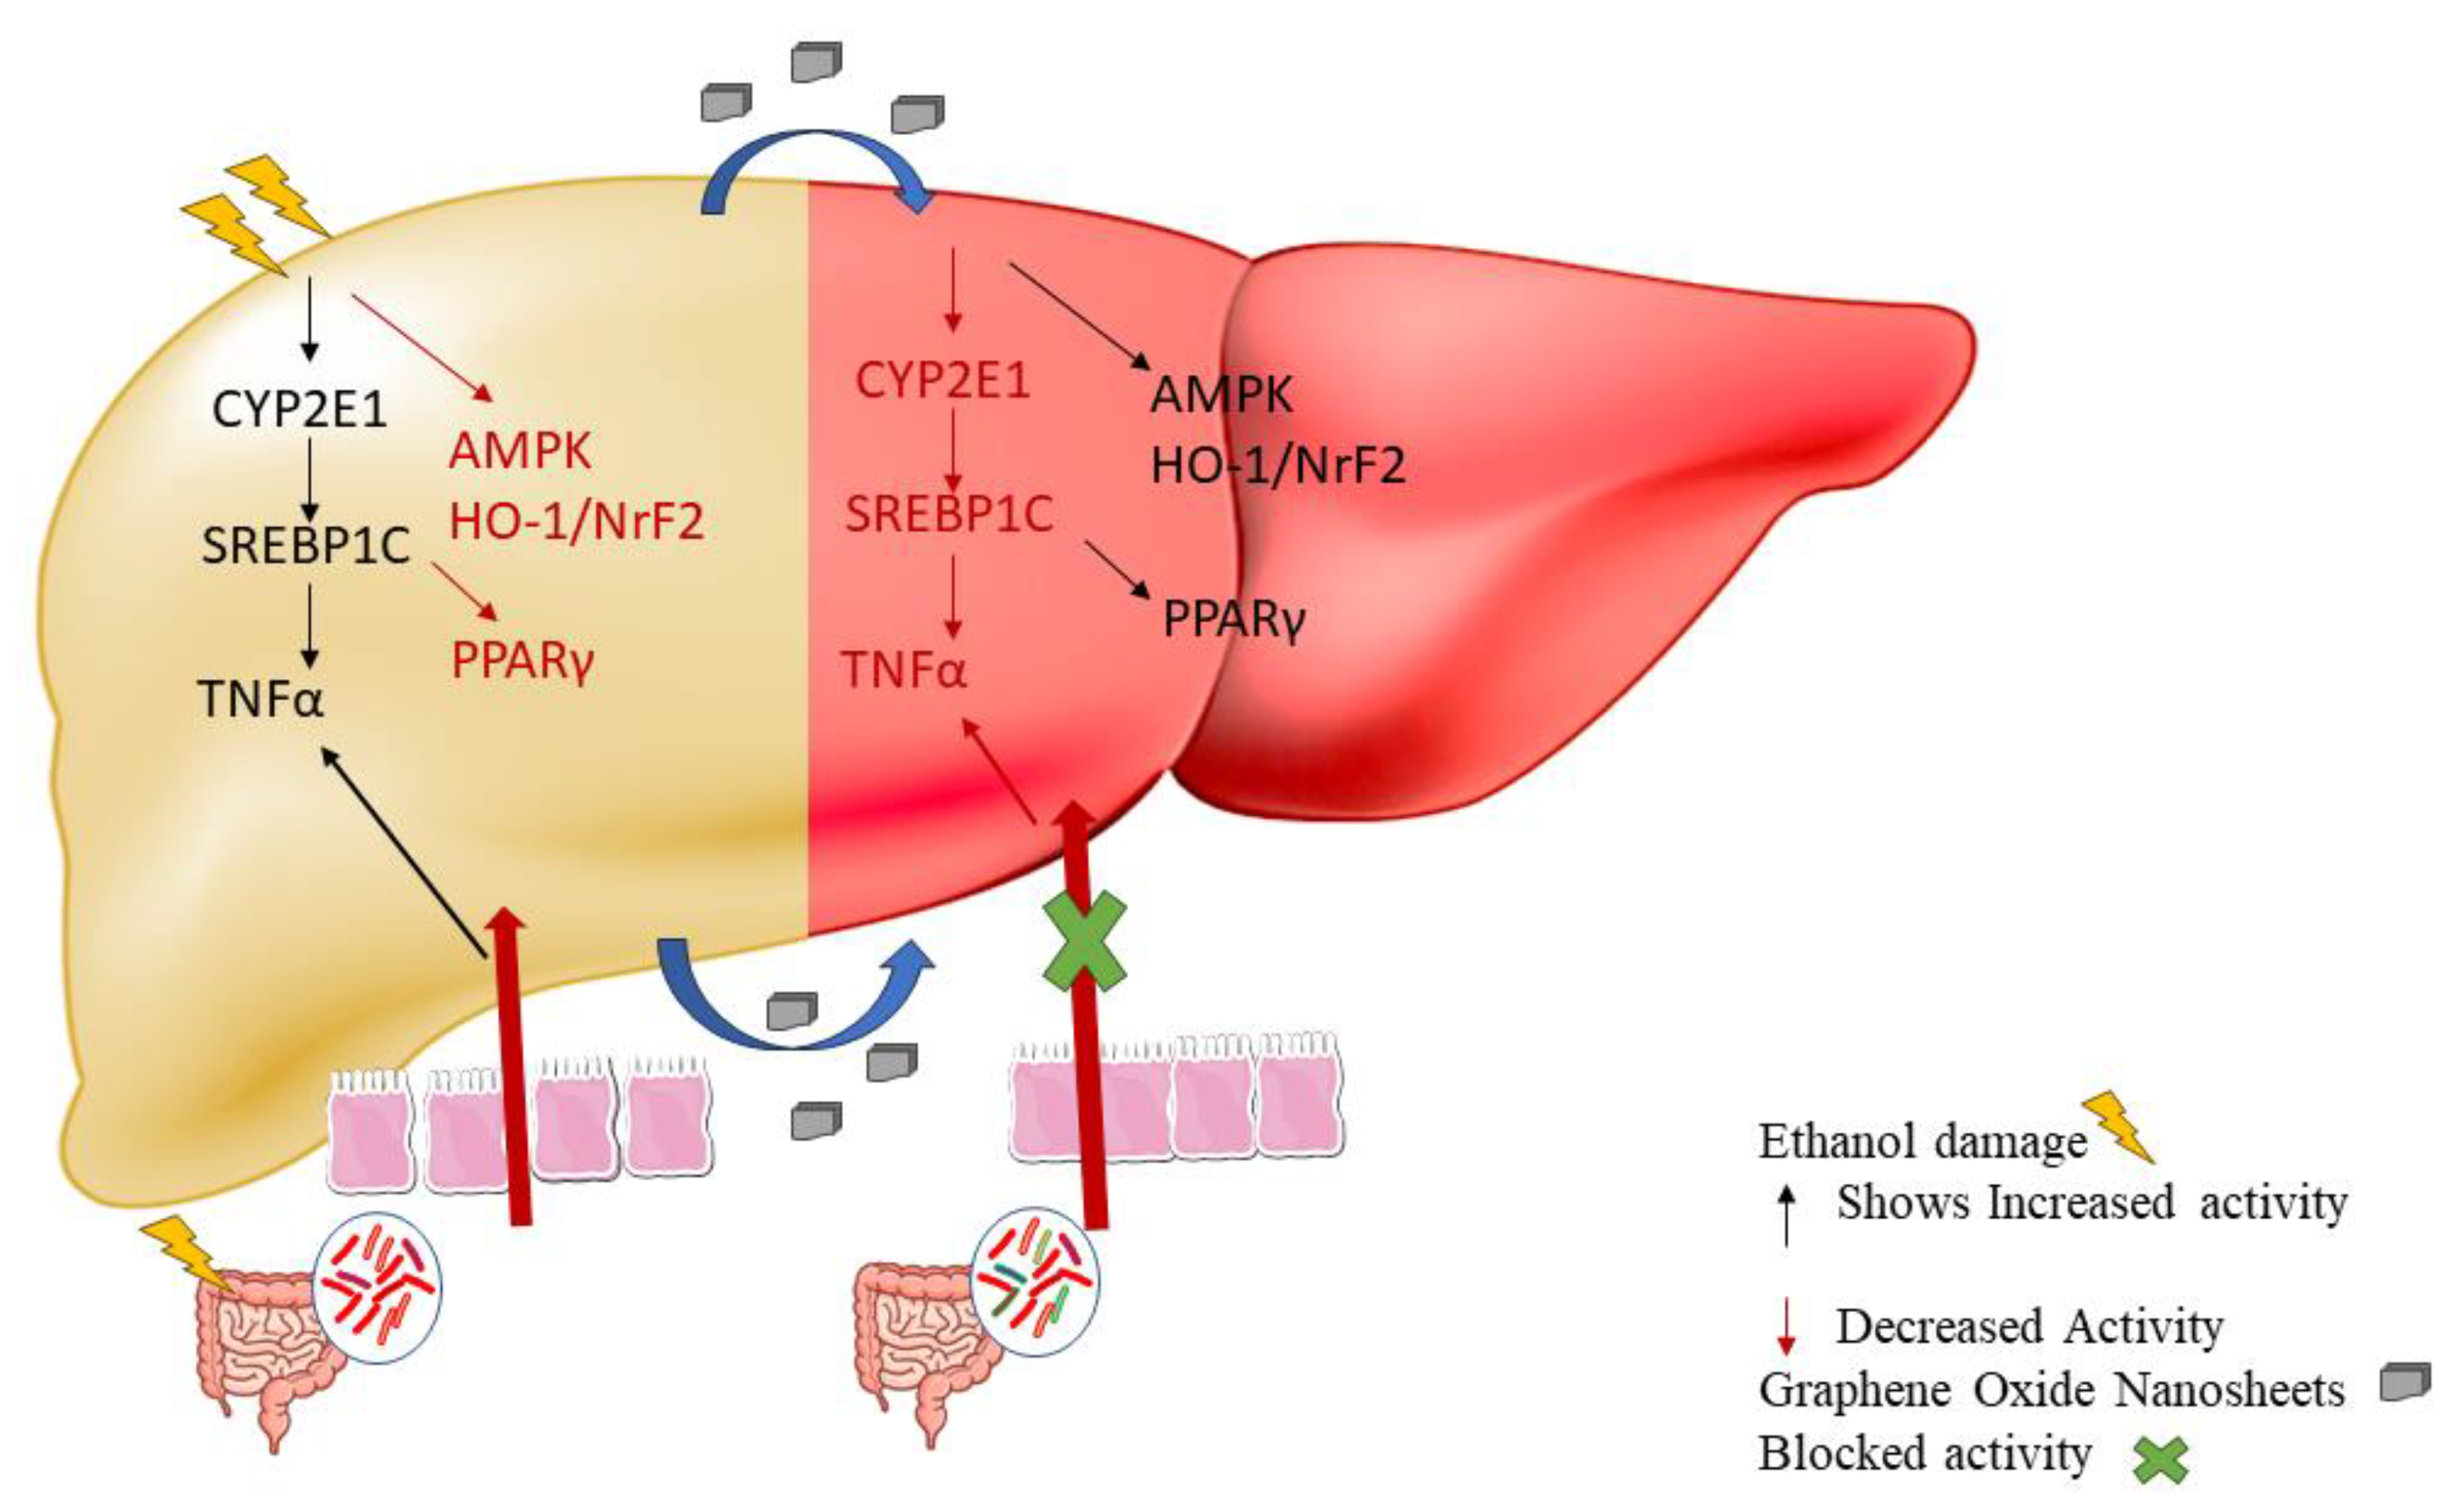
Figure 7.
Possible protective mechanism of GO for ALD.
Author Contributions
HA: Conceptualization, Data curation, Formal analysis; HA and PC: Investigation, Methodology, PM: Project administration, Resources, Supervision; HA and PC: Validation, Visualization; HA: Writing – original draft; PC and PM: Writing – review & editing. All authors have read and approved the article.
Funding
This research received no external funding.
Institutional Review Board Statement
Not Applicable
Informed Consent Statement
Not Applicable
Data Availability Statement
Data would be provided on request.
Acknowledgments
Authors would like to acknowledge Gujarat gov. Fellowship SHODH for financial support and Charotar university of science and technology for conducting the experimental work. Authors would also like to acknowledge IIT Gandhinagar Dr. Vijay Thiruvenkatam for SEM images.
Conflicts of Interest
The authors declare no conflicts of interest.
References
- Niu X, Zhu L, Xu Y, Zhang M, Hao Y, Ma L, et al. Global prevalence, incidence, and outcomes of alcohol related liver diseases: a systematic review and meta-analysis. BMC Public Health. 2023 Dec 1;23(1). [CrossRef]
- Aghara H, Chadha P, Zala D, Mandal P. Stress mechanism involved in the progression of alcoholic liver disease and the therapeutic efficacy of nanoparticles. Front Immunol. 2023;14. [CrossRef]
- Zhu L, Wang Y, Pan CQ, Xing H. Gut microbiota in alcohol-related liver disease: pathophysiology and gut-brain cross talk. Vol. 14, Frontiers in Pharmacology. 2023. [CrossRef]
- Subramaniyan V, Chakravarthi S, Jegasothy R, Seng WY, Fuloria NK, Fuloria S, et al. Alcohol-associated liver disease: A review on its pathophysiology, diagnosis and drug therapy. Vol. 8, Toxicology Reports. 2021. [CrossRef]
- Yoon EL, Kim W. Current and future treatment for alcoholic-related liver diseases. Vol. 38, Journal of Gastroenterology and Hepatology (Australia). 2023. [CrossRef]
- Osna, N.A.; Donohue, T.M.; Kharbanda, K.K. Alcoholic Liver Disease: Pathogenesis and Current Management. Alcohol research 2017, 38, 147–161. [Google Scholar]
- Zhao R, Zhu M, Zhou S, Feng W, Chen H. Rapamycin-Loaded mPEG-PLGA Nanoparticles Ameliorate Hepatic Steatosis and Liver Injury in Non-alcoholic Fatty Liver Disease. Front Chem. 2020;8. [CrossRef]
- Hu R, Liu S, Anwaier G, Wang Q, Shen W, Shen Q, et al. Formulation and intestinal absorption of naringenin loaded nanostructured lipid carrier and its inhibitory effects on nonalcoholic fatty liver disease. Nanomedicine [Internet]. 2021 Feb;32:102310. Available from: https://linkinghub.elsevier.com/retrieve/pii/S1549963420301647. [CrossRef]
- Lai WF, Wong WT. Use of graphene-based materials as carriers of bioactive agents. Vol. 16, Asian Journal of Pharmaceutical Sciences. 2021. [CrossRef]
- Marcano DC, Kosynkin D V., Berlin JM, Sinitskii A, Sun Z, Slesarev A, et al. Improved synthesis of graphene oxide. ACS Nano. 2010;4(8). [CrossRef]
- Habte AT, Ayele DW, Hu M. Synthesis and Characterization of Reduced Graphene Oxide (rGO) Started from Graphene Oxide (GO) Using the Tour Method with Different Parameters. Advances in Materials Science and Engineering. 2019;2019. [CrossRef]
- Nasirzadeh N, Azari MR, Rasoulzadeh Y, Mohammadian Y. An assessment of the cytotoxic effects of graphene nanoparticles on the epithelial cells of the human lung. Toxicol Ind Health. 2019;35(1). [CrossRef]
- Cummings BS, Schnellmann RG. Measurement of Cell Death in Mammalian Cells. Curr Protoc Pharmacol. 2004 Jun;25(1). [CrossRef]
- Liu K, Liu P cheng, Liu R, Wu X. Dual AO/EB staining to detect apoptosis in osteosarcoma cells compared with flow cytometry. Med Sci Monit Basic Res. 2015;21. [CrossRef]
- Kasibhatla S, Amarante-Mendes GP, Finucane D, Brunner T, Bossy-Wetzel E, Green DR. Acridine Orange/Ethidium Bromide (AO/EB) Staining to Detect Apoptosis. Cold Spring Harb Protoc. 2006;2006(3). [CrossRef]
- Rubin, E.; Rottenberg, H. Ethanol-induced injury and adaptation in biological membranes. Federation Proceedings 1982, 41, 2465–2471. [Google Scholar]
- Kema VH, Khan I, Jamal R, Vishwakarma SK, Lakki Reddy C, Parwani K, et al. Protective Effects of Diallyl Sulfide Against Ethanol-Induced Injury in Rat Adipose Tissue and Primary Human Adipocytes. Alcohol Clin Exp Res. 2017;41(6). [CrossRef]
- Patel F, Parwani K, Patel D, Mandal P. Metformin and Probiotics Interplay in Amelioration of Ethanol-Induced Oxidative Stress and Inflammatory Response in an in Vitro and in Vivo Model of Hepatic Injury. Mediators Inflamm. 2021;2021. [CrossRef]
- Karbowski M, Kurono C, Wozniak M, Ostrowski M, Teranishi M, Nishizawa Y, et al. Free radical-induced megamitochondria formation and apoptosis. Free Radic Biol Med. 1999;26(3–4). [CrossRef]
- Emiru TF, Ayele DW. Controlled synthesis, characterization and reduction of graphene oxide: A convenient method for large scale production. Egyptian Journal of Basic and Applied Sciences. 2017;4(1). [CrossRef]
- Surekha G, Krishnaiah KV, Ravi N, Padma Suvarna R. FTIR, Raman and XRD analysis of graphene oxide films prepared by modified Hummers method. In: Journal of Physics: Conference Series. 2020. [CrossRef]
- Khalili, D. Graphene oxide: A promising carbocatalyst for the regioselective thiocyanation of aromatic amines, phenols, anisols and enolizable ketones by hydrogen peroxide/KSCN in water. New Journal of Chemistry. 2016;40(3). [CrossRef]
- Rhazouani A, Gamrani H, El Achaby M, Aziz K, Gebrati L, Uddin MS, et al. Synthesis and Toxicity of Graphene Oxide Nanoparticles: A Literature Review of in Vitro and in Vivo Studies. Vol. 2021, BioMed Research International. 2021. [CrossRef]
- Rattana T, Chaiyakun S, Witit-Anun N, Nuntawong N, Chindaudom P, Oaew S, et al. Preparation and characterization of graphene oxide nanosheets. In: Procedia Engineering. 2012. [CrossRef]
- Oh, W.C.; Zhang, F.J. Preparation and characterization of graphene oxide reduced from a mild chemical method. Asian Journal of Chemistry 2011, 23, 875–879. [Google Scholar]
- Ribble D, Goldstein NB, Norris DA, Shellman YG. A simple technique for quantifying apoptosis in 96-well plates. BMC Biotechnol. 2005;5. [CrossRef]
- Wang QX, Ma X. Liver: a unique immune organ. Zhonghua Gan Zang Bing Za Zhi. 2021;29(6). [CrossRef]
- Kong LZ, Chandimali N, Han YH, Lee DH, Kim JS, Kim SU, et al. Pathogenesis, early diagnosis, and therapeutic management of alcoholic liver disease. Vol. 20, International Journal of Molecular Sciences. 2019. [CrossRef]
- Sarkar, D.; Jung, M.K.; Wang, H.J. Alcohol and the immune system. Alcohol Research: Current Reviews 2015, 37, 153. [Google Scholar]
- Seitz HK, Bataller R, Cortez-Pinto H, Gao B, Gual A, Lackner C, et al. Alcoholic liver disease. Vol. 4, Nature Reviews Disease Primers. Nature Publishing Group; 2018. [CrossRef]
- Wu D, Cederbaum AI. Oxidative stress and alcoholic liver disease. Vol. 29, Seminars in Liver Disease. 2009. [CrossRef]
- Moslehi A, Hamidi-Zad Z. Role of SREBPs in liver diseases: A mini-review. Vol. 6, Journal of Clinical and Translational Hepatology. 2018. [CrossRef]
- Jung JH, Kim SE, Suk KT, Kim DJ. Gut microbiota-modulating agents in alcoholic liver disease: Links between host metabolism and gut microbiota. Vol. 9, Frontiers in Medicine. Frontiers Media S.A.; 2022. [CrossRef]
- Slevin E, Baiocchi L, Wu N, Ekser B, Sato K, Lin E, et al. Kupffer Cells: Inflammation Pathways and Cell-Cell Interactions in Alcohol-Associated Liver Disease. Vol. 190, American Journal of Pathology. 2020. [CrossRef]
- Milosevic I, Vujovic A, Barac A, Djelic M, Korac M, Spurnic AR, et al. Gut-liver axis, gut microbiota, and its modulation in the management of liver diseases: A review of the literature. Vol. 20, International Journal of Molecular Sciences. 2019. [CrossRef]
- Priyadarsini S, Mohanty S, Mukherjee S, Basu S, Mishra M. Graphene and graphene oxide as nanomaterials for medicine and biology application. Vol. 8, Journal of Nanostructure in Chemistry. 2018. [CrossRef]
- Di Mauro G, Amoriello R, Lozano N, Carnasciali A, Guasti D, Becucci M, et al. Graphene Oxide Nanosheets Reduce Astrocyte Reactivity to Inflammation and Ameliorate Experimental Autoimmune Encephalomyelitis. ACS Nano. 2023;17(3). [CrossRef]
- Aliyev E, Filiz V, Khan MM, Lee YJ, Abetz C, Abetz V. Structural characterization of graphene oxide: Surface functional groups and fractionated oxidative debris. Nanomaterials. 2019;9(8). [CrossRef]
- Bellier N, Baipaywad P, Ryu N, Lee JY, Park H. Recent biomedical advancements in graphene oxide- and reduced graphene oxide-based nanocomposite nanocarriers. Vol. 26, Biomaterials Research. 2022. [CrossRef]
- Kucki M, Diener L, Bohmer N, Hirsch C, Krug HF, Palermo V, et al. Uptake of label-free graphene oxide by Caco-2 cells is dependent on the cell differentiation status. J Nanobiotechnology. 2017;15(1). [CrossRef]
- Qi W, Xue Z, Yuan W, Wang H. Layer-by-layer assembled graphene oxide composite films for enhanced mechanical properties and fibroblast cell affinity. J Mater Chem B. 2014;2(3). [CrossRef]
- Cebadero-Domínguez O, Ferrández-Gómez B, Sánchez-Ballester S, Moreno J, Jos A, Cameán AM. In vitro toxicity evaluation of graphene oxide and reduced graphene oxide on Caco-2 cells. Toxicol Rep. 2022;9. [CrossRef]
- Ruiz ON, Fernando KAS, Wang B, Brown NA, Luo PG, McNamara ND, et al. Graphene oxide: a nonspecific enhancer of cellular growth. ACS Nano. 2011;5(10). [CrossRef]
- Qiu Y, Wang Z, Owens ACE, Kulaots I, Chen Y, Kane AB, et al. Antioxidant chemistry of graphene-based materials and its role in oxidation protection technology. Nanoscale. 2014;6(20). [CrossRef]
- Patlolla AK, Randolph J, Kumari SA, Tchounwou PB. Toxicity evaluation of graphene oxidein kidneys of sprague-dawley rats. Int J Environ Res Public Health. 2016;13(4). [CrossRef]
- de Frutos S, Griera M, Lavín-López M del P, Martínez-Rovira M, Martínez-Rovira JA, Rodríguez-Puyol M, et al. A new graphene-based nanomaterial increases lipolysis and reduces body weight gain through integrin linked kinase (ILK). Biomater Sci. 2023;11(14). [CrossRef]
- Zhang Y, Yan T, Wang T, Liu X, Hamada K, Sun D, et al. Crosstalk between CYP2E1 and PPARα substrates and agonists modulate adipose browning and obesity. Acta Pharm Sin B. 2022. [CrossRef]
- Thomes PG, Osna NA, Davis JS, Donohue TM. Cellular steatosis in ethanol oxidizing-HepG2 cells is partially controlled by the transcription factor, early growth response-1. International Journal of Biochemistry and Cell Biology. 2013;45(2). [CrossRef]
- Castagnola V, Deleye L, Podestà A, Jaho E, Loiacono F, Debellis D, et al. Interactions of Graphene Oxide and Few-Layer Graphene with the Blood-Brain Barrier. Nano Lett. 2023;23(7). [CrossRef]
Disclaimer/Publisher’s Note: The statements, opinions and data contained in all publications are solely those of the individual author(s) and contributor(s) and not of MDPI and/or the editor(s). MDPI and/or the editor(s) disclaim responsibility for any injury to people or property resulting from any ideas, methods, instructions or products referred to in the content. |
© 2024 by the authors. Licensee MDPI, Basel, Switzerland. This article is an open access article distributed under the terms and conditions of the Creative Commons Attribution (CC BY) license (http://creativecommons.org/licenses/by/4.0/).
Copyright: This open access article is published under a Creative Commons CC BY 4.0 license, which permit the free download, distribution, and reuse, provided that the author and preprint are cited in any reuse.


