Submitted:
25 April 2024
Posted:
25 April 2024
You are already at the latest version
Abstract
Approximately 30% of steroid-resistant nephrotic syndromes are attributed to monogenic disorders that involve 27 genes. Mutations in KANK family members have also been linked to nephrotic syndrome; however, the precise mechanism remains elusive. To investigate this, podocyte-specific Kank1 knockout mice were generated to examine phenotypic changes. In the initial assessment under normal conditions, Kank1 knockout mice showed no significant differences in the urinary albumin-creatinine ratio, blood urea nitrogen, serum creatinine levels, or histological features compared to controls. However, following kidney injury with adriamycin, podocyte-specific Kank1 knockout mice exhibited a significantly higher albumin-creatinine ratio and a significantly greater sclerotic index than control mice. Electron microscopy revealed more extensive foot process effacement in the knockout mice than in control mice. In addition, KANK1-deficient human podocytes showed increased detachment and apoptosis following adriamycin exposure. These findings suggest that KANK1 may play a protective role in mitigating podocyte damage under pathological conditions.
Keywords:
adriamycin
; albuminuria
; apoptosis
; KANK1
; nephrotic syndrome
; podocyte
1. Introduction
Nephrotic syndrome (NS) is characterized by massive proteinuria, hypoalbuminemia, and systemic edema [1] and is categorized into steroid-sensitive NS (SSNS) and steroid-resistant NS (SRNS). Notably, approximately 50% of SRNS cases progress to end-stage renal disease within 15 years [2]. Clinically, SRNS often presents as focal segmental glomerulosclerosis (FSGS), with genetic factors implicated in 5%-10% of adult cases. [3]. Recent studies have identified that nearly 30% of SRNS cases result from mutations in 1 of 27 specific genes [4]. With advancements in next-generation sequencing (NGS), the discovery of additional related genes is anticipated. For instance, KANK1, KANK2, and KANK4 have been associated with NS [5], despite not being among the 27 previously identified genes [4].
KANK1, known as the KN motif and ankyrin repeat domain 1, has been recognized as a tumor suppressor gene in renal cell carcinoma [6]. The KANK family, which encompasses KANK1 through KANK4, is characterized by the presence of KN motifs, coiled-coil domains, and ankyrin repeat domains (ANKRDs) [7,8]. KANK1 is predominantly cytoplasmic and plays a pivotal role in the organization of the actin cytoskeleton [9], cell polarity [10], and focal adhesions [11,12,13]. KANK1 exists in two isoforms; the longer variant is tissue-specific, with predominant expression in the heart and kidneys [14]. KANK1 has been identified as 1 of the 677 genes significantly enriched in human glomeruli [15].
Recent research has linked KANK1 gene with nephrotic syndrome [5]. Although Kank1 RNAi mice exhibited a tendency towards proteinuria, the results were not statistically significant [16]. Given the conservation of the gene between humans and zebrafish, a kank1 knockout zebrafish model was developed, featuring a C-to-T point mutation in exon 3 of the kank1 gene. The dye filtration assay in zebrafish has proven to be an effective tool for examining glomerular permeability [17,18]. In preliminary experiments using this model, 500 kDa fluorescein isothiocyanate (FITC)- and 10 kDa rhodamine-conjugated dextran were injected into kank1 knockout or wild-type (WT) zebrafish embryos. The kank1 knockout group displayed the uptake of 500 kDa dextran in the proximal tubule, unlike the WT group. Based on this observation, we hypothesized that podocyte-specific Kank1 inactivation in mice might manifest as a kidney phenotype.
2. Results
2.1. KANK1 Protein Is Expressed in Both Human and Mouse Podocytes
- Co-immunofluorescence studies on frozen human kidney sections revealed that KANK1 was localized in the glomeruli, exhibiting co-localization with the podocyte-specific protein NPHS1 (Figure 1a). In addition, KANK1 expression was observed in the tubular basement membranes, albeit with minimal co-localization with SGLT2, a protein present in the brush borders of the proximal tubules (Supplementary Figure S1). In mouse models, KANK1 expression was similarly observed in the glomeruli, where it co-localized with the podocyte-specific protein SYNPO (Figure 1b).
2.2. Kank1 was Successfully Knocked out in Mouse Podocytes
Kank1 was engineered to contain loxP sites in the 5th and 9th introns of Kank1 (Figure 2a). To specifically target and remove exons 6-9 in podocytes, we used mice carrying the podocin-Cre (pod-CreTg/+) gene. By crossing Kank1 flox/flox (Kank1fl/fl) mice with pod-CreTg/+ mice, we generated offspring using various combinations of these genes, including Kank1fl/fl, Kank1fl/flpod-CreTg/+, and Kank1+/+pod-CreTg/+ mice. The resulting genotypes were discerned by distinct band patterns during genotyping: Kank1+/+pod-CreTg/+ mice exhibited a 459-bp band, while Kank1fl/fl and Kank1fl/flpod-CreTg/+ mice displayed a 587-bp band (Figure 2b). Notably, a 102-bp band was present in Kank1+/+pod-CreTg/+ and Kank1fl/flpod-CreTg/+ mice but absent in Kank1fl/fl mice (Figure 2b). Subsequent real-time polymerase chain reaction (PCR) revealed a marked reduction in Kank1 mRNA expression in the glomeruli of Kank1fl/flpod-CreTg/+ mice compared to Kank1fl/fl counterparts (0.14 ± 0.05 vs. 1.28 ± 0.26, P = 0.0001, Figure 2c). Western blotting corroborated these findings, showing undetectable KANK1 protein levels in the Kank1fl/flpod-CreTg/+ group (Figure 2d). Supplementary Figure S2 shows full blots. Immunofluorescence of frozen mouse kidney sections confirmed the diminished expression of KANK1 in the glomeruli of Kank1fl/flpod-CreTg/+ mice, in stark contrast to the clear expression observed in the Kank1+/+pod-CreTg/+ and Kank1fl/fl groups (Figure 2e).
2.3. The Inactivation of Kank1 in Podocytes at Two or Six Months Old Did Not Result in Albuminuria
At two months old, the urinary albumin-creatinine ratio (ACR) was consistent across the Kank1+/+pod-CreTg/+, Kank1fl/fl, and Kank1fl/flpod-CreTg/+ groups (Figure 3a). Similarly, no notable differences were observed in the blood urea nitrogen (BUN) or serum creatinine (Cr) levels among the groups (Figure 3b). However, the sclerotic index was significantly higher in the Kank1fl/flpod-CreTg/+ group than in the Kank1fl/fl group (0.59 ± 0.15 vs. 0.34 ± 0.08, P = 0.0201), with no marked difference when compared to the Kank1+/+pod-CreTg/+ group (Figure 3c). The fibrotic index showed no significant differences among the three groups (Figure 3c). In addition, an electron microscopic analysis revealed no significant disparities between the groups at this age (Figure 3d).
At six months old, the urinary ACR remained stable in the Kank1fl/flpod-CreTg/+ group compared to that in the Kank1fl/fl group (Supplementary Figure S3a). Similarly, there was no significant difference in BUN or Cr levels between Kank1fl/fl and Kank1fl/flpod-CreTg/+ mice at six months old (Supplementary Figure S3b). However, both sclerotic (0.86 ± 0.41 vs. 0.31 ± 0.25, P = 0.0181) and fibrotic (0.19 ± 0.11 vs. 0.08 ± 0.03, P = 0.0433) indices were significantly higher in the Kank1fl/flpod-CreTg/+ group than in the Kank1fl/fl group (Supplementary Figure S3c).
2.4. The Inactivation of Kank1 in Podocytes at One Year Old Did Not Result in Abnormalities in Urine, Blood, or Histological Tests
At one year old, the urinary ACR showed no significant difference between the Kank1fl/fl and Kank1fl/flpod-CreTg/+ groups (Figure 4a). Similarly, BUN and Cr levels were comparable between the two groups at this age (Figure 4b). There was no significant difference in sclerotic or fibrotic indices between the two groups (Figure 4c). Furthermore, electron microscopic analysis revealed no notable disparities in the results between the groups (Figure 4d).
2.5. Compensation by Other Members of the Kank Family Was Not Evident in Podocyte-Specific Kank1 Knockout Mice
One possible explanation for the observed outcomes under normal conditions is that compensatory mechanisms from other members of the Kank family, specifically Kank2, Kank3, and Kank4, may mitigate phenotypic effects in the Kank1fl/flpod-CreTg/+ group. However, real-time PCR analyses conducted on the glomeruli of Kank1fl/flpod-CreTg/+ mice yielded results consistent with those obtained from Kank1fl/fl mice (Figure 5a–c).
2.6. Albuminuria and Glomerular Sclerosis Evident in Podocyte-Specific Kank1 Knockout Mice under Pathological Conditions
To investigate potential phenotypic differences under disease conditions, we induced kidney injury in adriamycin-treated mice. Following a two-week period post-administration, we observed a significant increase in the urinary ACR in the Kank1fl/flpod-CreTg/+ group compared to the Kank1fl/fl group. The logarithmic urinary ACR was also significantly higher in the Kank1fl/flpod-CreTg/+ group than in the Kank1fl/fl group (7.4 ± 1.1 vs. 5.5 ± 0.8, P = 0.0157; Figure 6a). No significant differences were detected in BUN or Cr levels between the two groups (Figure 6b). Post-adriamycin treatment, the sclerotic index was significantly elevated in the Kank1fl/flpod-CreTg/+ group compared to the Kank1fl/fl group (0.46 ± 0.09 vs. 0.29 ± 0.04, P = 0.0056), although the fibrotic index showed no significant difference (Figure 6c). An electron microscopic analysis revealed a marked decrease in the density of foot processes per micrometer of glomerular basement membranes in the Kank1fl/flpod-CreTg/+ group relative to the Kank1fl/fl group (1.00 ± 0.18 vs. 1.50 ± 0.15, P = 0.0051; Figure 6d).
2.7. Generation of Human Immortalized KANK1 Knockout (KANK1KO) Podocyte Cell Line
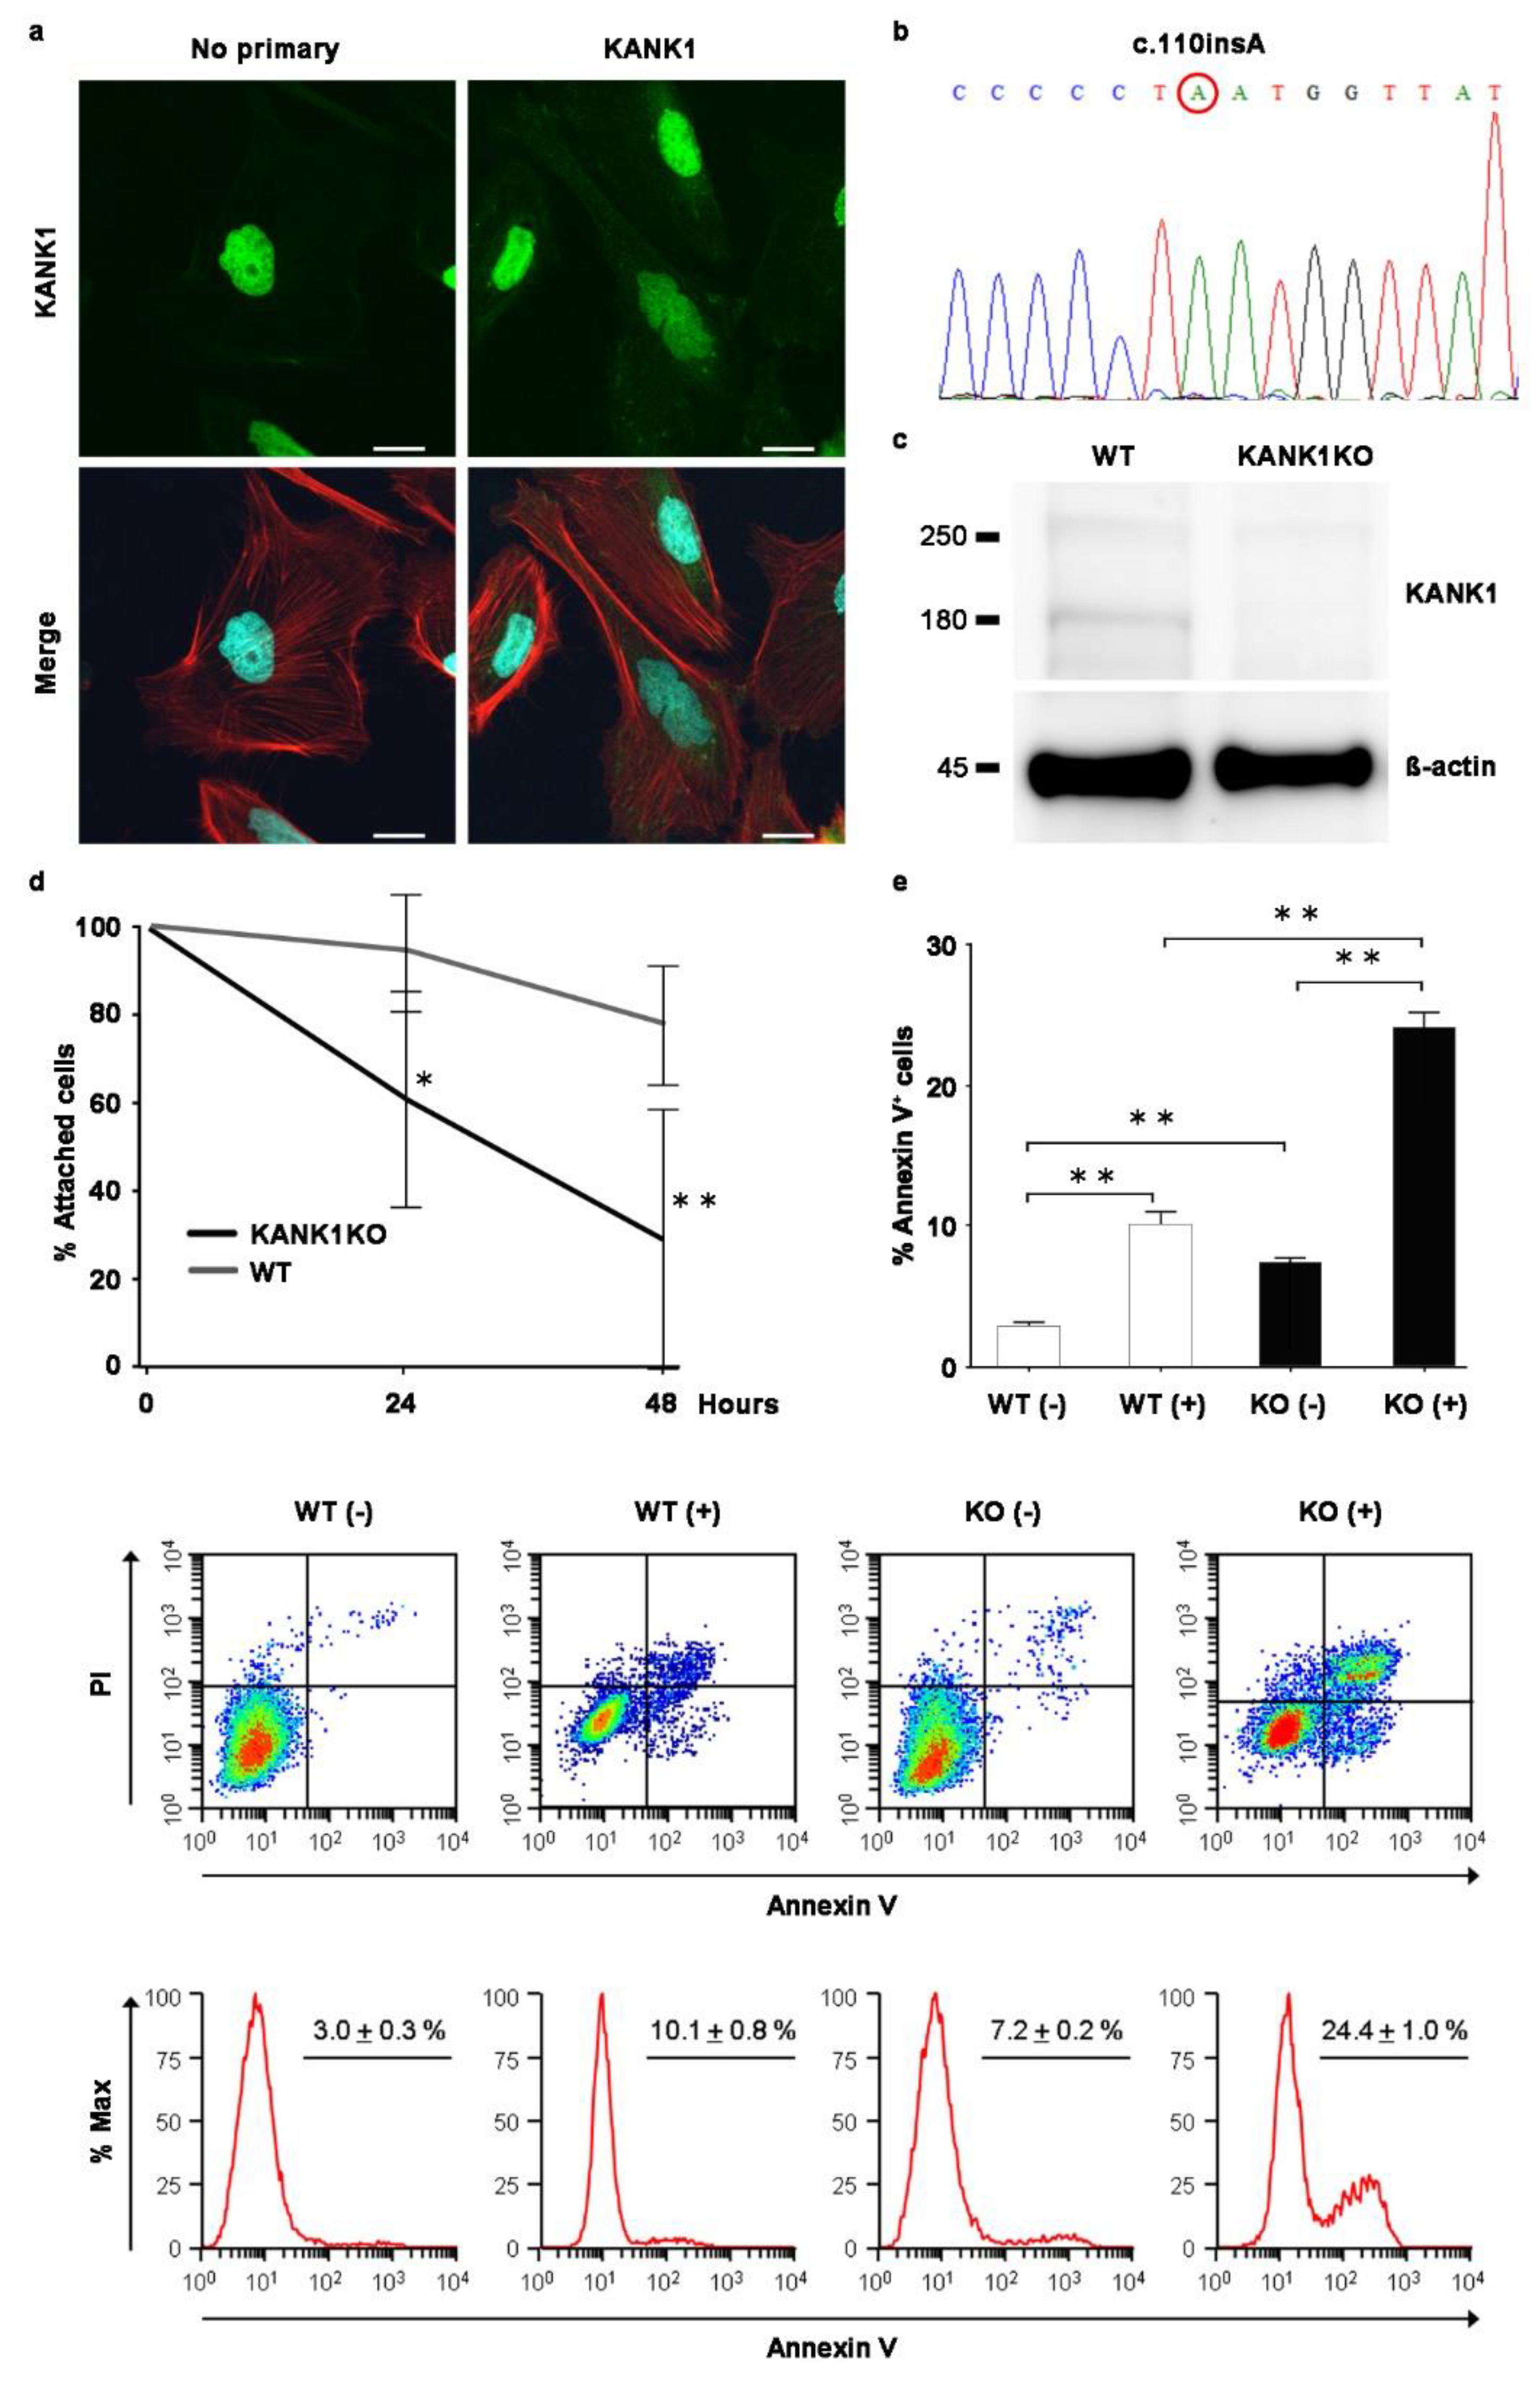
The observation of a link between Kank1 deficiency and kidney dysfunction in a mouse model prompted us to establish an in vitro human KANK1KO podocyte model. We investigated whether or not similar effects occurred in KANK1-deficient human podocytes. Rhodamine–phalloidin staining revealed KANK1 protein localization in the podocyte cytoplasm, specifically at the actin fiber edges (Figure 7a). Despite the nonspecific presence of nuclear stain, even without the primary KANK1 antibody, CRISPR-Cas9 technology facilitated the development of a KANK1KO podocyte cell line. This revealed a homozygous insertion (c.110 ins A) in exon 2 of KANK1, leading to a frameshift, premature stop codon, and truncated p.Y37* protein (Figure 7b). In KANK1KO podocytes, KANK1 protein expression at approximately 180 kDa was undetectable, unlike the visible band in WT podocytes (Figure 7c). Supplementary Figure S4 shows the full blot. Following adriamycin treatment, KANK1KO podocytes exhibited a significant reduction in cell attachment and an increase in apoptosis compared to WT podocytes (Figure 7d, e), emphasizing the protective role of the gene against podocyte injury.
3. Discussion
In this study, we successfully demonstrated the suppression of the Kank1 gene in podocytes at both the mRNA and protein levels using podocyte-specific Kank1 knockout mice. KANK1 protein, which co-localizes with podocyte-specific markers in humans, was confirmed to be expressed in podocytes. Its localization coincided with that of actin fiber markers, consistent with previous findings of its association with the actin cytoskeleton [9]. Under normal conditions, no notable phenotypic alterations were detected in podocyte-specific Kank1 knockout mice up one year old, which is consistent with another report of the Kank1 knockout mouse model [19]. However, following adriamycin-induced renal injury, the mice manifested a pronounced elevation in the urinary ACR and sclerotic index relative to controls. In addition, human KANK1KO podocytes displayed an increased propensity for detachment and apoptosis following adriamycin exposure. Overall, these findings highlight KANK1's potential as a protective factor against podocyte injury in disease states.
In the mouse models developed in this study, the omission of exon 6-9 in Kank1 led to a frameshift mutation, resulting in a premature stop codon. Consequently, the KANK1 protein was truncated, reducing its length from 1360 to 1052 amino acids, and lacking 5 ANKRDs. Recent studies have elucidated the function of ANKRDs [20], and loss of the domain function can lead to the results in the present study. Previous research has indicated that a singular rare variant in KANK1 and three in KANK2 were associated with minimal change nephrotic syndrome (MCNS), while two rare variants in KANK4 were linked to FSGS, [5] aligning with the mild phenotype observed in podocyte-specific Kank1 knockout mice. In addition, a study on Kank1 RNAi mice reported no significant increase in proteinuria [16], corroborating our findings. Although KANK1 may not be a direct causative factor, the results of the present study suggest that KANK1 can contribute to albuminuria.
In light of previous research suggesting that adriamycin exposure results in certain phenotypes [21], we administered this compound to both Kank1fl/flpod-CreTg/+ and Kank1fl/fl mice. Following adriamycin-induced injury, Kank1fl/flpod-CreTg/+ mice exhibited a notable increase in the urinary ACR and sclerotic index relative to Kank1fl/fl mice. Considering that elevated serum hemopexin levels have been implicated as a permeability factor in patients with MCNS [22,23,24], we assessed these levels in both mouse models before and after adriamycin administration. The results indicated a significant elevation in serum hemopexin levels in Kank1fl/flpod-CreTg/+ mice post-treatment, whereas no such increase was observed in Kank1fl/fl mice (Supplementary Figure S5).
The lack of experiments involving alternative inducible mouse models in addition to the adriamycin model is a limitation of the current study. Another limitation is that only one KANK1KO podocyte cell line was generated; however, the knockout of KANK1 was observed at the genomic and protein levels, while artifacts in other genes could not be excluded.
In summary, our study unveiled that podocyte-specific Kank1 knockout mice, following adriamycin-induced kidney injury, display a significant rise in ACR, an augmented sclerotic index, and enhanced foot process effacement compared to their control counterparts. Furthermore, KANK1KO podocytes exhibited an increased susceptibility to detachment after adriamycin treatment, correlating with a greater propensity for apoptosis. Taken together, these results suggest that KANK1 may play a protective role in mitigating podocyte damage under pathological conditions.
4. Materials and Methods
4.1. Mice
C57BL/6 Kank1fl/fl mice were generated by inserting loxP sites in introns 5 and 9 of the Kank1 gene using Cyagen (Santa Clara, CA, USA). C57BL/6 pod-CreTg/+ mice were purchased from the Jackson Laboratory (Sacramento, CA, USA). All experimental protocols were approved by the Animal Care and Use Committee of Mie University (No. 27-32) and all experiments were performed in accordance with approved guidelines.
Genomic DNA was extracted from the tails of Kank1+/+pod-CreTg/+, Kank1fl/fl, and Kank1fl/flpod-CreTg/+ mice using a FavorPrep Tissue Genomic DNA Extraction Mini Kit (FAVORGEN, Ping-Tung, Taiwan). Polymerase chain reaction (PCR) amplification was carried out with Hotstartaq (QIAGEN, Hilden, Germany) under the following conditions: 96 °C for 15 min; 30 cycles of 96 °C for 45 s, 57 °C for 45 s, and 72C for 1 min; and extension at 72 °C for 15 min. The PCR primers used were as follows: Kank1_f2, 5’-TCATTTCTTGCATAGCCGGTA-3’ and Kank1_r2, 5’-CTGTGCTATTCCTGACCAGT-3’ for Kank1; and oIMR1084, 5’-GCGGTCTGGCAGTAAAAACTATC-3’ and oIMR1085, 5’-GTGAAACAGCATTGCTGTCACTT-3’. PCR products were analyzed by gel electrophoresis on a 1.5% agarose gel. Adriamycin at a dose of 15 mg/kg body weight was injected via the mouse tail vein [25] once, and the mice were sacrificed after two weeks.
4.2. Isolation of Mouse Glomeruli
Glomeruli were isolated from Kank1fl/fl and Kank1fl/flpod-CreTg/+ mice at six months old by a perfusion method involving magnetic beads with collagenase digestion for RNA and without collagenase digestion for protein experiments [26].
4.3. RNA Extraction and Reverse Transcriptase (RT)-PCR
Total RNA was extracted from the glomeruli of the Kank1fl/fl or Kank1fl/flpod-CreTg/+ group (n = 4 each) using the TRIzol Plus RNA purification kit (ThermoFisher Scientific, Waltham, MA, USA), and cDNA was synthesized using SuperScript III reverse transcriptase (ThermoFisher Scientific). Real-time RT-PCR was performed using a StepOnePlus real-time PCR system (ThermoFisher Scientific). The oligonucleotide primers used were as follows: Kank1, 5’-TGTCAGCCTGCAACTTACTGA-3’ (forward) and 5’-CTGACTGGACACTCGGAACC-3’ (reverse); Kank2, 5’- GCACACAGCCAAGAAGATCA-3’ (forward) and 5’- CAGGGTTCTCAGGCTGTACC-3’ (reverse); Kank3, 5’-TTTCCAGCCTGCTACTGGAT-3’ (forward) and 5’-GCCATGTCTTCCTCCTCTTG-3’ (reverse); Kank4, 5’-TCGCCATTGTCAAGCTACTG-3’ (forward) and 5’-TTTCCAGACAACAGCCATGT-3’ (reverse); GAPDH, 5´-CGTCCCGTAGACAAAATGGT-3´ (forward) and 5´-GAATTTGCCGTGAGTGGAGT-3´ (reverse).
4.4. Immunofluorescence for KANK1 in Humans or WT Mice
Frozen sections of normal human kidneys were purchased from Zyagen (San Diego, CA, USA) and fixed in acetone at -20 ºC for 10 min. Blocking was performed with 10% normal goat serum in phosphate-buffered saline (PBS) for 30 min at room temperature. The sections were incubated with rabbit anti-KANK1 (1:100) (Proteintech, Rosemont, IL, USA) and mouse anti-NPHS1 (1:400) (50A9) [27] or rabbit anti-KANK1 (1:100) and mouse anti-SGLT2 (1:100) (Santa Cruz Biotechnology, Santa Cruz, CA, USA) in 10% normal goat serum in PBS at 4 °C overnight. After washing with PBS 3 times, the sections were incubated with goat anti-rabbit Alexa Fluor 488 (1:400) (ThermoFisher Scientific) and goat anti-mouse Alexa Fluor 568 (1:400) (ThermoFisher Scientific) in 1% bovine serum albumin (BSA) in PBS for 1 h. The sections were mounted after staining with 4’,6-diamindino-2-phenylindole (DAPI) (Invitrogen, Carlsbad, CA, USA) and examined using an FV1000 confocal laser scanning microscope (Olympus, Tokyo, Japan).
Frozen sections of WT mouse kidneys were fixed in acetone in a similar manner. After blocking with 10% normal goat serum in PBS, the sections were incubated with rabbit anti-KANK1 (1:100) (Proteintech) and guinea pig anti-SYNPO (1:500) (PROGEN, Heidelberg, Germany) with 10% normal goat serum in PBS at 4 °C overnight. Goat anti-rabbit Alexa Fluor 488 (1:400) (ThermoFisher Scientific) and goat anti-guinea pig Alexa Fluor 568 (1:400) (ThermoFisher Scientific) were used as secondary antibodies.
4.5. Western Blotting
Glomeruli were isolated from 6-month-old Kank1fl/fl or Kank1fl/flpod-CreTg/+ mice without collagenase digestion. The samples were separated on NuPAGE 4%–12% Bis-Tris gels (ThermoFisher Scientific) and transferred to polyvinylidene difluoride membranes. After blocking with Tris-buffered saline containing 0.1% Tween 20 and 5% milk, the upper membrane was incubated with anti-KANK1 antibody (1:1000) (ATLAS ANTIBODIES, Bromma, Sweden) at 4 °C overnight. The membrane was then incubated for 1 h at room temperature with horseradish peroxidase (HRP)-labeled donkey anti-rabbit antibody (1:3000) (GE Healthcare, Chicago, IL, USA) and developed using Amersham ECL Prime (GE Healthcare) according to the manufacturer’s instructions. The lower membrane (<100 kDa) was incubated with anti-β-actin antibody (1:2000) (Cell Signaling, Danvers, MA, USA) at 4 °C overnight, incubated for 1 h at room temperature with HRP-labeled sheep anti-mouse antibody, and developed in the same way.
4.6. Immunofluorescence Studies in Mice
Snap-frozen kidney blocks from two-month-old animals were prepared in Tissue-Tek OCT compound (Sakura Finetek, Tokyo, Japan) and sliced into 10-µm sections, and thereafter they were made on silane-coated microslides (MUTO PURE CHEMICALS, Tokyo, Japan). The sections were fixed in acetone for 10 min at -20 °C. After blocking with 10% normal goat serum in PBS for 60 min, the sections were incubated with anti-KANK1 antibody (1:500; ATLAS ANTIBODIES) or no primary antibody overnight at 4 °C. After washing with PBS, the sections were incubated with goat anti-rabbit Alexa Fluor 488 (1:500) at room temperature for 1 h and DAPI (1:3000) for 5 min and then examined using an FV1000 confocal laser scanning microscope (Olympus, Tokyo, Japan).
4.7. Urine and Blood Analyses
Urinary ACR, BUN, and Cr were measured in the Kank1+/+pod-CreTg/+, Kank1fl/fl, and Kank1fl/flpod-CreTg/+ groups at 2 months old (n = 6) and Kank1fl/fl group, and the Kank1fl/flpod-CreTg/+ group at 6 months old or at 1 year old (n = 6 each). The urinary ACR was measured using an immunoturbidimetric method for urinary albumin (Shibayagi, Gunma, Japan) and an enzymatic assay for urinary creatinine (Wako, Tokyo, Japan). BUN and Cr levels were measured as previously described [28].
4.8. Light Microscopic Analyses
For periodic acid-Schiff (PAS) and Masson trichrome (MT) staining, six kidneys from three groups (Kank1+/+pod-CreTg/+, Kank1fl/fl, and Kank1fl/flpod-CreTg/+) at two months old were examined (n = 6 for each group). At six months or one year old, six kidneys from two groups, Kank1fl/fl and Kank1fl/flpod-CreTg/+, were examined. The sclerotic index (0 = 0%, 1 = 1-25%, 2 = 26-50%, 3 = 51-75%, 4 = 76-100%) was evaluated by examining 30 glomeruli in PAS-stained specimens from each mouse. The fibrotic index (0 = 0%, 1 = 1%-25%, 2 = 26%-50%, 3 = 51%-75%, 4 = 76%-100%) was evaluated by examining 20 areas in the MT-stained specimen of each mouse [29].
4.9. Transmission Electron Microscopic Analyses
Mouse kidneys were cut into 1- 2-mm blocks, pre-fixed in 2.5% glutaraldehyde and 2% PFA in 0.1 M phosphate buffer (pH 7.4), and post-fixed in 2% osmium tetra-oxide for 2 h at 4 °C. The samples were dehydrated in graded ethanol and embedded in an epoxy resin. Ultrathin sections stained with uranyl acetate for 10 min and lead staining solution for 5 min were examined using a HITACHI H-700 (Hitachi, Tokyo, Japan). To assess the extent of podocyte foot process effacement, foot processes along at least 400 µm of the total glomerular basement membrane length were quantified in 4 glomeruli of the Kank1fl/fl or Kank1fl/flpod-CreTg/+ group after adriamycin treatment (each n = 4) using the ImageJ software program (National Institutes of Health, Bethesda, MD, USA), as previously reported [30,31].
4.10. Immunofluorescence in Human Podocytes
Human immortalized podocytes at 37 °C [32], cultured in RPMI 1640 medium (Wako) with 10% fetal bovine serum, insulin-transferrin-selenium-A (Wako), and penicillin/streptomycin, were fixed with 4% paraformaldehyde (PFA) in PBS at room temperature for 20 min, permeabilized with 0.1% Triton X-100 in PBS, and blocked with 2% BSA in PBS for 1 h at room temperature. The cells were incubated with anti- KANK1 antibody (1:200; ATLAS ANTIBODIES) or without the primary antibody at 4 °C overnight. After washing with PBS for 3 times, the cells were incubated with goat anti-rabbit Alexa Fluor 488 (1:500) and rhodamine-phalloidin (1:500) (Invitrogen, Carlsbad, CA, USA) at room temperature for 1 h, followed by DAPI (1:3000) at room temperature for 5 min. The results were examined using an FV1000 confocal laser-scanning microscope (Olympus).
4.11. Generation of a KANK1KO Human Immortalized Podocyte Cell Line
Two different guide RNAs, KANK1, gRNA1, and gRNA2, which target exon 2 of KANK1, were tested. The sequences of KANK1 gRNA1 and gRNA2 were 5'-GTCTAGTTGATAACCATAGG-3' and 5'-TGACACCGGGTGAGTTCAGA-3', respectively. The efficiency of genome editing using the GeneArt Genomic Cleavage Detection Kit (ThermoFisher Scientific) was higher in KANK1 gRNA1 than in KANK1 gRNA2; therefore, KANK1 gRNA1 was used. 0.5 × 10⁵ cells were transfected with Lipofectamine CRISPRMAX (ThermoFisher Scientific) 1.5 µl, Cas9 nuclease (1.5 µg), Cas9 plus reagent (2.5 µl), and KANK1 gRNA1 1.25 µg and incubated at 33 °C for 3 days. Single-cell cloning was performed by serial dilutions in 96-well plates. Genomic DNA was extracted from each clone, and a sequence analysis was performed to detect indels.
4.12. Detachment Assays
WT and KANK1KO podocyte cell lines were separately cultured in 24-well plates. The number of cells per field was counted to establish a baseline number. The cells were treated with 0.5 µg/ml adriamycin for a total of 48 h. The detachment assay was modified according to a previous study [33]. Specifically, the number of detached cells in 5 wells was evaluated at pre-treatment, 24 h after treatment, and 48 h after treatment in 3 independent experiments.
4.13. Apoptosis Assays
WT or KANK1KO podocyte cell lines were treated with 0.5 µg/ml adriamycin for 24 h, and the cells were harvested for an Annexin V-FITC/propidium iodide (PI) flow cytometry apoptosis assay to examine the effects of adriamycin.
4.14. Statistical Analyses
Data are expressed as the mean ± standard deviation (SD). Statistical analyses were performed using the StatView software package (version 5.0, SAS statistical software program, SAS Institute, Cary, NC, USA). A one-way analysis of variance (ANOVA) was used to analyze the data among the three mouse groups, followed by the post-hoc Scheffe test. Student’s t-test was used to compare data between the two mouse groups. P <0.05 was considered significant.
Supplementary Materials
The following supporting information can be downloaded at the website of this paper posted on Preprints.org, Figure S1: KANK1 expression in the proximal tubular basement membrane of the human kidneys; Figure S2: Full-length results of Western blotting; Figure S3: Inactivation of Kank1 in podocytes at the age of six months did not result in albuminuria; Figure S4: Full-length results of Western blotting; Figure S5: The serum hemopexin levels before and after adriamycin (ADR) treatment.
Author Contributions
Conceptualization, K.O. and K.K.; formal analysis, K.O., K.K., L.Z., M.T., A.T., R.S., T.Y., and C.N.D.; funding acquisition, K.K. and K.D.; investigation, K.O., K.K., L.Z., M.T., A.T., R.S., Y.S., M.M., Y.S., T.M., and T.H.; methodology, K.K., K.T., and E.C.G.; writing—original draft, K.O. and K.K.; writing—review and editing, L.Z. and E.C.G. All authors have read and agreed to the published version of the manuscript.
Funding
This work was supported in part by Grants-in-Aid for Scientific Research from the Ministry of Education, Culture, Sports, Science and Technology, Japan (No. 21K08255 to K.K.).
Institutional Review Board Statement
The animal study protocol was approved by the Ethics Committee of Mie University (protocol code No. 27-32, May 10th 2016).” for studies involving animals.
Data Availability Statement
We encourage all authors of articles published in MDPI journals to share their research data. In this section, please provide details regarding where data supporting reported results can be found, including links to publicly archived datasets analyzed or generated during the study. Where no new data were created, or where data is unavailable due to privacy or ethical restrictions, a statement is still required. Suggested Data Availability Statements are available in section “MDPI Research Data Policies” at https://www.mdpi.com/ethics.
Acknowledgments
We thank Yuko Koizumi for technical assistance.
Conflicts of Interest
Dr. Dohi reports research grants from Bristol-Myers Squibb, MSD K.K., Pfizer Japan Inc., Takeda Pharmaceutical Co., Ltd., Astellas Pharma Inc., Daiichi Sankyo Pharmaceutical Co., Ltd., Genzyme Japan, Shionogi & Co., Ltd., Sumitomo Dainippon Pharma Co., Ltd., Mitsubishi Tanabe Corporation, Otsuka Pharmaceutical Co., Ltd., Bayer Yakuhin, Ltd., AstraZeneca K.K., and Boehringer Ingelheim Co., Ltd. The funders had no role in the design of the study; in the collection, analyses, or interpretation of data; in the writing of the manuscript; or in the decision to publish the results.
References
- Chesney, R.W. The idiopathic nephrotic syndrome. Curr Opin Pediatr. 1999, 11, 158–161. [Google Scholar] [CrossRef]
- Mekahli, D.; Liutkus, A.; Ranchin, B.; Yu, A.; Bessenay, L.; Girardin, E.; Van Damme-Lombaerts, R.; Palcoux, J.B.; Cachat, F.; Lavocat, M.P.; et al. Long-term outcome of idiopathic steroid-resistant nephrotic syndrome: a multicenter study. Pediatr Nephrol. 2009, 24, 1525–1532. [Google Scholar] [CrossRef]
- Rosenberg, A.Z.; Kopp, J.B. Focal Segmental Glomerulosclerosis. Clin J Am Soc Nephrol. 2017, 12, 502–517. [Google Scholar] [CrossRef]
- Sadowski, C.E.; Lovric, S.; Ashraf, S.; Pabst, W.L.; Gee, H.Y.; Kohl, S.; Engelmann, S.; Vega-Warner, V.; Fang, H.; Halbritter, J.; et al. A single-gene cause in 29.5% of cases of steroid-resistant nephrotic syndrome. J Am Soc Nephrol. 2015, 26, 1279–1289. [Google Scholar] [CrossRef]
- Gee, H.Y.; Zhang, F.; Ashraf, S.; Kohl, S.; Sadowski, C.E.; Vega-Warner, V.; Zhou, W.; Lovric, S.; Fang, H.; Nettleton, M.; et al. KANK deficiency leads to podocyte dysfunction and nephrotic syndrome. J Clin Invest. 2015, 125, 2375–2384. [Google Scholar] [CrossRef]
- Sarkar, S.; Roy, B.C.; Hatano, N.; Aoyagi, T.; Gohji, K.; Kiyama, R. A novel ankyrin repeat-containing gene (Kank) located at 9p24 is a growth suppressor of renal cell carcinoma. J Biol Chem. 2002, 277, 36585–36591. [Google Scholar] [CrossRef]
- Kakinuma, N.; Zhu, Y.; Wang, Y.; Roy, B.C.; Kiyama, R. Kank proteins: structure, functions and diseases. Cell Mol Life Sci. 2009, 66, 2651–2659. [Google Scholar] [CrossRef]
- Zhu, Y.; Kakinuma, N.; Wang, Y.; Kiyama, R. Kank proteins: a new family of ankyrin-repeat domain-containing proteins. Biochim Biophys Acta. 2008, 1780, 128–133. [Google Scholar] [CrossRef]
- Roy, B.C.; Kakinuma, N.; Kiyama, R. Kank attenuates actin remodeling by preventing interaction between IRSp53 and Rac1. J Cell Biol. 2009, 184, 253–267. [Google Scholar]
- Li, C.C.; Kuo, J.C.; Waterman, C.M.; Kiyama, R.; Moss, J.; Vaughan, M. Effects of brefeldin A-inhibited guanine nucleotide-exchange (BIG) 1 and KANK1 proteins on cell polarity and directed migration during wound healing. Proc Natl Acad Sci U S A. 2011, 108, 19228–19233. [Google Scholar] [CrossRef]
- Bouchet, B.P.; Gough, R.E.; Ammon, Y.C.; van de Willige, D.; Post, H.; Jacquemet, G.; Altelaar, A.M.; Heck, A.J.; Goult, B.T.; Akhmanova, A. Talin-KANK1 interaction controls the recruitment of cortical microtubule stabilizing complexes to focal adhesions. Elife. 2016, 5, e18124. [Google Scholar] [CrossRef]
- Chen, N.P.; Sun, Z.; Fässler, R. The Kank family proteins in adhesion dynamics. Curr Opin Cell Biol. 2018, 54, 130–136. [Google Scholar] [CrossRef]
- Li, X.; Goult, B.T.; Ballestrem, C.; Zacharchenko, T. The structural basis of the talin-KANK1 interaction that coordinates the actin and microtubule cytoskeletons at focal adhesions. Open Biol. 2023, 13, 230058. [Google Scholar] [CrossRef]
- Wang, Y.; Onishi, Y.; Kakinuma, N.; Roy, B.C.; Aoyagi, T.; Kiyama, R. Alternative splicing of the human Kank gene produces two types of Kank protein. Biochem Biophys Res Commun. 2005, 330, 1247–1253. [Google Scholar] [CrossRef]
- Lindenmeyer, M.T.; Eichinger, F.; Sen, K.; Anders, H.J.; Edenhofer, I.; Mattinzoli, D.; Kretzler, M.; Rastaldi, M.P.; Cohen, C.D. Systematic analysis of a novel human renal glomerulus-enriched gene expression dataset. PLoS One. 2010, 5, 11545. [Google Scholar] [CrossRef]
- Yu, H.; Artomov, M.; Brähler, S.; Stander, M.C.; Shamsan, G.; Sampson, M.G.; White, J.M.; Kretzler, M.; Miner, J.H.; Jain, S.; et al. A role for genetic susceptibility in sporadic focal segmental glomerulosclerosis. J Clin Invest. 2016, 126, 1067–1078. [Google Scholar] [CrossRef]
- Kramer-Zucker, A.G.; Wiessner, S.; Jensen, A.M.; Drummond, I.A. Organization of the pronephric filtration apparatus in zebrafish requires Nephrin, Podocin and the FERM domain protein Mosaic eyes. Dev Biol. 2005, 285, 316–329. [Google Scholar] [CrossRef]
- Ebarasi, L.; He, L.; Hultenby, K.; Takemoto, M.; Betsholtz, C.; Tryggvason, K.; Majumdar, A. A reverse genetic screen in the zebrafish identifies crb2b as a regulator of the glomerular filtration barrier. Dev Biol. 2009, 334, 1–9. [Google Scholar] [CrossRef]
- Almosailleakh, M.; Bentivegna, S.; Narcisi, S.; Benquet, S.J.; Gillberg, L.; Montaño-Almendras, C.P.; Savickas, S.; Schoof, E.M.; Wegener, A.; Luche, H.; et al. Loss of the KN Motif and AnKyrin Repeat Domain 1 (KANK1) Leads to Lymphoid Compartment Dysregulation in Murine Model. Genes (Basel). 2023, 14, 1947. [Google Scholar] [CrossRef]
- Pan, W.; Sun, K.; Tang, K.; Xiao, Q.; Ma, C.; Yu, C.; Wei, Z. Structural insights into ankyrin repeat-mediated recognition of the kinesin motor protein KIF21A by KANK1, a scaffold protein in focal adhesion. J Biol Chem. 2018, 293, 1944–1956. [Google Scholar] [CrossRef]
- Hayashi, K.; Sasamura, H.; Nakamura, M.; Azegami, T.; Oguchi, H.; Sakamaki, Y.; Itoh, H. KLF4-dependent epigenetic remodeling modulates podocyte phenotypes and attenuates proteinuria. J Clin Invest. 2014, 124, 2523–2537. [Google Scholar] [CrossRef]
- Bakker, W.W.; van Dael, C.M.; Pierik, L.J.; van Wijk, J.A.; Nauta, J.; Borghuis, T.; Kapojos, J.J. Altered activity of plasma hemopexin in patients with minimal change disease in relapse. Pediatr Nephrol. 2005, 20, 1410–1415. [Google Scholar] [CrossRef]
- Bakker, W.W.; Borghuis, T.; Harmsen, M.C.; van den Berg, A.; Kema, I.P.; Niezen, K.E.; Kapojos, J.J. Protease activity of plasma hemopexin. Kidney Int. 2005, 68, 603–610. [Google Scholar] [CrossRef]
- Candelier, J.J.; Lorenzo, H.K. Idiopathic nephrotic syndrome and serum permeability factors: a molecular jigsaw puzzle. Cell Tissue Res. 2020, 379, 231–243. [Google Scholar] [CrossRef] [PubMed]
- Lee, V.W.; Harris, D.C. Adriamycin nephropathy: a model of focal segmental glomerulosclerosis. Nephrology (Carlton). 2011, 16, 30–38. [Google Scholar] [CrossRef]
- Takemoto, M.; Asker, N.; Gerhardt, H.; Lundkvist, A.; Johansson, B.R.; Saito, Y.; Betsholtz, C. A new method for large scale isolation of kidney glomeruli from mice. Am J Pathol. 2002, 161, 799–805. [Google Scholar] [CrossRef]
- Lahdenperä, J.; Kilpeläinen, P.; Liu, X.L.; Pikkarainen, T.; Reponen, P.; Ruotsalainen, V.; Tryggvason, K. Clustering-induced tyrosine phosphorylation of nephrin by Src family kinases. Kidney Int. 2003, 64, 404–413. [Google Scholar] [CrossRef]
- Murata, T.; Katayama, K.; Oohashi, T.; Jahnukainen, T.; Yonezawa, T.; Sado, Y.; Ishikawa, E.; Nomura, S.; Tryggvason, K.; Ito, M. COL4A6 is dispensable for autosomal recessive Alport syndrome. Sci Rep. 2016, 6, 29450. [Google Scholar] [CrossRef]
- Katayama, K.; Kawano, M.; Naito, I.; Ishikawa, H.; Sado, Y.; Asakawa, N.; Murata, T.; Oosugi, K.; Kiyohara, M.; Ishikawa, E.; et al. Irradiation prolongs survival of Alport mice. J Am Soc Nephrol. 2008, 19, 1692–1700. [Google Scholar] [CrossRef]
- Lin, M.H.; Miller, J.B.; Kikkawa, Y.; Suleiman, H.Y.; Tryggvason, K.; Hodges, B.L.; Miner, J.H. Laminin-521 Protein Therapy for Glomerular Basement Membrane and Podocyte Abnormalities in a Model of Pierson Syndrome. J Am Soc Nephrol. 2018, 29, 1426–1436. [Google Scholar] [CrossRef]
- Tanoue, A.; Katayama, K.; Ito, Y.; Joh, K.; Toda, M.; Yasuma, T.; D'Alessandro-Gabazza, C.N.; Kawachi, H.; Yan, K.; Ito, M.; et al. Podocyte-specific Crb2 knockout mice develop focal segmental glomerulosclerosis. Sci Rep. 2021, 11, 20556. [Google Scholar] [CrossRef] [PubMed]
- Saleem, M.A.; O'Hare, M.J.; Reiser, J.; Coward, R.J.; Inward, C.D.; Farren, T.; Xing, C.Y.; Ni, L.; Mathieson, P.W.; Mundel, P. A conditionally immortalized human podocyte cell line demonstrating nephrin and podocin expression. J Am Soc Nephrol. 2002, 13, 630–638. [Google Scholar] [CrossRef] [PubMed]
- Reiser, J.; Oh, J.; Shirato, I.; Asanuma, K.; Hug, A.; Mundel, T.M.; Honey, K.; Ishidoh, K.; Kominami, E.; Kreidberg, J.A.; et al. Podocyte migration during nephrotic syndrome requires a coordinated interplay between cathepsin L and alpha3 integrin. J Biol Chem. 2004, 279, 34827–34832. [Google Scholar] [CrossRef] [PubMed]
Figure 1.
Expression of KANK1 in podocytes from human and mouse kidneys. (a) In human glomeruli, KANK1 showed extensive localization with NPHS1, a marker specific to podocytes. Scale bars indicate 50 µm. (b) In mouse glomeruli, KANK1 exhibited extensive localization with SYNPO, a marker specific to podocytes. DAPI, 4',6-diamidino-2-phenylindole. Scale bars indicate 50 µm.
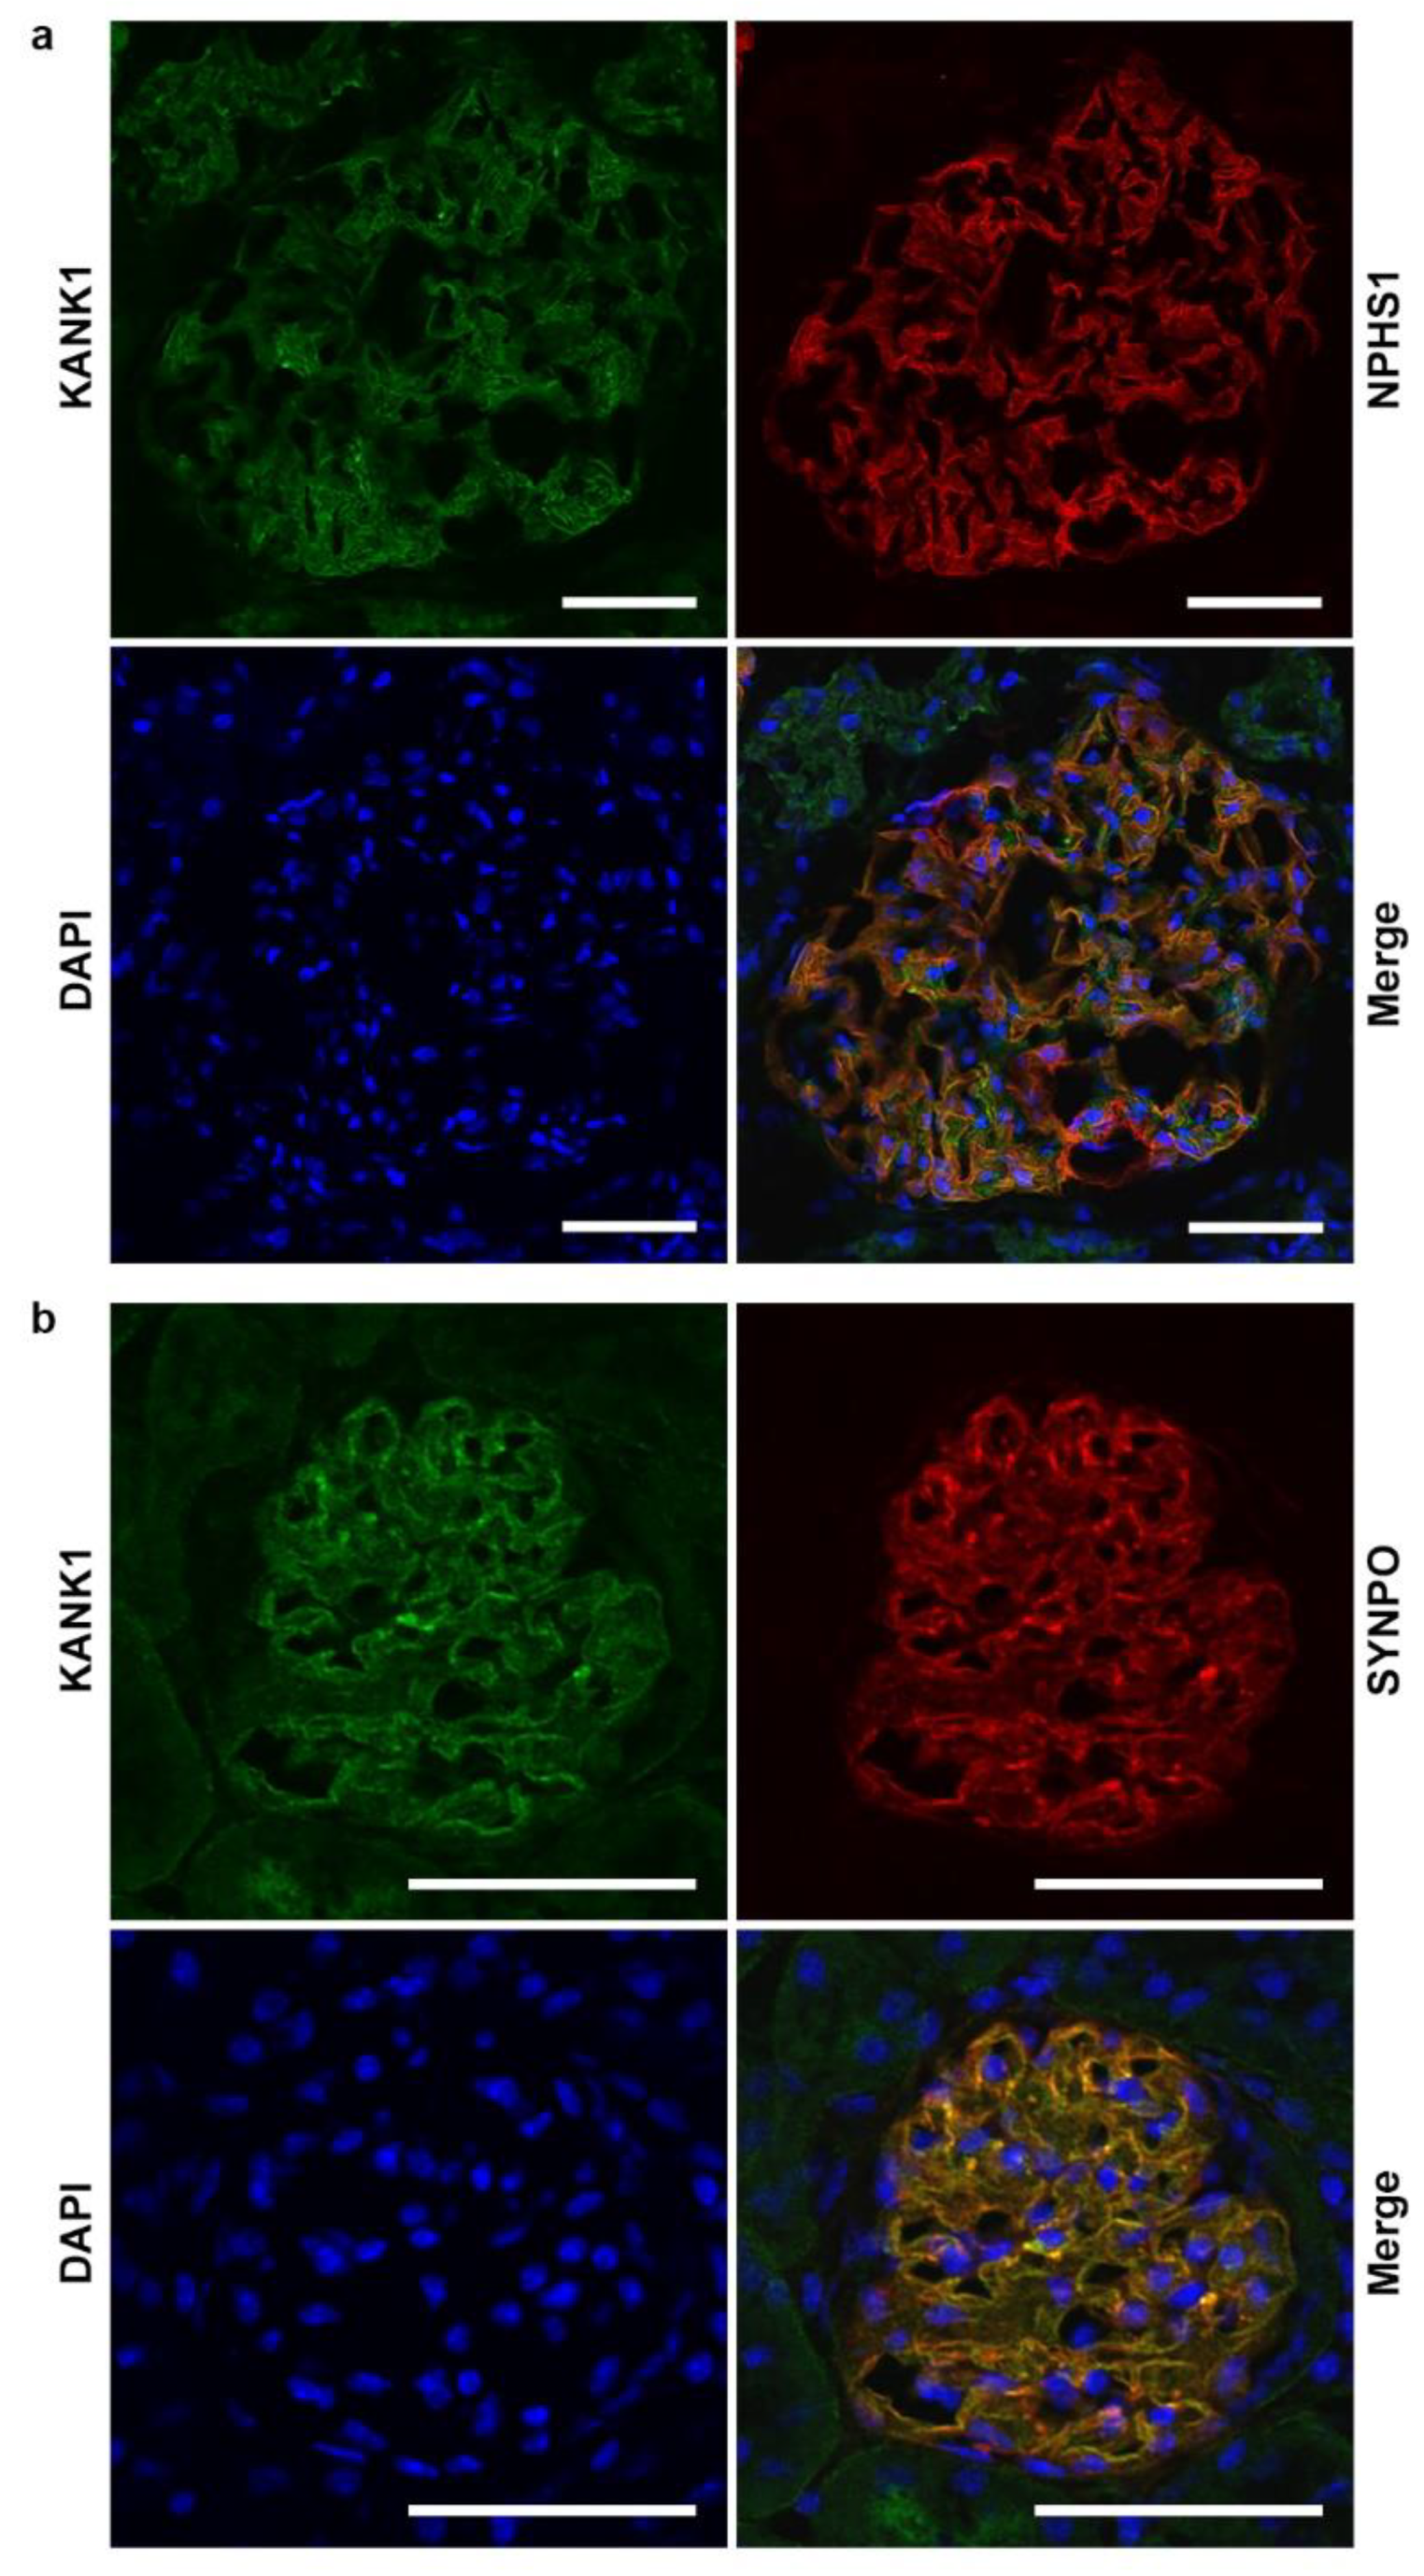
Figure 2.
Successful knockout of podocyte-specific Kank1. (a) LoxP sites were strategically inserted into introns 5 and 9 of the Kank1 gene. (b) Genotyping revealed a 459-bp band in Kank1+/+pod-CreTg/+ mice, whereas a 587-bp band was present in both Kank1fl/fl and Kank1fl/flpod-CreTg/+ mice using Kank1 primers. A 102-bp band was observed in both Kank1+/+pod-CreTg/+ and Kank1fl/flpod-CreTg/+ mice, but it was absent in Kank1fl/fl mice. (c) Kank1 mRNA expression was significantly reduced in the glomeruli of Kank1fl/flpod-CreTg/+ mice compared to Kank1fl/fl mice at 6 months old (***P <0.001). (d) A Western blot analysis showed that KANK1 protein expression was not detectable in the glomeruli isolated from Kank1fl/flpod-CreTg/+ mice, in contrast to Kank1fl/fl mice at six months old. β-actin expression was similar between the Kank1fl/fl and Kank1fl/flpod-CreTg/+ groups. (e) At two months old, KANK1 protein expression was significantly reduced in the glomeruli of Kank1fl/flpod-CreTg/+ mice when compared to the Kank1+/+pod-CreTg/+ group or Kank1fl/fl group. Scale bars indicate 50 µm.
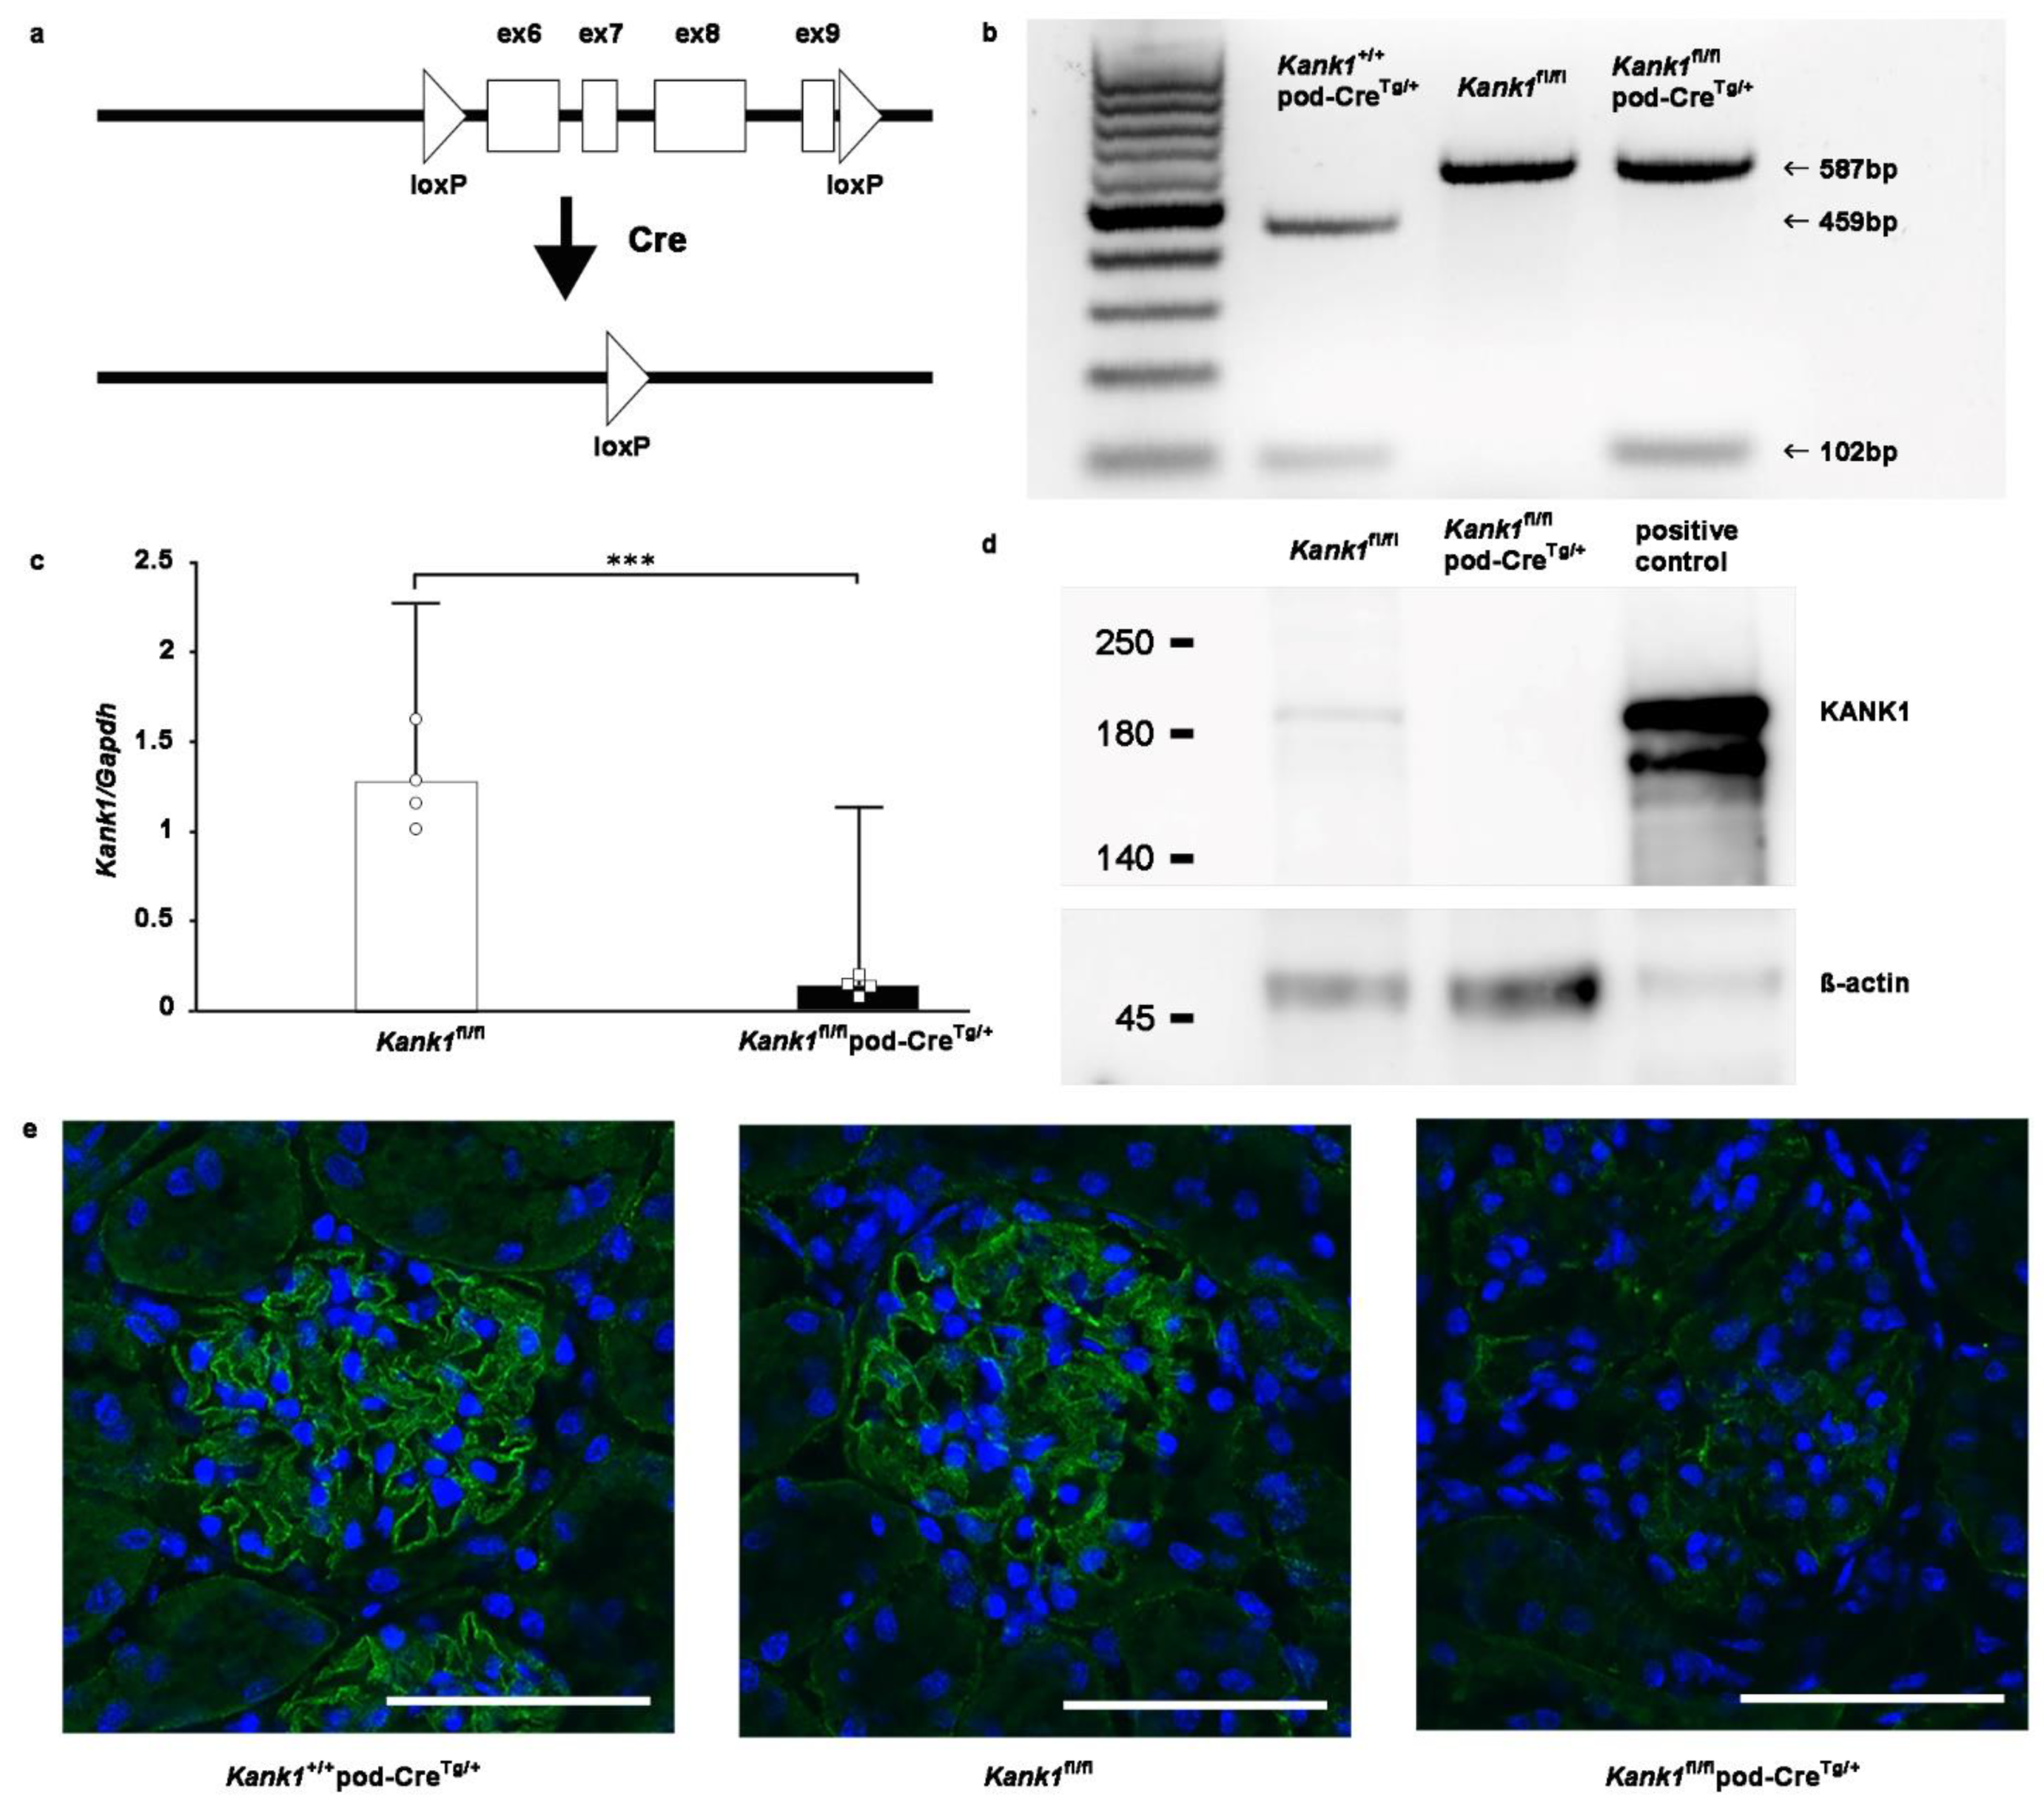
Figure 3.
Inactivation of Kank1 in podocytes at two months old does not result in albuminuria. (a) The urinary albumin-creatinine ratio (ACR) was found to be comparable across all three groups. (b) No significant differences were observed in blood urea nitrogen (BUN) or serum creatinine (Cr) levels among the groups. (c) The sclerotic index at two months old was significantly higher in the Kank1fl/flpod-CreTg/+ group compared to the Kank1fl/fl group (*P <0.05). In contrast, the Kank1+/+pod-CreTg/+ group did not show a significant difference from the Kank1fl/flpod-CreTg/+ group. In addition, the fibrotic index remained consistent among the three groups. Scale bars indicate 20 µm. (d) A microscopic analysis confirmed these findings, with no significant differences in the electron microscopic studies across the groups. Scale bars indicate 4 µm.
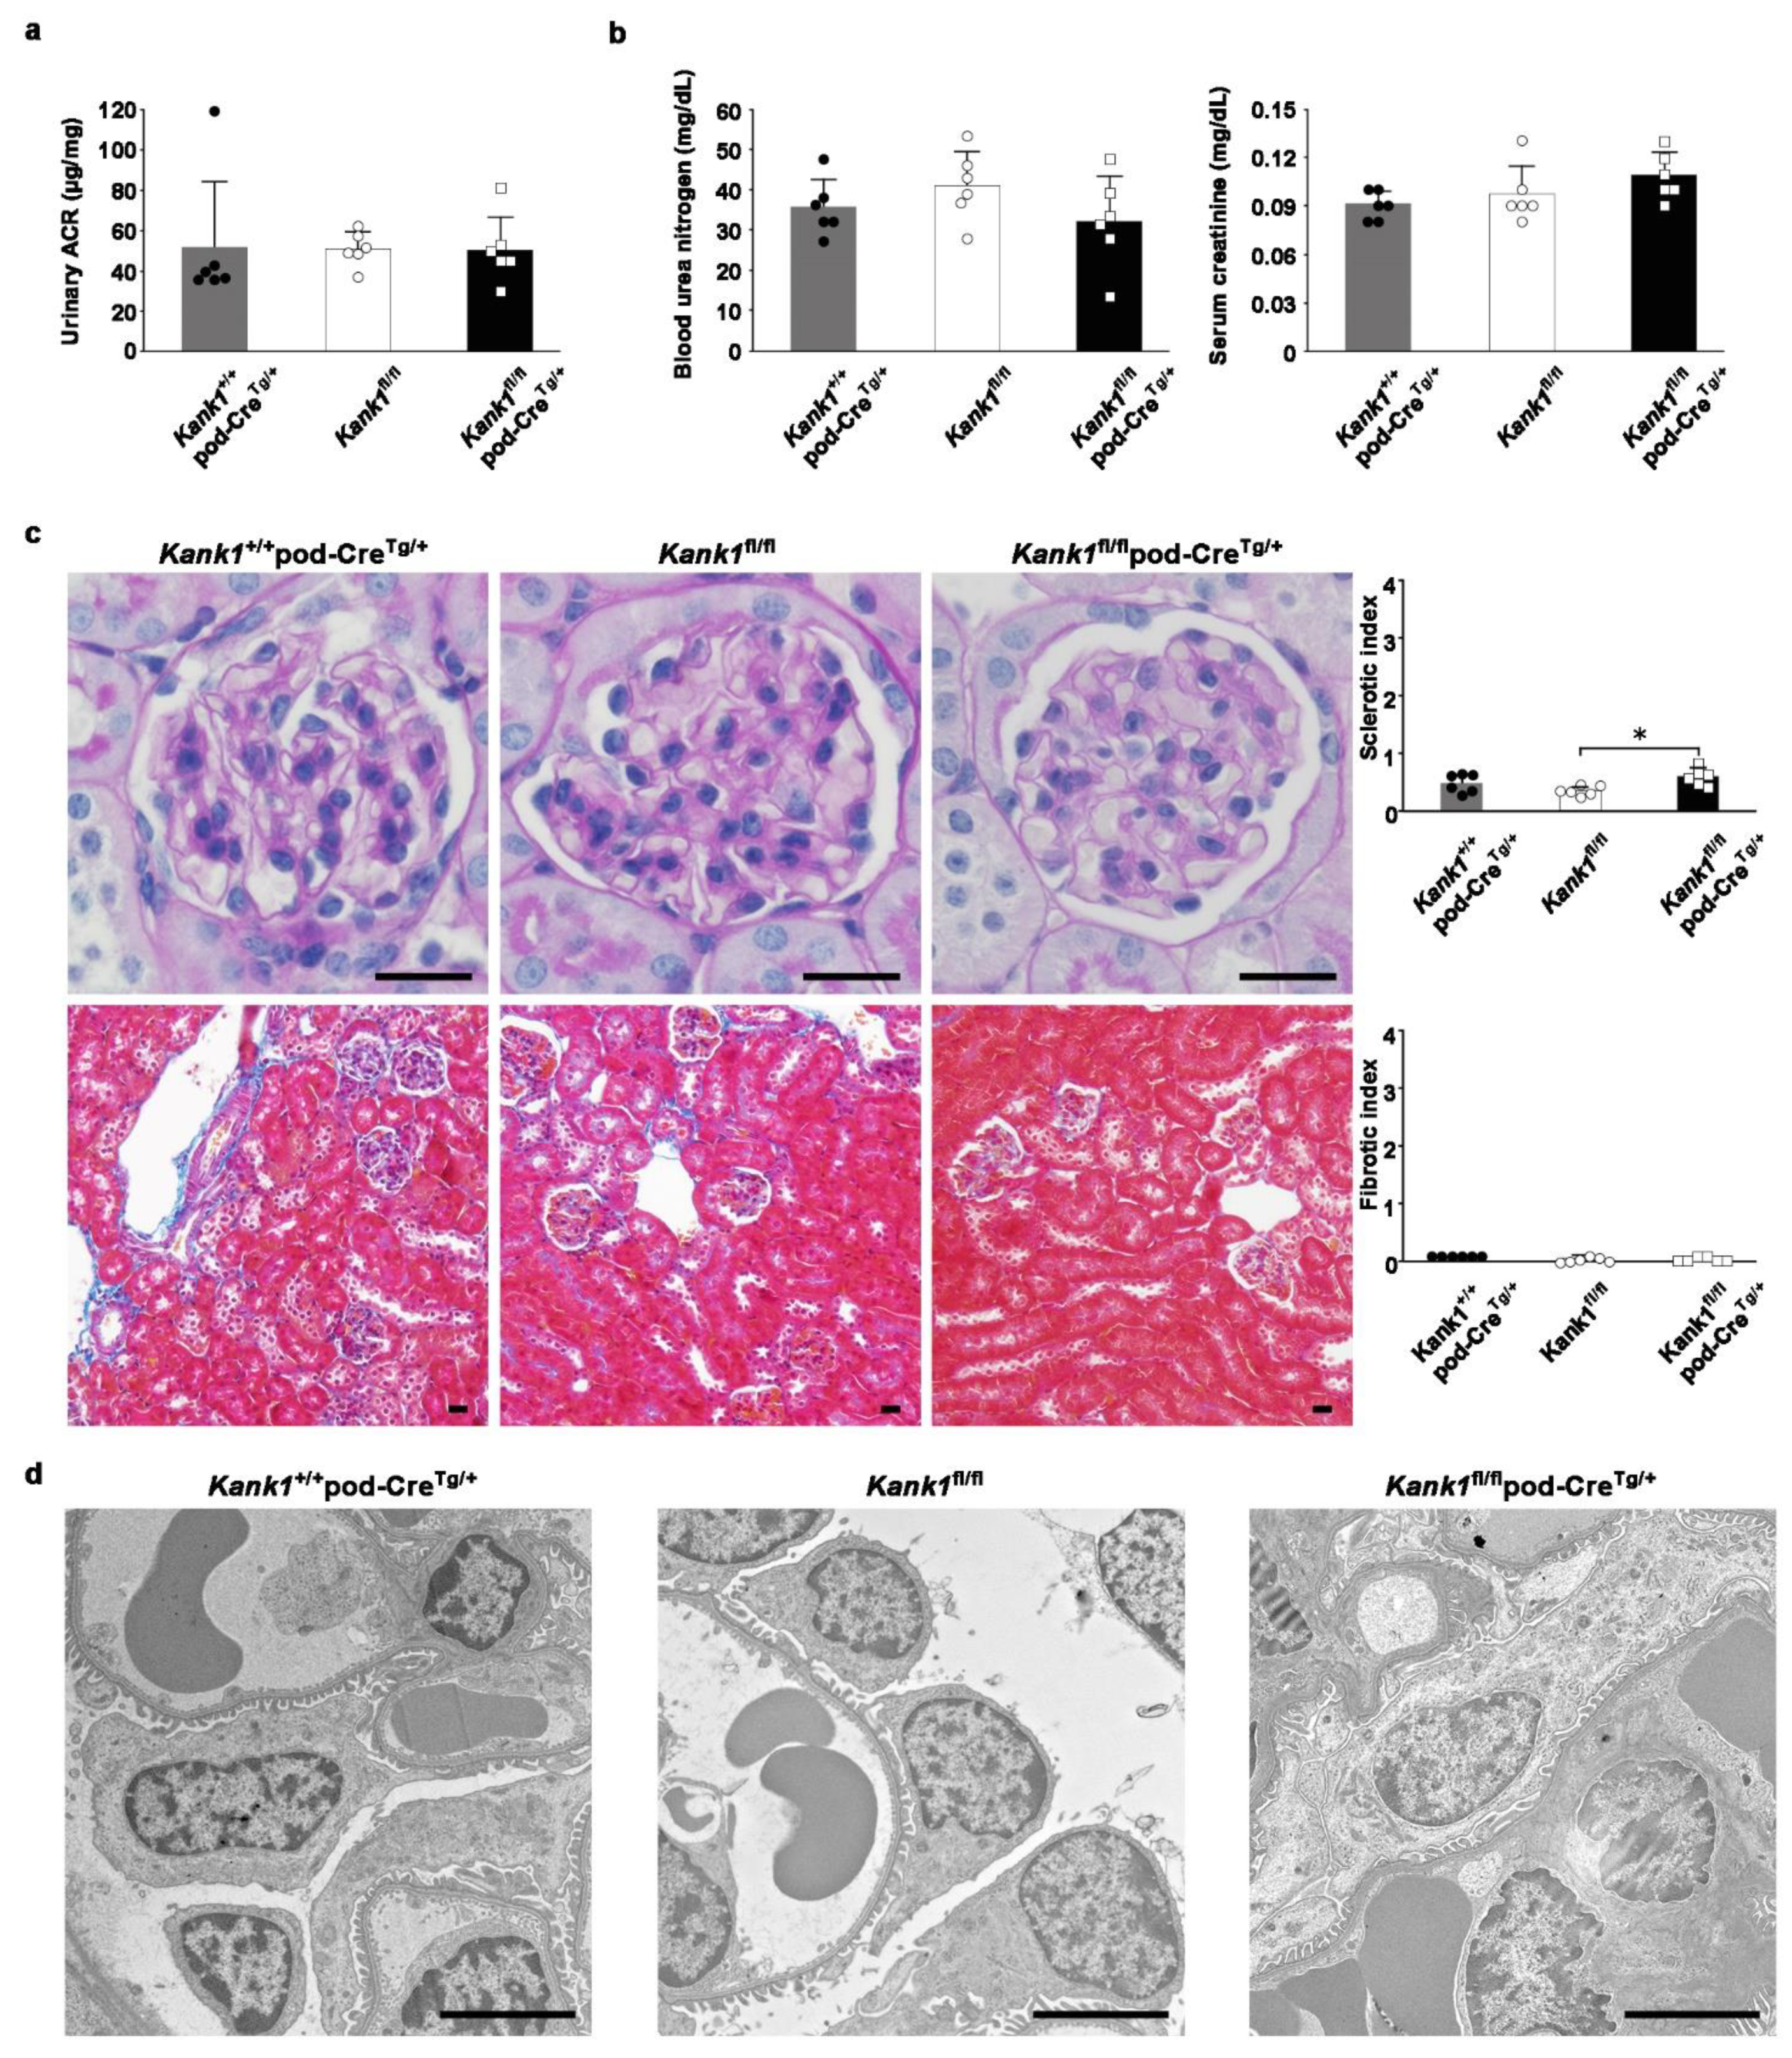
Figure 4.
Inactivation of Kank1 in podocytes at one year old was not associated with any detectable abnormalities in urine, blood, and histological tests. (a) There was no significant difference in the albumin-creatinine ratio (ACR) at one year old between Kank1fl/fl group and Kank1fl/flpod-CreTg/+ group. (b) The blood urea nitrogen (BUN) and serum creatinine (Cr) levels were comparable between the two groups at one year old. (c) There was no significant difference in sclerotic or fibrotic index between the two groups. Scale bars indicate 20 µm. (d) There was no significant difference in electron microscopic results between the two groups at one year old. Scale bars indicate 4 µm.
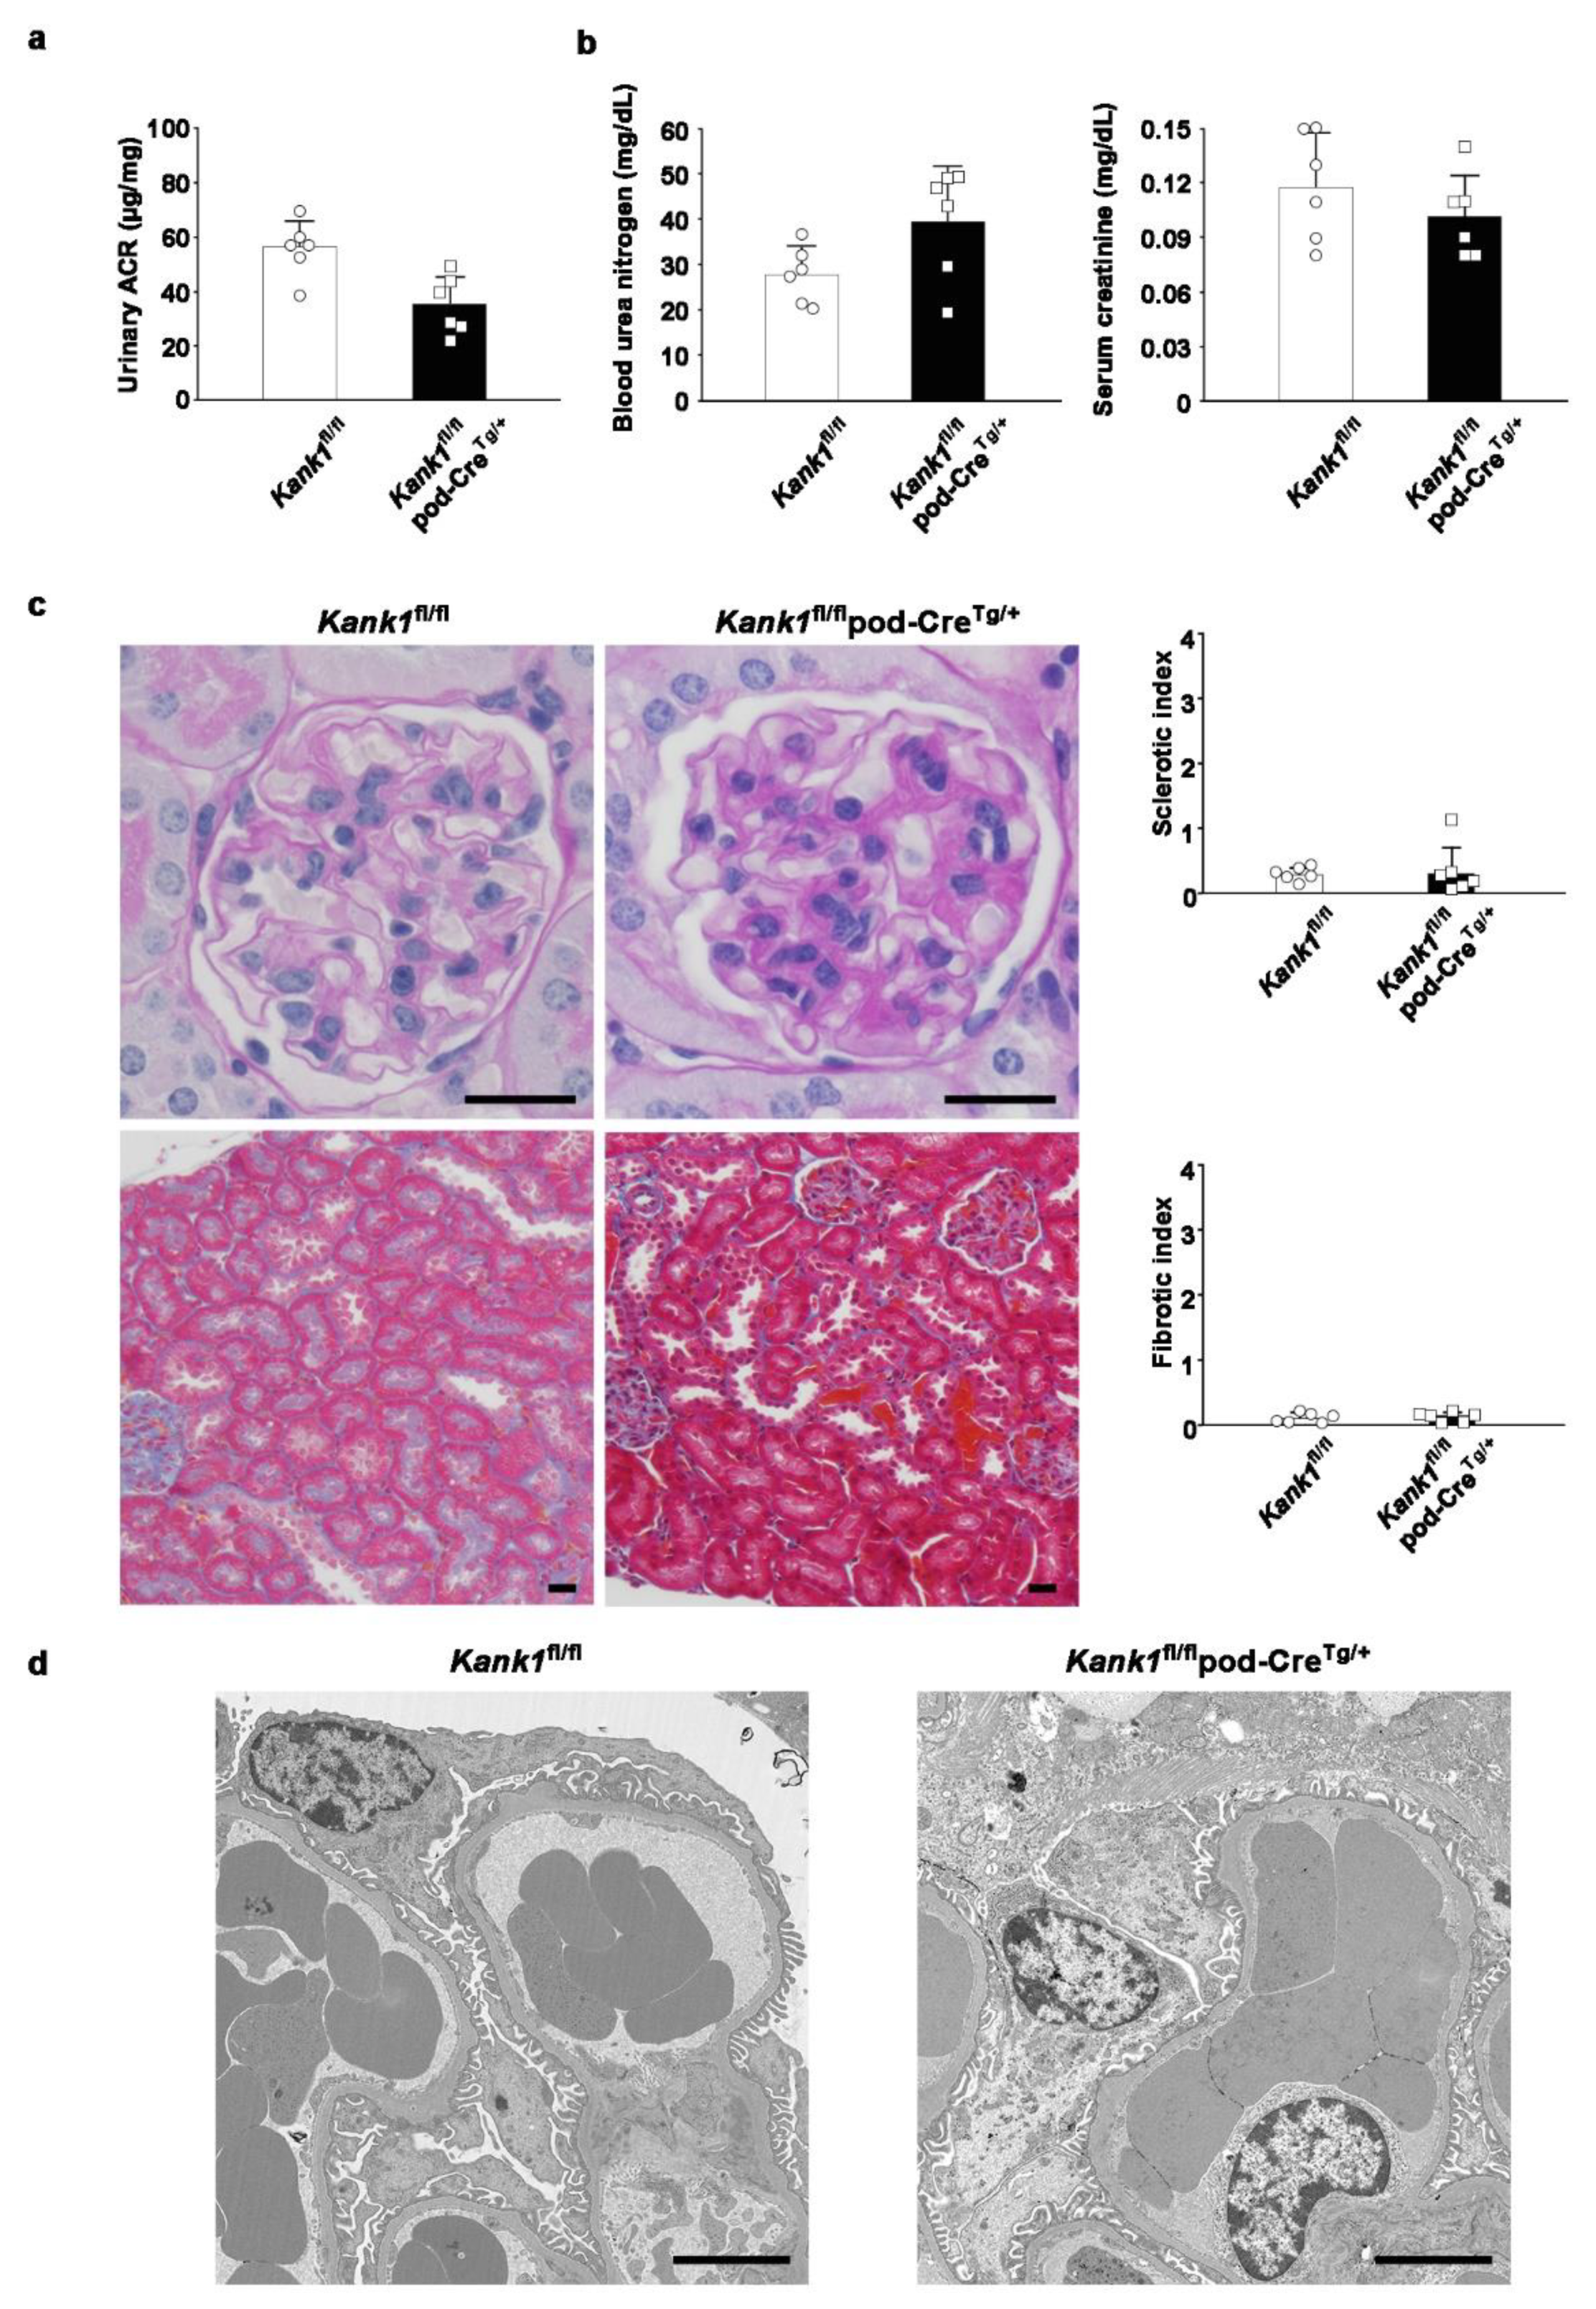
Figure 5.
Compensation by the other Kank family members was not observed in podocyte-specific Kank1 knockout mice. The mRNA levels of Kank2, Kank3, and Kank4 in the glomeruli of the Kank1fl/flpod-CreTg/+ group showed no significant difference when compared to the Kank1fl/fl group.
Figure 5.
Compensation by the other Kank family members was not observed in podocyte-specific Kank1 knockout mice. The mRNA levels of Kank2, Kank3, and Kank4 in the glomeruli of the Kank1fl/flpod-CreTg/+ group showed no significant difference when compared to the Kank1fl/fl group.
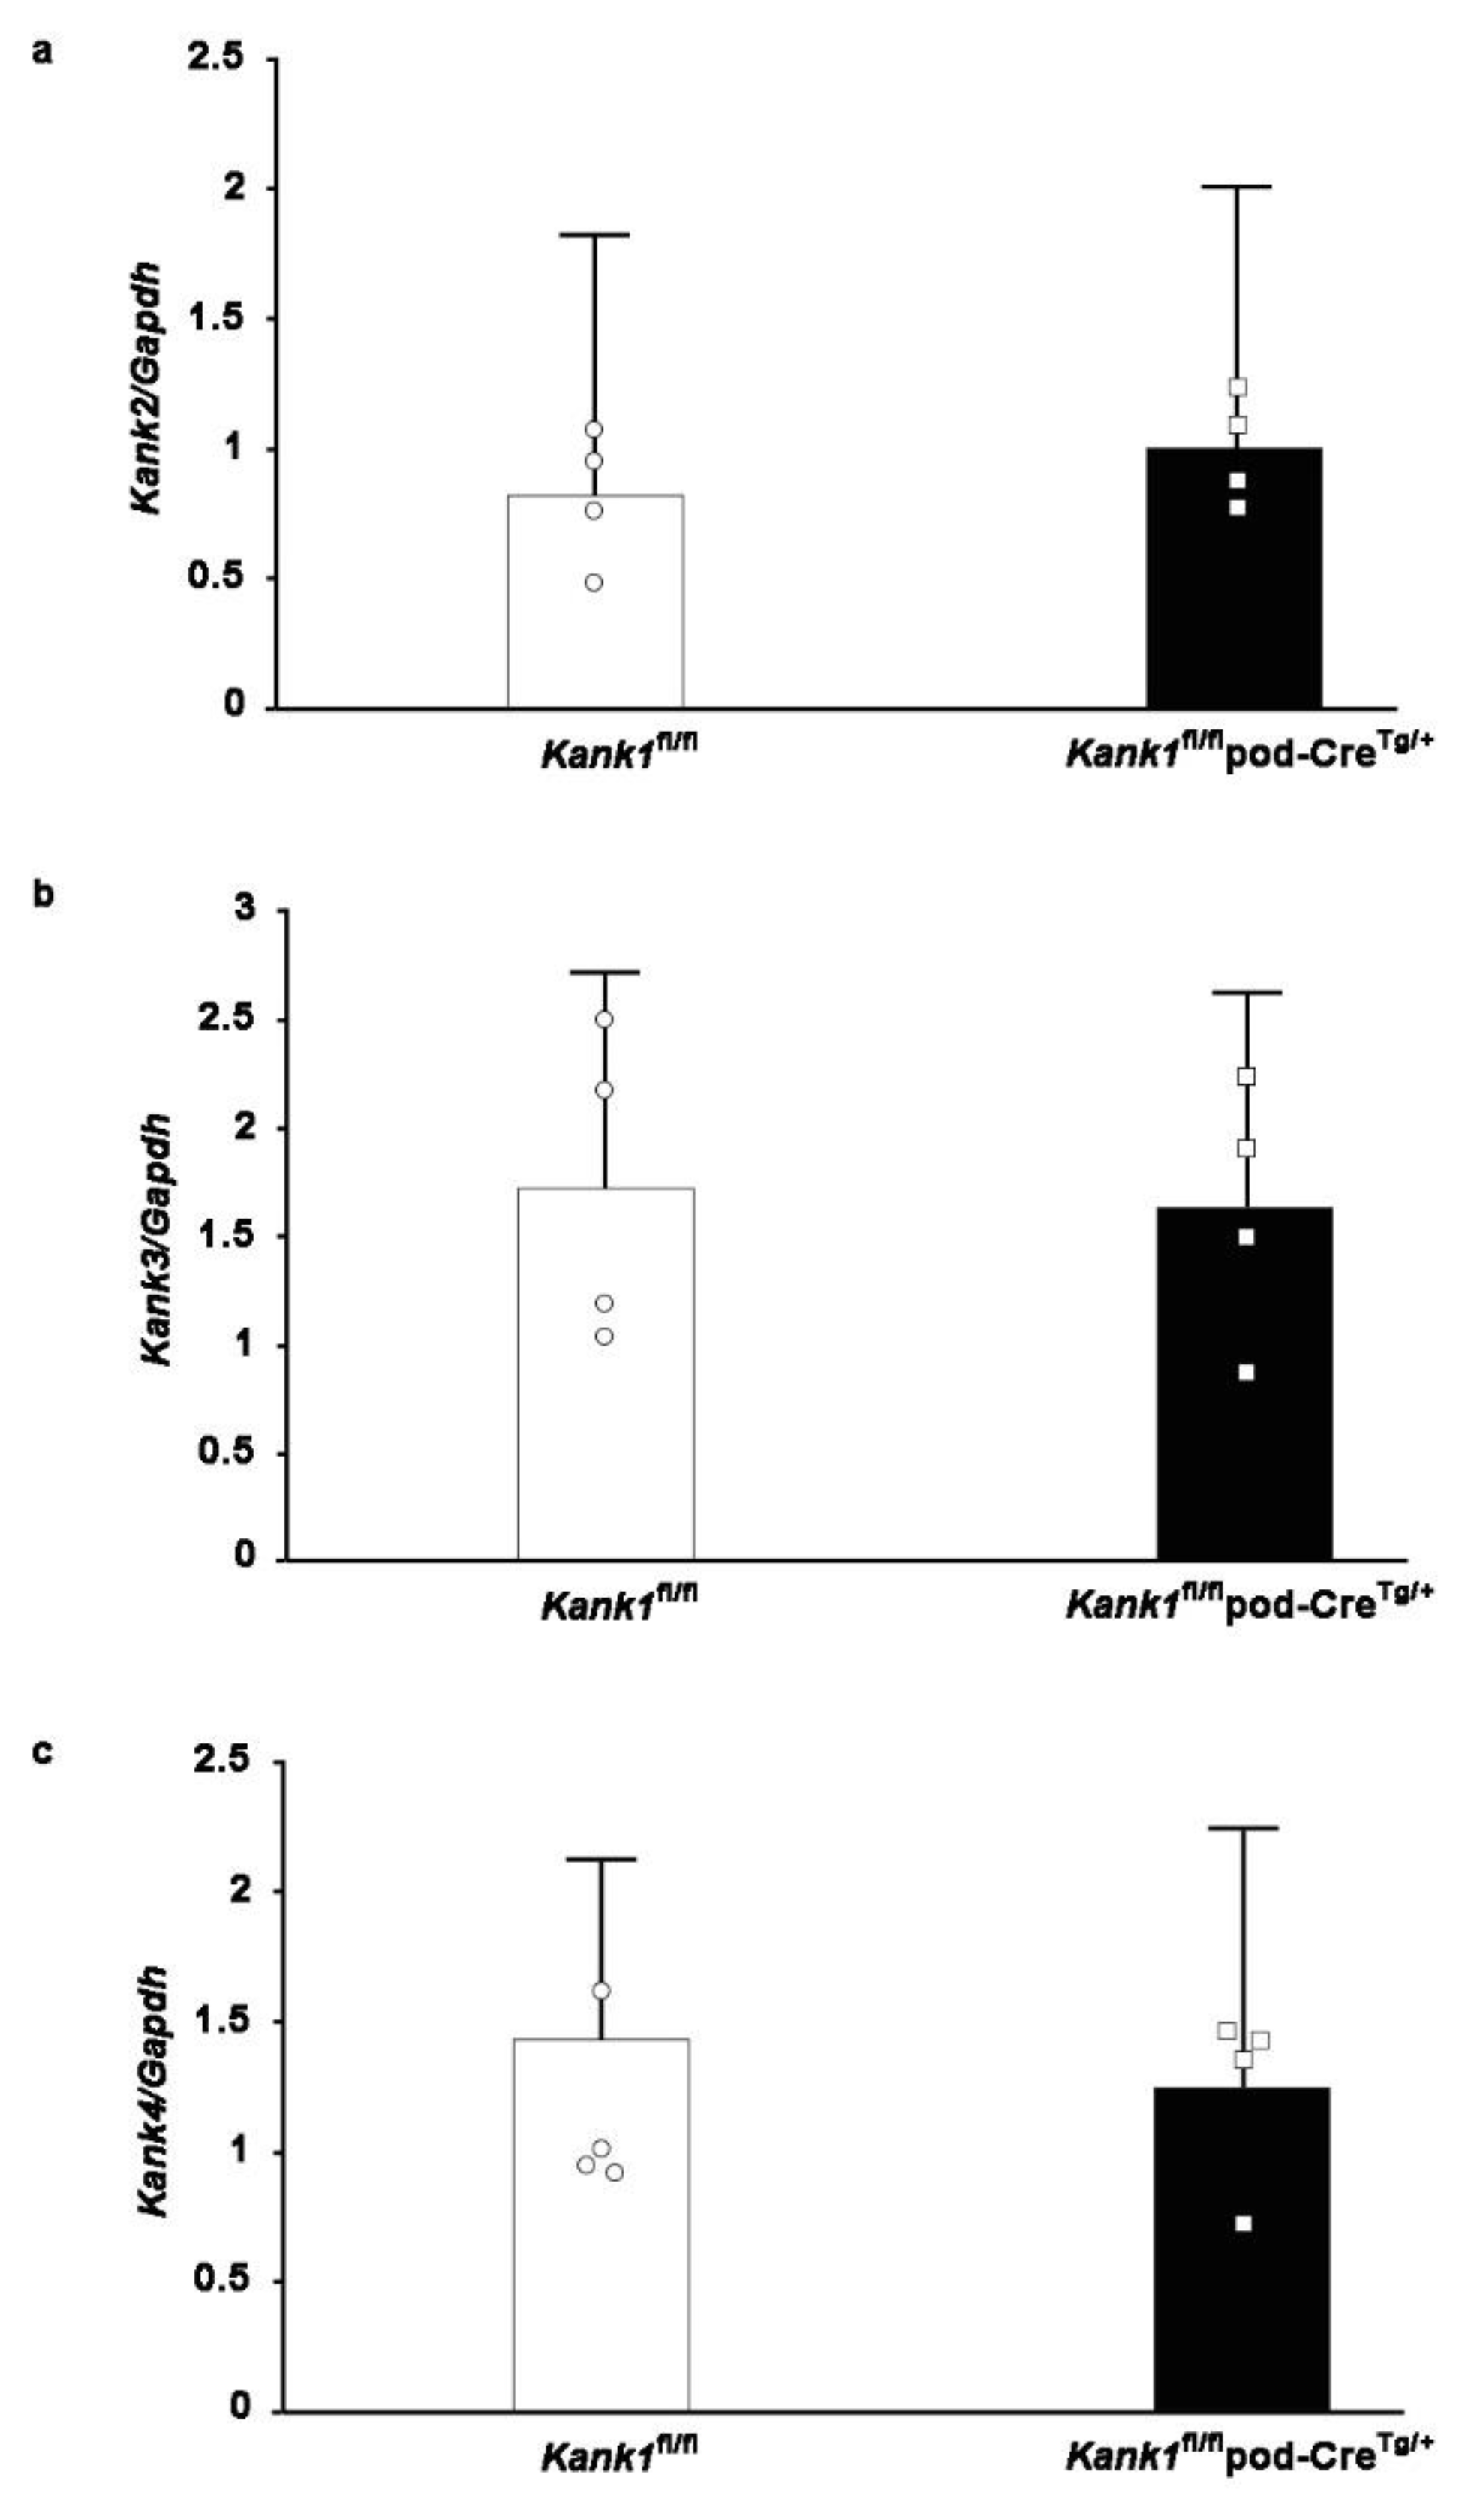
Figure 6.
Mild glomerular sclerosis was observed in podocyte-specific Kank1 knockout mice after adriamycin-induced kidney injury. (a) Two weeks after adriamycin injection, the urinary albumin-creatinine ratio (ACR) was significantly increased in the Kank1fl/flpod-CreTg/+ group compared to the Kank1fl/fl group (log ACR; 5.5 ± 0.8 vs. 7.4 ± 1.1, *P <0.05). (b) There was no significant difference in BUN or Cr levels between the Kank1fl/fl group and Kank1fl/flpod-CreTg/+ group. (c) Sclerotic index after adriamycin injection was significantly higher in the Kank1fl/flpod-CreTg/+ group than in the Kank1fl/fl group (*P <0.05), while the fibrotic index was not significant between the two groups. Scale bars indicate 20 µm. (d) Foot processes (FP) per micrometer of glomerular basement membranes (GBM) were significantly lower in the Kank1fl/flpod-CreTg/+ group than in the Kank1fl/fl group (*P <0.05). Scale bars indicate 2 µm.
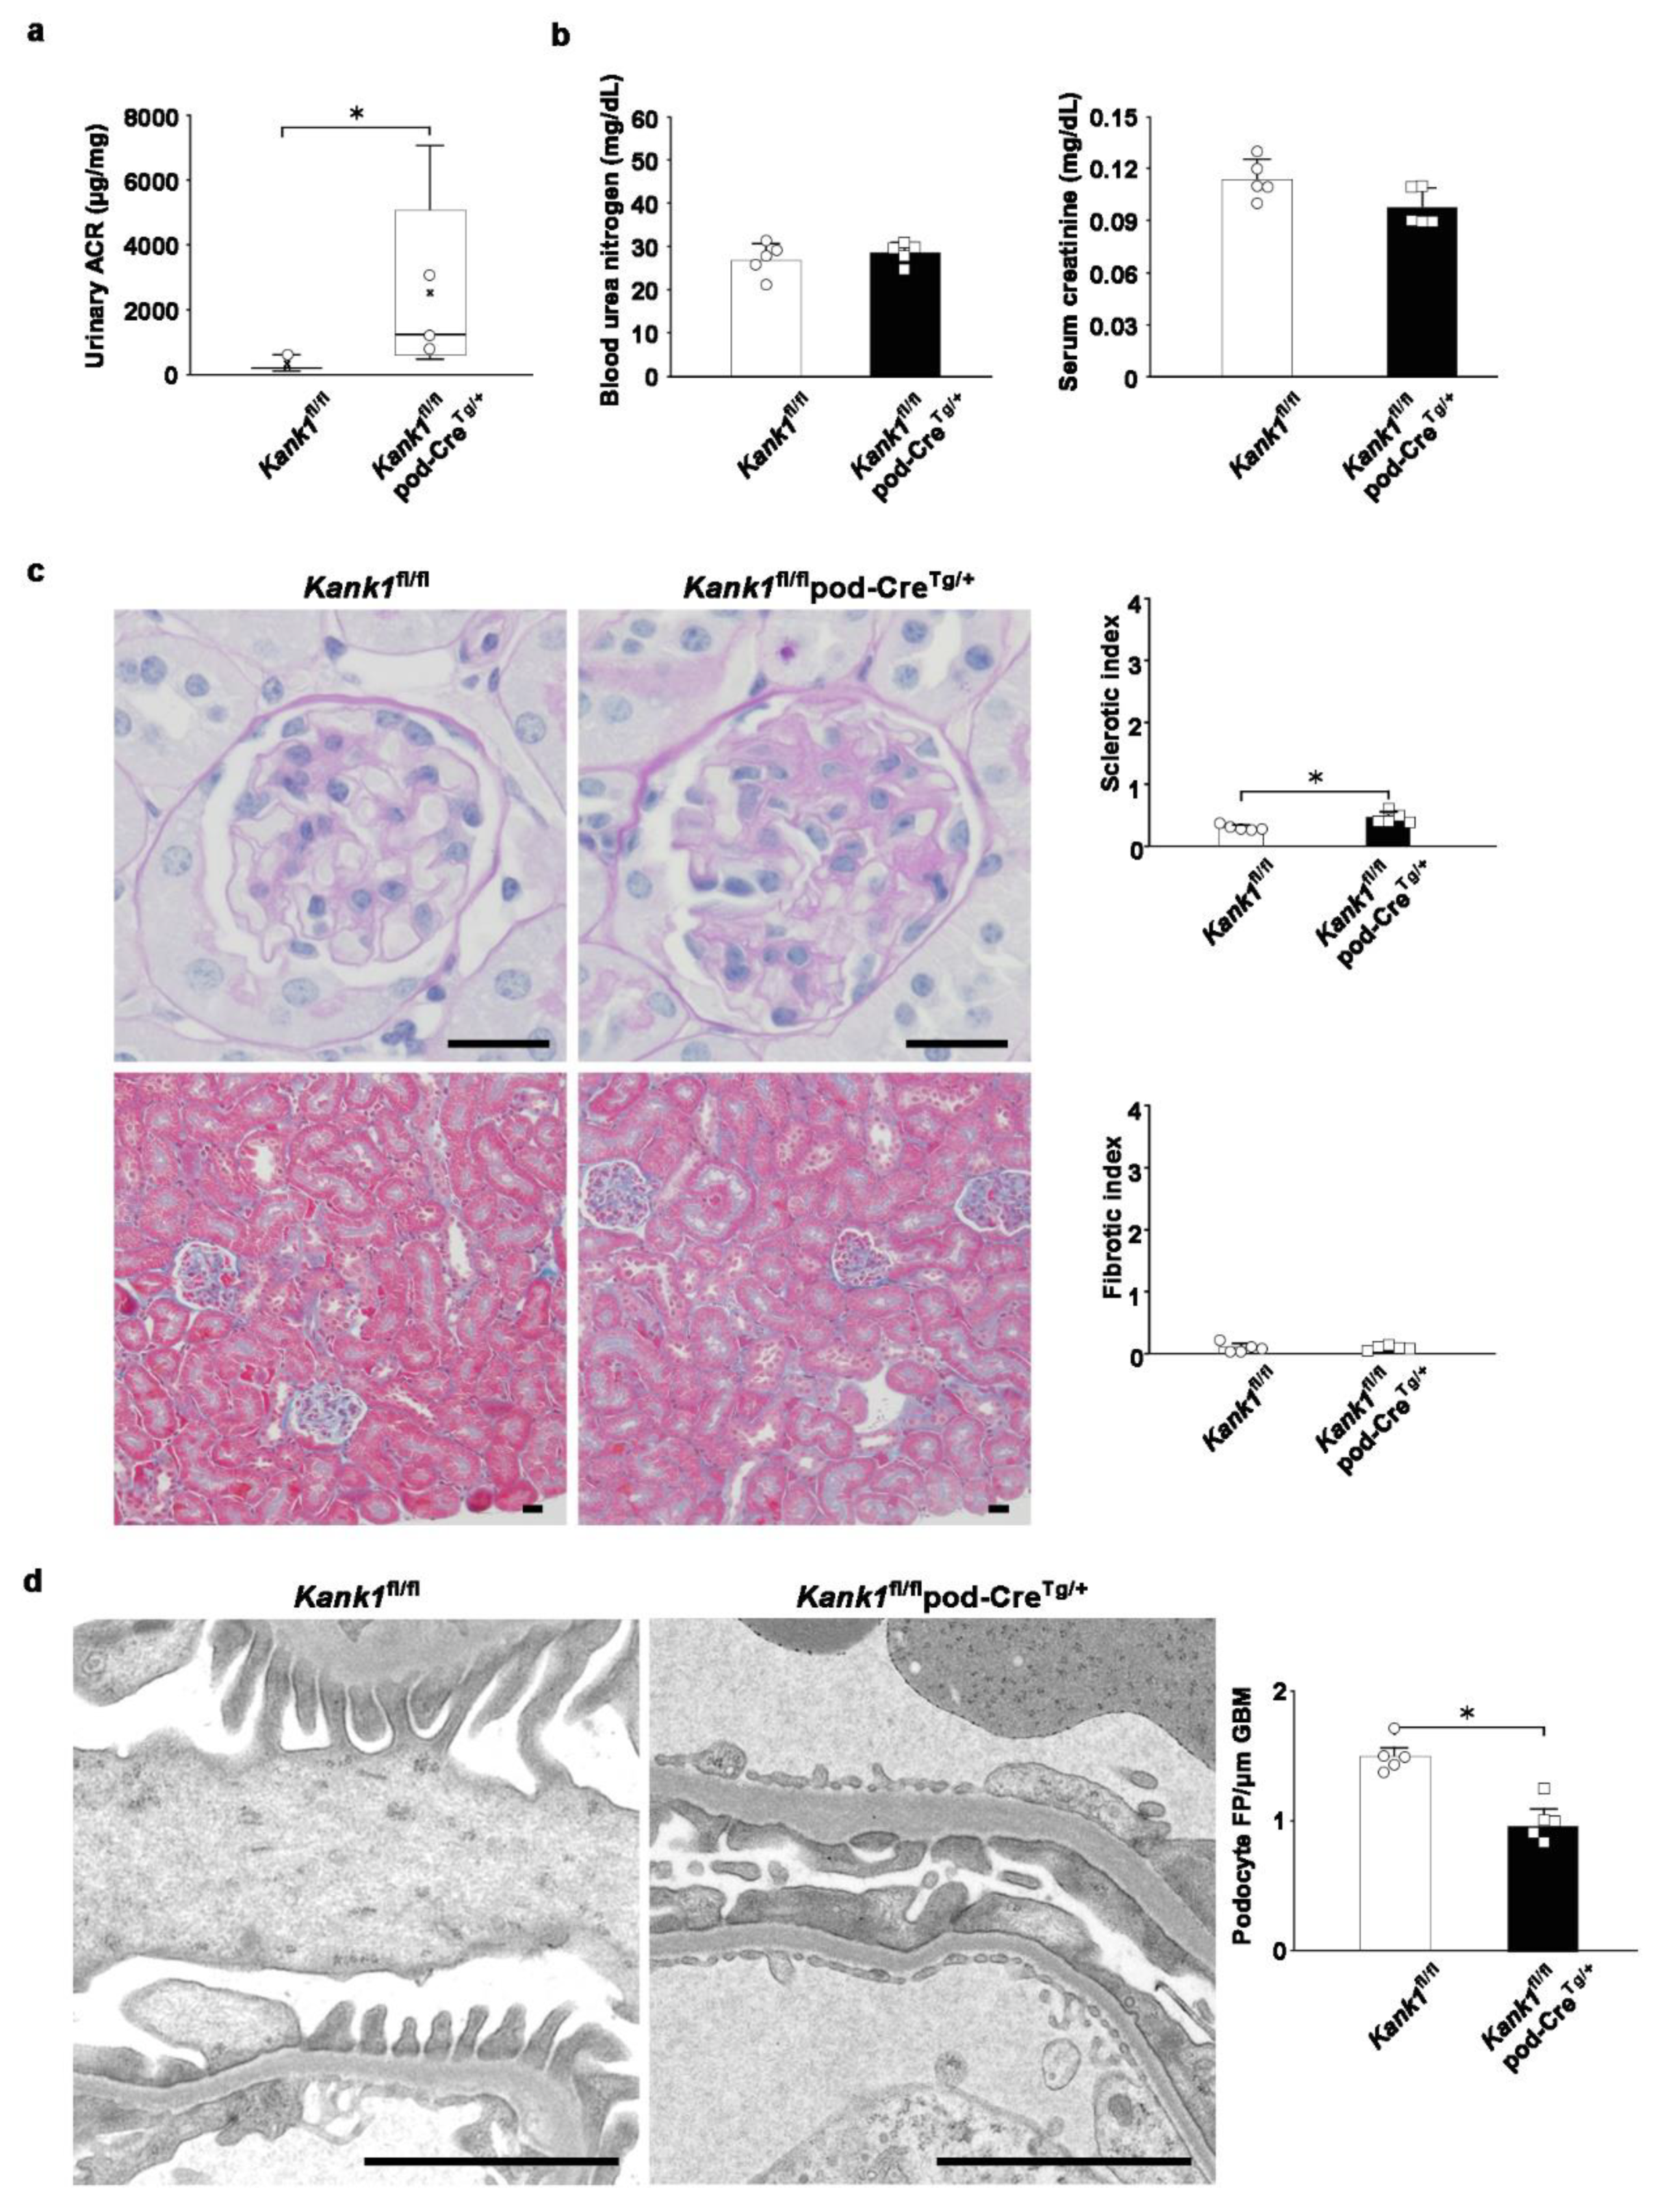
Figure 7.
Generation of human immortalized KANK1 knockout podocyte cell line. (a) The KANK1 protein was localized in the podocyte cytoplasm, co-localizing with the actin fibers' edges as stained with rhodamine-Phalloidin. Scale bars indicate 20 µm. (b) A sequence analysis identified a homozygous c.110ins A mutation in exon 2 of KANK1 in the KANK1KO podocytes. (c) The expression of KANK1 protein was not detectable at approximately 180 kDa in KANK1KO podocytes, while there was a visible band in wild-type (WT) immortalized podocytes. The expression of β-actin was comparable between the two groups. (d) Attached cells were significantly decreased from 24 h after adriamycin treatment in KANK1KO podocytes compared to WT podocytes (94.7% ± 13.6% vs. 61.1% ± 24.6% after 24 hours, *P <0.05, 78.2% ± 13.8% vs. 29.2% ± 29.5% after 48 h, **P <0.01). (e) The percentage of apoptotic cells was significantly increased in KANK1KO podocytes compared to WT podocytes (**P <0.01), and the percentage was increased significantly after adriamycin treatment (**P <0.01).
Disclaimer/Publisher’s Note: The statements, opinions and data contained in all publications are solely those of the individual author(s) and contributor(s) and not of MDPI and/or the editor(s). MDPI and/or the editor(s) disclaim responsibility for any injury to people or property resulting from any ideas, methods, instructions or products referred to in the content. |
© 2024 by the authors. Licensee MDPI, Basel, Switzerland. This article is an open access article distributed under the terms and conditions of the Creative Commons Attribution (CC BY) license (http://creativecommons.org/licenses/by/4.0/).
Copyright: This open access article is published under a Creative Commons CC BY 4.0 license, which permit the free download, distribution, and reuse, provided that the author and preprint are cited in any reuse.


