Submitted:
24 April 2024
Posted:
25 April 2024
You are already at the latest version
Abstract
Maternal unbalanced diets cause adverse metabolic programming and affect the offspring's liver microRNA profile. The liver is a site of β-carotene (BC) metabolism and a target of BC action. We studied the interaction of maternal Western diet (WD) and early-life BC supplementation on the epigenetic remodeling of offspring’s liver microRNAs. Mouse offspring of WD-fed mothers were given daily a placebo (controls) or BC during suckling. The liver miRNAome was analyzed in recently weaned animals by microarray hybridization. BC impacted the liver miRNAome differently in male and female offspring, with no overlap in differentially expressed (DE) miRNAs between sexes and more impact in females. Bioinformatic analysis of DE miRNA predicted target genes revealed enrichment in biological processes/pathways related to metabolic processes, regulation of developmental growth and circadian rhythm, liver homeostasis and metabolism, insulin resistance, and neurodegeneration, among others, with differences between sexes. Fifty five percent of the overlapping target genes in both sexes identified were targeted by DE miRNAs changed in opposite directions in males and females. The results identify sex-dependent responses of the liver miRNA expression profile to BC supplementation during suckling and may sustain further investigations regarding the long-term impact of early postnatal life BC supplementation on top of an unbalanced maternal diet.
Keywords:
Carotenoids
; β-carotene
; Liver
; microRNAs
; Western Diet
; Lactation
; Weaning
; early-life programming
1. Introduction
Carotenoids are natural pigments produced by vegetables, algae, and photosynthetic bacteria that play an important role in human health [1]. Among the carotenoids, β-carotene (BC) has been widely studied for its role as a precursor of vitamin A. In mammals, vitamin A and BC are crucial for the normal function of vision [2], skin [3], energy and lipid metabolism [4], and neurological processes [5,6], among others. Due to its potential to scavenge free radicals and its interaction with specific cellular signaling pathways, BC has been associated with protective effects against oxidative stress- and inflammation-related diseases, including cardiovascular diseases, type 2 diabetes, obesity, and some types of cancer [7], which are often associated with unbalanced obesogenic diets.
The liver is an important organ for vitamin A and BC metabolism, and BC has recognized hepatoprotective effects in adult animals [8,9]. Endogenous microRNAs (miRNAs, miR) contribute to the control of hepatic function and metabolism [10,11]. The miRNAs are short (20–22 nucleotides) non-coding RNA molecules that act at the post-transcriptional level to regulate (generally inhibit) gene expression. Interestingly, the ablation of carotenoid cleavage enzymes (BCO1 and BCO2) induces hepatic steatosis in mice by altering the farsenoid X receptor/miR-34a/sirtuin 1 pathway [12], suggesting a connection between BC metabolism and metabolic health through the regulation of specific miRNAs in the liver.
Studies in human and animal models indicate that maternal high-fat diet feeding and obesity result in adverse metabolic programming of the offspring [13]. miRNAs are epigenetic agents [14] that may play a role in the mechanisms of metabolic programming by dietary and other factors in early life. Besides miRNAs present at variable levels in breast milk [15,16], changes in endogenous miRNAs in offspring tissues could be involved. In particular, animal studies indicate that maternal high-fat diet affects miRNA expression in the liver of the fetus, recently weaned offspring, and adult offspring [17,18,19,20,21]. The metabolic programming activity of BC, in its turn, has been little studied, but emerging evidence suggests that carotenoids in human milk may play important roles in infant nutrition and development [22], and it is known that breast milk BC content is decreased in obese mothers [23]. Supplementation with BC and preformed vitamin A during lactation were shown to have distinct effects on adipose tissue DNA methylation in rats [24]. However, to our knowledge, no studies have addressed the possible interactive effects of a maternal obesogenic diet and BC supplementation during lactation on the miRNA expression profile in the offspring’s liver.
In this work, we hypothesized that BC supplementation during lactation could beneficially modify miRNA expression in the liver of offspring exposed to an unbalanced diet during development. To test this hypothesis, mouse offspring born to dams fed an obesogenic Western Diet (WD) rich in fat and sucrose were orally supplemented with placebo (controls) or BC during the suckling period. The liver miRNA profile was analyzed in the recently weaned animals for differential expression using a microarray direct hybridization method. To elucidate possible post-transcriptional regulation by these miRNAs, we constructed pathway interaction and miRNA-gene regulatory networks through integrated analysis of the crucial miRNAs showing modulation.
2. Materials and Methods
2.1. Experimental Design
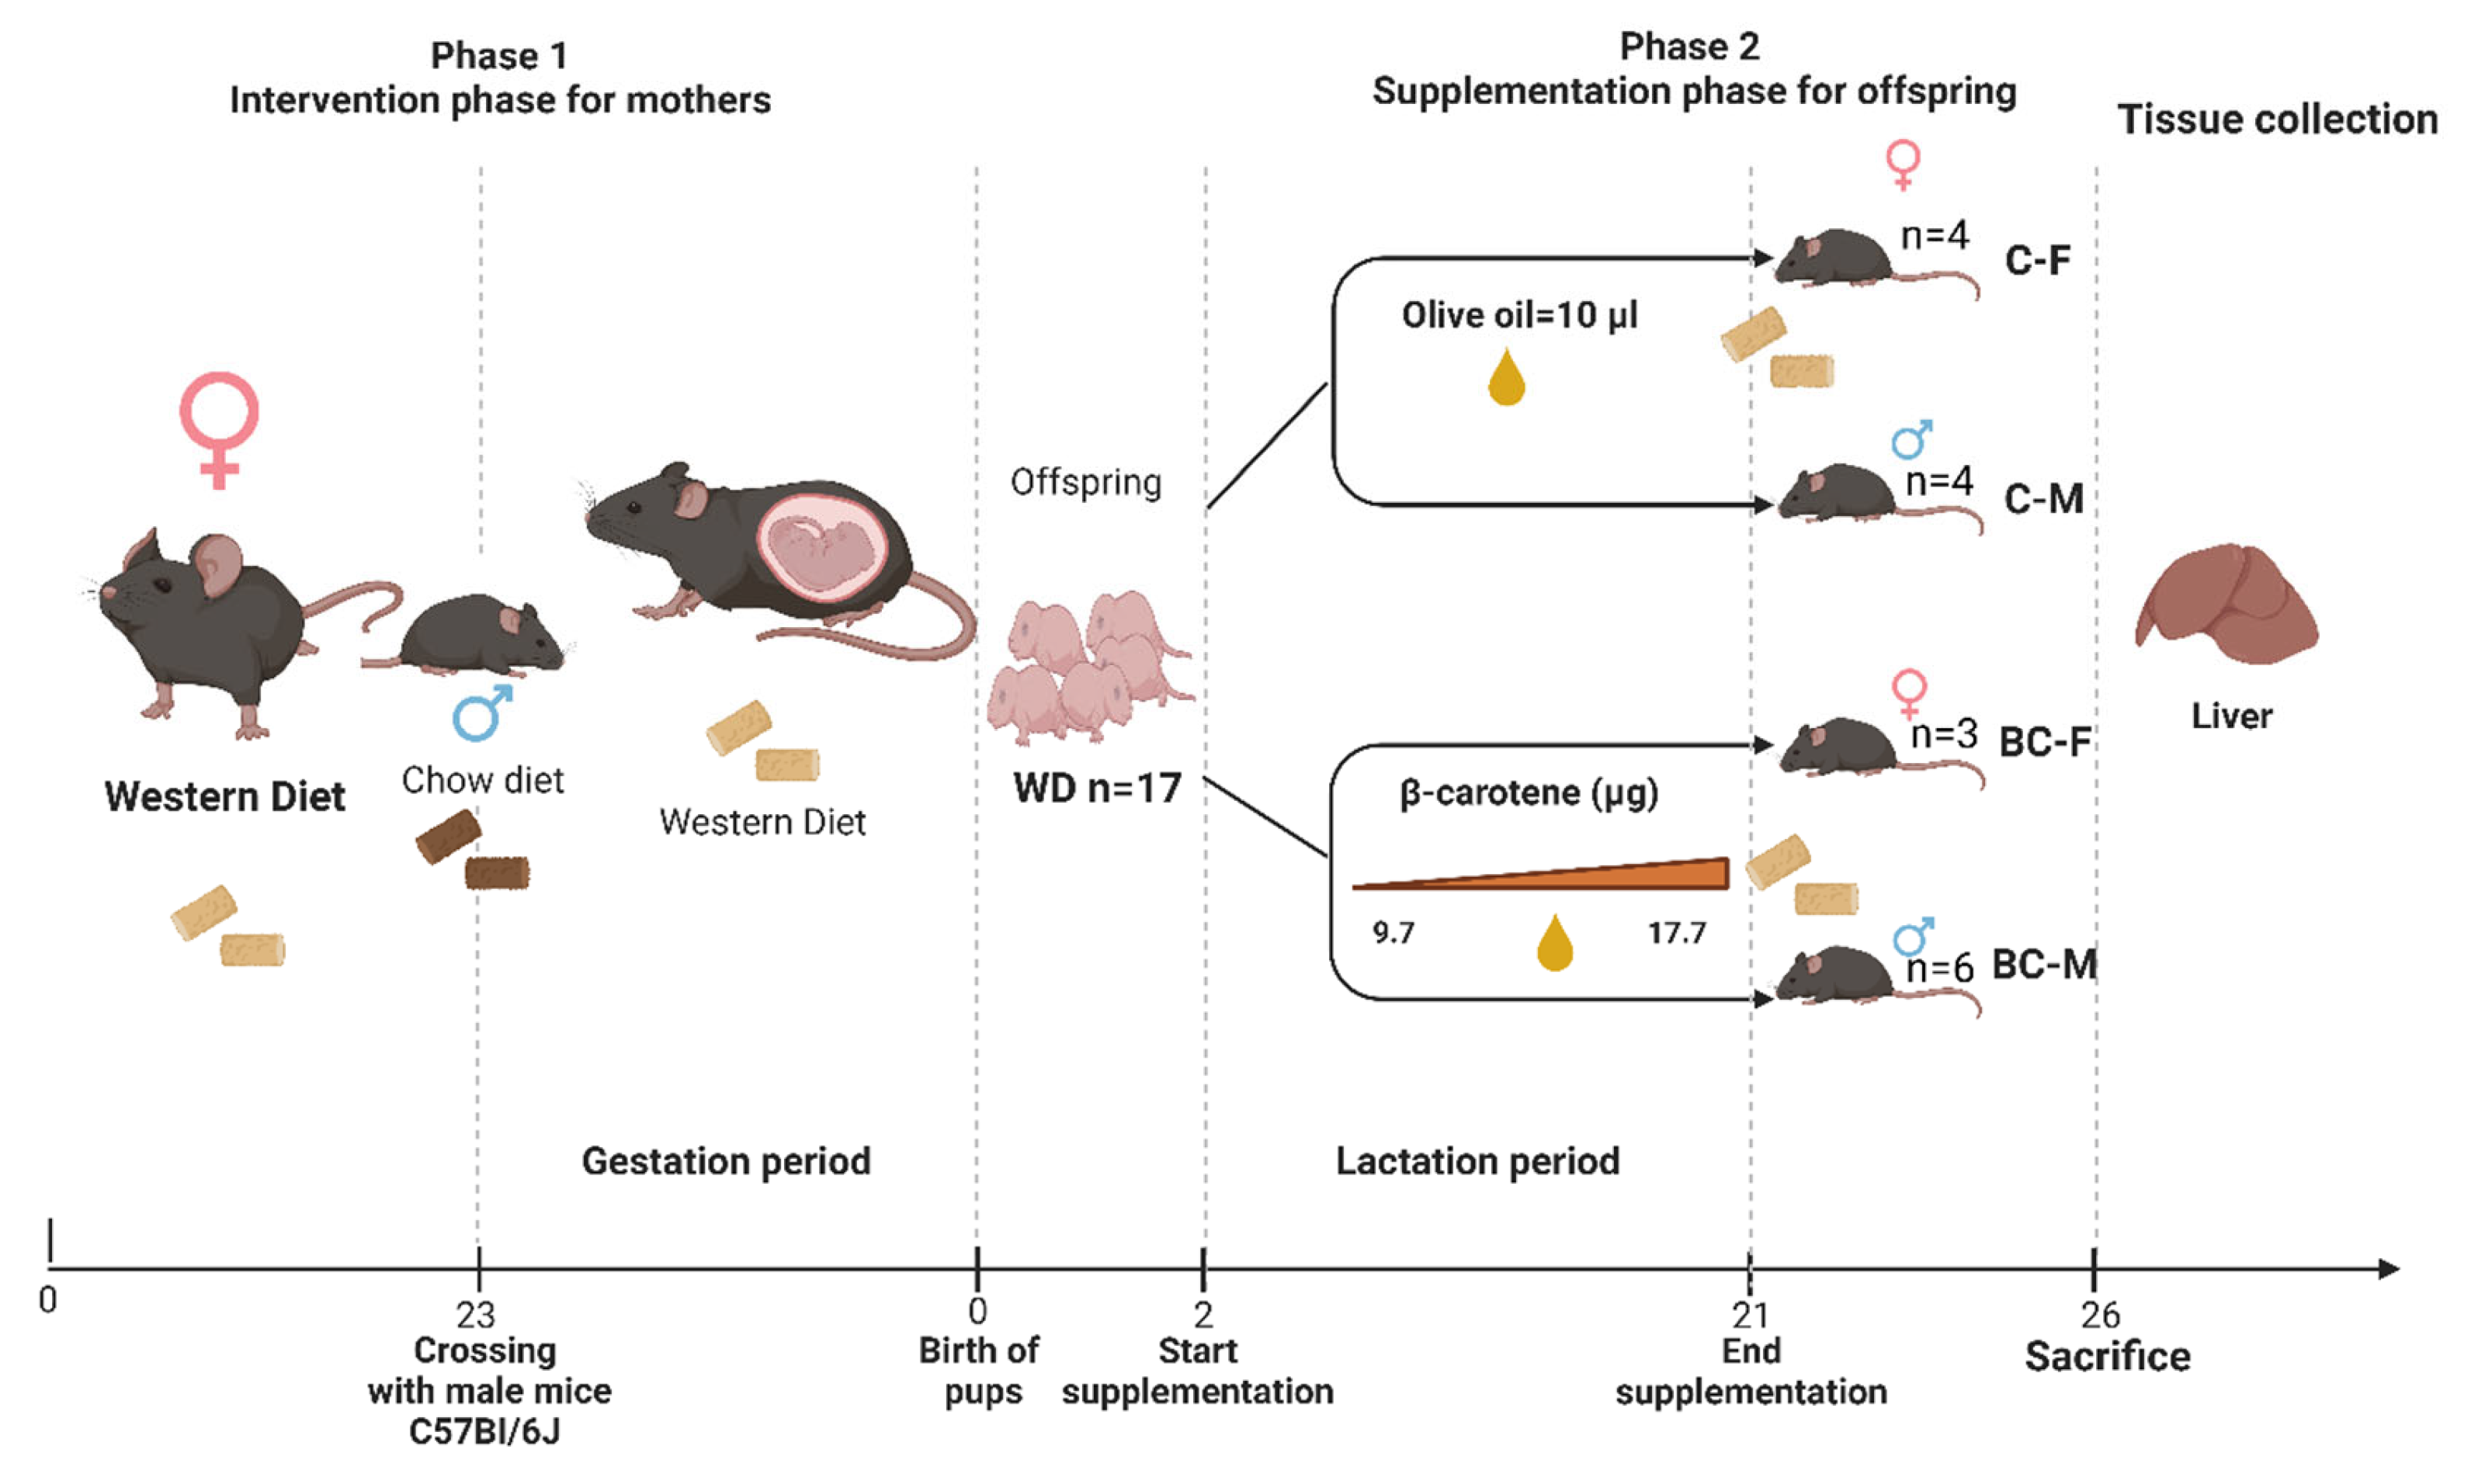
The animal protocol of this study (Figure 1) was reviewed and approved by the Animal Experimentation Ethics Committee (CEEA) of the University of the Balearic Islands (#ECC/566/2015 of March 20). Institutional use and care guidelines for laboratory animals were followed. C57BI/6J female mice kept under constant conditions of 12/12-h light-dark cycle at room temperature of 22 °C, and with free access to food and water were used. The female mice were switched from the standard chow diet (LASQCdiet®Rod14-H, Lage, Germany) to a WD pellet diet (D12079B, Research Diets, New Brunswick, NJ, USA) 23 days before mating with males of the same strain fed the standard chow. The dams continued to be fed the WD during the whole gestation and lactation period. From day 2 post-delivery until weaning (on postnatal day 21), the pups were orally treated daily, with the aid of a pipette, with 10 μL olive oil (control group) or the same volume of β-carotene (BC group) dissolved in olive oil. The amount of supplemented BC increased progressively from 10 μg BC per pup per day on postnatal d2 to 18 μg on d20 and corresponded to ~three-fold the vitamin A ingested daily through maternal milk. The daily amount of BC to be administered was calculated from the reported vitamin A concentration as retinyl ester in mouse milk [25], the estimated daily milk intake of mouse pups (which increases along the suckling period) [26], and the vitamin A equivalency of BC (VEB) in oil. We used a VEB of 2.5:1, which is based on the reported micrograms of BC in oil required to form 1 μg retinol in children, as in previous work with a similar animal study design [27]. At weaning, offspring were separated by sex, making up four experimental groups: control male and female mice (C-M and C-F, respectively) and BC-supplemented male and female mice (BC-M and BC-F). The animals continued to be fed with WD until sacrifice on postnatal day 26, when livers were collected, frozen immediately in liquid nitrogen, and stored at -80 ˚C until RNA extraction and analysis.
Figure 1.
Diagram of the experimental study design. Phase 1, intervention phase for mothers; phase 2, supplementation phase for offspring during the lactation period. The mothers were kept on the WD during the lactation period. WD, Western Diet; C-F, Control-female; C-M, Control-male; BC-F, β-carotene-female; BC-M, β-carotene-male. Created with BioRender.
2.2. RNA Isolation and Quantification
The mirVanaTM miRNA Isolation Kit (Ambion by Life Technologies, Grand Island, NY, USA) was used to extract miRNA from liver samples following the manufacturer’s instructions. First, 0.024 ± 0.005 g of liver samples were homogenized in 250 μL of lysis binding buffer, on ice. A spike-in of Arabidopsis thaliana microRNA (ath-miR-159a, 1 ƿmol, 2 μL) was added to each sample as a standard, vortexed for 30 sec, and incubated on ice for 5 min. Then, 1/10 volume of miRNA Homogenate Additive (55 μL) was added to the homogenate, mixed by vortexing, and left for 10 min on ice. Subsequently, 250 μL phenol/chloroform was added and vortexed for 1 min. The mixture was then centrifuged for 10 min at 10,000 g at 4°C to separate the aqueous phase from the organic phase. The aqueous phase (upper) was pipetted and transferred to an RNase-free Eppendorf (200 μL) and 1.25 volumes of 100% ethanol were added at room temperature and mixed by inversion (5 times). Each sample was passed through the columns in aliquots of 250 μL and centrifuged for 30 sec at 10,000 g, the eluate was discarded. This was repeated until all the lysate/ethanol mixture was passed through the filter. The filter/column was washed with 700 μL of miRNA wash solution 1 and centrifuged for 10 sec at 10,000 g, and then the column was washed with 500 μL of wash buffer solution 2/3, centrifuged twice at 10,000 g for 10 sec, and the eluate was discarded each time. A spin of 1 min was performed to remove the remains of the filter. The columns were transferred to a new collection RNase-free tube, and 50 μL of RNase-free water at 95°C were added and incubated for 2 min. Finally, it was centrifuged for 30 sec at maximum speed, and the RNA eluate was collected and stored at -80°C. Nucleic acids extracted were quantified by spectrophotometry with NanoDrop ND-1000 (ThermoFisher Scientific, Waltham, MA, USA) at 260 nm, using 2 µL, which allows it to be quantified in ng/µL with reproducibility and precision. Samples with nucleic acid concentration >100 ng/μL were used. RNA quality and integrity were checked by 260/280 ratio and confirmed by 1% agarose gel electrophoresis.
2.3. miRNA Assessment
150 ng of liver RNA/miRNA was used as input for miRNA profiling using the n-counter flex NanoString Technology. Mature miRNAs underwent an annealing procedure for 13 min with the following conditions: 94°C for 1 min, 65°C for 2 min, and 45°C for 10 min. Then, miRNAs were ligated to a species-specific tag sequence (miRtag) via a thermally controlled splinted ligation at 48°C for 3 min, 47°C for 3 min, 46°C for 3 min, 45°C for 5 min, and 65°C for 10 min (24 min in total). The unligated miRtags were removed by enzymatic purification using Ligase cleanupTM enzyme for 70 min. miRtagged mature miRNAs were then hybridized with the mouse miRNA V 1.5 panel (LBL-C0068-02) according to the instructions at nCounter® miRNA Expression Assay User Manual (NanoString Technologies, Seattle, WA, USA) for 22 h at 65°C. The unhybridized CodeSet was removed with automated purification performed on the nCounter Prep Station, and the remaining target probe complexes were transferred and bound to an imaging surface as previously described [28]. The data output was imported into nSolver™ 4.0 Analysis software (NanoString Technologies, Seattle, WA, USA). Raw data were exported as an Excel table for further bioinformatics analysis.
2.4. Bioinformatic Analysis
Volcano plots were created using SRPLOT tools based on the normalized counts to identify significant DE miRNAs. The R heatmap function (v1.0.12) was used to perform heatmap clustering. Three databases, miRWalk, TargetScan, and miRDB, were used to identify predicted miRNA target genes. The miRNA-target genes networks were plotted with Cytoscape software (which overlaps genes from the three aforementioned databases). Finally, gene ontology (GO) and Kyoto Encyclopedia of Genes and Genomes (KEGG) analysis of the predicted targets of the differentially expressed miRNAs in BC-M and BC-F groups were conducted using DIANA miRPath tools [29]. The STRING online tool was used to identify protein-protein interactions among identified key genes. STRING provides direct (physical) interactions and indirect (functional) associations that stem from computational prediction, knowledge transfers between organisms, and interactions aggregated from other (primary) databases. The miRNAs targeting Bco1 mRNA were identified on the miRwalk platform using two filters: CDS and binding probabilities. A binding probability of 1 indicates higher quality prediction. Finally, experimentally validated microRNA-target interactions were assessed using miRTarbase.
2.5. Statistical Analysis
Comparisons between the vehicle-treated (control group, C) and β-carotene (BC)-treated groups were carried out for each sex (C-M/BC-M and C-F/BC-F). For biometric parameters, all data are shown as means and standard error of the mean (SEM). Statistical analyses were conducted using Graph Pad Prism 10 for Windows (GraphPad Software, La Jolla, CA, USA). Comparisons between groups were performed with one-way ANOVA with Uncorrected Fisher's LSD; differences were considered significant when P< 0.05. For miRNA expression profiling, the DESeq2 R package [30] was used to perform data normalization based on miRNA raw counts and the analysis of differentially expressed (DE) miRNA between sex-matched BC and C groups. miRNAs that showed > 0.5-fold change in BC-M vs. C-M and >1-fold change in BC-F vs. C-F with a P-value <0.05 were used as cut-offs to filter DE miRNAs. Similarly, a cut-off of P< 0.05 was used for significant enrichment results in GO and KEGG analyses. The top 10 enriched terms were plotted with dotplot using the clusterProfiler R package.
3. Results
3.1. Biometric Parameters
Body weight, adipose tissue, and liver weights of recently weaned control and BC-supplemented male and female offspring born to mothers fed an obesogenic WD are shown in Supplementary Table S1. BC supplementation during the suckling period contributed to a significantly decreased body weight in male offspring compared to mice with obesogenic diet only (C-M= 13.73±0.53 g, BC-M= 12.45±0.17 g, P= 0.03), but not in female offspring (C-F= 11.85±0.37 g, BC-F= 11.13±0.35 g, P= 0.129). The BC-supplemented male offspring also displayed decreased retroperitoneal (C-M= 23.1±2.8 mg, BC-M= 18.2±0.8 mg, P= 0.027) and gonadal white adipose tissue mass (C-M= 129.2±15.8 mg, BC-M= 102.5±3.1 mg, P= 0.0309) compared with their sex-matched controls. No statistically significant changes in any biometric parameter were observed in female offspring.
3.2. Nanostring Analysis of miRNAs and Differentially Expressed miRNAs
The hepatic miRNAs affected by BC supplementation differed between male and female animals, with no common differentially expressed (DE) miRNAs found.
Figure 2 depicts DE miRNAs in the liver of male mice treated with BC compared to controls. The volcano plot (Figure 22A) shows that 10 miRNAs were differently expressed between the BC-M and the C-M groups. Specifically, one miRNA was downregulated, and nine were upregulated in the BC-M group. The clustered heatmap in Figure 2B shows the expression levels of these DE miRNAs in the two groups of male animals. Table 1 lists and summarizes the DE miRNAs in the BC-M vs. C-M group.
Figure 2.
A) Volcano plot and B) Heatmap visualizing differentially expressed miRNAs in the liver of BC and Control male mice. In the volcano plot, the blue spots represent downregulated miRNAs and the pink upregulated miRNAs. Grey spots represent miRNAs that did not show significant changes between the two groups. C-M, Control-male; BC-M, β-carotene-male.
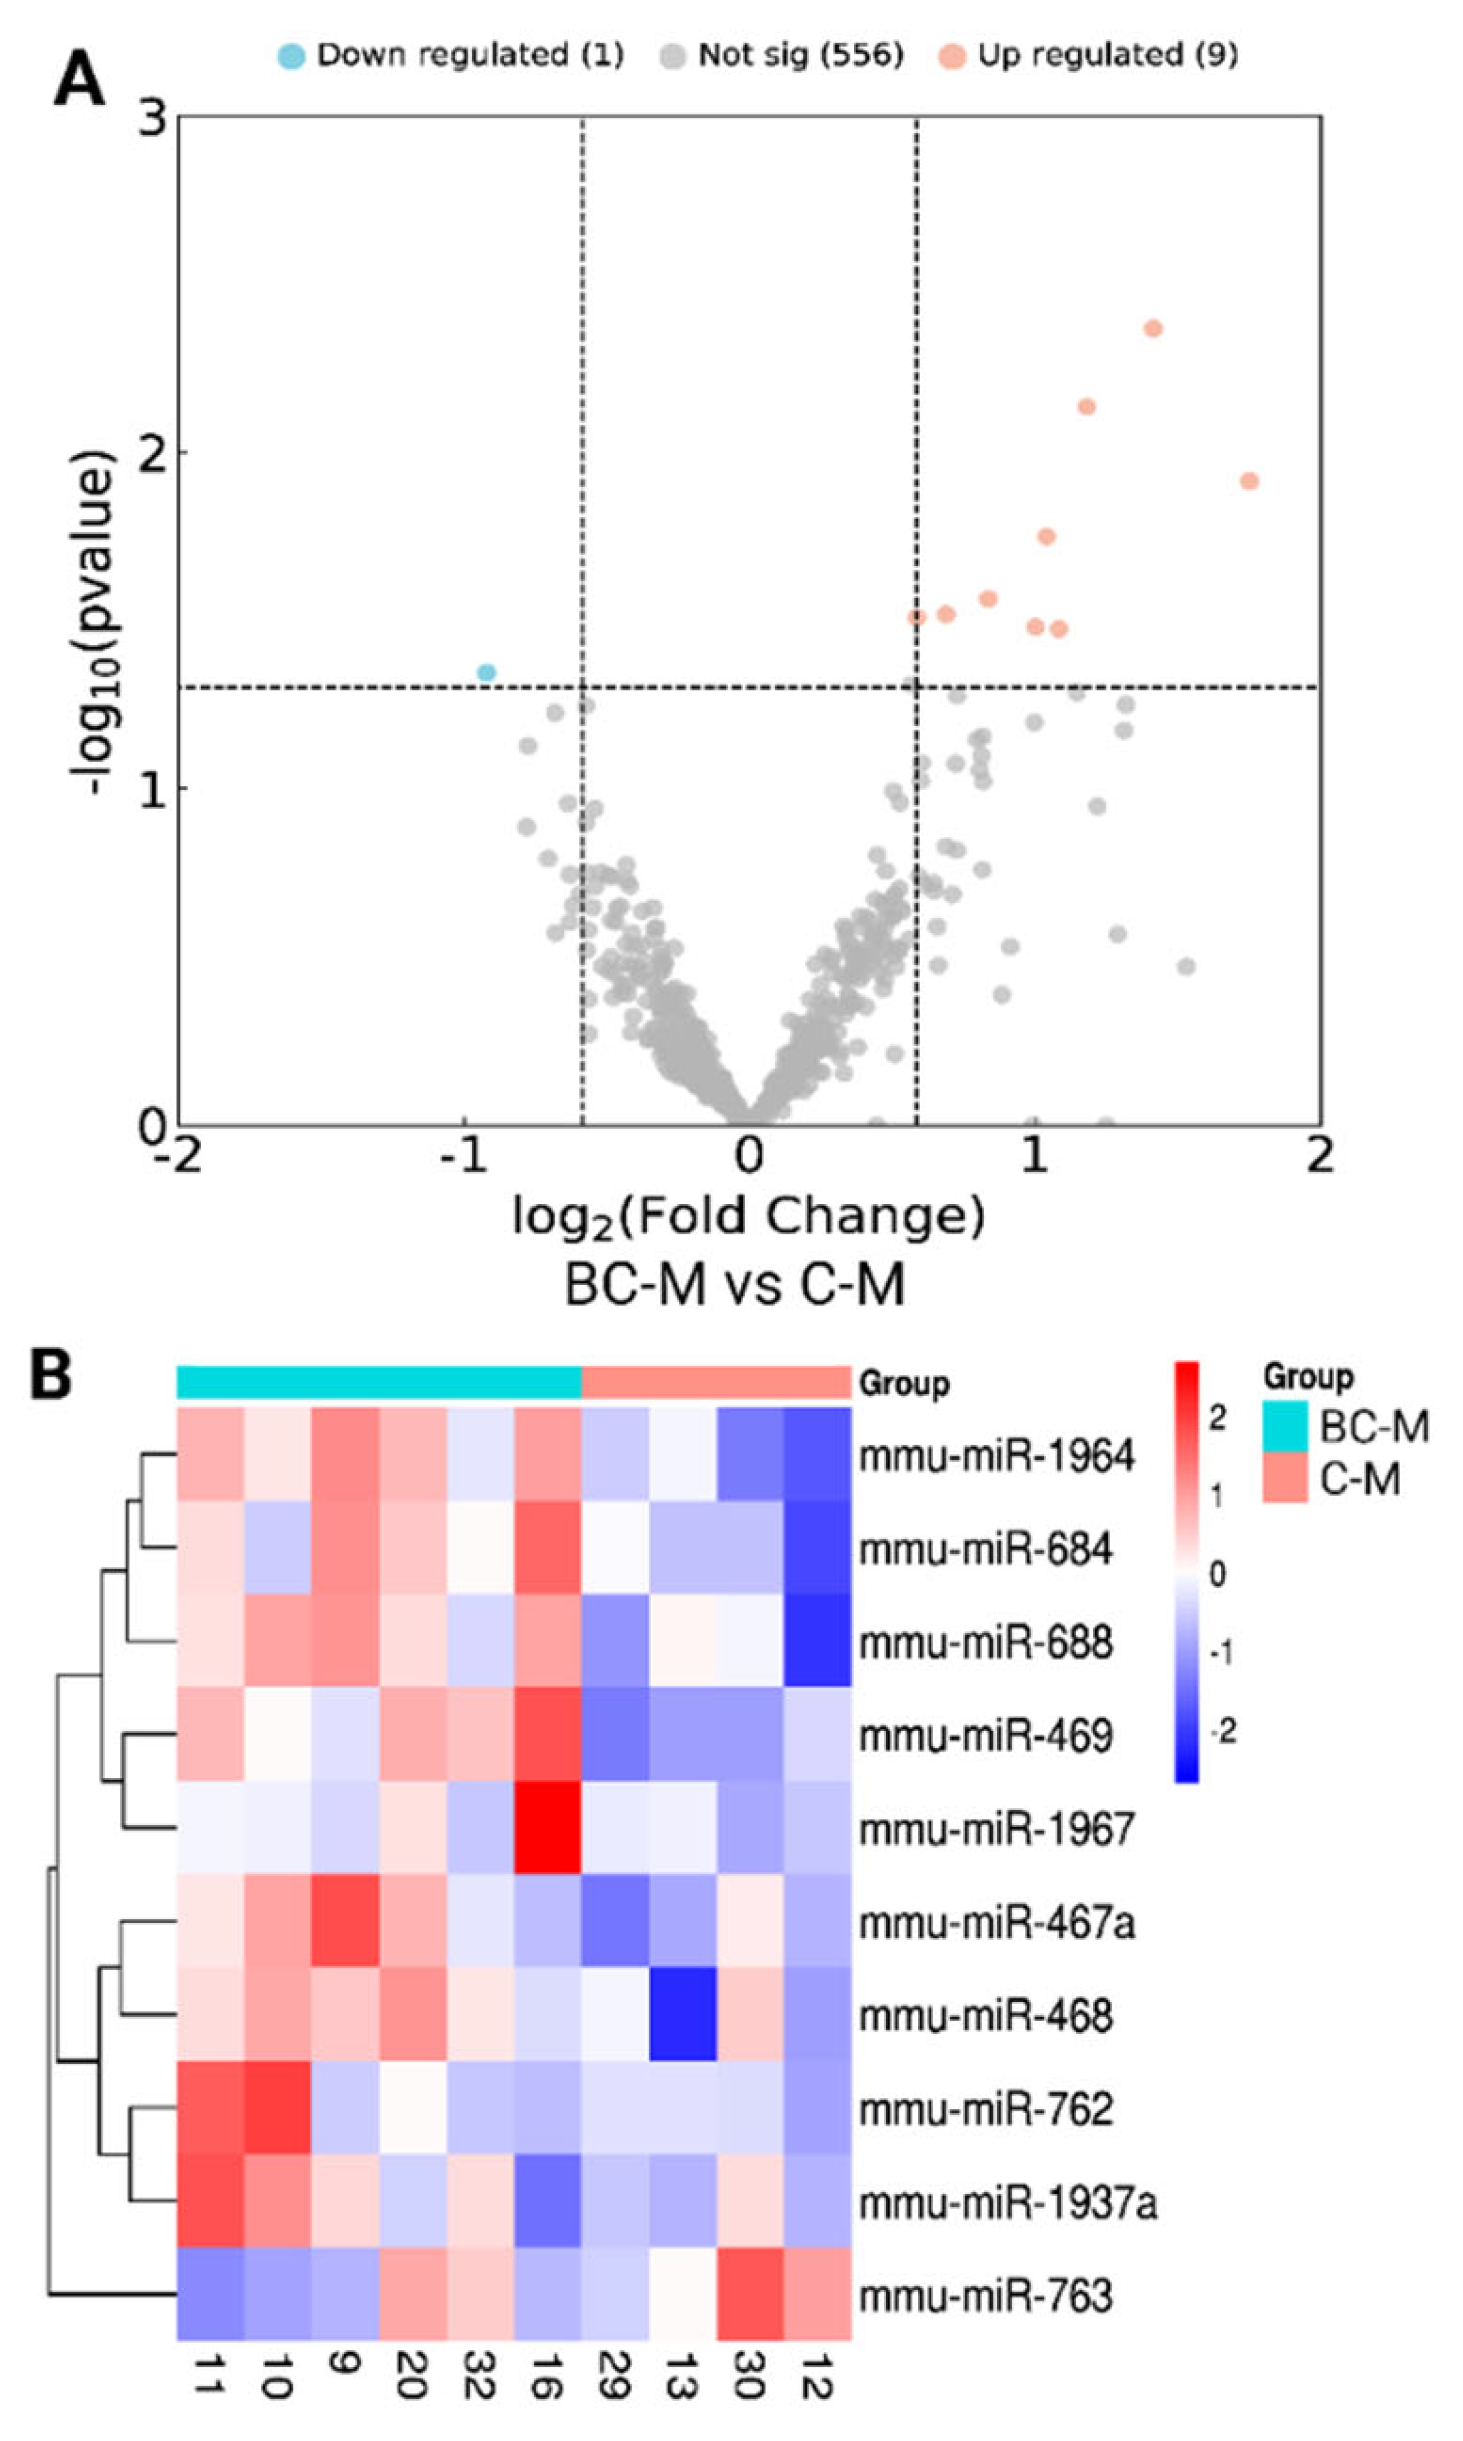

Table 1.
Differentially expressed miRNAs in the liver of males with BC supplementation.
| miRNA | Fold change | Regulation | P-value |
|---|---|---|---|
| mmu-miR-763 | -1.893 | Down | 0.0453 |
| mmu-miR-1937a/b | 1.751 | Up | 0.0121 |
| mmu-miR-762 | 1.41458 | Up | 0.004291 |
| mmu-miR-468 | 1.181217 | Up | 0.007326 |
| mmu-miR-1967 | 1.083272 | Up | 0.033513 |
| mmu-miR-469 | 1.040029 | Up | 0.017799 |
| mmu-miR-688 | 1.001268 | Up | 0.033073 |
| mmu-miR-684 | 0.836395 | Up | 0.027278 |
| mmu-miR-1964 | 0.687733 | Up | 0.030326 |
| mmu-miR-467a | 0.585563 | Up | 0.030996 |
Figure 3 shows results in females. There were 51 miRNAs differently expressed in the liver of the BC-F vs. C-F group. Of these, 42 were downregulated and 9 upregulated in the BC-supplemented females, as highlighted in the Volcano plot (Figure 3A). The clustered heatmap in Figure 3B shows the expression levels of these DE miRNAs in the two groups of female animals (note the heterogeneity within the C-F group). Table 2 lists the DE miRNAs in the BC-F vs. C-F group.
Figure 3.
A) Volcano plot and B) Heatmap visualizing differentially expressed miRNAs in the liver of BC and Control female mice. In the Volcano plot, the blue spots represent downregulated miRNAs and the pink upregulated miRNAs. Grey spots represent miRNAs that did not show significant changes between the two groups. C-F, control-female; BC-F, β-carotene-female.
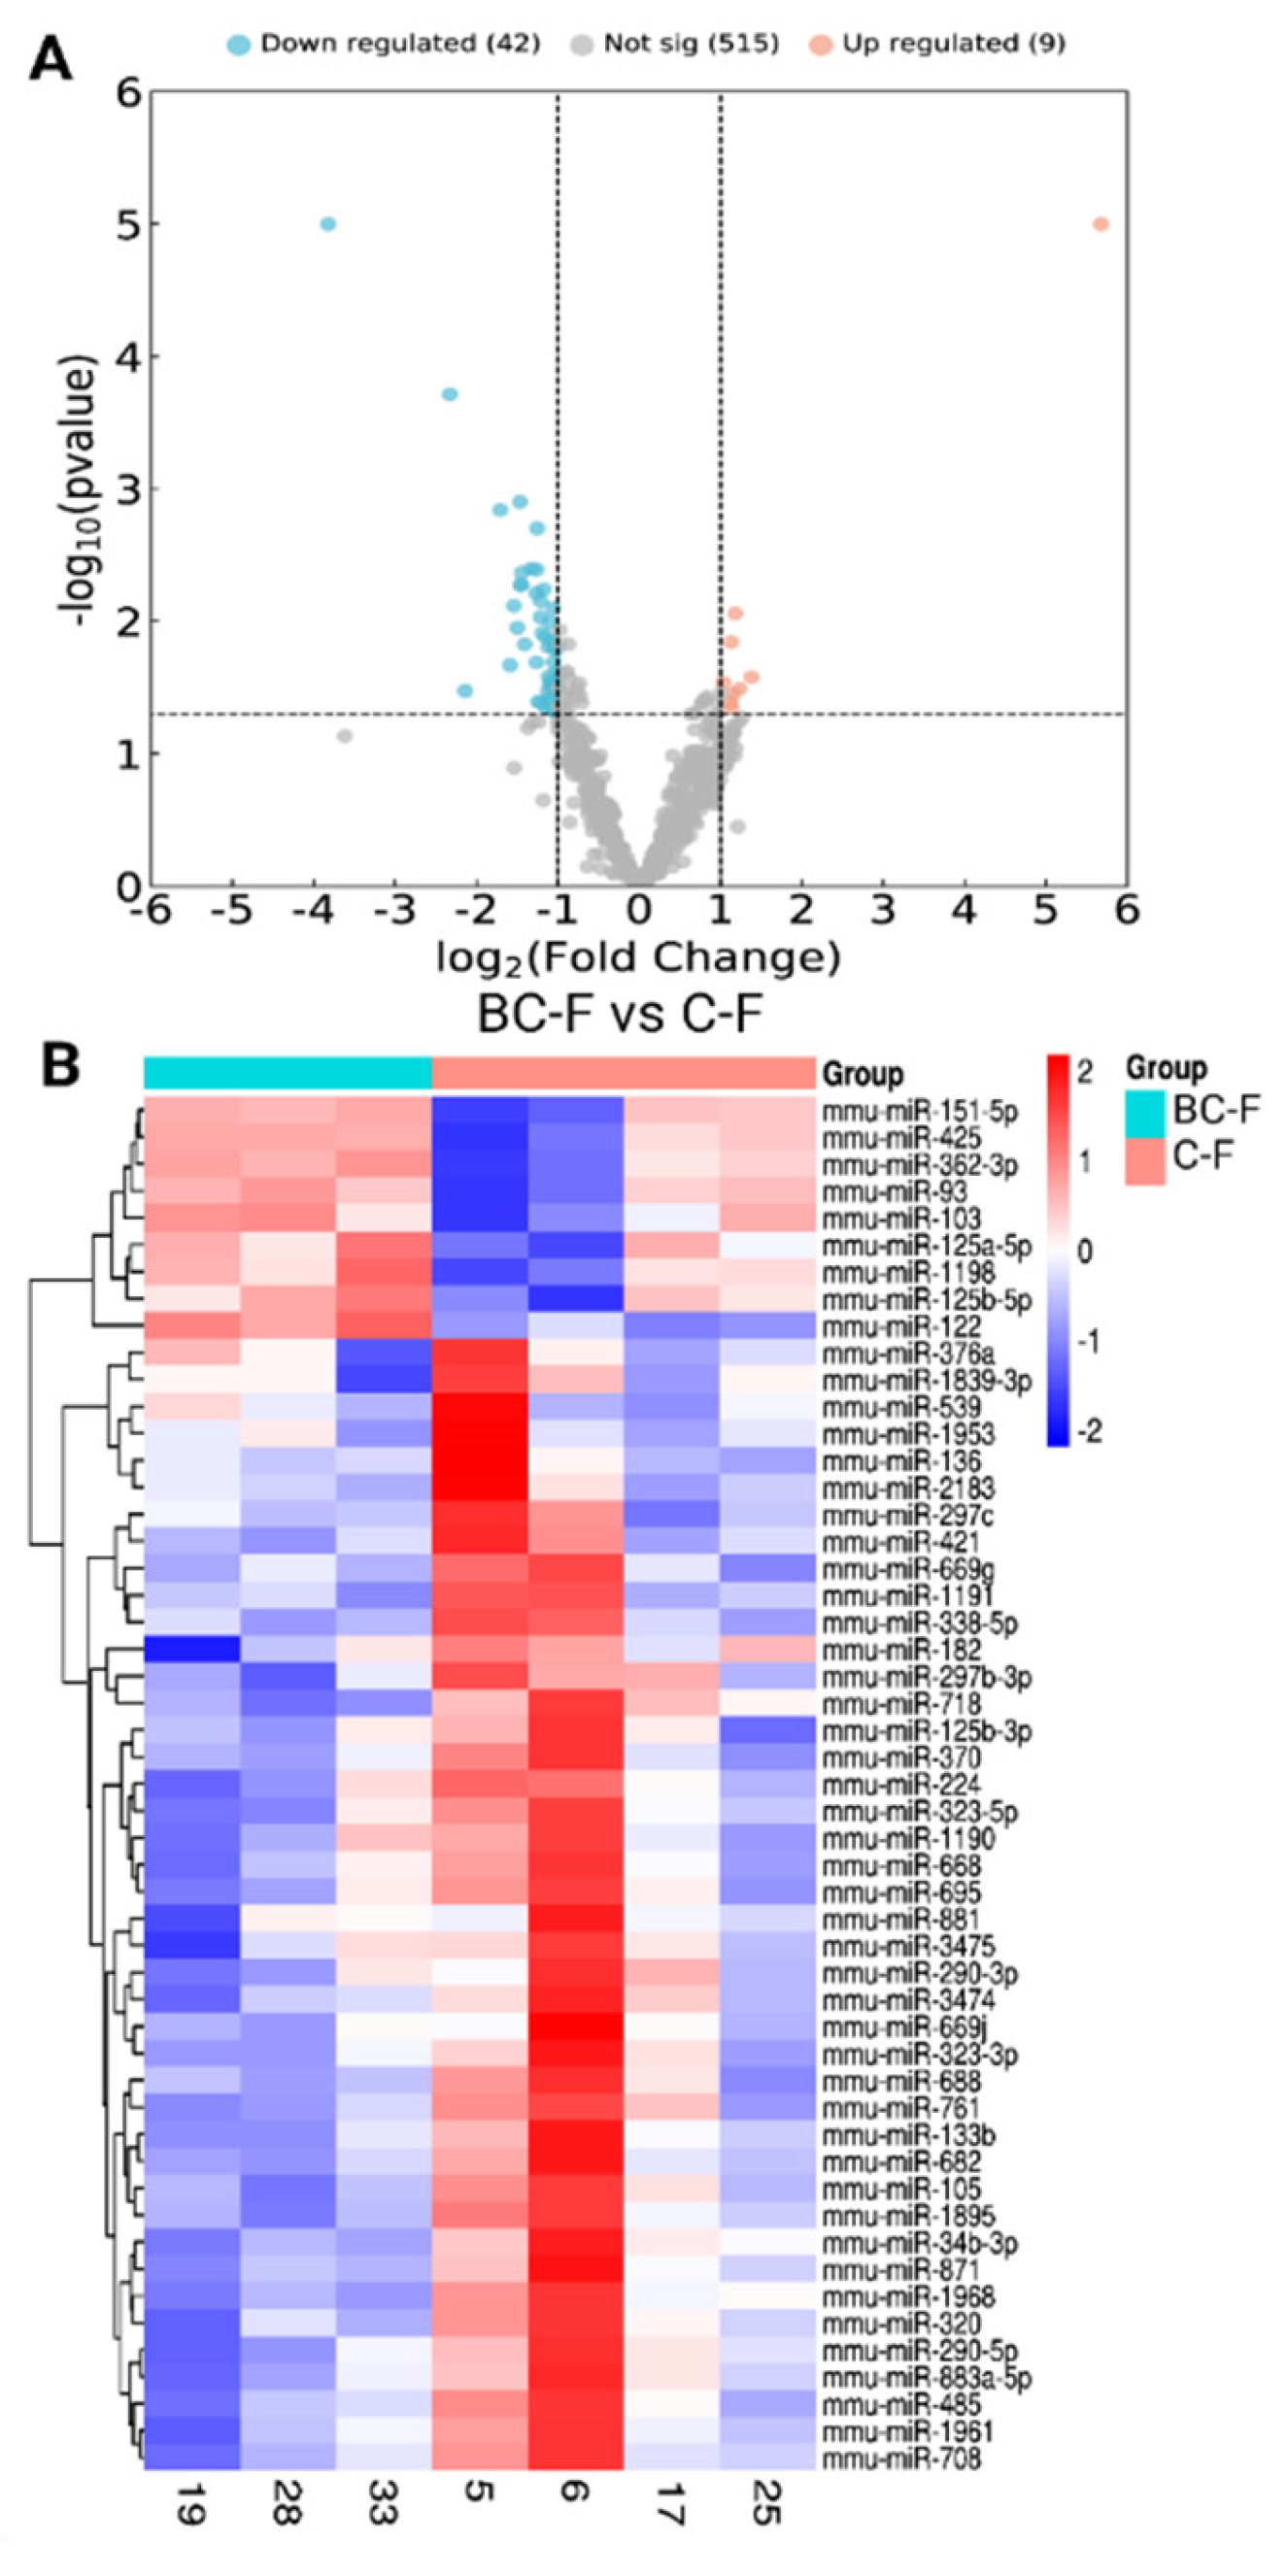
Table 2.
Differentially expressed miRNAs in the liver of females with BC supplementation.
| miRNA | Fold change | Regulation | P- value | |||||
|---|---|---|---|---|---|---|---|---|
| mmu-miR-1191 | -14.1521 | Down | 3.09E-07 | |||||
| mmu-miR-2183 | -5.01241 | Down | 0.000193 | |||||
| mmu-miR-376a | -4.40317 | Down | 0.033524 | |||||
| mmu-miR-1968 | -3.26993 | Down | 0.001442 | |||||
| mmu-miR-539 | -3.00592 | Down | 0.021402 | |||||
| mmu-miR-136 | -2.90541 | Down | 0.007614 | |||||
| mmu-miR-669g | -2.8221 | Down | 0.011202 | |||||
| mmu-miR-338-5p | -2.76262 | Down | 0.001253 | |||||
| mmu-miR-682 | -2.75437 | Down | 0.005321 | |||||
| mmu-miR-323-5p | -2.72259 | Down | 0.005302 | |||||
| mmu-miR-290-5p | -2.7219 | Down | 0.004294 | |||||
| mmu-miR-182 | -2.65349 | Down | 0.014895 | |||||
| mmu-miR-320 | -2.50812 | Down | 0.004008 | |||||
| mmu-miR-761 | -2.40692 | Down | 0.00612 | |||||
| mmu-miR-871 | -2.40115 | Down | 0.004071 | |||||
| mmu-miR-1839-3p | -2.40041 | Down | 0.020481 | |||||
| mmu-miR-34b-3p | -2.38487 | Down | 0.001983 | |||||
| mmu-miR-881 | -2.36257 | Down | 0.040452 | |||||
| mmu-miR-224 | -2.32138 | Down | 0.009298 | |||||
| mmu-miR-1961 | -2.31858 | Down | 0.007012 | |||||
| mmu-miR-125b-3p | -2.2945 | Down | 0.041596 | |||||
| mmu-miR-297c | -2.28392 | Down | 0.012285 | |||||
| mmu-miR-421 | -2.25396 | Down | 0.005722 | |||||
| mmu-miR-883a-5p | -2.21618 | Down | 0.013146 | |||||
| mmu-miR-3474 | -2.19501 | Down | 0.04617 | |||||
| mmu-miR-3475 | -2.17952 | Down | 0.033841 | |||||
| mmu-miR-297b-3p | -2.16784 | Down | 0.015613 | |||||
| mmu-miR-1953 | -2.16066 | Down | 0.025989 | |||||
| mmu-miR-695 | -2.1502 | Down | 0.039103 | |||||
| mmu-miR-323-3p | -2.13416 | Down | 0.028574 | |||||
| mmu-miR-133b | -2.13306 | Down | 0.010116 | |||||
| mmu-miR-370 | -2.12883 | Down | 0.03029 | |||||
| mmu-miR-1895 | -2.08625 | Down | 0.007972 | |||||
| mmu-miR-688 | -2.07886 | Down | 0.047323 | |||||
| mmu-miR-485 | -2.0763 | Down | 0.014138 | |||||
| mmu-miR-290-3p | -2.07055 | Down | 0.020309 | |||||
| mmu-miR-105 | -2.06476 | Down | 0.015803 | |||||
| mmu-miR-669j | -2.06456 | Down | 0.035964 | |||||
| mmu-miR-1190 | -2.0396 | Down | 0.048281 | |||||
| mmu-miR-708 | -2.03612 | Down | 0.016461 | |||||
| mmu-miR-668 | -2.03022 | Down | 0.029321 | |||||
| mmu-miR-718 | -2.01753 | Down | 0.024074 | |||||
| mmu-miR-122 | 51.125 | Up | 1.74E-25 | |||||
| mmu-miR-103 | 2.598296 | Up | 0.026379 | |||||
| mmu-miR-125b-5p | 2.352268 | Up | 0.032295 | |||||
| mmu-miR-362-3p | 2.265612 | Up | 0.008745 | |||||
| mmu-miR-151-5p | 2.229765 | Up | 0.035369 | |||||
| mmu-miR-125a-5p | 2.19763 | Up | 0.044985 | |||||
| mmu-miR-1198 | 2.186721 | Up | 0.014346 | |||||
| mmu-miR-93 | 2.170918 | Up | 0.041012 | |||||
| mmu-miR-425 | 2.050926 | Up | 0.029188 | |||||
3.3. Gene Ontology (GO) Analysis of the Differentially Expressed miRNAs Target Genes
The biological significance of the DE miRNAs integrated signature was approached via their target genes. To this end, predicted targets of the down and upregulated miRNAs in the liver of BC- supplemented male and female offspring were identified (see section 3.4), and GO enrichment analyses were performed on the respective whole gene sets. GO categories were assigned to the target genes according to the Biological Processes (BP) in which the gene products are involved, the Cellular Components (CC) to which the gene products are located, and their Molecular Function (MF).
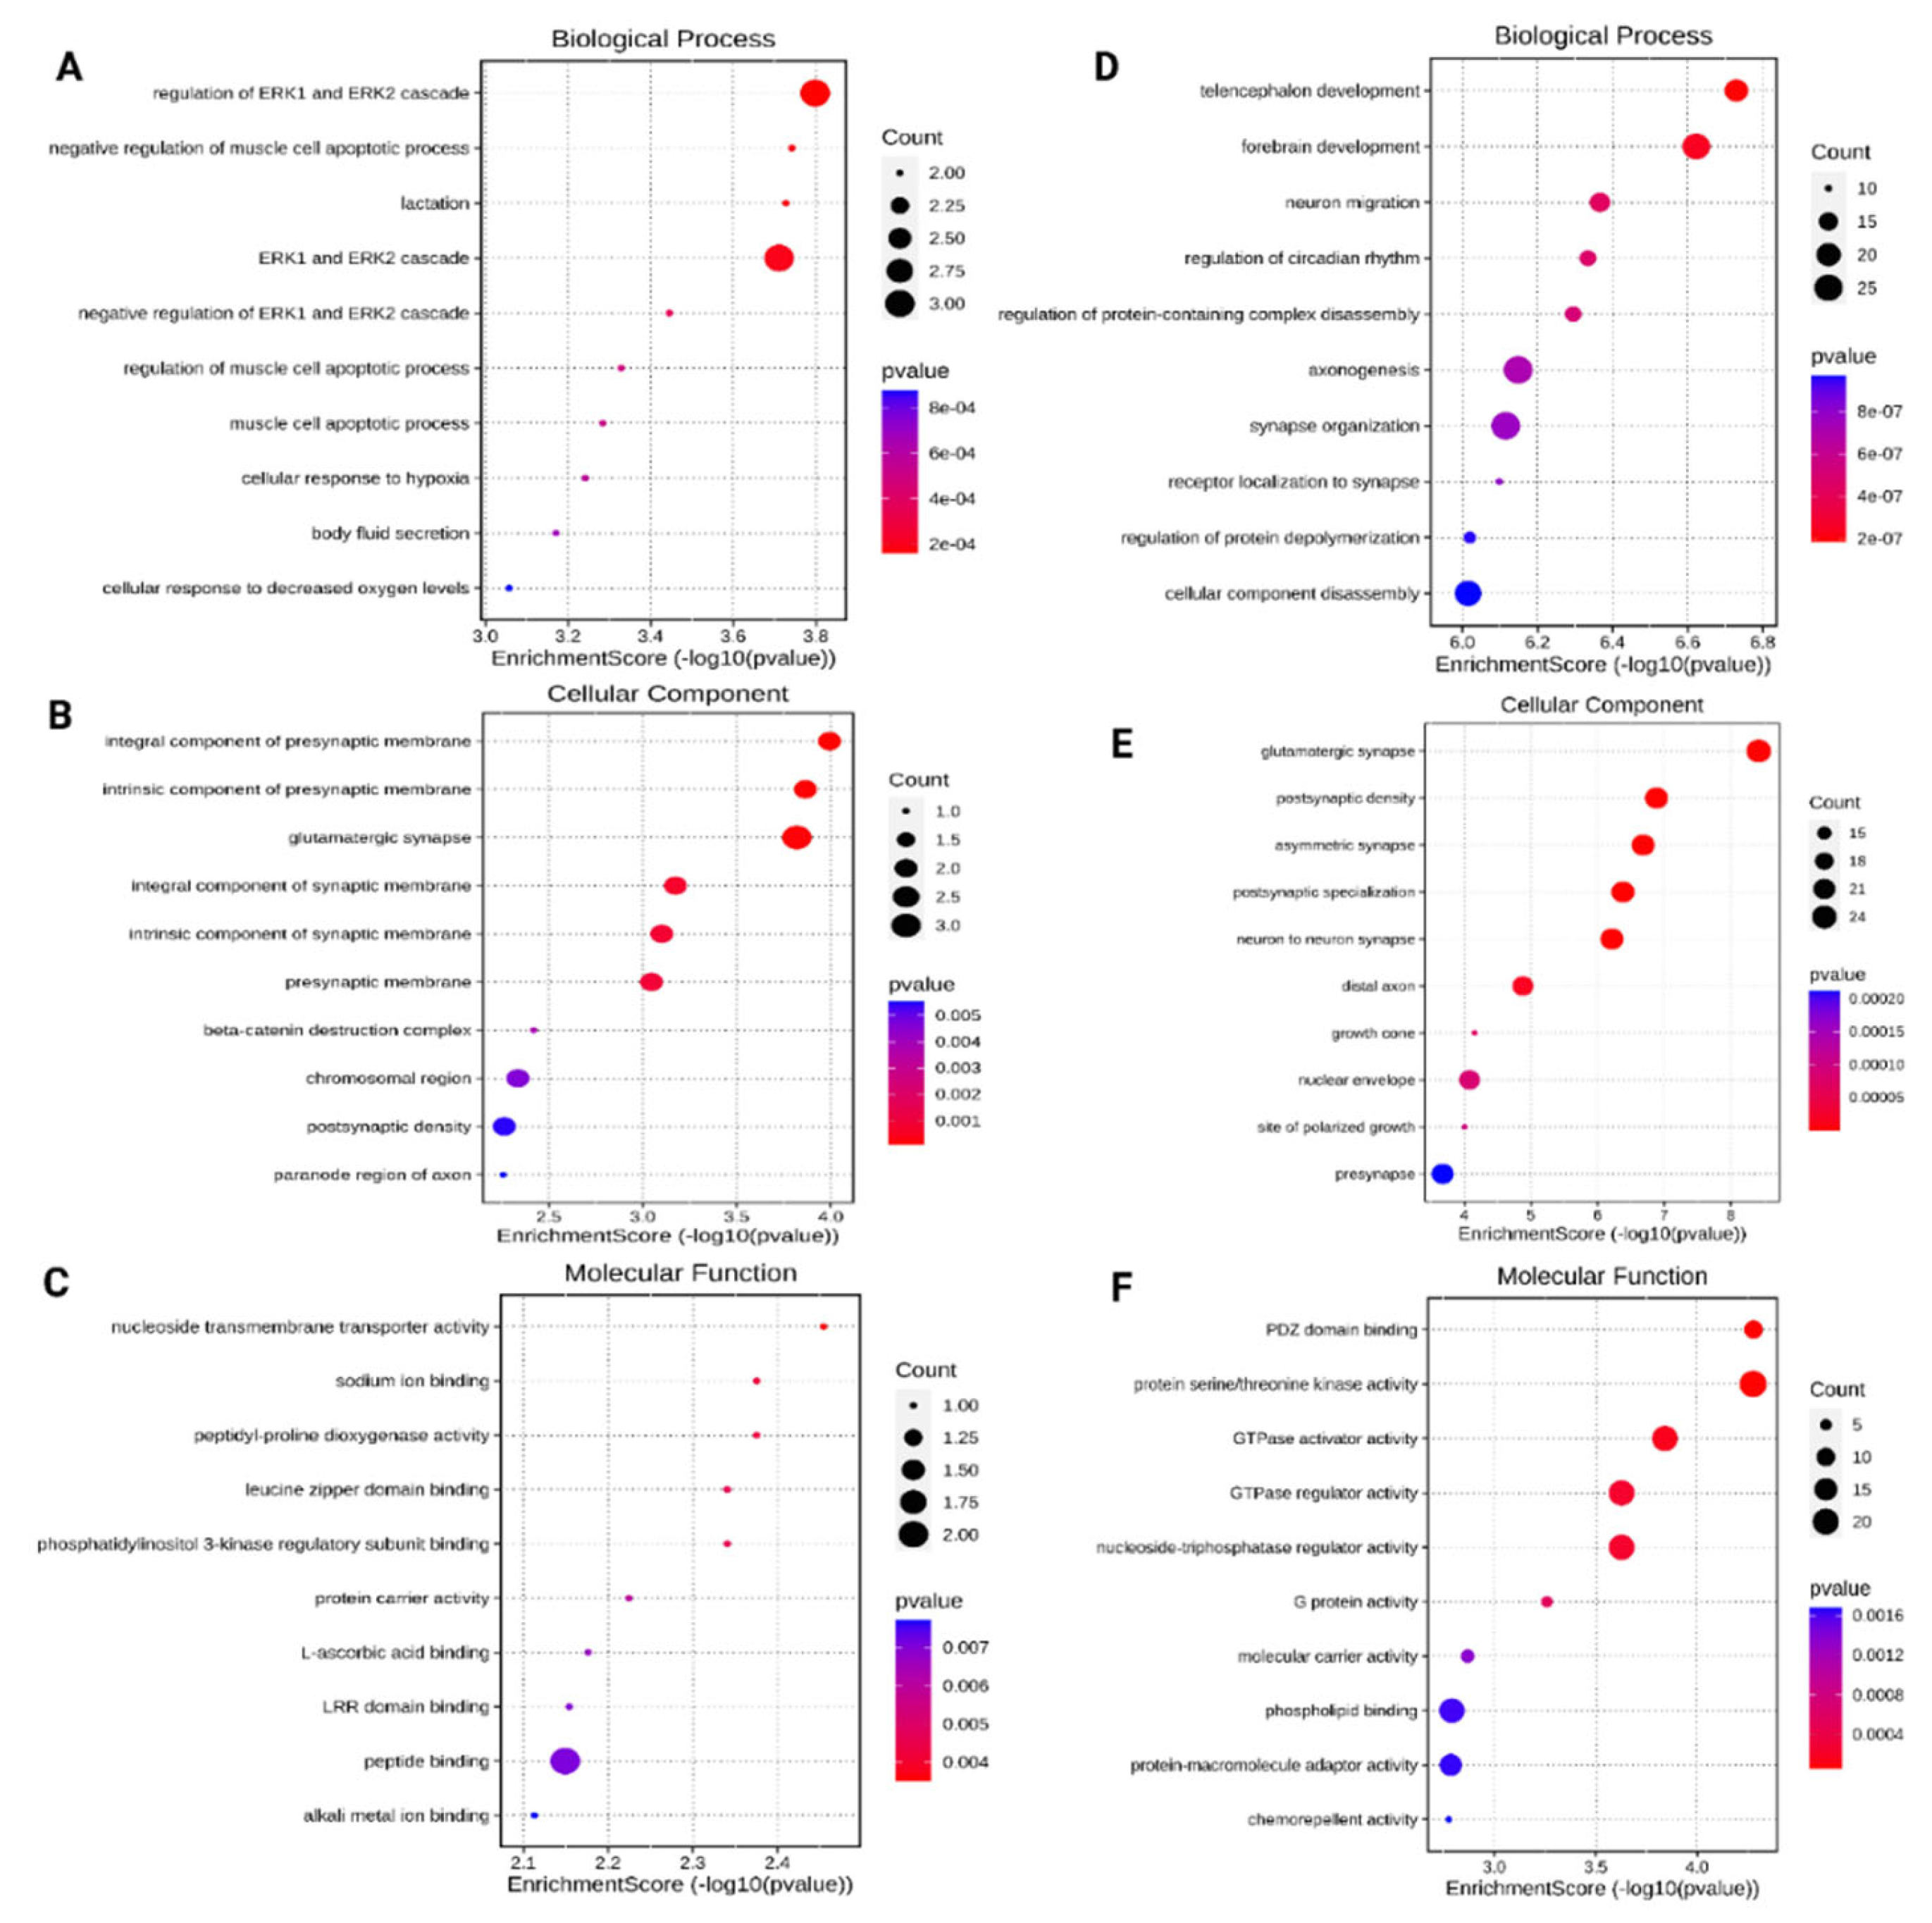
Figure 4 shows the top 10 significant results of each of the three GO categories for the predicted targets of downregulated (Figures 4A-C) and upregulated (Figures 4D–F) DE miRNAs in the liver of BC male mice. Target genes of the downregulated miRNAs in males showed enrichment in BPs such as the ERK1 and ERK2 cascade and its regulation (Figure 4A); CCs related to synapses (Figure 4B); and MFs such as peptide binding and phosphatidylinositol 3-kinase regulatory subunit binding (Figure 4C). Meanwhile, target genes of the upregulated miRNAs in males showed enrichment in BPs related to neural developmental and organization processes and regulation of circadian rhythm (Figure 4D); CCs related again to synapses (Figure 4E); and MFs such as protein serine/threonine kinase activity and GTPase activator and regulator activities (Figure 4F).
Figure 4.
Gene Ontology analysis of target genes of miRNAs differentially expressed (DE) in the liver of BC-treated male offspring. Panels A to C (left) correspond to the downregulated miRNA targets, and panels D to F (right) to the upregulated miRNAs targets. The panels show the top 10 most represented Biological Processes (A, D), Cellular Components (B, E), and Molecular Functions (C, F) among the DE miRNAs targets. The colour of each dot represents the P value of each term involved in the analysis. The size of each dot represents the counts of overlapped genes between the input genes and the total gene list on GO pathway.
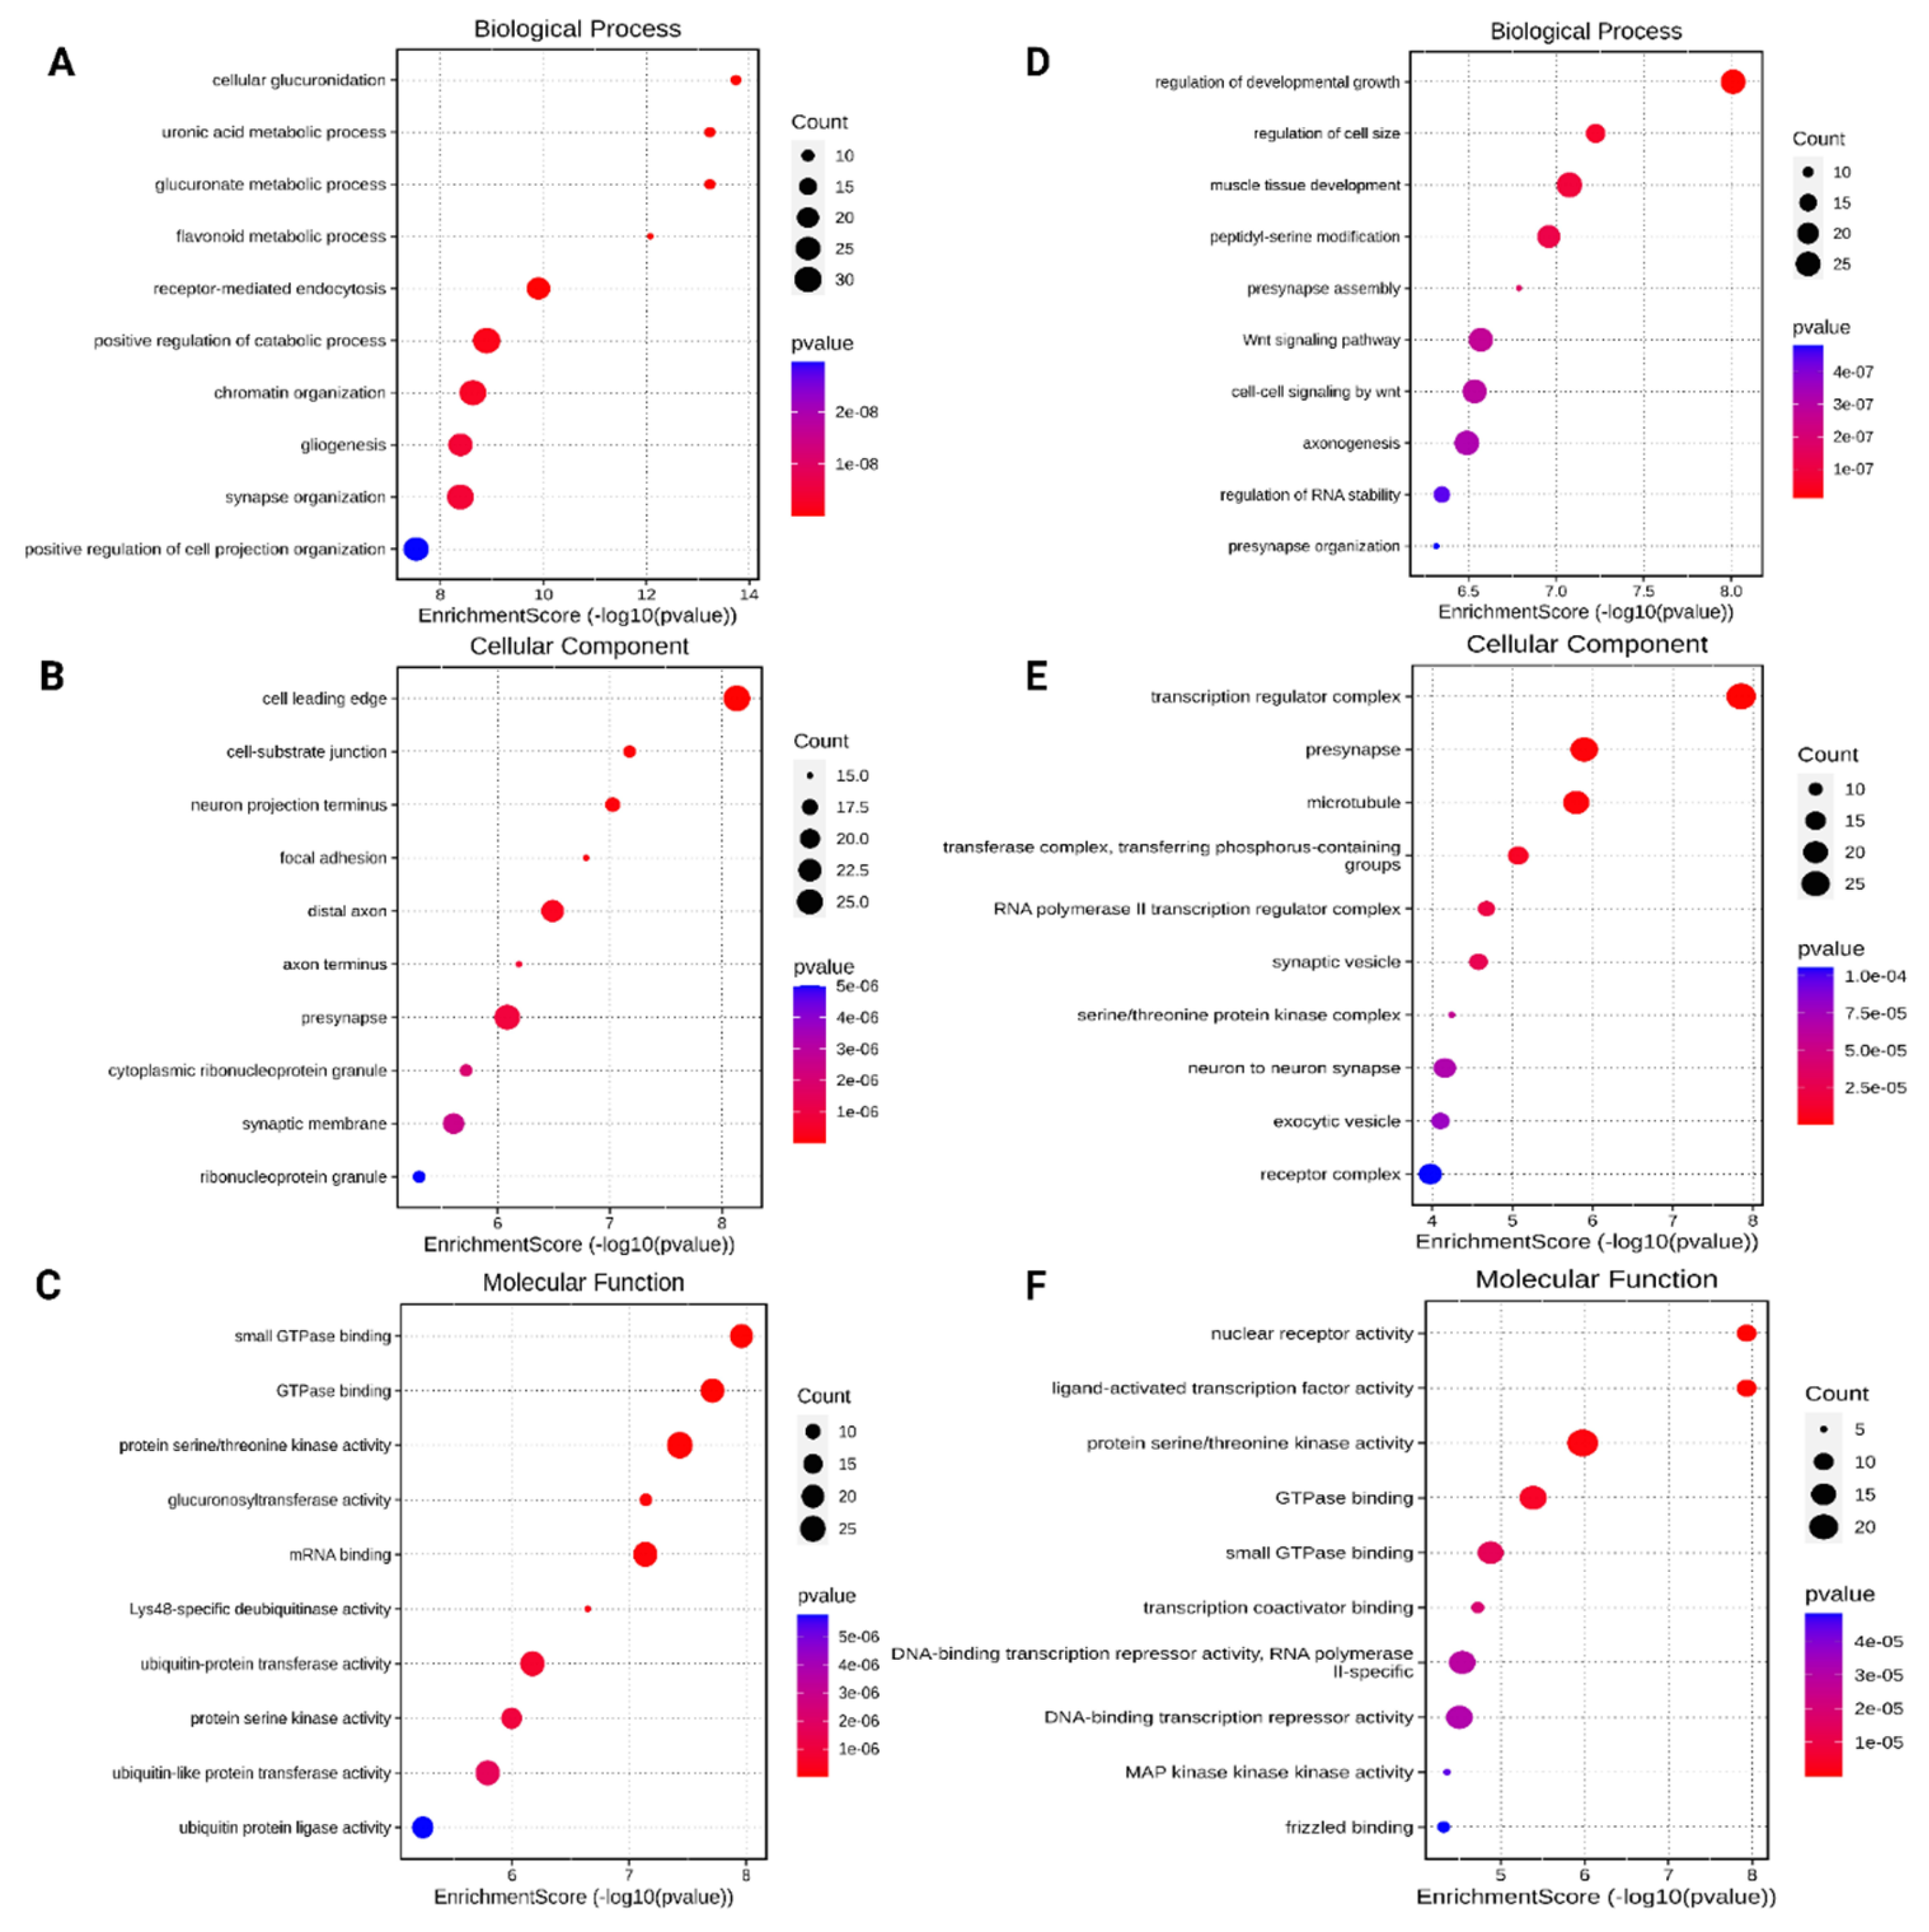
In females, predicted targets of the miRNAs downregulated in the liver with BC treatment associated with BPs such as cellular glucuronidation and metabolic processes (Figure 5A) and with diverse CCs and MFs, as indicated in Figure 5B and 5C, respectively. Finally, targets of the upregulated miRNAs in the liver of BC females showed enrichment in processes related to the regulation of developmental growth and cell size as BPs (Figure 5D); transcription regulator complex as CC (Figure 5E); and nuclear receptor activity, ligand-activated transcription factor activity, and protein serine/threonine kinase activity as MFs (Figure 5F), among others.
Figure 5.
Gene Ontology analysis of target genes of miRNAs differentially expressed (DE) in the liver of BC-treated female offspring. Panels A to C (left) correspond to the downregulated miRNAs targets, and panels D to F (right) to the upregulated miRNAs targets. The panels show the top 10 most represented Biological Processes (A, D), Cellular Components (B, E), and Molecular Functions (C, F) among the DE miRNAs targets. The colour of each dot represents the P value of each term involved in the analysis. The size of each dot represents the counts of overlapped genes between the input genes and the total gene list on GO pathway.
3.4. KEGG Pathway Functional Enrichment Analysis
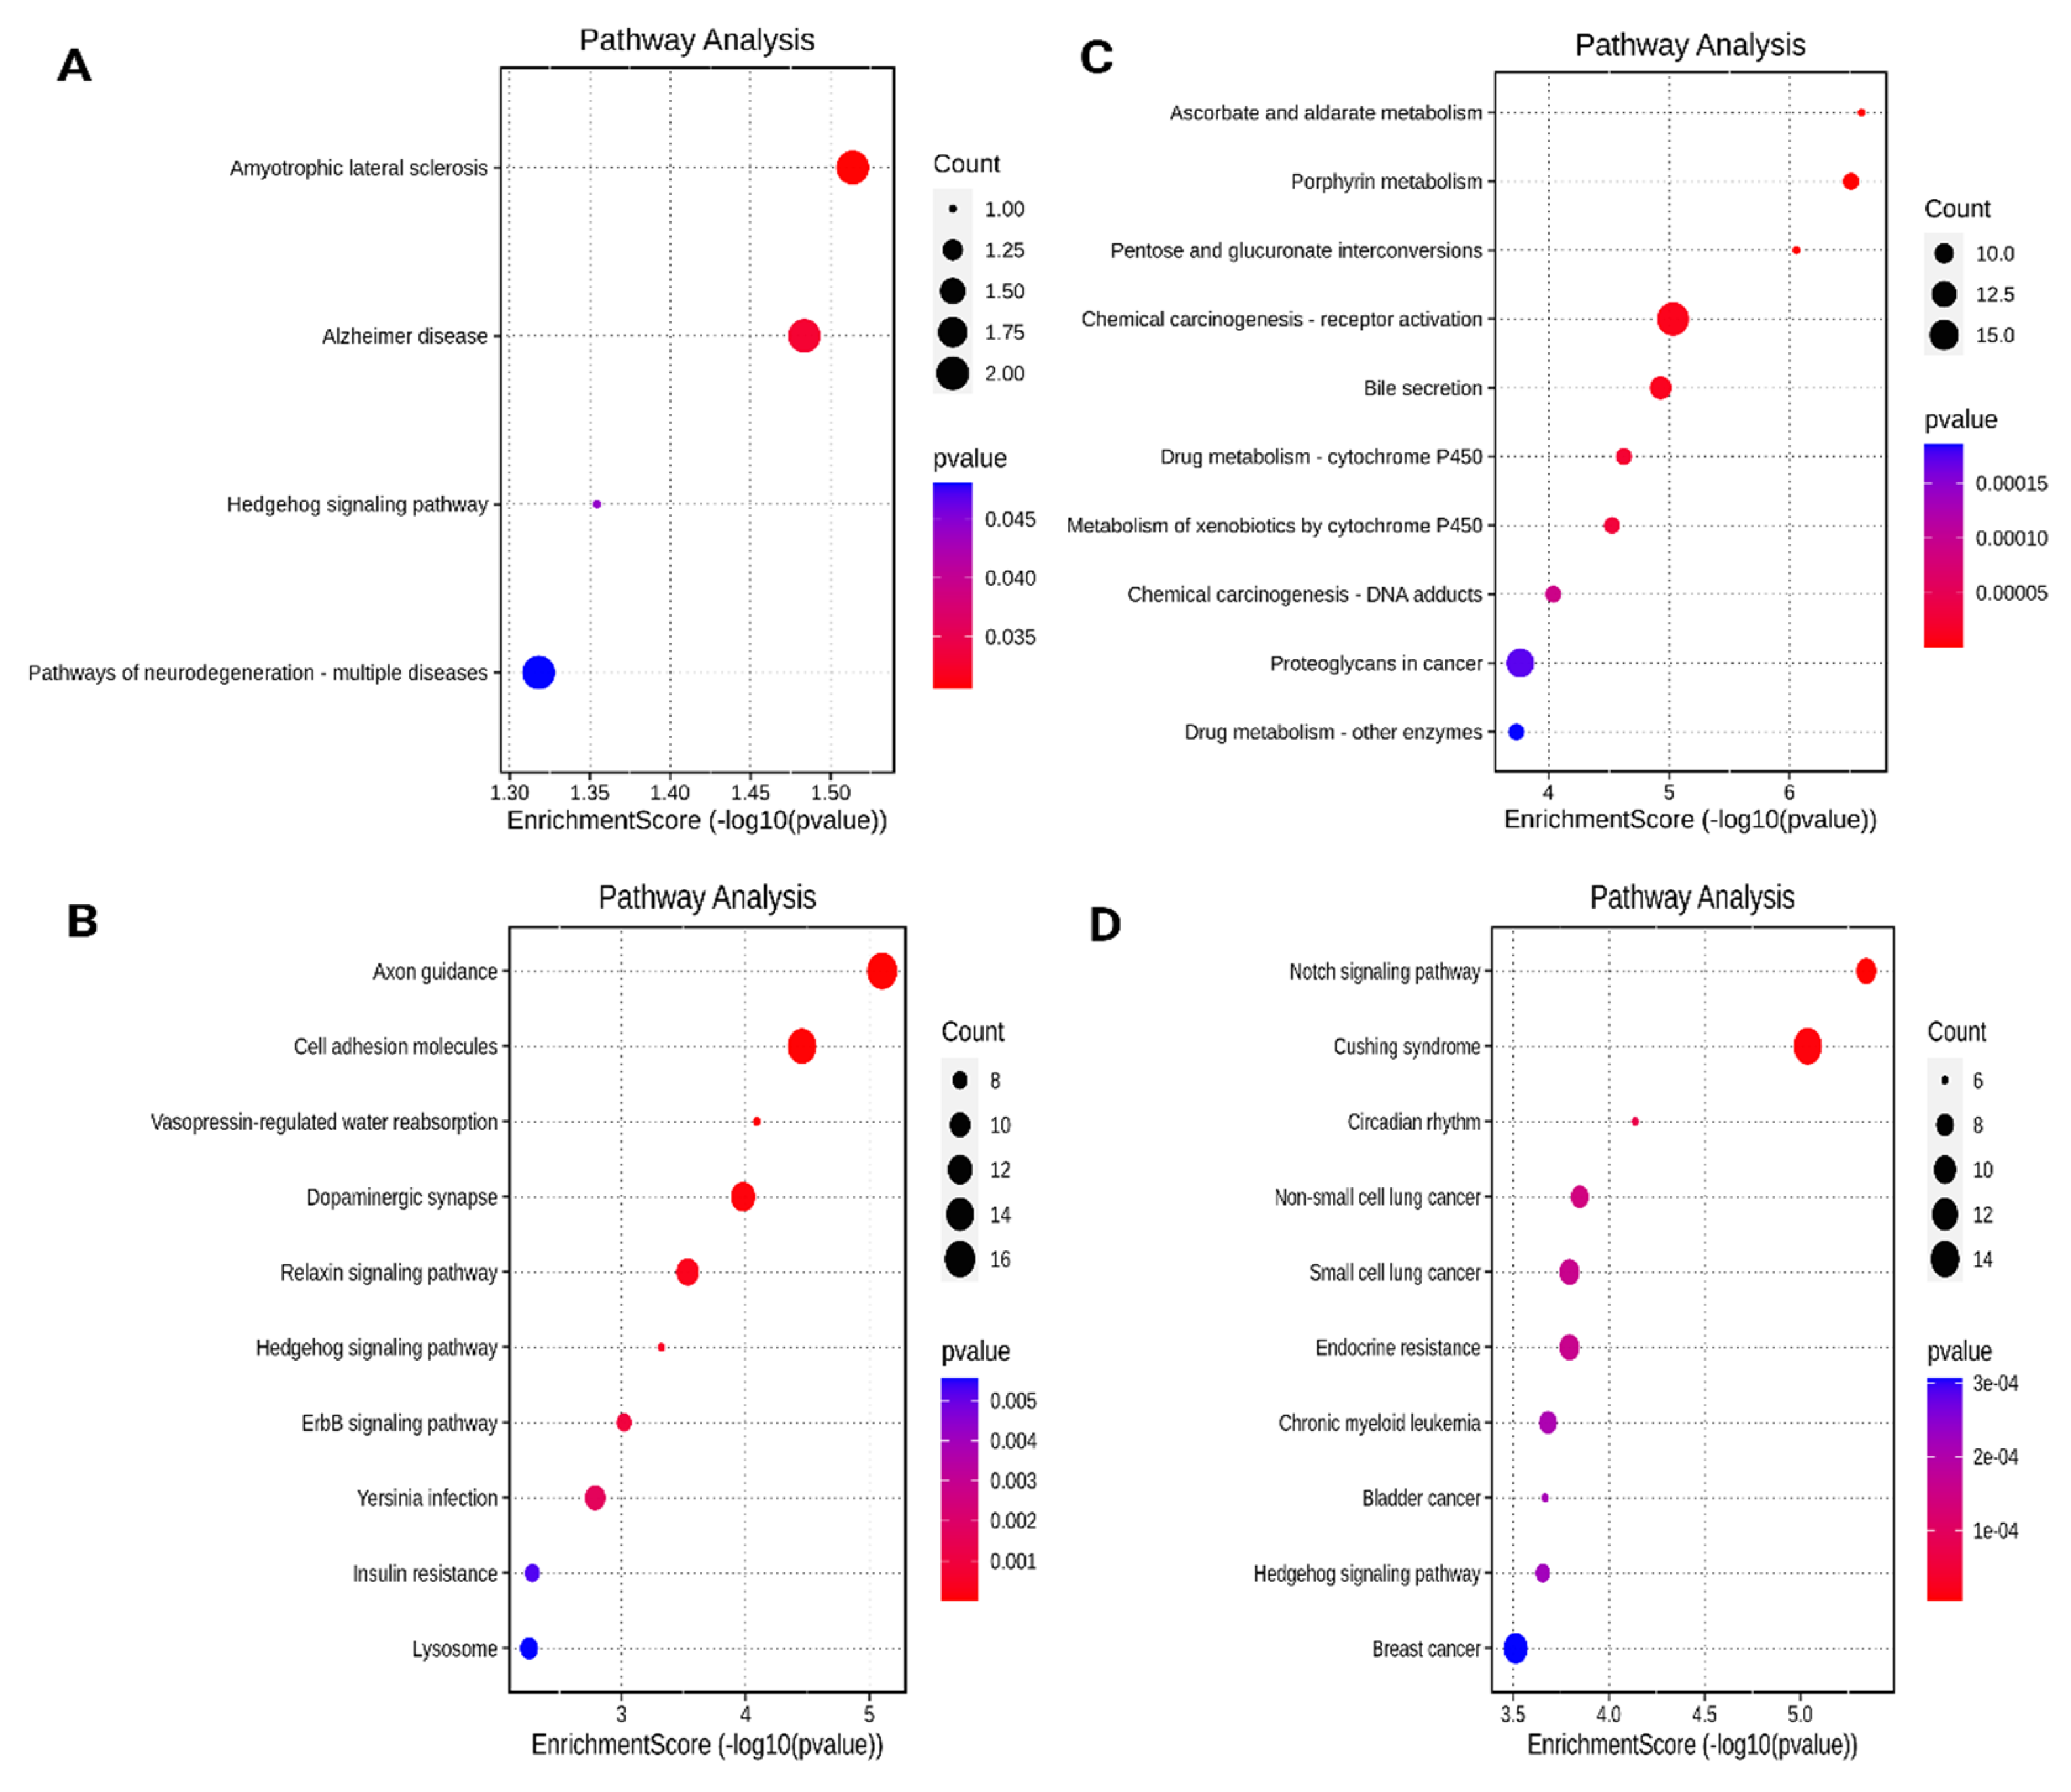
Figure 6 shows the top KEGG-enriched pathways associated with predicted targets of the DE miRNAs in the liver of BC-supplemented offspring of each sex. Fifty-two pathways were significantly enriched in the BC males (p-value <0.05). Targets of the downregulated miRNA associated significantly with four KEGG pathways: Amyotrophic lateral sclerosis, Alzheimer’s disease, Pathways of neurodegeneration, and Hedgehog signaling (Figure 6A). The 10 most significantly enriched KEGG pathways of targets of the upregulated miRNAs in BC-M included Cell adhesion molecules, Hedgehog signaling, ErbB signaling, and Insulin resistance, among others (Figure 6B). In the BC females, 130 KEGG pathways were significantly enriched. Of them, the top 10 enriched among targets of the downregulated miRNAs in BC-F included Ascorbate and aldarate metabolism, Porphyrin metabolism, Pentose and glucuronate interconversions, Chemical carcinogenesis, Bile secretion, and Drug metabolism, among others (Figure 6C); additionally, Steroid hormone biosynthesis and Retinol metabolism were significantly enriched (p-value <0.05, data not shown). Finally, the top 10 significantly enriched pathways among targets of the upregulated miRNAs in BC-F included among others Notch signaling, Cushing syndrome, Circadian rhythm, Non-small/small cell lung cancer, Breast cancer, Hedgehog signaling, and Endocrine resistance (Figure 6D).
Figure 6.
KEGG analysis of target genes of downregulated (A) and upregulated (B) miRNAs in the liver of BC- supplemented males, and of downregulated (C) and upregulated (D) miRNAs in the liver of BC-supplemented females. The colour of each dot represents the P value of each term involved in the analysis. The size of each dot represents the counts of overlapped genes between the input genes and the total gene list on KEGG pathway.
3.5. Construction of miRNA-Gene Interactional Networks and Identification of miRNAs with Bco1 as Target
Based on the miRNA-gene prediction pairs, miRNA-target gene networks were plotted with Cytoscape software (Supplementary Material Figure S1). Target genes of the 61 DE miRNAs in the liver of BC-supplemented offspring were predicted by three tools: miRWalk database, TargetsScan, and miRDB. A total of 1504 predicted target genes were obtained, 543 in male mice and 961 in female mice. In both sexes, the miRNA-gene networks revealed several genes targeted by multiple DE miRNAs. In males, miR-763, the only downregulated miRNA, was predicted to target a low number of genes, while miR-762 had the highest number of predicted targets, followed by miR-1967, miR-467a-5p, miR-684, miR-468-3p, miR-688, and miR-1964-3p. In females, among the downregulated miRNAs, miR-182-5p had the highest number of targets, followed by miR-320-3p, miR-133b-3p, miR-370-3p, and miR-485-5p; whereas among the upregulated miRNAs, miR-93-5p had the highest predicted number of targets, followed by miR-125a-5p, miR-125b-5p, miR-103-3p, miR-122-5p, miR-362-3p, miR-425-5p, and miR-151-5p. The Supplementary Material shows the whole networks (Figure S1).
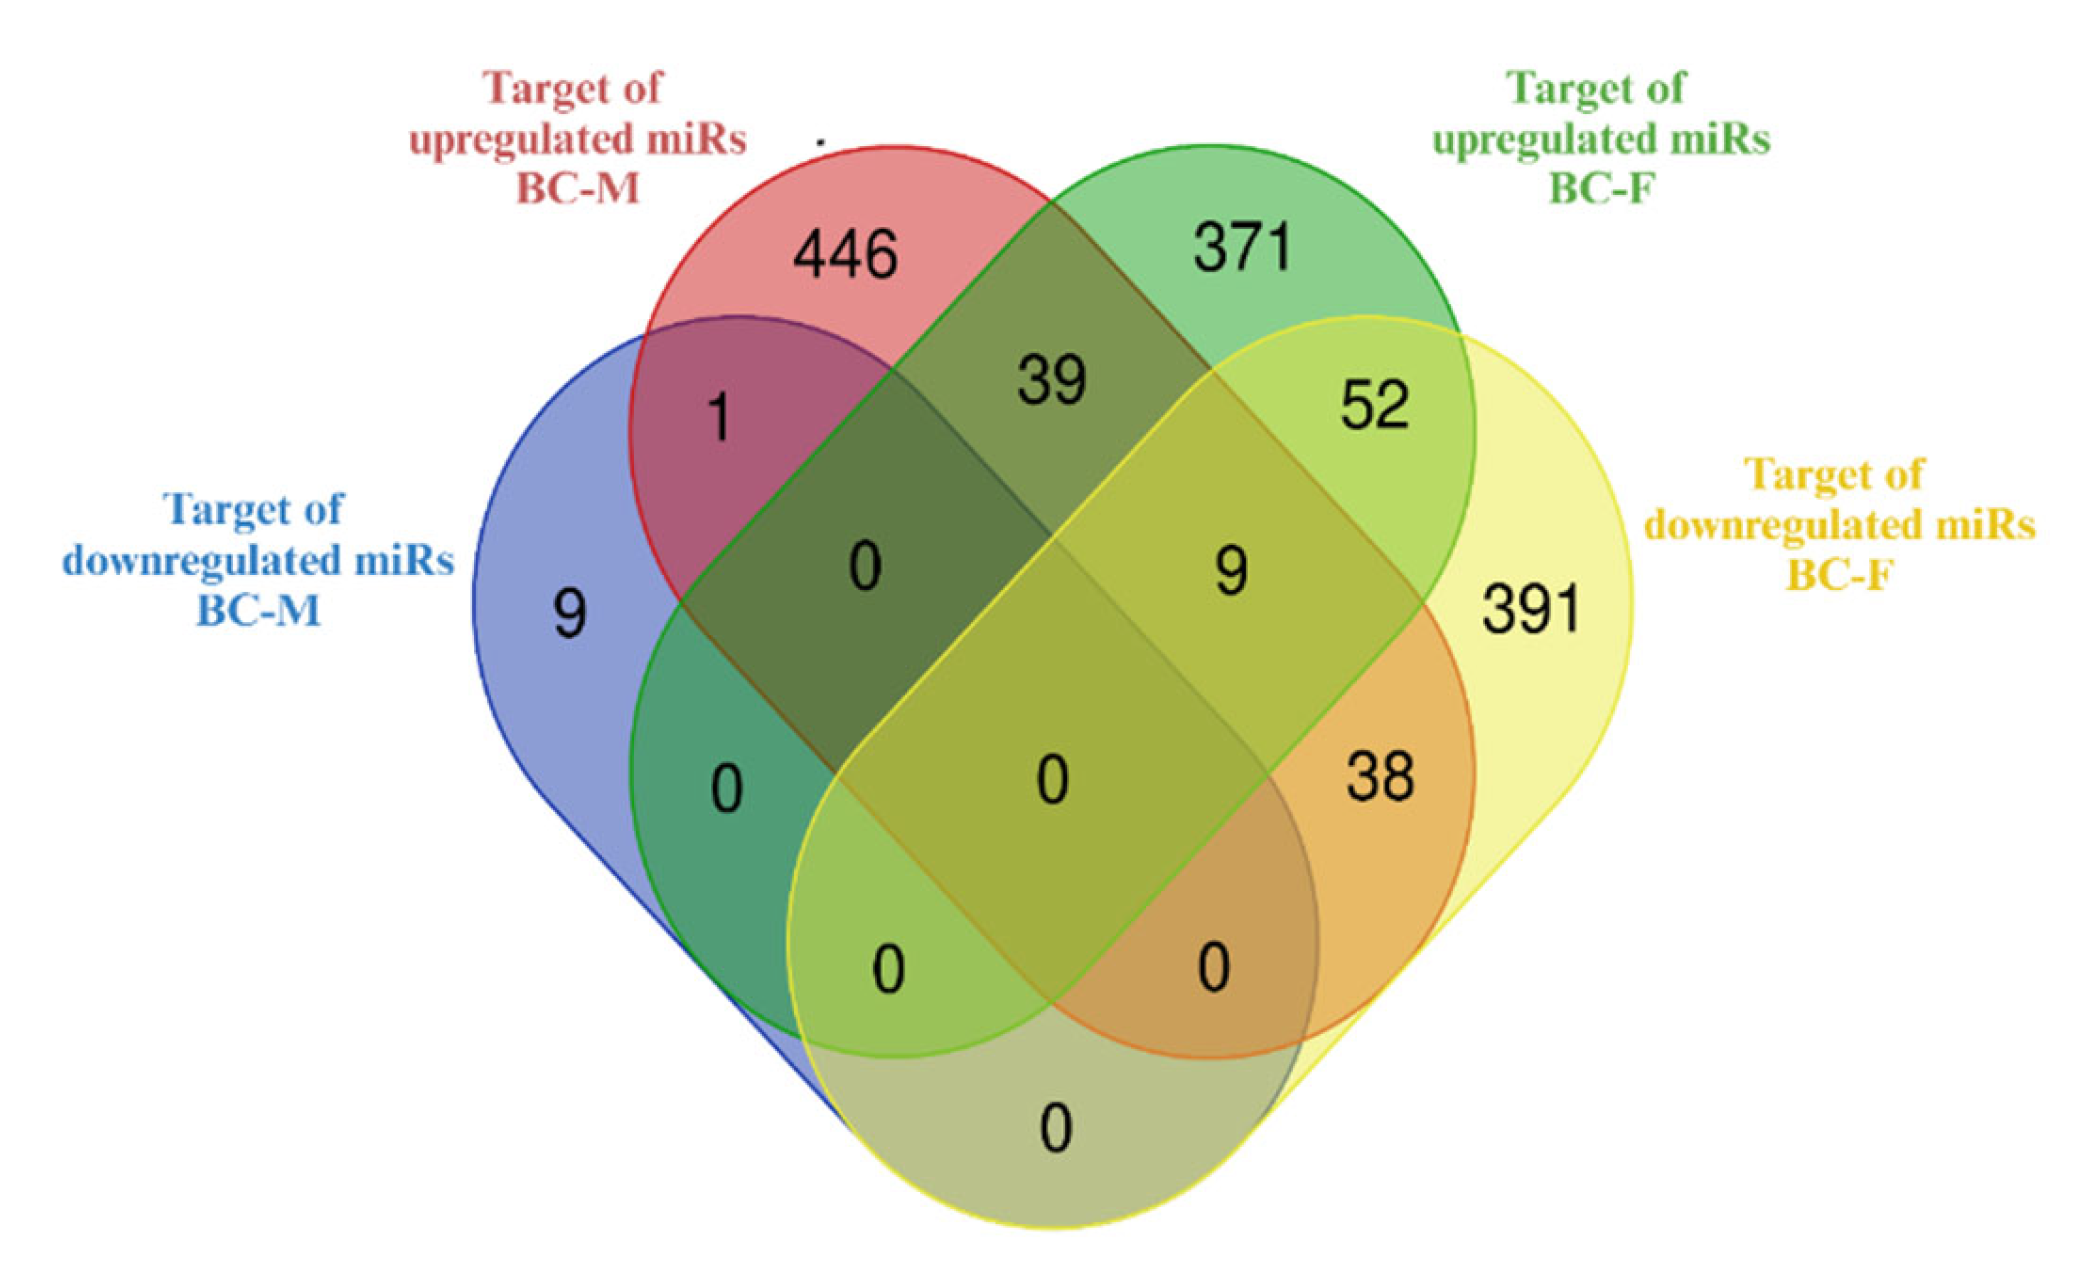
In an attempt to decipher the major functions of the miRNAs DE in the liver of BC-supplemented offspring, we further focused on predicted targets overlapping in both sexes. To be noted, even if no DE miRNAs in common were found in the liver of males and females supplemented with BC, it is possible that the target genes of different DE miRNAs partially overlap since the same mRNA can be regulated by different miRNAs [31]. Furthermore, the co-regulatory miRNAs might respond differently to treatments/interventions, so some are upregulated and others downregulated. A Venn diagram (Figure 7) showed 456 uniquely predicted target genes of DE miRNAs in the male mice, 814 uniquely predicted target genes in the female mice, and a total of 86 predicted target genes overlapping in the two sexes: 39 overlapping targets of upregulated miRNAs in either sex, 38 overlapping targets of downregulated miRNAs in females and upregulated miRNAs in males, and 9 overlapping targets of upregulated miRNAs in males, and down and upregulated miRNAs in females. Twenty-two DE miRNAs - six in males (mmu-miR-762, -684, -467, -1967, -468, -1964) and 16 in females (mmu-miR-182-5p, -5p, -320-3p, -133b-3p, -485-5p, -668-3p, -224-5p, -323-3p, -708-5p, -1968-5p, -103-3p, -125a-5p, -93-5p, -125b-5p, -362-3p, -122-5p) - were predicted to be involved in the targeting of these 86 overlapping genes. The overlapping genes and their potential regulatory DE miRNAs in the liver of male and female BC-supplemented mice are listed in Supplementary Table S2. Out of the 86 genes that overlapped, 47 were predicted targets of miRNAs that were regulated in opposite directions (up or down) between sexes. KEGG pathway adscriptions of the 86 overlapping targets in both sexes are presented in Table S3. It is worth noting that Pik3r1 was the most involved gene in multiple KEGG pathways (see Supplementary Material Table S3).
Figure 7.
Venn diagram of predicted target genes of the miRNAs differentially expressed (DE) in the liver of BC-supplemented males (BC-M) and females (BC-F). Created with Bioinformatics & Evolutionary Genomics.
Figure 7.
Venn diagram of predicted target genes of the miRNAs differentially expressed (DE) in the liver of BC-supplemented males (BC-M) and females (BC-F). Created with Bioinformatics & Evolutionary Genomics.
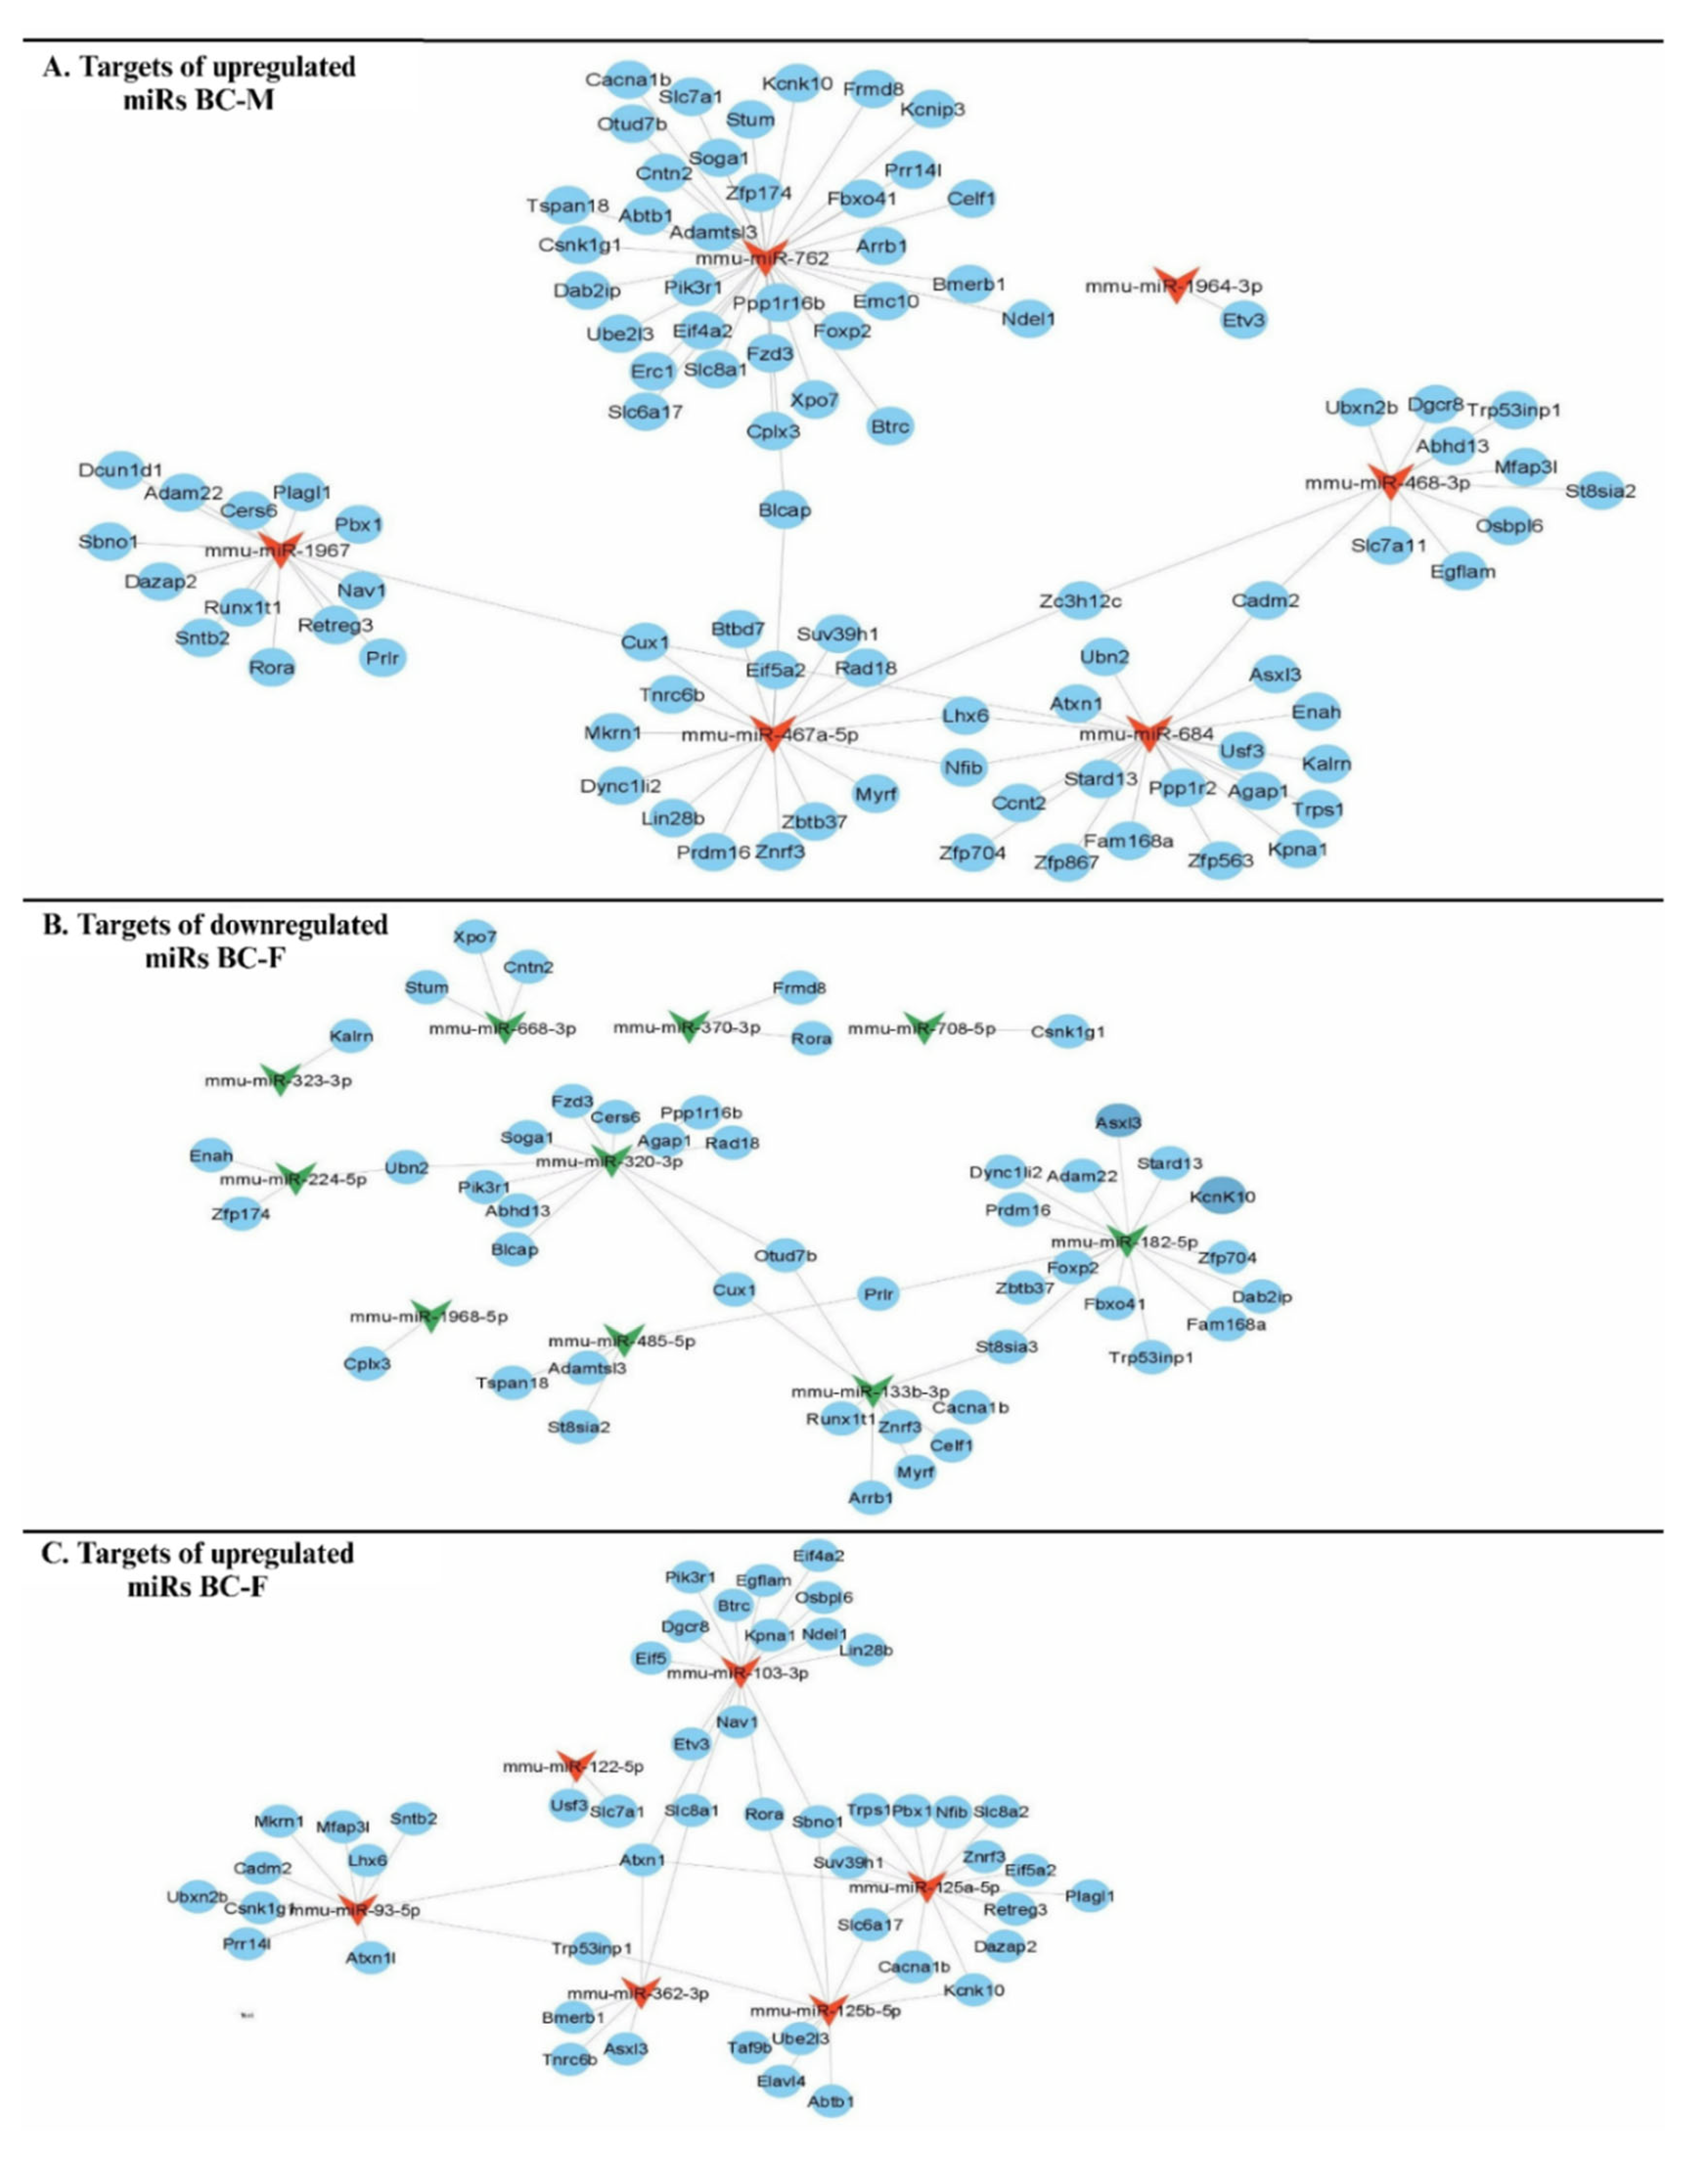
miRNA˗target gene mRNA networks were constructed through Cytoscape considering the 86 overlapping genes and the 22 DE miRNAs potentially involved in their regulation (Figure 8). In the BC males, 98 pairs of upregulated miRNAs˗downregulated mRNAs were predicted (Figure 8A). Some genes (Cux1, Blcap, Zc3h12c, Lhx6, Nfib, and Cadm2) paired with more than one of the upregulated miRs in BC-M liver, acting at intersections between miRNAs (Figure 8A). In the BC females, 109 miRNAs˗gene pairs were predicted, of which 51 pairs involving miRNAs downregulated (Figure 8B) and 58 pairs involving miRNAs upregulated (Figure 8C). There were 5 target genes at the intersections among downregulated miRNAs (Ubn2, Cux1, Otud7b, Prlr, and St8sia2), and 7 target genes at the intersections among upregulated miRNAs (Etv3, Atxn1, Trp53inp1, Rora, Snob1, Cacna1b, and Kcnk10). Out of the DE miRNA˗gene pairs predicted in male animals, mmu-miR-684, -1967, and -762 are experimentally validated regulatory miRNAs for Lhx6, Nav1, and Xpo7, respectively, whereas out of the pairs predicted in female animals, mmu-miR-125b-5p, -362-3p, -122-5p, and -103-3p are experimentally validated regulatory miRNAs for Abtb1, Atxn1, Slc7a1, and Pik3r1, respectively (source miRTarbase).
Figure 8.
miRNA-gene interaction networks of the 86 target genes overlapping in both sexes. A) Targets of upregulated miRs in males. B) Targets of downregulated and C) upregulated miRs in females.
Figure 8.
miRNA-gene interaction networks of the 86 target genes overlapping in both sexes. A) Targets of upregulated miRs in males. B) Targets of downregulated and C) upregulated miRs in females.
Besides the systematic bioinformatic approach, a targeted approach was used for Bco1, since this gene encodes the crucial enzyme (beta-carotene-15, 15'-oxygenase) for the cleavage and metabolism of BC in mammals [32]. Predicted miRNAs regulating the Bco1 gene were searched on the miRwalk platform. A total of 990 miRNAs were found. Of them, focusing on the results of our microarray, six DE miRNAs were predicted to target the Bco1 transcript, namely mmu-miR-763 in the male offspring and mmu-miR-668, -105, -370, -323-3p, and -290-3p in the female offspring (Table 3). All the DE miRNAs with Bco1 as a potential target were downregulated in the liver of offspring born to WD-fed dams following BC supplementation during suckling.
Table 3.
DE miRNAs in the liver of BC-supplemented offspring potentially regulating Bco1.
| Gene | Sex | miRNAs downregulated | miRNAs upregulated |
|---|---|---|---|
| Bco1 | Male | mmu-miR-763 | - |
| Female | mmu-miR-668, -105, -370, -323, -3p, -290-3p | - |
3.6. Protein-Protein Interaction Network Analysis
To better understand the interactions among predicted targets of the miRNAs regulated by BC in the liver of young mice born to WD-fed mothers, protein-protein interaction (PPI) networks were constructed using the STRING database. Shown in Table 4 are the top 10 hub genes among the 86 overlapping genes potentially regulated by BC supplementation in both sexes, ranked according to their node degree. The higher the node degree, the higher the core level of the gene in the network. The whole networks are shown in the Supplementary Material (Figure S2)
Table 4.
Top 10 genes in the protein-protein interaction networks involving the DE miRNAs target genes overlapping across sexes, ranked by node degree.
Table 4.
Top 10 genes in the protein-protein interaction networks involving the DE miRNAs target genes overlapping across sexes, ranked by node degree.
| Males upregulated | Females downregulated | Females upregulated | |||
|---|---|---|---|---|---|
| Genes | Node Degree | Genes | Node Degree | Genes | Node Degree |
| Pik3r1 | 23 | Pik3r1 | 29 | Pik3r1 | 23 |
| Arrb1 | 16 | Arrb1 | 16 | Atxn1 | 19 |
| Kalrn | 15 | Xpo7 | 16 | Btrc | 13 |
| Atxn1 | 13 | Kalrn | 13 | Suv39h1 | 12 |
| Cacna1b | 9 | Cacna1b | 11 | Eif4a2 | 10 |
| Ube2l3 | 9 | Celf1 | 11 | Erc1 | 9 |
| Xpo7 | 9 | Foxp2 | 11 | Rora | 8 |
| Btrc | 8 | Cux1 | 9 | Ube2l3 | 7 |
| Dab2ip | 8 | Adam22 | 6 | Cacna1b | 6 |
| Ndel1 | 8 | Cntn2 | 6 | Dgcr8 | 6 |
4. Discussion
BC is a natural pigment with nutritional functions and interesting bioactive properties in adult animals, including hepatoprotective effects. Maternal unbalanced diets are known to cause malprogramming and affect miRNA expression in the liver of offspring. In the present study, we aimed to determine the impact of BC supplementation during the suckling period on the microRNA profile in the liver of young mice exposed prenatally and during lactation to an obesogenic maternal diet. We studied recently weaned offspring of both sexes and used hybridization to microarrays for miRNA profiling. Identifying sex-dependent responses is crucial to determining new targets, personalizing nutrition and treatment methods, and allowing translation to human health. Although RNA sequencing is increasingly been used to perform comprehensive analyses of miRNA expression profiles, it has been demonstrated that next-generation sequencing and microarray measurements give similar results [33].
BC supplementation differentially affected the hepatic miRNA expression profile in male and female animals, with no overlap in DE miRNAs between sexes and a stronger impact in the females. A smaller number of miRNAs responded to BC supplementation in males. Additionally, with the notable exception of miR-122 in females (discussed below), most DE miRNAs changed within a small range in both sexes. The low fold-change observed may be due to upregulated mmu-miR-468-3p in males and mmu-miR-103-3p in females. In the present study, these miRs were identified in silico as negative regulators of Dcgr8 (encoding DROSHA), and the efficiency of miRNA processing by DROSHA crucially determines the abundance of miRNAs [34].
The liver is an organ with recognized sexually dimorphic metabolic and cellular responses and is extremely sensitive to the action of sexual hormones [35,36]. Further, the effects of dietary BC on gene expression are also highly organ and sex-specific [37]. Our results fit in this perspective since changes in the hepatic miRNA profile with neonatal BC strongly differed between sexes. Particularly noteworthy was the sex-dependent response to early life BC supplementation of hepatic miR-122 expression, markedly and significantly upregulated (x51-fold) in the female offspring and unaffected in the male offspring. Of note, miR-122 has been described as a female-predominant miRNA related to nutritional conditions (induced upon starvation) in rats [38]. miR-122 is the predominant liver miRNA, making up 70% of the total miRNA population [39]. miR-122 is a critical regulator of hepatic homeostasis and lipid metabolism, and its activity decreases lipogenesis and suppresses the pathogenic progress of hepatocellular carcinoma [40]. Increased liver miR-122 expression levels with neonatal BC, as observed in the female offspring, could thus represent a beneficial effect. Further, miR-122 expression is controlled by miR-370 [41] and, interestingly, a maternal high-fat diet was found to decrease miR-122 expression and increase miR-370 expression in the liver of recently weaned mouse offspring [19], changes opposite to those observed here in the female offspring of high-fat/high-sucrose (WD)-fed dams following BC supplementation, namely increased miR-122 and decreased miR-370 expression (Table 2). miR-370 directly down-regulates CPT1α, the rate-limiting enzyme in fatty acid β-oxidation [41].
We approached the potential functions of the DE miRNAs in the liver of BC males and females by GO annotation and KEGG enrichment analysis of predicted targets and the construction of miRNA-gene interaction networks. In male animals, significant GO terms retrieved pointed to specific biological processes potentially relevant to maintaining homeostasis in the liver, such as the ERK1/ERK2 cascade [42]. At the same time, KEGG analysis of targets of DE miRNAs in the liver of BC males showed enrichment for genes in the Hedgehog signaling pathway involved in regulating hepatic lipid metabolism and its zonation [43]. Interestingly, enriched pathways in the BC males also included neurodegenerations/Alzheimer’s disease and insulin resistance, processes that are related to each other [44] and potentially to BC nutrition and metabolism. A connection between neurodegenerations/ Alzheimer’s disease and BC is indicated by results showing modulation of dietary BC metabolism by the APOE genotype: following a BC diet, engineered mice expressing the human APOE4 isoform had lower plasma and tissue BC levels due to higher hepatic (but not intestinal) Bco1 expression compared with mice expressing human APOE3 [45]. The APOE4 genotype is the strongest genetic risk factor for Alzheimer’s disease [46]. The connection is also suggested by research pointing to the protective effects of BC on cognitive function and specifically against Alzheimer’s disease [5,6]. A connection between insulin resistance and BC may involve effects on the low-density lipoprotein (LDL) fraction. LDL is the main carrier of circulating BC, transporting about 60%–70% of total serum BC [47], and there is evidence that BC can inhibit the oxidative modification of LDL [48]. High oxidized LDL levels are associated with insulin resistance [49], metabolic syndrome [50], and atherosclerosis [51]. Oxidized LDL is also neurotoxic and has been related to Alzheimer’s disease [52], even if this latter condition has multifactorial etiology. Serum BC levels in humans are inversely associated with insulin resistance [53] and metabolic syndrome [54] and are reduced in patients with Alzheimer’s disease [55,56].
As in males, Hedgehog signaling was identified as one of the top enriched KEGG pathways of targets of DE miRNA in the liver of female offspring supplemented with BC. However, neurodegenerations/Alzheimer’s disease and insulin resistance were not. Instead, enrichment in targets related to drug metabolism and cancer was revealed for DE miRNAs in the liver of BC-supplemented females. It is well established that similar to humans, male mice have lower insulin sensitivity than female mice and are more susceptible to unhealthy diet-induced metabolic disorders [57,58,59]. Therefore, epigenetic modulation of these health endpoints by neonatal BC supplementation (for instance, through effects on miRNAs in the liver and possibly other tissues) could be particularly interesting in males. Overall, supplementing BC during the suckling period impacts the hepatic expression of miRNAs in recently weaned mice born to mothers fed an unbalanced diet, and GO and KEGG analysis suggest that the affected miRNAs target genes involved in clinically relevant pathways modulated in a beneficial manner by BC/vitamin A in the adult animals. Therefore, changes in these miRNAs could represent early epigenetic mediators of long-term effects of early postnatal BC supplementation in offspring exposed to an unbalanced maternal diet during gestation and lactation.
Six DE miRNAs in males and 16 DE miRNAs in females were predicted through in silico analyses to regulate 86 overlapping genes across both sexes. Forty-seven of these overlapping genes (55% percent) were targeted by miRNAs with opposite (down or up) regulation between sexes. Nutritional or functional associations to BC or BC derivates are described in the literature for some of the overlapping genes, such as Cntn2 [60], Etv3 [61], Foxp2 [62], Otud7b [63], and Pbxl [64]. Additionally, among the 47 predicted overlapping targets of miRNAs affected in opposite senses across sexes was the Rora gene encoding the retinoic acid receptor-related orphan receptor alpha transcription factor. Interestingly, sex-dependent differences in the expression of the Rora gene in the liver during aging have been described [65]. Further, the expression of miR-122 – a miRNA with a marked sex-dependent response in our experiment- is induced in liver cells by saturated free fatty acids in a RORɑ-dependent manner [66]. Rora is a circadian rhythm gene [67], an enriched pathway in our GO analysis for males and KEGG analysis for females.
Bioinformatics analysis of interactions between predicted target gene products of miRNAs differentially expressed upon BC supplementation revealed many connections involving Pik3r1. This gene was a predicted target of DE miR-762 in males and of miR-320-3p and miR-103-3p in females and is a validated target of miR-103-3p (Table S2). Pik3r1 encodes a regulatory subunit of phosphoinositide 3-kinases (PI3K). PI3K are crucial components of the PI3K/AKT/mTOR pathway regulating cell growth, metabolism, survival, apoptosis, and autophagy [68]. The Pik3r1 product binds, stabilizes, and inhibits the PI3K catalytic subunit, thus exerting a complex regulatory role. It is involved in modulating the metabolic actions of insulin, and its mutation has been associated with insulin resistance [69]. The Pik3r1 protein product also has tumor suppressor potential since its reduced levels favor the constitutive activation of downstream Akt signaling, which can induce carcinogenesis [70]. Previous studies showed BC can activate the PI3K/AKT/mTOR signaling pathway to attenuate apoptosis and autophagy induced by LPS in intestinal epithelial cells [71] and glycation end products in cardiomyocytes [72]. Though these examples are not in liver cells, results herein in this work suggest the possible involvement of BC effects on miRNAs targeting Pik3r1.
Interestingly, both in male and female offspring, DE miRNAs were found targeting Bco1, and all of them were downregulated, suggesting the possible upregulation of hepatic Bco1 expression following oral BC supplementation irrespective of sex. Dietary BC conversion to vitamin A retinoids through BCO1 decreases adiposity [73,74], circulating cholesterol [75], and atherosclerosis progression in various experimental animal models [76,77]. In humans, responses to dietary BC may be widely variable due to genetic variants in the BCO1 coding gene [78,79]. Additionally, there is emerging evidence that BCO1 may have functional roles in regulating metabolism and cellular fate independent of its role in carotenoid cleavage, and these roles seem to involve the regulation of miRNAs [12,80].
This is the first report to evaluate the impact of neonatal BC supplementation in the context of an obesogenic maternal diet on the miRNA profile in the liver of offspring. Our study provides a global vision that BC supplementation in early life can impact tissue miRNA expression in a sex-dependent manner and that sexual differences in metabolic programming could rely on miRNAs, among other factors. The present study has some limitations that should be noted. First, our results are based on a mouse model with a small sample size and are limited to the short term. An in-depth investigation should be performed to ascertain the long-term programming impact of observed effects in recently weaned animals and the translatability of findings to humans. Second, we performed a bioinformatics analysis based on microarray data without RNA expression validations by real-time qPCR; thorough validation and further functional experiments should be performed in the future to investigate specific candidate miRNAs and their downstream functions directly. Given the complexity of the biological response predicted, further exploration is required to uncover interesting aspects of gene regulation by miRNAs affected by BC supplementation in early life.
To sum up, findings in this work identify distinct miRNAs differentially expressed with BC supplementation in the female and male liver of young mice born to WD-fed mothers and provide an overall vision of their potential functional impact. The current study and integrated analysis may open new avenues for research toward understanding the molecular mechanisms associated with the programming effects of BC supplementation early on in offspring exposed to a maternal unbalanced (Western) diet. Further studies are required to decipher the long-term impact on liver metabolism and health and the underlying molecular mechanisms of these miRNAs.
Supplementary Materials
The following supporting information can be downloaded at the website of this paper posted on Preprints.org, Table S1: Biometric parameters at sacrifice; Table S2: Overlapping target genes in both sexes of miRNAs differentially expressed with neonatal beta-carotene supplementation; Table S3: KEGG pathway adscriptions of overlapping target genes in both sexes of miRNAs differentially expressed with neonatal beta-carotene supplementation; Figure S1: miRNA-gene interaction networks; Figure S2: Protein-protein interaction (PPI) networks of predicted targets of the miRNAs differentially expressed with neonatal beta-carotene supplementation.
Author Contributions
Conceptualization, MLB, JR, and EC; Investigation, DMA-G, and SG; Formal analysis and visualization, DMA-G, SG, MLB, JR, RC, MCC, EC; Funding acquisition, JR, and EC. All authors were involved in drafting, revising and editing the manuscript. All authors have read and agreed to the published version of the manuscript.
Funding
This research was funded by PNRR Project: H23C22000370006-T4Y S5G4PP1 to E.C., and by projects PGC2018-097436-B-I00, PID2022-138140NB-I00 (to J. R.), and RED2022-134577-T (to J. R.) funded by MCIN/AEI/ 10.13039/501100011033 and by “ERDF A way of making Europe”.
Institutional Review Board Statement
The animal study protocol was approved by the University of the Balearic Islands' Animal Experimentation Ethics Committee (CEEA) (#ECC/566/2015 of March 20).
Data availability statement: The data that support the findings of this study are available from the corresponding author upon reasonable request.
Conflicts of Interest
The authors do not have any conflict of interest to disclose.
References
- Johnson: E.J. The role of carotenoids in human health. Nutr Clin Care 2002, 5, 56-65. [CrossRef]
- Age-Related Eye Disease Study Research, G. A randomized, placebo-controlled, clinical trial of high-dose supplementation with vitamins C and E, beta carotene, and zinc for age-related macular degeneration and vision loss: AREDS report no. 8. Arch Ophthalmol 2001, 119, 1417-1436. [CrossRef]
- Baswan, S.M.; Klosner, A.E.; Weir, C.; Salter-Venzon, D.; Gellenbeck, K.W.; Leverett, J.; Krutmann, J. Role of ingestible carotenoids in skin protection: A review of clinical evidence. Photodermatol Photoimmunol Photomed 2021, 37, 490-504. [CrossRef]
- Bonet, M.L.; Ribot, J.; Galmes, S.; Serra, F.; Palou, A. Carotenoids and carotenoid conversion products in adipose tissue biology and obesity: Pre-clinical and human studies. Biochimica et biophysica acta. Molecular and cell biology of lipids 2020, 1865, 158676. [CrossRef]
- Yuan, C.; Fondell, E.; Ascherio, A.; Okereke, O.I.; Grodstein, F.; Hofman, A.; Willett, W.C. Long-Term Intake of Dietary Carotenoids Is Positively Associated with Late-Life Subjective Cognitive Function in a Prospective Study in US Women. J Nutr 2020, 150, 1871-1879. [CrossRef]
- Abrego-Guandique, D.M.; Bonet, M.L.; Caroleo, M.C.; Cannataro, R.; Tucci, P.; Ribot, J.; Cione, E. The Effect of Beta-Carotene on Cognitive Function: A Systematic Review. Brain Sci 2023, 13. [CrossRef]
- Bohn, T.; Bonet, M.L.; Borel, P.; Keijer, J.; Landrier, J.F.; Milisav, I.; Ribot, J.; Riso, P.; Winklhofer-Roob, B.; Sharoni, Y.; et al. Mechanistic aspects of carotenoid health benefits - where are we now? Nutr Res Rev 2021, 34, 276-302. [CrossRef]
- Yilmaz, B.; Sahin, K.; Bilen, H.; Bahcecioglu, I.H.; Bilir, B.; Ashraf, S.; Halazun, K.J.; Kucuk, O. Carotenoids and non-alcoholic fatty liver disease. Hepatobiliary Surg Nutr 2015, 4, 161-171. [CrossRef]
- Elvira-Torales, L.I.; Garcia-Alonso, J.; Periago-Caston, M.J. Nutritional Importance of Carotenoids and Their Effect on Liver Health: A Review. Antioxidants 2019, 8. [CrossRef]
- Willeit, P.; Skroblin, P.; Kiechl, S.; Fernandez-Hernando, C.; Mayr, M. Liver microRNAs: potential mediators and biomarkers for metabolic and cardiovascular disease? European heart journal 2016, 37, 3260-3266. [CrossRef]
- Cione, E.; Abrego Guandique, D.M.; Caroleo, M.C.; Luciani, F.; Colosimo, M.; Cannataro, R. Liver Damage and microRNAs: An Update. Curr Issues Mol Biol 2022, 45, 78-91. [CrossRef]
- Lim, J.Y.; Liu, C.; Hu, K.Q.; Smith, D.E.; Wang, X.D. Ablation of carotenoid cleavage enzymes (BCO1 and BCO2) induced hepatic steatosis by altering the farnesoid X receptor/miR-34a/sirtuin 1 pathway. Arch Biochem Biophys 2018, 654, 1-9. [CrossRef]
- Peleg-Raibstein, D. Understanding the Link Between Maternal Overnutrition, Cardio-Metabolic Dysfunction and Cognitive Aging. Front Neurosci 2021, 15, 645569. [CrossRef]
- Yao, Q.; Chen, Y.; Zhou, X. The roles of microRNAs in epigenetic regulation. Curr Opin Chem Biol 2019, 51, 11-17. [CrossRef]
- Perri, M.; Lucente, M.; Cannataro, R.; De Luca, I.F.; Gallelli, L.; Moro, G.; De Sarro, G.; Caroleo, M.C.; Cione, E. Variation in Immune-Related microRNAs Profile in Human Milk Amongst Lactating Women. Microrna 2018, 7, 107-114. [CrossRef]
- Pomar, C.A.; Castro, H.; Pico, C.; Serra, F.; Palou, A.; Sanchez, J. Cafeteria Diet Consumption during Lactation in Rats, Rather than Obesity Per Se, alters miR-222, miR-200a, and miR-26a Levels in Milk. Mol Nutr Food Res 2019, 63, e1800928. [CrossRef]
- Puppala, S.; Li, C.; Glenn, J.P.; Saxena, R.; Gawrieh, S.; Quinn, A.; Palarczyk, J.; Dick, E.J., Jr.; Nathanielsz, P.W.; Cox, L.A. Primate fetal hepatic responses to maternal obesity: epigenetic signalling pathways and lipid accumulation. J Physiol 2018, 596, 5823-5837. [CrossRef]
- Sugino, K.Y.; Mandala, A.; Janssen, R.C.; Gurung, S.; Trammell, M.; Day, M.W.; Brush, R.S.; Papin, J.F.; Dyer, D.W.; Agbaga, M.P.; et al. Western diet-induced shifts in the maternal microbiome are associated with altered microRNA expression in baboon placenta and fetal liver. Front Clin Diabetes Healthc 2022, 3. [CrossRef]
- Benatti, R.O.; Melo, A.M.; Borges, F.O.; Ignacio-Souza, L.M.; Simino, L.A.; Milanski, M.; Velloso, L.A.; Torsoni, M.A.; Torsoni, A.S. Maternal high-fat diet consumption modulates hepatic lipid metabolism and microRNA-122 (miR-122) and microRNA-370 (miR-370) expression in offspring. Br J Nutr 2014, 111, 2112-2122. [CrossRef]
- Zhang, J.; Zhang, F.; Didelot, X.; Bruce, K.D.; Cagampang, F.R.; Vatish, M.; Hanson, M.; Lehnert, H.; Ceriello, A.; Byrne, C.D. Maternal high fat diet during pregnancy and lactation alters hepatic expression of insulin like growth factor-2 and key microRNAs in the adult offspring. BMC Genomics 2009, 10, 478. [CrossRef]
- Mennitti, L.V.; Carpenter, A.A.M.; Loche, E.; Pantaleao, L.C.; Fernandez-Twinn, D.S.; Schoonejans, J.M.; Blackmore, H.L.; Ashmore, T.J.; Pisani, L.P.; Tadross, J.A.; et al. Effects of maternal diet-induced obesity on metabolic disorders and age-associated miRNA expression in the liver of male mouse offspring. Int J Obes (Lond) 2022, 46, 269-278. [CrossRef]
- Lipkie, T.E.; Morrow, A.L.; Jouni, Z.E.; McMahon, R.J.; Ferruzzi, M.G. Longitudinal Survey of Carotenoids in Human Milk from Urban Cohorts in China, Mexico, and the USA. PLoS One 2015, 10, e0127729. [CrossRef]
- Vishwanathan, R.; Panagos, P.; Sen, S. Breast milk carotenoid concentrations are decreased in obese mothers. In Proceedings of the The FASEB Journal 2014 28:1_supplement, 2014.
- Arreguin, A.; Ribot, J.; Musinovic, H.; von Lintig, J.; Palou, A.; Bonet, M.L. Dietary vitamin A impacts DNA methylation patterns of adipogenesis-related genes in suckling rats. Arch Biochem Biophys 2018, 650, 75-84. [CrossRef]
- O'Byrne, S.M.; Kako, Y.; Deckelbaum, R.J.; Hansen, I.H.; Palczewski, K.; Goldberg, I.J.; Blaner, W.S. Multiple pathways ensure retinoid delivery to milk: studies in genetically modified mice. Am J Physiol Endocrinol Metab 2010, 298, E862-870. [CrossRef]
- Rath, E.A.; Thenen, S.W. Use of tritiated water for measurement of 24-hour milk intake in suckling lean and genetically obese (ob/ob) mice. J Nutr 1979, 109, 840-847. [CrossRef]
- Musinovic, H.; Bonet, M.L.; Granados, N.; Amengual, J.; von Lintig, J.; Ribot, J.; Palou, A. beta-Carotene during the suckling period is absorbed intact and induces retinoic acid dependent responses similar to preformed vitamin A in intestine and liver, but not adipose tissue of young rats. Mol Nutr Food Res 2014, 58, 2157-2165. [CrossRef]
- Geiss, G.K.; Bumgarner, R.E.; Birditt, B.; Dahl, T.; Dowidar, N.; Dunaway, D.L.; Fell, H.P.; Ferree, S.; George, R.D.; Grogan, T.; et al. Direct multiplexed measurement of gene expression with color-coded probe pairs. Nat Biotechnol 2008, 26, 317-325. [CrossRef]
- Tastsoglou, S.; Skoufos, G.; Miliotis, M.; Karagkouni, D.; Koutsoukos, I.; Karavangeli, A.; Kardaras, F.S.; Hatzigeorgiou, A.G. DIANA-miRPath v4.0: expanding target-based miRNA functional analysis in cell-type and tissue contexts. Nucleic Acids Res 2023, 51, W154-W159. [CrossRef]
- Love, M.I.; Huber, W.; Anders, S. Moderated estimation of fold change and dispersion for RNA-seq data with DESeq2. Genome Biol 2014, 15, 550. [CrossRef]
- Shu, J.; Silva, B.; Gao, T.; Xu, Z.; Cui, J. Dynamic and Modularized MicroRNA Regulation and Its Implication in Human Cancers. Sci Rep 2017, 7, 13356. [CrossRef]
- von Lintig, J.; Vogt, K. Filling the gap in vitamin A research. Molecular identification of an enzyme cleaving beta-carotene to retinal. J Biol Chem 2000, 275, 11915-11920.
- Rao, M.S.; Van Vleet, T.R.; Ciurlionis, R.; Buck, W.R.; Mittelstadt, S.W.; Blomme, E.A.G.; Liguori, M.J. Comparison of RNA-Seq and Microarray Gene Expression Platforms for the Toxicogenomic Evaluation of Liver From Short-Term Rat Toxicity Studies. Front Genet 2018, 9, 636. [CrossRef]
- Santamaria, C.; Muntion, S.; Roson, B.; Blanco, B.; Lopez-Villar, O.; Carrancio, S.; Sanchez-Guijo, F.M.; Diez-Campelo, M.; Alvarez-Fernandez, S.; Sarasquete, M.E.; et al. Impaired expression of DICER, DROSHA, SBDS and some microRNAs in mesenchymal stromal cells from myelodysplastic syndrome patients. Haematologica 2012, 97, 1218-1224. [CrossRef]
- Rando, G.; Wahli, W. Sex differences in nuclear receptor-regulated liver metabolic pathways. Biochim Biophys Acta 2011, 1812, 964-973. [CrossRef]
- Nevola, R.; Tortorella, G.; Rosato, V.; Rinaldi, L.; Imbriani, S.; Perillo, P.; Mastrocinque, D.; La Montagna, M.; Russo, A.; Di Lorenzo, G.; et al. Gender Differences in the Pathogenesis and Risk Factors of Hepatocellular Carcinoma. Biology (Basel) 2023, 12. [CrossRef]
- van Helden, Y.G.; Godschalk, R.W.; von Lintig, J.; Lietz, G.; Landrier, J.F.; Bonet, M.L.; van Schooten, F.J.; Keijer, J. Gene expression response of mouse lung, liver and white adipose tissue to beta-carotene supplementation, knockout of Bcmo1 and sex. Mol Nutr Food Res 2011, 55, 1466-1474. [CrossRef]
- Cheung, L.; Gustavsson, C.; Norstedt, G.; Tollet-Egnell, P. Sex-different and growth hormone-regulated expression of microRNA in rat liver. BMC Mol Biol 2009, 10, 13. [CrossRef]
- Lagos-Quintana, M.; Rauhut, R.; Yalcin, A.; Meyer, J.; Lendeckel, W.; Tuschl, T. Identification of tissue-specific microRNAs from mouse. Curr Biol 2002, 12, 735-739. [CrossRef]
- Wen, J.; Friedman, J.R. miR-122 regulates hepatic lipid metabolism and tumor suppression. J Clin Invest 2012, 122, 2773-2776. [CrossRef]
- Iliopoulos, D.; Drosatos, K.; Hiyama, Y.; Goldberg, I.J.; Zannis, V.I. MicroRNA-370 controls the expression of microRNA-122 and Cpt1alpha and affects lipid metabolism. J Lipid Res 2010, 51, 1513-1523. [CrossRef]
- Cingolani, F.; Liu, Y.; Shen, Y.; Wen, J.; Farris, A.B.; Czaja, M.J. Redundant Functions of ERK1 and ERK2 Maintain Mouse Liver Homeostasis Through Down-Regulation of Bile Acid Synthesis. Hepatol Commun 2022, 6, 980-994. [CrossRef]
- Matz-Soja, M.; Rennert, C.; Schonefeld, K.; Aleithe, S.; Boettger, J.; Schmidt-Heck, W.; Weiss, T.S.; Hovhannisyan, A.; Zellmer, S.; Kloting, N.; et al. Hedgehog signaling is a potent regulator of liver lipid metabolism and reveals a GLI-code associated with steatosis. Elife 2016, 5. [CrossRef]
- Sedzikowska, A.; Szablewski, L. Insulin and Insulin Resistance in Alzheimer's Disease. Int J Mol Sci 2021, 22. [CrossRef]
- Huebbe, P.; Lange, J.; Lietz, G.; Rimbach, G. Dietary beta-carotene and lutein metabolism is modulated by the APOE genotype. Biofactors 2016, 42, 388-396. [CrossRef]
- Raulin, A.C.; Doss, S.V.; Trottier, Z.A.; Ikezu, T.C.; Bu, G.; Liu, C.C. ApoE in Alzheimer's disease: pathophysiology and therapeutic strategies. Mol Neurodegener 2022, 17, 72. [CrossRef]
- Shete, V.; Costabile, B.K.; Kim, Y.K.; Quadro, L. Low-Density Lipoprotein Receptor Contributes to beta-Carotene Uptake in the Maternal Liver. Nutrients 2016, 8. [CrossRef]
- Karppi, J.; Nurmi, T.; Kurl, S.; Rissanen, T.H.; Nyyssonen, K. Lycopene, lutein and beta-carotene as determinants of LDL conjugated dienes in serum. Atherosclerosis 2010, 209, 565-572. [CrossRef]
- Linna, M.S.; Ahotupa, M.; Kukkonen-Harjula, K.; Fogelholm, M.; Vasankari, T.J. Co-existence of insulin resistance and high concentrations of circulating oxidized LDL lipids. Ann Med 2015, 47, 394-398. [CrossRef]
- Holvoet, P.; De Keyzer, D.; Jacobs, D.R., Jr. Oxidized LDL and the metabolic syndrome. Future Lipidol 2008, 3, 637-649. [CrossRef]
- Poznyak, A.V.; Nikiforov, N.G.; Markin, A.M.; Kashirskikh, D.A.; Myasoedova, V.A.; Gerasimova, E.V.; Orekhov, A.N. Overview of OxLDL and Its Impact on Cardiovascular Health: Focus on Atherosclerosis. Front Pharmacol 2020, 11, 613780. [CrossRef]
- Yamchuen, P.; Aimjongjun, S.; Limpeanchob, N. Oxidized low density lipoprotein increases acetylcholinesterase activity correlating with reactive oxygen species production. Neurochem Int 2014, 78, 1-6. [CrossRef]
- Harari, A.; Coster, A.C.F.; Jenkins, A.; Xu, A.; Greenfield, J.R.; Harats, D.; Shaish, A.; Samocha-Bonet, D. Obesity and Insulin Resistance Are Inversely Associated with Serum and Adipose Tissue Carotenoid Concentrations in Adults. J Nutr 2020, 150, 38-46. [CrossRef]
- Beydoun, M.A.; Chen, X.; Jha, K.; Beydoun, H.A.; Zonderman, A.B.; Canas, J.A. Carotenoids, vitamin A, and their association with the metabolic syndrome: a systematic review and meta-analysis. Nutr Rev 2019, 77, 32-45. [CrossRef]
- Jimenez-Jimenez, F.J.; Molina, J.A.; de Bustos, F.; Orti-Pareja, M.; Benito-Leon, J.; Tallon-Barranco, A.; Gasalla, T.; Porta, J.; Arenas, J. Serum levels of beta-carotene, alpha-carotene and vitamin A in patients with Alzheimer's disease. Eur J Neurol 1999, 6, 495-497. [CrossRef]
- Mullan, K.; Williams, M.A.; Cardwell, C.R.; McGuinness, B.; Passmore, P.; Silvestri, G.; Woodside, J.V.; McKay, G.J. Serum concentrations of vitamin E and carotenoids are altered in Alzheimer's disease: A case-control study. Alzheimers Dement (N Y) 2017, 3, 432-439. [CrossRef]
- Ciarambino, T.; Crispino, P.; Guarisco, G.; Giordano, M. Gender Differences in Insulin Resistance: New Knowledge and Perspectives. Curr Issues Mol Biol 2023, 45, 7845-7861. [CrossRef]
- Macotela, Y.; Boucher, J.; Tran, T.T.; Kahn, C.R. Sex and depot differences in adipocyte insulin sensitivity and glucose metabolism. Diabetes 2009, 58, 803-812. [CrossRef]
- Gao, A.; Su, J.; Liu, R.; Zhao, S.; Li, W.; Xu, X.; Li, D.; Shi, J.; Gu, B.; Zhang, J.; et al. Sexual dimorphism in glucose metabolism is shaped by androgen-driven gut microbiome. Nat Commun 2021, 12, 7080. [CrossRef]
- Yamaguchi, Y.; Zampino, M.; Tanaka, T.; Bandinelli, S.; Moaddel, R.; Fantoni, G.; Candia, J.; Ferrucci, L.; Semba, R.D. The Plasma Proteome Fingerprint Associated with Circulating Carotenoids and Retinol in Older Adults. J Nutr 2022, 152, 40-48. [CrossRef]
- Janesick, A.; Wu, S.C.; Blumberg, B. Retinoic acid signaling and neuronal differentiation. Cell Mol Life Sci 2015, 72, 1559-1576. [CrossRef]
- Reay, W.R.; Kiltschewskij, D.J.; Di Biase, M.A.; Gerring, Z.F.; Kundu, K.; Surendran, P.; Greco, L.A.; Clarke, E.D.; Collins, C.E.; Mondul, A.M.; et al. Genetic influences on circulating retinol and its relationship to human health. Nat Commun 2024, 15, 1490. [CrossRef]
- Kanki, K.; Akechi, Y.; Ueda, C.; Tsuchiya, H.; Shimizu, H.; Ishijima, N.; Toriguchi, K.; Hatano, E.; Endo, K.; Hirooka, Y.; et al. Biological and clinical implications of retinoic acid-responsive genes in human hepatocellular carcinoma cells. J Hepatol 2013, 59, 1037-1044. [CrossRef]
- van Helden, Y.G.; Godschalk, R.W.; Swarts, H.J.; Hollman, P.C.; van Schooten, F.J.; Keijer, J. Beta-carotene affects gene expression in lungs of male and female Bcmo1 (-/-) mice in opposite directions. Cell Mol Life Sci 2011, 68, 489-504. [CrossRef]
- Noh, S.G.; Jung, H.J.; Kim, S.; Arulkumar, R.; Kim, D.H.; Park, D.; Chung, H.Y. Regulation of Circadian Genes Nr1d1 and Nr1d2 in Sex-Different Manners during Liver Aging. Int J Mol Sci 2022, 23. [CrossRef]
- Chai, C.; Rivkin, M.; Berkovits, L.; Simerzin, A.; Zorde-Khvalevsky, E.; Rosenberg, N.; Klein, S.; Yaish, D.; Durst, R.; Shpitzen, S.; et al. Metabolic Circuit Involving Free Fatty Acids, microRNA 122, and Triglyceride Synthesis in Liver and Muscle Tissues. Gastroenterology 2017, 153, 1404-1415. [CrossRef]
- Sato, T.K.; Panda, S.; Miraglia, L.J.; Reyes, T.M.; Rudic, R.D.; McNamara, P.; Naik, K.A.; FitzGerald, G.A.; Kay, S.A.; Hogenesch, J.B. A functional genomics strategy reveals Rora as a component of the mammalian circadian clock. Neuron 2004, 43, 527-537. [CrossRef]
- Ersahin, T.; Tuncbag, N.; Cetin-Atalay, R. The PI3K/AKT/mTOR interactive pathway. Mol Biosyst 2015, 11, 1946-1954. [CrossRef]
- Tsay, A.; Wang, J.C. The Role of PIK3R1 in Metabolic Function and Insulin Sensitivity. Int J Mol Sci 2023, 24. [CrossRef]
- Cheung, L.W.; Mills, G.B. Targeting therapeutic liabilities engendered by PIK3R1 mutations for cancer treatment. Pharmacogenomics 2016, 17, 297-307. [CrossRef]
- Xu, G.; Ma, T.; Zhou, C.; Zhao, F.; Peng, K.; Li, B. beta-Carotene Attenuates Apoptosis and Autophagy via PI3K/AKT/mTOR Signaling Pathway in Necrotizing Enterocolitis Model Cells IEC-6. Evid Based Complement Alternat Med 2022, 2022, 2502263. [CrossRef]
- Zhao, G.; Zhang, X.; Wang, H.; Chen, Z. Beta carotene protects H9c2 cardiomyocytes from advanced glycation end product-induced endoplasmic reticulum stress, apoptosis, and autophagy via the PI3K/Akt/mTOR signaling pathway. Ann Transl Med 2020, 8, 647. [CrossRef]
- Amengual, J.; Gouranton, E.; van Helden, Y.G.; Hessel, S.; Ribot, J.; Kramer, E.; Kiec-Wilk, B.; Razny, U.; Lietz, G.; Wyss, A.; et al. Beta-carotene reduces body adiposity of mice via BCMO1. PLoS One 2011, 6, e20644. [CrossRef]
- Coronel, J.; Yu, J.; Pilli, N.; Kane, M.A.; Amengual, J. The conversion of beta-carotene to vitamin A in adipocytes drives the anti-obesogenic effects of beta-carotene in mice. Mol Metab 2022, 66, 101640. [CrossRef]
- Amengual, J.; Coronel, J.; Marques, C.; Aradillas-Garcia, C.; Morales, J.M.V.; Andrade, F.C.D.; Erdman, J.W.; Teran-Garcia, M. beta-Carotene Oxygenase 1 Activity Modulates Circulating Cholesterol Concentrations in Mice and Humans. J Nutr 2020, 150, 2023-2030. [CrossRef]
- Zhou, F.; Wu, X.; Pinos, I.; Abraham, B.M.; Barrett, T.J.; von Lintig, J.; Fisher, E.A.; Amengual, J. beta-Carotene conversion to vitamin A delays atherosclerosis progression by decreasing hepatic lipid secretion in mice. J Lipid Res 2020, 61, 1491-1503. [CrossRef]
- Pinos, I.; Coronel, J.; Albakri, A.; Blanco, A.; McQueen, P.; Molina, D.; Sim, J.; Fisher, E.A.; Amengual, J. beta-Carotene accelerates the resolution of atherosclerosis in mice. Elife 2024, 12. [CrossRef]
- Leung, W.C.; Hessel, S.; Meplan, C.; Flint, J.; Oberhauser, V.; Tourniaire, F.; Hesketh, J.E.; von Lintig, J.; Lietz, G. Two common single nucleotide polymorphisms in the gene encoding beta-carotene 15,15'-monoxygenase alter beta-carotene metabolism in female volunteers. FASEB J 2009, 23, 1041-1053. [CrossRef]
- Grune, T.; Lietz, G.; Palou, A.; Ross, A.C.; Stahl, W.; Tang, G.; Thurnham, D.; Yin, S.A.; Biesalski, H.K. Beta-carotene is an important vitamin A source for humans. J Nutr 2010, 140, 2268S-2285S, . [CrossRef]
- Kim, Y.S.; Gong, X.; Rubin, L.P.; Choi, S.W.; Kim, Y. beta-Carotene 15,15'-oxygenase inhibits cancer cell stemness and metastasis by regulating differentiation-related miRNAs in human neuroblastoma. J Nutr Biochem 2019, 69, 31-43. [CrossRef]
Disclaimer/Publisher’s Note: The statements, opinions and data contained in all publications are solely those of the individual author(s) and contributor(s) and not of MDPI and/or the editor(s). MDPI and/or the editor(s) disclaim responsibility for any injury to people or property resulting from any ideas, methods, instructions or products referred to in the content. |
© 2024 by the authors. Licensee MDPI, Basel, Switzerland. This article is an open access article distributed under the terms and conditions of the Creative Commons Attribution (CC BY) license (http://creativecommons.org/licenses/by/4.0/).
Copyright: This open access article is published under a Creative Commons CC BY 4.0 license, which permit the free download, distribution, and reuse, provided that the author and preprint are cited in any reuse.


