

Submitted:
24 April 2024
Posted:
26 April 2024
You are already at the latest version
Abstract
YouTube is a very popular social media platform in today’s digital landscape. The primary
focus of this study is to explore the underlying sentiment in user comments on food-related videos
on YouTube, specifically within two pivotal food product categories: Plant-Based and Hedonic.
Our research involved labelling comments using sentiment lexicons such as TextBlob and VADER.
Furthermore, the sentiments of the comments were classified using advanced Machine Learning
(ML) algorithms, namely Support Vector Machine (SVM), Multinomial Naive Bayes, Random Forest,
Logistic Regression, and XGBoost. The evaluation of these models encompassed key macro average
metrics, including accuracy, precision, recall, and f1-score. Results from VADER showcased a high
accuracy level, with SVM achieving 93% accuracy in the plant-based dataset and 96% in the hedonic
dataset. In addition to sentiment analysis, we delved into user interactions within the two datasets,
measuring crucial metrics such as views, likes, comments, and engagement rate. The findings
illuminate significantly higher levels of views, likes, and comments in the hedonic food dataset, but
the plant-based dataset maintains a superior overall engagement rate.
Keywords:
plant-based products
; hedonic food products
; sentiment analysis
; text analytics
; youtube comments
; machine learning
1. Introduction
Driven by a substantial pool of potential consumers, stakeholders in the food industry, including suppliers and retailers, are increasingly motivated to harness social media platforms, amplifying interactive engagements [1]. Within this context, the ever-evolving landscape of digital content consumption has witnessed the widespread traction of visual-centric social media platforms such as YouTube, Instagram, and Tik Tok. Among these platforms, YouTube stands out as a transformative force, shaping how individuals engage with a myriad of topics, including food. As a visual-centric social media platform, YouTube has become a hub for culinary exploration, providing a diverse array of content ranging from cooking tutorials to food reviews.The platform’s influence extends beyond mere viewership, with users actively participating through comments, likes, and shares, thereby creating a dynamic and interactive community. Consequently, a research interest revolves around investigating the role of YouTube within the food sector.
In our study we aim to contribute to the evolving understanding of user sentiments within YouTube food videos. The study has three objectives. The primary one, aims to understand user sentiment in a variety of YouTube videos related to Plant-Based and Hedonic food products. The second objective is to determine the most accurate machine learning algorithm for detecting sentiment in YouTube food videos. Lastly, the study seeks to explore user engagement levels in YouTube videos related to food, examining metrics such as views, likes, comments, and engagement rate. In particular, we identify the most appropriate data labelling tool by comparing two well-known libraries. Additionally, we investigate the most accurate Machine Learning algorithm for predicting sentiment. Lastly, we explore the interaction of users with food videos on YouTube. The purpose of this study is to address the following research questions:
- RQ1: What is the most appropriate sentiment analysis tool for our study when it comes to data labelling, TextBlob or VADER?
- RQ2: What is the most accurate ML algorithm to detect sentiment in YouTube food videos?
- RQ3: How do user engagement levels reflect in YouTube food videos, particularly concerning views, likes, comments and engagement rate?
This study holds significant implications for advancing our understanding of user sentiments in YouTube food videos, with a specific emphasis on the domains of Plant-Based and Hedonic food products. The research seeks to address critical gaps in the current literature, particularly in the context of plant-based foods where research is notably limited. Understanding public sentiment toward a specific food category can greatly influence marketing strategies, product development, and content creation.
2. Theoretical Background
In the theoretical background section, the study examines aspects related to plant-based and hedonic products. Furthermore, the research highlights the significance of YouTube comments as authentic user-generated content and reviews relevant prior works within the academic landscape.
2.1. Plant-Based Products
In recent years, plant-based diets have garnered the attention of the general public [2]. Amid growing concerns about animal welfare [3] and how diet affects our health and the environment, a collective aspiration has emerged to curtail the consumption of animal-based products. Evidently, consumers are demonstrating a growing interest in replacing, reducing, or even completely eliminating animal-based products such as meat, milk, and eggs. Nevertheless, the extensive utilization of animal products in various traditional food cultures generates cultural, culinary, and sensory conflicts, thereby highlighting the challenges associated with the ongoing transition [4]. The term "plant-based" has recently gained usage to signify a diet that avoids consuming animal products [5]. At its core, the "plant-based" concept encompasses food items meticulously crafted to closely imitate their animal-derived counterparts [6]. Plant-based foods (PBFs) generally lower the risk of developing cardiovascular diseases due to their rich nutrient content, including fiber and antioxidants, while having lower levels of saturated fats and cholesterol compared to foods sourced from animals [7].
The global consumption of plant-based products has doubled from 6,7% in 2008–2011 to 13.1% in 2017–2019, with plant-based milk and meat being the most popular options [8]. Particularly, plant-based beverages have experienced remarkable growth. They offer a lactose -and cholesterol- free alternative, effectively serving as wholesome substitutes for dairy milk [9]. Plant proteins are getting a lot of traction too. The global plant protein market is expected to grow from $10.3 billion in 2020 to $15.6 billion by 2026 [10]. Plant-based products’ increasing presence in supermarkets and discount stores and their presumed potential to support a transformation towards more sustainable food systems, underline the relevance of this food market segment.
2.2. Hedonic Products
The desire to eat for pleasure rather than out of prolonged food deprivation is called hedonic hunger [11]. Hedonic foods, encompassing indulgent treats like ice cream, potato chips, and candy, are chosen by consumers primarily for the sensory pleasure they offer, leading to spontaneous purchases driven by the perceived heightened reward value associated with these foods [12]. When individuals buy pleasurable items, they generally undergo emotional reactions, such as experiencing joy while consuming a delightful dessert, and they are less price-sensitive when they want to make a hedonic purchase [13].
Dhar and Wertenbroch [14] discovered in their research that consumers commonly associate hedonic food with enjoyment and pleasure, emphasizing that hedonic consumption is typically motivated by individuals seeking pleasurable experiences. Also, the consumption of hedonic goods is characterized by a subjective, affective, and multi-sensory emotional experience, involving tastes, sounds, scents, tactile impressions, and visual images. This highlights the subjective aspects over objective considerations [15]. Additionally, consumers, as demonstrated by the same authors, place considerable importance on the "taste" and "appearance" of hedonic food products, further emphasizing the sensory and aesthetic factors driving the selection of such items. Moreover, individuals with lower health concerns exhibit a greater inclination toward purchasing hedonic foods. This tendency is reinforced by the association of hedonic foods with an unhealthy image, aligning with people’s desires [16]. Also, pleasurable products can evoke a sense of guilt, prompting consumers to engage in reflection and adopt more altruistic behaviours as a way to offset this feeling.
2.3. YouTube Comments as User Generated Content
The number of videos on the YouTube platform is growing by 100% every year [17]. Considering that it enables users to sign up, create channels, edit their profiles with personal information, add images, write comments, and share videos on other social networks, YouTube is currently one of the most comprehensive social networks available [18]. A notable hallmark of YouTube is its practice of making videos publicly accessible to all, including non-subscribers; however, the privilege of commenting is exclusively reserved for registered users of the platform. Through the act of uploading videos onto the platform, participating in discussions through posts, and disseminating shared content, consumers wield the power to shape marketing strategies, communication initiatives, and even the purchasing choices of individuals spanning virtually every conceivable product category [19]. Users also have the ability to leave comments on videos. These comments encompass a spectrum of viewpoints, including opinions, questions about the video’s content, expressions of gratitude towards the video creator, or even discontent directed at the video itself or its creator [20]. This mechanism of commenting essentially contributes to the pool of user-generated content (UGC). User-generated content (UGC), also referred to as electronic word-of-mouth (eWOM), functions similarly to traditional word-of-mouth [21], with the distinction that it spreads through digital platforms. UGC encompasses original materials created and uploaded to the internet by non-media individuals.
This form of content exerts a significant impact on people’s consumption patterns, often finding its way onto social media platforms such as Facebook, YouTube, Twitter, and Instagram. Online consumers frequently turn to user-generated content as a crucial resource to aid them in making informed purchase choices [22]. The quote, "A brand is no longer what we tell the consumer it is—it is what consumers tell each other it is" (Scott Cook, co-founder of Intuit), captures how user-driven discussions are shaping the changing nature of brand perception.
2.4. Sentiment Analysis
Sentiment analysis, also known as Opinion Mining, is conducted at the document, sentence, and aspect levels [23]. The goal of sentiment analysis is to determine whether text generated by users conveys a positive, negative, or neutral opinion [24]. Three primary techniques for sentiment analysis have been recognized: lexicon-based approaches, ML approaches, and hybrid approaches. Lexicon-based approaches were the initial techniques used for sentiment analysis. There are two main approaches: the dictionary-based approach and the corpus-based approach. Predefined dictionaries like WordNet and SentiWordNet are relied upon for dictionary-based sentiment classification. On the other hand, corpus-based sentiment analysis involves performing a statistical or semantic analysis of document content rather than using predefined dictionaries [25].
ML approaches are utilized to categorize the polarity of sentiments (such as negative, positive, and neutral) by leveraging both training and testing datasets. These approaches can be divided into three primary categories of learning: supervised learning, unsupervised learning, and semi-supervised learning. By harnessing ML techniques, these methodologies can decipher intricate patterns inherent to specific domains within textual content, thus yielding more robust outcomes in the realm of sentiment classification [26]. The most commonly used methods in ML are Support Vector Machines (SVM) and the Naïve Bayes model. Different ML models exist, but these two are the most commonly used. Naïve Bayes is effective when applied to well-formed text corpora, while Support Vector Machines perform well with datasets of low dimensionality [27]. Studies have shown that combining both methods results in better efficiency. Therefore, to improve the outcomes, it is recommended to combine both methods as they complement each other, resulting in improved results compared to using a single approach. Hybrid models combine both lexicon-based and machine-learning approaches.
The rise of social media platforms has significantly altered the worldwide scene, gradually replacing traditional means of communication, spreading ideas, and even how people approach learning on their own ([28]. Businesses and organizations extensively utilize sentiment analysis to identify customer opinions on social media platforms. Between 2008 and 2022, the number of published papers including the concept of "sentiment analysis in social networks" grew at a geometric rate of 34% year on year [29].
The most popular social media platform for extracting information is Twitter [27] and a significant number of academic papers use Twitter as their database. In our research, we use the YouTube platform as the source for customer comments.
2.5. Related Work
The food industry has attracted significant attention from researchers. Rajeswari et al. [30] analyzed consumer reviews for organic and regular food products, concluding that sentiment scores for organic products exceeded those for regular products. In a similar vein, Meza and Yamanaka [31] investigated the dissemination of information about local and organic foods on YouTube. Their findings revealed that viewers generally portrayed sustainable food positively within a broader context, occasionally drawing comparisons with artificially produced alternatives and using these comparisons to promote organic options. In the realm of social media platforms, Lim et al. [32] directed their attention toward analyzing emotions expressed in comments on Food and Beverages Facebook fan pages. Their conclusion highlighted that the sentiment scores provided in these comments do not always accurately reflect the overall mood and sentiment of the entire message due to the analysis’s focus on the word level.
Concurrently, Tzafilkou et al. [33] delved into the emotional states of viewers, analyzing their facial expressions while watching food video campaigns on social media, along with their subjective assessment of their pleasurable affinity toward the product. Authors’ findings indicated that different types of food and media can evoke varying emotional responses, with sadness emerging as the most prevalent emotion. Furthermore, preferences for products were influenced by factors beyond emotional responses, encompassing individual preferences and expectations. In their study, Pastor et al. [34] investigated the presence of food products on children’s YouTube channels and uncovered a notable preponderance of non-essential and nutritionally unfavorable food products. Tzafilkou et al. [35] explored the connection between online consumer behavior and purchase intent within the context of social media, focusing on facially expressed emotions during the viewing of food product video campaigns. Their results underscored the effectiveness of Neural Networks and Random Forest in predicting purchase intent based on these emotions, with sadness and surprise emerging as significant contributors to the prediction.
Research on plant-based products is relatively limited. For instance, Shamoi et al. [36] examined public sentiment towards vegan (plant-based) products, revealing a growing acceptance and popularity associated with increasingly positive sentiments and emotions, although some feelings of fear still persist. Furthermore, Thao [37] conducted an investigation into consumer attitudes towards vegetarian food across five dimensions: price, packaging, delivery, brand, and quality. The results unveiled that approximately 20.8% of customer opinions were positive, while only 0.7% were negative. The majority, accounting for 78.5%, expressed neutral sentiments across all five aspects, with quality garnering the highest number of positive comments. In contrast, Dalayya et al. [38] explored public perceptions and preferences concerning plant-based diets for cancer prevention and management. Bhuiyan et al. [39] proposed an attention-based approach for sentiment analysis of food review datasets, which included both CNN and LSTM models. They concluded that CNN-based attention model achieved an impressive accuracy of 98.45%. Conversely, Gunawan et al. [40] embraced a ML approach, specifically to capture sentiment in food reviews. They found sentiment analysis to be particularly effective for examining food business reviews, and ML algorithms, especially Support Vector Machines (SVMs), were deemed successful for training sentiment classifiers.
In the context of sentiment analysis within the food industry, Panagiotou and Gkatzionis [41] developed a food-related emotion lexicon, utilizing emotion-related word lists and surveys to directly assess people’s food-related emotions. Additionally, Liapakis [42] proposed a sentiment lexicon-based analysis for the Food and Beverage industry in the Greek language.
3. Materials and Methods
In this section of the study, we clarify our research design. The initial segment provides a comprehensive account of the processes undertaken for the sentiment analysis task, while the subsequent part delineates the methodology employed in analysing user’s engagement on the YouTube platform.
3.1. Data Collection for Sentiment Analysis
The first step of the research is to collect the data, which will serve as the foundation for subsequent steps. To comprehensively address the research questions, two distinct types of data must be acquired: YouTube video metrics and YouTube video comments. To build a comprehensive dataset, videos related to plant-based and hedonic food products were manually compiled based on specific criteria outlined in Table 1 and Table 2. In September 2023, 83 videos were finalized for analysis—24 focused on hedonic products and 59 on plant-based products. The decision to include more videos for plant-based products was driven by two key factors on the YouTube platform: a) many videos for plant-based products have fewer than 100 comments, disqualifying them from our selection, and b) even if some videos exceed 100 comments, they still do not accumulate as many comments as hedonic food videos. As a result, we chose to collect more videos about plant-based products to create a rich dataset, even though it is still smaller than the dataset for hedonic food products.
The video compilation is completed by manually recording key information for each video, such as views, comments, likes, and engagement rate. These metrics form the basis for evaluating engagement levels. From the chosen videos, only top-level comments were exported, totaling 188,011 comments. Each comment in the dataset includes essential details like the author’s name, comment, posting time, likes, and replies. Ultimately, two CSVs were generated, one for each food category.
3.2. Data Cleaning
To derive meaningful insights from textual data, a systematic data cleaning approach was adopted. This involved processes such as lowercasing, lemmatization, converting emojis to word representations, and removing noise like URLs, HTML tags, usernames, stop words, duplicates, and non-alphabetic characters. The result is a refined dataset with 93,411 comments for the hedonic dataset and 17,873 for the plant-based dataset.
3.3. Data Labelling
The next step involves categorizing comments into sentiment classes ("Positive," "Negative," or "Neutral"). Two tools, TextBlob and VADER, were evaluated. VADER, available as the Python package vaderSentiment, is widely used for its comprehensive approach, considering various elements like uppercase vs lowercase letters, emojis, punctuation, smileys, and slangs [43]. TextBlob provides polarity scores within the range of -1 to 1, indicating sentiment. A score of -1 implies a wholly negative sentiment, 0 signifies a neutral sentiment, and 1 represents a positive sentiment [44]. VADER’s superior accuracy led to its selection for sentiment analysis. A custom function was implemented to automate sentiment labeling based on the polarity score: "Positive" for positive scores, "Negative" for negative scores, and "Neutral" for scores close to zero.
3.4. Data Tokenization
After the data labelling, we performed tokenization. The NLTK (Natural Language Toolkit) library was employed to tokenize user comments related to food products. The NLTK tokenizer breaks down sentences into a sequence of words, removing punctuation and special characters. This process results in a structured representation of each comment, where words are isolated and can be individually analyzed.
3.5. Data Splitting
To prepare the datasets for ML model training and evaluation, a crucial step involved its division into two distinct sets: a training set and a testing set. The implementation leveraged the train test split function from the scikit learn library. This function facilitated the random shuffling of the dataset and the allocation of 80% of the data to the training set, with the remaining 20% constituting the testing set. The same process was executed for both food categories.
3.6. Feature Extraction Using TF-IDF
In this research phase, TF-IDF vectorization was employed to convert tokenized comments into a numerical format suitable for sentiment analysis. TF-IDF assesses word importance within a specific text category, with TF indicating significance in a document, and IDF characterizing its ability to differentiate in text classification [45]. Vital for sentiment analysis and ML, TF-IDF features capture semantic importance, aiding in sentiment pattern identification. The TfidfVectorizer from the scikit-learn library executed the TF-IDF vectorization process, converting tokenized comments into numerical representations based on TF-IDF values, encapsulating term importance relative to the entire dataset.
3.7. Model Training and Testing
The success of sentiment prediction relies on the careful selection of models, each with unique characteristics adaptable to diverse datasets. Our selected machine learning algorithms—Support Vector Machines (SVM), Random Forest, Naive Bayes, Logistic Regression, and XGBoost—were chosen for their widespread use in sentiment analysis on unorganized social media data [46,47,48,49,50]. For all models, a meticulous hyperparameter fine-tuning process was undertaken to maximize predictive performance. Utilizing Grid Search, we systematically explored hyperparameter combinations by specifying ranges for each. This approach ensured robustness and mitigated overfitting risks through 5-fold cross-validation. The training dataset was divided into five folds, with the model iteratively trained on four while testing on the remaining one. After completing Grid Search and cross-validation, optimal hyperparameters leading to the best predictive performance were selected for subsequent model training.
3.8. Evaluation of the Models
In the evaluation phase, sentiment analysis classifiers underwent a comprehensive assessment using key macro average metrics: accuracy, precision, recall, and F1 score. Selected for their broad applicability across diverse contexts [49,51,52], these metrics ensure a robust evaluation framework transcending specific domains. Accuracy provides an overall assessment of correct classifications, precision focuses on the accuracy of positive predictions, recall measures the ability to capture all positive instances, and the F1 score offers a balanced assessment, considering both precision and recall. Table 3 provides a quick breakdown of terms for easy understanding, while in Table 4 are demonstrated the formulas for each metric.
3.9. Engagement Metrics and User Interaction
In our research, we investigated user engagement levels in YouTube videos related to food, specifically focusing on metrics such as views, likes, comments, and engagement rate. We employed also the Mann-Whitney Test to explore potential differences between two datasets. Additionally, descriptive statistics were used to gain insights into central tendencies and variability.
3.9.1. Mann-Whitney Test
In our research, we sought to uncover potential disparities in user engagement with content across two distinct datasets, considering comments, likes, views, and engagement rate. Due to the diverse nature of these metrics and varying sample sizes [54], we opted for the Mann-Whitney U test as our statistical method. According to Kasuya [55] this non-parametric test is widely utilized in behavioral studies, offering a suitable approach to explore potential variations in the distribution of engagement metrics. For each engagement metric, we formulated clear null and alternative hypotheses:
- H0: There is no significant difference in the distributions of engagement metrics between the two datasets.
- H1: There is no significant difference in the distributions of engagement metrics between the two datasets.
To assess the statistical significance, we set an alpha of 0.05. The non-parametric test was independently applied to each engagement metric, producing U statistics and corresponding p-values in our analysis. The decision to reject or retain the null hypothesis depended on the comparison of these p-values to our chosen significance level.
3.9.2. Descriptive Statistics
To comprehensively analyze user engagement metrics, we employed various descriptive statistical measures within the dataset. For each engagement metric, the following descriptive statistics were computed:
- Mean: Represents the average value, providing a central point around which data clusters.
- Median: Calculated as the middle value when data is sorted, offering a robust measure of central tendency, especially in the presence of outliers.
Measures of Dispersion:
- Standard Deviation (Std): Quantifies variation or dispersion in the dataset, revealing insights into the spread of values around the mean [58].
- Variance (Var): Indicates how spread out values are, complementing standard deviation in assessing overall variability [59].
- Range: Calculated as the difference between maximum and minimum values, providing a straightforward measure of the overall dataset spread [60].
3.9.3. Statistical Analysis and Data Visualization
To enhance our dataset understanding, we conducted correlation and temporal analyses. Correlation analysis assessed relationships between comment length and two engagement metrics, ’Comment Likes’ and ’Reply Count,’ using the Pearson correlation coefficient. Temporal patterns were investigated by extracting components such as year, day of the week, and hour of the day. Comment activity trends over distinct years were examined, quantifying and visualizing patterns to understand how engagement evolved across time periods. This combination of statistical calculations and visualizations offers a comprehensive insight into the dataset’s dynamics.
4. Results
In this section, we present the empirical findings of our study. Our primary aim is to present the research outcomes, with each result directly linked to the core objectives of our study. First, we delve into the performance and comparison of the ML algorithms and then we move on engagement metrics task.
4.1. Comparison of Sentiment Analysis Tools: TextBlob and VADER
In the realm of sentiment analysis, accurate data labeling is crucial. This study thoroughly compares two widely used libraries, TextBlob and VADER, to identify the most suitable sentiment analysis tool [61,62,63]. VADER, known for its expertise in social media sentiment analysis [64], evaluates individual words and sentences, providing sentiment scores within the context of social media [65]. It articulates expressed sentiments, as discussed Hutto and Gilbert [66]. TextBlob, widely used in sentiment analysis tasks [67,68], is also selected. The labeling process categorizes data into positive, negative, and neutral classes, consistently applied to both datasets. Sentiment labels for each tool are illustrated in Table 5 and Table 6.
After labelling the comments, we compared the tools. Results are depicted in Figure 1 and Figure 2, shedding light on the performance of each tool in sentiment classification.
In both datasets, TextBlob and VADER provided similar results. Positive comments predominated, with negative ones being a minority. However, a notable difference emerged in the number of comments labeled as neutral. TextBlob assigned more comments as neutral than VADER, especially in the hedonic dataset, where neutral comments closely rivaled positive ones. The matching label percentage between TextBlob and VADER in the plant-based dataset is 72.48%, and in the hedonic dataset, it is 71.05%.
To determine the tool more aligned with human understanding, we manually compared a sample of 300 differently labeled comments in each dataset. Table 7 and Table 8 showcase parts of our datasets, highlighting in bold instances where the tools seemed closer to human understanding.
When it comes to comments that were differently classified by the two tools, VADER seems to be closer to human understanding. So, VADER is the sentiment analysis tool that we considered most appropriate for our study. According to VADER in the plant-based dataset, 58.9% of the comments were labelled positive, 32.6% neutral, and 8.5% as negative, while in the hedonic dataset, 52.5% of the comments were labelled positive, 34.6% neutral, and 12.9% as negative.
4.2. Performance and Comparison of the ML Algorithms
In this section, we discuss procedures applied to both plant-based and hedonic datasets. Choosing between micro, macro, and weighted averages as a performance metric is a common challenge in ML. Our study compared all three for model analysis. Figure 3 illustrates the performance of these metrics for the Random Forest Model. Macro and weighted average values present a similar picture, but with a slight divergence. Macro-average values are slightly lower, suggesting potential class imbalance. The weighted average, accounting for class distribution, tends to be slightly higher. If we take the weighted average, the F1 score is a good score. However, it doesn’t classify negative comments with great confidence, which is why we believe the macro-average with 0.81 would be a better measure. Similar results were obtained from other models.
So, in our datasets, we decided to calculate the evaluation metrics using the macro-average to assign equal significance to each class and to handle the dataset imbalance. According to Hamid et al.[69], a slightly imbalanced dataset is defined as having a distribution like 60:40, 55:45, or 70:30 (majority: minority). Furthermore, Opitz [70] notes a growing adoption of ’macro’ metrics in recent years, and Guo et al. [71] highlight an increasing trend in utilizing macro-average indicators for sentiment analysis evaluation.
4.2.1. Performance and Comparison of the ML Algorithms in Plant-Based Dataset
First, let’s examine the performance metrics for the plant-based dataset. In Table 9, we present the performance values obtained from all five ML algorithms.
In our study, we evaluated the performance with respect to accuracy and F1 score. A higher accuracy indicates a better model performance. Our analysis revealed that the Support Vector Machine and Logistic Regression models achieved the highest accuracy among the considered models, both scoring an accuracy of 0.93. Additionally, the F1 score, which combines precision and recall, provides a balanced evaluation of a model’s performance. A higher F1 score implies a better trade-off between precision and recall. F1 remains a popular metric among researchers, and in multiclass cases, the F1 micro/macro averaging procedure offers flexibility, enabling customization for ad-hoc optimization to meet specific goals in diverse contexts [72]. When considering the F1 score, the Support Vector Machine model outperformed the other models with a score of 0.89. This indicates that the Support Vector Machine model was able to maintain a good balance between precision and recall in its predictions. Overall, our results suggest that the Support Vector Machine model excels in both accuracy and F1 score, making it a suitable choice for sentiment analysis in the context of YouTube comments on plant-based products.
4.2.2. Performance and Comparison of the ML Algorithms in Hedonic Dataset
Just like we did for the previous dataset, Table 10 demonstrates the performance metrics for all five ML algorithms for the hedonic dataset.
Our evaluation has unveiled that the Support Vector Machine and Logistic Regression models stand out as top performers, both achieving an impressive accuracy of 96%. Additionally, when considering the F1 score, both the Support Vector Machine and Logistic Regression models have proven to be highly effective with an F1 score of 94%. This score indicates that they maintain a strong equilibrium between precision and recall in their predictions. To determine which one of the two performed better in our dataset, we used their confusion matrices (Figure 4 and Figure 5), to compare the true positive and true negative values of each model at Table 11 and Table 12.
The performance of the two models is quite similar, with subtle differences. If we were to choose one model, the Support Vector Machine emerges as the preferable choice due to its slightly higher combined count of True Positive and True Negative values, indicating a marginally stronger overall performance.
4.3. Engagement Metrics
The Mann-Whitney U tests show significant differences in user engagement metrics, rejecting the null hypothesis (Figure 6). Notably, Views, Comments, Likes, and Engagement Rate exhibit consistent disparities, indicating non-random variations. These findings enhance quantitative insights into user behavior, emphasizing the importance of exploring underlying factors. In Table 7, descriptive statistics are calculated for each dataset for a deeper understanding.
The hedonic dataset boasts a mean view count of 10 million, indicating broad reach and potential virality, with views ranging from 1.68 million to 68.75 million. Active audience participation is shown through a mean of 6579 comments and a substantial like count of 170,862, reflecting a positive response. The engagement rate suggests moderate interaction, ranging from 0.70% to 4.06%. In contrast, the plant-based dataset has a lower mean view count of 432,891, indicating less diverse viewership. Although comments are fewer, with a mean of 510, the likes count is positive, ranging from 1.109 to 113,000, indicating varying popularity. The engagement rate is notable at 3.90%, showcasing a more actively engaged audience compared to the hedonic dataset, with a range from 1.31% to 9.08%. After examining both datasets, we calculate the overall engagement rate by considering total views, comments, and likes. The engagement rate, computed using the formula in Figure 7, is shown in Table 13. It’s essential to consider dataset sizes—59 videos for plant-based and 24 for hedonic—before interpreting engagement metrics.

Table 13.
Descriptive Statistics
| Plant Based: | Views | Comments | Likes | Engagement Rate |
|---|---|---|---|---|
| mean | 510.12 | 3.90 | ||
| median | 307.00 | 3.42 | ||
| std | 510.50 | 1.64 | ||
| min | 104.00 | 1.31 | ||
| max | 2174.00 | 9.08 | ||
| var | 260611.14 | 2.69 | ||
| calculate_range | 2070.00 | 7.77 | ||
| Hedonic: | Views | Comments | Likes | Engagement Rate |
| mean | 6579.75 | 2.29 | ||
| median | 5544.00 | 2.10 | ||
| std | 4978.95 | 0.77 | ||
| min | 1798.00 | 0.70 | ||
| max | 25168.00 | 4.06 | ||
| var | 24789956.63 | 0.59 | ||
| calculate_range | 23370.00 | 3.36 |
The plant-based dataset achieved 25.5 million views, 30,097 comments, and 812,411 likes, resulting in a commendable 3.30% engagement rate. In contrast, the hedonic dataset garnered 241.4 million views, 157,914 comments, and 4.1 million likes, with a relatively lower 1.77% engagement rate. Despite higher absolute engagement in hedonic videos, the plant-based dataset maintained a superior rate, suggesting a more consistent and impactful connection per video. Considering the varying video counts, the hedonic dataset achieved impressive views but across a smaller set of 24 videos. In contrast, the plant-based dataset, with 59 videos, achieved a noteworthy 3.30% engagement rate despite 25.5 million views. This emphasizes that plant-based content not only attracted attention but also fostered a more engaged audience per video. Beyond quantitative metrics, we analyze the effect of comment length, referring to the number of characters in each comment, on viewer engagement. In both datasets (Figure 8), the correlation coefficients between comment length and comment likes, as well as reply count, are low, suggesting a weak linear connection. In the plant-based dataset, the correlation coefficients are 0.03 for comment likes and 0.10 for reply count. In the hedonic dataset, these coefficients are even smaller, at 0.02 and 0.06, respectively.
Table 14.
Overall Engagement Rate of the two datasets.
| Dataset | Views | Comments | Likes | Engagement Rate |
|---|---|---|---|---|
| Plant-Based | 25.540.596 | 30.097 | 812.411 | 3.30% |
| Hedonic | 241.400.820 | 157.914 | 4.100.700 | 1.77% |
Moving from comment length correlations, we shift to another engagement measure—the total comments over the years. Examining trends in both datasets, Table 15 offers insights into user interaction dynamics. The plant-based dataset showed an upward trend from 2018 to 2021, followed by a decline in 2022 and 2023. Similarly, the hedonic dataset peaked in 2020, followed by a decline in subsequent years.
Table 15.
Total number of comments.
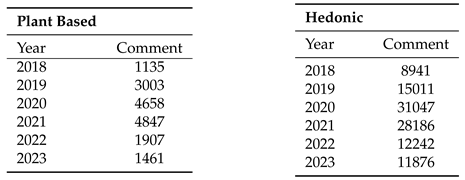
Lastly, beyond numerical counts, we delve into user activity patterns within each dataset (Figure 9). In the plant-based dataset, activity rises in late morning and peaks between 14:00 and 18:00, with consistently higher activity on Sundays. In contrast, the hedonic dataset sees a peak in activity during the afternoon and evening, especially on Sundays.
5. Discussion
The comparison between TextBlob and VADER for sentiment analysis revealed that both tools yielded similar results in terms of positive and negative sentiment classifications across both plant-based and hedonic datasets. However, notable differences were observed in the classification of neutral comments, where TextBlob tended to label more comments as neutral compared to VADER. To determine the most appropriate tool, a manual comparison of differently labelled comments was conducted, aiming to align tool classifications with human understanding. VADER demonstrated closer alignment with human judgement, making it the preferred sentiment analysis tool for our study and that answers the first research objective. The sentiment distribution presented by VADER showcased a predominance of positive sentiments in both datasets, emphasizing a generally positive user sentiment towards food-related content on YouTube.
In the evaluation of ML algorithms, the F1 score and accuracy metrics were employed to assess their performance on both plant-based and hedonic datasets. For the plant-based dataset, the Support Vector Machine and Logistic Regression models exhibited the highest accuracy (93%) and Support Vector Machine exhibited also the highest F1 score (89%). In the hedonic dataset, similar top-performing models were observed, with the Support Vector Machine and Logistic Regression models achieving an impressive accuracy of 96% and an F1 score of 94%. The Support Vector Machine model emerged as a consistent top performer across both datasets, demonstrating robustness in maintaining a balance between precision and recall. In the hedonic dataset, although both Support Vector Machine and Logistic Regression models displayed comparable accuracy and F1 scores, the Support Vector Machine’s slightly higher combined count of True Positive and True Negative values positioned it as the preferred choice for sentiment analysis, answering the second research question.
The Mann-Whitney U test confirms significant differences in user engagement metrics between the plant-based and hedonic datasets, suggesting distinct user behavior patterns. Descriptive statistics reveal the hedonic dataset’s broad reach and active audience, while the plant-based dataset maintains a more engaged audience. Calculating overall engagement rates reinforces this distinction, emphasizing plant-based content’s consistent impact. Analysis of comment length indicates a limited influence on engagement metrics. Temporal trends showcase fluctuations over the years, offering insights for content creators, and user activity patterns reveal peak engagement times. Understanding these dynamics is crucial for tailoring content strategies to optimize user engagement in the competitive landscape of YouTube food videos.
5.1. Comparative Analysis of Proposed Study with Previous Studies
Our observation of a predominance of positive sentiments aligns with Shamoi et al.’s [36] examination of public sentiment towards plant-based products, emphasizing a generally positive reception of plant-based food. In contrast, Dalayya et al. [37] explored public perceptions of plant-based diets for cancer prevention and management. Their research revealed that the public’s preference for plant-based diets wasn’t as strong as previously believed.
Our choice of the Support Vector Machine (SVM) as the primary sentiment analysis model aligns with established practices in sentiment analysis. This is consistent with the findings of Gunawan et al. [40] who have discussed the effectiveness of ML algorithms, particularly SVMs, in capturing sentiments in various contexts, including food reviews.
5.2. Future Work and Limitations
The study encounters certain limitations that warrant acknowledgment. Firstly, even though we used VADER for data labelling, it didn’t always categorize comments the same way a human would. This might have influenced our results. Secondly, despite the application of high-performing classifiers, none attained absolute accuracy. For future research, enhancing prediction accuracy could involve exploring advanced classifiers like neural networks. Additionally, considering alternative feature extraction techniques may contribute to refining sentiment predictions. Thirdly, the dataset for plant-based products had a lower number of comments, which could affect our results. Having more comments might give us a clearer picture. Lastly, we focused on specific food products, specifically our datasets were structured from comments about milk, butter, yoghurt for the plant-based and pizza, burgers and cake for hedonic. Trying out different products in these categories or exploring other types of food could give us other results. These limitations show there’s room for improvement and more exploration in future studies.
5.3. Conclusions
The comparison between sentiment analysis tools revealed that VADER, with its closer alignment to human judgment, is preferable for analyzing user sentiments in YouTube food-related content. Additionally, the prevalence of positive sentiments across both datasets suggests a generally favorable user sentiment towards food-related content on the platform. The consistent performance of the Support Vector Machine (SVM) model highlights its effectiveness in sentiment analysis tasks, indicating its potential for broader application in content analysis. Moreover, the observed differences in user engagement metrics between plant-based and hedonic datasets imply distinct user behavior patterns, emphasizing the importance of tailored content strategies. These findings collectively underscore the significance of sentiment analysis and user engagement metrics in understanding and optimizing content performance on YouTube.
Author Contributions
Conceptualization: M.T. and K.T.; writing—original draft preparation: M.T.; writing—review and editing: C.T., K.T., and D.K.; project supervision: C.T. and D.K.; All authors have read and agreed to the published version of the manuscript.
Funding
This research received no external funding.
Institutional Review Board Statement
Not applicable.
Informed Consent Statement
Not applicable.
Data Availability Statement
Data available upon request.
Acknowledgments
The authors declare no potential conflicts of interest with respect to the research, authorship, and/or publication of this article. This manuscript is according to the guidelines and complies with the Ethical Standards.
References
- N. Luo, S. N. Luo, S. Wu, Y. Liu and Z. Feng, "Mapping social media engagement in the food supply chain," 23. [Online]. Available, 20 July. [CrossRef]
- T. Patra, A. T. Patra, A. Rinnan and K. Olsen, "The physical stability of plant-based drinks and the analysis methods thereof," 21. [Online]. Available, 2021 September. [CrossRef]
- C.S. Kopplin and T.M. Rausch, "Above and beyond meat: the role of consumers’ dietary behavior for the purchase of plant-based food substitutes," . [Online]. Available, 3 July 2021. [CrossRef]
- M.C. Onwezen, "The application of systematic steps for interventions towards meat-reduced diets,’ Trends in Food Science and Technology," 22. [Online]. Available, 2022 January. [CrossRef]
- J. Aschemann-Witzel, R. J. Aschemann-Witzel, R. Futtrup-Gantriisa, P. Fraga and F.J.A. Perez-Cueto, "Plant-based food and protein trend from a business perspective: markets, consumers, and the challenges and opportunities in the future," . [Online]. Available, 13 July 2020. [Google Scholar] [CrossRef]
- C. Martin, C. C. Martin, C. Langé and S. Marette, "Importance of additional information, as a complement to information coming from packaging, to promote meat substitutes: A case study on a sausage based on vegetable proteins," 21. [Online]. Available, 2021 January. [CrossRef]
- H. Kahleová, S. H. Kahleová, S. Levin and N.D. Barnard, "Cardio-Metabolic benefits of Plant-Based diets," .[Online]. Available, 9 August 2017. [Google Scholar] [CrossRef]
- C. Alae-Carew, R. C. Alae-Carew, R. Green, C. Stewart, B. Cook, A.D. Dangour and P.F.D. Scheelbeek, "The role of plant-based alternative foods in sustainable and healthy food systems: Consumption trends in the UK," . [Online]. Available, 10 February 2022. [Google Scholar] [CrossRef]
- J.B. Acquah, J.G.N. J.B. Acquah, J.G.N. Amissah, N.S. Affrifah, T.J. Wooster and A.O. Danquah, "Consumer perceptions of plant based beverages: The Ghanaian consumer’s perspective," 23. [Online]. Available, 2023 June. [CrossRef]
- Q.Yang, E. Q.Yang, E. Eikelboom, E. van der Linden, R. de Vries and P. Venema, "A mild hybrid liquid separation to obtain functional mungbean protein," . [Online]. Available, 15 January 2022. [Google Scholar] [CrossRef]
- A. Chmurzynska, M.A. A. Chmurzynska, M.A. Mlodzik-Czyzewska, A. Radziejewska and D.J. Wiebe, "Hedonic Hunger Is Associated with Intake of Certain High-Fat Food Types and BMI in 20- to 40-Year-Old Adults," 21. [Online]. 2021 April. [CrossRef]
- T. Otterbring, M. T. Otterbring, M. Folwarczny and K. Gidlöf, "Hunger effects on option quality for hedonic and utilitarian food products," 23. [Online]. Available, 2023 January. [CrossRef]
- K.L. Wakefield and J.J. Inman, "Situational price sensitivity: the role of consumption occasion, social context and income," 2003 [Online]. Available. [CrossRef]
- R. Dhar and K. Wertenbroch, "Consumer Choice between Hedonic and Utilitarian Goods," 00. [Online]. Available, 2000 February. [CrossRef]
- L. Cramer and G. Antonides, "Endowment effects for hedonic and utilitarian food products," 11. [Online]. Available, 2011 January. [CrossRef]
- N. Loebnitz and K.G. Grunert, "Impact of self-health awareness and perceived product benefits on purchase intentions for hedonic and utilitarian foods with nutrition claims," 18. [Online]. Available, 2018 March. [CrossRef]
- W.R. Fitriani, A.B. W.R. Fitriani, A.B. Mulyono, A.N. Hidayanto and Q. Munajat, "Reviewer’s communication style in YouTube product-review videos: does it affect channel loyalty?," . [Online]. Available, 14 September 2020. [Google Scholar] [CrossRef]
- B. Castillo-Abdul, L.M. B. Castillo-Abdul, L.M. Romero-Rodríguez and A. Larrea-Ayala, "Kid influencers in Spain: understanding the themes they address and preteens’ engagement with their YouTube channels," . [Online]. Available, 26 September 2020. [Google Scholar] [CrossRef]
- C. Oh, Y. C. Oh, Y. Roumani, J. K. Nwankpa and H.-F. Hu, "Beyond likes and tweets: Consumer engagement behavior and movie box office in social media," 17. [Online]. Available, 2017 January. [CrossRef]
- K.M. Kavitha, A. K.M. Kavitha, A. Shetty, B. Abreo, A. D’Souza and A. Kondana, "Analysis and Classification of User Comments on YouTube Videos," 2020. [Online]. Available. [CrossRef]
- K.H.A. Manap and N.A. Adzharudin, "The Role of User Generated Content (UGC) in Social Media for Tourism Sector," 2013. [Online]. Available: https://www.westeastinstitute.com/wp-content/uploads/2013/07/Khairul-Hilmi-A-Manap.pdf.
- A.Z. Bahtar and M. Muda, "The Impact of User – Generated Content (UGC) on Product Reviews towards Online Purchasing – A Conceptual Framework," 2016 [Online]. Available. [CrossRef]
- Ganganwar and, R. Rajalakshmi, "Implicit aspect extraction for sentiment Analysis: A survey of Recent approaches," 2019. [Online]. Available. [CrossRef]
- C.N. Dang, M.N.M. C.N. Dang, M.N.M. García and F. De La Prieta, "Sentiment analysis Based on Deep Learning: A comparative study," . [Online]. Available, 14 March 2020. [Google Scholar] [CrossRef]
- Q. Xu, V. Q. Xu, V.Chang and C. Jayne, "A systematic review of social media-based sentiment analysis: Emerging trends and challenges," [Online]. 22 Available, 2022 June. [CrossRef]
- M. Birjali, M. M. Birjali, M. Kasri and A. Beni-Hssane, "A comprehensive survey on sentiment analysis: Approaches, challenges and trends," . [Online]. Available, 17 August 2021. [Google Scholar] [CrossRef]
- Z. Drus and H. Khalid, "Sentiment Analysis in Social Media and its Application: Systematic Literature review," . 2019 [Online]. Available, 2014 February. [CrossRef]
- I. Chalkias, K. I. Chalkias, K. Tzafilkou, D. Karapiperis and C. Tjortjis, "Learning Analytics on YouTube Educational Videos: Exploring Sentiment Analysis Methods and Topic Clustering," 2023. [Online]. Available. [CrossRef]
- M.Rodríguez-Ibánez, A. M.Rodríguez-Ibánez, A. Casánez-Ventura, F. Castejón-Mateos and P.-M. Manuel Cuenca-Jiménez, "A review on sentiment analysis from social media platforms," . [Online]. Available: https://www.synopsys.com/glossary/what-is-dast.html. 1 August 2023. [Google Scholar]
- B. Rajeswari, S. B. Rajeswari, S. Madhavan, Ramakrishnan Venkatesakumar and S. Riasudeen, "Sentiment analysis of consumer reviews – a comparison of organic and regular food products usage," 2020. [Online]. Available. [CrossRef]
- X.V. Meza and T. Yamanaka, "Food Communication and its Related Sentiment in Local and Organic Food Videos on YouTube," 2020. [Online]. Available. [CrossRef]
- K.H. Lim, T.M. K.H. Lim, T.M. Lim, K.S.N. Neo Tan and L.P Tan, "Sentiment Analysis on Mixed Language Facebook Comments: A Food and Beverages Case Study," . [Online]. Available, 30 January 2023. [Google Scholar] [CrossRef]
- K. Tzafilkou,F.R. Panavou and A.A. Economides, "Facially Expressed Emotions and Hedonic Liking on Social Media Food Marketing Campaigns:Comparing Different Types of Products and Media Posts," 22. [Online]. Available, 20 November 2022. [CrossRef]
- E.M. Pastor, R. E.M. Pastor, R. Vizcaíno-Laorga and D. Atauri-Mezquida, "Health-related food advertising on kid YouTuber vlogger channels," . [Online]. Available, 19 October 2021. [Google Scholar] [CrossRef]
- K.Tzafilkou, A.A. K.Tzafilkou, A.A. Economides and F.R. Panavou, "You Look like You’ll Buy It! Purchase Intent Prediction Based on Facially Detected Emotions in Social Media Campaigns for Food Products," . [Online]. Available, 21 April 2023. [Google Scholar] [CrossRef]
- E. Shamoi, A. E. Shamoi, A. Turdybay, P.Shamoi, I. Akhmetov, A.Jaxylykova and A. Pak, "Sentiment analysis of vegan related tweets using mutual information for feature selection," . [Online]. Available, 5 December 2022. [Google Scholar] [CrossRef]
- T.T.H. Thao, "Exploring consumer opinions on vegetarian food by sentiment analysis method.," 2022. [Online]. Available: https://journalofscience.ou.edu.vn/index.php/econ-en/article/view/2256/1787.
- S.Dalayya, S.T.F. S.Dalayya, S.T.F.A Elsaid, K.H. Ng, T.L. Song and J.B.Y. Lim, "Sentiment Analysis to Understand the Perception and Requirements of a Plant-Based Food App for Cancer Patients," 2023. [Online]. Available. [CrossRef]
- Md.R.Bhuiyan, M.H. Md.R.Bhuiyan, M.H. Mahedi, N. Hossain, Z.N. Tumpa and S.A. Hossain, "An Attention Based Approach for Sentiment Analysis of Food Review Dataset," 2020. [Online]. Available. [CrossRef]
- L. Gunawan, M.S. L. Gunawan, M.S. Anggreainy, L. Wihan, Santy, G.Y.Lesmana and S.Yusuf, "Support vector machine based emotional analysis of restaurant reviews," 2023. [Online]. Available. [CrossRef]
- T.T.H. Thao, "Lexicon development to measure emotions evoked by foods: A review," 22. [Online]. Available, 2022 September. [CrossRef]
- A. Liapakis, "A Sentiment Lexicon-Based Analysis for Food and Beverage Industry reviews. The Greek Language Paradigm.," . [Online]. Available: https://journalofscience.ou.edu.vn/index.php/econ-en/article/view/2256/1787. 15 June 2020.
- E.Rosenberg, C. E.Rosenberg, C. Tarazona, F. Mallor, H. Eivazi, D. Pastor-Escuredo, F. Fuso-Nerini and R. Vinuesa, "Sentiment analysis on Twitter data towards climate action," . [Online]. Available, 9 January 2023. [Google Scholar] [CrossRef]
- M. Lokanan, "The tinder swindler: Analyzing public sentiments of romance fraud using machine learning and artificial intelligence," 23. [Online]. Available, 2023 December. [CrossRef]
- M. Liang and T. Niu, "Research on Text Classification Techniques Based on Improved TF-IDF Algorithm and LSTM Inputs," 2022. [Online]. Available. [CrossRef]
- H. Cam, A.V. H. Cam, A.V. Cam, U. Demirel and S. Ahmed, "Sentiment analysis of financial Twitter posts on Twitter with the machine learning classifiers," . [Online]. Available, 16 December 2023. [Google Scholar] [CrossRef]
- S. Ghosal and A. Jain, "Depression and Suicide Risk Detection on Social Media using fastText Embedding and XGBoost Classifier," 2023. [Online]. Available. [CrossRef]
- T.H.J. Hidayat, Y. T.H.J. Hidayat, Y. Ruldeviyani, A.R. Aditama, G.R. Madya, A.W. Nugraha and M.W. Adisaputra, "Sentiment analysis of twitter data related to Rinca Island development using Doc2Vec and SVM and logistic regression as classifier," 2022. [Online]. Available. [CrossRef]
- V.A. Fitri, R. V.A. Fitri, R. Andreswari and M.A. Hasibuan, "Sentiment Analysis of Social Media Twitter with Case of Anti-LGBT Campaign in Indonesia using Naïve Bayes, Decision Tree, and Random Forest Algorithm," 2019. [Online]. Available. [CrossRef]
- P. Anastasiou, K. P. Anastasiou, K. Tzafilkou, D. Karapiperis, C. Tjortjis, "YouTube Sentiment Analysis on Healthcare Product Campaigns: Combining Lexicons and Machine Learning Models," 2023.
- H.T. Halawani, A.M. H.T. Halawani, A.M. Mashraqi, S.K. Badr and S.Alkhalaf, "Automated sentiment analysis in social media using Harris Hawks optimisation and deep learning techniques," . [Online]. Available, 1 October 2023. [Google Scholar] [CrossRef]
- Md.S. Zulfiker, N. Md.S. Zulfiker, N.Kabir, Al.A. Biswas, S. Zulfiker and M.S Uddin, "Analyzing the public sentiment on COVID-19 vaccination in social media: Bangladesh context," 22. [Online]. Available, 2022 September. [CrossRef]
- M. Hossin and Md.N. Sulaiman, "A Review on Evaluation Metrics for Data Classification Evaluations," 15. [Online]. Available, 2015 March. [CrossRef]
- E. McClenaghan, "Mann-Whitney U Test: Assumptions and example," . [Online]. Available: https://www.technologynetworks.com/informatics/articles/mann-whitney-u-test-assumptions-and-example-363425. 6 July 2022.
- E. Kasuya, "Mann–Whitney U test when variances are unequal," 01. [Online]. Available, 2001 June. [CrossRef]
- M. Sethuraman, "Measures of central tendency: Median and mode," . [Online]. Available, 1 September 2011. [CrossRef]
- M. Sethuraman, "Measures of central tendency: The mean," . [Online]. Available, 1 June 2011. [CrossRef]
- Q.M. Roberson, M.C. Q.M. Roberson, M.C. Sturman and T.Simons, "Measures of central tendency: The mean," 07. [Online]. Available, 2007 October. [CrossRef]
- S. Gawali, "Dispersion of Data : Range, IQR, Variance, Standard Deviation," . [Online]. Available: https://www.analyticsvidhya.com/blog/2021/04/dispersion-of-data-range-iqr-variance-standard-deviation/. 29 April 2021.
- M. Sethuraman, "Measures of dispersion," . [Online]. Available, 1 December 2011. [CrossRef]
- M.Umer, S. M.Umer, S. Sadiq,H. Karamti, A.A.Eshmawi,M. Nappi, M.U. Sana and I. Ashraf, "ETCNN: Extra Tree and Convolutional Neural Network-based Ensemble Model for COVID-19 Tweets Sentiment Classification," 22. [Online]. Available, 2022 December. [CrossRef]
- O. Abiola, A. O. Abiola, A. Abayomi-Alli, O. Arogundade Tale, S. Misra and O.Abayomi-Alli, "Sentiment analysis of COVID-19 tweets from selected hashtags in Nigeria using VADER and Text Blob analyser," . [Online]. Available, 16 January 2023. [Google Scholar] [CrossRef]
- M. Mujahid, E. M. Mujahid, E. Lee, F. Rustam, P.B. Washington, S. Ullah, A.A. Reshi and I. Ashraf, "Sentiment Analysis and Topic Modeling on Tweets about Online Education during COVID-19," 21. [Online]. Available, 2021 September. [CrossRef]
- J. Garay, R. J. Garay, R. Yap and M.J.G. Sabellano, "An analysis on the insights of the anti-vaccine movement from social media posts using k-means clustering algorithm and VADER sentiment analyzer," 2019. [Online]. Available. [CrossRef]
- S. Elbagir and J. Yang, "Twitter Sentiment Analysis Using Natural Language Toolkit and VADER Sentiment," 2019. [Online]. Available: https://www.iaeng.org/publication/IMECS2019/IMECS2019_pp12-16.
- C.J. Hutto and E. Gilbert, "VADER: A Parsimonious Rule-Based Model for Sentiment Analysis of Social Media Text," . [Online]. Available, 16 May 2014. [CrossRef]
- W. Aljedaani, F. W. Aljedaani, F. Rustam, M.W. Mkaouer, A. Ghallab, V. Rupapara, P.B. Washington, E. Lee and I. Ashraf, "Sentiment analysis on Twitter data integrating TextBlob and deep learning models: The case of US airline industry," . [Online]. Available, 14 November 2022. [Google Scholar] [CrossRef]
- G.S.M. Diyasa, N.M.I.M. G.S.M. Diyasa, N.M.I.M. Mandenni, M.I. Fachrurrozi1, S.I. Pradika, K.R.N. Manab and N.R. Sasmita, "Twitter Sentiment Analysis as an Evaluation and Service Base On Python Textblob," 2021. [Online]. Available. [CrossRef]
- M.H.A. Hamid, M. M.H.A. Hamid, M. Yusoff and A. Mohamed, "Survey on highly imbalanced multi-class data," 2022. [Online]. Available. [CrossRef]
- J. Optiz, "From Bias and Prevalence to Macro F1, Kappa, and MCC: A structured overview of metrics for multi-class evaluation," 2022. [Online]. Available. [CrossRef]
- X. Guo, W. X. Guo, W. Yu and X.Wang, "An overview on fine-grained text Sentiment Analysis: Survey and challenges," 2022. [Online]. Available. [CrossRef]
- D. Chicco and G. Jurman(2020), "The advantages of the Matthews correlation coefficient (MCC) over F1 score and accuracy in binary classification evaluation," 2022. [Online]. Available. [CrossRef]
Figure 1.
Comparison of TextBlob and VADER on Plant-Based Dataset.
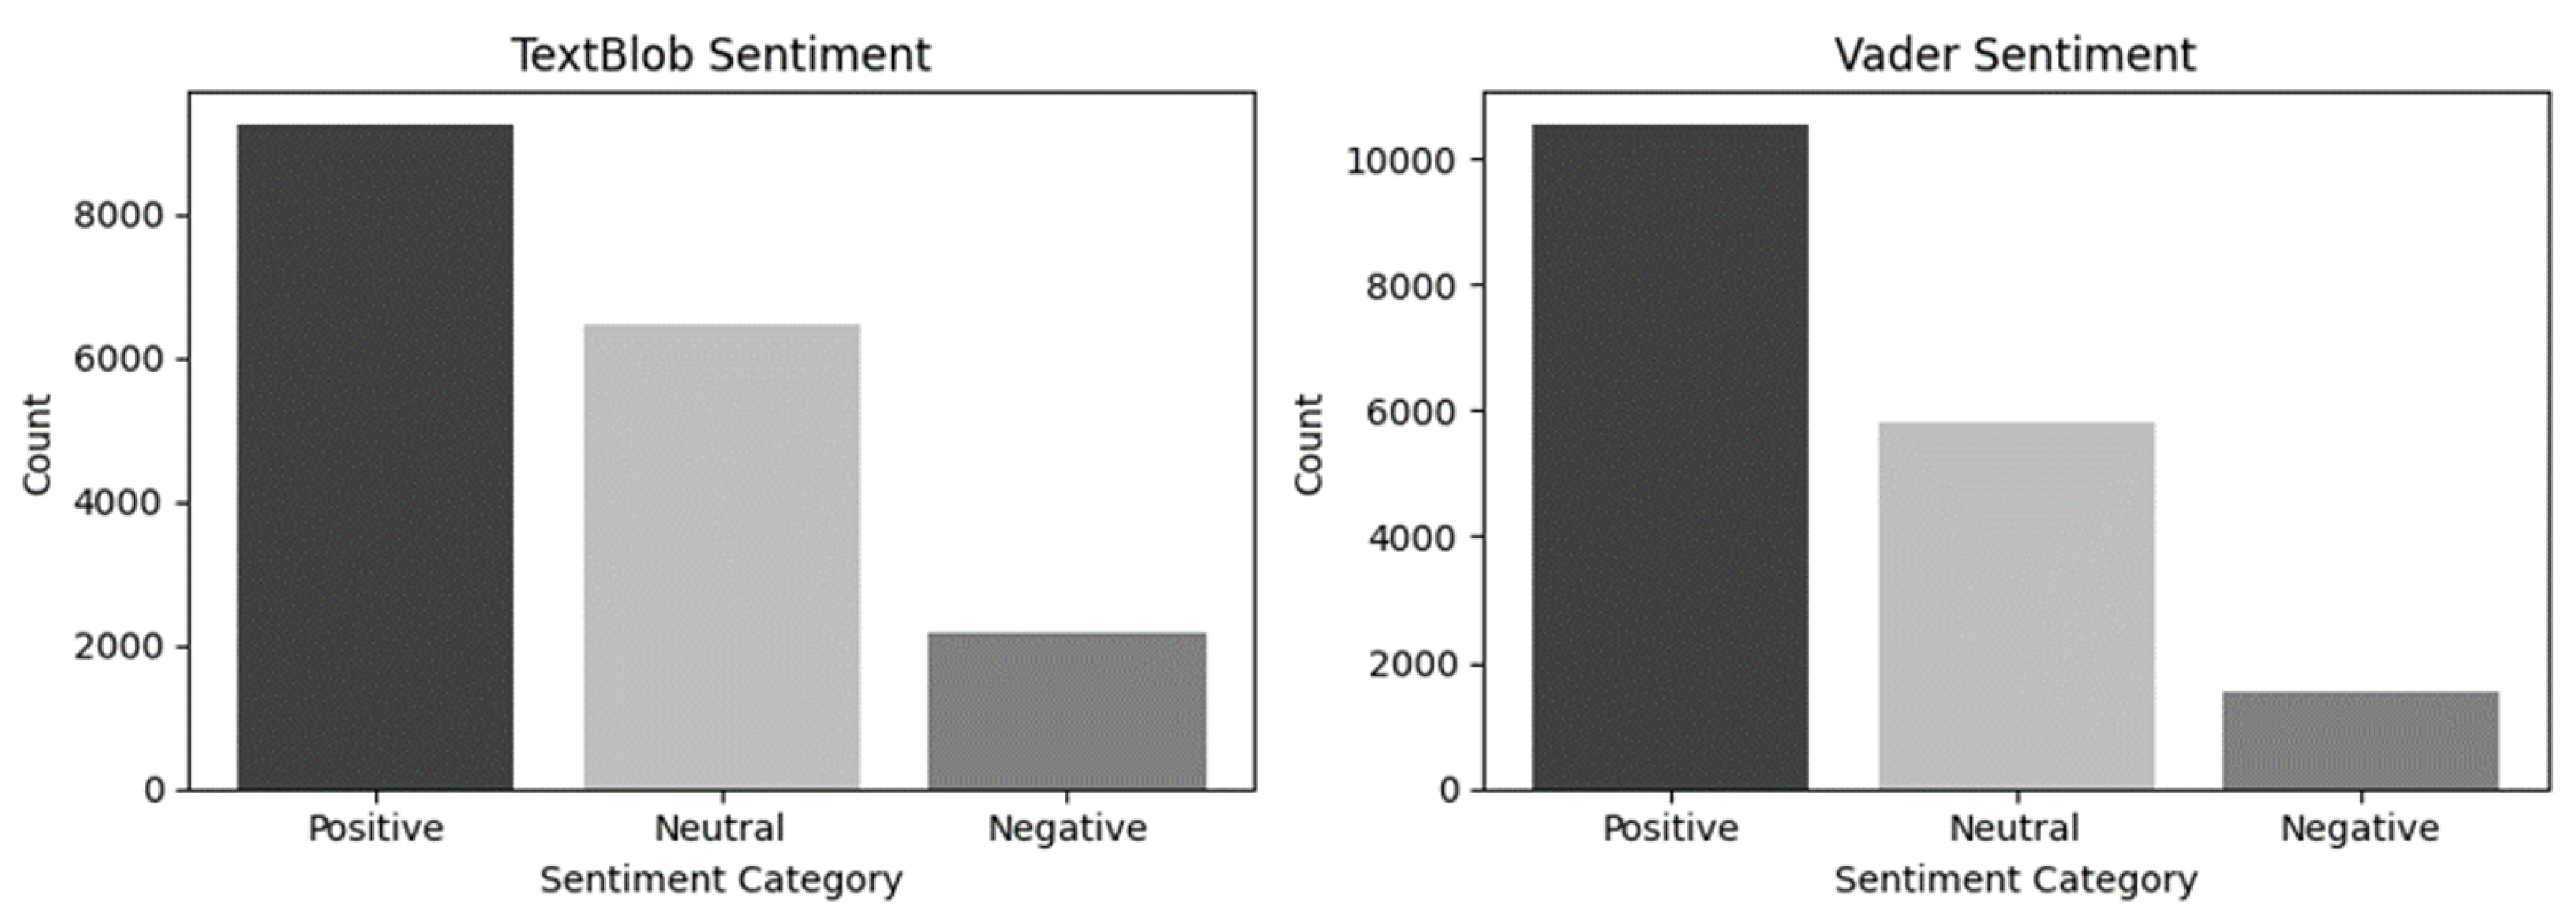
Figure 2.
Comparison of TextBlob and VADER on Hedonic Dataset.
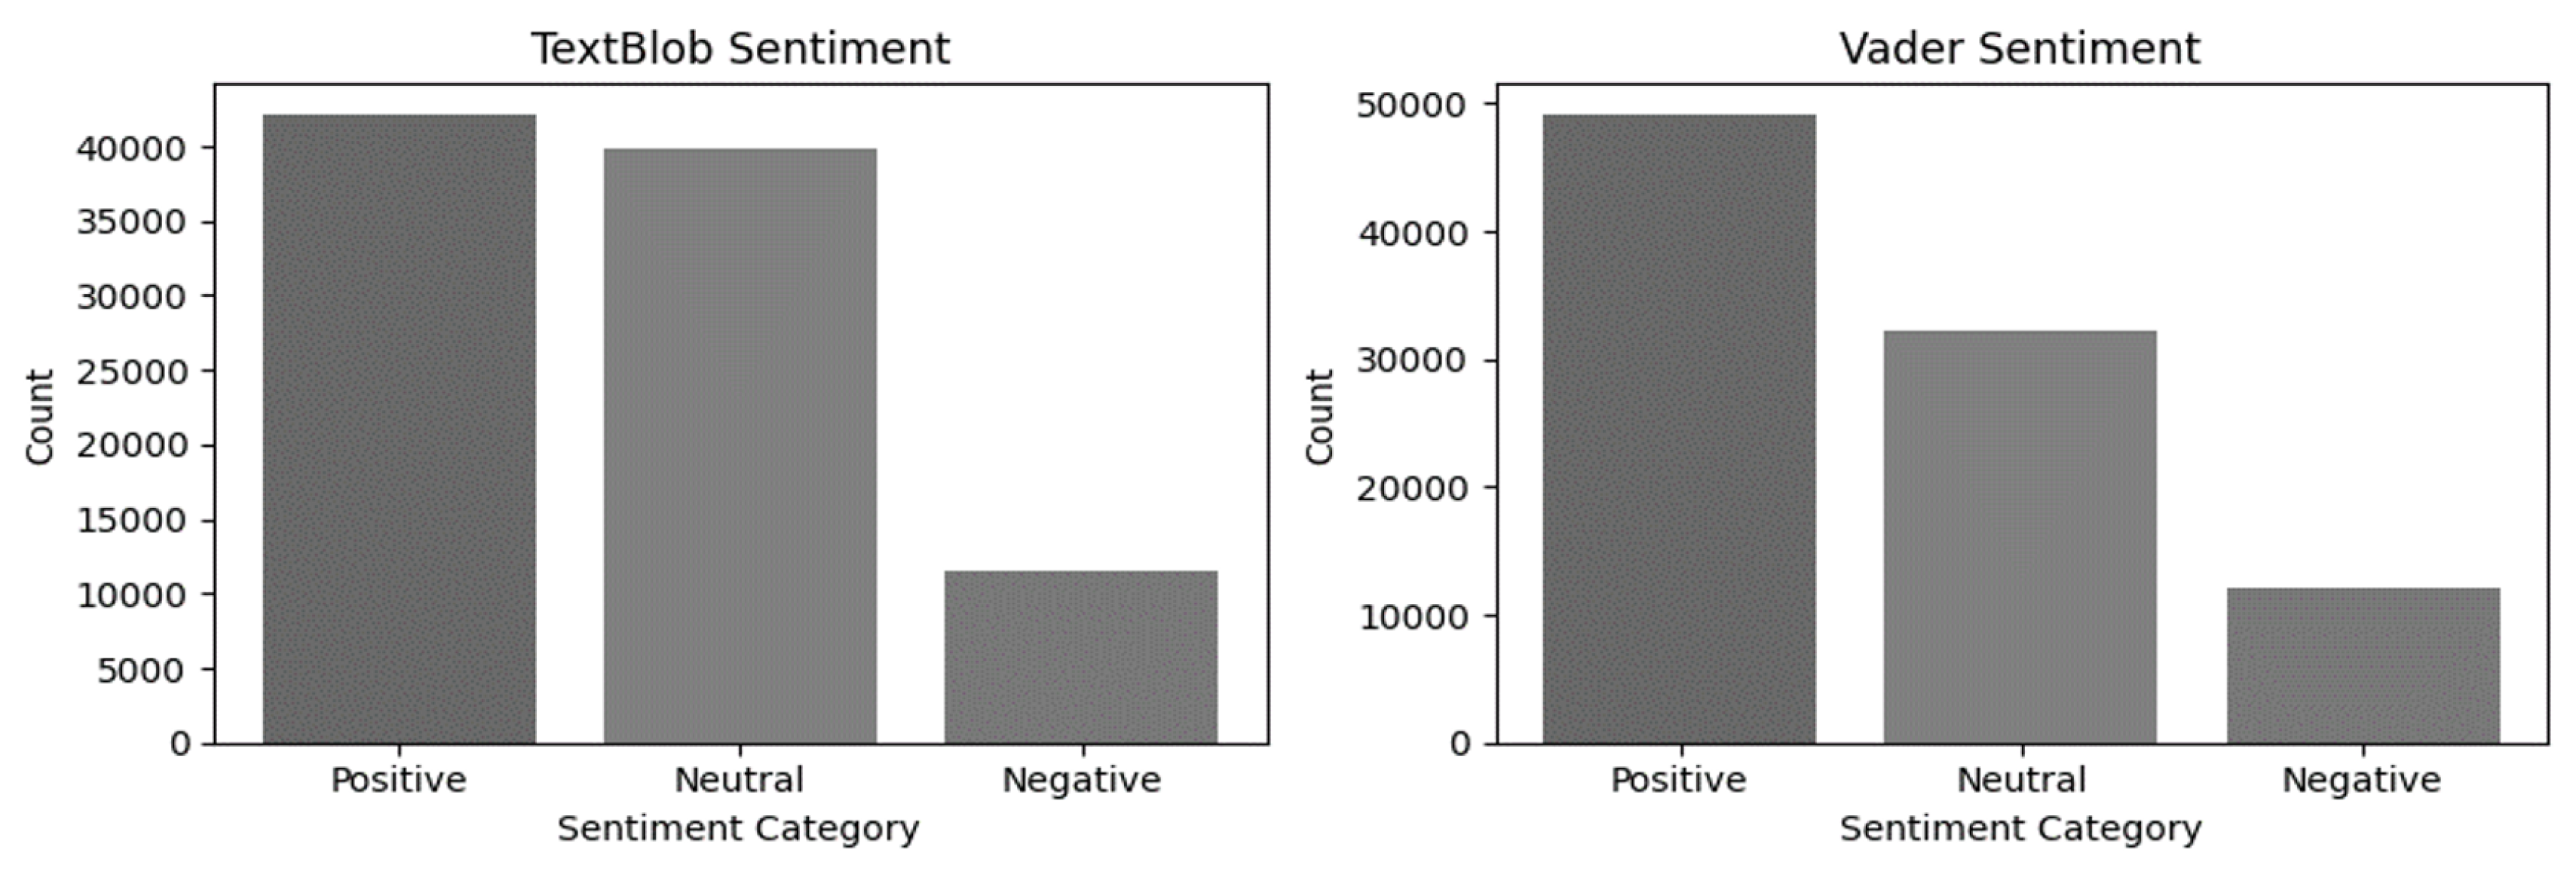
Figure 3.
Classification Report of Random Forest in Plant-Based Dataset.
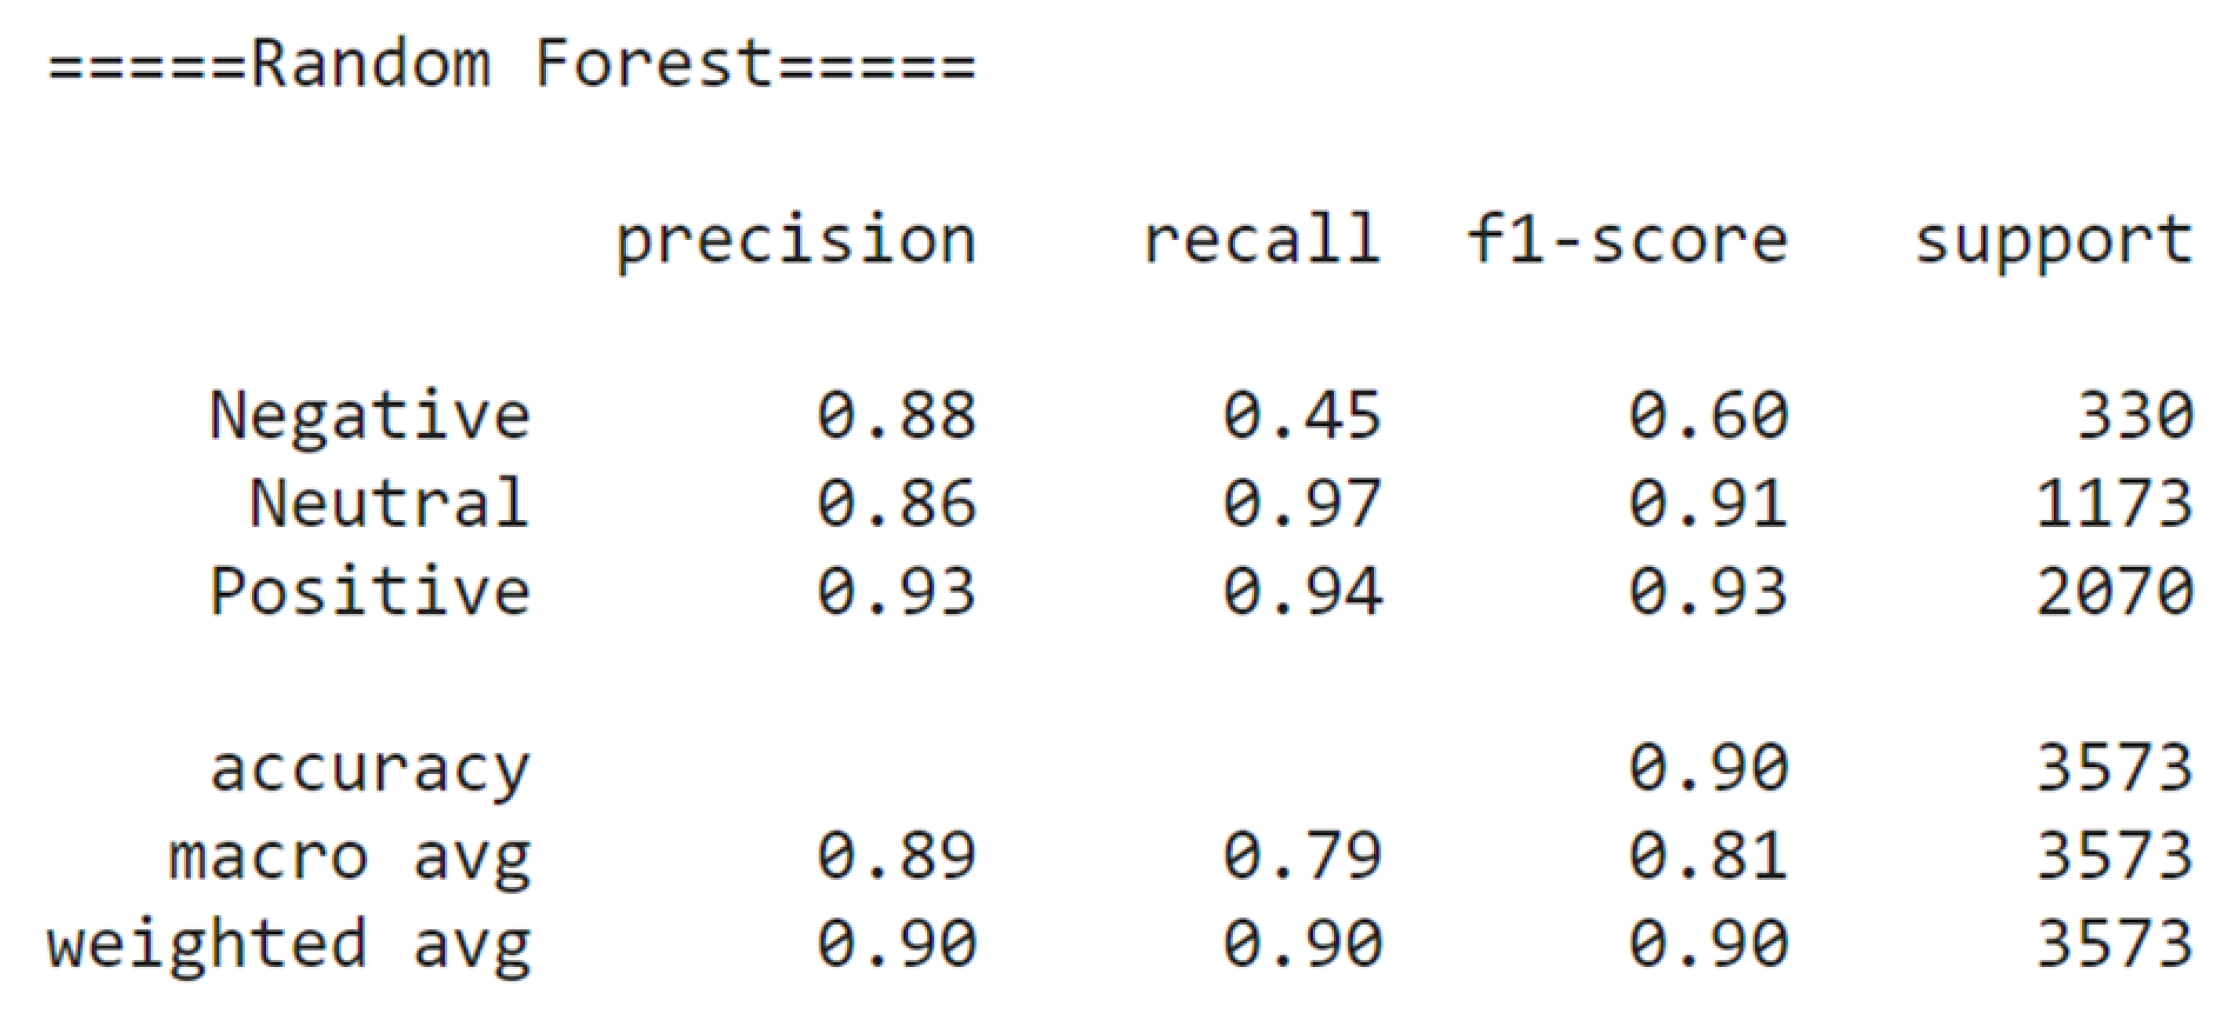
Figure 4.
Confusion Matrix of SVM.
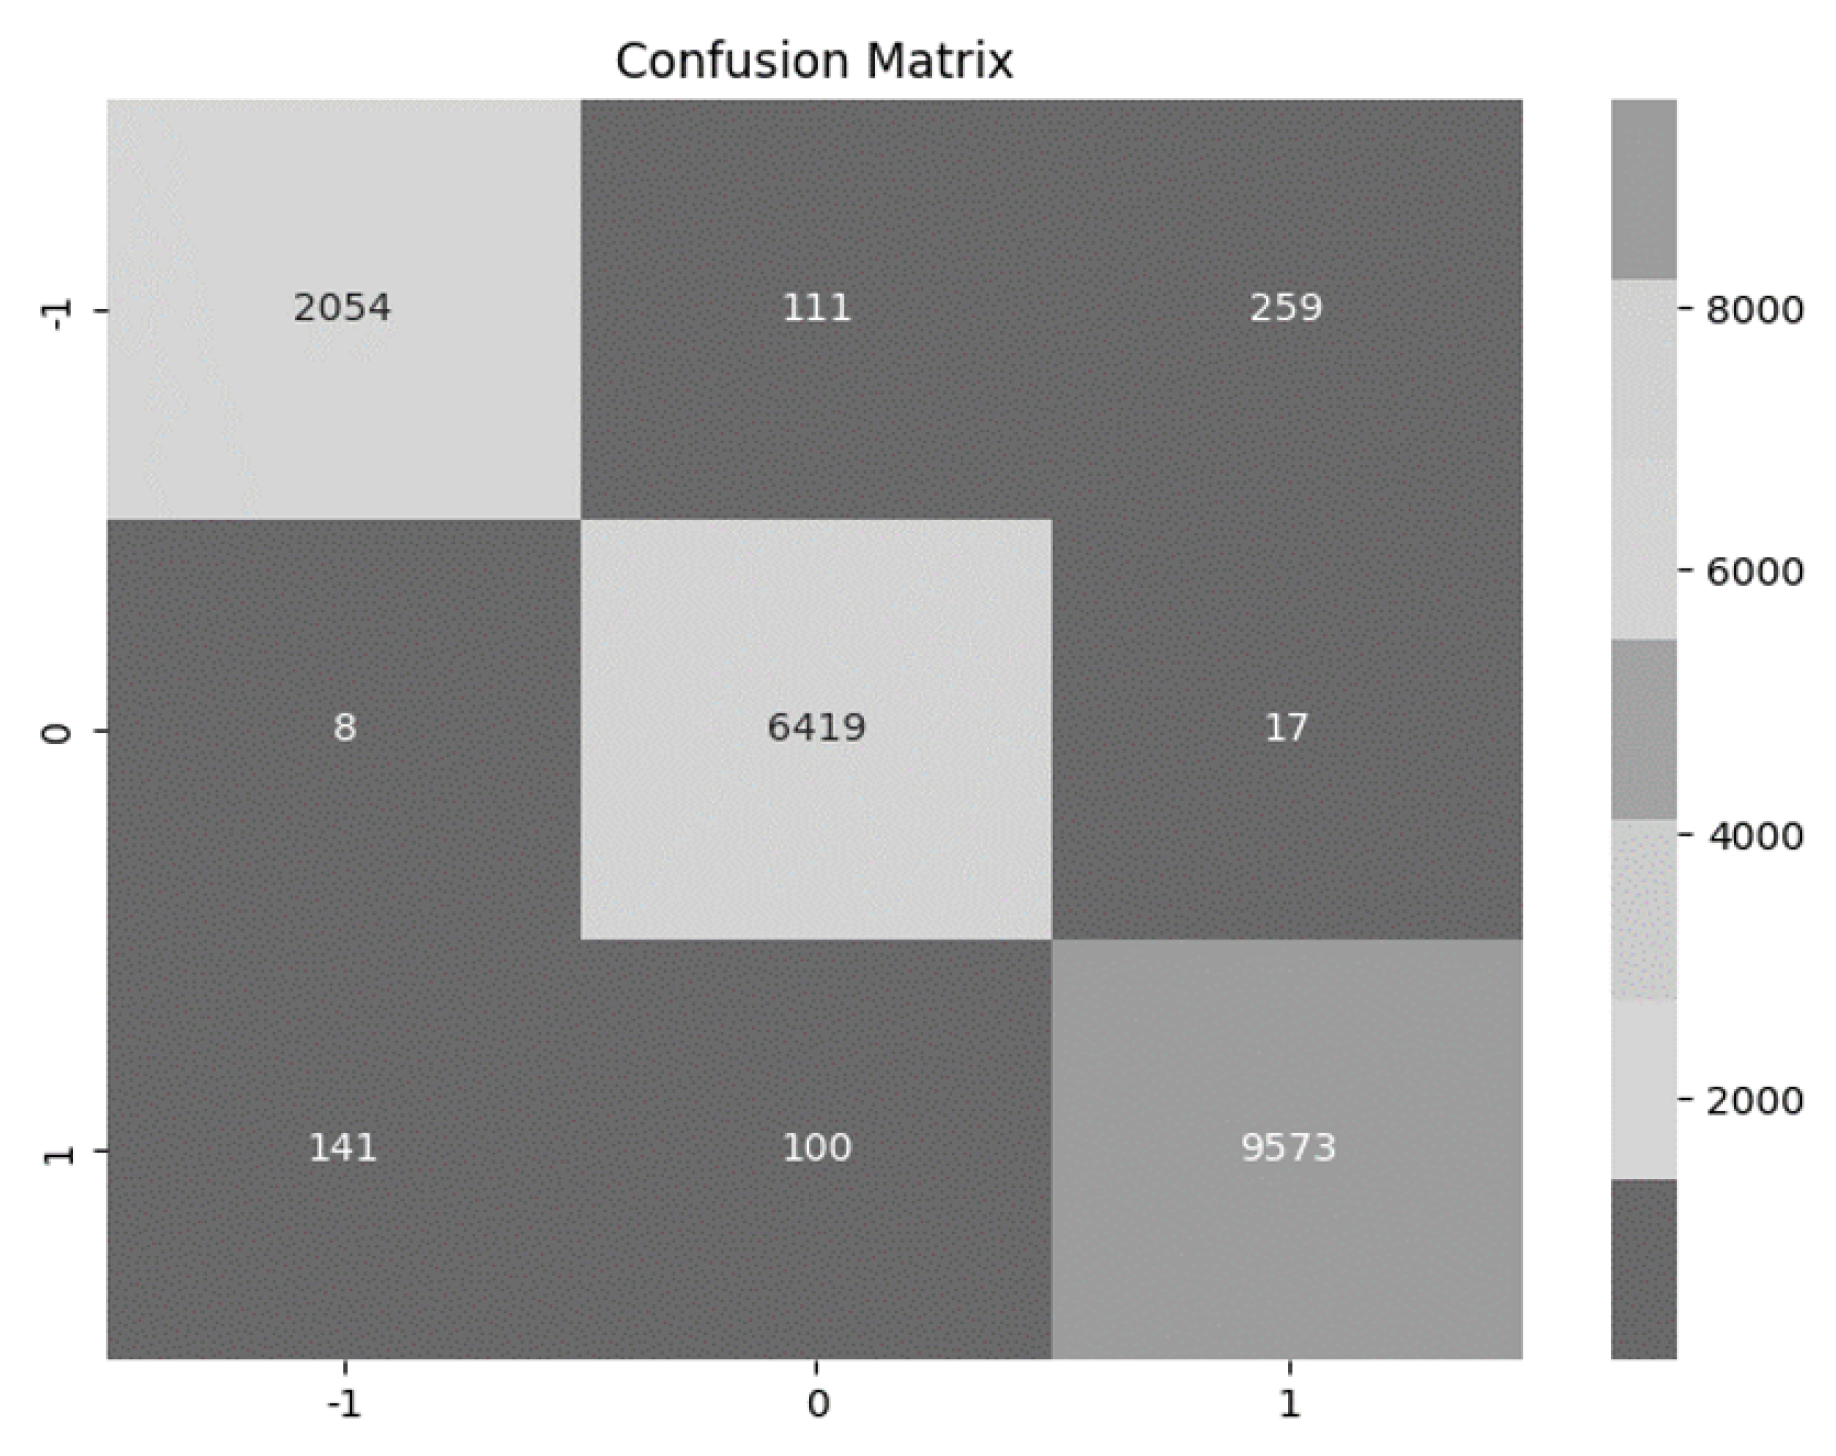
Figure 5.
Confusion Matrix of Logistic Regression.
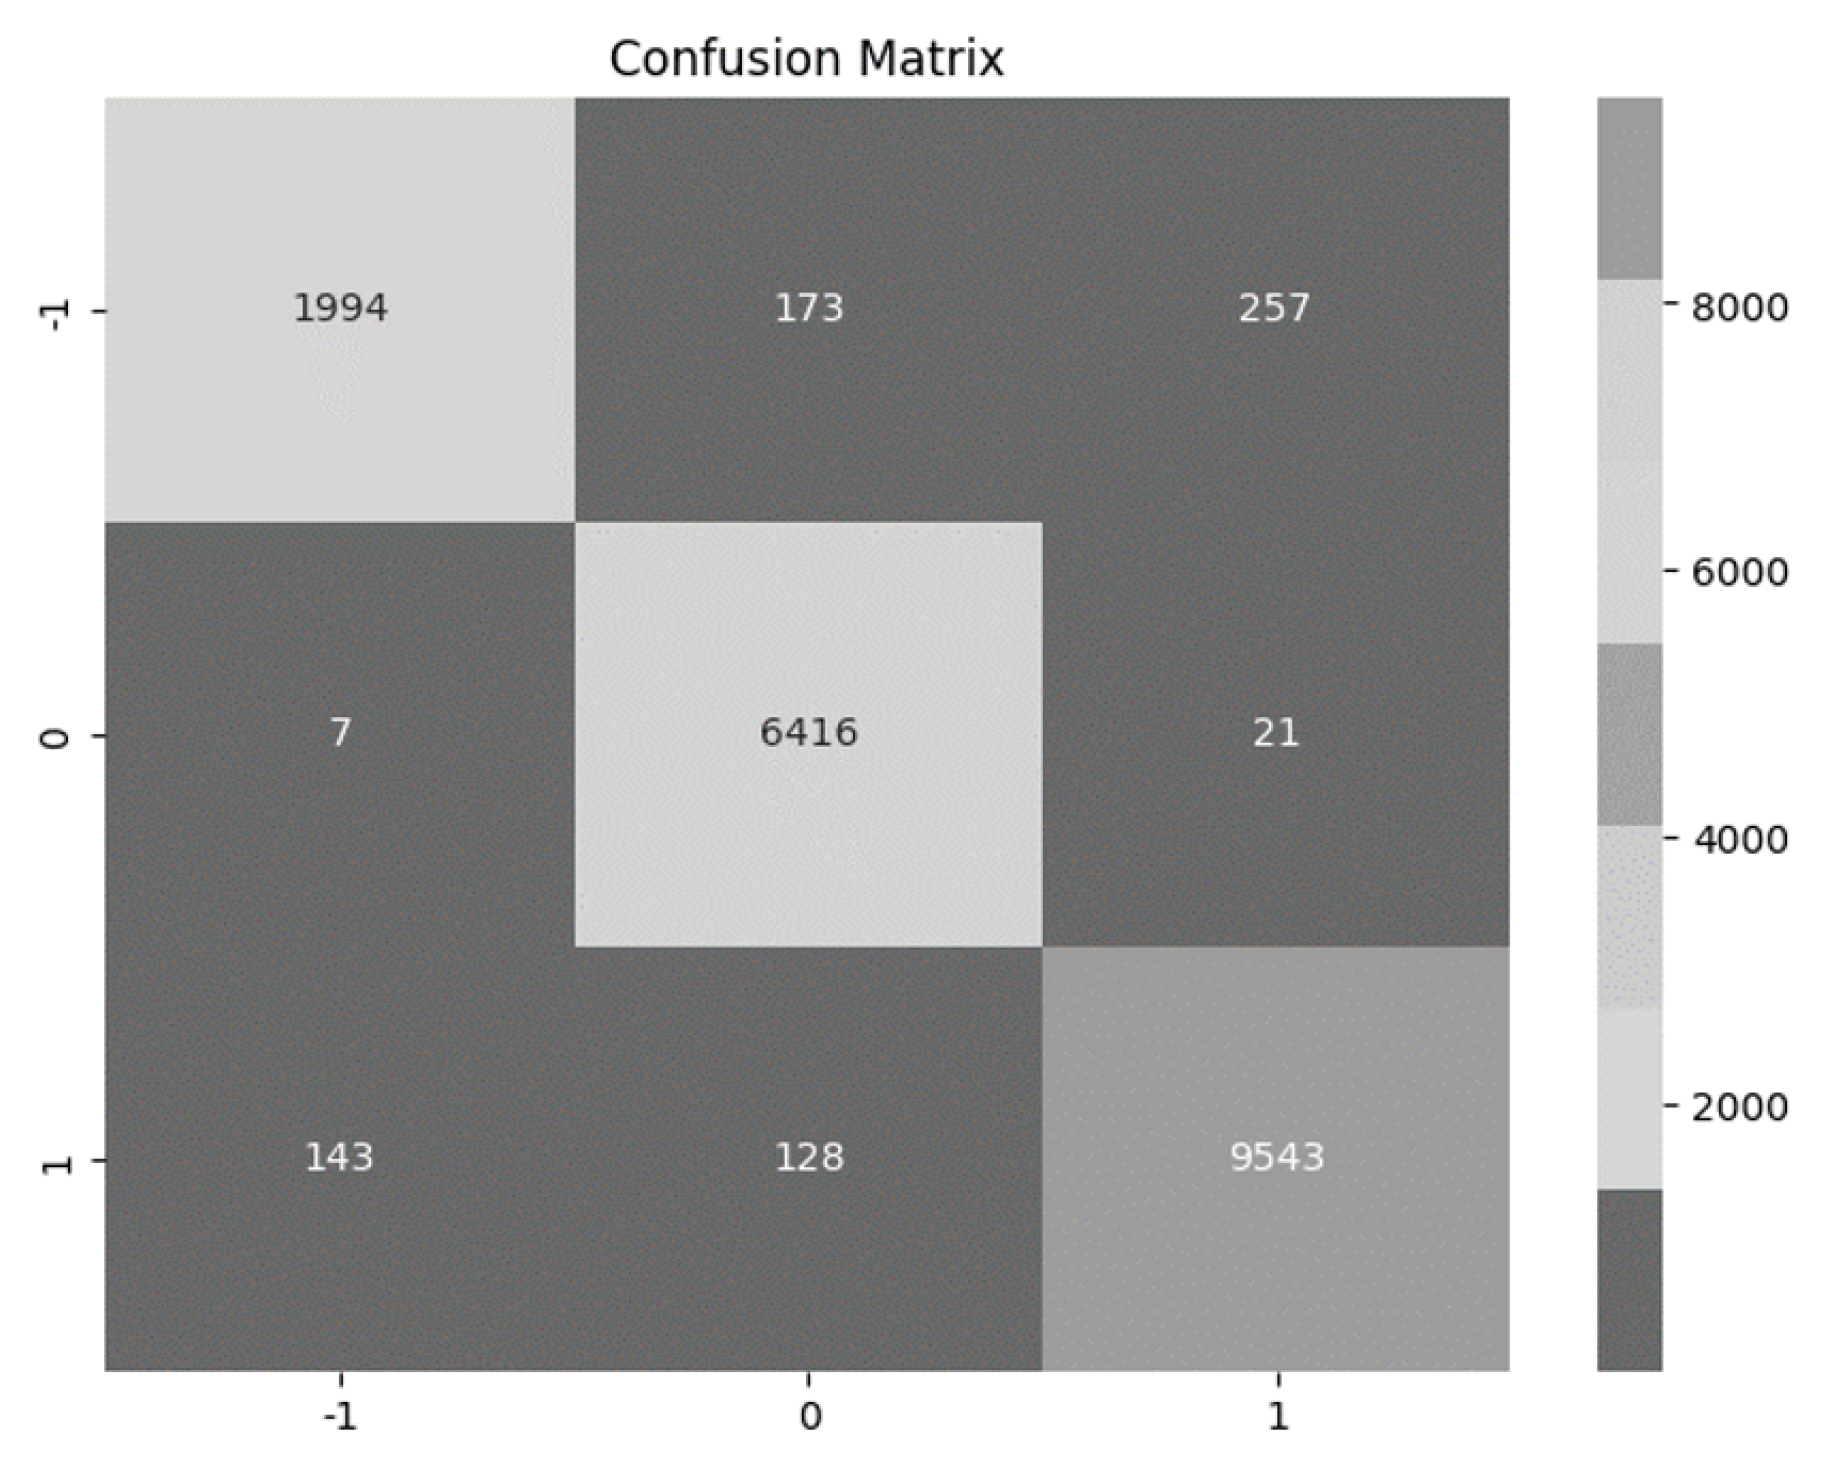
Figure 6.
Mann-Whitney U Results.
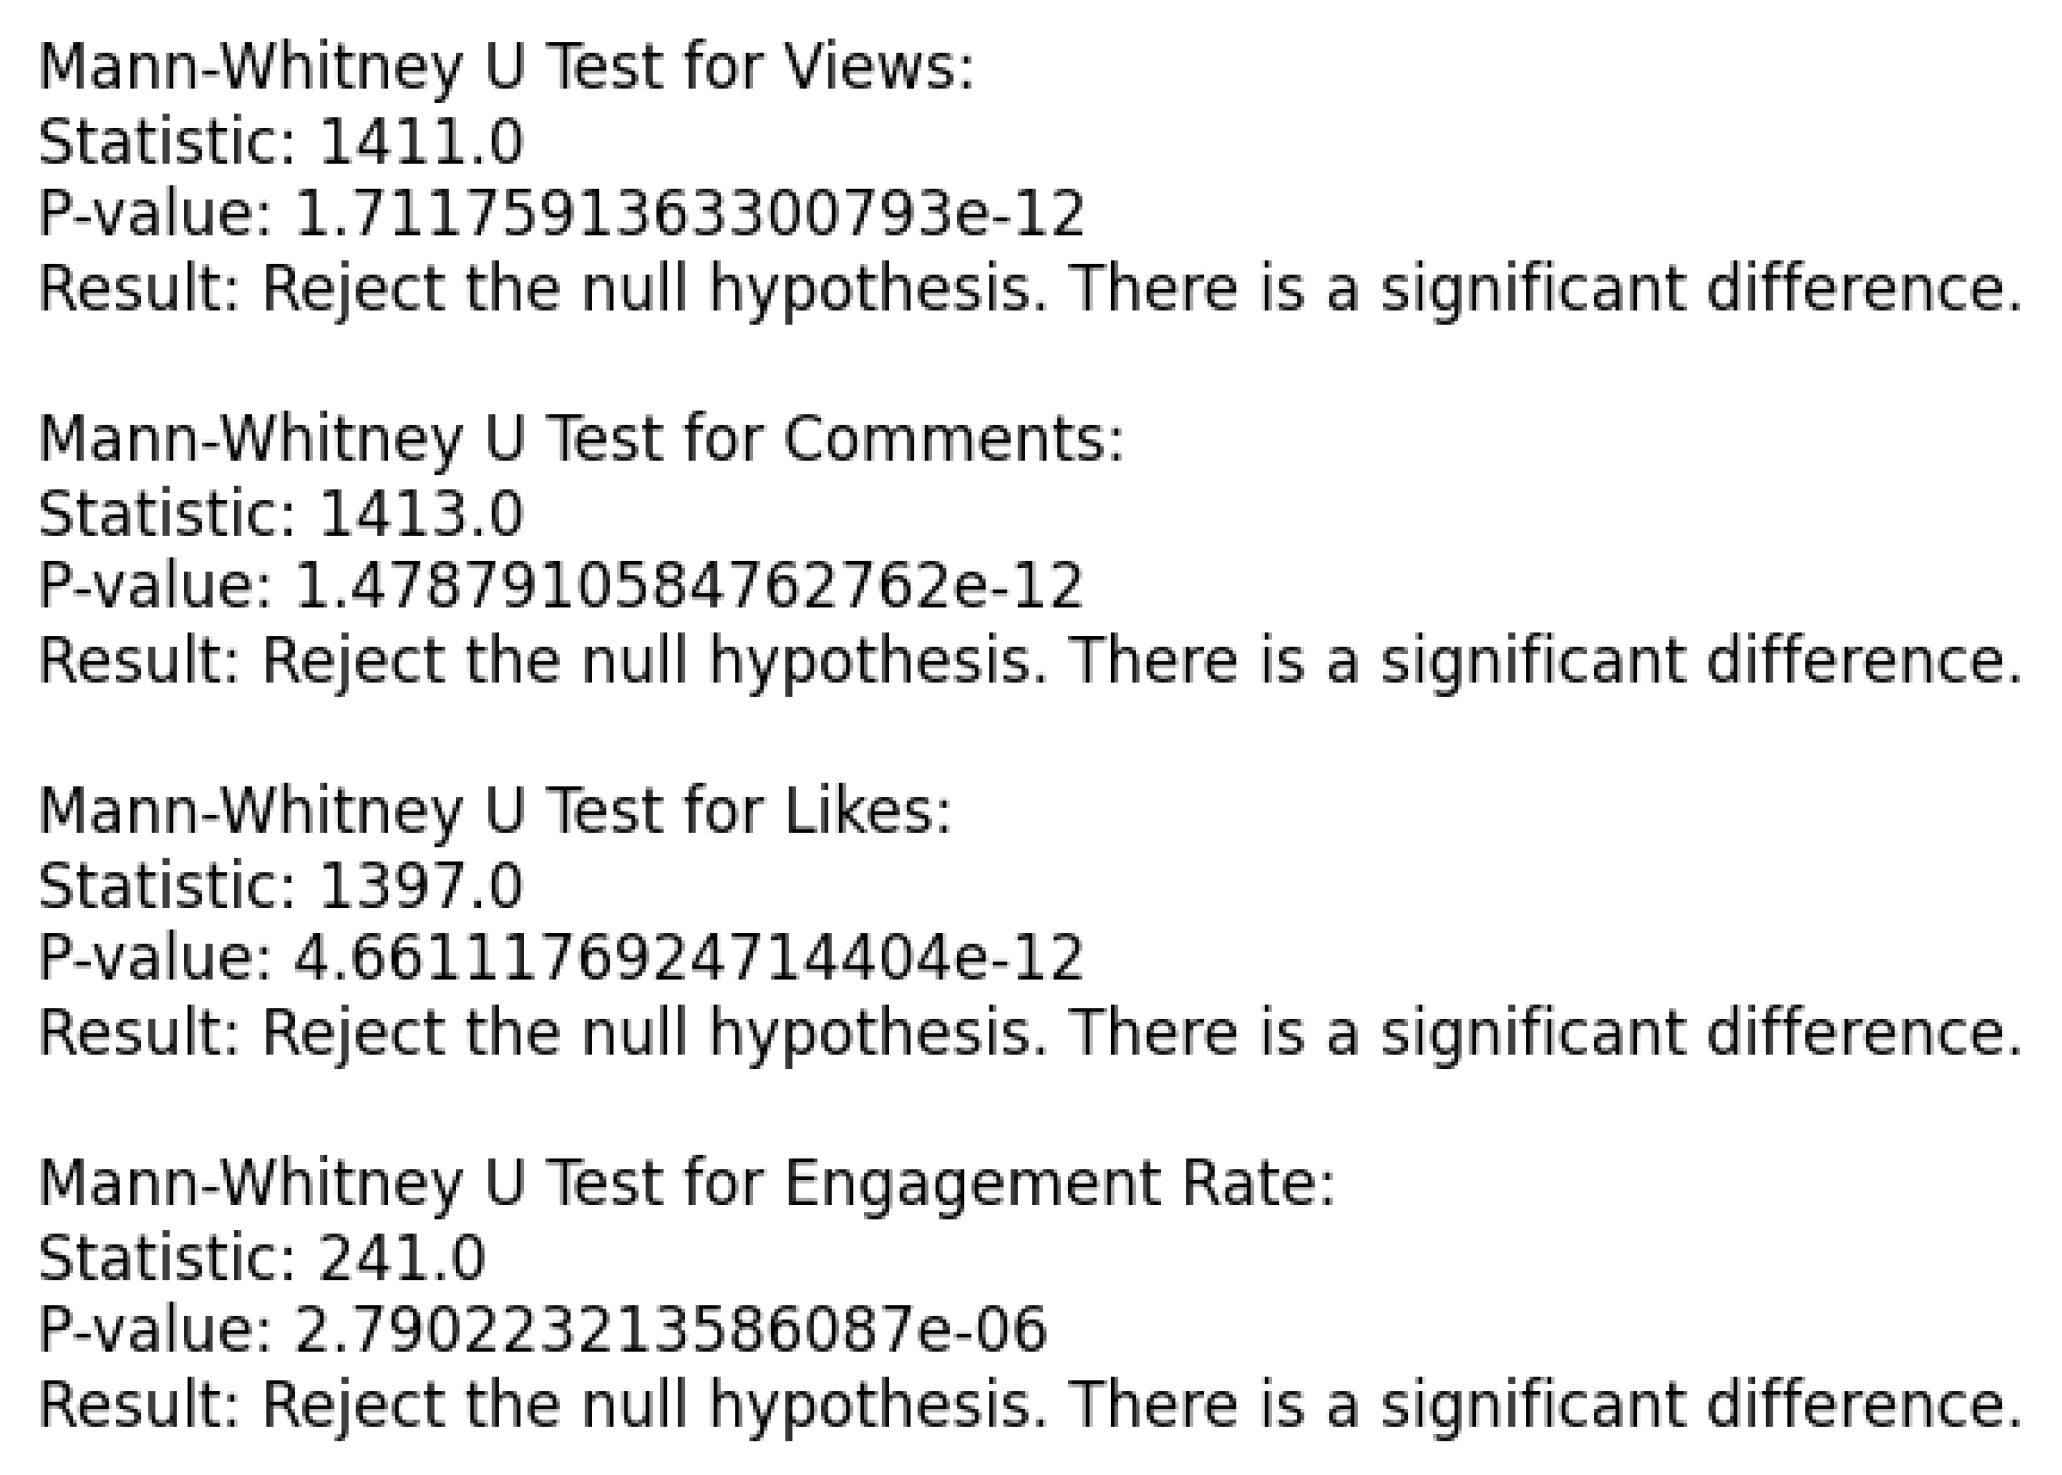
Figure 7.
Engagement Rate Formula.
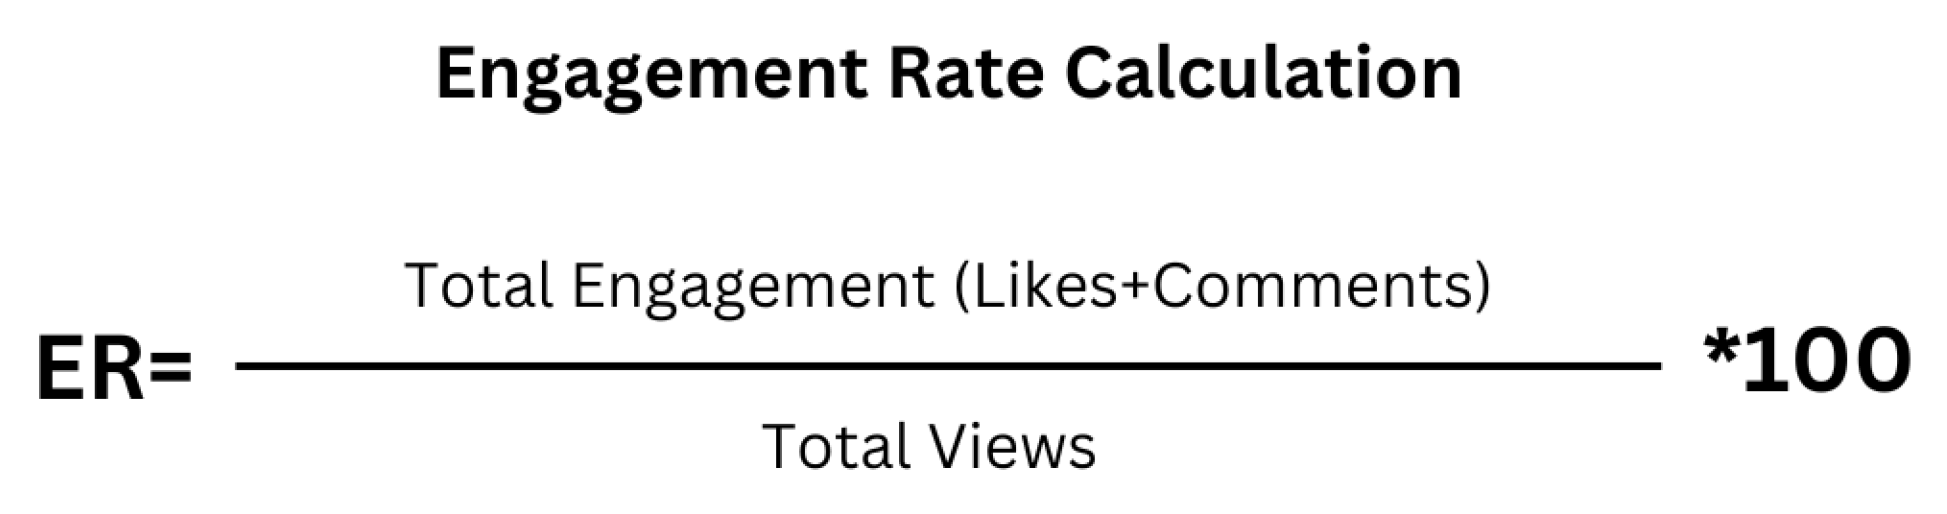
Figure 8.
Total Number of Comments.
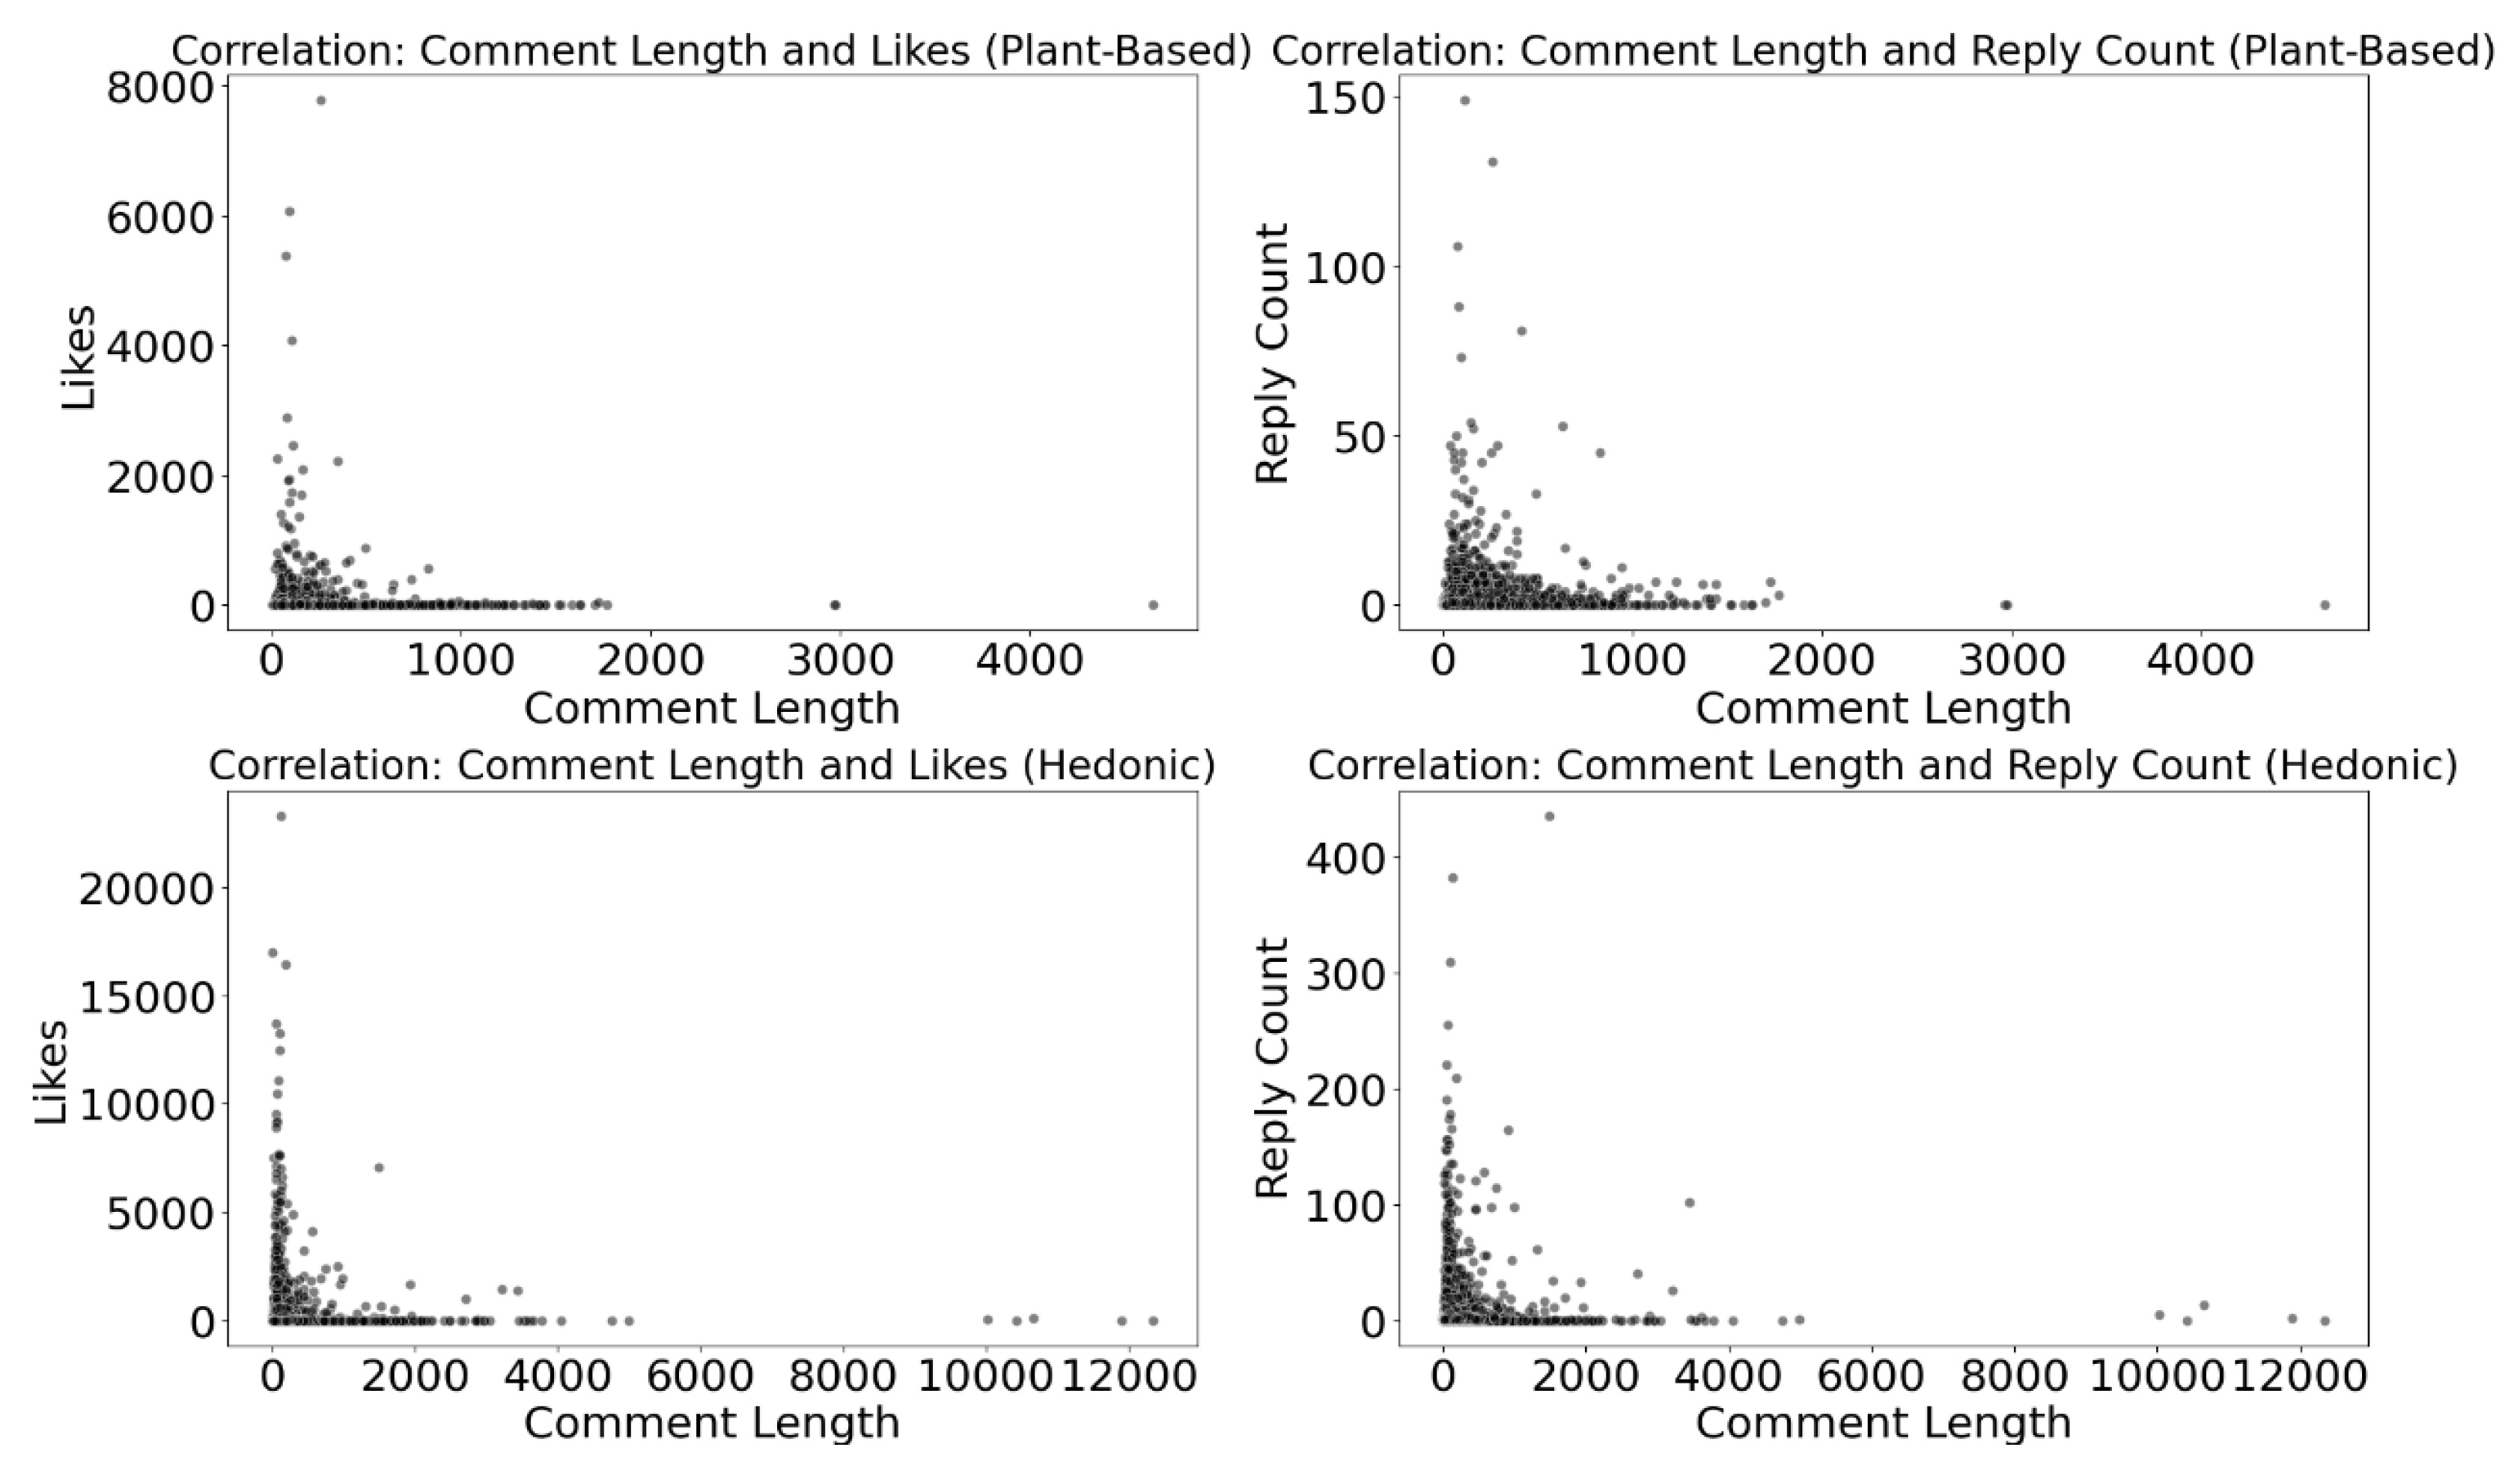
Figure 9.
User Activity.
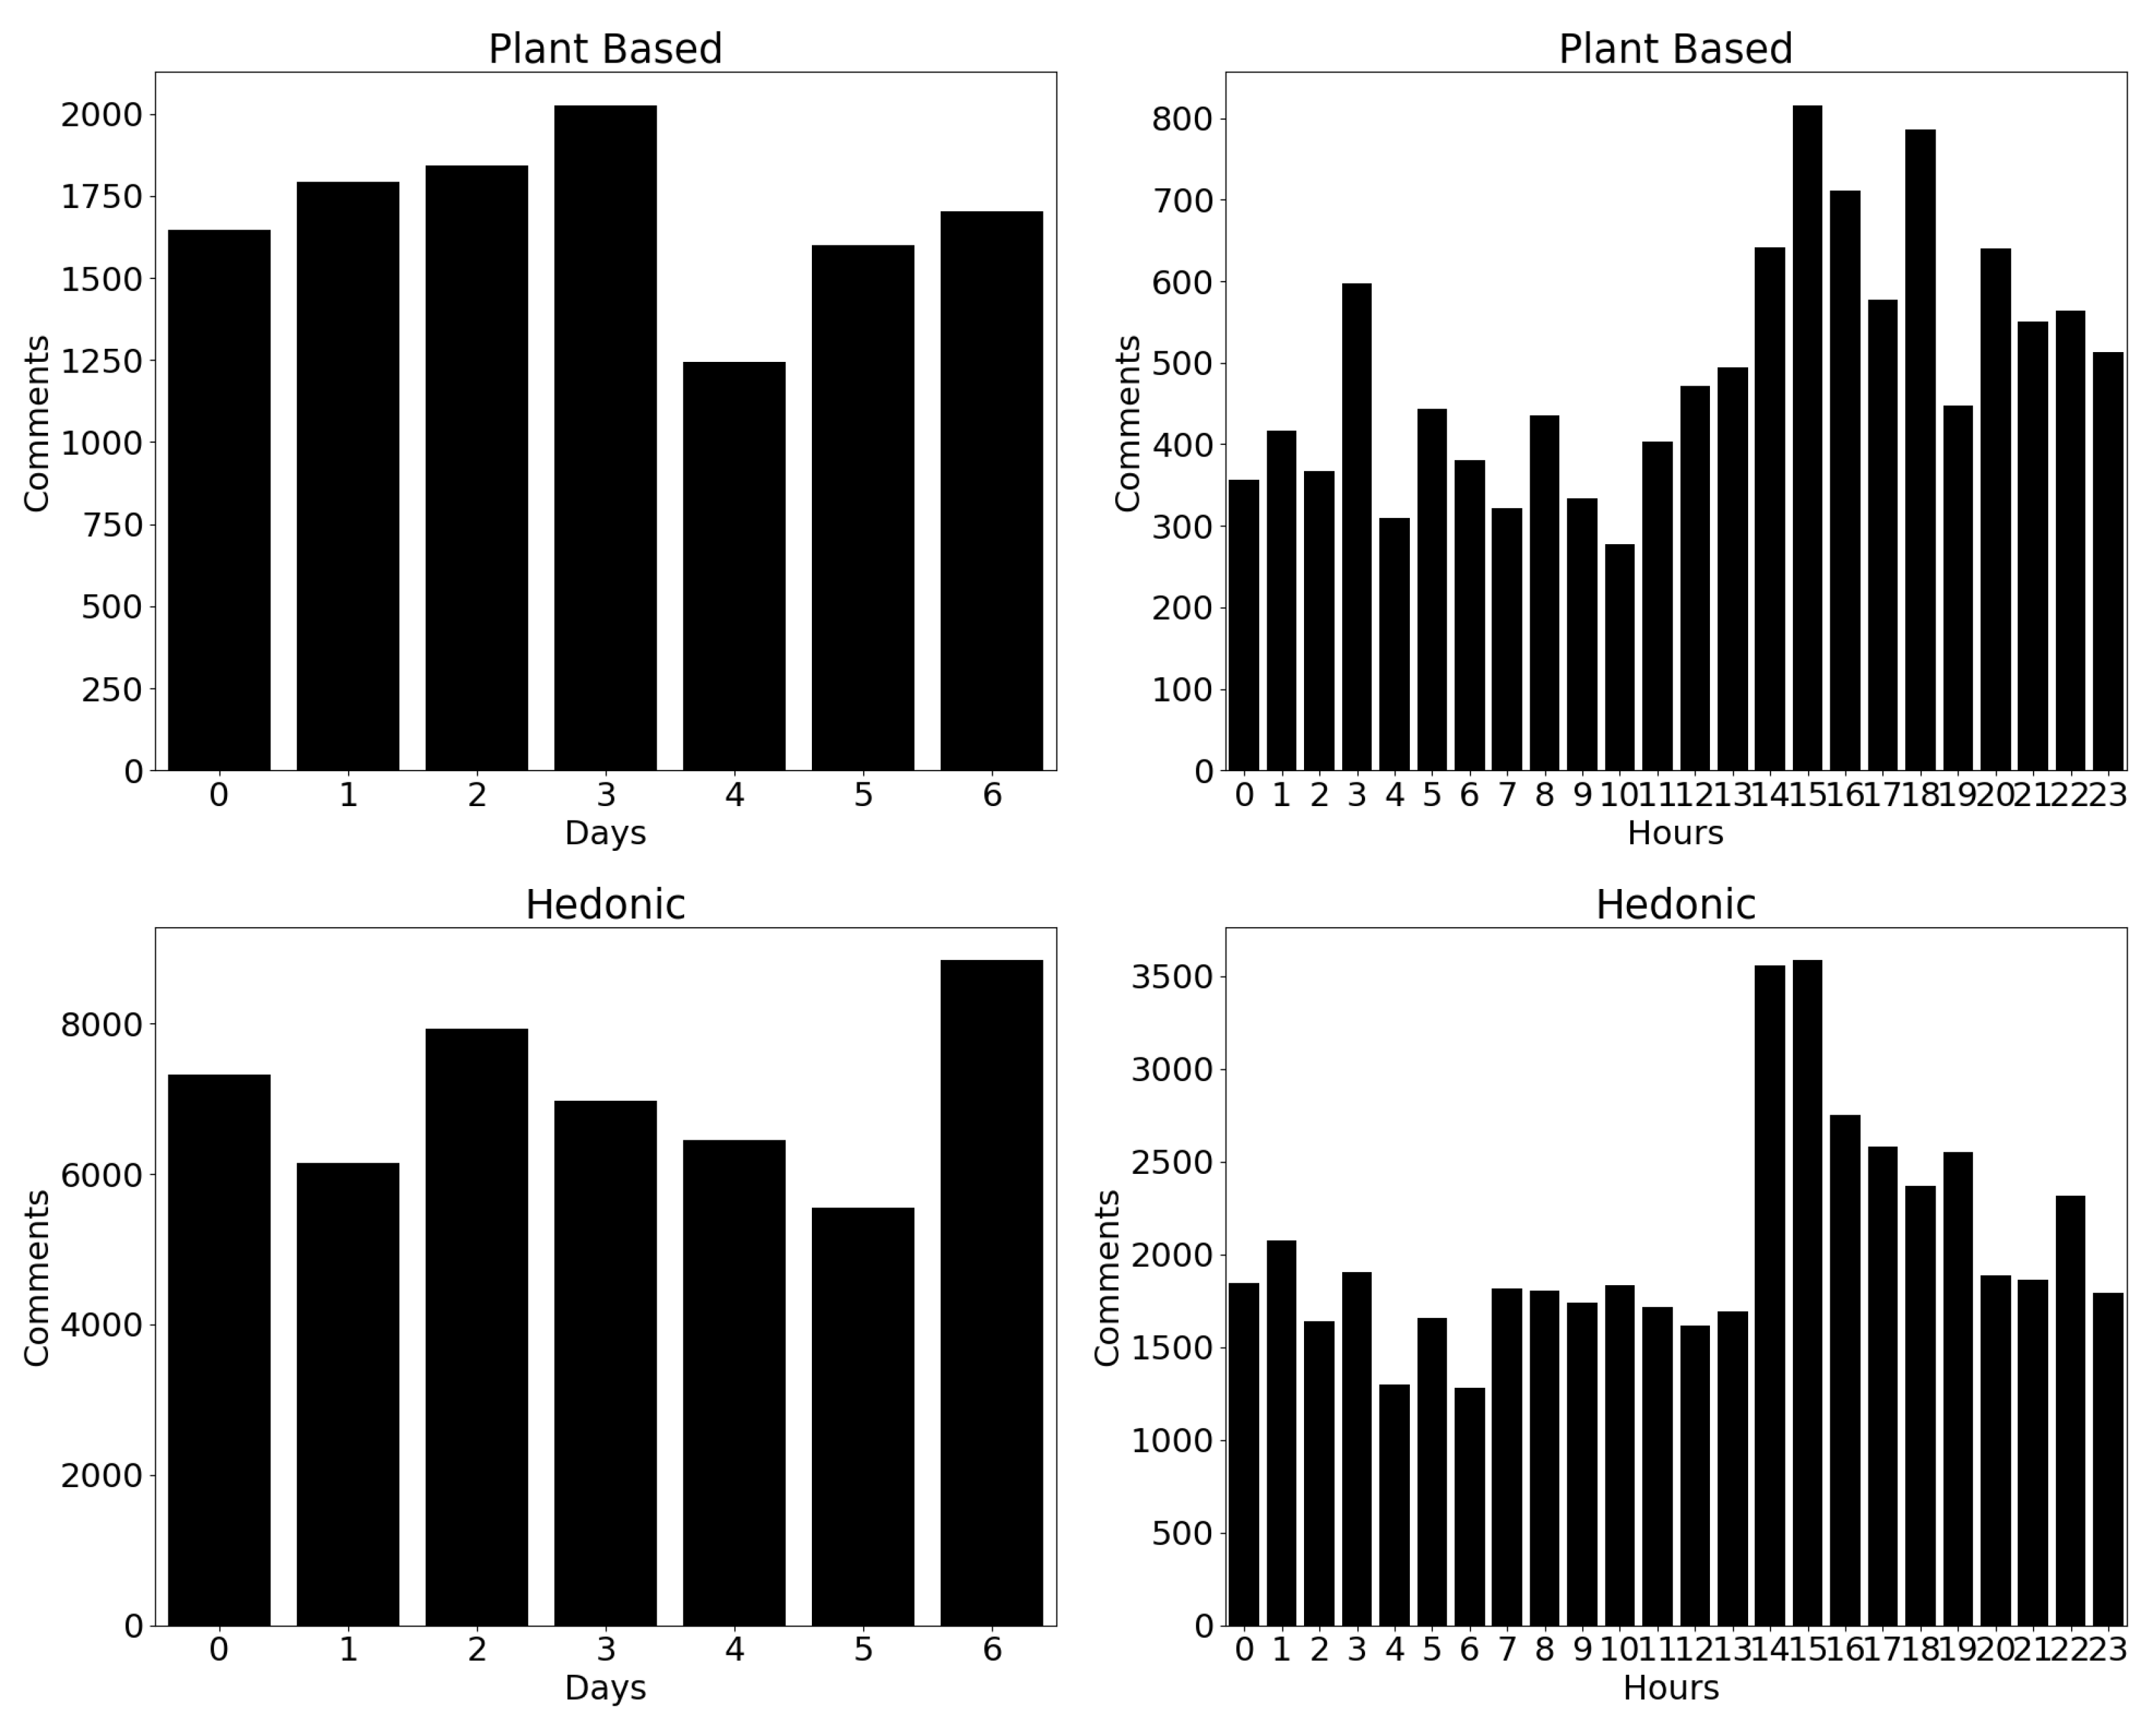
Table 1.
Inclusion Criteria for Plant-Based Products.
| Inclusion Criteria | Plant-Based Products |
|---|---|
| Video Content | The chosen videos focus on plant-based products specifically on milk, butter, and yogurt. |
| Video Type | The selected videos are of the "how-to" or tutorial-style format, where the preparation of plant-based food products is demonstrated. |
| Comments | All the included videos have a minimum of 100 comments, ensuring that the dataset for sentiment analysis is substantial. |
| Language | The videos selected for analysis are exclusively in the English language, ensuring linguistic consistency. |
| Year | The chosen videos were uploaded within the last 5-6 years, aligning them with current trends in plant-based eating. |
| Duration of the video | All selected videos have a duration of less than 20 minutes, facilitating efficient analysis. |
Table 2.
Inclusion Criteria for Hedonic Products.
| Inclusion Criteria | Hedonic Products |
|---|---|
| Video Content | The chosen videos focus on hedonic products specifically on pizza, burgers and cakes. |
| Video Type | The selected videos are of the "how-to" or tutorial-style format, where the preparation of hedonic food products is demonstrated. |
| Comments | All the included videos have a minimum of 100 comments, ensuring that the dataset for sentiment analysis is substantial. |
| Language | The videos selected for analysis are exclusively in the English language, ensuring linguistic consistency. |
| Year | The chosen videos were uploaded within the last 5-6 years, aligning them with current trends in hedonic eating. |
| Duration of the video | All selected videos have a duration of less than 16 minutes, facilitating efficient analysis. |
Table 3.
Evaluation Model’s Terms.
| TP (True Positive) | Instances correctly predicted as positive. |
|---|---|
| TN (True Negative) | Instances correctly predicted as negative. |
| FP (False Positive) | Instances incorrectly predicted as positive. |
| FN (False negative) | Instances incorrectly predicted as negative. |
Table 4.
Formulas for Evaluation Metrics [53].
Table 4.
Formulas for Evaluation Metrics [53].
| Metric | Formula |
|---|---|
| Accuracy | |
| Precision | |
| Recall | |
| F1-score |
Table 5.
Sentiment Labels in Plant-Based Dataset.
| Comment | TextBlob | VADER |
|---|---|---|
| try thank easy peasy | positive | positive |
| interested try shelf like milk | positive | positive |
| thankuuuuuu want try | neutral | positive |
| many day store fridge | positive | neutral |
| must costly | neutral | negative |
| use milk instead water | neutral | neutral |
| look fantastic go make simple clean | positive | positive |
| add vanilla | neutral | neutral |
| thank much video love recipe almond milk best | positive | positive |
| amaze | neutral | positive |
| awesome video thank upload | positive | positive |
Table 6.
Sentiment Labels in Hedonic Dataset.
| Comment | TextBlob | VADER |
|---|---|---|
| Love work love pizza | positive | positive |
| That’s heaven | neutral | positive |
| Amazing burger easy inexpensive | positive | positive |
| Give heart attack | neutral | negative |
| Cant get good nope | positive | negative |
| Delicious love flavour vanilla nice recipe | positive | positive |
| Make cake home amaze thanks recipe best | positive | positive |
| Good cake recipe keep fridge minute pls reply thanks | positive | positive |
| Recreate ur recipe soooo perfect thanks much | positive | positive |
| Become go cake deliciousness | positive | positive |
| Wow look awesome thanks share | positive | positive |
Table 7.
Comparison of Classification results on Plant-Based Dataset.
| Comment | TextBlob | VADER |
|---|---|---|
| like | neutral | positive |
| can pressure cancer | neutral | negative |
| look amazing yum | positive | positive |
| amaze | neutral | positive |
| thank definitely try | neutral | positive |
| look yummy | neutral | positive |
| look amaze long last fridge | negative | positive |
| great video cant wait try tonight | positive | positive |
| look delicious | positive | positive |
| look soo good omg | positive | positive |
Table 8.
Comparison of Classification results on Hedonic Dataset.
| Comment | TextBlob | Vader |
|---|---|---|
| yes pizza | neutral | positive |
| really love pizza | positive | positive |
| amaze look delicious | positive | positive |
| lose yeast | neutral | negative |
| fan pizza congratulation | neutral | positive |
| yummy vanilla cake recipe | neutral | positive |
| im person dont like pizza | neutral | negative |
| favourite pizza top mine chicken | negative | positive |
| wow look tasty | negative | positive |
| use plain self raise flour | negative | neutral |
Table 9.
Performance values for the five models in Plant-Based Dataset.
| Models | Accuracy | Precision | Recall | F1 Score |
|---|---|---|---|---|
| Support Vector Machine | 0.93 | 0.91 | 0.87 | 0.89 |
| Random Forest | 0.90 | 0.89 | 0.79 | 0.81 |
| Naïve Bayes | 0.81 | 0.75 | 0.67 | 0.70 |
| Logistic Regression | 0.93 | 0.90 | 0.85 | 0.87 |
| XGBoost | 0.91 | 0.89 | 0.83 | 0.85 |
Table 10.
Performance values for the five models in Hedonic Dataset.
| Models | Accuracy | Precision | Recall | F1 Score |
|---|---|---|---|---|
| Support Vector Machine | 0.96 | 0.95 | 0.93 | 0.94 |
| Random Forest | 0.92 | 0.92 | 0.86 | 0.88 |
| Naïve Bayes | 0.79 | 0.78 | 0.72 | 0.74 |
| Logistic Regression | 0.96 | 0.95 | 0.93 | 0.94 |
| XGBoost | 0.92 | 0.91 | 0.86 | 0.88 |
Table 11.
TP, TN, FN, FP of each class in SVM model in Hedonic Dataset.
| Class | -1 | 0 | 1 |
|---|---|---|---|
| TP | 2054 | 6419 | 9573 |
| TN | 16109 | 12207 | 8592 |
| FP | 149 | 211 | 276 |
| FN | 370 | 25 | 241 |
Table 12.
TP, TN, FN, FP of each class in Logistic Regression model in Hedonic Dataset.
| Class | -1 | 0 | 1 |
|---|---|---|---|
| TP | 1994 | 6416 | 9543 |
| TN | 16108 | 11937 | 8590 |
| FP | 150 | 301 | 278 |
| FN | 430 | 28 | 271 |
Disclaimer/Publisher’s Note: The statements, opinions and data contained in all publications are solely those of the individual author(s) and contributor(s) and not of MDPI and/or the editor(s). MDPI and/or the editor(s) disclaim responsibility for any injury to people or property resulting from any ideas, methods, instructions or products referred to in the content. |
© 2024 by the authors. Licensee MDPI, Basel, Switzerland. This article is an open access article distributed under the terms and conditions of the Creative Commons Attribution (CC BY) license (https://creativecommons.org/licenses/by/4.0/).
Copyright: This open access article is published under a Creative Commons CC BY 4.0 license, which permit the free download, distribution, and reuse, provided that the author and preprint are cited in any reuse.


