
Submitted:
19 April 2024
Posted:
19 April 2024
You are already at the latest version
Abstract
Premalignant lesions in the bronchial epithelium represent early stages of squamous cell lung carcinoma, challenging to detect with conventional methods. While previous studies have focused on gene expression, here we examine transcriptomic alterations associated with lesion development with the emphasis on protein-coding transcripts. We reanalyzed publicly available RNAseq dataset on airway epithelial cells from 82 smokers with and without premalignant lesions. Transcript abundances were quantified using kallisto, and differential expression and transcript usage analysis was conducted using the sleuth and RATs packages. Functional characterization included overrepresentation analysis (clusterProfiler), weighted co-expression network analysis (WGCNA), and network analysis (Enrichr-KG). We detected 5,906 differentially expressed transcripts, with significant enrichment in pathways related to oxidative phosphorylation and mitochondrial function. Transcript-level WGCNA identified single module correlated with dysplasia status, enriched in cilium-related biological processes. Analysis of hubs within this module highlighted key genes including RABL2B, DNAH1, EFHC1 and VWA3A, and revealed transcription factors such as FOXJ1 and ZNF474 as potential regulators. Our findings underscore the value of transcript-level analysis in uncovering novel insights into premalignant lesion biology. By examining transcripts rather than genes, we identified potential biomarkers associated with early lung carcinogenesis.
Keywords:
bronchial premalignant lesion
; transcriptomics
; biomarker
; WGCNA
; cilium
1. Introduction
Premalignant lesions (PMLs) are early precursors of squamous cell lung carcinoma originating in the bronchial epithelium, characterized by histological changes in the large airways, and are challenging to visualize with conventional bronchoscopy [1]. Autofluorescence bronchoscopy has been tailored for preinvasive lesion detection and has enhanced sensitivity in identifying such lesions [2]. However, this method is a costly and intricate technique with limited applicability in extensive screening programs. Hence, there is a crucial need for more cost-effective, simple, and scalable methods of PML detection to prevent the development of squamous cell lung carcinoma [3].
Scientific interest in the biology of preinvasive stages has sparked the publication of several articles focusing on characterizing molecular alterations accompanying PMLs. The study published by Beane and colleagues [4] identified 280 genes in the airway field associated with premalignant lung lesions, revealing that several biological processes including oxidative phosphorylation, electron transport chain, and mitochondrial protein transport are notably upregulated. They have also shown that bronchial brushes from normal-appearing areas of the mainstem bronchus could predict the presence of PMLs. A subsequent publication used gene expression to suggest that PML may be divided into four molecular subtypes (proliferative, inflammatory, secretory, and normal-like). Merrick et al [5] investigated differences in gene expression profiles between persistent and regressive bronchial dysplasia, revealing 395 differentially expressed genes and 31 significantly altered pathways associated with cell-cycle control, proliferation, inflammation, and epithelial differentiation. Teixeira et al [6] comprehensively profiled the genomic, transcriptomic, and epigenomic characteristics of carcinoma in situ lesions revealing progression-specific methylation changes alongside a strong chromosomal instability signature.
While aforementioned studies have primarily relied on gene expression analysis, an increasing volume of literature underscores the biomedical significance of protein isoforms, as these variants, originating from the same gene, can exhibit diverse biological functions and contribute differently to cellular processes [7,8,9,10], including oncogenesis [11,12]. In this study, we conducted a higher-resolution analysis of the transcriptomic profiles of both normal and PML samples, with a specific focus on protein-coding transcripts rather than genes. We show that transcript-level analysis allows to detect new biological processes and potential biomarkers of the earliest stages of lung cancer development, including possible targets for squamous cell carcinoma chemoprevention.
2. Results
2.1. Functional Enrichment of Differentially Expressed Transcripts
Transcriptomics data (GSE79209) obtained by Beane et al. [4] were downloaded from the GEO database. The initial dataset consisted of 82 samples and showed no significant differences in clinical traits in the dataset, such as COPD and reported smoking history between the subjects. Similar to Beane et al. [4], brushes with the worst histology of metaplasia (n=7) were excluded. Reads were pseudoaligned to the human transcriptome using the kallisto software. This resulted in a total of 227,665 transcripts quantifications for each of the 75 samples.
We conducted differential expression analysis, comparing 25 samples with no evidence of PMLs (samples with no abnormal fluorescing areas or biopsies having normal or hyperplasia histology) against 50 samples with evidence of PMLs (biopsies having mild, moderate, or severe dysplasia). Differentially expressed transcripts (DETs) were identified using the sleuth package [13]. Total 84,625 transcripts passed the default initial filtering used by the sleuth (at least 5 mapped reads to a transcript in at least 47% of the samples). According to the Wald test, there were 5,906 DETs encoding for 4,122 genes between normal and PML classes (q-value less than 0.05). Among the 5,906 DETs discovered ~40% of transcripts belonged to the "protein_coding class according to the Ensembl annotation, 37% transcripts were classified as "retained_intron", and 10% transcripts were classified as "lncRNA".
We then turned to the functional enrichment analysis of the identified DETs to gain insights into the biological pathways and processes associated with the differentially expressed transcripts, see Figure 1. We report that pathways identified via DET-based enrichment analysis (1,910 protein-coding genes) are consistent with the previous findings provided by Beane et al. [4]. There is significant enrichment of pathways related to Cytoplasmic ribosomal proteins (FDR = 5.9E-55), Electron transport chain OXPHOS system in mitochondria (FDR = 1.2E-38), Nonalcoholic fatty liver disease (FDR = 1.8E-19) and Oxidative phosphorylation (FDR = 2.7E-18). Full results of the DET functional enrichment analysis are available in Supplementary Table S1.
Using the transcript abundances quantified by kallisto, the gene-level test implemented in RATs package identified two events of differential transcript usage between normal and dysplasia classes: MRPS25 (mitochondrial ribosomal protein S25, FDR=3.6E-5) and COLCA1 (colorectal cancer associated 1, 3.8E-22).
2.2. Weighted Coexpression Network Analysis
To gain more insights into PML-related processes we utilized a Weighted Gene Co-expression Network Analysis (WGCNA) [14]. Log-transformed TPM values from top-10% of the most variable protein coding transcripts were used to derive the co-expression network (total 8,343 transcripts). The soft-threshold parameter was selected equal to 4 (Supplementary Figure S1).
A total of nine co-expression modules covering 6,466 transcripts were identified by the WGCNA analysis (Supplementary Table S2). There were 1,877 transcripts classified by WGCNA as being not co-expressed and therefore assigned to the "grey" module. Each of the nine modules was correlated with available sample metadata to reveal a subset of co-expressed transcripts associated with clinical traits. Results of the correlation analysis are presented in Figure 2.
There was a single module ("yellow") consisting of 687 transcripts that had a statistically significant correlation with dysplasia status (R=0.26, p=0.02), while the second best-correlated module ("brown", 727 transcripts) had a non-significant correlation (R=-0.10 and p=0.4). No modules were significantly associated with sex and COPD status. We found no modules that were significantly correlated with the worst histology. Several modules were found to be associated with smoking. The highest correlation (R=0.31, p=0.006) was observed for the "yellow" module, while the "green" module showed the second-best absolute correlation (R=-0.29, p=0.01), followed by the "black" module (R=0.26, p=0.03). Overall, these results suggest that the "yellow" module contains co-expressed transcripts associated with the development of the precancerous disease state.
2.3. Enrichment Analysis
We then turned to the biological interpretation of the "yellow" module, since it was found as the only module significantly correlated with dysplasia status. The transcripts of the "yellow" module were mapped to genes and subjected to enrichment analysis against biological processes and cellular components described in Gene Ontology, see Figure 3.
We found that the "yellow" module is significantly enriched in biological processes associated with cilium organization (GO:0044782, FDR = 4.2E-14), cilium assembly (GO:0060271, FDR = 9.0E-15), and cilium movement (GO:0003341, FDR = 1.5E-13). Another cluster of enriched GO terms is also related to cilium activity and generally represents cilium−dependent cell motility (GO:0060285, FDR= 1.8E-8). Finally, there is a cluster of significantly enriched terms not related to cilium and it is formed by biological processes related to mRNA splicing (GO:0000398, FDR=1.3E-4) and its regulation (GO:0050684, FDR=5.0E-3). Expectedly, the analysis results for cellular components also demonstrate enrichment of the "yellow" cluster with cilium-related terms including axoneme (GO:0005930, FDR = 8.0E-13), motile cilium (GO:0031514, FDR=9.0E-13), dynein complex (GO:0030286, FDR=5.4E-5) and others.
Gene-level analysis found several genes that are involved in multiple cilium-related biological processes and cellular components like DNAH5 (dynein axonemal heavy chain 5), CFAP221 (cilia and flagella associated protein 221), ODAD1 (outer dynein arm docking complex subunit 1), TTLL3 (Tubulin Tyrosine Ligase Like 3), HYDIN (axonemal central pair apparatus protein).
2.4. Network Analysis
We proceeded to identify the most significant transcripts that play a pivotal role within the “yellow” module. We defined hubs as transcripts that should satisfy two requirements. The first requirement was the high Pearson correlation of transcript expression with the module "main direction" (first principal component), the threshold was selected as 0.93. The second requirement was the significant differential expression between normal and dysplasia samples. There were a total of 16 transcripts that satisfied both requirements, enlisted in Supplementary Table S3.
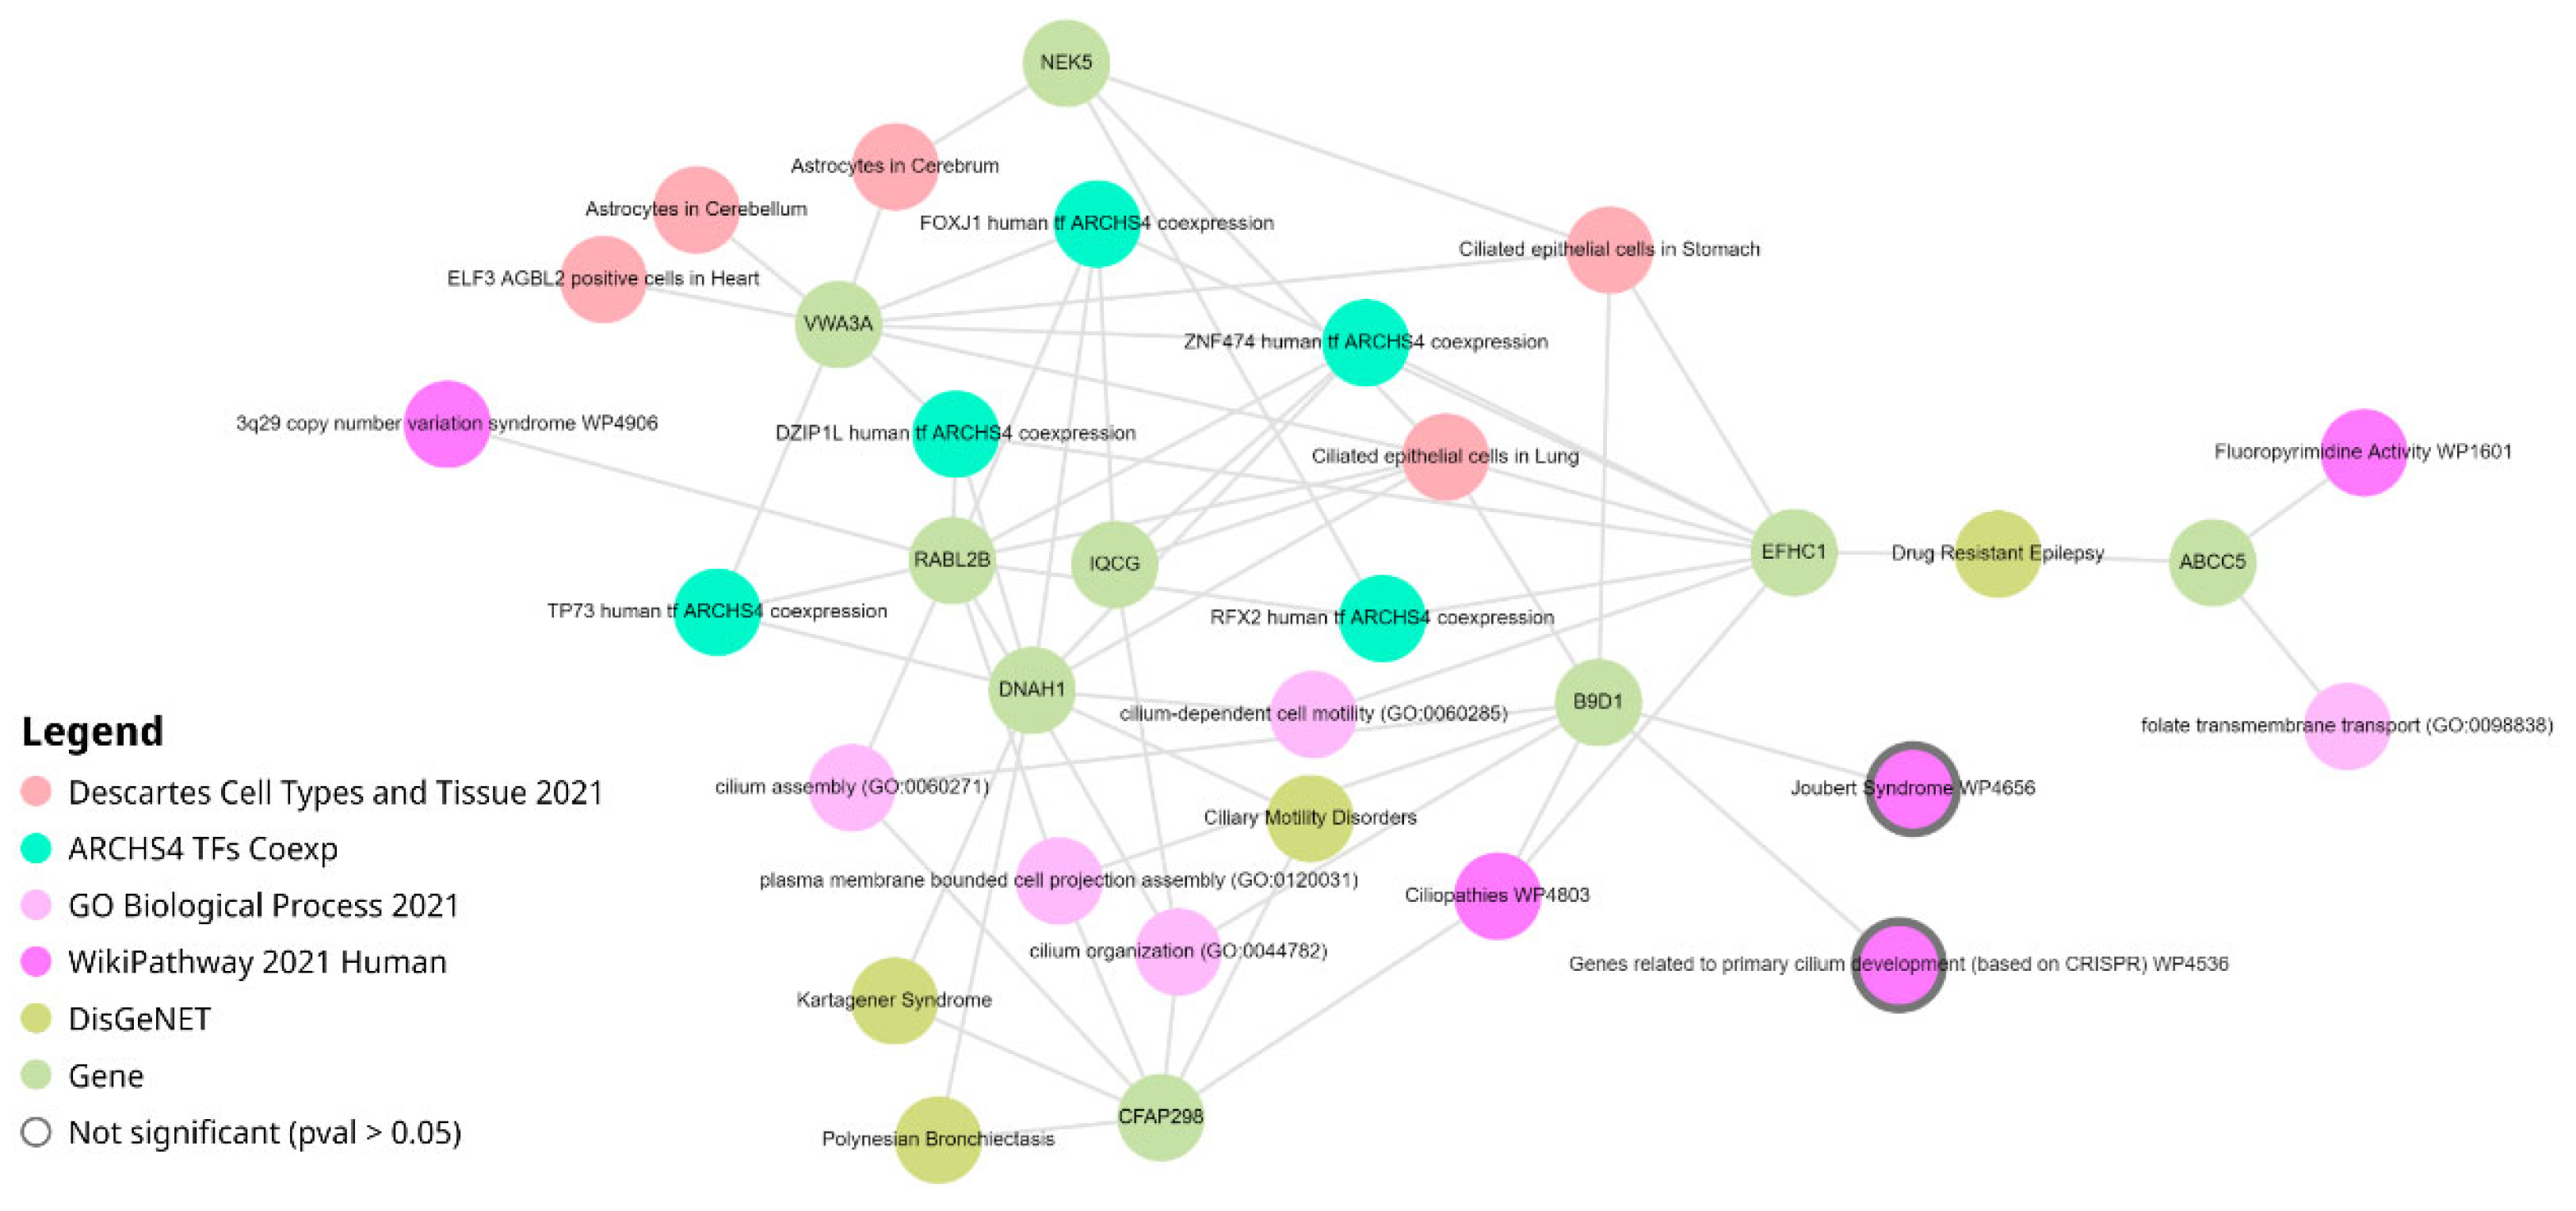
We performed an in-depth analysis of identified hubs via Enrichr-KG resource [15]. This web service combines geneset enrichment analysis with a knowledge graph data representation and returns a network containing the top enriched terms from multiple libraries connected to the overlapping genes, see Figure 4. The network consisted of 33 nodes connected with 63 edges. Nodes included transcript hubs, transcription factors from ARCHS4 coexpression [16], biological processes from Gene Ontology [17], cell types and tissues from Descartes [18], pathways from WikiPathways [19] and diseases from DisGeNet [20].
Consistent with the analysis of the whole "yellow" module described in the previous section, the network built for only hubs also indicated the involvement of various cilium-related bioprocesses (cillium organization, GO:0044872; cilium assembly, GO:0060271) and pathways (Ciliopathies, WP4803). The most connected cell type was "Ciliated epithelial cells in Lung" (7 connections), followed by "Ciliated epithelial cells in Stomach" (4 connections).
The most connected gene was RABL2B (ENST00000395590, 10 connections). This gene encodes for GTPase required for ciliation. Kanie et al. demonstrated that the RABL2B GTPase complex, recruited by CEP19, plays a pivotal role in releasing pre-docked IFT-B complexes at the ciliary base, thereby initiating the entry of intraflagellar transport complexes into the cilium [21]. Three other hub transcripts each having 9 connections were: DNAH1(ENST00000420323, Dynein Axonemal Heavy Chain 1), EFHC1(ENST00000635996, EF-hand domain containing 1), VWA3A (ENST00000563389, von Willebrand factor A domain containing 3A). Of note, VWA3A has a total of five protein-coding transcripts and three of them (ENST00000389398, ENST00000563389, ENST00000563755) passed the top-10% variability filter and were attributed to the "yellow" module.
Enrichment analysis identified several transcription factors that co-regulate selected hubs. Two of them (FOXJ1 and ZNF474) regulated five hubs. While FOXJ1 is known to be the master regulator of motile ciliogenesis [22], the molecular function of ZNF474, a zinc finger protein, is rarely reported. Other transcription factors include DZIP1L, RFX2, and TP73. Transcription factor DZIP1L is located in the ciliary basal body and is known to be involved in cilium assembly and at the same time regulates Hedgehog signaling by interacting with GLI3 [23]. Transcription factor RFX2 coordinates multiple gene expression programs in the multi-ciliated epithelial cells, regulating cell movement, ciliogenesis, and cilia function [24]. Research is investigating the connection between RFX transcription factors and tumor formation and prognosis [25]. It was found that both protein and mRNA levels of ciliogenesis-associated markers FOXJ1 and P73 were significantly increased in patients with nasal polyps and associated with abnormal cilia architecture [26]. Autosomal-recessive deleterious variants in TP73 cause a mucociliary clearance disorder due to a defect in multiciliated cell differentiation [27].
3. Discussion
In the present study, we reanalyzed the dataset from Beane et al.[4] from two distinct perspectives. The first one is the focus on the differentially expressed transcripts, rather than genes, thus providing a more detailed understanding of gene regulation and isoform-specific effects. The other aspect involves the application of Weighted Gene Co-expression Network Analysis, a technique for the exploration of co-expressed transcripts modules and capable of capturing subtle changes in expression patterns, which may not be detected by traditional DEG-based analysis.
While taking a different approach to the analysis, we were able to reproduce the main findings from Beane et al. [4], such as the identification of activated pathways related to oxidative phosphorylation and the electron transport chain. Of note, this connection between the PML-associated field of injury and processes linked to oxidative phosphorylation and the electron transport chain was experimentally validated through immunohistochemistry (IHC) and bioenergetics studies.
Furthermore, transcript-level analysis coupled with WGCNA enabled us to discover additional biological processes related to PML development. The main finding is the association between the development of premalignant bronchial lesions and dysregulation of cilium-related cell processes. Increasing evidence suggests the critical role of the primary cilium in modulating various aspects of oncogenic signaling pathways, immunological responses, and inflammation [28]. It was found that primary cilia coordinate multiple signaling pathways, such as Hedgehog, TGFβ/BMP, G-protein-coupled receptors, WNT, receptor tyrosine kinase to regulate developmental processes, tissue plasticity, and organ function [29]. Given the role of primary cilia in cell cycle regulation, their involvement in tumorigenesis is plausible, supported by the dysregulated expression of cilia-related genes across various tumor types [30]. While limited data exist on airway cilia in lung cancer, histologic changes from normal to dysplastic to cancerous tissues involve cilia loss, and marked downregulation of ciliated cell genes correlates with a more aggressive clinical phenotype in a subset of lung adenocarcinoma [31].
Our analysis predicted some cilia-related genes and transcripts associated with premalignant lesion development. Some of them are known to be associated with cancerogenesis. For example, tubulin glycine ligase TTLL3 knockdown decreased primary cilia and increased colon epithelial cell proliferation, promoting CRC development in mice and correlating with human CRC progression [32]. For other genes such as VWA3A or EFHC1 we were unable to find significant confirmations in the literature. However, we speculate that identified genes and transcription factors could serve as potential drug targets or biomarkers of PML development. The discovery of a link between anticancer drug resistance and primary ciliary dynamics highlights the significance of primary cilia as a crucial target organelle for combatting drug resistance in cancer treatment, thus emphasizing the urgent need for research in this area to develop novel strategies [33]
Overall presented transcript-level analysis provides insight into the molecular mechanisms underlying PML development, emphasizing the dysregulation of cilium-related processes. By exploring isoforms that may influence cancer development and investigating potential differences in isoform functions resulting from carcinogen exposure, we aim to contribute to the understanding of PML progression. Identified transcripts and transcription factors may serve as potential biomarkers or drug targets for prevention of squamous cell lung carcinoma. However further research into the role of cilia-related processes in lung tumorigenesis is warranted to develop novel therapeutic strategies.
4. Materials and Methods
4.1. Transcript Quantification and Differential Expression Analyses
A total of 75 files in the SRA format were downloaded from the NCBI GEO resource, dataset identifier GSE79209 [4] and converted to the FASTQ format via the fastq-dump utility (NCBI SRA toolkit). Quality trimming and adapter clipping were performed with fastp [34] using the default settings with subsequent quality control performed with fastQC [https://www.bioinformatics.babraham.ac.uk/projects/fastqc/]. Transcript abundances in TPM units were quantified via kallisto [35] with default settings except for a change in the number of bootstraps, which was set to 200. The index file for kallisto constructed from the Ensembl reference transcriptomes (version 108) was acquired from the website [https://github.com/pachterlab/kallisto-transcriptome-indices]. Differential transcript expression was identified via the sleuth package [13], which leverages the bootstrap estimates from kallisto output. We used the Wald test implemented in sleuth with default settings; a cutoff q-value set as 0.05. Differential transcript usage was calculated using RATs software [36] based on the transcript abundance quantitation and bootstrap analysis from kallisto output. The following parameters were used: dprop_thresh = 0.1, use_sums=TRUE.
4.2. Functional Enrichment Analysis of Differentially Expressed Transcripts
All protein-coding transcripts with significant differential expression (q-value<0.05) were mapped to the corresponding genes and subjected to enrichment analysis using the enrichWP function from the R package 'clusterProfiler' [37], with maxGSSize parameter set to 200. Pathway content was downloaded from the WikiPathways resource [38]. Significantly enriched pathways (FDR less than 0.05) were visualized using the dotplot function.
4.3. Weighted Coexpression Network Analysis
All the protein-coding transcripts were ranked by variance from large to small, and the log-transformed TPM values from the top-10% transcripts were selected as input for the weighted correlation network analysis using the R package WGCNA [14]. The pickSoftThreshold() function was used to screen the soft-threshold parameter, which ranged from 1 to 20. A soft threshold was selected to maximize the scale free topology model fit. The automatic network construction and module detection was performed using blockwiseModules() function with the following parameters: pamRespectsDendro = TRUE, minModuleSize = 20, maxBlockSize = 4000, reassignThreshold = 0, mergeCutHeight = 0.25. The correlation between each gene's expression values and the first principal component of each module (eigengene) provided a measure of the proximity between a gene and a specific module, so-called kME values. Module eigengenes were subjected to Pearson correlation analysis with clinical traits to identify modules that showed significant associations with the clinical characteristics (COPD status, dysplasia status, maximum histology grade, packs per year, sex and smoking status).
4.4. The Module of Interest Enrichment
Similar to the enrichment of differentially expressed transcripts, all protein-coding transcripts from the module of interest were mapped to genes and subjected to enrichment analysis against Gene Ontology terms (biological processes and cellular components) using the enrichGO function from the 'clusterProfiler' [37]. Significantly enriched terms (FDR less than 0.05) were visualized using functions treeplot and cnetplot.
4.5. Analysis of Hub Genes
Module hubs were defined as transcripts that satisfied two criteria: 1) were detected by sleuth as significantly differentially expressed between normal and dysplasia classes (Wald test q-value less than 0.05) 2) had absolute Pearson correlation between expression and eigengene of the yellow module greater than 0.93. Network visualization and enrichment analysis of the identified hub transcripts were performed using Enrichr-KG web-server application [15]. All settings were set to default except for "Minimum links per gene" = 2. The following geneset libraries were used: Descartes_Cell_Types_and_Tissue_2021, WikiPathway_2021_Human, Gene Ontology (biological process), DisGeNet, ARCHS4_TFs_Coexp.
Supplementary Materials
The following supporting information can be downloaded at the website of this paper posted on Preprints.org. Figure S1: WGCNA diagnostics plot; Table S1: Enrichment analysis of differentially expressed transcripts; Table S2: Description and WGCNA module assignment for top-10% most varying transcripts; Table S3: Hub transcripts of the “yellow” module.
Author Contributions
Conceptualization, M.P. and E.P.; methodology, M.P.; formal analysis, M.P.; investigation, M.P.; writing—original draft preparation, M.P. and E.P.; visualization, M.P.; supervision, E.P.; project administration, E.P.; funding acquisition, E.P. All authors have read and agreed to the published version of the manuscript.
Funding
This research was funded by RSF, grant number 21-74-1006.
Institutional Review Board Statement
Not applicable.
Informed Consent Statement
Not applicable.
Data Availability Statement
Data sharing is not applicable.
Conflicts of Interest
The authors declare no conflicts of interest. The funders had no role in the design of the study; in the collection, analyses, or interpretation of data; in the writing of the manuscript; or in the decision to publish the results.
References
- Banerjee, A.K. Preinvasive Lesions of the Bronchus. J. Thorac. Oncol. 2009, 4, 545–551. [CrossRef]
- Gupta, A.; Harris, K.; Dhillon, S.S. Role of Bronchoscopy in Management of Central Squamous Cell Lung Carcinoma in Situ. Ann. Transl. Med. 2019, 7, 354–354. [CrossRef]
- Roberts, M.; Ogden, J.; Hossain, A.S.M.; Chaturvedi, A.; Kerr, A.R.W.; Dive, C.; Beane, J.E.; Lopez-Garcia, C. Interrogating the Precancerous Evolution of Pathway Dysfunction in Lung Squamous Cell Carcinoma Using XTABLE. Elife 2023, 12. [CrossRef]
- Beane, J.; Mazzilli, S.A.; Tassinari, A.M.; Liu, G.; Zhang, X.; Liu, H.; Buncio, A.D.; Dhillon, S.S.; Platero, S.J.; Lenburg, M.E.; et al. Detecting the Presence and Progression of Premalignant Lung Lesions via Airway Gene Expression. Clin. Cancer Res. 2017, 23, 5091–5100. [CrossRef]
- Merrick, D.T.; Edwards, M.G.; Franklin, W.A.; Sugita, M.; Keith, R.L.; Miller, Y.E.; Friedman, M.B.; Dwyer-Nield, L.D.; Tennis, M.A.; O’Keefe, M.C.; et al. Altered Cell-Cycle Control, Inflammation, and Adhesion in High-Risk Persistent Bronchial Dysplasia. Cancer Res. 2018, 78, 4971–4983. [CrossRef]
- Teixeira, V.H.; Pipinikas, C.P.; Pennycuick, A.; Lee-Six, H.; Chandrasekharan, D.; Beane, J.; Morris, T.J.; Karpathakis, A.; Feber, A.; Breeze, C.E.; et al. Deciphering the Genomic, Epigenomic, and Transcriptomic Landscapes of Pre-Invasive Lung Cancer Lesions. Nat. Med. 2019, 25, 517–525. [CrossRef]
- Stastna, M.; Van Eyk, J.E. Analysis of Protein Isoforms: Can We Do It Better? Proteomics 2012, 12, 2937–2948. [CrossRef]
- Bhuiyan, S.A.; Ly, S.; Phan, M.; Huntington, B.; Hogan, E.; Liu, C.C.; Liu, J.; Pavlidis, P. Systematic Evaluation of Isoform Function in Literature Reports of Alternative Splicing. BMC Genomics 2018, 19. [CrossRef]
- Poverennaya, E.; Kiseleva, O.; Romanova, A.; Pyatnitskiy, M. Predicting Functions of Uncharacterized Human Proteins: From Canonical to Proteoforms. Genes (Basel). 2020, 11, 1–17. [CrossRef]
- Pozo, F.; Martinez-Gomez, L.; Walsh, T.A.; Rodriguez, J.M.; Di Domenico, T.; Abascal, F.; Vazquez, J.; Tress, M.L. Assessing the Functional Relevance of Splice Isoforms. NAR genomics Bioinforma. 2021, 3, 1–16. [CrossRef]
- Hinz, N.; Jücker, M. Distinct Functions of AKT Isoforms in Breast Cancer: A Comprehensive Review. Cell Commun. Signal. 2019, 17. [CrossRef]
- Dolgalev, G.; Poverennaya, E. Quantitative Analysis of Isoform Switching in Cancer. Int. J. Mol. Sci. 2023, 24. [CrossRef]
- Pimentel, H.; Bray, N.L.; Puente, S.; Melsted, P.; Pachter, L. Differential Analysis of RNA-Seq Incorporating Quantification Uncertainty. Nat. Methods 2017, 14, 687–690. [CrossRef]
- Langfelder, P.; Horvath, S. WGCNA: An R Package for Weighted Correlation Network Analysis. BMC Bioinformatics 2008, 9. [CrossRef]
- Evangelista, J.E.; Xie, Z.; Marino, G.B.; Nguyen, N.; Clarke, D.J.B.; Ma’Ayan, A. Enrichr-KG: Bridging Enrichment Analysis across Multiple Libraries. Nucleic Acids Res. 2023, 51, W168–W179. [CrossRef]
- Lachmann, A.; Torre, D.; Keenan, A.B.; Jagodnik, K.M.; Lee, H.J.; Wang, L.; Silverstein, M.C.; Ma’ayan, A. Massive Mining of Publicly Available RNA-Seq Data from Human and Mouse. Nat. Commun. 2018, 9. [CrossRef]
- Ashburner, M.; Ball, C.A.; Blake, J.A.; Botstein, D.; Butler, H.; Cherry, J.M.; Davis, A.P.; Dolinski, K.; Dwight, S.S.; Eppig, J.T.; et al. Gene Ontology: Tool for the Unification of Biology. The Gene Ontology Consortium. Nat. Genet. 2000, 25, 25–29. [CrossRef]
- Cao, J.; O’Day, D.R.; Pliner, H.A.; Kingsley, P.D.; Deng, M.; Daza, R.M.; Zager, M.A.; Aldinger, K.A.; Blecher-Gonen, R.; Zhang, F.; et al. A Human Cell Atlas of Fetal Gene Expression. Science 2020, 370. [CrossRef]
- Martens, M.; Ammar, A.; Riutta, A.; Waagmeester, A.; Slenter, D.N.; Hanspers, K.; Miller, R.A.; Digles, D.; Lopes, E.N.; Ehrhart, F.; et al. WikiPathways: Connecting Communities. Nucleic Acids Res. 2021, 49, D613–D621. [CrossRef]
- Piñero, J.; Ramírez-Anguita, J.M.; Saüch-Pitarch, J.; Ronzano, F.; Centeno, E.; Sanz, F.; Furlong, L.I. The DisGeNET Knowledge Platform for Disease Genomics: 2019 Update. Nucleic Acids Res. 2020, 48, D845–D855. [CrossRef]
- Kanie, T.; Abbott, K.L.; Mooney, N.A.; Plowey, E.D.; Demeter, J.; Jackson, P.K. The CEP19-RABL2 GTPase Complex Binds IFT-B to Initiate Intraflagellar Transport at the Ciliary Base. Dev. Cell 2017, 42, 22. [CrossRef]
- Mukherjee, I.; Roy, S.; Chakrabarti, S. Identification of Important Effector Proteins in the FOXJ1 Transcriptional Network Associated with Ciliogenesis and Ciliary Function. Front. Genet. 2019, 10, 416138. [CrossRef]
- Wang, C.; Low, W.C.; Liu, A.; Wang, B. Centrosomal Protein DZIP1 Regulates Hedgehog Signaling by Promoting Cytoplasmic Retention of Transcription Factor GLI3 and Affecting Ciliogenesis. J. Biol. Chem. 2013, 288, 29518. [CrossRef]
- Chung, M.I.; Kwon, T.; Tu, F.; Brooks, E.R.; Gupta, R.; Meyer, M.; Baker, J.C.; Marcotte, E.M.; Wallingford, J.B. Coordinated Genomic Control of Ciliogenesis and Cell Movement by RFX2. Elife 2014, 2014, 1439. [CrossRef]
- Walentek, P. Ciliary Transcription Factors in Cancer--How Understanding Ciliogenesis Can Promote the Detection and Prognosis of Cancer Types. J. Pathol. 2016, 239, 6–9. [CrossRef]
- Li, Y.Y.; Li, C.W.; Chao, S.S.; Yu, F.G.; Yu, X.M.; Liu, J.; Yan, Y.; Shen, L.; Gordon, W.; Shi, L.; et al. Impairment of Cilia Architecture and Ciliogenesis in Hyperplastic Nasal Epithelium from Nasal Polyps. J. Allergy Clin. Immunol. 2014, 134, 1282–1292. [CrossRef]
- Wallmeier, J.; Bracht, D.; Alsaif, H.S.; Dougherty, G.W.; Olbrich, H.; Cindric, S.; Dzietko, M.; Heyer, C.; Teig, N.; Thiels, C.; et al. Mutations in TP73 Cause Impaired Mucociliary Clearance and Lissencephaly. Am. J. Hum. Genet. 2021, 108, 1318–1329. [CrossRef]
- Liu, H.; Kiseleva, A.A.; Golemis, E.A. Ciliary Signalling in Cancer. Nat. Rev. Cancer 2018, 18, 511–524. [CrossRef]
- Anvarian, Z.; Mykytyn, K.; Mukhopadhyay, S.; Pedersen, L.B.; Christensen, S.T. Cellular Signalling by Primary Cilia in Development, Organ Function and Disease. Nat. Rev. Nephrol. 2019, 15, 199–219. [CrossRef]
- Cilia Gene Expression Patterns in Cancer - PubMed.
- Tilley, A.E.; Walters, M.S.; Shaykhiev, R.; Crystal, R.G. Cilia Dysfunction in Lung Disease. Annu. Rev. Physiol. 2015, 77, 379–406. [CrossRef]
- Rocha, C.; Papon, L.; Cacheux, W.; Marques Sousa, P.; Lascano, V.; Tort, O.; Giordano, T.; Vacher, S.; Lemmers, B.; Mariani, P.; et al. Tubulin Glycylases Are Required for Primary Cilia, Control of Cell Proliferation and Tumor Development in Colon. EMBO J. 2014, 33, 2247–2260. [CrossRef]
- Lee, K.H. Primary Cilia: A Novel Research Approach to Overcome Anticancer Drug Resistance. Front. Mol. Biosci. 2023, 10. [CrossRef]
- Chen, S.; Zhou, Y.; Chen, Y.; Gu, J. Fastp: An Ultra-Fast All-in-One FASTQ Preprocessor. Bioinformatics 2018, 34, i884–i890. [CrossRef]
- Bray, N.L.; Pimentel, H.; Melsted, P.; Pachter, L. Near-Optimal Probabilistic RNA-Seq Quantification. Nat. Biotechnol. 2016, 34, 525–527. [CrossRef]
- Froussios, K.; Mourão, K.; Simpson, G.; Barton, G.; Schurch, N. Relative Abundance of Transcripts (RATs): Identifying Differential Isoform Abundance from RNA-Seq . F1000Research 2019, 8. [CrossRef]
- Wu, T.; Hu, E.; Xu, S.; Chen, M.; Guo, P.; Dai, Z.; Feng, T.; Zhou, L.; Tang, W.; Zhan, L.; et al. ClusterProfiler 4.0: A Universal Enrichment Tool for Interpreting Omics Data. Innov. (Cambridge 2021, 2. [CrossRef]
- Pico, A.R.; Kelder, T.; Van Iersel, M.P.; Hanspers, K.; Conklin, B.R.; Evelo, C. WikiPathways: Pathway Editing for the People. PLoS Biol. 2008, 6, 1403–1407. [CrossRef]
Figure 1.
Functional enrichment analysis of transcripts differentially expressed between normal and PML samples. Genesets obtained from the WikiPathways resource, top-15 pathways are visualized.
Figure 1.
Functional enrichment analysis of transcripts differentially expressed between normal and PML samples. Genesets obtained from the WikiPathways resource, top-15 pathways are visualized.
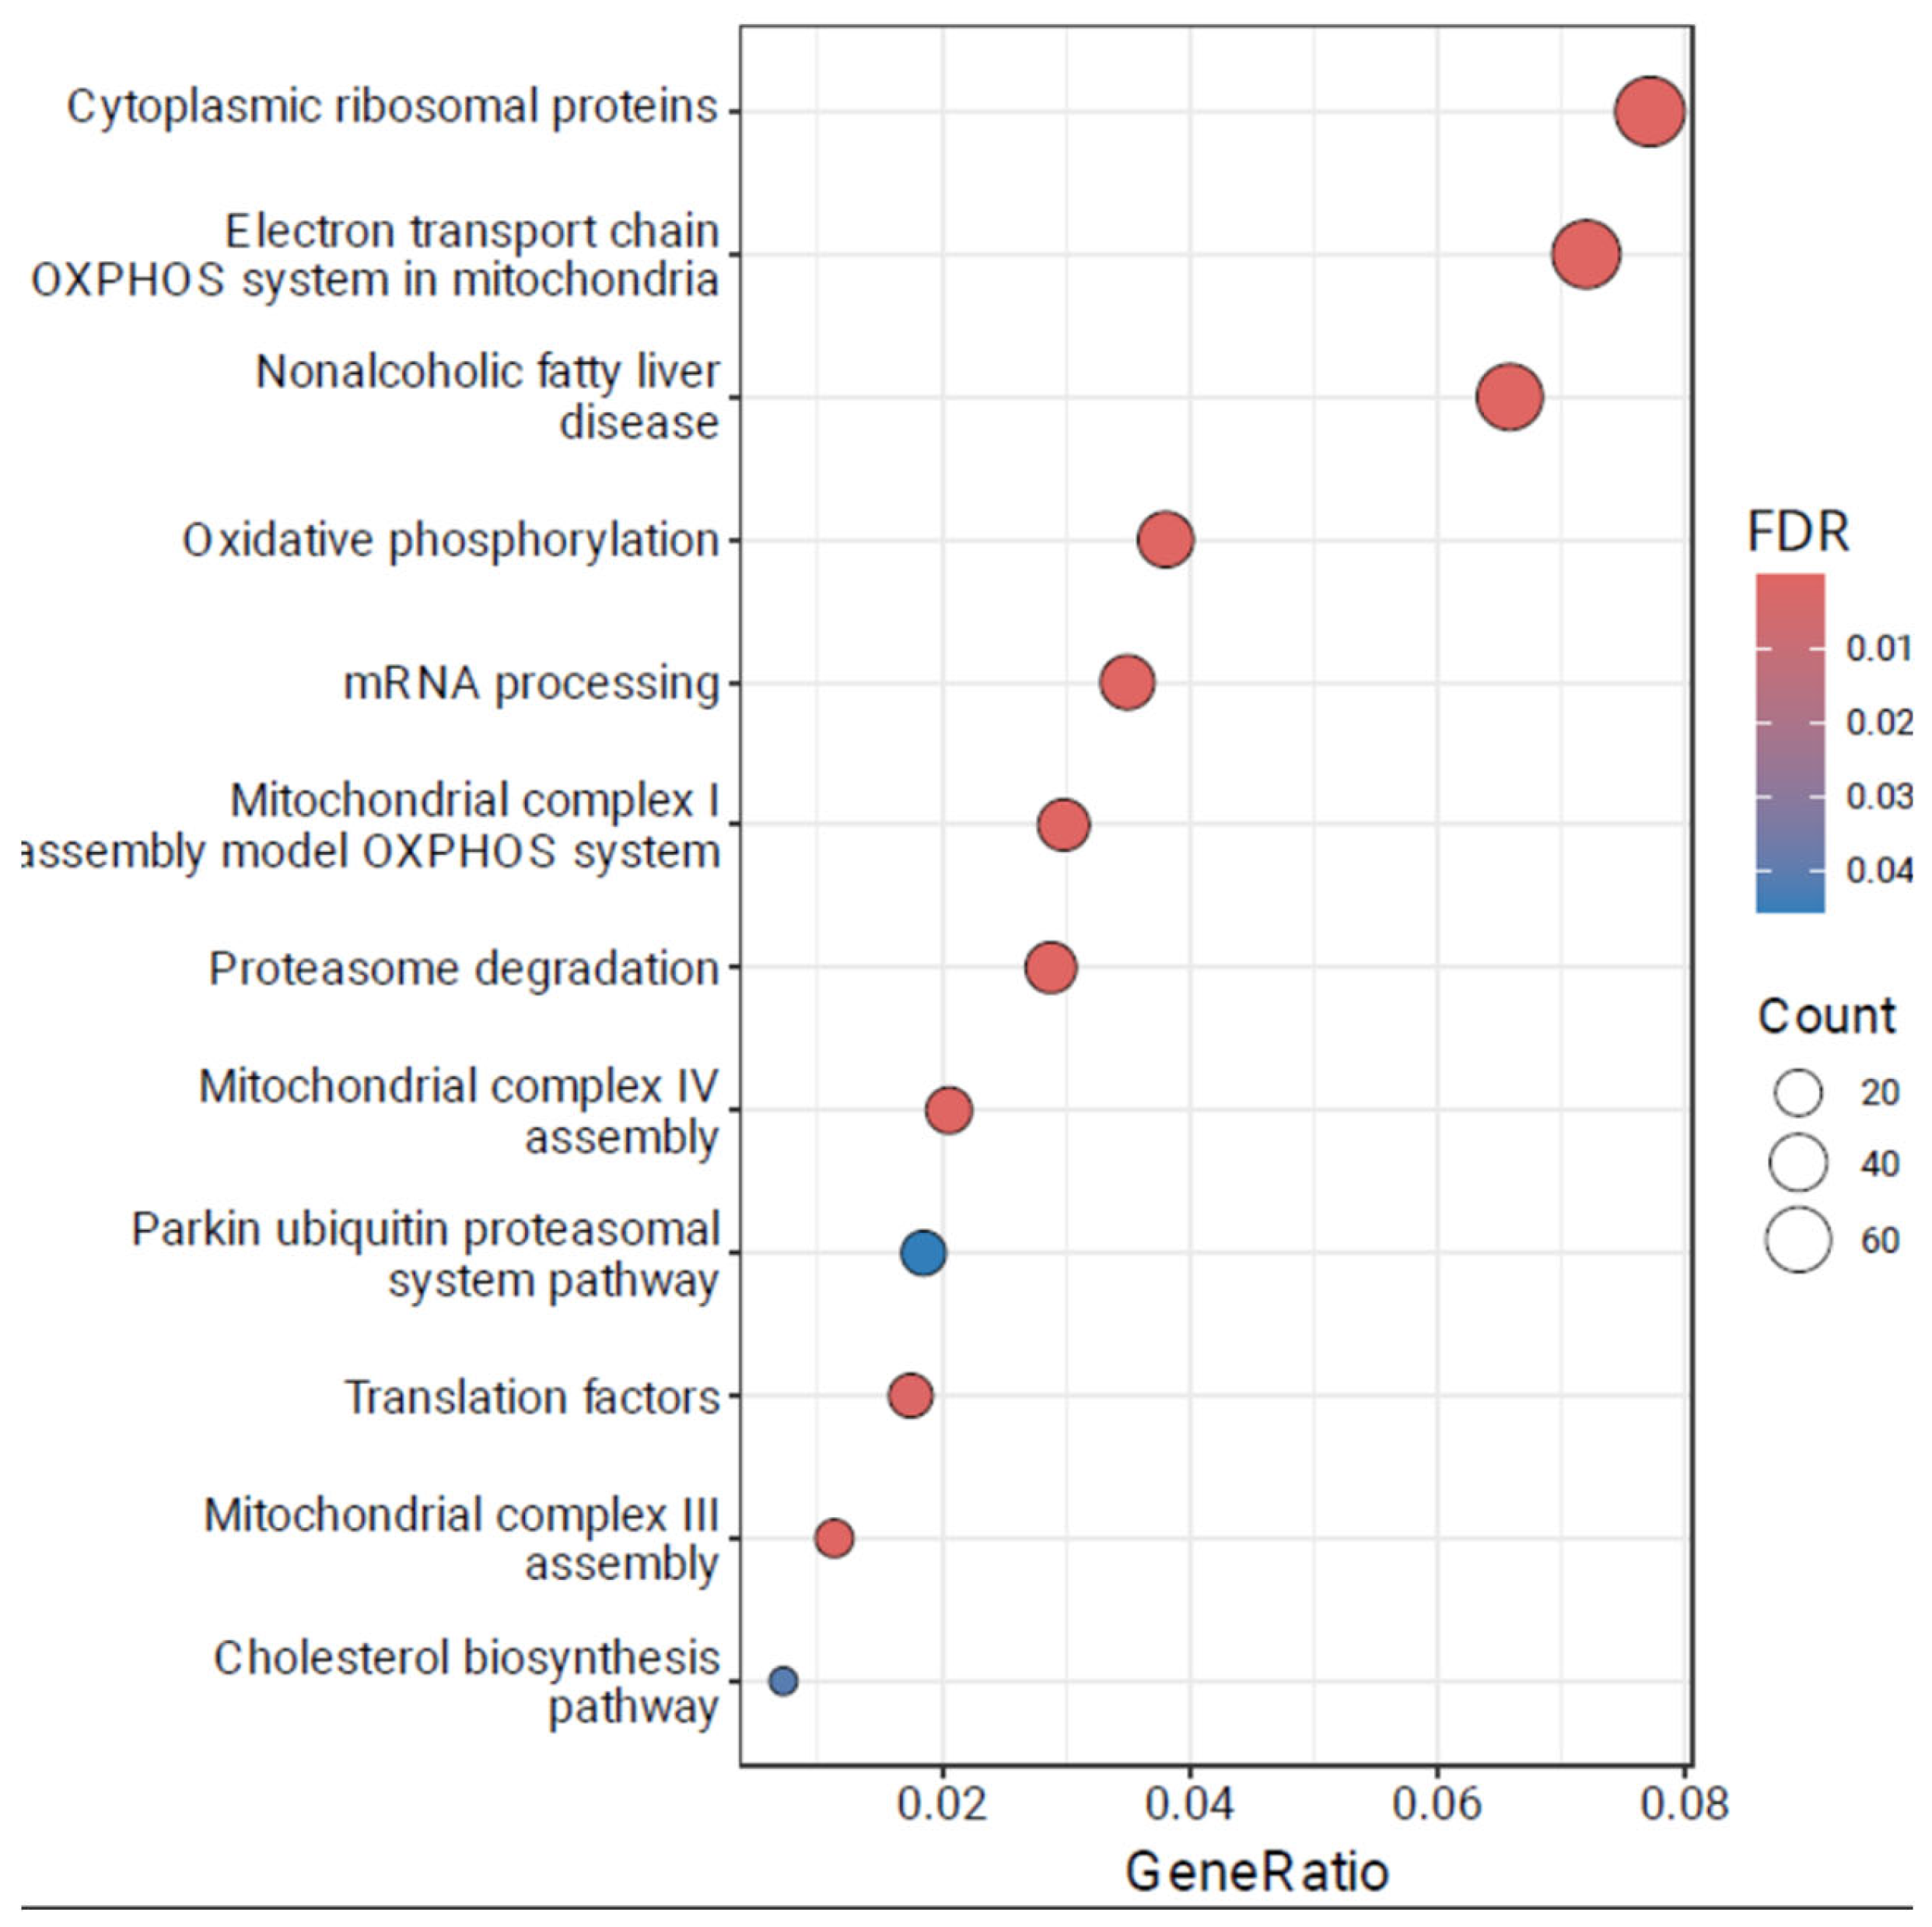
Figure 2.
Correlation between co-expressed module eigengenes and clinical traits. Number of transcripts for each module is given in parentheses. Each cell contains the value of Pearson correlation and the p-value for the null hypothesis that the corresponding correlation coefficient is equal to zero.
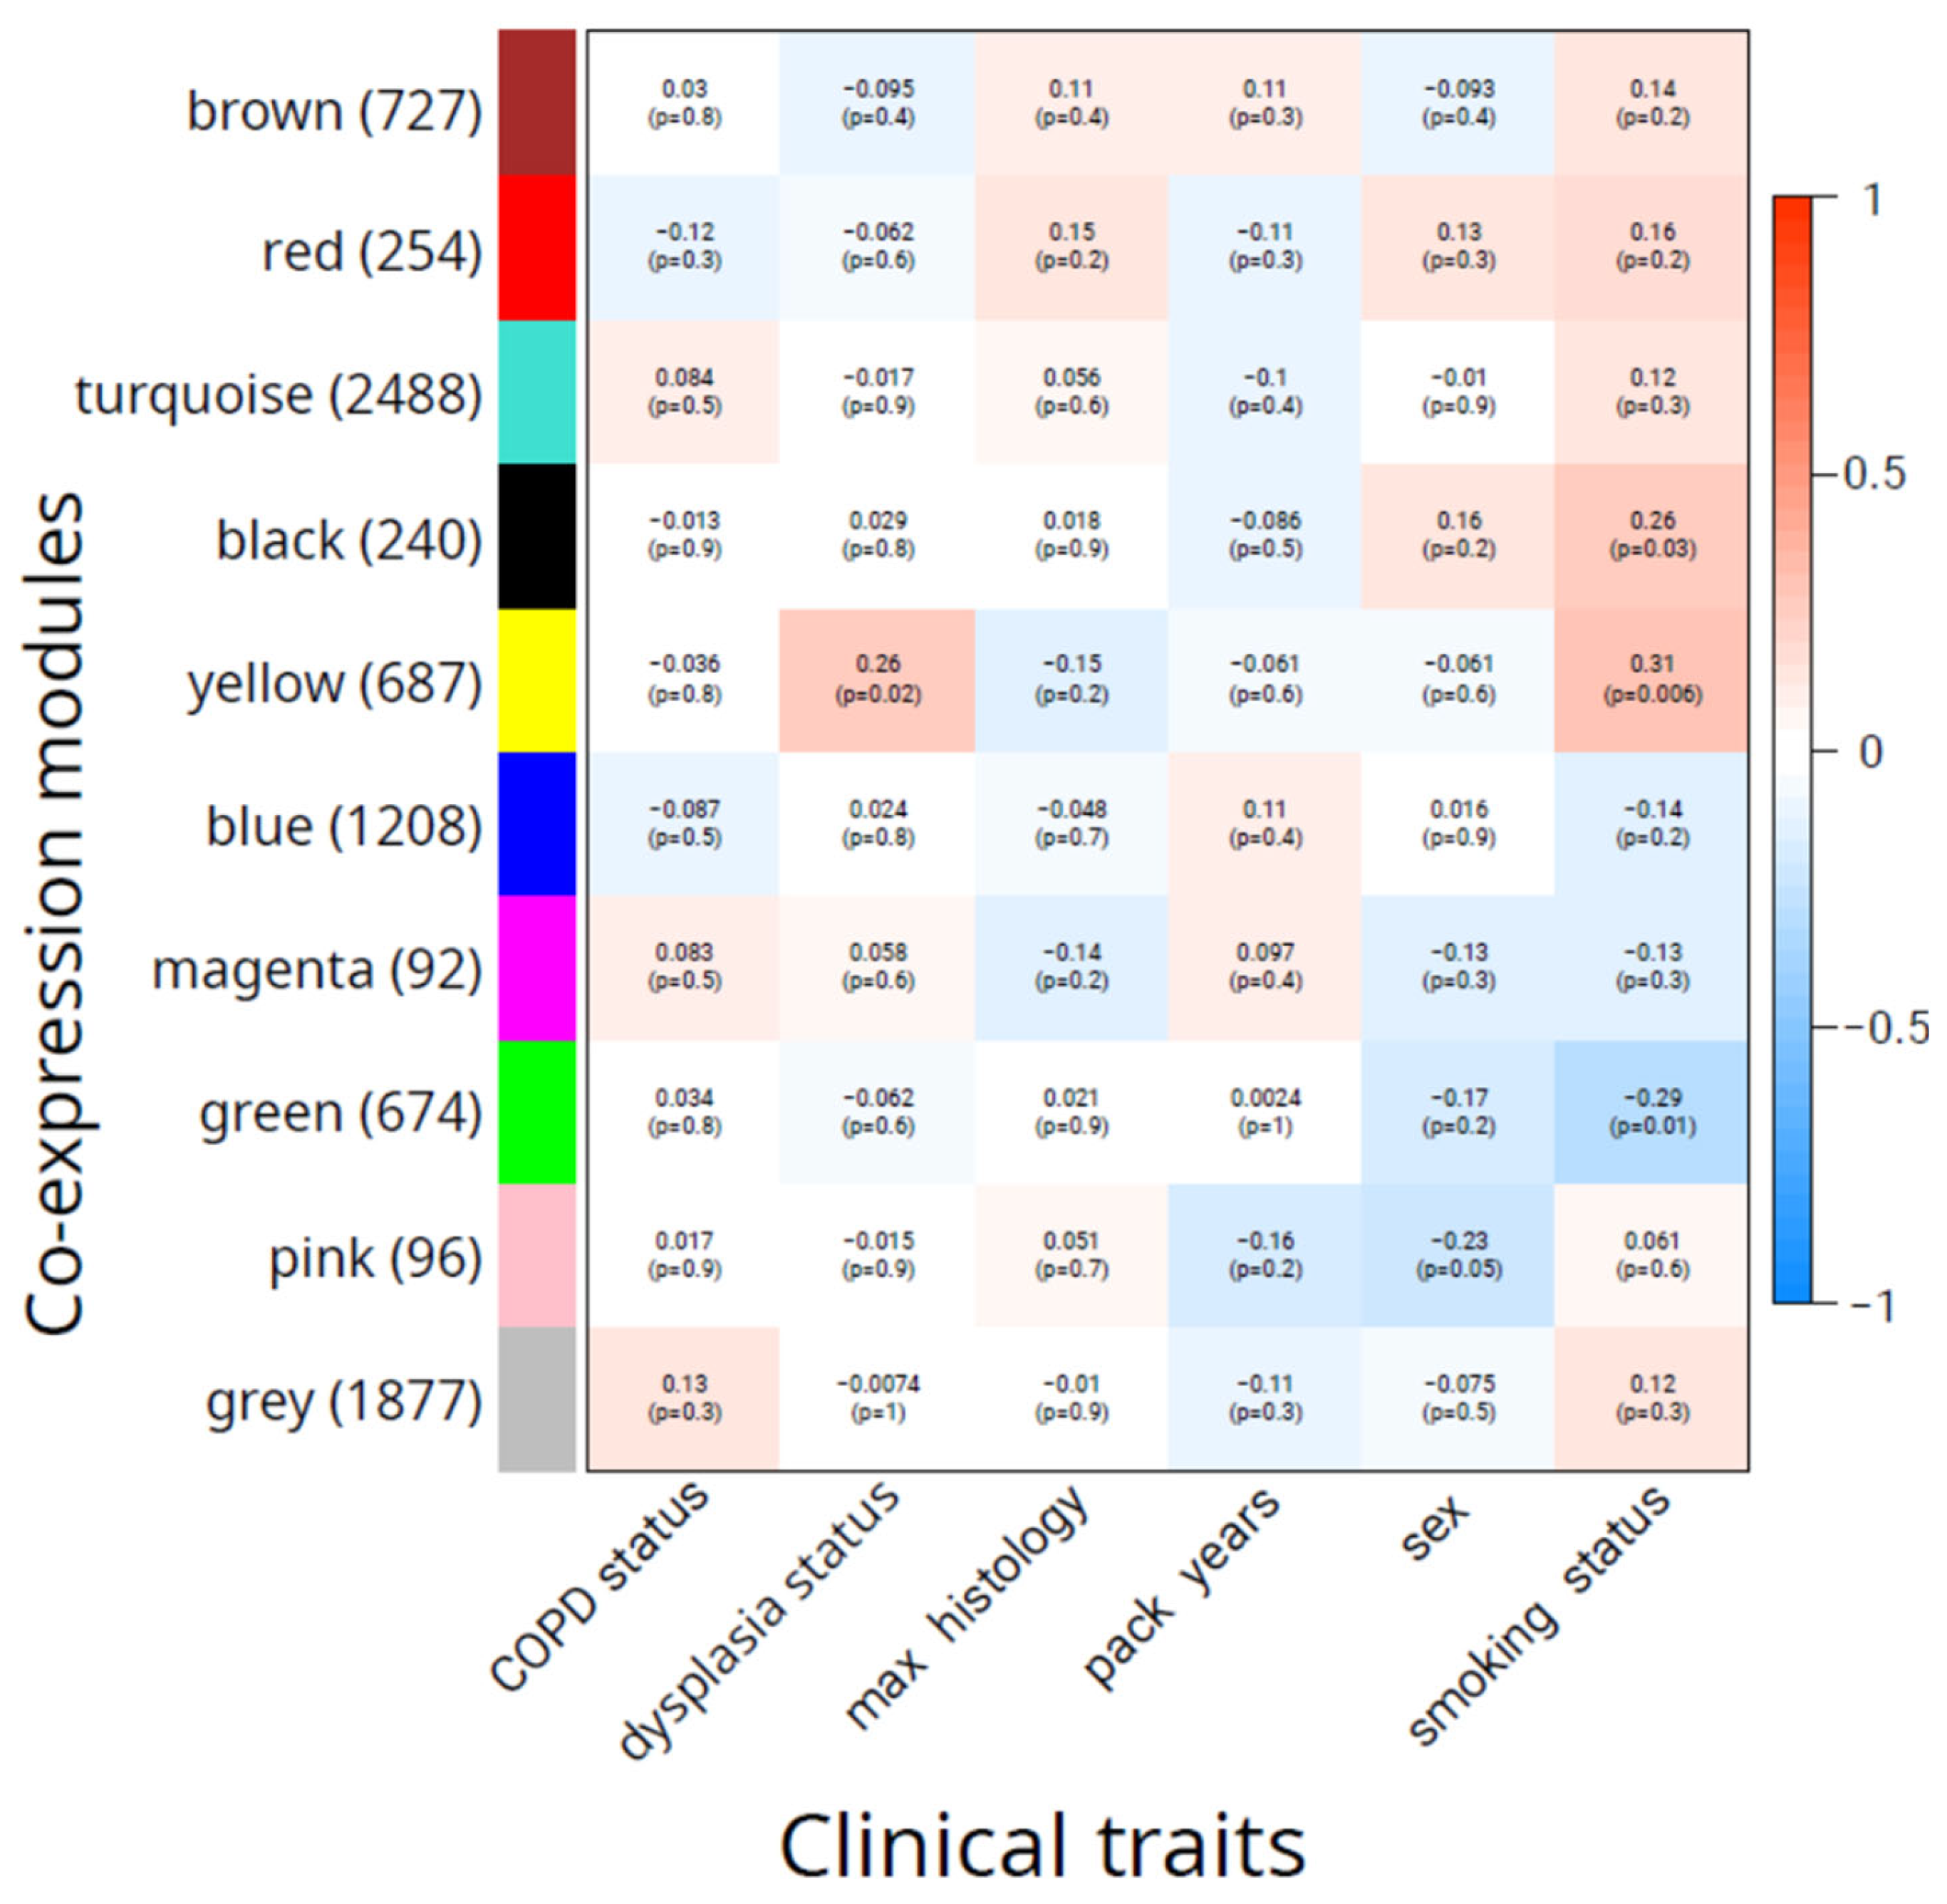
Figure 3.
Functional enrichment analysis of transcripts belonging to the "yellow" module. Treeplots for significantly enriched Gene Ontology terms for biological processes (A) and cellular components (B). The circle size is proportional to the number of genes annotated as belonging to the term, the circle color encodes the adjusted p-value of enrichment significance. Gene-concept networks for top-5 significantly enriched Gene Ontology terms for biological processes (C) and cellular components (D).
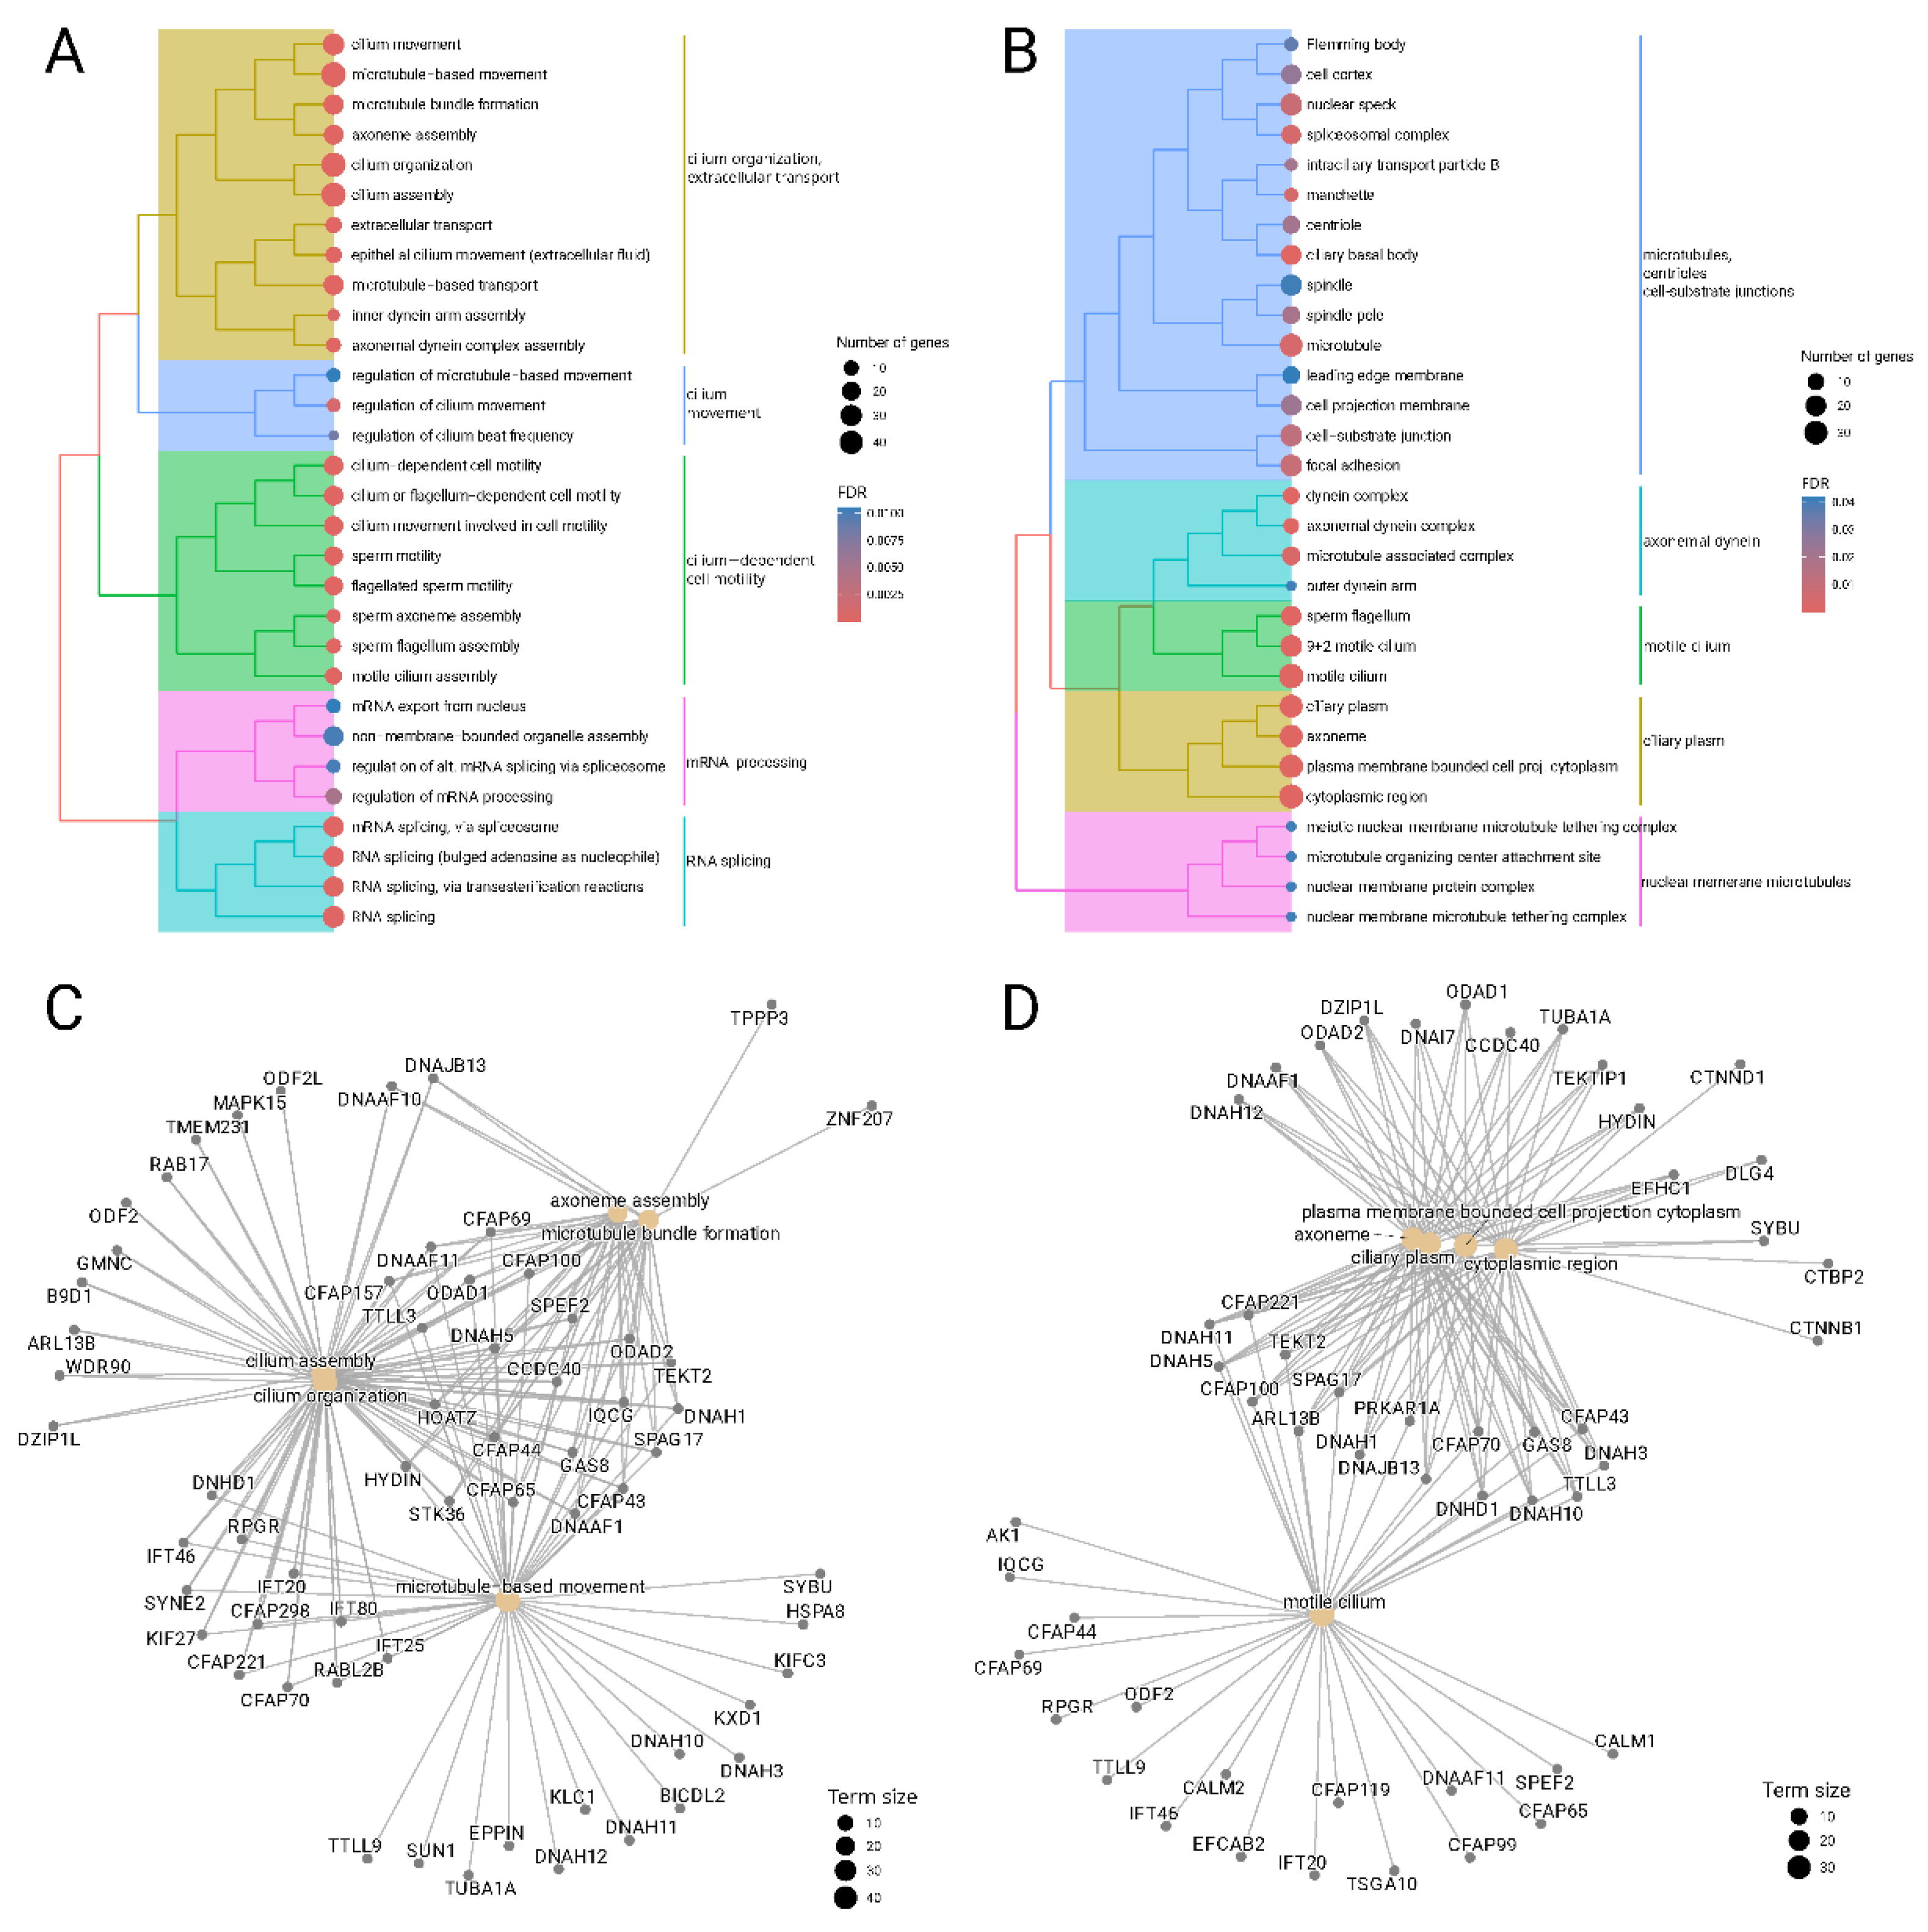
Figure 4.
Network produced by Enrichr-KG, which links the top enriched terms with the hubs from the "yellow" module. Transcripts and genes having at least two connections to the neighboring nodes are visualized.
Figure 4.
Network produced by Enrichr-KG, which links the top enriched terms with the hubs from the "yellow" module. Transcripts and genes having at least two connections to the neighboring nodes are visualized.
Disclaimer/Publisher’s Note: The statements, opinions and data contained in all publications are solely those of the individual author(s) and contributor(s) and not of MDPI and/or the editor(s). MDPI and/or the editor(s) disclaim responsibility for any injury to people or property resulting from any ideas, methods, instructions or products referred to in the content. |
© 2024 by the authors. Licensee MDPI, Basel, Switzerland. This article is an open access article distributed under the terms and conditions of the Creative Commons Attribution (CC BY) license (http://creativecommons.org/licenses/by/4.0/).
Copyright: This open access article is published under a Creative Commons CC BY 4.0 license, which permit the free download, distribution, and reuse, provided that the author and preprint are cited in any reuse.


