Submitted:
17 April 2024
Posted:
18 April 2024
You are already at the latest version
Abstract
Reliable prediction of infectious disease is an essential need for public health organizations to minimize or prevent the disease's spread. With the increase of data growth in the healthcare sector, accurate analysis of such data helps for early disease detection and better patient care. With the availability of huge data, it is a great deal for predicting and handling an epidemic occurrence. To control the epidemic disease, a new Artificial Intelligence called Manhattan Hessian Linear Feature Embedding Based Tucker Congruence Deep Convolutional Network (MHLFE-TCDCN) is introduced with higher accuracy and minimum time consumption. The MIoT device is used to collect the data from the patient body. The proposed MHLFE-TCDCN includes two major processes namely feature selection and classification with multiple layers such as input, two hidden layers, and one output layer. First, the feature selection process is performed using the Manhattan Hessian Locally Linear Embedding technique in the first hidden layer to minimize the dimensionality and time complexity. After selecting the feature, the classification is performed using the Tucker coefficient of congruence regression. The Tucker coefficient of congruence measures the similarity between the training and testing disease data. A positive similarity level is used to accurately identify the disease at the output layer based on the similarity measure. Experimental assessment is carried out with various parameters such as accuracy, precision, recall, F-measure, and computational time concerning several numbers of patient data. The quantitative results and discussion that the proposed MHLFE-TCDCN technique achieves higher accuracy with minimal computation time as compared to the conventional methods.
Keywords:
Cloud
; Epidemic Disease Control
; feature selection
; Deep Convolutional Network
; Hessian Locally Linear Embedding technique
; Manhattan distance measure
; Tucker coefficient of congruence regression
1. Introduction
The spread of infectious diseases around the world has changed and influenced the daily lives of individuals largely. Therefore, early detection of infectious diseases is essential in smart healthcare services. Application of the Medical Internet of Things (MIoT) along with Artificial intelligence techniques is used for early detection of infectious disease to reduce the unexpected rise in the number of disease cases in a particular geographical area. MIoT is connected to the internet to collect valuable data, and artificial intelligence techniques utilize this data and analyze the symptoms to predict the disease. Several research works have been developed for disease prediction.
A Deep-LSTM ensemble model was introduced in [1] to find the global pandemic of Covid-19 cases. But it was impossible for proving the accurate results while increasing the Covid-19 cases exponentially without the inception of Artificial Intelligence. An Interaction-Temporal Graph Convolution Network (IT-GCN) was developed in [2] to investigate the pandemic data. However, higher prediction accuracy was not obtained with minimum time consumption.
A smart health monitoring system was introduced in [3] to identify the patients’ information and find the COVID-19 disease. The deployment of machine learning algorithms was not implemented to identify the probable COVID-19 patients from large, populated data. A robust IoT and deep learning-based multi-modal data classification technique were developed in [4] for the accurate prediction of COVID 19. But the time complexity of prediction was not minimized.
Supervised machine learning approaches were developed in [5] to predict the COVID-19 disease. However, the time consumption of accurate Covid-19 prediction was not minimized. A recurrent and convolutional neural network model was developed in [6] to find the COVID-19 disease. But the accurate prediction was not performed to take decisions accordingly.
A hybrid artificial intelligence (AI) method was developed in [7] for COVID-19 prediction. However, the method failed to achieve the accuracy of COVID-19 prediction. An IoT-based deep learning approach was developed in [8] for early assessment of Covid-19. But it failed to handle the vast amount of data generated by IoT devices. An artificial intelligence technique based on a deep convolutional neural network (CNN) was developed in [9] to detect COVID. However, the deep feature analysis was not carried out to minimize the complexity. An integrated IoT framework was introduced in [10] using Long Short-Term Memory (LSTM). However, the designed framework failed to enhance the feasibility of COVID-19.
The major contribution of the proposed MHLFE-TCDCN is explained as given below,
- 1)
- A novel MHLFE-TCDCN is introduced for accurate prediction to minimize the Epidemic Disease Control using deep learning algorithms instead of the conventional healthcare system to identify an infected person.
- 2)
- To minimize the prediction time of epidemic disease, MHLFE-TCDCN uses the Manhattan Hessian Locally Linear Embedding technique in the first hidden layer of deep convolutive neural network for minimizing the dimensionality of the dataset. The Hessian Locally Linear Embedding finds the relevant features based on the Manhattan distance measure between the two features. Based on a distance measure, the relevant and irrelevant features are identified from the dataset.
- 3)
- To improve the prediction accuracy of epidemic disease, MHLFE-TCDCN performs the classification using the Tucker coefficient of congruence regression. The regression uses the Tucker coefficient of congruence similarity for deeply analyzing the training and testing disease data. Based on the similarity estimation between the data, a positive similarity level is used to accurately predict the disease at the output layer. This helps to minimize the incorrect disease prediction.
- 4)
- Finally, a comprehensive experimental assessment of the MHLFE-TCDCN technique is carried out with two baseline prediction approaches with various performance metrics.
The rest of the article is organized as follows: In Section 2, related work reviews the articles discussed using state-of-the-art methods followed by the detailed discussion of the proposed MHLFE-TCDCN technique is presented in Section 3. In Section 4, experimental settings with data set descriptions are presented. Section 5 discusses the result of the experiment by making a comparison with the state-of-the-art methods. Finally, concluding remarks are provided in Section 6.
2. Related Works
A federated machine learning model was developed in [11] to improve the COVID-19 prediction. But deep feature analysis was not carried out to further improve the prediction accuracy. A stacking ensemble learning technique was introduced in [12] based on deep neural networks for the early prediction of COVID-19 survivors. However, it failed to implement the feature selection techniques to deal with high-dimensional data.
A Cauchy Exploration Strategy Beetle Antennae Search and Adaptive Network-based Fuzzy Inference System (CESBAS-ANFIS) was introduced in [13] for improving the Covid-19 prediction. However, it failed to apply an efficient machine learning method for accurate classification and regression to decrease the prediction time. Three hybrid approaches were developed in [14] for forecasting COVID-19 time series data. But designed approaches failed to extract the informative features from the time-series dataset and incorporate them into the deep learning models.
An Adaptive Neuro-Fuzzy Inference System (ANFIS) was introduced in [15] for early detection of Coronavirus Disease by determining the significant features. But the performance of time consumption for disease detection was not analyzed. An intelligent healthcare system was introduced in [16] that integrates IoT-cloud technologies and deep learning (DL) for COVID-19 detection. However, the accuracy of COVID-19 detection was not improved in medical diagnosis.
A novel IoT enabled Depth wise separable convolution neural network (DWS-CNN) with a Deep support vector machine (DSVM) was developed in [17] for COVID-19 diagnosis and classification. But it failed to attain maximum classification results. A Deep Learning-based approach was introduced in [18] for detecting the Novel Coronavirus (COVID-19) Pandemic. However, the complexity of detection was not minimized. Artificial Intelligence technique was introduced in [19] for tackling the COVID-19 pandemic. However, it failed to apply to the smart-health care industry. A hybrid model was developed in [20] for predicting the COVID-19. But the time consumption of COVID-19 prediction was not minimized.
3. Proposed Methodology
The smart healthcare system (MIoT) for disease diagnosis concentrates on the development of healthcare services. Due to the improvements in information technology, the smart healthcare system provides the patients’ information individually to the doctors. Then the doctor differentiates the data of the particular patient and stores it on the cloud. Therefore, the technology of MIoT makes the monitoring system more flexible for diagnosing and exact treatment to make patients’ lives easier. A novel MHLFE-TCDCN is introduced in this section to control the epidemic disease by predicting the disease at an earlier stage with higher accuracy and minimum time consumption.
Figure 1 given above illustrates the architecture of the proposed MHLFE-TCDCN to obtain the accurate Epidemic Disease prediction with higher accuracy and lesser time consumption. First, the Medical IoT provides the connectivity of physical objects (i.e., patients) with the Internet, and information transmitted through the Internet. The IoT concept has been developed using Smart devices like sensors. This smart device helps to capture data and distribute it to accomplish the required task. Medical IoT and cloud computing are mutually dependent on each other. The integration of these two technologies becomes a great platform for monitoring patients at the remote site providing uninterrupted health information to the doctors.
Due to a sudden increasing the number of patients due to Epidemic conditions, it is significantly very important to monitor patients’ health condition constantly before any serious infection occur. According to transferring the large volume of patient-sensitive health data to the doctors, dealing with early detection of patient health status is a major concern and a challenging problem. Therefore, a novel technique called MHLFE-TCDCN is introduced for improving the health status prediction resulting in controlling the widespread occurrence of an infectious disease.
The features ‘ and the patient data are collected from the MIoT device and stored into the cloud server. Then the MHLFE-TCDCN technique performs two processes namely feature selection and classification. At first, the Hessian Locally Linear Embedding technique feature projection is applied for selecting the relevant features and removing the other features. Then the selected features are used for classification using Tucker coefficient of congruence regression. The different processes are implemented in the deep neural network.
Above Figure 2 illustrates a schematic diagram of the Deep Convolutional Network including the input layer, hidden layer, and output layer. From the above figure, the input layer consists of features. The first hidden layer represents the feature selection layer whereas the second hidden layer performs classification. Finally, the result of the output layer provides the output disease diagnosing results.
3.1. Manhattan Hessian Locally-Linear Embedding Technique
The proposed MHLFE-TCDCN first performs the feature selection in the first hidden layer. The feature selection is especially important while handling a large dataset. The irrelevant features possibly add more noise than valuable information and degrade the classification performance. Therefore, a feature selection process is applied for minimizing the training and consumption time. The proposed MHLFE-TCDCN uses the Manhattan Hessian Locally-Linear Embedding technique for finding the significant features for accurate classification. The Hessian Locally-Linear Embedding is a dimensionality reduction technique that helps to transform data from a high-dimensional space into a low-dimensional space. Hessian Locally-Linear Embedding is used for finding a set of the nearest neighbors of each point. It is used for finding a set of the nearest neighbors of each point through the Manhattan distance measure. In this work, a Manhattan Hessian Locally-Linear feature Embedding finds the set of relevant features based on the nearest neighbor’s concept using Manhattan distance.
Let us consider the number of features in the dataset in the high dimensional space. The Hessian Locally-Linear Embedding technique projects the features from the high dimensional space into low dimensional space. The Manhattan distance formula.
From (1), indicates a Manhattan distance between the two features and the nearest features ‘ ’ and the weight vector ‘’. The sum of every row of the weight vector is normalized into ‘1’. If the distances between these two features are equal to zero, then the features are said to be similar. Otherwise, the features are said to be irrelevant.
From (2), indicates an output of a Manhattan Hessian Locally-Linear feature Embedding technique. Based on a distance measure, the nearest neighbor feature i.e., relevant feature is selected for classification and the rest of the features are removed from the dataset. In this way, the proposed MHLFE-TCDCN transforms the relevant features from the high dimensional space into low dimensional space.
3.2. Tucker Coefficient of Congruence Regression-Based Disease Prediction
After the feature selection, early disease prediction of the patient is performed in the second hidden layer using the Tucker coefficient of congruence regression. The epidemic disease is controlled by finding the diagnosis at an earlier stage. Tucker coefficient of congruence regression is a machine learning technique in which the independent variable (i.e data) is partitioned into different classes based on relationships between the variables. The relationships between the variables are identified using the Tucker coefficient of congruence.
Figure 3 portrays the block diagram of the Tucker coefficient of congruence regression to analyze the training data and testing disease data. The relationship between these two are analyzed as given below,
Where ‘’ indicates Tucker coefficient of congruence, indicates a training patient data, ‘’ indicates a testing patient data, denotes a squared score of testing patient data ‘’ and denotes a squared score of training patient data ‘’. The resultant value of the coefficient provides the range between -1 and +1.
Where ‘’ indicates a similarity between the training and testing patient data. Based on the above estimation, the positive similarity level is used to predict the disease at an earlier stage. The MHLFE-TCDCN algorithmic process is described as given below,
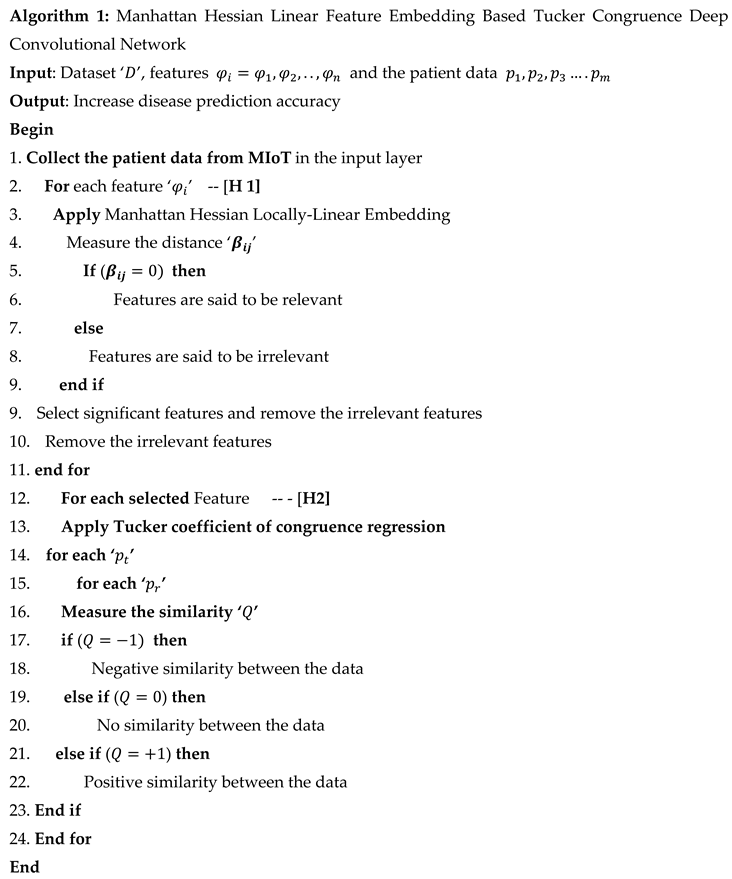
Algorithm 1 describes the step-by-step process of Manhattan Hessian Linear Feature Embedding Based Tucker Congruence Deep Convolutional Network. The number of features and data are collected from the dataset. After that, the Manhattan Hessian Locally Linear Feature Embedding is applied in the first hidden layer for finding the relevant features based on Manhattan distance measure to minimize the time complexity of classification. In the second hidden layer, the Tucker coefficient of congruence regression is applied to analyze the training and testing disease data. The similarity between training and testing disease data is used to predict the disease with higher accuracy in the output layer.
4. Experimental System
In this section, experimental evaluation of the proposed MHLFE-TCDCN technique and existing deep-LSTM ensemble model [1], IT-GCN [2] are carried out in Java language using Novel Corona Virus 2019 Dataset. The dataset has daily collected covid-19 affected cases information. The dataset comprises the different CSV files such as
- 1)
- covid_19_data.csv,
- 2)
- time_series_covid_19_confirmed.csv,
- 3)
- time_series_covid_19_confirmed_US.csv,
- 4)
- time_series_covid_19_deaths. csv,
- 5)
- time_series_covid_19_deaths_US.csv,
The above said files are used for conducting the experiments to identify the disease at an earlier stage for avoiding the Epidemic Disease Control. First, the feature selection process is performed to select the significant features and perform classification for identifying the confirmed cases (i.e., Corona Virus 2019 disease affected).
5. Results and Discussion
The results and discussion of the proposed MHLFE-TCDCN technique and existing deep-LSTM ensemble model [1], IT-GCN [2] with the different parameters such as prediction accuracy, precision, recall, and f-measure and prediction time are described in this section. Performance results are evaluated with the help of table values and graphical representations.
5.1. Impact of Prediction Accuracy
Prediction Accuracy is used to find the number of patient data that are correctly predicted as disease or not. The prediction accuracy is formulated as,
Where, denotes a prediction accuracy, indicates a true positive, denotes a false positive, indicates the true negative, represents the false negative. The accuracy is measured in terms of percentage (%).
Table 1 provides the performance outcomes of prediction accuracy versus number of patient data. The prediction accuracy is measured using three different methods namely the MHLFE-TCDCN technique and existing deep-LSTM ensemble model [1], IT-GCN [2]. Among the three methods, namely, the MHLFE-TCDCN technique provides superior performance than the conventional methods. This is proved through statistical estimation. Let us consider the number of data is 1000 for conducting the experiments. By applying the MHLFE-TCDCN technique, the observed prediction accuracy was found to be 92%. Whereas the prediction accuracy of existing Deep-LSTM [1], IT-GCN [2] are 88% and 86% respectively.
Similarly, different outcomes are observed for each method. Finally, the performance of the MHLFE-TCDCN technique is compared to the existing methods. The comparison results indicate that the performance of prediction accuracy is comparatively improved by 4% and 7% when compared to Deep-LSTM [1], IT-GCN [2].
Figure 4 given above illustrates the graphical diagram of the Covid 19 disease epidemic prediction accuracy with a few patient data. The performance of accuracy is measured using three different prediction methods namely the MHLFE-TCDCN technique and existing deep-LSTM ensemble model [1], IT-GCN [2]. As shown in Figure 4, the accuracy of proposed and existing [1] and [2] are represented by three dissimilar colors. From the presented graphical results, it is observed that the MHLFE-TCDCN technique considerably outperforms the existing approaches. This is due to the application of the Tucker coefficient of congruence regression into the Deep Convolutional Network. The regression function analyzes the testing and training disease data by applying the Tucker coefficient of congruence similarity measures for identifying the confirmed covid 19 cases. The earlier prediction of the Covid 19 helps to control the disease spread.
5.2. Impact of Precision
It is measured based on true positives and false negatives. The Precision is measured using the given formula,
Where, indicates a Precision, symbolizes the true positive, represents the false positive. The Precision is measured in percentage (%).
Table 2 and Figure 5 provide the performance of precision versus the number of patient data taken in the ranges from 1000 to 10000. From the observed results, the performance of the MHLFE-TCDCN technique is comparatively higher than the conventional methods. This major reason for this improvement is to increase the true positive and minimize the false negative. The MHLFE-TCDCN technique uses the Deep Convolutional Network for analyzing the training and testing data by using the Tucker coefficient of congruence regression. The deep analysis of training and testing data using similarity measures minimizes the incorrect disease prediction and increases the accurate prediction. Let us consider the data samples as input for calculating the precision, the performance of the MHLFE-TCDCN technique is 94.38%. Similarly, the performance of precision using [1] and [2] are 91.75% and 89.87% respectively. Likewise, different results are observed for all three methods. Then the percentages of the precision using the proposed technique are compared to existing results. The average values of ten comparison results indicate that the precision is considerably enhanced by 3% and 4% than the state-of-the-art methods.
5.3. Impact of Recall
The recall is used to determine the true positives and false negatives of disease prediction. It is formulated using the given formula,
Where ‘ ‘indicates a recall, represents the true positive, denotes the false negative. The recall is measured in percentage (%).
Table 3 and Figure 6 illustrate the performance investigation of recall against a number of input patient data samples is considered in the ranges from 1000 to 10000. The performances of recall using three methods are estimated based on the true positive and false negative. As shown in the graph, the performance of recall is found to be increased using MHLFE-TCDCN when compared to existing methods. By applying the deep learning classification, the testing disease samples, and training samples are analyzed with the help of the similarity measure. Based on the similarity values of the deep learning classifier, accurate classification results are obtained at the output layer of the deep learning classifier. Let us consider the 1000 patient data to measure the recall for all three methods. By applying the MHLFE-TCDCN technique, the observed recall value is 96.55%. Then the recall of the existing [1] and [2] are observed by 93.97%, 92.2% respectively. The average of ten comparison results shows that the specificity of the MHLFE-TCDCN technique is drastically increased by 2 % when compared to [1], 4% when compared to [2].
5.4. Impact of F-Measure
F-measure is measured as the mean of precision as well as recall. It is evaluated as given below, is computed by multiplying by the precision as well as recall and then dividing the result by the sum of these two measures.
Wheredenotes an F-measure is measured based on precision denotes a recall ‘’. F-measure is measured in terms of percentage (%).
Table 4 and Figure 7 illustrate the performance analysis of F-measure versus a number of input patient data taken in the ranges from 1000 to 10000. From the table and graphical results, the F-measure of the three methods is estimated based on precision as well as recall.
Among the three methods, the F-measure of the proposed MHLFE-TCDCN is comparatively higher than the other two existing methods. This improvement is achieved by increasing the precision as well as recall values. As a result, the MHLFE-TCDCN technique increases the true positive and minimizes the true negative, false negative and false positive. Let us consider the 1000 patient data to measure the f-measure for all three methods. By applying the BTFP-RKRDBNL technique, the f-measure of the MHLFE-TCDCN technique is 95.45%. The f-measure of the existing techniques Deep-LSTM ensemble model [1] and [2] is observed by 92.85%, 91.02% respectively. The average results indicate that the F-measure of the BTFP-RKRDBNL technique is considerably improved by 3% when compared to [1], 4% when compared to [2].
5.5. Impact of Prediction Time
It is defined as the amount of time taken by the algorithm to predict the disease. Therefore, time is mathematically calculated as follows,
Where, indicates a Disease prediction time, represents a number of data, denotes a time for predicting the single patient data (). Disease prediction time is measured in terms of milliseconds (ms).
The time consumption of COVID 19 disease prediction with respect to a number of patient data is given in Table 5. The observed experimentation results indicate that the disease prediction time is measured using three different methods namely the MHLFE-TCDCN technique and the existing deep-LSTM ensemble model [1], IT-GCN [2]. The observed results indicate that the MHLFE-TCDCN technique minimizes the disease prediction time when compared to the other two methods. Let us consider the number of patient data is 1000, the COVID 19 prediction time of using MHLFE-TCDCN is and time of the other two conventional methods [1] and [2] are observed to be and respectively. For each method, ten various results are observed with different counts of input data. Therefore, the overall performance results prove that the disease prediction time of MHLFE-TCDCN is significantly minimized by 11% and 19% when compared to [1] and [2] respectively.
Figure 8 demonstrates the graphical outcomes of the disease prediction time versus several patient data are taken from the Covid 19 dataset. The above graphical results indicate that the performance of disease prediction time of all the methods gets increased while increasing the number of patient data. Compared to other methods, MHLFE-TCDCN outperforms well in terms of achieving lesser prediction time. This is because of the applying the Manhattan Hessian Locally-Linear Embedding technique in the first hidden layer of deep learning technique for minimizing the dimensionality of the dataset by selecting the relevant features and removing the other features based on the distance measure. This process helps to minimize the time complexity of Covid 19 disease prediction.
6. Conclusions
Artificial intelligence is the major concept for analyzing the epidemic diseases diagnosis including coronavirus. These kinds of diseases are monitored by health care services to easily detect and prevent the Covid-19 pandemic. Artificial intelligence is used by health care services to diagnose this pandemic at an earlier stage. In this paper, a novel technique MHLFE-TCDCN is developed to analyze the spread of Covid-19 by early prediction through feature selection and classification. The technology of IoT is used for monitoring the patient’s health conditions and collecting the different data for alerting the physician or doctor accordingly. Then the MHLFE-TCDCN performs the feature selection to minimize the dimensionality of the dataset by applying Manhattan Hessian Locally-Linear Embedding. Then the proposed deep learning model uses the Tucker coefficient of congruence regression for measuring the similarity between the training and testing disease data. Based on the similarity measure, the disease is correctly predicted at the output layer. The experimental evaluation is conducted using the MHLFE-TCDCN technique and other existing methods with the novel COVID dataset. The observed results indicate that the performance of the MHLFE-TCDCN technique increases the prediction accuracy, precision, recall, f-measure, and prediction time than the state-of-the-art methods.
Acknowledgment
This research was funded by Princess Nourah bint Abdulrahman University Researchers Supporting Project number (PNURSP2024R716), Princess Nourah bint Abdulrahman University (PNU), P.O. Box 84428, 11671 Riyadh, Saudi Arabia.
References
- Shastri, S.; Singh, K.; Kumar, S.; Kour, P.; Mansotra, V. Deep-LSTM ensemble framework to forecast Covid-19: an insight to the global pandemic. Int. J. Inf. Technol. 2021, 13, 1291–1301. [Google Scholar] [CrossRef] [PubMed]
- Yu, Z.; Zheng, X.; Yang, Z.; Lu, B.; Li, X.; Fu, M. Interaction-Temporal GCN: A Hybrid Deep Framework For Covid-19 Pandemic Analysis. IEEE Open J. Eng. Med. Biol. 2021, 2, 97–103. [Google Scholar] [CrossRef] [PubMed]
- Vaneeta Bhardwaj, Rajat Joshi and Anshu Mli Gaur, “IoT-Based Smart Health Monitoring System for COVID-19”, SN Computer Science, Springer, vol 3, Article number: 137, 2022.
- Jayachitra, V.P. Nivetha, SNivetha, and RHariniR, “A cognitive IoT-based framework for effective diagnosis of COVID-19 using multimodal data”, Biomedical Signal Processing and Control, Elsevier, vol 70, pp. 1-16, 2021.
- L. J. Muhammad, Ebrahem A. Algehyne, Sani Sharif Usman, Abdulkadir Ahmad, Chinmay Chakraborty and I. A. Mohammed, “Supervised Machine Learning Models for Prediction of COVID-19 Infection using Epidemiology Dataset”, SN Computer Science, Springer, vol 2, pp. 1-13, 2021.
- Verma, H.; Mandal, S.; Gupta, A. Temporal deep learning architecture for prediction of COVID-19 cases in India. Expert Syst. Appl. 2022, 195, 116611–116611. [Google Scholar] [CrossRef] [PubMed]
- Zheng, N.; Du, S.; Wang, J.; Zhang, H.; Cui, W.; Kang, Z.; Yang, T.; Lou, B.; Chi, Y.; Long, H.; et al. Predicting COVID-19 in China Using Hybrid AI Model. IEEE Trans. Cybern. 2020, 50, 2891–2904. [Google Scholar] [CrossRef] [PubMed]
- Imran Ahmed, Awais Ahmad, Gwanggil Jeon, “An IoT-Based Deep Learning Framework for Early Assessment of Covid-19”, IEEE Internet of Things Journal, vol. 8, no. 21, pp. 15855 – 15862, 2021.
- Moutaz Alazab, Albara Awajan, Abdelwadood Mesleh, and Ajith Abraham, “COVID-19 Prediction and Detection Using Deep Learning”, International Journal of Computer Information Systems and Industrial Management Applications, vol. 12, pp. 168-181, 2020.
- Awais, M.; Raza, M.; Singh, N.; Bashir, K.; Manzoor, U.; Islam, S.U.; Rodrigues, J.J.P.C. LSTM-Based Emotion Detection Using Physiological Signals: IoT Framework for Healthcare and Distance Learning in COVID-19. IEEE Internet Things J. 2020, 8, 16863–16871. [Google Scholar] [CrossRef] [PubMed]
- Kallel, A.; Rekik, M.; Khemakhem, M. Hybrid-based framework for COVID-19 prediction via federated machine learning models. J. Supercomput. 2021, 78, 7078–7105. [Google Scholar] [CrossRef] [PubMed]
- Gupta, A.; Jain, V.; Singh, A. Stacking Ensemble-Based Intelligent Machine Learning Model for Predicting Post-COVID-19 Complications. New Gener. Comput. 2021, 40, 987–1007. [Google Scholar] [CrossRef] [PubMed]
- Zivkovic, M.; Bacanin, N.; Venkatachalam, K.; Nayyar, A.; Djordjevic, A.; Strumberger, I.; Al-Turjman, F. COVID-19 cases prediction by using hybrid machine learning and beetle antennae search approach. Sustain. Cities Soc. 2020, 66, 102669–102669. [Google Scholar] [CrossRef] [PubMed]
- Abbasimehr, H.; Paki, R. Prediction of COVID-19 confirmed cases combining deep learning methods and Bayesian optimization. Chaos, Solitons Fractals 2020, 142, 110511. [Google Scholar] [CrossRef]
- Iwendi, C.; Mahboob, K.; Khalid, Z.; Javed, A.R.; Rizwan, M.; Ghosh, U. Classification of COVID-19 individuals using adaptive neuro-fuzzy inference system. Multimedia Syst. 2021, 28, 1223–1237. [Google Scholar] [CrossRef]
- Nasser, N.; Emad-Ul-Haq, Q.; Imran, M.; Ali, A.; Razzak, I.; Al-Helali, A. A smart healthcare framework for detection and monitoring of COVID-19 using IoT and cloud computing. Neural Comput. Appl. 2021, 35, 13775–13789. [Google Scholar] [CrossRef] [PubMed]
- Dac-Nhuong Le, Velmurugan Subbiah Parvathy, Deepak Gupta, Ashish Khanna, Joel J. P. C. Rodrigues and K. Shankar, “IoT enabled depth wise separable convolution neural network with deep support vector machine for COVID-19 diagnosis and classification”, International Journal of Machine Learning and Cybernetics, Springer, vol.12, pp. 3235–3248, 2021.
- Asraf, A.; Islam, Z.; Haque, R.; Islam, M. Deep Learning Applications to Combat Novel Coronavirus (COVID-19) Pandemic. SN Comput. Sci. 2020, 1, 363. [Google Scholar] [CrossRef] [PubMed]
- Swayamsiddha, S.; Prashant, K.; Shaw, D.; Mohanty, C. The prospective of Artificial Intelligence in COVID-19 Pandemic. Heal. Technol. 2021, 11, 1311–1320. [Google Scholar] [CrossRef] [PubMed]
- Ossa, L.F.C.; Chamoso, P.; Arango-López, J.; Pinto-Santos, F.; Isaza, G.A.; Santa-Cruz-González, C.; Ceballos-Marquez, A.; Hernández, G.; Corchado, J.M. A Hybrid Model for COVID-19 Monitoring and Prediction. Electronics 2021, 10, 799. [Google Scholar] [CrossRef]
Figure 1.
architecture of MHLFE-TCDCN.
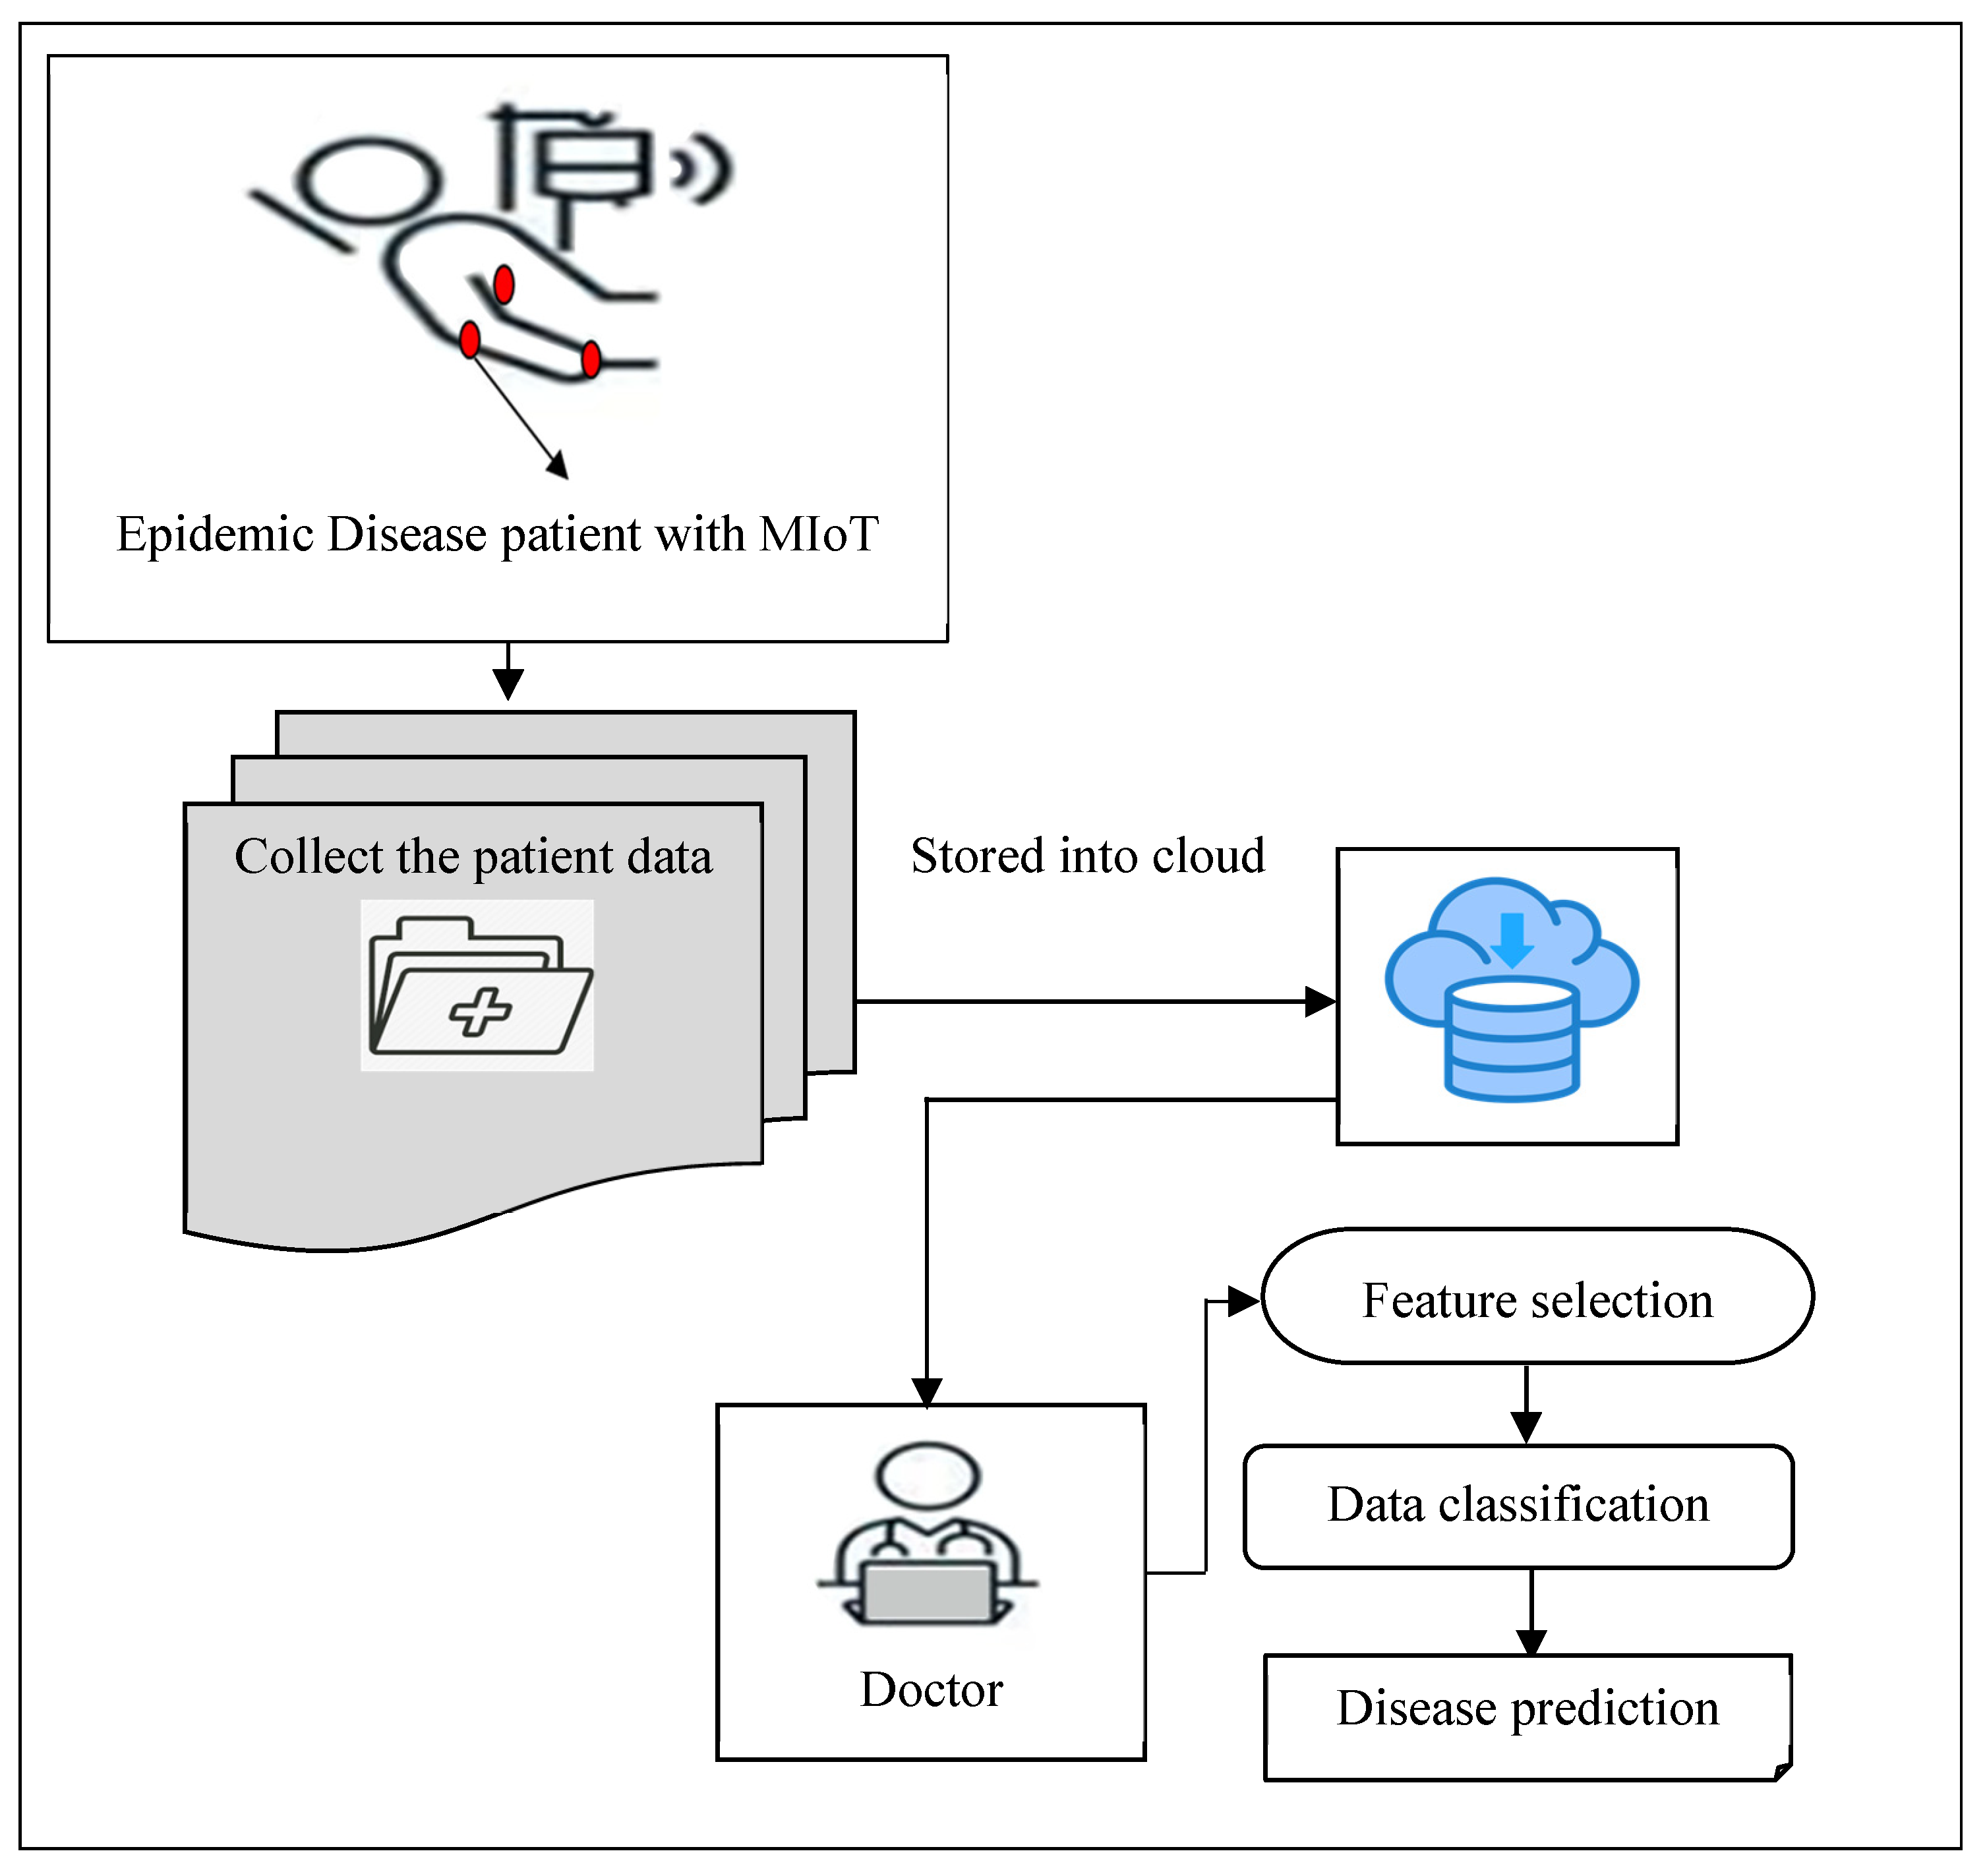
Figure 2.
Schematic diagram of the Deep Convolutional Network.
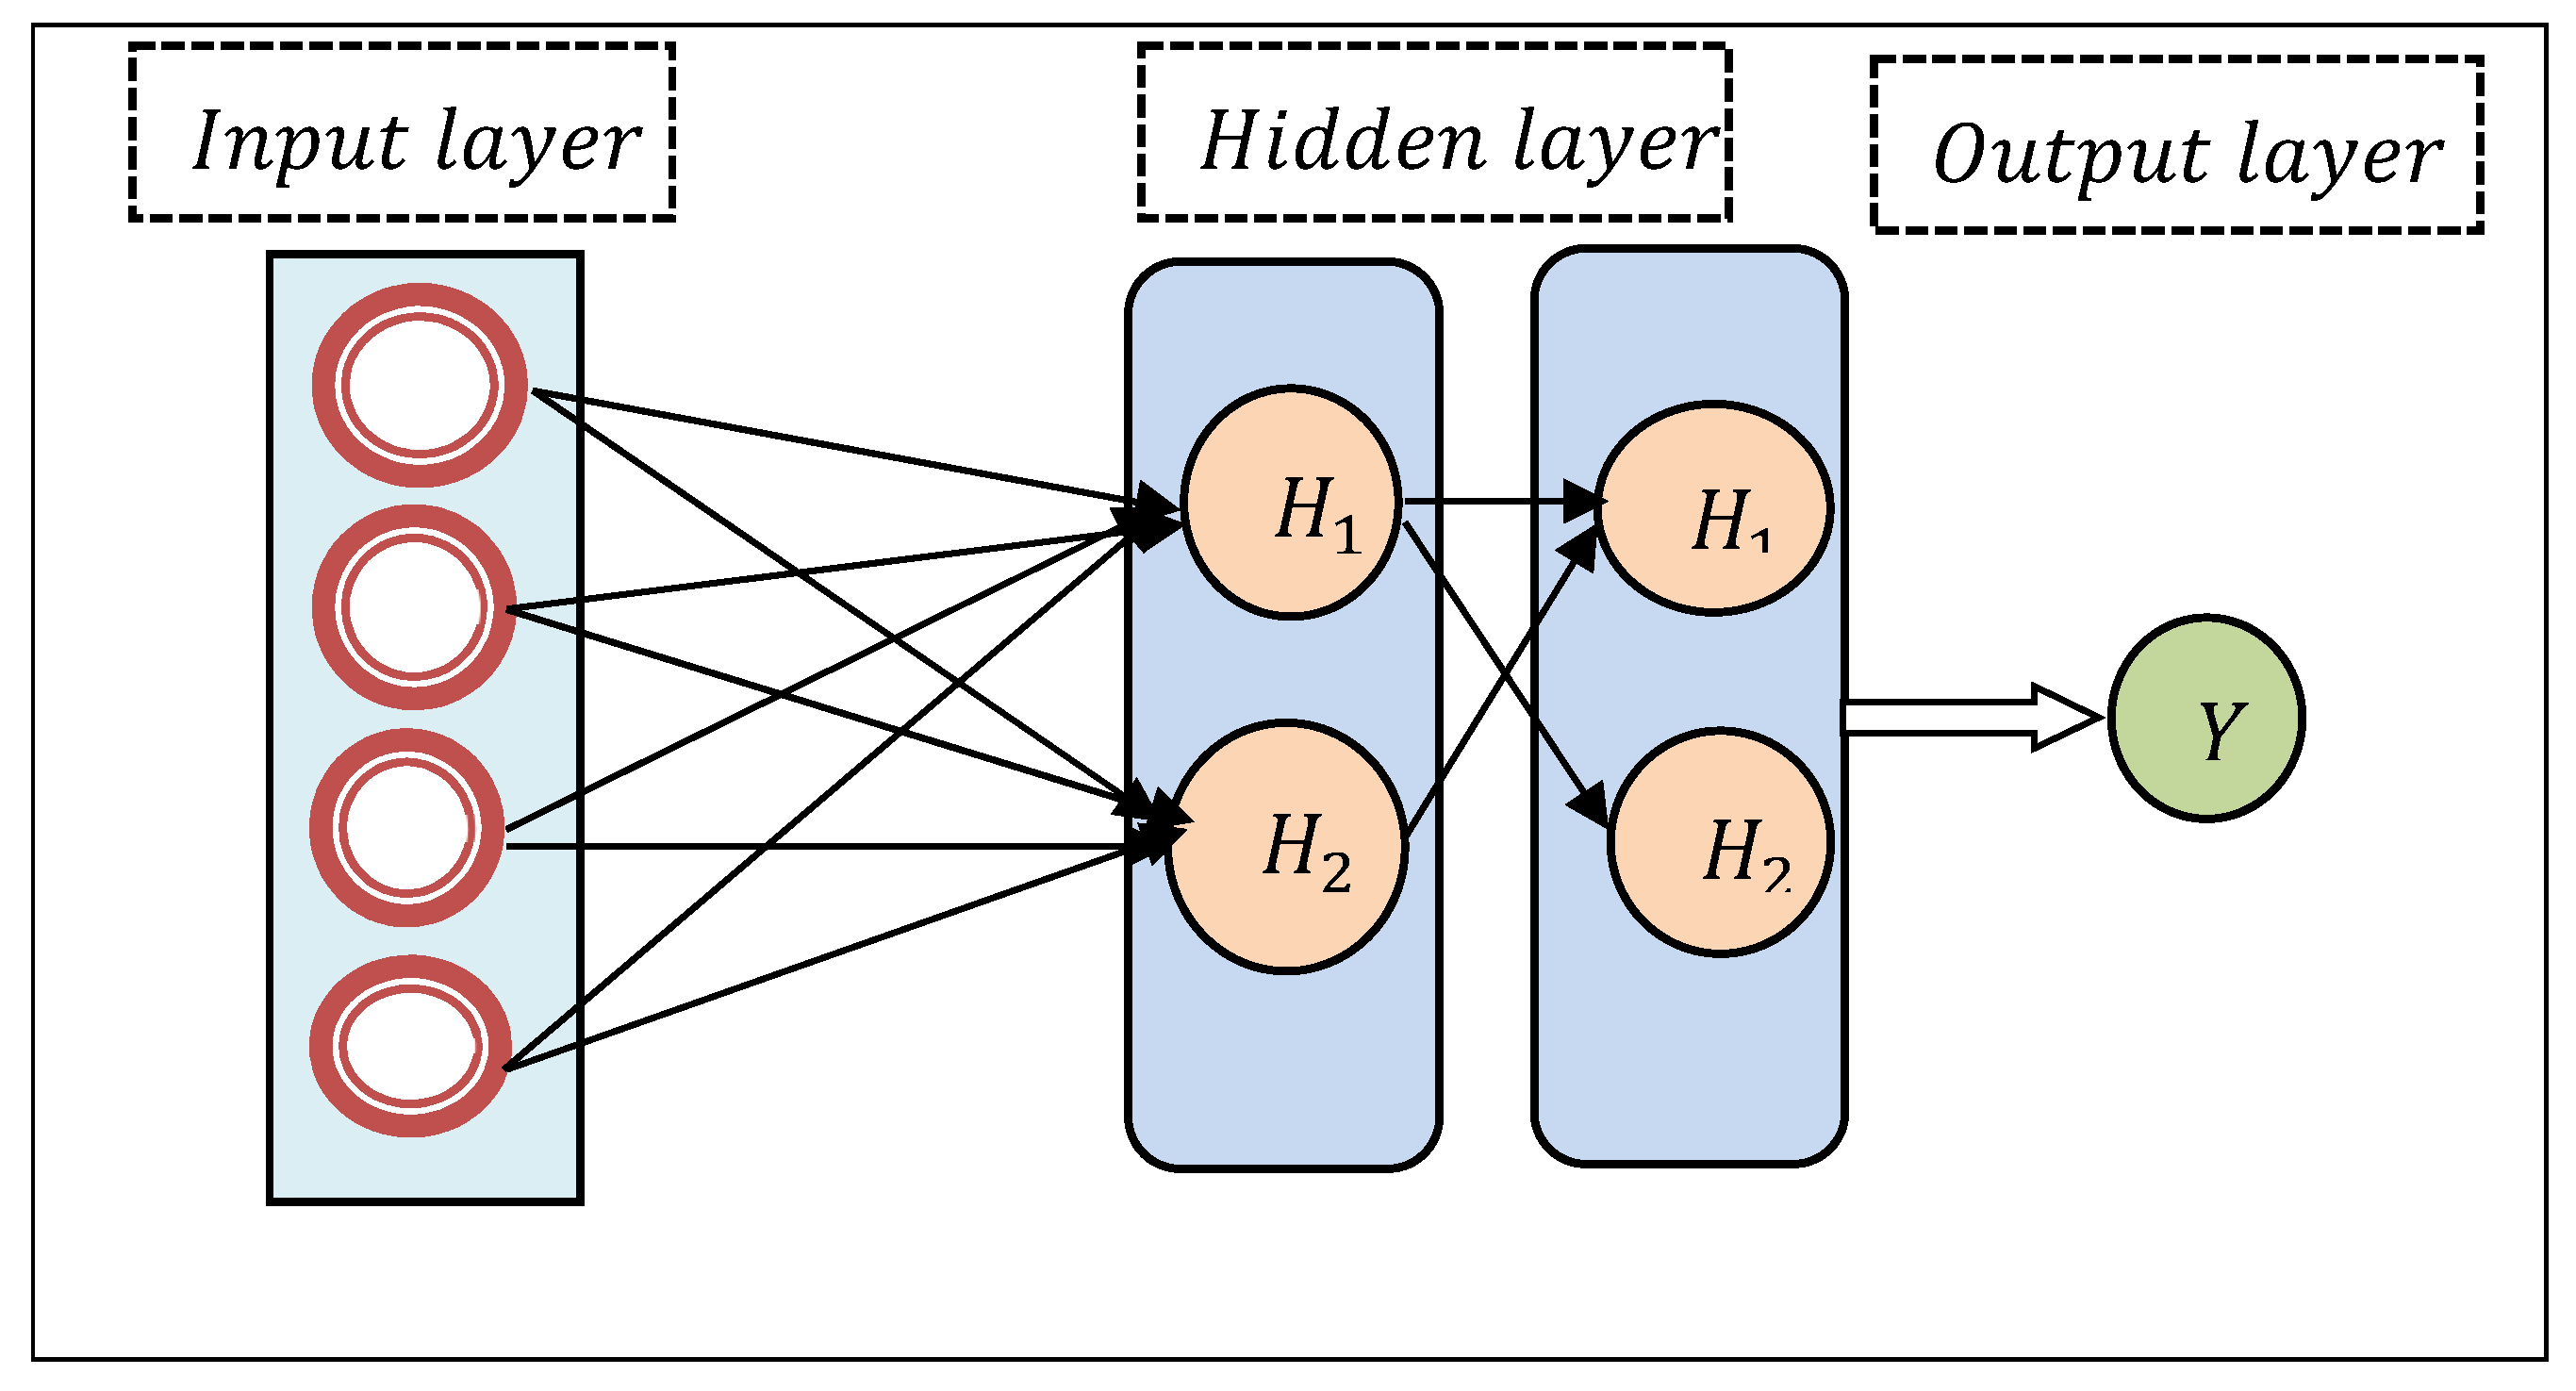
Figure 3.
Block diagram of Tucker coefficient of congruence regression.
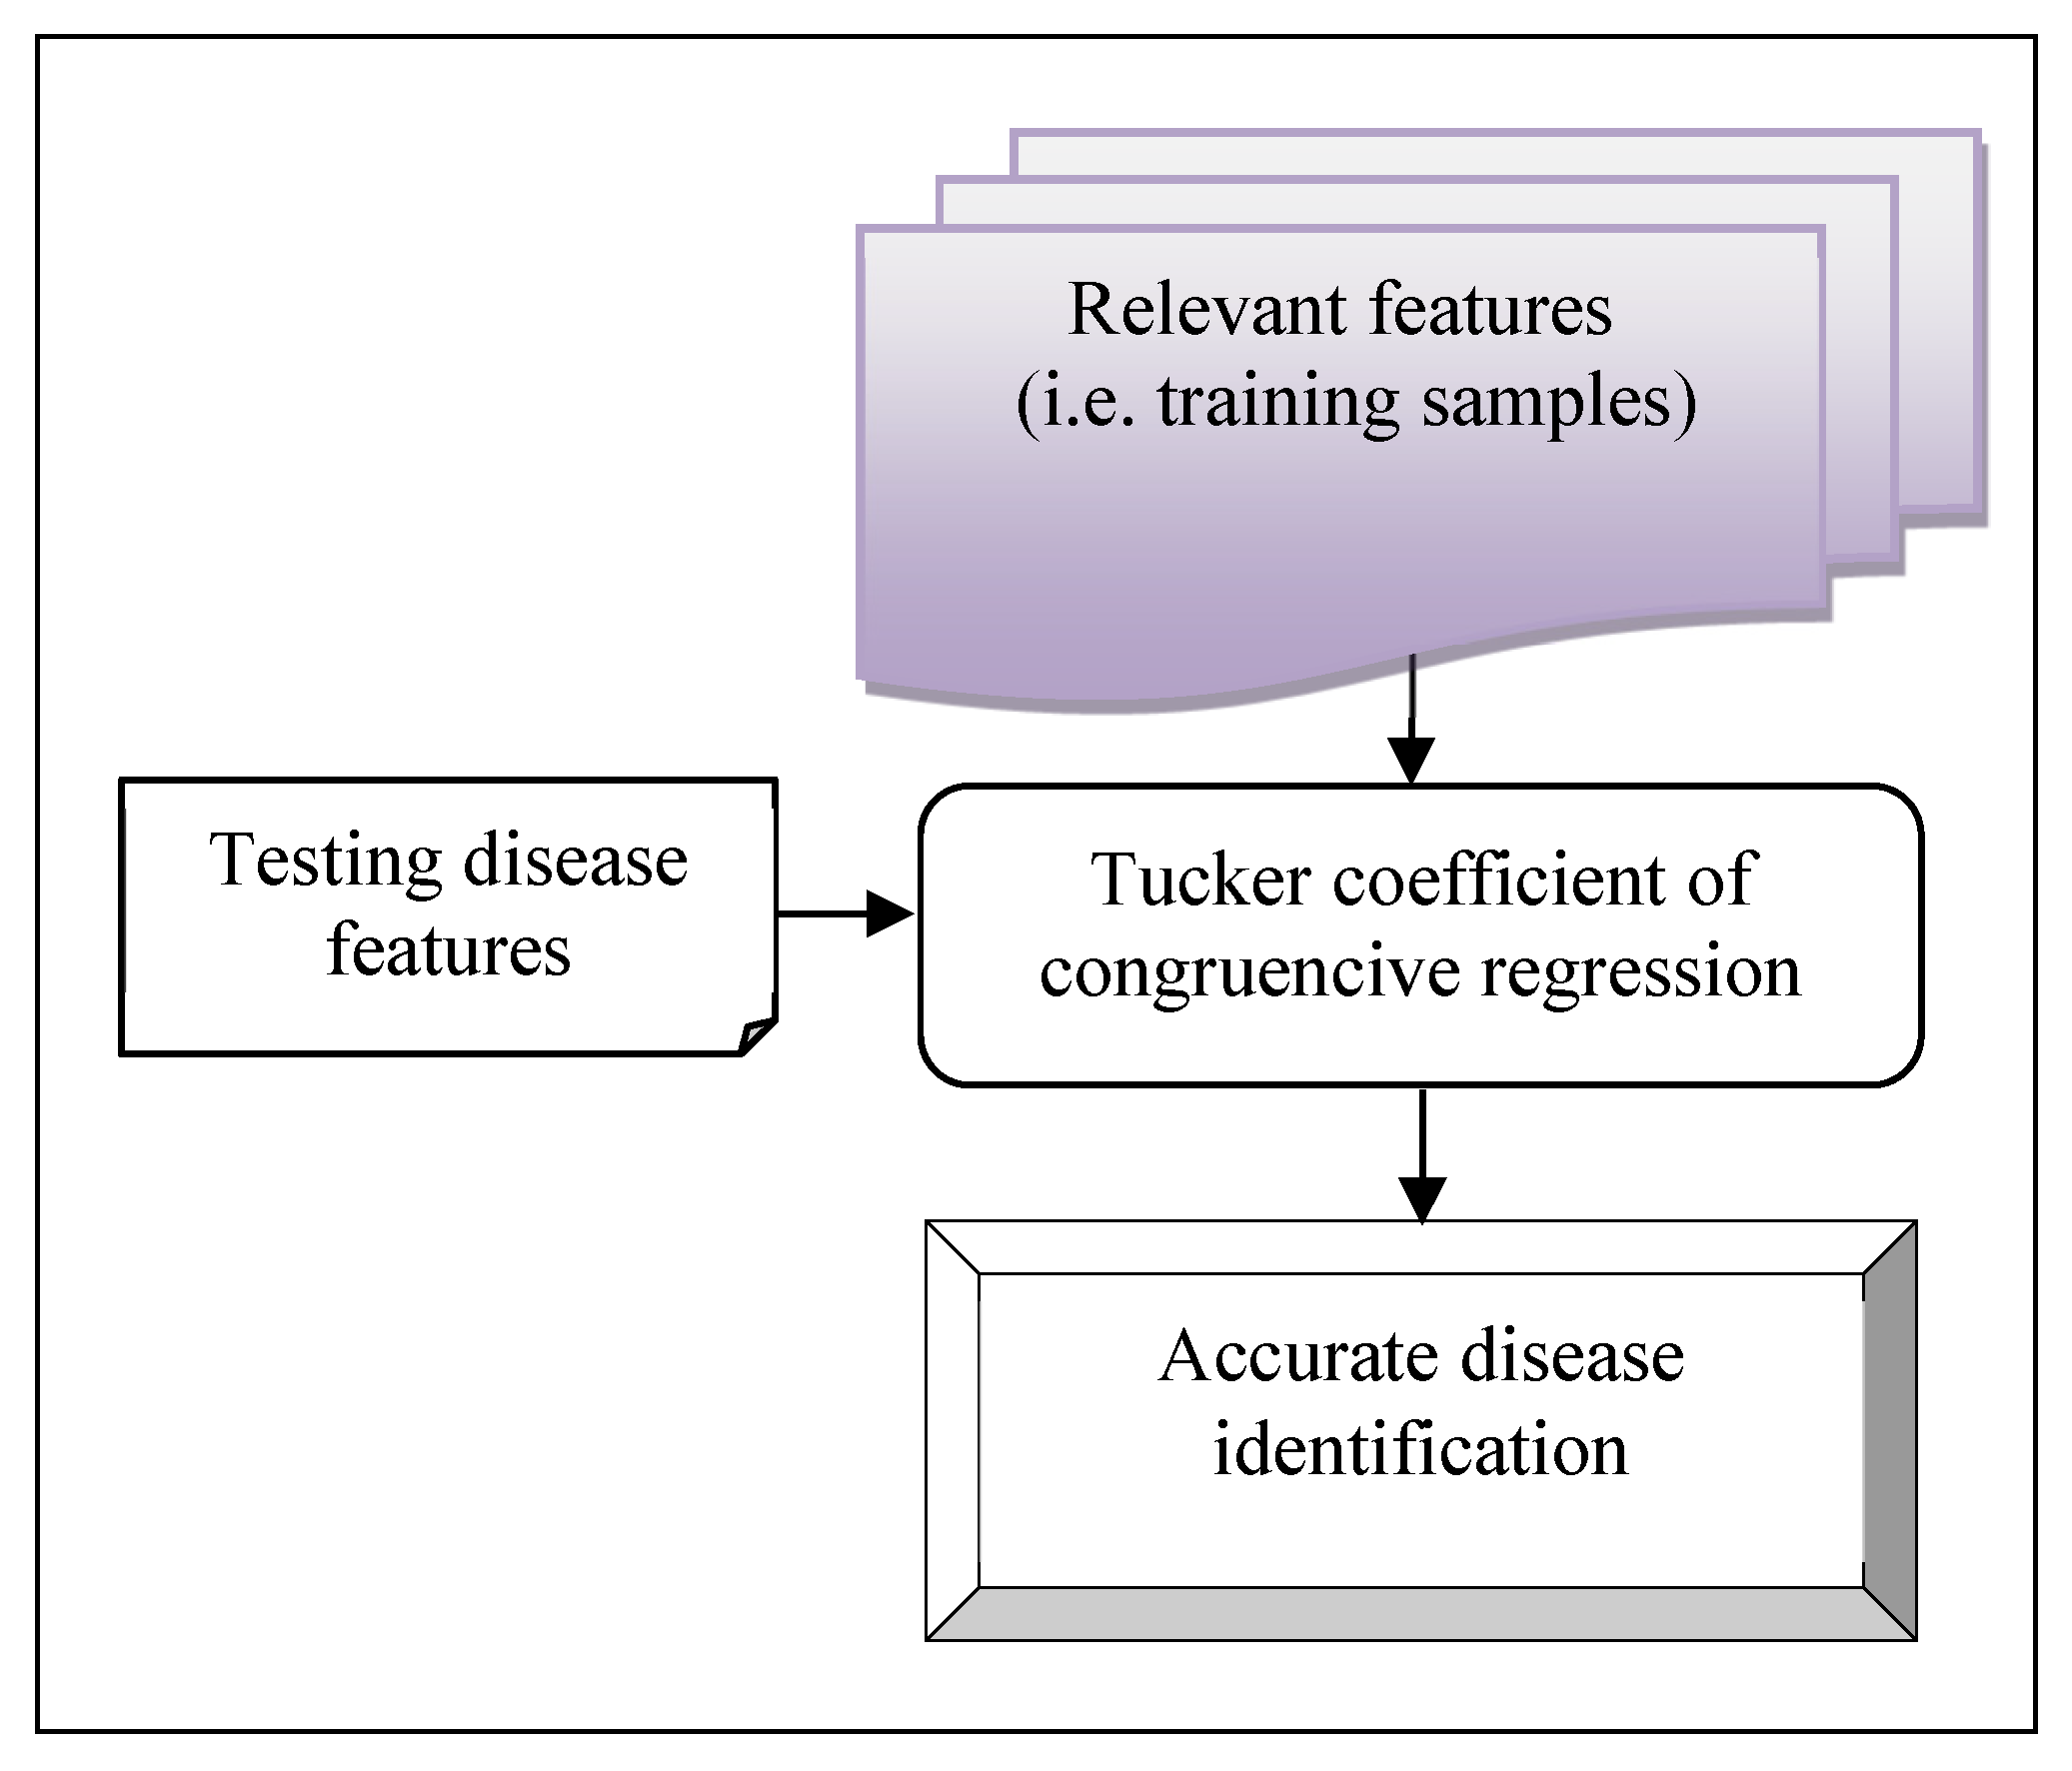
Figure 4.
Graphical illustration of prediction accuracy.
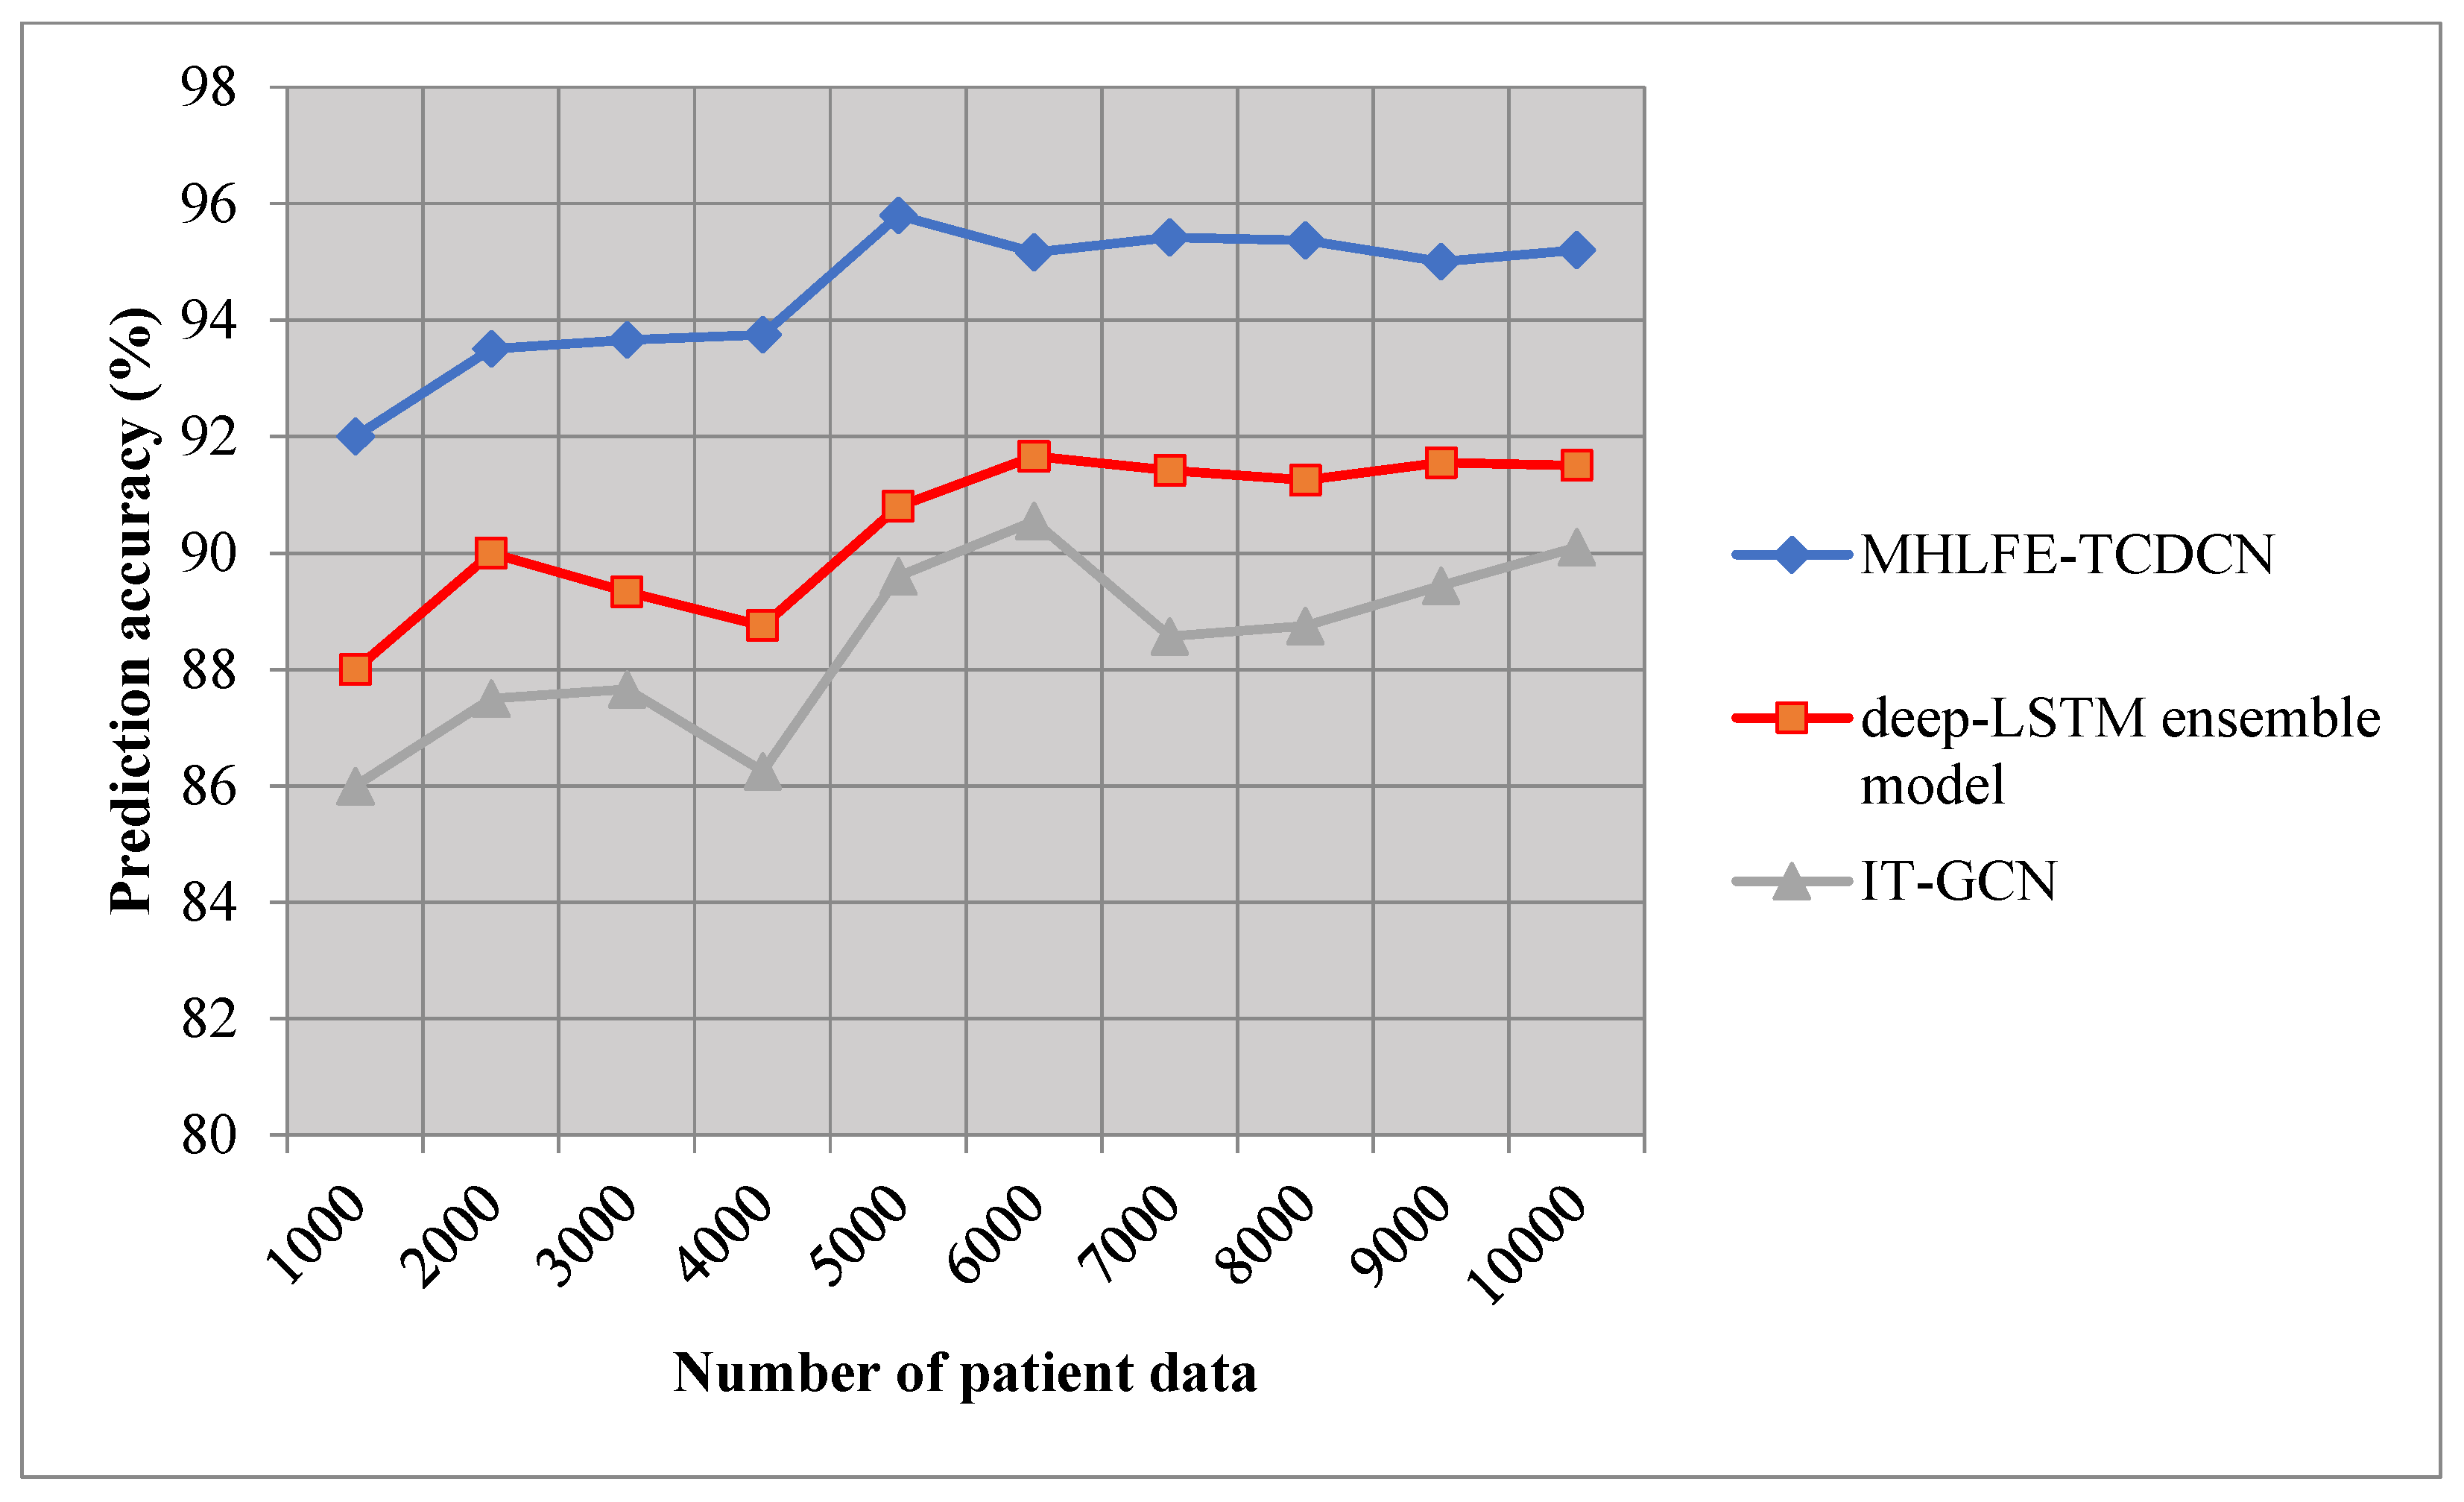
Figure 5.
Graphical illustration of precision.
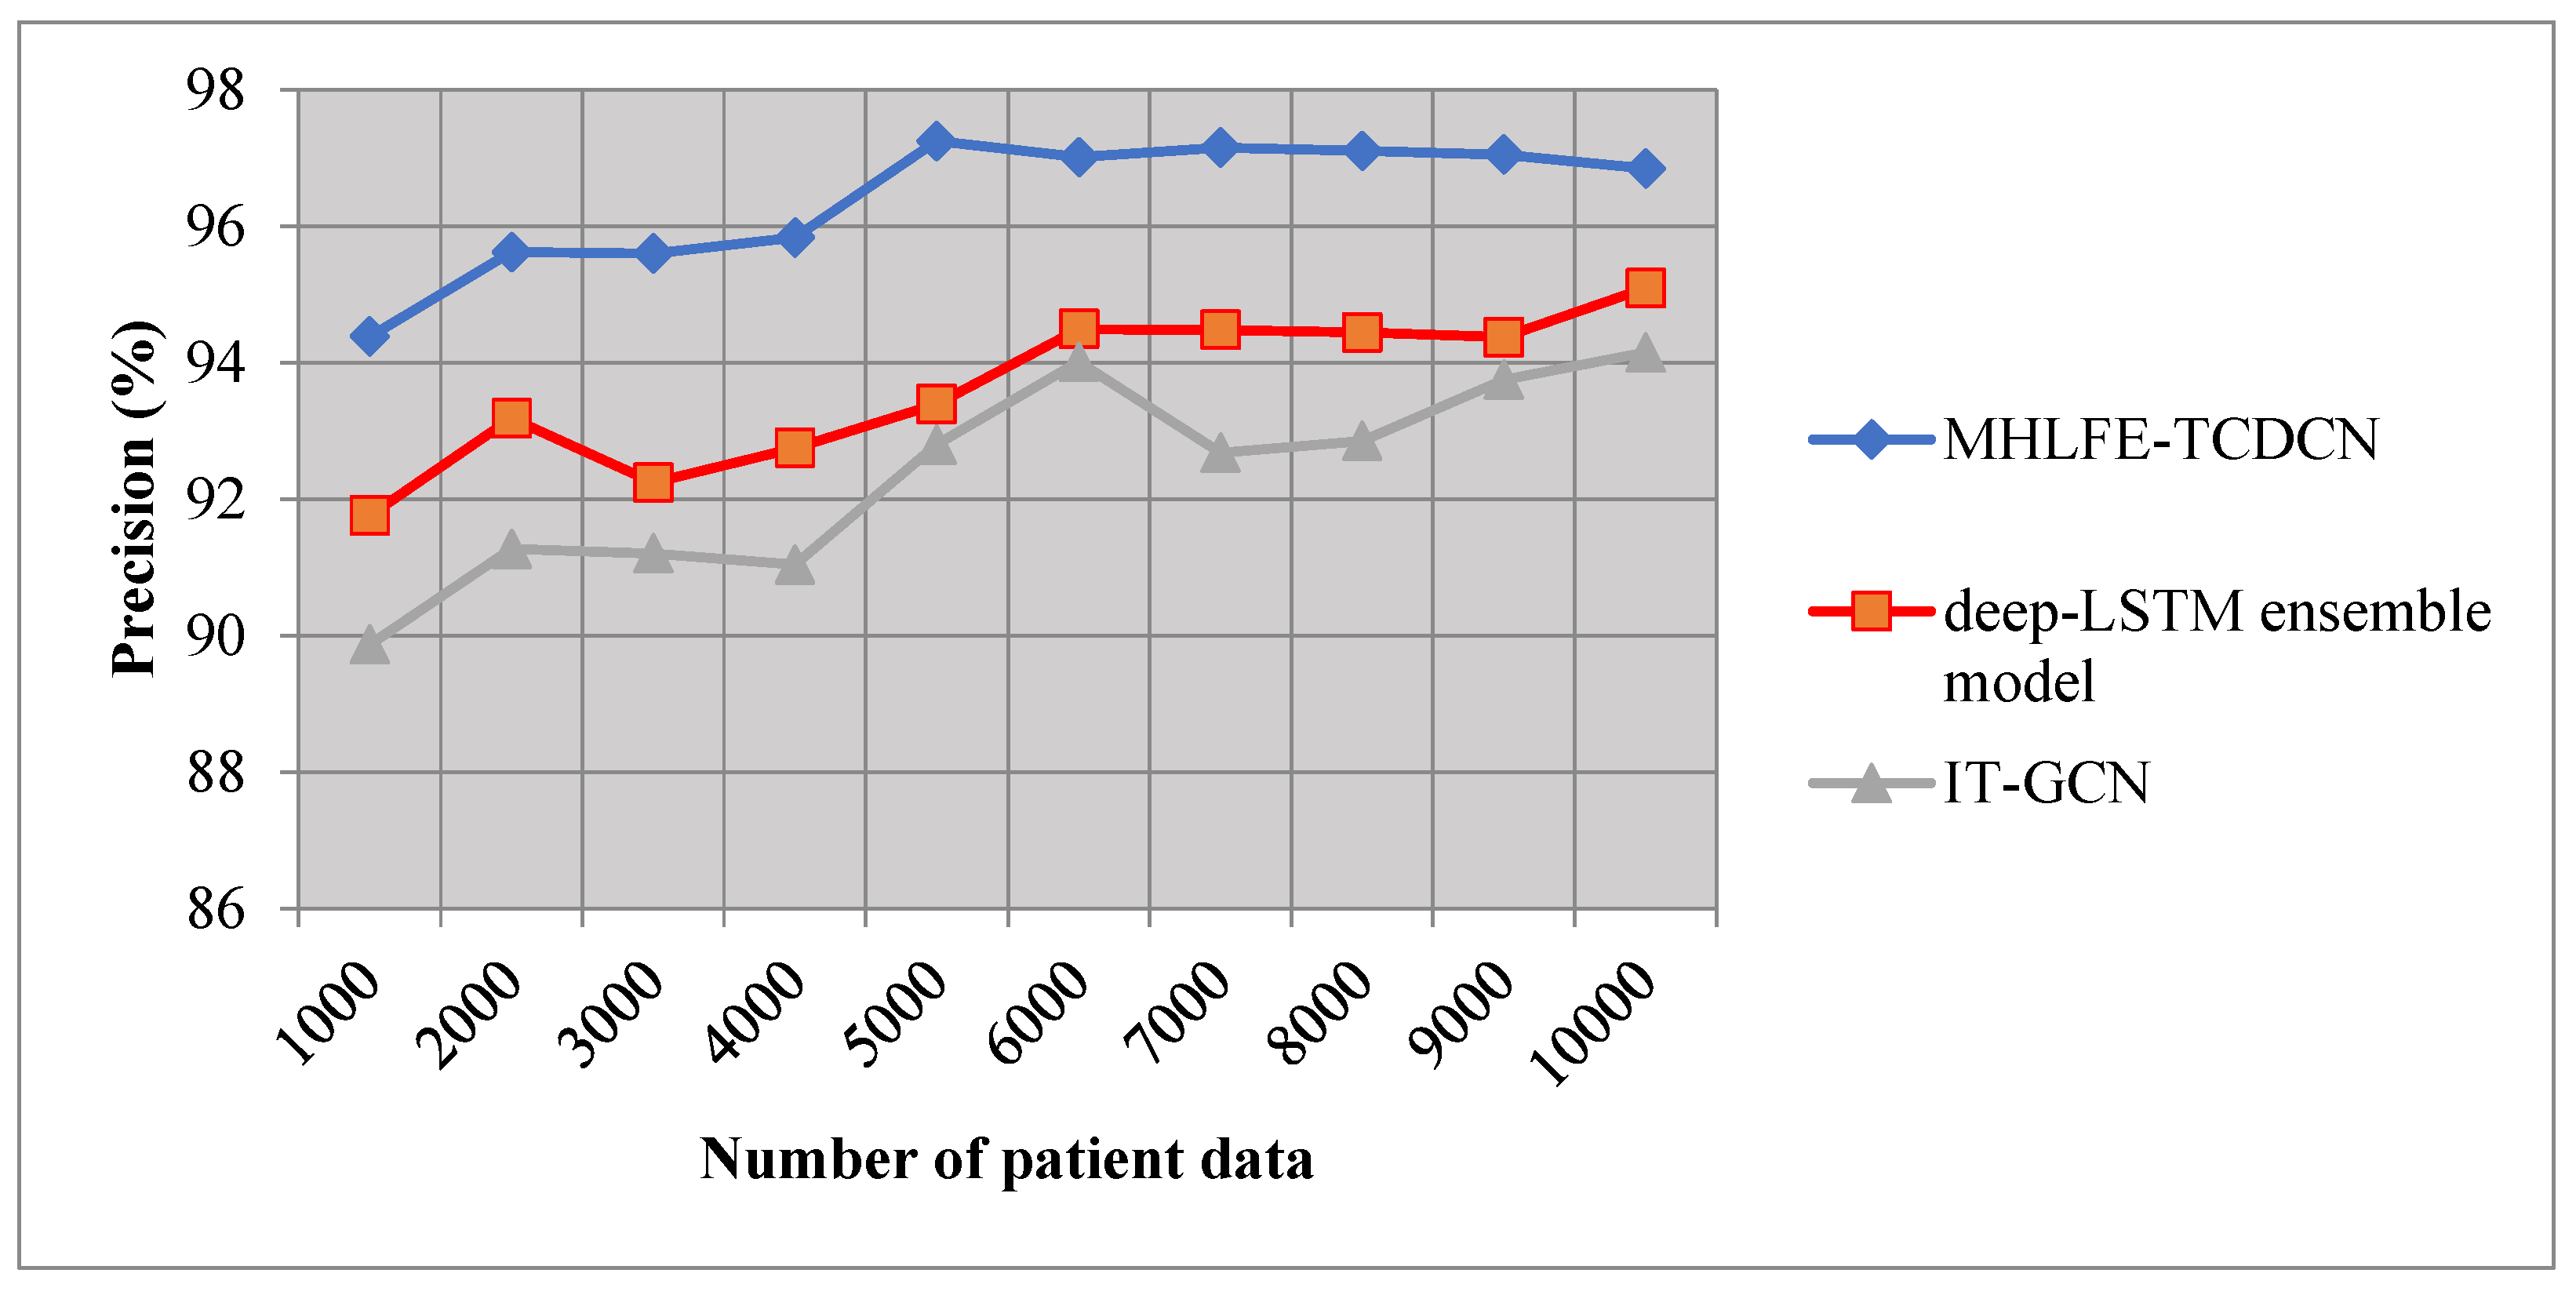
Figure 6.
Graphical illustration of recall.
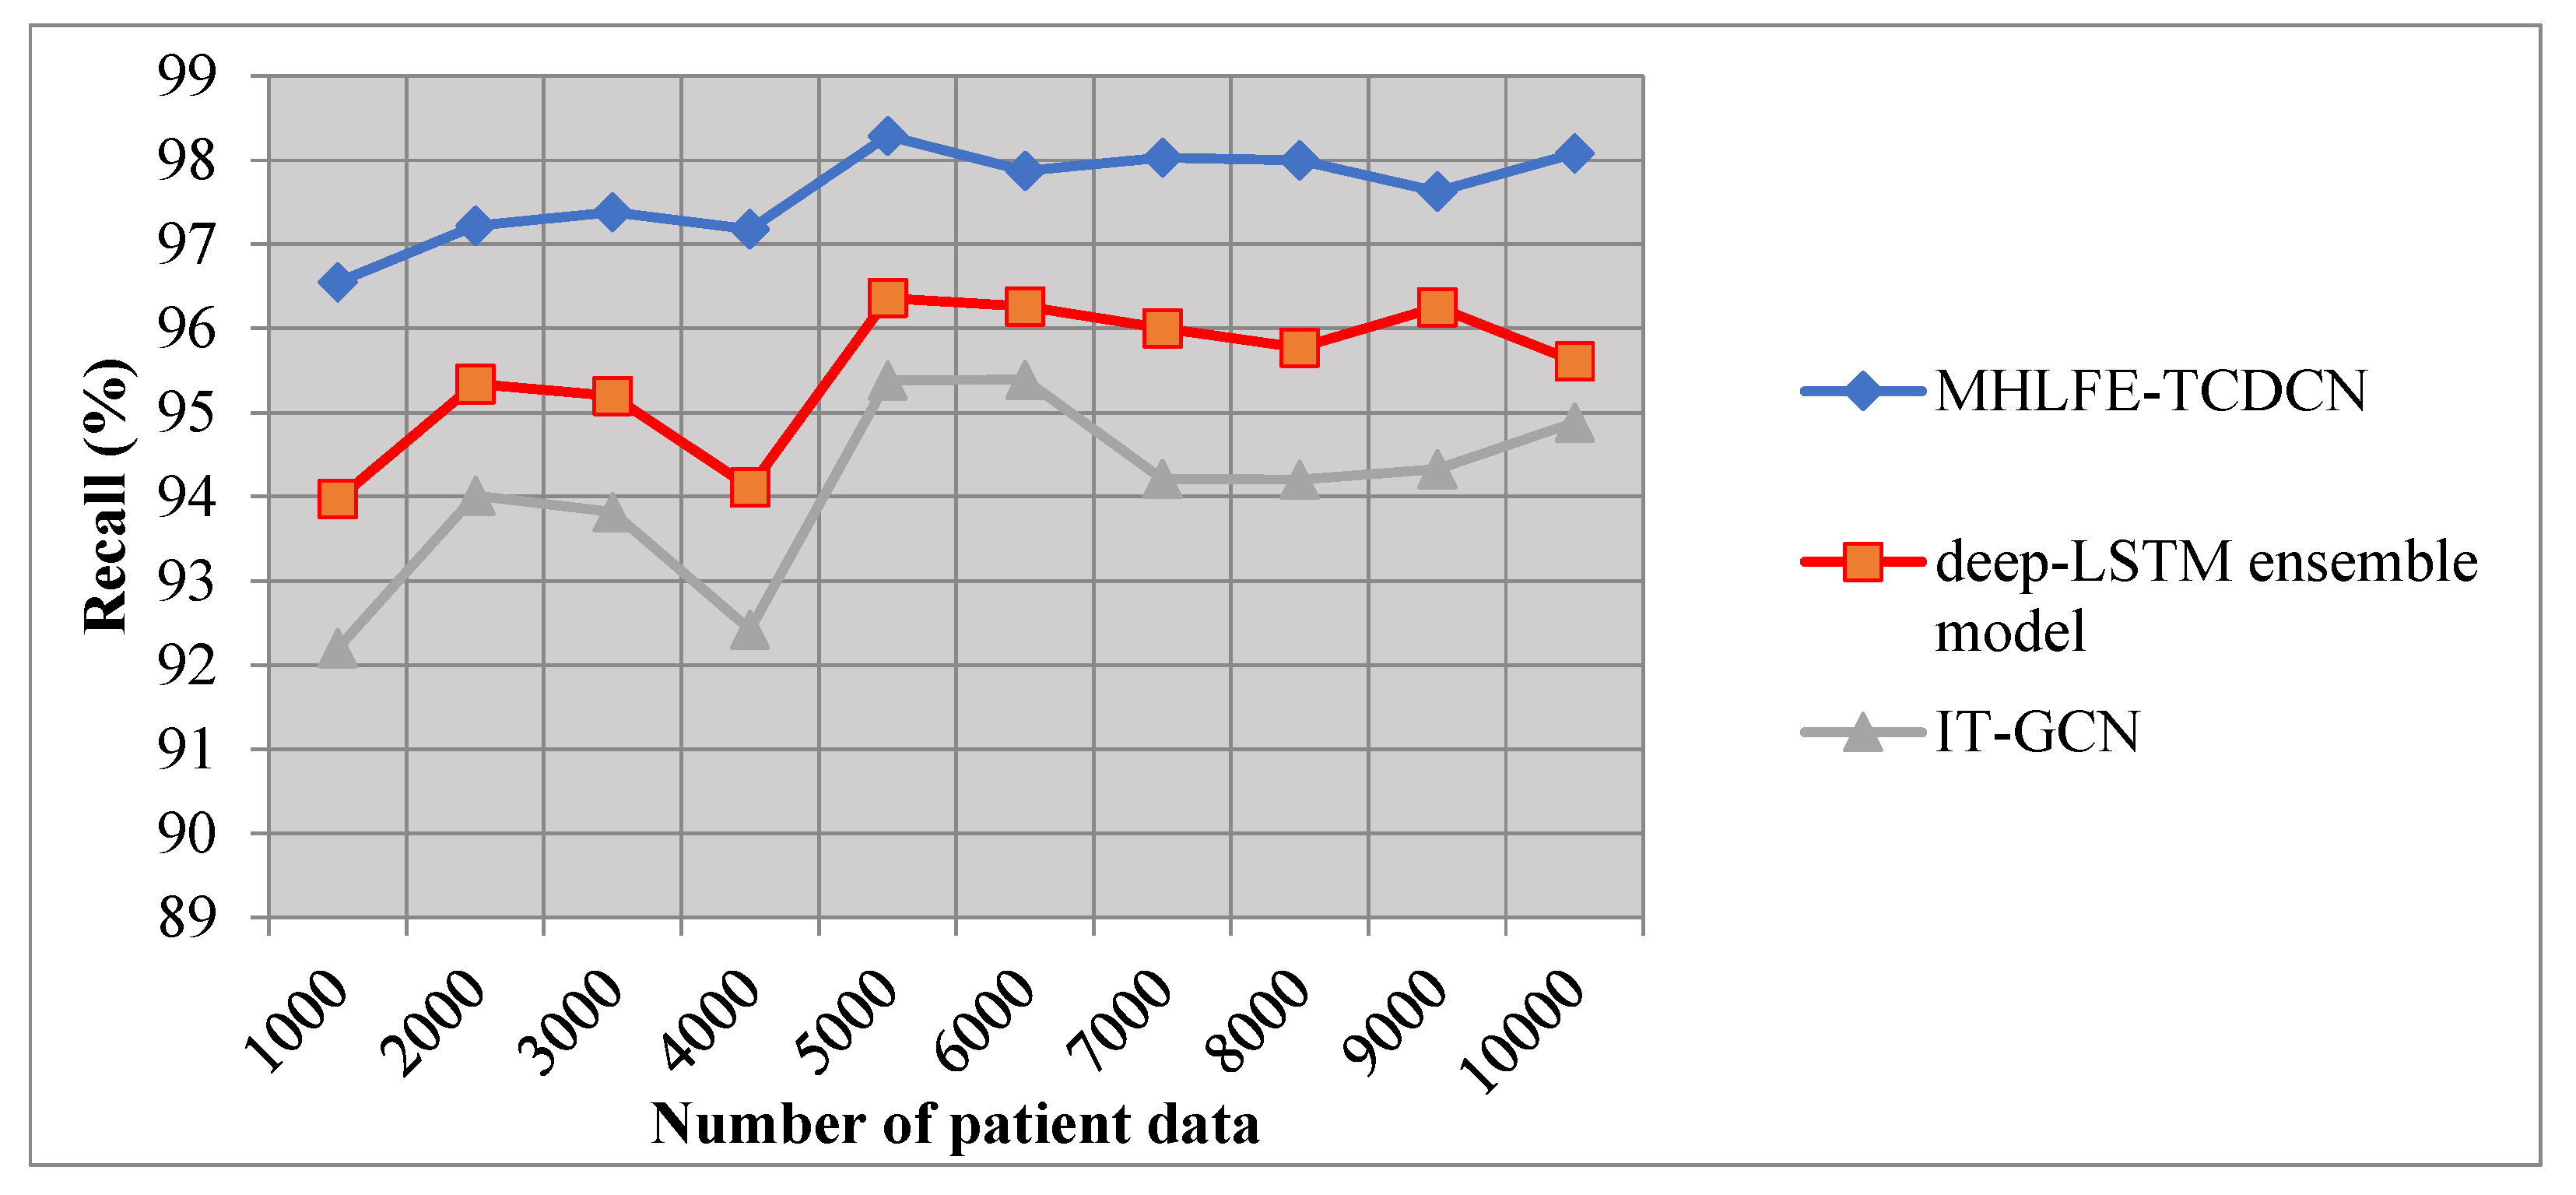
Figure 7.
Graphical illustration of F-measure.
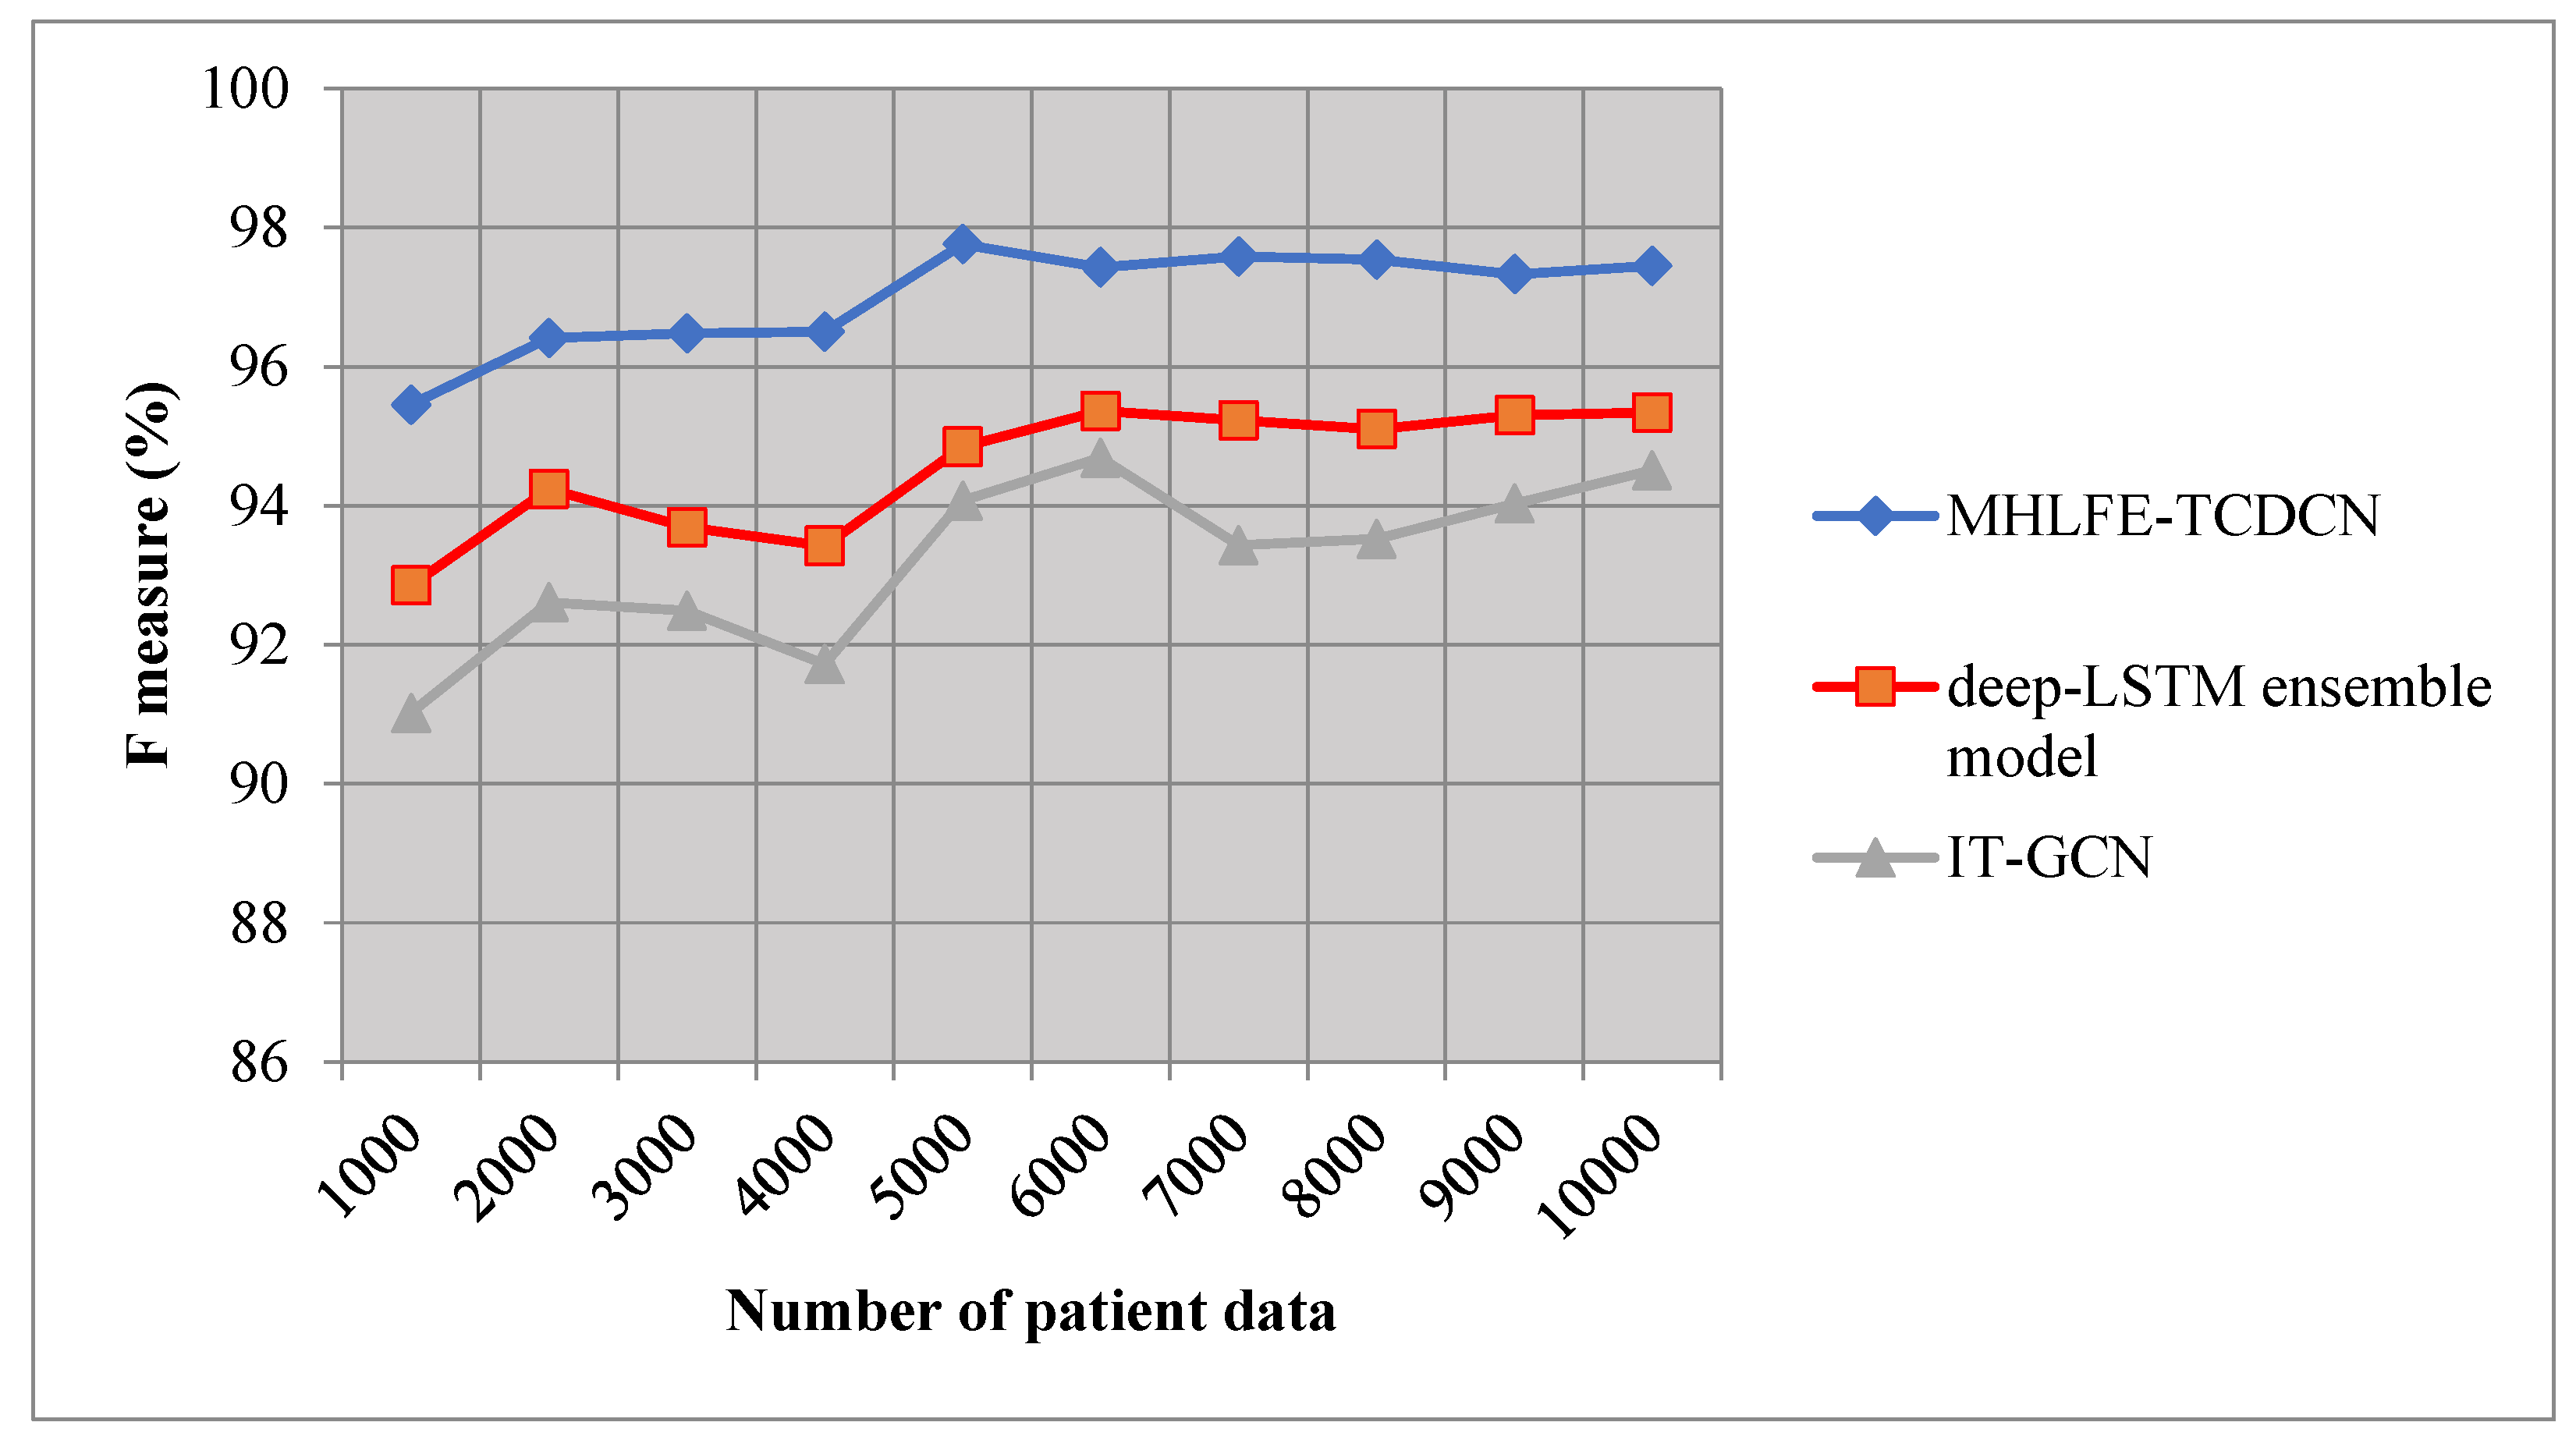
Figure 8.
Graphical illustration of Prediction time.
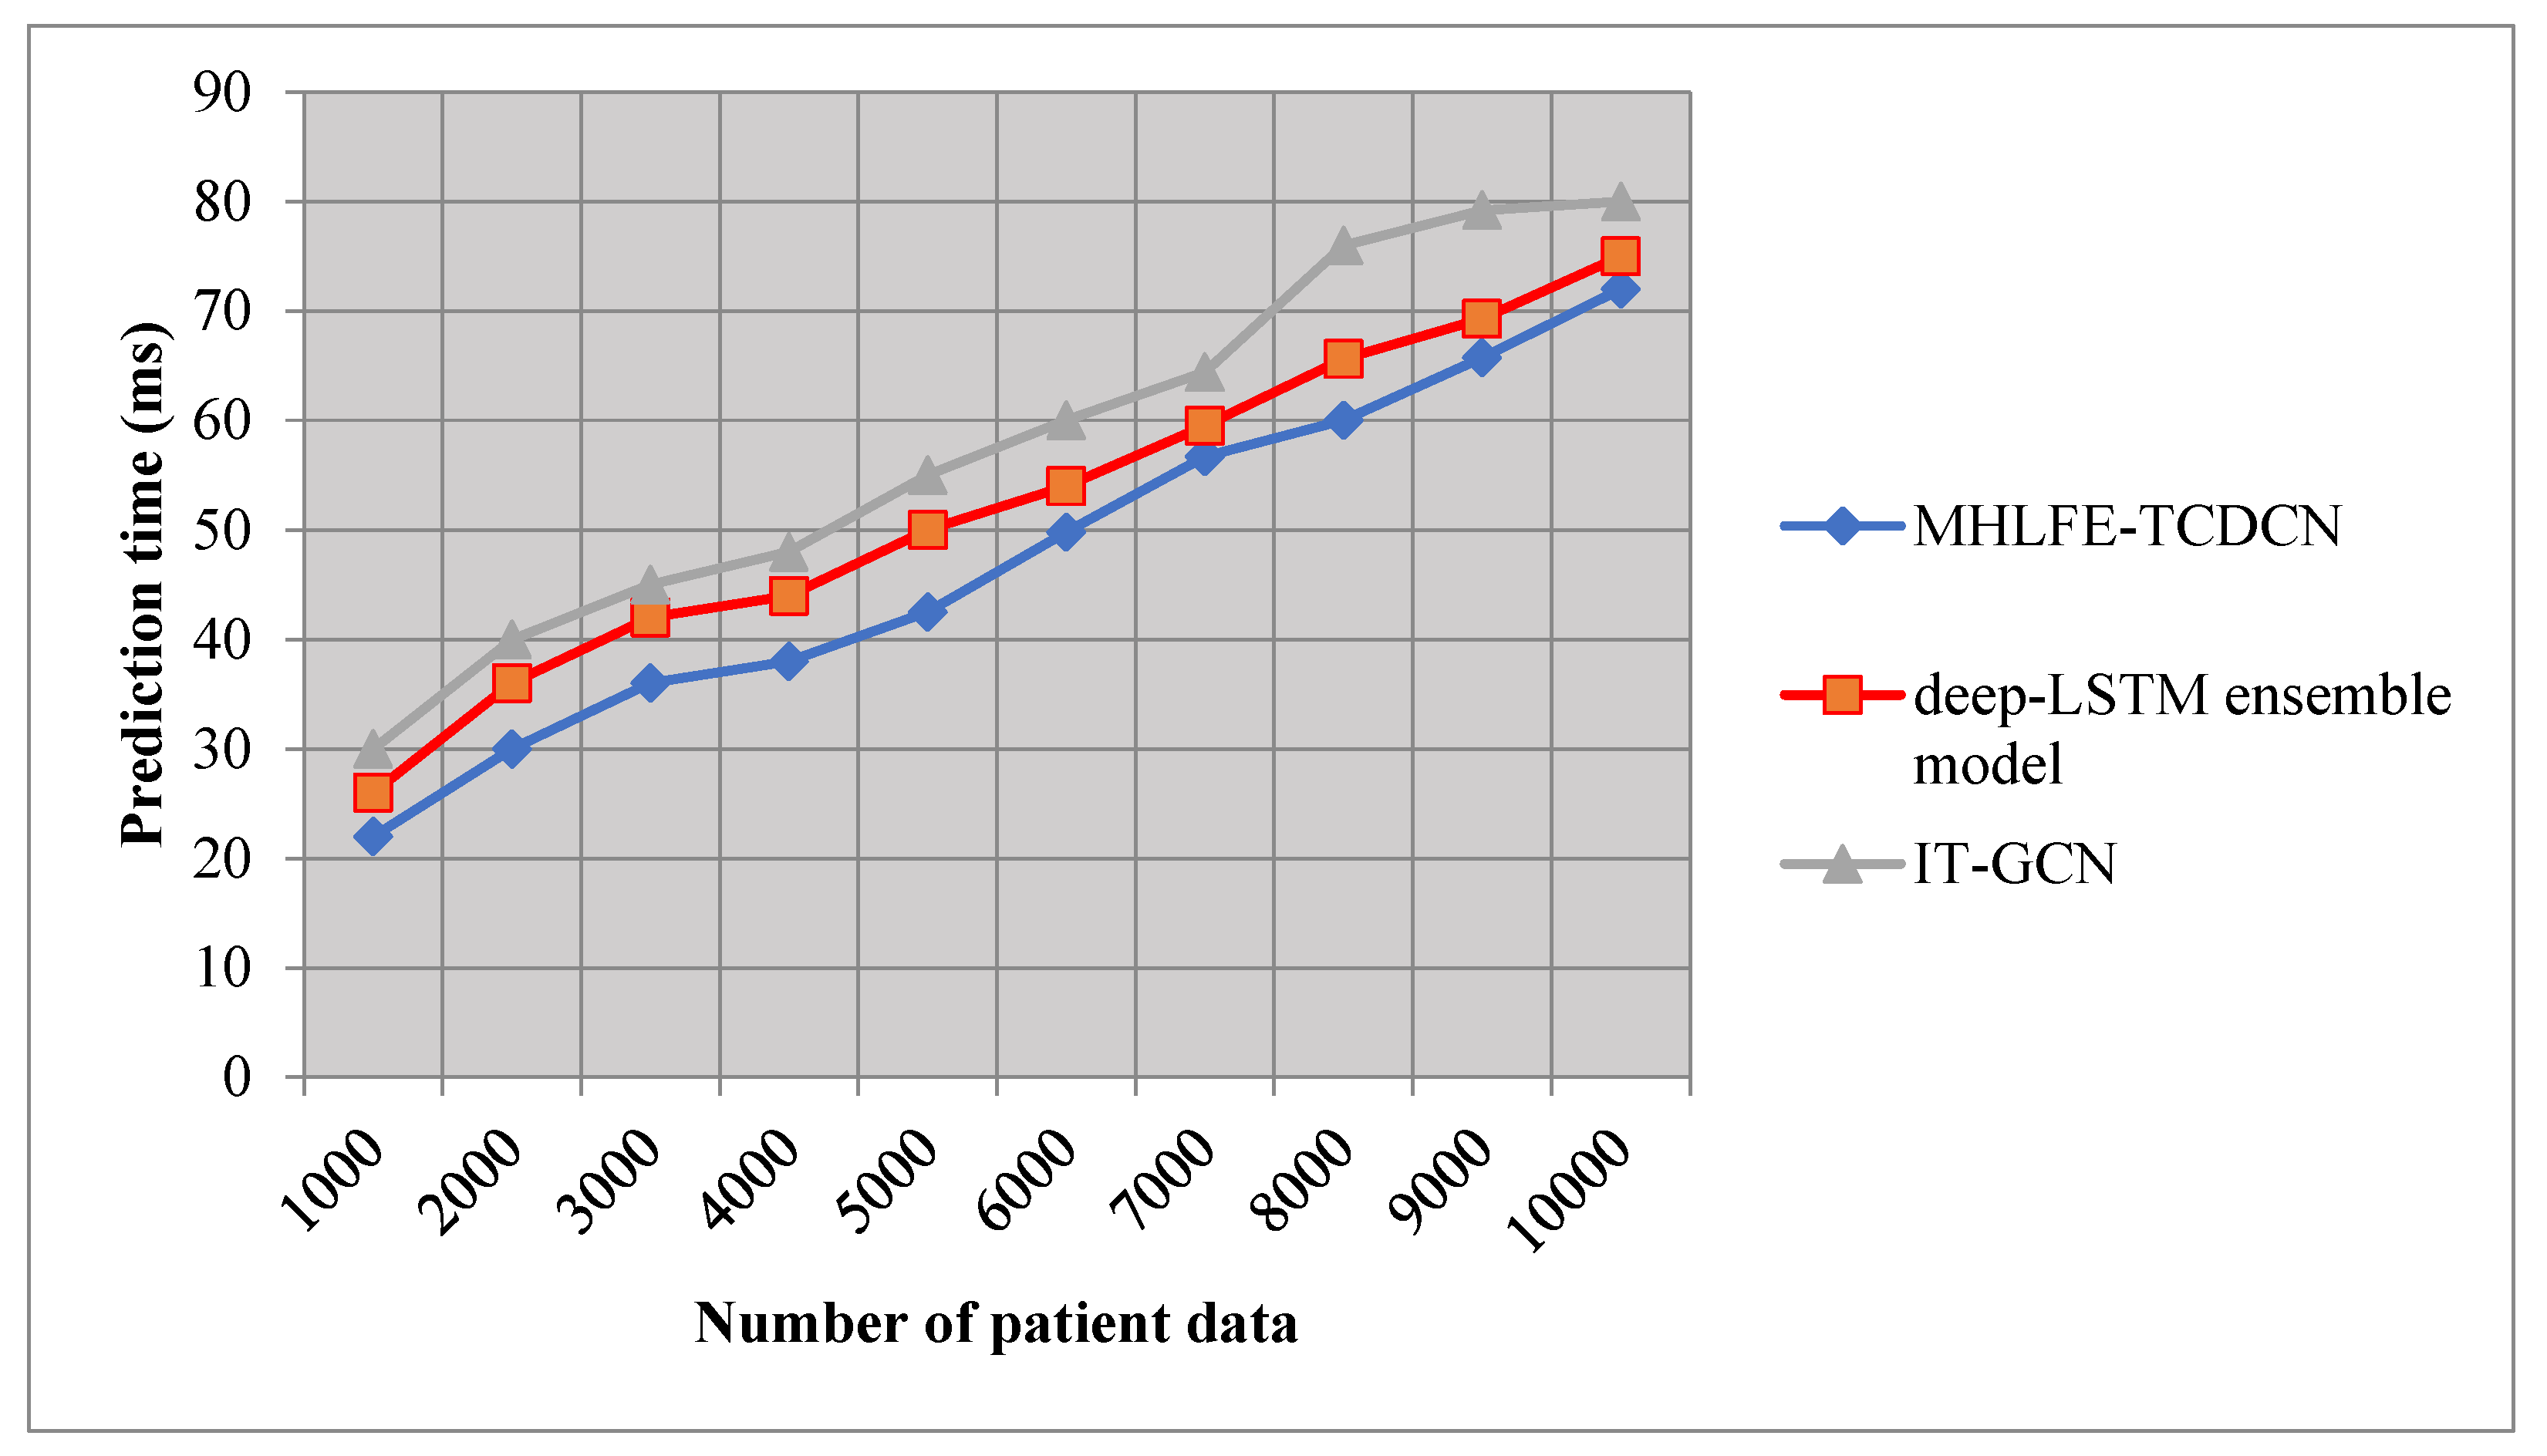

Table 1.
Comparison of prediction accuracy.
| Number of Patient Data | Prediction Accuracy (%) | ||
|---|---|---|---|
| MHLFE-TCDCN | Deep-LSTM Ensemble Model | IT-GCN | |
| 1000 | 92 | 88 | 86 |
| 2000 | 93.5 | 90 | 87.5 |
| 3000 | 93.66 | 89.33 | 87.66 |
| 4000 | 93.75 | 88.75 | 86.25 |
| 5000 | 95.8 | 90.8 | 89.6 |
| 6000 | 95.166 | 91.66 | 90.55 |
| 7000 | 95.42 | 91.42 | 88.57 |
| 8000 | 95.37 | 91.25 | 88.75 |
| 9000 | 95 | 91.55 | 89.44 |
| 10000 | 95.2 | 91.5 | 90.1 |
Table 2.
Comparison of prediction accuracy.
| Number of Patient Data | Precision (%) | ||
|---|---|---|---|
| MHLFE-TCDCN | Deep-LSTM Ensemble Model | IT-GCN | |
| 1000 | 94.38 | 91.76 | 89.87 |
| 2000 | 95.62 | 93.18 | 91.27 |
| 3000 | 95.60 | 92.24 | 91.2 |
| 4000 | 95.83 | 92.75 | 91.04 |
| 5000 | 97.25 | 93.39 | 92.80 |
| 6000 | 97.01 | 94.49 | 94.01 |
| 7000 | 97.15 | 94.48 | 92.68 |
| 8000 | 97.10 | 94.44 | 92.85 |
| 9000 | 97.05 | 94.37 | 93.75 |
| 10000 | 96.84 | 95.09 | 94.15 |
Table 3.
Comparison of Recall.
| Number of Patient Data | Recall (%) | ||
|---|---|---|---|
| MHLFE-TCDCN | Deep-LSTM Ensemble Model | IT-GCN | |
| 1000 | 96.55 | 93.97 | 92.20 |
| 2000 | 97.22 | 95.34 | 94.01 |
| 3000 | 97.38 | 95.2 | 93.82 |
| 4000 | 97.18 | 94.11 | 92.42 |
| 5000 | 98.29 | 96.36 | 95.38 |
| 6000 | 97.87 | 96.26 | 95.39 |
| 7000 | 98.03 | 96 | 94.21 |
| 8000 | 98 | 95.77 | 94.20 |
| 9000 | 97.63 | 96.25 | 94.33 |
| 10000 | 98.08 | 95.61 | 94.88 |
Table 4.
Comparison of F-measure.
| Number of Patient Data | F-Measure (%) | ||
|---|---|---|---|
| MHLFE-TCDCN | Deep-LSTM Ensemble Model | IT-GCN | |
| 1000 | 95.45 | 92.85 | 91.02 |
| 2000 | 96.41 | 94.24 | 92.61 |
| 3000 | 96.48 | 93.69 | 92.49 |
| 4000 | 96.50 | 93.42 | 91.72 |
| 5000 | 97.76 | 94.85 | 94.07 |
| 6000 | 97.43 | 95.36 | 94.69 |
| 7000 | 97.58 | 95.23 | 93.43 |
| 8000 | 97.54 | 95.10 | 93.52 |
| 9000 | 97.33 | 95.30 | 94.03 |
| 10000 | 97.45 | 95.34 | 94.51 |
Table 5.
Comparison of Prediction time.
| Number of Patient Data | Prediction Time (ms) | ||
|---|---|---|---|
| MHLFE-TCDCN | Deep-LSTM Ensemble Model | IT-GCN | |
| 1000 | 22 | 26 | 30 |
| 2000 | 30 | 36 | 40 |
| 3000 | 36 | 42 | 45 |
| 4000 | 38 | 44 | 48 |
| 5000 | 42.5 | 50 | 55 |
| 6000 | 49.8 | 54 | 60 |
| 7000 | 56.7 | 59.5 | 64.4 |
| 8000 | 60 | 65.6 | 76 |
| 9000 | 65.7 | 69.3 | 79.2 |
| 10000 | 72 | 75 | 80 |
Disclaimer/Publisher’s Note: The statements, opinions and data contained in all publications are solely those of the individual author(s) and contributor(s) and not of MDPI and/or the editor(s). MDPI and/or the editor(s) disclaim responsibility for any injury to people or property resulting from any ideas, methods, instructions or products referred to in the content. |
© 2024 by the authors. Licensee MDPI, Basel, Switzerland. This article is an open access article distributed under the terms and conditions of the Creative Commons Attribution (CC BY) license (http://creativecommons.org/licenses/by/4.0/).
Copyright: This open access article is published under a Creative Commons CC BY 4.0 license, which permit the free download, distribution, and reuse, provided that the author and preprint are cited in any reuse.


