Submitted:
17 April 2024
Posted:
18 April 2024
You are already at the latest version
Abstract
The grain filling rate (GFR) plays a crucial role in determining grain yield. However, the regulatory and molecular mechanism of grain filling rate (GFR) in foxtail millet remains unclear. In this study, we found the GFR of 'Changnong No.47' (CN47) was significantly higher at 14 days after flowering (DAF) and 21 DAF in comparison to 'Changsheng 13' (CS13). Furthermore, CN47 also exhibited higher thousand grain weight and yield than CS13. Therefore, we conducted transcriptomics and metabolomics to analyze the biological processes and functional genes associated with GFR during two stages of grain filling in both cultivars. A total of 765 differentially expressed genes (DEGs) and 246 differentially accumulated metabolites (DAMs) were identified at the 14 DAF stage, while at the 21 DAF stage, a total of 908 DEGs and 268 DAMs were identified. The integrated analysis of co-mapped DAMs and DEGs revealed enriched pathways, including flavonoid biosynthesis, plant hormone signal transduction, tyrosine metabolism, ATP-binding cassette (ABC) transporters, beta-alanine metabolism, as well as stilbenoid, diarylheptanoid and gingerol biosynthesis. In order to elucidate their potential functions in the context of GFR, we developed a gene-metabolite regulatory network for these metabolic pathways. Notably we found some genes associated with ABC transporters and plant hormone signal transduction pathway were implicated in auxin transport and signal transduction, highlighting the crucial role of auxin during grain filling. The results provide initial insights into the regulatory and molecular mechanisms underlying GFR in foxtail millet, as well as offer valuable genetic resources for further elucidation of GFR in future studies. The findings have established a theoretical basis for improving the efficiency of yield breeding in foxtail millet.
Keywords:
foxtail millet
; grain filling rate
; transcriptome
; metabolome
; auxin
1. Introduction
Foxtail millet (Setaria italica L.) is an ancient crop originated in China, renowned for its high drought tolerance [1]. It has emerged as a prominent cereal in regions with limited water resources, including China, India, and certain African countries [2]. Foxtail millet grains are abundant in essential nutrients, such as organic acids [3], vitamin E, various amino acids, and high quality protein [4]. Additionally, it serves as a valuable source of trace elements like zinc and iron [5]. Its bran also contains substantial amounts of linoleic and linolenic acids [6,7], making it an excellent crude fiber source that aids intestinal digestion and promotes digestive health [8]. These nutritional attributes have garnered increasing global attention towards this grain. However, its yield per unit area significantly lags behind staple crops like maize, wheat, and rice, and the planting area and total yield have been a declining trend [9]. Therefore, enhancing the yield potential of foxtail millet becomes imperative.
Cereal crops grain yield is determined by three component traits, the number of panicles, the number of grains per panicle and thousand kernel weight (TKW) [10]. Kernel weight, the most crucial factor determining yield, is largely influenced by the grain filling duration (GFD) and grain filling rate (GFR) [11]. Previous studies have shown that GFD is greatly affected by temperature [12,13], nitrogenous fertilizer [14], especially during the grain filling period under water stress [15]. However, the stability of GFR and its limited susceptibility to environmental factors [16,17] suggest a potential genetic determination for this parameter [18]. More importantly, the GFR plays a crucial role in enhancing grain productivity by facilitating endosperm development and nutrient accumulation [19]. The performance of cultivars with high filling rates is generally superior under adverse conditions such as abiotic and biotic stresses, as they produce seeds that are fuller and exhibit lower effects compared to cultivars with low filling rates [20]. Thus, the attainment of crops with high GFR can be accomplished through genetic breeding, and the strategic selection and breeding of genotypes exhibiting high GFR will prove to be a successful approach in ensuring optimal grain yield. Furthermore, exploring and identifying regulatory genes and key loci associated with GFR, as well as analyzing and definiting the regulatory pathways and molecular mechanisms governing GFR, we can facilitate precise breeding of rapid filling characteristics, thereby enhancing both grain yield and quality.
The identification of several pivotal genes involved in GFR, along with the elucidation of their molecular pathways in major crops, has significantly contributed to our understanding of this intricate process. In rice, the enzymes associated with assimilate synthesis and transport in rice, including those involved in starch synthesis and sucrose metabolism, exert a significant impact on GFR. Grain incomplete filling2 (GIF2), encoding an ADP-Glc pyrophosphorylase large subunit, regulats grain filling and starch biosynthesis during caryopsis development. Inhibition of GIF2 expression level leads to a decrease in GFR and yield [21]. The sucrose transport-related genes, Sucrose Transporter1 (OsSUT1), OsSUT2, OsSUT3, OsSUT4, have been reported to exert significant influence on grain filling due to their involvement in the transportation of sucrose. OsNF-YB1 acts as an upstream regulator of OsSUT3 and OsSUT4 expression, specifically expressed in the aleurone layer. [22,23]. Moreover, the SWEET genes, such as ZmSWEET4c in maize and OsSWEET4 in rice, regulate the seed filling process by mediating transepithelial hexose transport [24]. In maize, Opaque2 activates the expression of sucrose synthase genes SUS1 and SUS2 and promotes grain filling [25]. Furthermore, several studies have indicated that the members of the cell wall invertase (CIN) gene family impact the GFR. In rice, the cell wall convertase genes OsGIF1/OsCIN2 have been identified as domesticating selective genes involved in carbon allocation during early growth stage. These genes regulate transport and unloading of sucrose and affect GFR [26]. And the change in plant hormone levels also strongly influences GFR. Ethylene (ETH) and abscisic acid (ABA) regulate the activity of enzymes involved in starch synthesis, thereby further inhibiting carbohydrates biosynthesis in spikelets, reducing GFR and ultimately affecting yield [27,28]. And the low concentrations of auxin (IAA) and cytokinin (CK) in rice lead to a decrease in GFR, resulting in poor grain filling, ultimately leading to reduced grain weight and yield [29,30]. DEP1/qPE9-1 is the rice G protein γ subunit, which regulats GFR by increasing the auxin and CK content of grains [31]. As well as, microRNAs (miRNAs) play a crucial role during grain filling, and the suppression of miR1432 expression enhances GFR, leading to a significantly increase grain yield in rice [19]. GRAIN-FILLING RATE1 (GFR1) encodes a membrane-localized protein that enhances the expression of Rubisco genes in the calvin cycle, thereby promoting the synthesis of sucrose and increasing the grain filling rate and yield in rice [32]. And QGfr.sicau-7D.1 is a newly discovered QTL for GFR in wheat [33].
However, the study on molecular mechanisms and regulatory genes related to GFR in foxtail millet is rarely reported compared to major cereal crops. The whole genome sequencing of foxtail millet has facilitated further research in the field of molecular biology and functional genomics for this crop [34,35]. High-throughput sequencing technology and multi-omics analysis have made it possible to identify genes associated with grain filling. By comparing the difference in transcriptome [9,36,37], metabolome [38] and genome-wide DNA methylation in foxtail millet [39] at different grain filling stages, numerous potential regulators in grain filling and the accumulation of grain metabolites have been identified [35,39]. Furthermore, one papers provided preliminary insights into the differences in gene expression and molecular mechanisms of grain filling among foxtail millet cultivars with different panicle types in the North China summer-sowing region [40]. Nevertheless, those studies solely focus on elucidating the mechanism underlying foxtail millet grain filling process, without delving into the mechanism for differences in the grain filling process of two genotypes (high GFR and low GFR). In particular, the molecular pathways and associated genes governing GFR have not been identified.
In this study, we conducted an analysis on the variations in grain weight and GFR across six different developmental stages, utilizing the grains of high-GFR and low-GFR foxtail millet cultivars. Then, the stages with the most significant disparity in grain filling rate between the two cultivars was chosen for transcriptomic and metabolomic investigations. Our comprehensive analysis of the transcriptome and metabolome revealed potentially crucial metabolites and transcriptional regulators, shedding light on the molecular regulatory mechanism underlying grain-filling rate. Furthermore, this study provides a theoretical foundation for achieving high-yield and high-quality molecular design breeding of foxtail millet.
2. Materials and Methods
2.1. Plant Materials and Growth Conditions
The foxtail millet cultivars (Setaria italica L.) utilized in this study were Changsheng 13 (CS13, with a low grain filling rate) and Changnong No. 47 (CN47, with a high grain filling rate), which were provided by the Millet Research Institute of Shanxi Agricultural University/Shanxi Academy of Agricultural Sciences (Changzhi, Shanxi, China). Foxtail millets were cultivated at the experimental station of the Millet Research Institute of Shanxi Agricultural University/Shanxi Academy of Agricultural Sciences in Changzhi, Shanxi, China (36°21’N, 113°14’E) from May to October in 2023. The experimental field features a temperate semi-humid continental monsoon climate, characterized by an average annual temperature ranging from 8.6 °C to 10.5 °C, an average annual rainfall exceeding 600 mm, and a frost-free period lasting between 155 and 184 days. A randomized block design is employed for the field experiments with each plot measuring 5 m × 2.4 m and three biological replicates. The soil consisted of brown loam with nutrient contents as follows: organic matter (33.51 g/kg), available nitrogen (46.14 µg/g), available phosphorus (20.14 µg/g), and available potassium (168.76 µg/g). Regular agronomic practices were implemented in the field.
2.2. Investigation of the Grain Development and Grain-Filling Rate
The experimental plots were labeled with sixty plants exhibiting spikelets of the same age and size in the central sections, all flowering synchronously. On each plant, 200 flowers were marked with a black pen on the glume surface. After seven days of marking, fresh grains from five randomly selected plants were harvested and subjected to drying in an oven at 105°C for 30 minutes, followed by further drying in another oven at 80°C until reaching a constant weight. Subsequently, these dried grains were manually hulled and weighed using a balance with a precision of up to 0.001 g. Two hundred foxtail millet grains chosen randomly per plant were weighed and averaged. Similarly, fresh grains collected at 7, 14, 21, 28, 35, and 42 days after marking underwent harvesting, drying, hulling, and weighing procedures. The grain-filling rate was then calculated for each stage using the formula: GFRi = (GWi - GWi-1) /7 , where GFRi represents the grain-filling rate (mg grain-1 d-1), GWi denotes the dried grain weight (mg grain-1 d-1) at stage i (i = 1, 2, 3, 4, 5). A stereo microscope (SZX10, Olympus, Japan) was employed to document changes in developing grains at different stages including 7, 14, 21, 28, 35, and 42 DAF(days after flower) [32].
In addition, grains were sampled at the 14, and 21 DAF from of the same age and size in the central sections of marked plant. Grains from five spikelets within the same field plot were pooled together as one biological replicate. Three biological replicates were selected for each developmental stage from three different field plots. All the samples were immediately frozen in liquid nitrogen and stored at -80 °C for subsequent experiments.
2.3. RNA Sequencing and Transcriptomic Profiling Analysis
The grains of CS13 and CN47 at the 14 DAF stage and 21 DAF stage were collected for RNA extraction and sequencing. RNA-seq was performed by Novogene Co., Ltd. (Beijing, China). Each treatment group consisted of three biological replicates. The integrity of RNA was assessed using the Bioanalyzer 2100 system (Agilent Technologies, CA, USA) with the RNA Nano 6000 Assay Kit. The cDNA library was constructde and sequencing were conducted using the Illumina (HiSeq/MiSeq) system by Genepioneer. Subsequently, clean reads were obtained by filtering out unqualified raw reads, based on Q20, Q30 and GC content criteria. Trimmomatic (version 0.36) [41] was used to trim the clean reads while HISAT2 (version v2.0.5) [42] mapped them to the reference genome of foxtail millet [39]. Differential expression analysis of genes was performed using DESeq package with BaseMean value estimation [43]. Differentially expressed genes (DEGs) were identified based on | log2(fold change) | ≧ 1 and adjusted P-value < 0.05 as screening criteria. Gene Ontology (GO) [44] and Kyoto Encyclopedia of Genes and Genomes (KEGG) [45] pathway enrichment analyses were performed by the Novogene cloud analysis tools ( https://magic.novogene.com/ ).
2.4. Metabolome Profiling Analysis
The metabolome analysis material was identical tp that used for transcriptome analysis, with six biological replicates per treatment group (Metabolite extraction and LC-MS analysis also were also conducted by Novogene Co., Ltd. in Beijing, China). Tissues weighing 100 mg each were individually ground using the liquid nitrogen grinding method, and the resulting homogenate was resuspended in prechilled 80% methanol throuth vigorous vortexing. The samples were then incubated on ice for 5 min before being centrifuged at 15,000 g, 4°C for 20 minutes. A portion of the supernatant was diluted with LC-MS grade water to a final concentration containing 53% methanol. Subsequently, the samples were transferred to a fresh Eppendorf tubes and centrifuged again at 15000 g, 4°C for 20 minutes. Finally, the supernatant was injected into the LC-MS/MS system for analysis [46]. UHPLC-MS/MS analyses were performed using a Vanquish UHPLC system (ThermoFisher, Germany) coupled with an Orbitrap Q ExactiveTM HF mass spectrometer or Orbitrap Q ExactiveTMHF-X mass spectrometer (Thermo Fisher, Germany) at Novogene Co., Ltd. Samples were injected onto a Hypersil Gold column (100×2.1 mm, 1.9μm) using a linear gradient over a duration of 12 minutes at a flow rate of 0.2 mL/min. The column temperature was maintained to 40 °C throughout the progress. For positive polarity mode, the eluents consisted of eluent A (0.1% FA in Water) and eluent B (Methanol). For negative polarity mode, the eluents comprised eluent A (5 mM ammonium acetate, pH 9.0) and eluent B (Methanol). The solvent gradient was set as follows: 2% B, 1.5 min; 2-85% B, 3 min; 85-100% B, 10min; 100-2% B, 10.1 min; 2% B, 12 min. The Q ExactiveTM HF mass spectrometer was operated in positive/negative polarity mode with spray voltage of 3.5 kV, capillary temperature of 320 °C, sheath gas flow rate of 35 psi and aux gas flow rate of 10L/min, S-lens RF level of 60, Aux gas heater temperature of 350°C.
The raw data files generated by UHPLC-MS/MS were processed using Compound Discoverer 3.3 (CD3.3, ThermoFisher) for peak alignment, peak picking, and metabolite quantitation. Metabolites quantification involved integrating the peak area from the mass spectra of all the substances and correcting for variations in mass spectrometry peaks across different samples to ensure the accurate quantification. Metabolites were subjected to principal component analysis (PCA) and partial least squares discriminant analysis [47]. The differences in metabolites between treatments were analyzed using a t-test. The metabolites with VIP > 1 and P-value< 0.05 among with | log2 (fold change) | > 0.5 were considered as differential metabolites (DAMs). These DAMs were annotated using the KEGG database (https://www.genome.jp/kegg/pathway.html.) and mapped onto KEGG metabolic pathways for pathway analysis and enrichment.
2.5. Conjoint Analysis of Transcriptome and Metabolome
By simultaneously mapping DEGs and DAMs to the KEGG Pathway database, we obtained their shared pathway information. Correlation analysis was performed using quantitative values of genes and metabolites in all samples. Spearman’s correlation coefficient (Cor) and p-value were calculated using the Cor function of R language. Finally, a network map of DEGs-DAMs based on Spearman’s correlation coefficient (with |Cor| > 0.8 and p ≤ 0.05) was constructed using Cytoscape.
2.6. Quantitative qRT-PCR
Total RNA extracted by the TaKaRa MiniBEST Plant Total RNA Extraction Kit from all samples. The SynScript®Ⅲ RT SuperMix for qPCR was used for reverse transcription of RNA, and the synthesized first-strand cDNA was diluted 5 times and was used as a template for qRT-PCR. qPCR was carried out using the ArtiCanCEO SYBR qPCR Mix and Bio-Rad CFX96 (Bio-Rad CFX96, BIORAD, USA). The reaction conditions were as follows: pre-denaturation at 95 ℃ for 5 min, 40 cycles of denaturation at 95 ℃ for 15 s, and annealing, extension at 60 ℃ for 20 s, and extension at 72 ℃ for 20 s. The relative expression of genes was calculated using the 2−∆∆Ct method. Each pair of primers was set up with three biological replicates and three technical replicates. The gene expression was normalized to housekeeping gene Actin 1. The primers were listed in Table S8.
2.7. Statistical Analysis
The statistical analysis for the experiment on phenotype and qRT-PCR as well as content verification of DAMs, was performed using SPSS software. A significantly level of p ≤ 0.05 was considered to indicate a statistically significant difference in the t-test. The final graph was generated using Origin software.
3. Results
3.1. Characterization of Grain Filling Rate-Related Phenotypes in Foxtail Millet
To investigate dynamic changes in foxtail millet grain development after flowering, spikelets were collected from two cultivars (CS13 and CN47) at 7, 14, 21, 28, 35 and 42 days after flowering (DAF) during the grain filling period. The growth morphology changes of de-husked grains of foxtail millet was observed across six stages using a stereo microscope (Figure 1a,b). It was observed that CN47 displayed significant differences in grain size and millet color compared to CS13 at 14 DAF and 21 DAF stages. Additionally, grain-filling rates and thousand millets weight were measured for both cultivars at each time point mentioned (Figure 1c,d). There were distinct variations in GFR and thousand foxtail millet weight between CS13 and CN47, with CN47 consistently exhibiting higher thousand foxtail millet weight from 14 DAF to 42 DAF. The highest grain-filling rates were observed at 21 DAF for both cultivars, with CN47 exhibiting higher rates at 14 DAF and 21 DAF compared to CS13. No significant differences were found among the agronomic traits analyzed, including heading date (HD), plant height (PH), grain width (GW), grain number per panicle, and panicle number per plot. However, significant differences were observed in grain length (GL), grain weight per panicle, thousand-grain weight (TGW), and yield per plot (YPP) between CS13 and CN47 (Figure 1e). Analysis of agronomic traits indicated that the relatively high values of GL, TGW, and YPP in CN47 could be attributed to its elevated grain- filling rate.
3.2. Transcriptomic Difference in the Grains during Grain-Filling Stages between Foxtail Millet Cultivars
Transcription profiles of CS13 and CN47 were examined at the 14 DAF and 21 DAF stages, with three biological replicates used for each stage. Twelve cDNA libraries were sequenced separately by Illumina sequencing. An average of 6.7 Gb clean bases per library were generated after removing the adapter sequences, low quality and contaminated reads, with a mean Q30 level of 94.8%. This indicated that the library contained high-quality raw reads (Table S2). The read mapping ratio to the reference genome per sample ranged from 92% to 94% (Table S3). Gene expression levels were quantified using fragments mapped (FPKM). Principal component analysis (PCA) revealed distinct clustering of the samples, with tight clusters formed by the three biological replicates within each group (Figure 2a). Differential expression analysis was performed to compare CS13_14 DAF vs CN47_14 DAF and CS13_21 DAF vs CN47_21 DAF, with a fold change threshold of > 1 and false discovery rate FDR < 0.05. The CS13_14 DAF vs CN47_14 DAF comparison revealed a total of 765 differentially expressed genes (DEGs), with 439 genes up-regulated and 326 genes down-regulated. Similarly, 908 DEGs were identified in the CS13_21 DAF vs CN47_21 DAF comparison, with 471 up-regulated genes and 439 down-regulated genes (Figure 2b).
The GO enrichment analyses were performed to gain further insights into the functions and associated biological processes in which the DEGs participated, with the results depicted in Figure 3. The GO analysis revealed that the DEGs were classified into cellular components (CC), molecular functions (MF), and biological processes (BP). We further analyzed the top 10 categories for CC, MF, and BP in the GO annotation (Figure 3a,b). In terms of molecular functions, we observed an enrichment of shared GO terms such as ADP binding, nutrient reservoir activity and cysteine-type peptidase activity. Regarding cellular components, both comparison groups showed enrichment of GO terms related to the DNA-directed RNA polymerase II, holoenzyme, transcription factor complex, DNA-directed RNA polymerase complex, nuclear DNA-directed RNA polymerase complex and RNA polymerase complex. Different GO terms were enriched in two comparision groups for biological processes, with only two shared terms identified. These findings indicated that various factors influence the differences in grain-filling rates between CS13 and CN47.
To reveal the biological pathways associated with GFR, the pathway enrichment analysis of the DEGs was also performted by the Kyoto Encyclopedia of Genes and Genomes (KEGG), with the results depicted in Figure 3c,d. The KEGG enrichment analysis revealed that 12 out of the top 20 terms were shared between the two stages, indicating a high consistency in the pathways involved in grain-filling. We observed significant enrichment in pathways including basal transcription factor, sphingolipid metabolism, zeatin biosynthesis, plant-pathogen interaction, motor proteins, ribosome biogenesis in eukaryotes, nucleotide metabolism, fatty acid degradation, biotin metabolism, tyrosine metabolism, fatty acid biosynthesis, fatty acid metabolism. Moreover, the pathways of plant hormone signal transduction and nitrogen metabolism were identified as pivotal for the process of grain-filling. These findings provided further evidence that the regulation of grain-filling rate involved multiple pathways.
3.3. Metabolite Difference in the Grains during Grain-Filling Stages between Foxtail Millet Cultivars
In order to identify differential metabolites between the two cultivars at 14 DAF and 21 DAF stages, a non-targeted metabolic analysis was conducted,which revealed distinct patterns of metabolite accumulation. Metabolites were primarily categorized into two modes: the positive ion mode (POS) and the negative ion mode (NEG). Metabolites exhibiting with | log2 (fold change) | > 0.5 and VIP ≥ 1 were chosen as differentially accumulated metabolites (DAMs). In the POS and NEG modes, a total of 246 DAMs (146 up-regulated, 100 down-regulated) were identified between CS13_14 vs CSN47_14 DAF, while 268 DAMs (133 up-regulated, 135 down-regulated) were found between CS13_21 DAF vs CSN47_21 DAF (Table S4; Figure 4a,b). The gene clustering heatmap analysis demonstrated excellent biological repeatability, with clear distinctions among the samples (Figure 4c,d). At 14 DAF stage, 44 DAMs were annotated to the KEGG pathway and mapped to 24 pathways (Table S5). At 21 DAF stage, 40 DAMs were annotated to the KEGG pathway and mapped to 23 pathways (Table S6). The top 20 pathway were depicted in Figure 4e,f. A large number of identical pathways have been discovered at 14 DAF and 21 DAF stages. These included flavonoid biosynthesis, biosynthesis of secondary metabolites, flavone and flavonol biosynthesis, carotenoid biosynthesis, isoflavonoid biosynthesis, isoquinoline alkaloid biosynthesis, betalain biosynthesis, plant hormone signal transduction, tyrosine metabolism, sesquiterpenoid and triterpenoid biosynthesis, caffeine metabolism, anthocyanin biosynthesis, sulfur relay system, glutathione metabolism, ascorbate and aldarate metabolism, ATP-binding cassette (ABC) transporters, beta-Alanine metabolism, and stilbenoid, diarylheptanoid and gingerol biosynthesis. The result suggested that these metabolic pathways exhibited similarly between the two stages during grain filling.
3.4. Integrated Transcriptome and Metabolome Analysis
Based on the results of DAMs and DEGs, a joint analysis of the metabolome and transcriptome was then conducted to unveil their relationship and regulatory mechanism. Figure 5 displayed the KEGG pathways that were co-enriched in both DAMs and DEGs during 14 DAF and 21 DAF stages. The results showed that flavonoid biosynthesis, plant hormone signal transduction, tyrosine metabolism, ABC transporters, beta-Alanine metabolism, stilbenoid, diarylheptanoid and gingerol biosynthesis were identified as shared pathways in both comparisons of CS13_14 DAF vs CSN47_14 DAF and CS13_21 DAF vs CSN47_21 DAF (Figuure 5a, 5b). However, the DAMs and DEGs mapped to shared pathway were differed at different stages (Table S7).
To identify key genes related to grain-filling rate, a Venn diagram analysis was conducted to compare all DEGs and DAMs at the 14 DAF and 21 DAF stages of two foxtail millet cultivars. As shown in the Figure 5c, there were 512 identical DEGs for the comparisons of CS13 and CSN47, with 274 genes up-regulated and 238 genes down-regulated showing a similar trend of change, accounting for more 50 percent. At the same time, we found 116 identical metabolites, including 66 up-regulated metabolites and 55 down-regulated metabolites (Figure 5d). The change trend of DAMs were also the same. Further analysis reveals that shared DEGs and DAMs were enriched the same pathway as mentioned above (Table S8; Figure 5e). It can be inferred that flavonoid biosynthesis, plant hormone signal transduction, tyrosine metabolism, ABC transporters, beta-alanine metabolism, stilbenoid, diarylheptanoid and gingerol biosynthesis may be related to the high GFR of the CN47.
3.5. Many Hormones Were Key Regulators of the Grain Filling Rate
KEGG pathway classification analysis was performed on shared DEGs and DAMs, revealing a significant enrichment of share DEGs in hormone signaling. Our results have identified 11 genes involved in phytohormones signaling, including auxin, cytokinin (CTK), and ethylene (ETH) signaling pathways. To investigate the expression patterns of phytohormone-related genes, we exmined gene expression profile clustering. Among the phytohormones, auxin played a crucial role in grain filling stages [48]. We found several key genes enriched in the auxin biosynthesis (tryptophan metabolism), transport (ABC transport) and signal transduction pathway at grain filling 14 DAF and 21 DAF stages. And a network was established to display the relationship between auxin and plant growth and development (Figure 6). It is worth noting that the tryptophan-dependent pathway is the primary pathway responsible for the production of indole-3-acetic acid (IAA) [49]. SETIT_026842mg was identified, which encoded a YUCCA protein associated with tryptophan metabolism that acted as a rate-limiting enzyme for auxin biosynthesis. The gene was expressed at low levels in CN47 at 14 DAF and 21 DAF stages, it may negatively regulate GFR since the IAA concentration of CN47 was higher than CS13. And two genes related to the ABCB1 were identified, namely SETIT_032403mg and SETIT_000076mg. They were linked to ABC transport and coded an ABCB protein that interacted with PIN protein to regulate Polar Auxin Transport. In CN47, SETIT_032403mg showed low expression level at the 14 DAF and 21 DAF stages of grain filling progress. Conversely, the expression patterns of SETIT_000076mg were different. Additionally, we identified several key genes involved in the auxin signal transduction pathway, including three AUX1, one AUX/IAA, and one SAUR, SETIT_0218801mg, SETIT_0218802mg, SETIT_035200mg, SETIT_007373mg and SETIT_028123mg. Compared with the 14 DAF, the downregulated genes SETIT_0218801mg, SETIT_0218802mg, SETIT_035200mg and SETIT_007373mg showed high expression differences at 21 DAF in CN47 compared to CS13. The small Auxin-Up RNA (SAUR) families constituted the most important family of auxin-responsive proteins, potentially playing an important role in the regulation of foxtail millet grain development [50]. Furthermore, SETIT_028123mg, which was highly expressed in CN47 at 14 DAF and 21 DAF stages, was identified related to SUAR. It may be have a positive correlation with the GFR of foxtail millet. These results suggested their potential role in facilitating extracellular-to-intracellular auxin transport. Notably, SETIT_007373mg and SETIT_028123mg, as early response genes to auxin, could regulate downstream gene expression. These data suggest that these genes related to auxin signaling are involved in grain filling progress and GFR. Therefore, the potential function of these key genes related to auxin biosynthesis, transport, and signal transduction underscores the significance of IAA during grain filling and GFR.
Cytokinin (CTK), an important phytohormone, plays a significant role in grain filling progress [51]. The CTK biosynthesis (Zeatin metabolism) and signal transduction pathway exhibited enrichment of several genes during grain filling stages at 14 DAF and 21 DAF, as depicted in Figure 7. Furthermore, a network was established to illustrate the correlation between CTK and plant growth and development. It was noteworthy that the Zeatin metabolism pathway played an important role for the production of CTK. Their genes include a prenyltransferase (SETIT_008985mg), and a cytochrome monooxygenase (SETIT_032720mg), which respectively encodes IPTs protein and CYP735A protein associated with zeatin metabolism. These enzymes act as rate-limiting enzymes for CTK biosynthesis. The expression level of SETIT_008985mg was significantly upregulated at 14 DAF and 21 DAF stages in CN47, while the CTK contents were also higher in CN47 compared to CN13 at these developmental stages. This suggested that SETIT_008985mg may be positively correlated with the GFR of foxtail millet. Additionally, we identified three key genes enriched in the CTK signal transduction pathway during grain filling stages at 14 DAF and 21 DAF, These genes were involved in SETIT_023526mg, SETIT_018243mg, and SETIT_011287mg. Specifically, SETIT_023526mg was identified as encoding the AHPs protein which facilitated the transfer of phosphate groups to response regulators (SETIT_018243mg, SETIT_011287mg), thereby inducing gene expression and regulating plant growth and development. This gene exhibited high expression levels in CN47 at 14 DAF and 21 DAF stages, suggesting a potential positive correlation with foxtail millet's GFR. Additionally, SETIT_018243mg and SETIT_011287mg, as members of the type-A (ARR) family of response regulators, displayed distinct expression patterns between CN47 and CS13 during the 14 DAF and 21 DAF stages. These three genes collectively functioned as rate-limiting enzymes for CTK signal transduction. In addition, this study identified SETIT_029213mg and SETIT_009909mg, which were associated with the ethylene-insensitive 3 (EIN3)-like 1 (EIL1) protein and EIN3-like 5 (EIL5) protein respectively (Figure S1). These genes exhibited high expression levels at CN47 during the 21 DAF stage, suggesting may be a positive correlation with GFR.
3.6. qRT-PCR Verification of RNA-seq Data
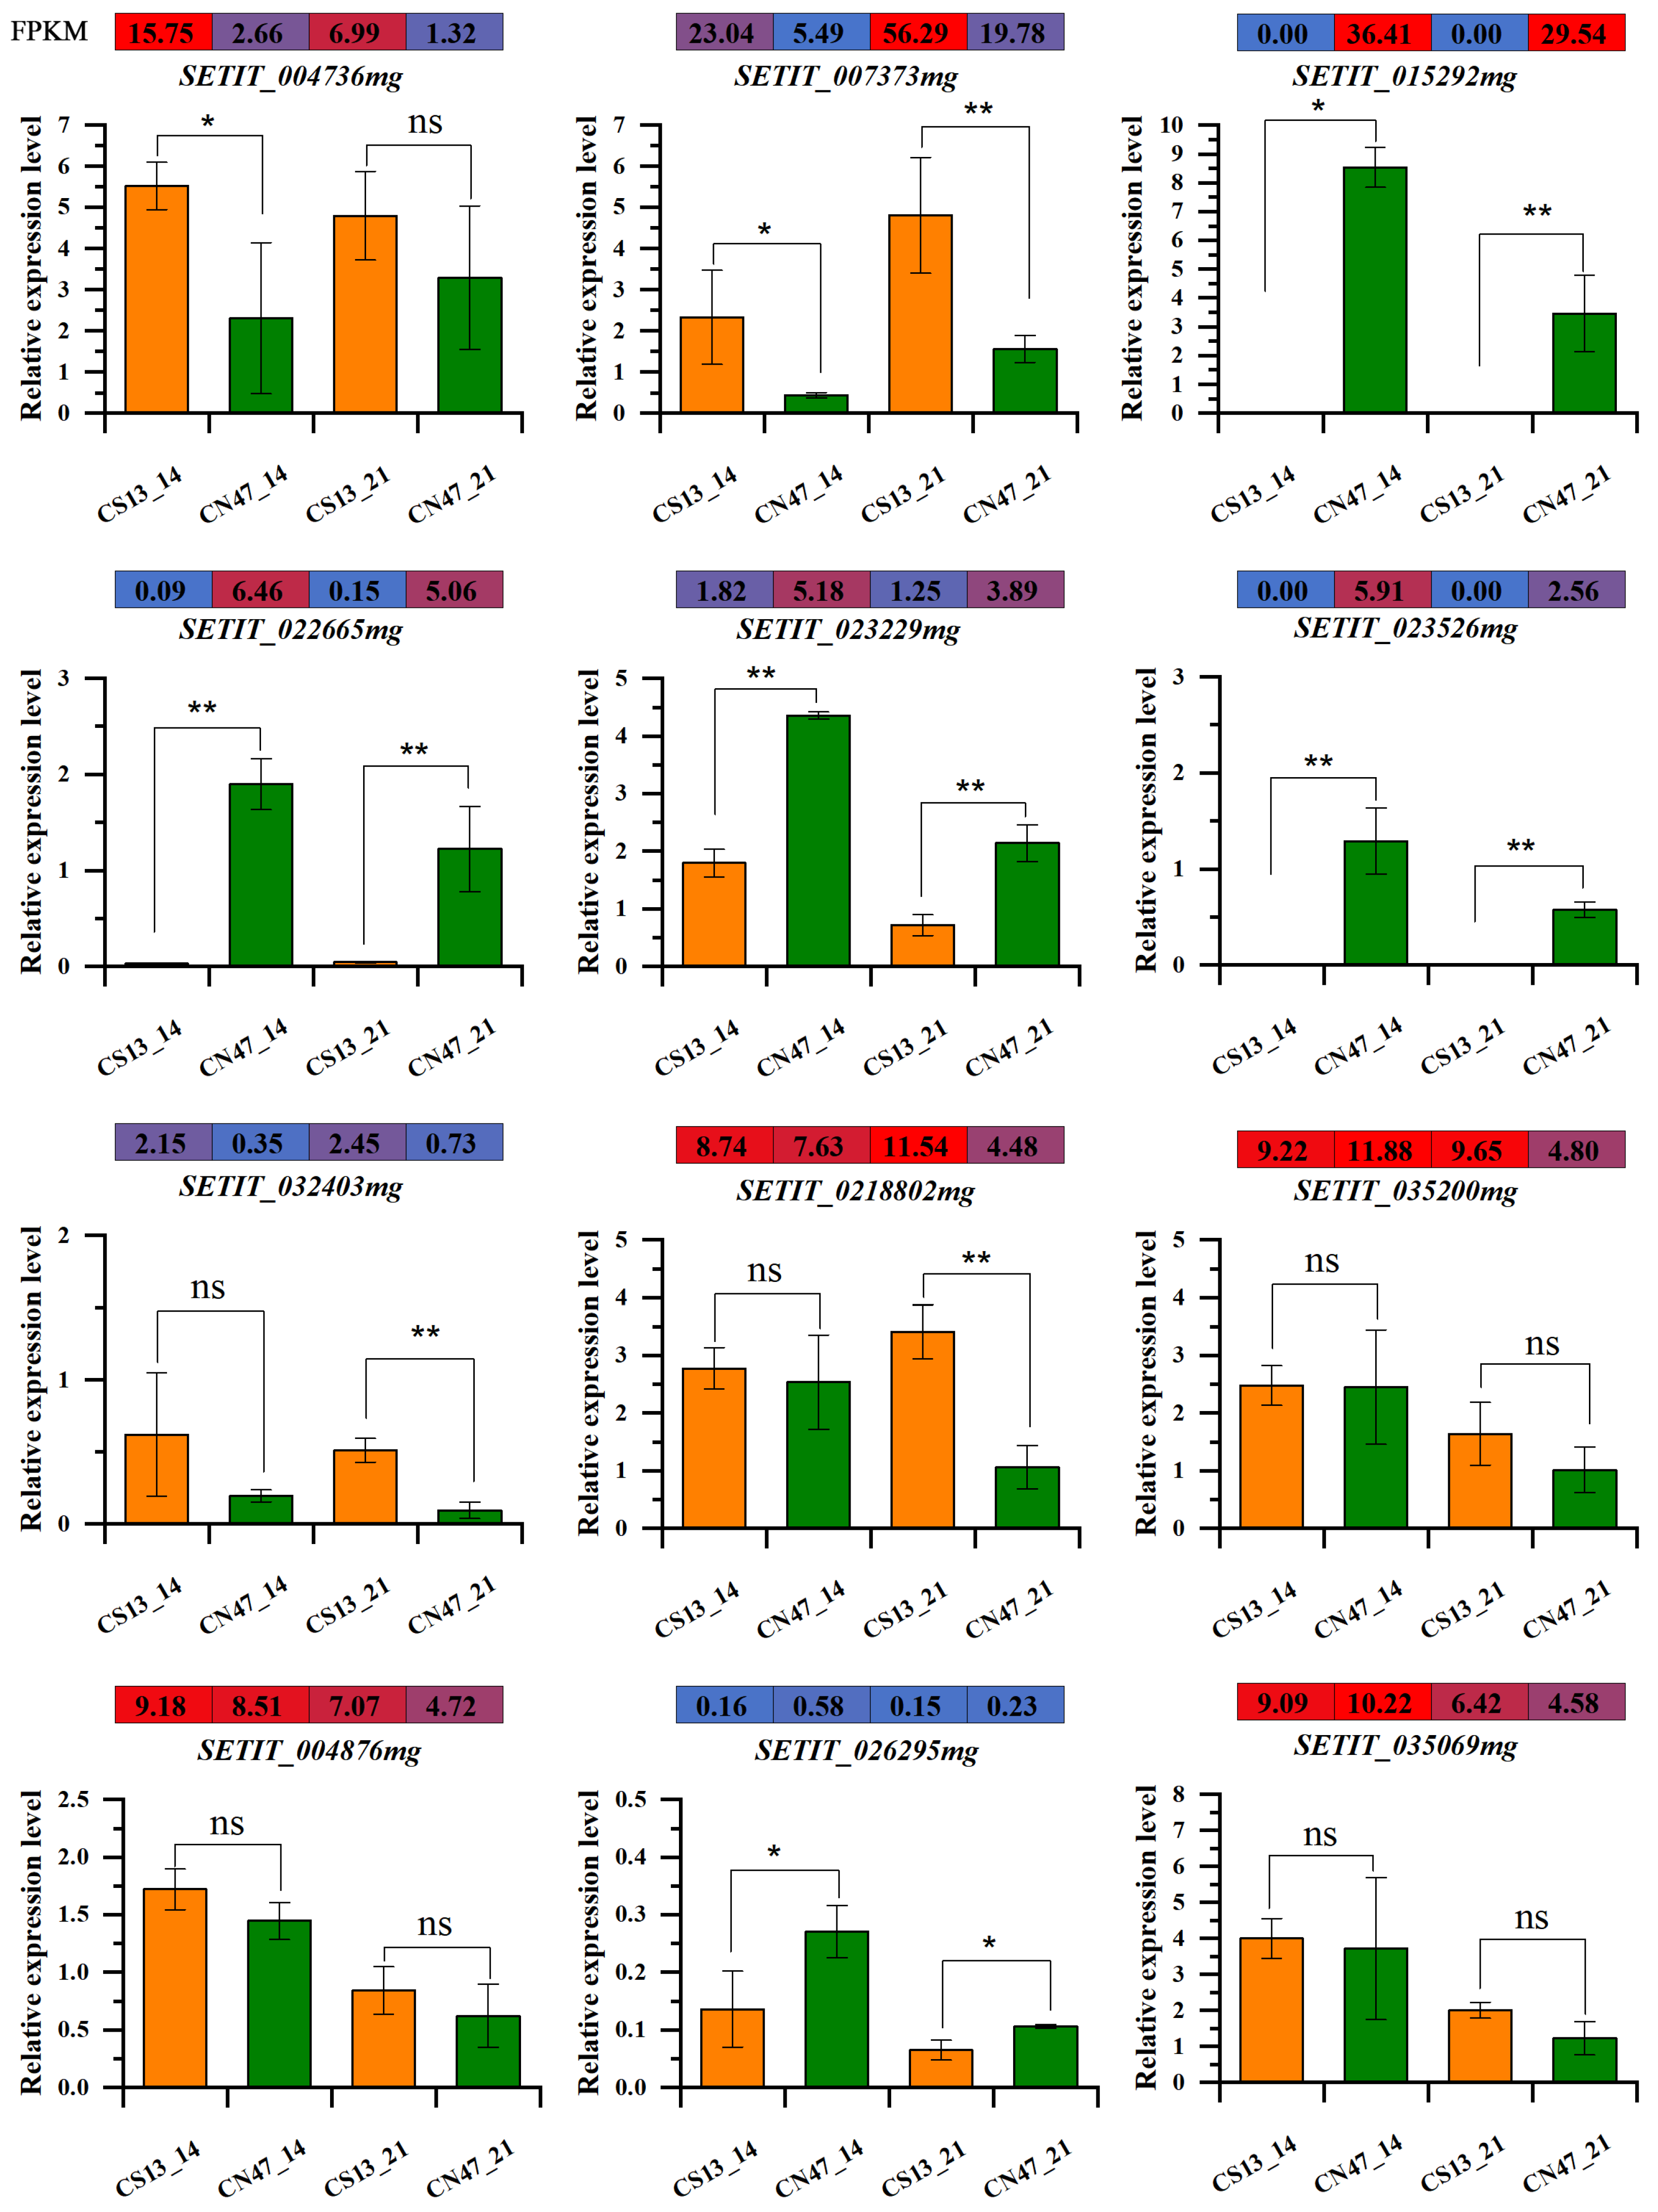
To ensure the reliability of our transcriptome data, we selected 12 key genes through qRT-PCR validation (Figure 8). These genes were involved in plant hormone signal transduction, flavonoid biosynthesis, ABC transporters, tyrosine metabolism, beta-Alanine metabolism, as well as stilbenoid, diarylheptanoid and gingerol biosynthesis. The results of our qRT-PCR analysis demonstrated that the observed variation in gene expression levels aligned with those obtained from the RNA-seq data. This concurrence strongly suggests the reliability of our analytical findings.
4. Discussion
Foxtail millet grain filling progress is crucial for seed setting, grain weight, quality, and yield [39]. This process is highly sophisticated, involving the accumulation of carbohydrates and other nutrients by the developing endosperm to synthesize starch and enhance grain development [52]. The progress of foxtail millet grain filling is manifested in four stages: the ovule stage before pollination (ovule stage, 1-5 DAF), the milk stage after pollination (milk stage, 6-11 DAF), nutrient storage stage after pollination (dough stage, 12-22 DAF), and the grain maturity stage (maturity stage, 23-30 DAF) [9]. The interaction of phytohormones, the activity of starch biosynthesis enzymes, the levels of polyamines, and the synthesis and translocation of assimilates all play essential roles in grain filling [24,53,54]. Various factors, such as photosynthetic products, transportation of stored substances, transport tissues, physiological activities of the grains, regulation of plant hormones, and environmental factors, can restrict this progress [55]. Enhancing GFR, particularly improving the rate at which grains are filled with nutrients and water, has been demonstrated as an effective strategy to enhance crop yield and quality [56]. The grain filling rate is an important agronomic trait primarily influenced by genetic factors, while research on the molecular mechanisms of grain development in cereal crops has only been carried out in recent years. Some genes and quantitative trait loci (QTLs) associated with the grain size and GFR have been identified and cloned in rice, maize or wheat [32,33,57]. However, the molecular mechanisms related to GFR in foxtail millet have not yet been reported.
CS13 and CN47 are well-suited for cultivation in the mid-late mature spring foxtail millet region of northwest China, exhibiting a growth period of 122 days and a heading date ranging from 48 to 50 days [58,59]. The two cultivars had similar agronomic traits, except for the thousand-grain weight. Nevertheless, we found that CN47 had a significantly higher grain filling rate at 14 DAF and 21 DAF stages compared to CS13. Therefore, CN47 exhibited high grain filling rate, whereas CS13 displayed low grain filling rate. The significant disparity in grain filling rate between CN47 and CS13 made it the optimal material for investigating the grain filling rate of spring foxtail millet in the middle and late maturity regions of northwest China. So we sampled and sequenced the grains of foxtail millet in both periods. Therefore, this study has provided experimental materials for exploring genes and pathways related to the regulation of grain filling rate.
The utilization of RAN-seq is indispensable in the investigation of plant development processes, facilitating our comprehension of gene expression levels across various stages or cultivars [60]. The metabolites, serving as the ultimate outcomes of gene expression, are intricately associated with the development of plant traits. It is a common approach to identify pivotal genes and elucidate the mechanism underlying phenotypic variations through the integrated analysis of transcriptome and metabolome. The transcriptome analysis conducted in foxtail millet at five distinct grain filling stages initially revealed the involvement of pathways related to starch biosynthesis, cell-wall invertases, hormone signal transduction, and polyamine metabolism in the process of grain filling [36]. Subsequently, the transcript dynamics involved in foxtail millet grain development at four stages were investigated using RNA-seq. The results revealed the intricate mechanisms underlying plant hormone signaling, starch and sugar metabolism, carotenoid metabolism, flavonoid biosynthesis, and folate metabolism pathways during grain development in foxtail millet [9]. Moreover, a comparative transcriptome analysis also revealed significant variations in the expression levels of genes related to the ABC transporter, photosynthesis, and the photosynthesis-antenna protein pathway. Besides, a large-scale metabolome study indicated dynamic changes in flavonoid, glutathione, linoleic acid, starch , sucrose, valine, leucine and isoleucine during foxtail millet grain filling [38]. In this study, the transcriptome analysis conducted at 14 DAF and 21 DAF stages revealed inconsistencies with previous reports in terms of significantly enriched pathways. However, metabolome analysis revealed that pathways such as flavonoid biosynthesis, ABC transporters, photosynthesis, and plant hormone signal transduction were consistent with previous research findings. The findings indicated that a limited number of DEGs were implicated in pathways associated with the process of grain filling. The DEGs and DAMs identified between CS13 and CN47 at 14 DAF and 21 DAF stages were found to be associated with pathways such as flavonoid biosynthesis, plant hormone signal transduction, tyrosine metabolism, ABC transporters, beta-Alanine metabolism, as well as stilbenoid, diarylheptanoid and gingerol biosynthesis. The results obtained above demonstrate that flavonoid biosynthesis, ABC transporters, and plant hormone signal transduction pathways play a crucial role in influencing the grain filling process of foxtail millet. Importantly, these pathways have also been identified as potentially significant factors contributing to the disparity in GFR between CS13 and CN47.
Flavonoids are the predominant yellow pigments found in plants and are believed to confer nutritional and pharmacological benefits to plants [61]. They play essential roles in enhancing the overall quality of plants, encompassing aspects such as color and flavor [62]. The study revealed that foxtail millets were abundant in flavonoids, such as vitexin, naringenin, and naringenin chalcone. It was widely acknowledged that the flavonoid metabolic pathway significantly influenced the development of a yellow hue in de-husked grains. In essence, the flavonoid metabolic pathway played a crucial role in grain filling and GFR. In the study, the integration of the DEGs and DAMs between CS13 and CN47 at 14 DAF and 21 DAF stages identified co-enrichment of flavonoid biosynthesis. Specifically, the pathway only contained one gene, SETIT_015292mg, which encoded a methyltransferase involved in the post-modification of flavonoids. The gene clearly encoded flavonoid O-methyltransferase (FOMT), which serves as a key modifying enzyme in the flavonoid metabolic pathway by catalyzing the synthesis of O-methylated derivatives of flavonoids [63]. Furthermore, SETIT_015292mg also played a crucial role in the stilbenoid, diarylheptanoid and gingerol biosynthesis pathway (Table S8). Interestingly, the expression of SETIT_015292mg was observed exclusively in CN47, but not in CS13, which could potentially serve as a significant contributing factor to the high GFR in CN 47 (Figure S2).
The ABC transporters are essential for normal plant development and play a pivotal role in diverse biological processes, encompassing auxin transport and seed development in plants [64]. In cereal crops, numerous genes related to ABC transporters had been found and identified to be linked with grain development and grain filling. TaABCC3 promoted grain formation in wheat, while its suppression resulted in a reduction in the number of grains [65]. And wheat ABCC13 was reported functionally essential for grain development [66]. Similarly, strong expression of OsABCI15 and OsABCI16 was exhibited in the seed, including their involvement in seed development in rice. Overexpression of either gene significantly enhanced the grain yield, while CRISPR/Cas9-mediated loss-of-function mutations in these genes resulted in incomplete filling of developing seeds [67]. The expression levels of several ABC transporter-related DEGs, including ABCB and ABCC genes, were found to be significantly upregulated during the late stages of grain filling in foxtail millets [47]. In contrast, our study found that two ABCB1 genes in ABC transporters pathway exerted influences on grain filling at different stages by regulating auxin transport. These genes, SETIT_032403mg and SETIT_000076mg, exhibited different expression patterns between CS13 and CN47 at 14 DAF and 21 DAF stages, suggesting diverse roles of ABC transporters in GFR.
Phytohormones play an extremely crucial role in kernel development and grain filling in crops. So far, numerous genes related to plant hormones have been identified. Auxin can induce the expression of growth-regulating genes to regulate the panicle and spikelet development in rice [68]. Furthermore, a study had reported that auxin-response factors potentially influence early foxtail millet grain development in foxtail millet [47]. Additionally, some studies showed that CTK and ETH were involved in regulating grain filling [69,70]. In our study, we observed that many DEGs were related to plant hormone biosynthesis and/or signaling pathways, these genes included YUCCA, ABCB, AUXIN1, AUX/IAA, SAUR, IPTs, AHP, ARR, EIN3. Notably, Indole-3-acetic acid (IAA) was detected as a DAM, and the majority of genes associated with auxin were found in the plant hormone signal transduction pathway. Genes associated with the auxin signaling pathway may serve as valuable resources for molecular breeding of foxtail millet. Therefore, our primary focus lies on elucidating the mechanisms underlying auxin-mediated grain filling and exploring strategies to regulate the growth factor receptor (GFR).
Auxin, a phytohormone, is known to be crucial for endosperm development and grain filling [57]. YUCCA flavin monooxygenases are involved in auxin biosynthesis, and the rice auxin biosynthesis gene (OsYUC11) is essential for grain filling in rice. Mutations in OsYUC11 have been shown to hinder grain filling and the accumulation of storage proteins [71,72]. Blocking auxin transport led to abnormalities of seed [73]. The intercellular transport of auxin, facilitated by PIN [74], ABCB [75], and AUXIN [76], plays a crucial role in establishing and maintaining optimal concentrations of auxin. It reported that the ABCB proteins were involved in auxin transport, with ABCB1, ABCB4, and ABCB19 being responsible for directional transport in rice [77]. The auxin signal transduction pathway, encompassing TIR1/AFB co-receptors, Aux/IAA repressors, and ARF transcription factors, is recognized for its regulatory role in grain yield. Nevertheless, its involvement in the grain filling process remains ambiguous [78,79]. SAUR genes, which are early auxin-responsive genes, play a role in plant growth, particularly in cell elongation [80]. In this study, we identified several vital genes related to auxin biosynthesis, transport and signal transduction. Contrary to findings in other plant species, the expression of a YUCCA gene was found to be higher in CS13 with low GFR compared to CN47 with high GFR at 14 DAF. Interestingly, the variation in auxin levels between the two cultivars was observed at 21 DAF instead of at 14 DAF. It is hypothesized that YUCCA may usexert a negative regulatory effect on auxin synthesis, with its impact being delayed. Furthermore, several genes related to auxin transport pathway have been identified, belonging to the ABCB gene family and AUXIN gene family. In rice, the low expression of OsLAX1/OsAUX1 was found to increased root length [81]. Similarly the low expression level of four genes in CN47 may also lead to an increase in grain length by promoting grain filling rate. The expression levels of SETIT_007373mg and SETIT_028123mg as auxin response gene exhibited contrasting trends. The expression level of AUX/IAA gene SETIT_007373mg was found to be higher in CS13, whereas a decrease in expression was observed for the SAUR gene SETIT_028123mg. The expression profiles of different auxin response genes may vary in their responsiveness to auxin signaling pathways. Based on these findings, it is reasonable to speculate that these genes may play distinct regulatory roles at different stages; further investigation is required to elucidate their involvement in the grain filling process.
5. Conclusions
In this study, we conducted a comparative analysis of the transcriptome and metabolome at 14 DAF and 21 DAF stages to investigate the molecular mechanism regulating GFR in CS13 (low GFR) and CN47 (high GFR). The results revealed that a total of 765 DEGs and 908 DEGs, as well as 246 DAMs and 268 DAMs, were identified at 14 DAF and 21 DAF stages both in CS13 and CN47 respectively. The functional analysis of DEGs and DAMs revealed stage-specific properties in the GFR of foxtail millet. Several important pathways, such as flavonoid biosynthesis, plant hormone signal transduction, tyrosine metabolism, ABC transporters, beta-Alanine metabolism, as well as Stilbenoid, diarylheptanoid, and gingerol biosynthesis were enriched via a conjoint analysis of DEGs and DAMs. Notably most of the share DEGs were enriched in hormone signaling pathways, including auxin, cytokinin, and so on. Especially, several key genes related to auxin biosynthesis (YUCCA), transport (ABCB1) and signal transduction (AUX1, AUX/IAA, SAUR) pathway were identified in the ABC transporters and plant hormone signal transduction pathway. These findings highlight the significant role of auxin in regulating GFR and grain filling progress, providing valuable molecular insights for investigating differences in GFR among foxtail millet cultivars and theoretical mechanisms for high-yield breeding.
Supplementary Materials
The following supporting information can be downloaded at the website of this paper posted on Preprints.org, Figure S1: The genes expression of ethylene (ETH) transport and signal transduction pathway ; Figure S2: The expression levels (FPKM) of SETIT_015292mg at 14 DAF and 21 DAF between CS13 and CN47. Table S1: Primers used for qRT-PCR; Table S2: Summary of sequencing data quality and transcriptome statistics; Table S3: Sample comparison regional statistics; Table S4: Statistical information of the identified metabolites; Table S5: KEGG pathway classification of DAMs in 14 DAF stage; Table S6: KEGG pathway classification of DAMs in 21 DAF stage; Table S7: DAMs and DEGs mapped to shared pathway in 14 DAF and 21 DAF stages; Table S8: Shared DAMs and DEGs mapped to shared pathways.
Author Contributions
Y.H., P.Z. and A.Z. conceived and designed the experiments; Y.H., and P.Z., investigation, data curation, validation, writing, revising; Y.Z., M.L., investigation and formal analysis; E.G. investigation; G.W. contributed reagents/analysis tools. A.Z. review, editing, and funding acquisition. All authors have read and agreed to the published version of the manuscript.
Funding
This research was funded by the National Key Research and Development Program of China (2023YFD1202704), Construction Project of National Modern Agricultural Industry Technology System (CARS-06-14.5-A21), Construction of modern agricultural industrial technology system in Shanxi Province (2023CYJSTX04-04).
Data Availability Statement
Available upon request from the corresponding author.
Conflicts of Interest
The authors declare no conflicts of interest.
References
- Lata, C.; Gupta, S.; Prasad, M. Foxtail millet: a model crop for genetic and genomic studies in bioenergy grasses. Crit. Rev. Biotechnol. 2012, 33, 328–343. [Google Scholar] [CrossRef] [PubMed]
- Memariani, Z.; Abbas, S.Q.; ul Hassan, S.S.; Ahmadi, A.; Chabra, A. Naringin and naringenin as anticancer agents and adjuvants in cancer combination therapy: Efficacy and molecular mechanisms of action, a comprehensive narrative review. Pharmacol. Res. 2021, 171, 105264. [Google Scholar] [CrossRef] [PubMed]
- Kaur, P.; Purewal, S.S.; Sandhu, K.S.; Kaur, M.; Salar, R.K. Millets: a cereal grain with potent antioxidants and health benefits. J. Food Meas. Charact. 2018, 13, 793–806. [Google Scholar] [CrossRef]
- Sachdev, N.; Goomer, S.; Singh, L.R. Foxtail millet: a potential crop to meet future demand scenario for alternative sustainable protein. J. Sci. Food Agric. 2020, 101, 831–842. [Google Scholar] [CrossRef] [PubMed]
- Shyamli, P.S.; Rana, S.; Suranjika, S.; Muthamilarasan, M.; Parida, A.; Prasad, M. Genetic determinants of micronutrient traits in graminaceous crops to combat hidden hunger. Theor. Appl. Genet. 2021, 134, 3147–3165. [Google Scholar] [CrossRef] [PubMed]
- Amadou, I.; Amza, T.; Shi, Y.; Le, G. Chemical analysis and antioxidant properties of foxtail millet bran extracts. SJST. 2011, 33, 509−15 http://rdopsuacth/sjstweb/indexphp. [Google Scholar]
- Liang, S.; Yang, G.; Ma, Y. Chemical Characteristics and Fatty Acid Profile of Foxtail Millet Bran Oil. J. Am. Oil Chem. Soc. 2009, 87, 63–67. [Google Scholar] [CrossRef]
- Sharma, N.; Niranjan, K. Foxtail millet: Properties, processing, health benefits, and uses. Food Rev. Int. 2017, 34, 329–363. [Google Scholar] [CrossRef]
- Wang, D.; Su, M.; Hao, J.-H.; Li, Z.-D.; Dong, S.; Yuan, X.; Li, X.; Gao, L.; Chu, X.; Yang, G.; et al. Dynamic transcriptome landscape of foxtail millet grain development. Seed Biol. 2023, 2. [Google Scholar] [CrossRef]
- Xing, Y.; Zhang, Q. Genetic and Molecular Bases of Rice Yield. Annu. Rev. Plant Biol. 2010, 61, 421–442. [Google Scholar] [CrossRef]
- Li, X.; Pan, Z. A study on the grain filling characteristic of different weight wheat. Rev China Agric Sci Technol. 2005, 7, 26–30. [Google Scholar] [CrossRef]
- Yoshida, S.; Hara, T. Effects of air temperature and light on grain filling of an indica and a japonica rice (Oryza sativaL.) under controlled environmental conditions. Soil Sci. Plant Nutr. 1977, 23, 93–107. [Google Scholar] [CrossRef]
- Wiegand, C.L.; Cuellar, J.A. Duration of Grain Filling and Kernel Weight of Wheat as Affected by Temparature1. Crop. Sci. 1981, 21, 95–101. [Google Scholar] [CrossRef]
- Ma, J.; Ming, D.; Ma, W.; Xu, F. Effects of different nitrogen application periods on rice starch accumulation and starch synthesis Studies on the activity changes of related enzymes. Scientia Agricultura Sinica. 2005, 38, 290–296. [Google Scholar] [CrossRef]
- Wang, Z.; Xu, Y.; Chen, T.; Zhang, H.; Yang, J.; Zhang, J. Abscisic acid and the key enzymes and genes in sucrose-to-starch conversion in rice spikelets in response to soil drying during grain filling. Planta 2015, 241, 1091–1107. [Google Scholar] [CrossRef] [PubMed]
- Van Sanford, D.A. Variation in Kernel Growth Characters Among Soft Red Winter Wheats1. Crop. Sci. 1985, 25, 626–630. [Google Scholar] [CrossRef]
- Mashiringwani, N.A.; Mashingaidze, K.; Kangai, J.; Olsen, K. Genetic basis of grain filling rate in wheat (Triticum aestivum L. emend. Thell.). Euphytica 1994, 76, 33–44. [Google Scholar] [CrossRef]
- Jones, D.B.; Peterson, M.L.; Geng, S. Association Between Grain Filling Rate and Duration and Yield Components in Rice1. Crop. Sci. 1979, 19, 641–644. [Google Scholar] [CrossRef]
- Zhao, Y.; Peng, T.; Sun, H.; Teotia, S.; Wen, H.; Du, Y.; Zhang, J.; Li, J.; Tang, G.; Xue, H.; et al. miR1432-OsACOT (Acyl-CoA thioesterase) module determines grain yield via enhancing grain filling rate in rice. Plant Biotechnol. J. 2018, 17, 712–723. [Google Scholar] [CrossRef]
- Zhu, D.; Wang, H.; Liu, D.; Gao, D.; Lu, G.; Wang, J.; Gao, Z.; Lu, C. Characteristics of grain filling and dehydration in wheat. Scientia Agricultura Sinica. 2019, 52, 4251–4261. [Google Scholar] [CrossRef]
- Wei, X.; Jiao, G.; Lin, H.; Sheng, Z.; Shao, G.; Xie, L.; Tang, S.; Xu, Q.; Hu, P. GRAIN INCOMPLETE FILLING 2 regulates grain filling and starch synthesis during rice caryopsis development. J. Integr. Plant Biol. 2017, 59, 134–153. [Google Scholar] [CrossRef]
- Ishibashi, Y.; Okamura, K.; Miyazaki, M.; Phan, T.; Yuasa, T.; Iwaya-Inoue, M. Expression of rice sucrose transporter gene OsSUT1 in sink and source organs shaded during grain filling may affect grain yield and quality. Environ. Exp. Bot. 2014, 97, 49–54. [Google Scholar] [CrossRef]
- Bai, A.-N.; Lu, X.-D.; Li, D.-Q.; Liu, J.-X.; Liu, C.-M. NF-YB1-regulated expression of sucrose transporters in aleurone facilitates sugar loading to rice endosperm. Cell Res. 2015, 26, 384–388. [Google Scholar] [CrossRef] [PubMed]
- Sosso, D.; Luo, D.; Li, Q.-B.; Sasse, J.; Yang, J.; Gendrot, G.; Suzuki, M.; E Koch, K.; McCarty, D.R.; Chourey, P.S.; et al. Seed filling in domesticated maize and rice depends on SWEET-mediated hexose transport. Nat. Genet. 2015, 47, 1489–1493. [Google Scholar] [CrossRef]
- Deng, Y.; Wang, J.; Zhang, Z.; Wu, Y. Transactivation of Sus1 and Sus2 by Opaque2 is an essential supplement to sucrose synthase-mediated endosperm filling in maize. Plant Biotechnol. J. 2020, 18, 1897–1907. [Google Scholar] [CrossRef] [PubMed]
- Wang, E.; Wang, J.; Zhu, X.; Hao, W.; Wang, L.; Li, Q.; Zhang, L.; He, W.; Lu, B.; Lin, H.; et al. Control of rice grain-filling and yield by a gene with a potential signature of domestication. Nat. Genet. 2008, 40, 1370–1374. [Google Scholar] [CrossRef] [PubMed]
- Kuanar, S.R.; Molla, K.A.; Chattopadhyay, K.; Sarkar, R.K.; Mohapatra, P.K. Introgression of Sub1 (SUB1) QTL in mega rice cultivars increases ethylene production to the detriment of grain- filling under stagnant flooding. Sci. Rep. 2019, 9, 1–12. [Google Scholar] [CrossRef]
- Zhu, G.; Ye, N.; Yang, J.; Peng, X.; Zhang, J. Regulation of expression of starch synthesis genes by ethylene and ABA in relation to the development of rice inferior and superior spikelets. J. Exp. Bot. 2011, 62, 3907–3916. [Google Scholar] [CrossRef] [PubMed]
- Zhang, W.; Cao, Z.; Zhou, Q.; Chen, J.; Xu, G.; Gu, J.; Liu, L.; Wang, Z.; Yang, J.; Zhang, H. Grain Filling Characteristics and Their Relations with Endogenous Hormones in Large- and Small-Grain Mutants of Rice. PLOS ONE 2016, 11, e0165321. [Google Scholar] [CrossRef]
- Panda, B.B.; Sekhar, S.; Dash, S.K.; Behera, L.; Shaw, B.P. Biochemical and molecular characterisation of exogenous cytokinin application on grain filling in rice. BMC Plant Biol. 2018, 18, 89. [Google Scholar] [CrossRef]
- Zhang, D.; Zhang, M.; Zhou, Y.; Wang, Y.; Shen, J.; Chen, H.; Zhang, L.; Lü, B.; Liang, G.; Liang, J. The Rice G Protein γ Subunit DEP1/qPE9–1 Positively Regulates Grain-Filling Process by Increasing Auxin and Cytokinin Content in Rice Grains. Rice 2019, 12, 1–11. [Google Scholar] [CrossRef] [PubMed]
- Liu, E.; Zeng, S.; Zhu, S.; Liu, Y.; Wu, G.; Zhao, K.; Liu, X.; Liu, Q.; Dong, Z.; Dang, X.; et al. Favorable Alleles of GRAIN-FILLING RATE1 Increase the Grain-Filling Rate and Yield of Rice. Plant Physiol. 2019, 181, 1207–1222. [Google Scholar] [CrossRef] [PubMed]
- Lin, Y.; Jiang, X.; Tao, Y.; Yang, X.; Wang, Z.; Wu, F.; Liu, S.; Li, C.; Deng, M.; Ma, J.; et al. Identification and validation of stable quantitative trait loci for grain filling rate in common wheat (Triticum aestivum L.). Theor. Appl. Genet. 2020, 133, 2377–2385. [Google Scholar] [CrossRef] [PubMed]
- Bennetzen, J.L.; Schmutz, J.; Wang, H.; Percifield, R.; Hawkins, J.; Pontaroli, A.C.; Estep, M.; Feng, L.; Vaughn, J.N.; Grimwood, J.; et al. Reference genome sequence of the model plant Setaria. Nat. Biotechnol. 2012, 30, 555–561. [Google Scholar] [CrossRef]
- Jia, G.; Huang, X.; Zhi, H.; Zhao, Y.; Zhao, Q.; Li, W.; Chai, Y.; Yang, L.; Liu, K.; Lu, H.; et al. A haplotype map of genomic variations and genome-wide association studies of agronomic traits in foxtail millet (Setaria italica). Nat. Genet. 2013, 45, 957–961. [Google Scholar] [CrossRef]
- Wang, T.; Song, H.; Li, P.; Wei, Y.; Hu, N.; Chen, Z.; Wang, W.; Liu, J.; Zhang, B.; Peng, R. Transcriptome Analysis Provides Insights into Grain Filling in Foxtail Millet (Setaria italica L.). Int. J. Mol. Sci. 2020, 21, 5031. [Google Scholar] [CrossRef]
- Wang, T.; Wang, S.; Tong, Y.; Wei, Y.; Li, P.; Hu, N.; Liu, Y.; Zhao, Z.; Zhao, Y.; Chen, H.; et al. Spatiotemporal dynamics of the foxtail millet transcriptome during grain filling. Physiol. Plant. 2024, 176. [Google Scholar] [CrossRef]
- Wang, T.; Xing, L.; Song, H.; Wei, Y.; Li, P.; Lu, Q.; Hu, N.; Liu, Y.; Zhao, Y.; Liu, J.; et al. Large-scale metabolome analysis reveals dynamic changes of metabolites during foxtail millet grain filling. Food Res. Int. 2023, 165, 112516. [Google Scholar] [CrossRef]
- Wang, T.; Lu, Q.; Song, H.; Hu, N.; Wei, Y.; Li, P.; Liu, Y.; Zhao, Z.; Liu, J.; Zhang, B.; et al. DNA Methylation and RNA-Sequencing Analysis Show Epigenetic Function During Grain Filling in Foxtail Millet (Setaria italica L.). Front. Plant Sci. 2021, 12. [Google Scholar] [CrossRef]
- Song, H.; Wang, T.; Li, L.; Xing, L.; Xie, H.F.; Feng, B.L.; Liu, J.R. Comparative transcriptome analysis provides insights into grain filling commonalities and differences between foxtail millet [Setaria italica (L.) P. Beauv.] varieties with different panicle types. PeerJ 2022, 10, e12968. [Google Scholar] [CrossRef]
- Bolger, A.M.; Lohse, M.; Usadel, B. Trimmomatic: A flexible trimmer for Illumina sequence data. Bioinformatics 2014, 30, 2114–2120. [Google Scholar] [CrossRef] [PubMed]
- Kim, D.; Langmead, B.; Salzberg, S.L. HISAT: A fast spliced aligner with low memory requirements. Nat. Methods 2015, 12, 357–360. [Google Scholar] [CrossRef] [PubMed]
- Anders, S.; Huber, W. Differential expression analysis for sequence count data. Genome Biol. 2010, 11, R106. [Google Scholar] [CrossRef] [PubMed]
- Ashburner, M.; Ball, C.A.; Blake, J.A.; Botstein, D.; Butler, H.; Cherry, J.M.; Davis, A.P.; Dolinski, K.; Dwight, S.S.; Eppig, J.T.; et al. Gene ontology: Tool for the unification of biology. Nat. Genet. 2000, 25, 25–29. [Google Scholar] [CrossRef] [PubMed]
- Kanehisa, M.; Goto, S.; Kawashima, S.; Okuno, Y.; Hattori, M. The KEGG resource for deciphering the genome. Nucleic Acids Res. 2004, 32, D277–D280. [Google Scholar] [CrossRef]
- Want, E.J.; Masson, P.; Michopoulos, F.; Wilson, I.D.; Theodoridis, G.; Plumb, R.S.; Shockcor, J.; Loftus, N.; Holmes, E.; Nicholson, J.K. Global metabolic profiling of animal and human tissues via UPLC-MS. Nat. Protoc. 2012, 8, 17–32. [Google Scholar] [CrossRef]
- Wen, B.; Mei, Z.; Zeng, C.; Liu, S. metaX: a flexible and comprehensive software for processing metabolomics data. BMC Bioinform. 2017, 18, 1–14. [Google Scholar] [CrossRef] [PubMed]
- Zhang, H.; Tan, G.; Yang, L.; Yang, J.; Zhang, J.; Zhao, B. Hormones in the grains and roots in relation to post-anthesis development of inferior and superior spikelets in japonica/indica hybrid rice. Plant Physiol. Biochem. 2009, 47, 195–204. [Google Scholar] [CrossRef] [PubMed]
- Zhao, Y. Auxin Biosynthesis: A Simple Two-Step Pathway Converts Tryptophan to Indole-3-Acetic Acid in Plants. Mol. Plant 2012, 5, 334–338. [Google Scholar] [CrossRef]
- Ma, X.; Dai, S.; Qin, N.; Zhu, C.; Qin, J.; Li, J. Genome-wide identification and expression analysis of the SAUR gene family in foxtail millet (Setaria italica L.). BMC Plant Biol. 2023, 23, 1–17. [Google Scholar] [CrossRef]
- Mok, M. Cytokinins and plant development—an overview. In Cytokinins, ed. Mok MC. Boca Raton: CRC Press. 2019, pp. 15–66. [CrossRef]
- Ishimaru, T.; Matsuda, T.; Ohsugi, R.; Yamagishi, T. Morphological development of rice caryopses located at the different positions in a panicle from early to middle stage of grain filling. Funct. Plant Biol. 2003, 30, 1139–1149. [Google Scholar] [CrossRef] [PubMed]
- Liu, D.; Zhao, H.; Xiao, Y.; Zhang, G.; Cao, S.; Yin, W.; Qian, Y.; Yin, Y.; Zhang, J.; Chen, S.; et al. A cryptic inhibitor of cytokinin phosphorelay controls rice grain size. Mol. Plant 2021, 15, 293–307. [Google Scholar] [CrossRef] [PubMed]
- Zhao, Y. Essential Roles of Local Auxin Biosynthesis in Plant Development and in Adaptation to Environmental Changes. Annu. Rev. Plant Biol. 2018, 69, 417–435. [Google Scholar] [CrossRef] [PubMed]
- A Slafer, G.; Foulkes, M.J.; Reynolds, M.P.; Murchie, E.H.; Carmo-Silva, E.; Flavell, R.; Gwyn, J.; Sawkins, M.; Griffiths, S. A ‘wiring diagram’ for sink strength traits impacting wheat yield potential. J. Exp. Bot. 2022, 74, 40–71. [Google Scholar] [CrossRef] [PubMed]
- Wang, G.; Kang, M.S.; Moreno, O. Genetic analyses of grain-filling rate and duration in maize. Field Crop. Res. 1999, 61, 211–222. [Google Scholar] [CrossRef]
- Zhang, Z.; Liu, Z.; Cui, Z.; Hu, Y.; Wang, B.; Tang, J. Genetic Analysis of Grain Filling Rate Using Conditional QTL Mapping in Maize. PLOS ONE 2013, 8, e56344. [Google Scholar] [CrossRef] [PubMed]
- Hao, X.; Wang, G.; Wang, X.; Yang, H.; Cheng, Q. ; Qin,Y. Breeding and cultivation techniques of millet variety Changsheng 13 suitable for mechanized production. China Seed Industry. 2019, 10, 74–76. [Google Scholar] [CrossRef]
- Fan, H.; Zhao, P.; Zhang, A.; Li, Y.; Wang, L.; Wang, R.; Guo, E. Breeding of high-quality herbicide-resistant millet variety Changnong 47 and its high-yield cultivation techniques. Journal of Hebei Agricultural Sciences. 2022, 26, 1–5. [Google Scholar]
- Garg, R.; Jain, M. RNA-Seq for Transcriptome Analysis in Non-model Plants. In Legume Genomics; Humana Press: Totowa, NJ, USA, 2013; Volume 1069, pp. 43–58. [Google Scholar] [CrossRef]
- Li, X.; Gao, J.; Song, J.; Guo, K.; Hou, S.; Wang, X.; He, Q.; Zhang, Y.; Zhang, Y.; Yang, Y.; et al. Multi-omics analyses of 398 foxtail millet accessions reveal genomic regions associated with domestication, metabolite traits, and anti-inflammatory effects. Mol. Plant 2022, 15, 1367–1383. [Google Scholar] [CrossRef]
- Zhang, Y.; Gao, J.; Qie, Q.; Yang, Y.; Hou, S.; Wang, X.; Li, X.; Han, Y. Comparative Analysis of Flavonoid Metabolites in Foxtail Millet (Setaria italica) with Different Eating Quality. Life 2021, 11, 578. [Google Scholar] [CrossRef]
- Schubert, H.L.; Blumenthal, R.M.; Cheng, X. Many paths to methyltransfer: a chronicle of convergence. Trends Biochem. Sci. 2003, 28, 329–335. [Google Scholar] [CrossRef] [PubMed]
- Rea, P.A. Plant ATP-Binding Cassette Transporters. Annu. Rev. Plant Biol. 2007, 58, 347–375. [Google Scholar] [CrossRef]
- Walter, S.; Kahla, A.; Arunachalam, C.; Perochon, A.; Khan, M.R.; Scofield, S.R.; Doohan, F.M. A wheat ABC transporter contributes to both grain formation and mycotoxin tolerance. J. Exp. Bot. 2015, 66, 2583–2593. [Google Scholar] [CrossRef] [PubMed]
- Bhati, K.K.; Alok, A.; Kumar, A.; Kaur, J.; Tiwari, S.; Pandey, A.K. Silencing ofABCC13transporter in wheat reveals its involvement in grain development, phytic acid accumulation and lateral root formation. J. Exp. Bot. 2016, 67, 4379–4389. [Google Scholar] [CrossRef]
- Ma, B.; Cao, X.; Li, X.; Bian, Z.; Zhang, Q.-Q.; Fang, Z.; Liu, J.; Li, Q.; Liu, Q.; Zhang, L.; et al. Two ABCI family transporters, OsABCI15 and OsABCI16, are involved in grain-filling in rice. J. Genet. Genom. 2023. [Google Scholar] [CrossRef]
- Gao, F.; Wang, K.; Liu, Y.; Chen, Y.; Chen, P.; Shi, Z.; Luo, J.; Jiang, D.; Fan, F.; Zhu, Y.; et al. Blocking miR396 increases rice yield by shaping inflorescence architecture. Nat. Plants 2015, 2, 15196. [Google Scholar] [CrossRef]
- Ashikari, M.; Sakakibara, H.; Lin, S.; Yamamoto, T.; Takashi, T.; Nishimura, A.; Angeles, E.R.; Qian, Q.; Kitano, H.; Matsuoka, M. Cytokinin Oxidase Regulates Rice Grain Production. Science 2005, 309, 741–745. [Google Scholar] [CrossRef]
- Li, H.; Lv, Q.; Deng, J.; Huang, J.; Cai, F.; Liang, C.; Chen, Q.; Wang, Y.; Zhu, L.; Zhang, X.; et al. Transcriptome Analysis Reveals Key Seed-Development Genes in Common Buckwheat (Fagopyrum esculentum). Int. J. Mol. Sci. 2019, 20, 4303. [Google Scholar] [CrossRef] [PubMed]
- Xu, X.; E, Z.; Zhang, D.; Yun, Q.; Zhou, Y.; Niu, B.; Chen, C. OsYUC11-mediated auxin biosynthesis is essential for endosperm development of rice. Plant Physiol. 2020, 185, 934–950. [Google Scholar] [CrossRef]
- Zhang, D.; Zhang, M.; Liang, J. RGB1 Regulates Grain Development and Starch Accumulation Through Its Effect on OsYUC11-Mediated Auxin Biosynthesis in Rice Endosperm Cells. Front. Plant Sci. 2021, 12. [Google Scholar] [CrossRef]
- Forestan, C.; Meda, S.; Varotto, S. ZmPIN1-Mediated Auxin Transport Is Related to Cellular Differentiation during Maize Embryogenesis and Endosperm Development. Plant Physiol. 2009, 152, 1373–1390. [Google Scholar] [CrossRef] [PubMed]
- Adamowski, M.; Friml, J. PIN-Dependent Auxin Transport: Action, Regulation, and Evolution. Plant Cell 2015, 27, 20–32. [Google Scholar] [CrossRef] [PubMed]
- Zhu, J.; Bailly, A.; Zwiewka, M.; Sovero, V.; Di Donato, M.; Ge, P.; Oehri, J.; Aryal, B.; Hao, P.; Linnert, M.; et al. TWISTED DWARF1 Mediates the Action of Auxin Transport Inhibitors on Actin Cytoskeleton Dynamics. Plant Cell 2016, 28, 930–948. [Google Scholar] [CrossRef] [PubMed]
- Marchant, A.; Kargul, J.; May, S.T.; Muller, P.; Delbarre, A.; Perrot-Rechenmann, C.; Bennett, M.J. AUX1 regulates root gravitropism in Arabidopsis by facilitating auxin uptake within root apical tissues. EMBO J. 1999, 18, 2066–2073. [Google Scholar] [CrossRef] [PubMed]
- Cho, M.; Lee, Z.-W.; Cho, H.-T. ATP-Binding Cassette B4, an Auxin-Efflux Transporter, Stably Associates with the Plasma Membrane and Shows Distinctive Intracellular Trafficking from That of PIN-FORMED Proteins. Plant Physiol. 2012, 159, 642–654. [Google Scholar] [CrossRef] [PubMed]
- Ma, F.; Zhang, F.; Zhu, Y.; Lan, D.; Yan, P.; Wang, Y.; Hu, Z.; Zhang, X.; Hu, J.; Niu, F.; et al. Auxin signaling module OsSK41-OsIAA10-OsARF regulates grain yield traits in rice. J. Integr. Plant Biol. 2023, 65, 1753–1766. [Google Scholar] [CrossRef] [PubMed]
- Guo, F.; Huang, Y.; Qi, P.; Lian, G.; Hu, X.; Han, N.; Wang, J.; Zhu, M.; Qian, Q.; Bian, H. Functional analysis of auxin receptor OsTIR1/OsAFB family members in rice grain yield, tillering, plant height, root system, germination, and auxinic herbicide resistance. New Phytol. 2020, 229, 2676–2692. [Google Scholar] [CrossRef]
- Huang, X.; Lu, Z.; Zhai, L.; Li, N.; Yan, H. The Small Auxin-Up RNA SAUR10 Is Involved in the Promotion of Seedling Growth in Rice. Plants 2023, 12, 3880. [Google Scholar] [CrossRef]
- Yu, C.; Sun, C.; Shen, C.; Wang, S.; Liu, F.; Liu, Y.; Chen, Y.; Li, C.; Qian, Q.; Aryal, B.; et al. The auxin transporter, OsAUX1, is involved in primary root and root hair elongation and in Cd stress responses in rice (Oryza sativa L.). Plant J. 2015, 83, 818–830. [Google Scholar] [CrossRef]
Figure 1.
Phenotypic of grain filling rate related in foxtail millets. (a) and (b) Morphological changes in foxtail millet grain of CS13 (a) and CN47 (b) at six stages. Bars=500 μm. (c) Thousand millets weight (de-husked grains) changes of CS13 and CN47 at six stages. (d) Grain-filling rate changes of CS13 and CN47 at six stages. (e) Comparison of the agronomic traits between CS13 and CN47. The data are means ± SD (n=3). Student’s t test was used for statistical analysis (*, P ≤ 0.05 and **, P ≤ 0.01).
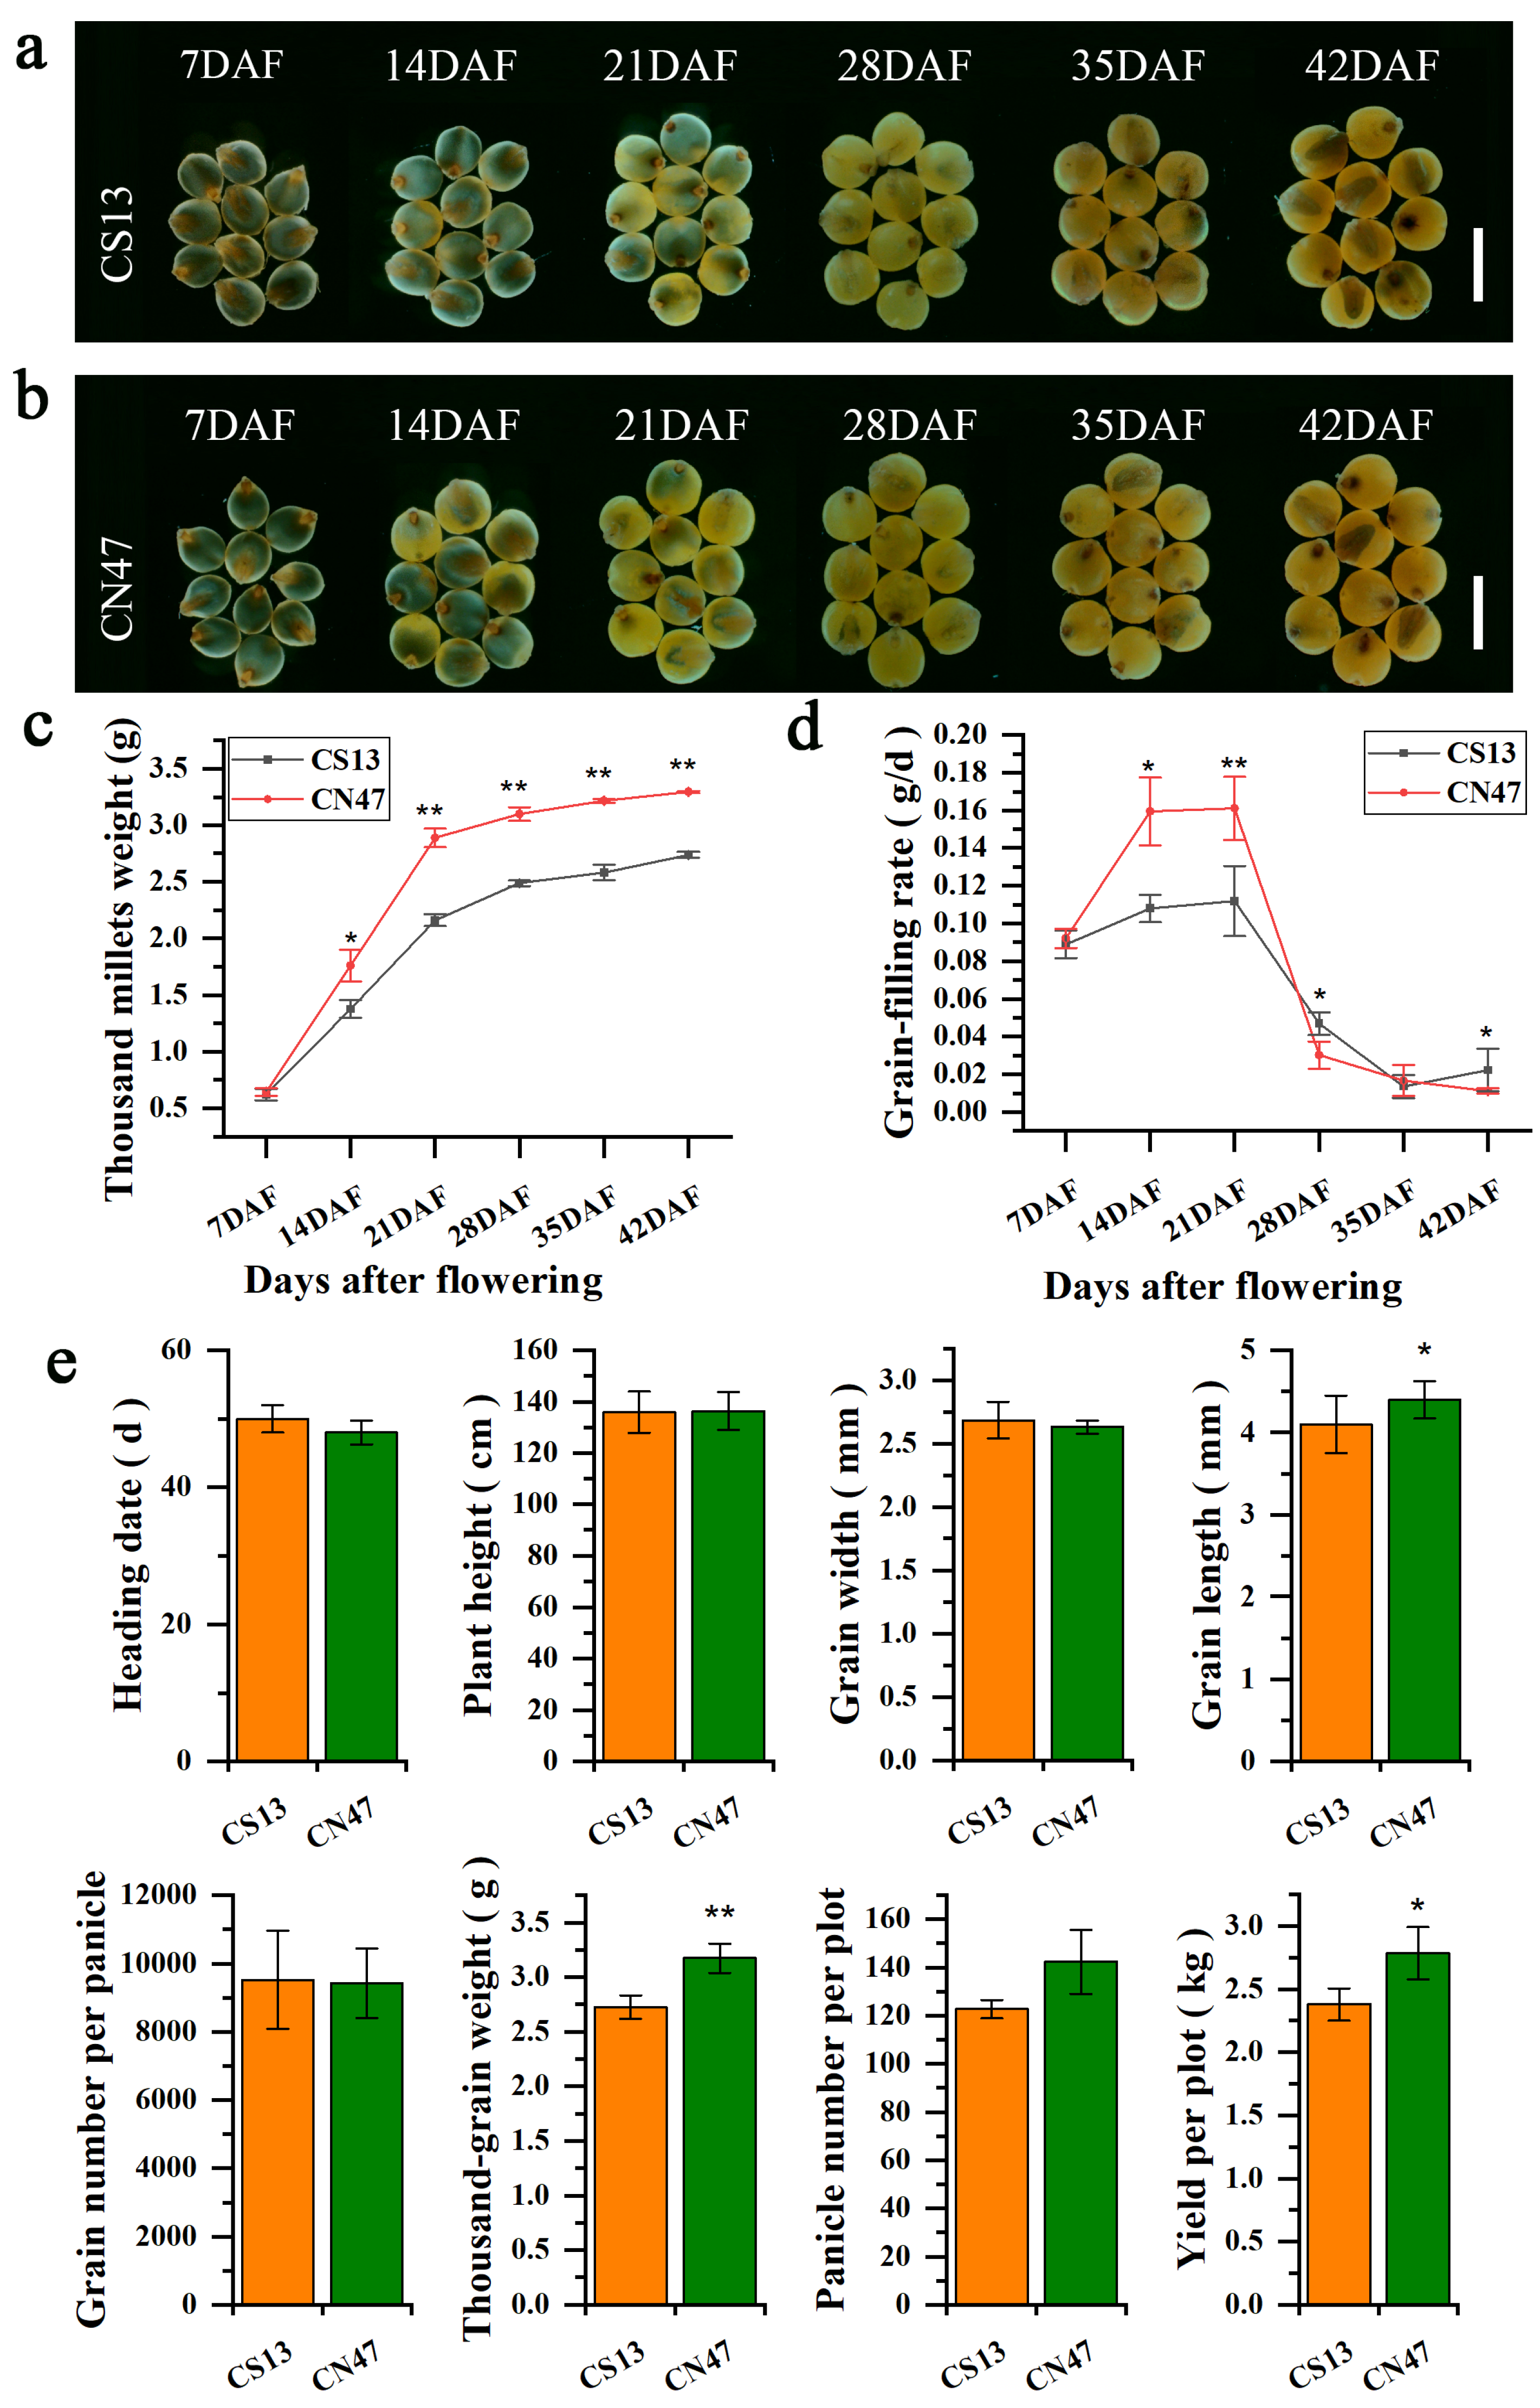
Figure 2.
Transcriptomes analysis and the total number of differentially expressed genes of the two foxtail millets at two stages during grain filling. (a) Principal component analysis (PCA) plot analysis of transcriptome; the x-axis and y-axis represent principal component 1 (PC1) and principal component 2 (PC2), respectively. S1–S3 represents the three biological replicates of S1 (14 DAF of CS13), S4–S6 represents the three biological replicates of S4 (21 DAF of CS13), N1–N3 represents the three biological replicates of N1 (14 DAF of CN47), N4–N6 represents the three biological replicates of N4 (21 DAF of CN47). (b) Statistic of expressed genes (DEGs) in the CS13_14 vs CN47_14, CS13_21 vs CN47_21 comparison.
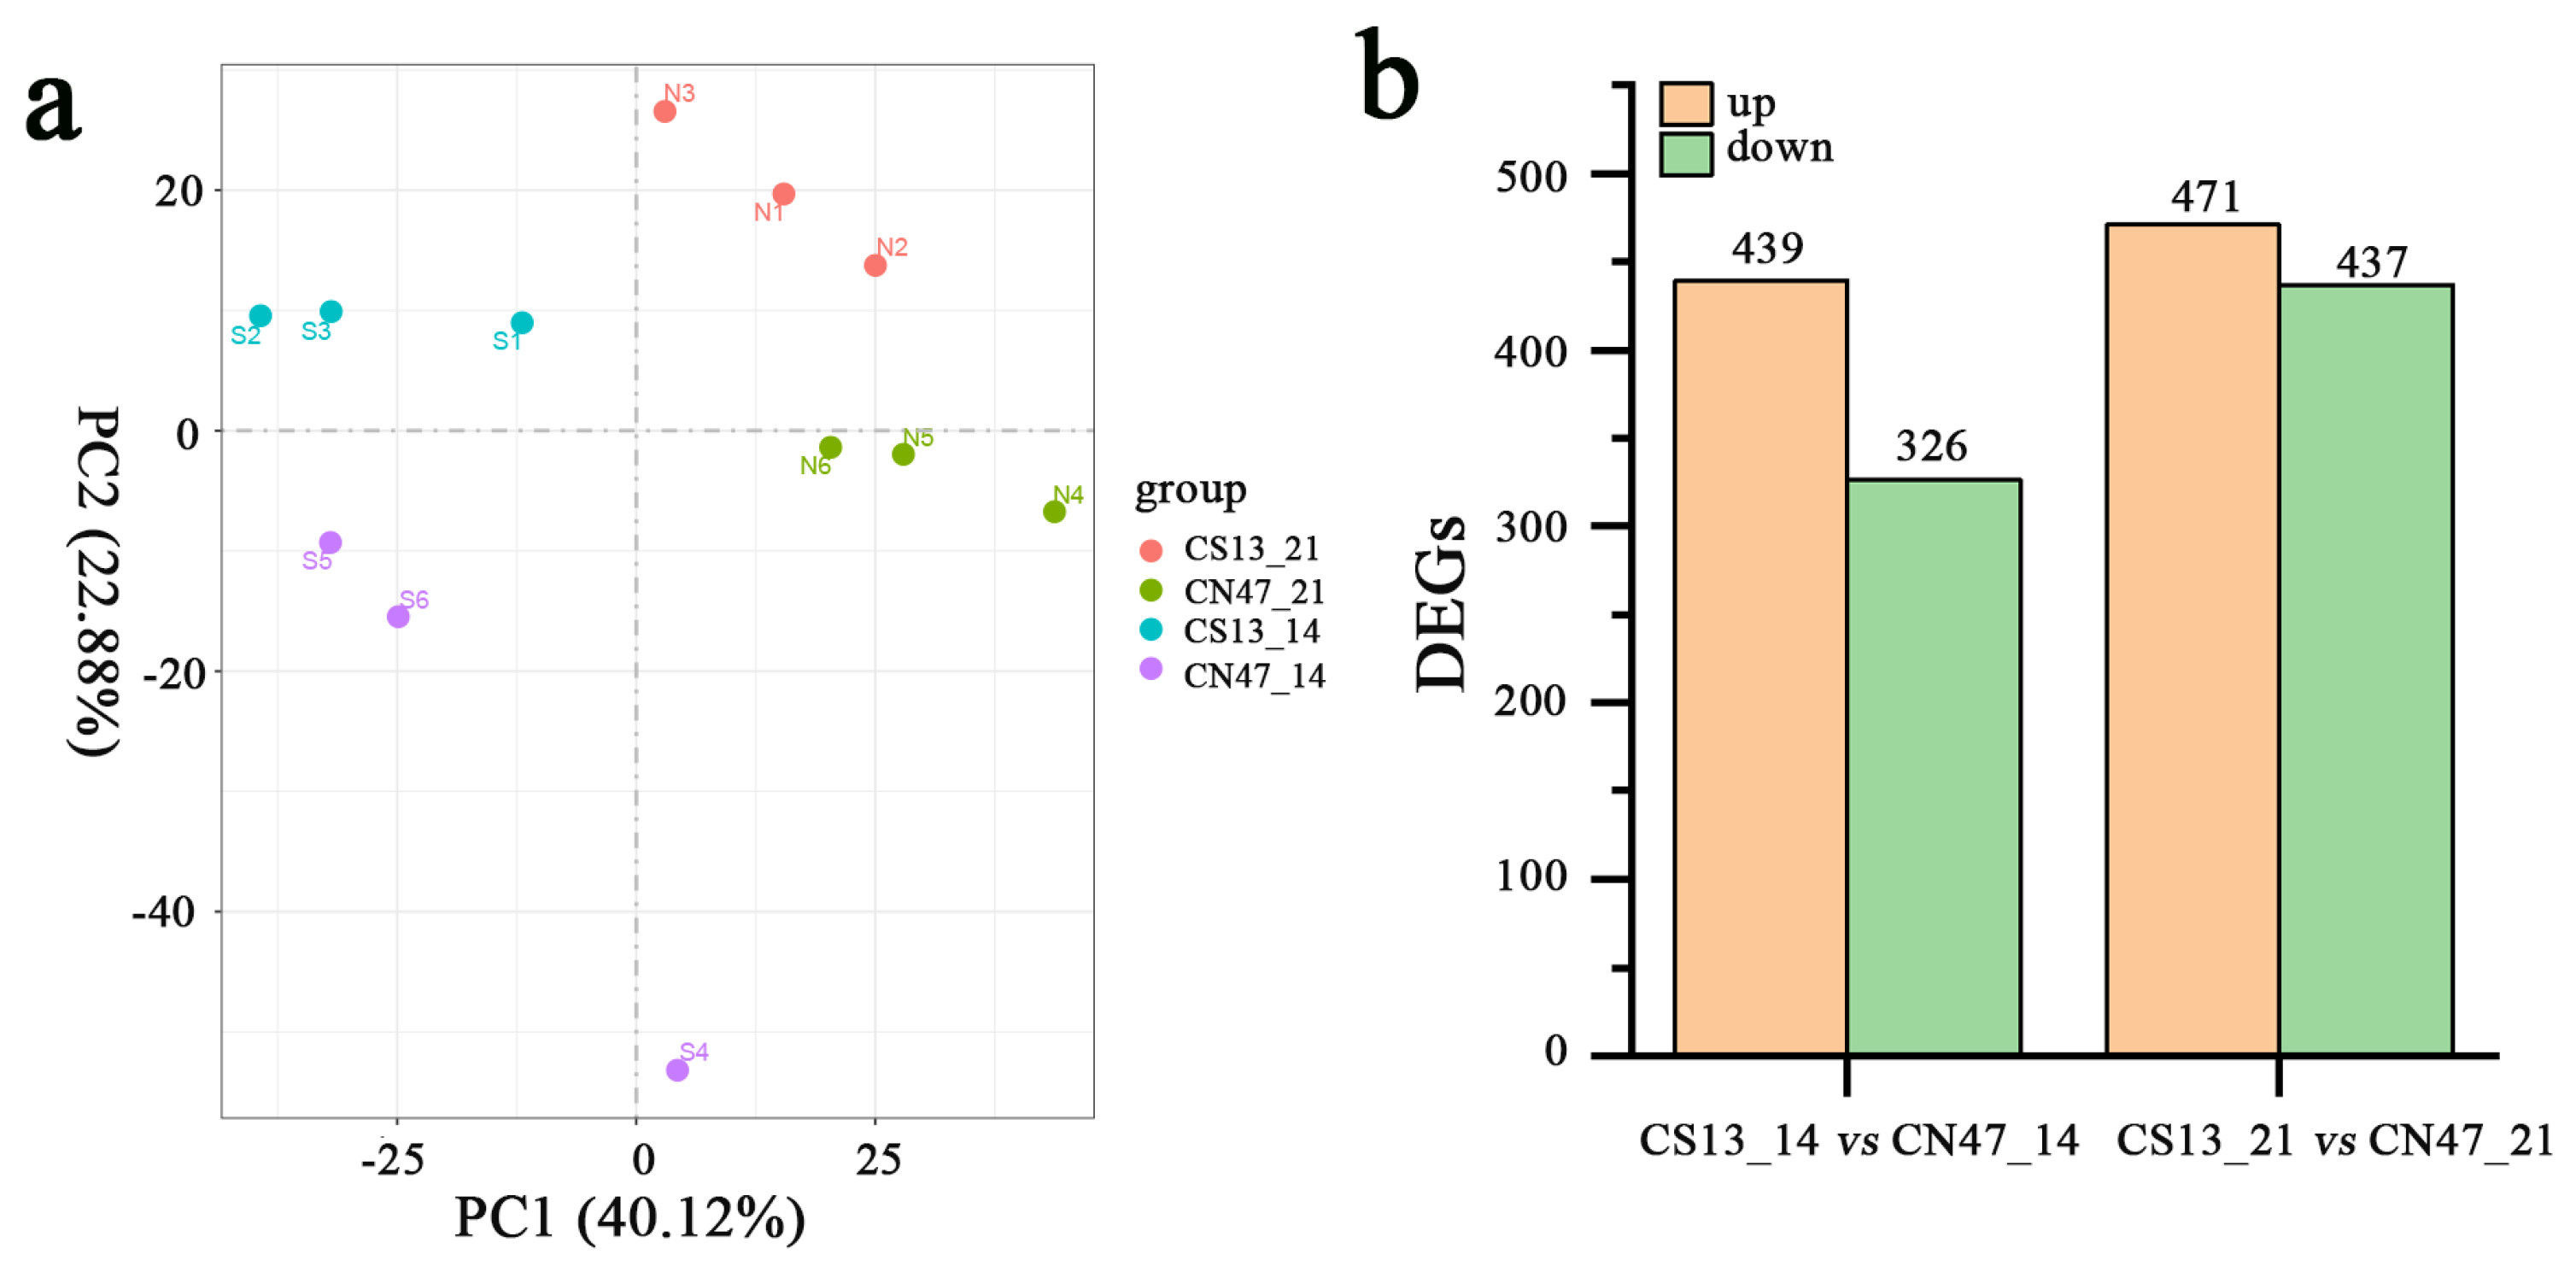
Figure 3.
(a) and (b) The top 25 Gene Ontology (GO) classification in each category of DEGs in the CS13_14 vs CN47_14, CS13_21 vs CN47_21 comparison. (c) and (d) The top 20 Kyoto Encyclopedia of Genes and Genomes (KEGG) classification in each category of DEGs in the CS13_14 vs CN47_14, CS13_21 vs CN47_21 comparison.
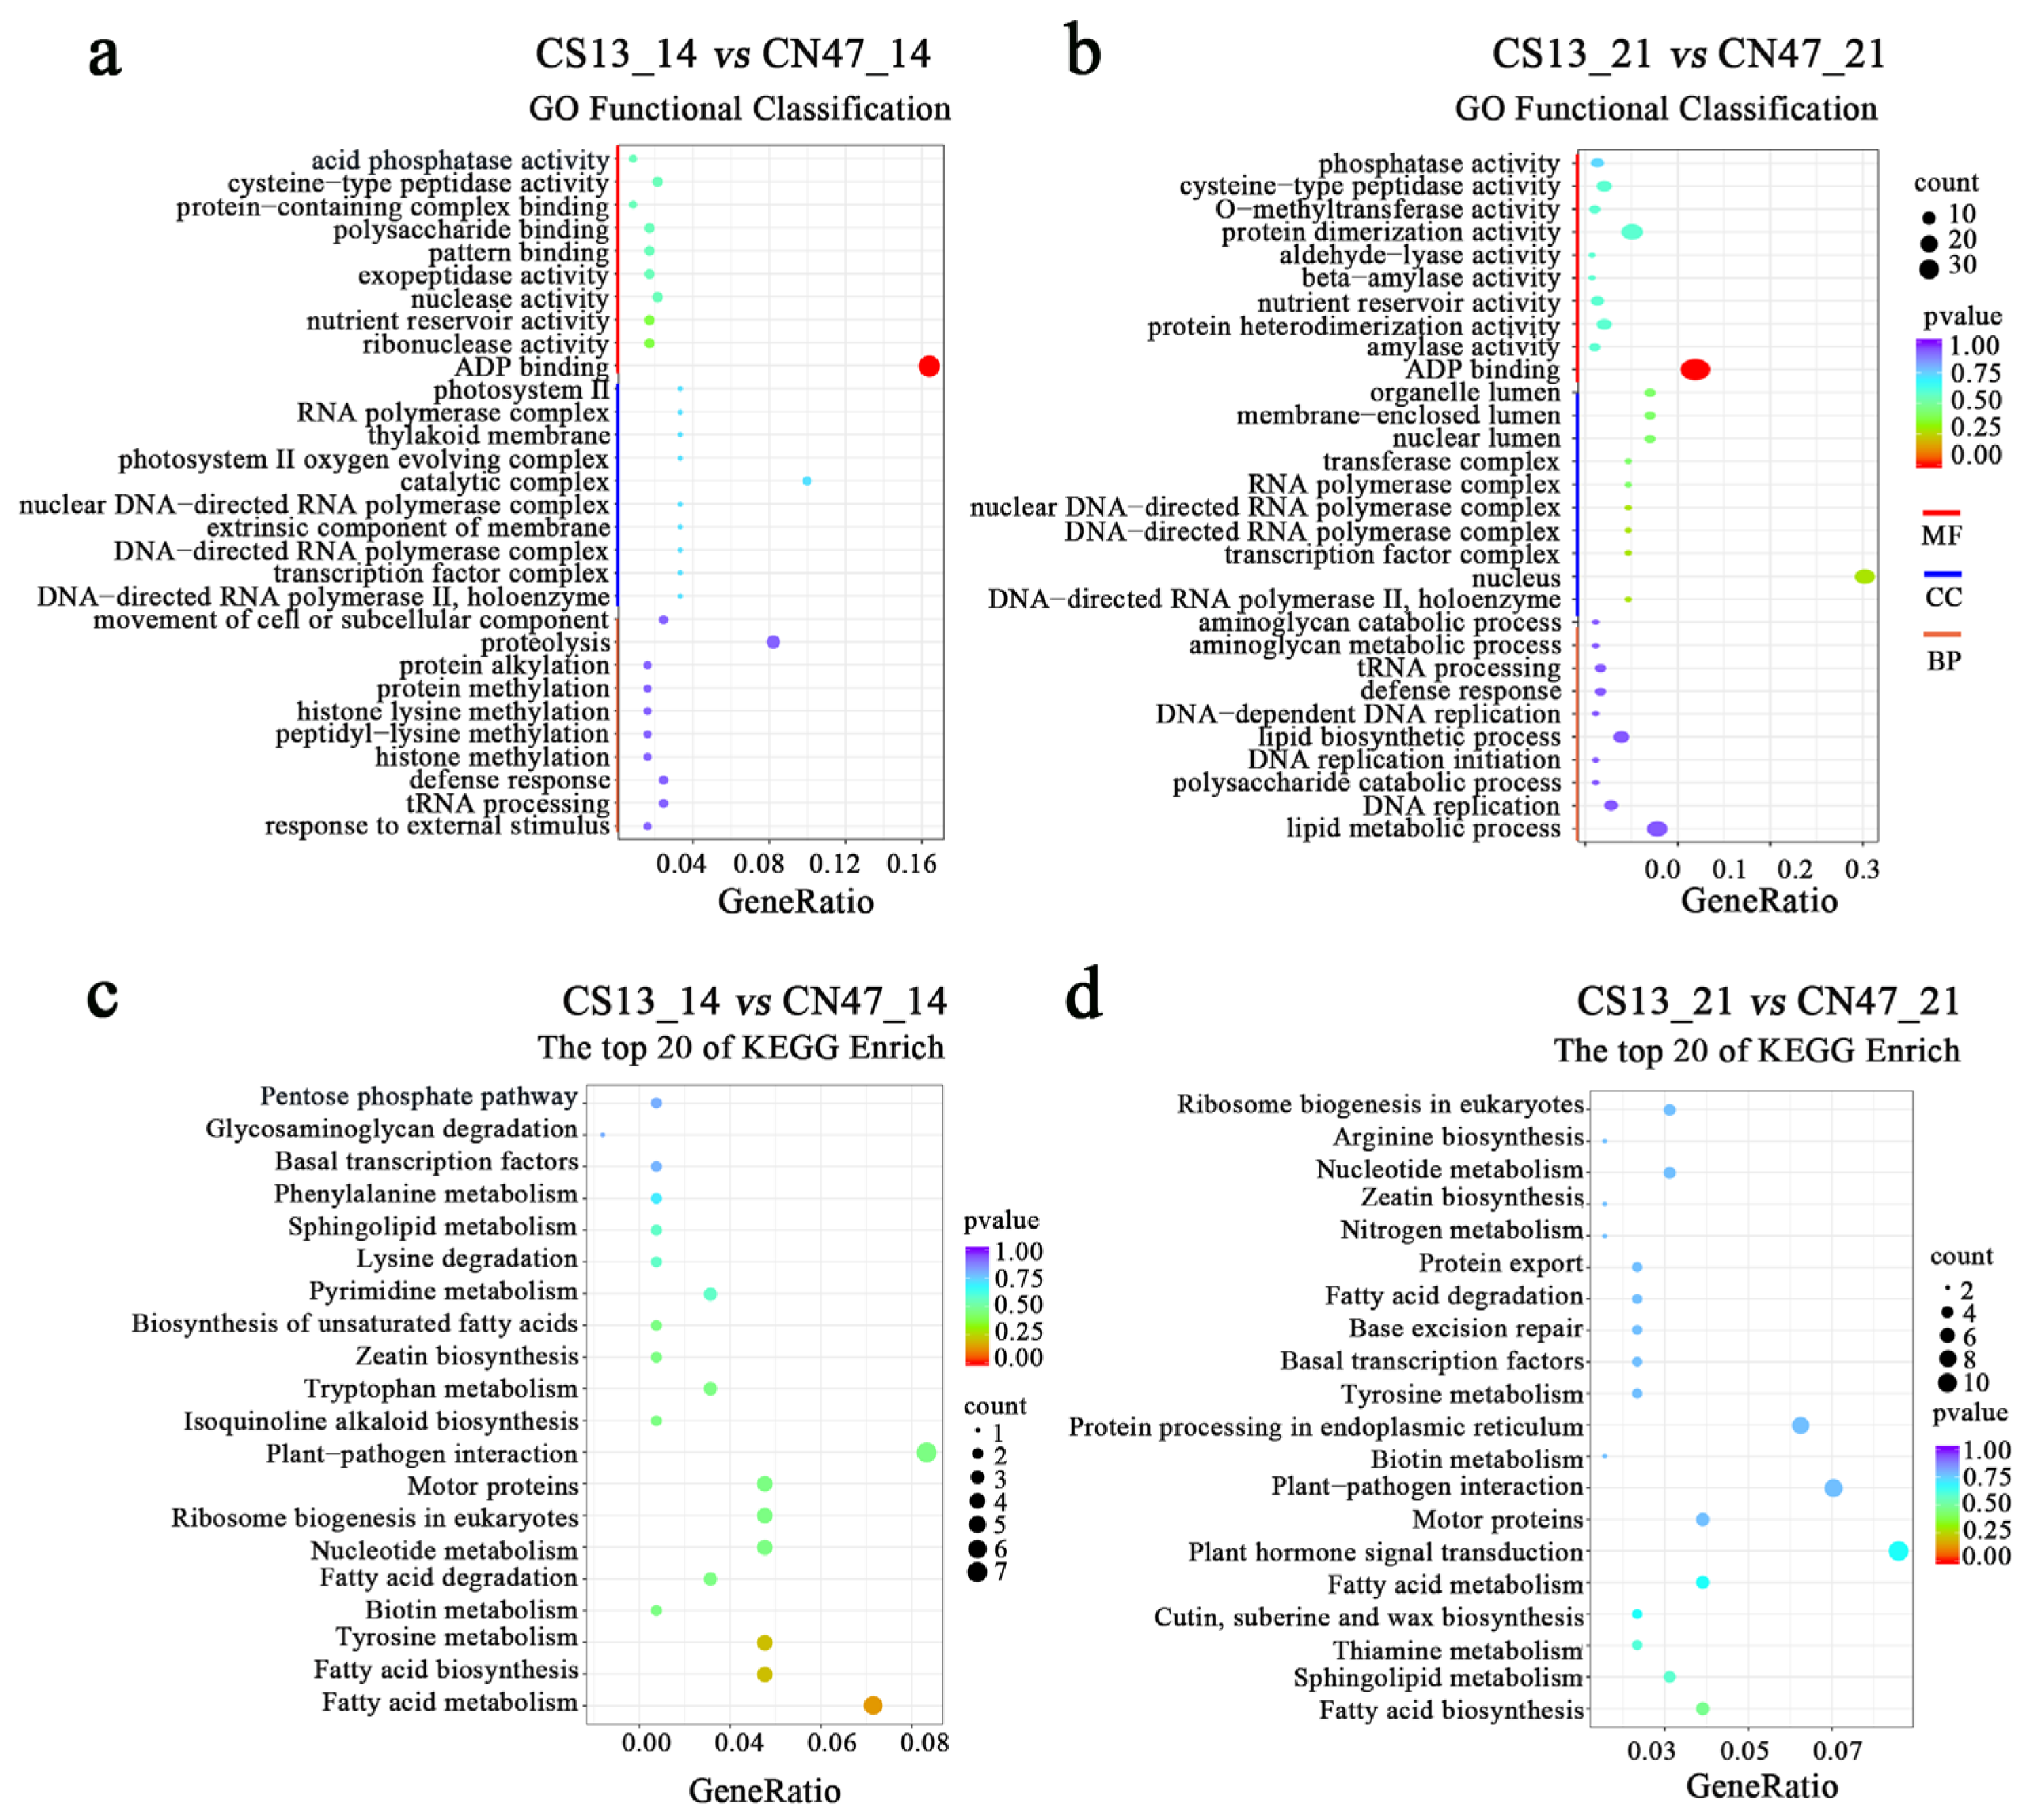
Figure 4.
Metabolomic profiling analysis at two stages during grain filling of the two foxtail millets. (a) and (b) Volcano plot of DAMs in the CS13_14 vs CN47_14, CS13_21 vs CN47_21 comparison, respectively. (c) and (d) Heatmap analysis of DAMs in the CS13_14 vs CN47_14, CS13_21 vs CN47_21 comparison, respectively; red and blue means high and low level. (e) and (f) Top 20 KEGG pathway classification of DAMs in the CS13_14 vs CN47_14, CS13_21 vs CN47_21 comparison, respectively.
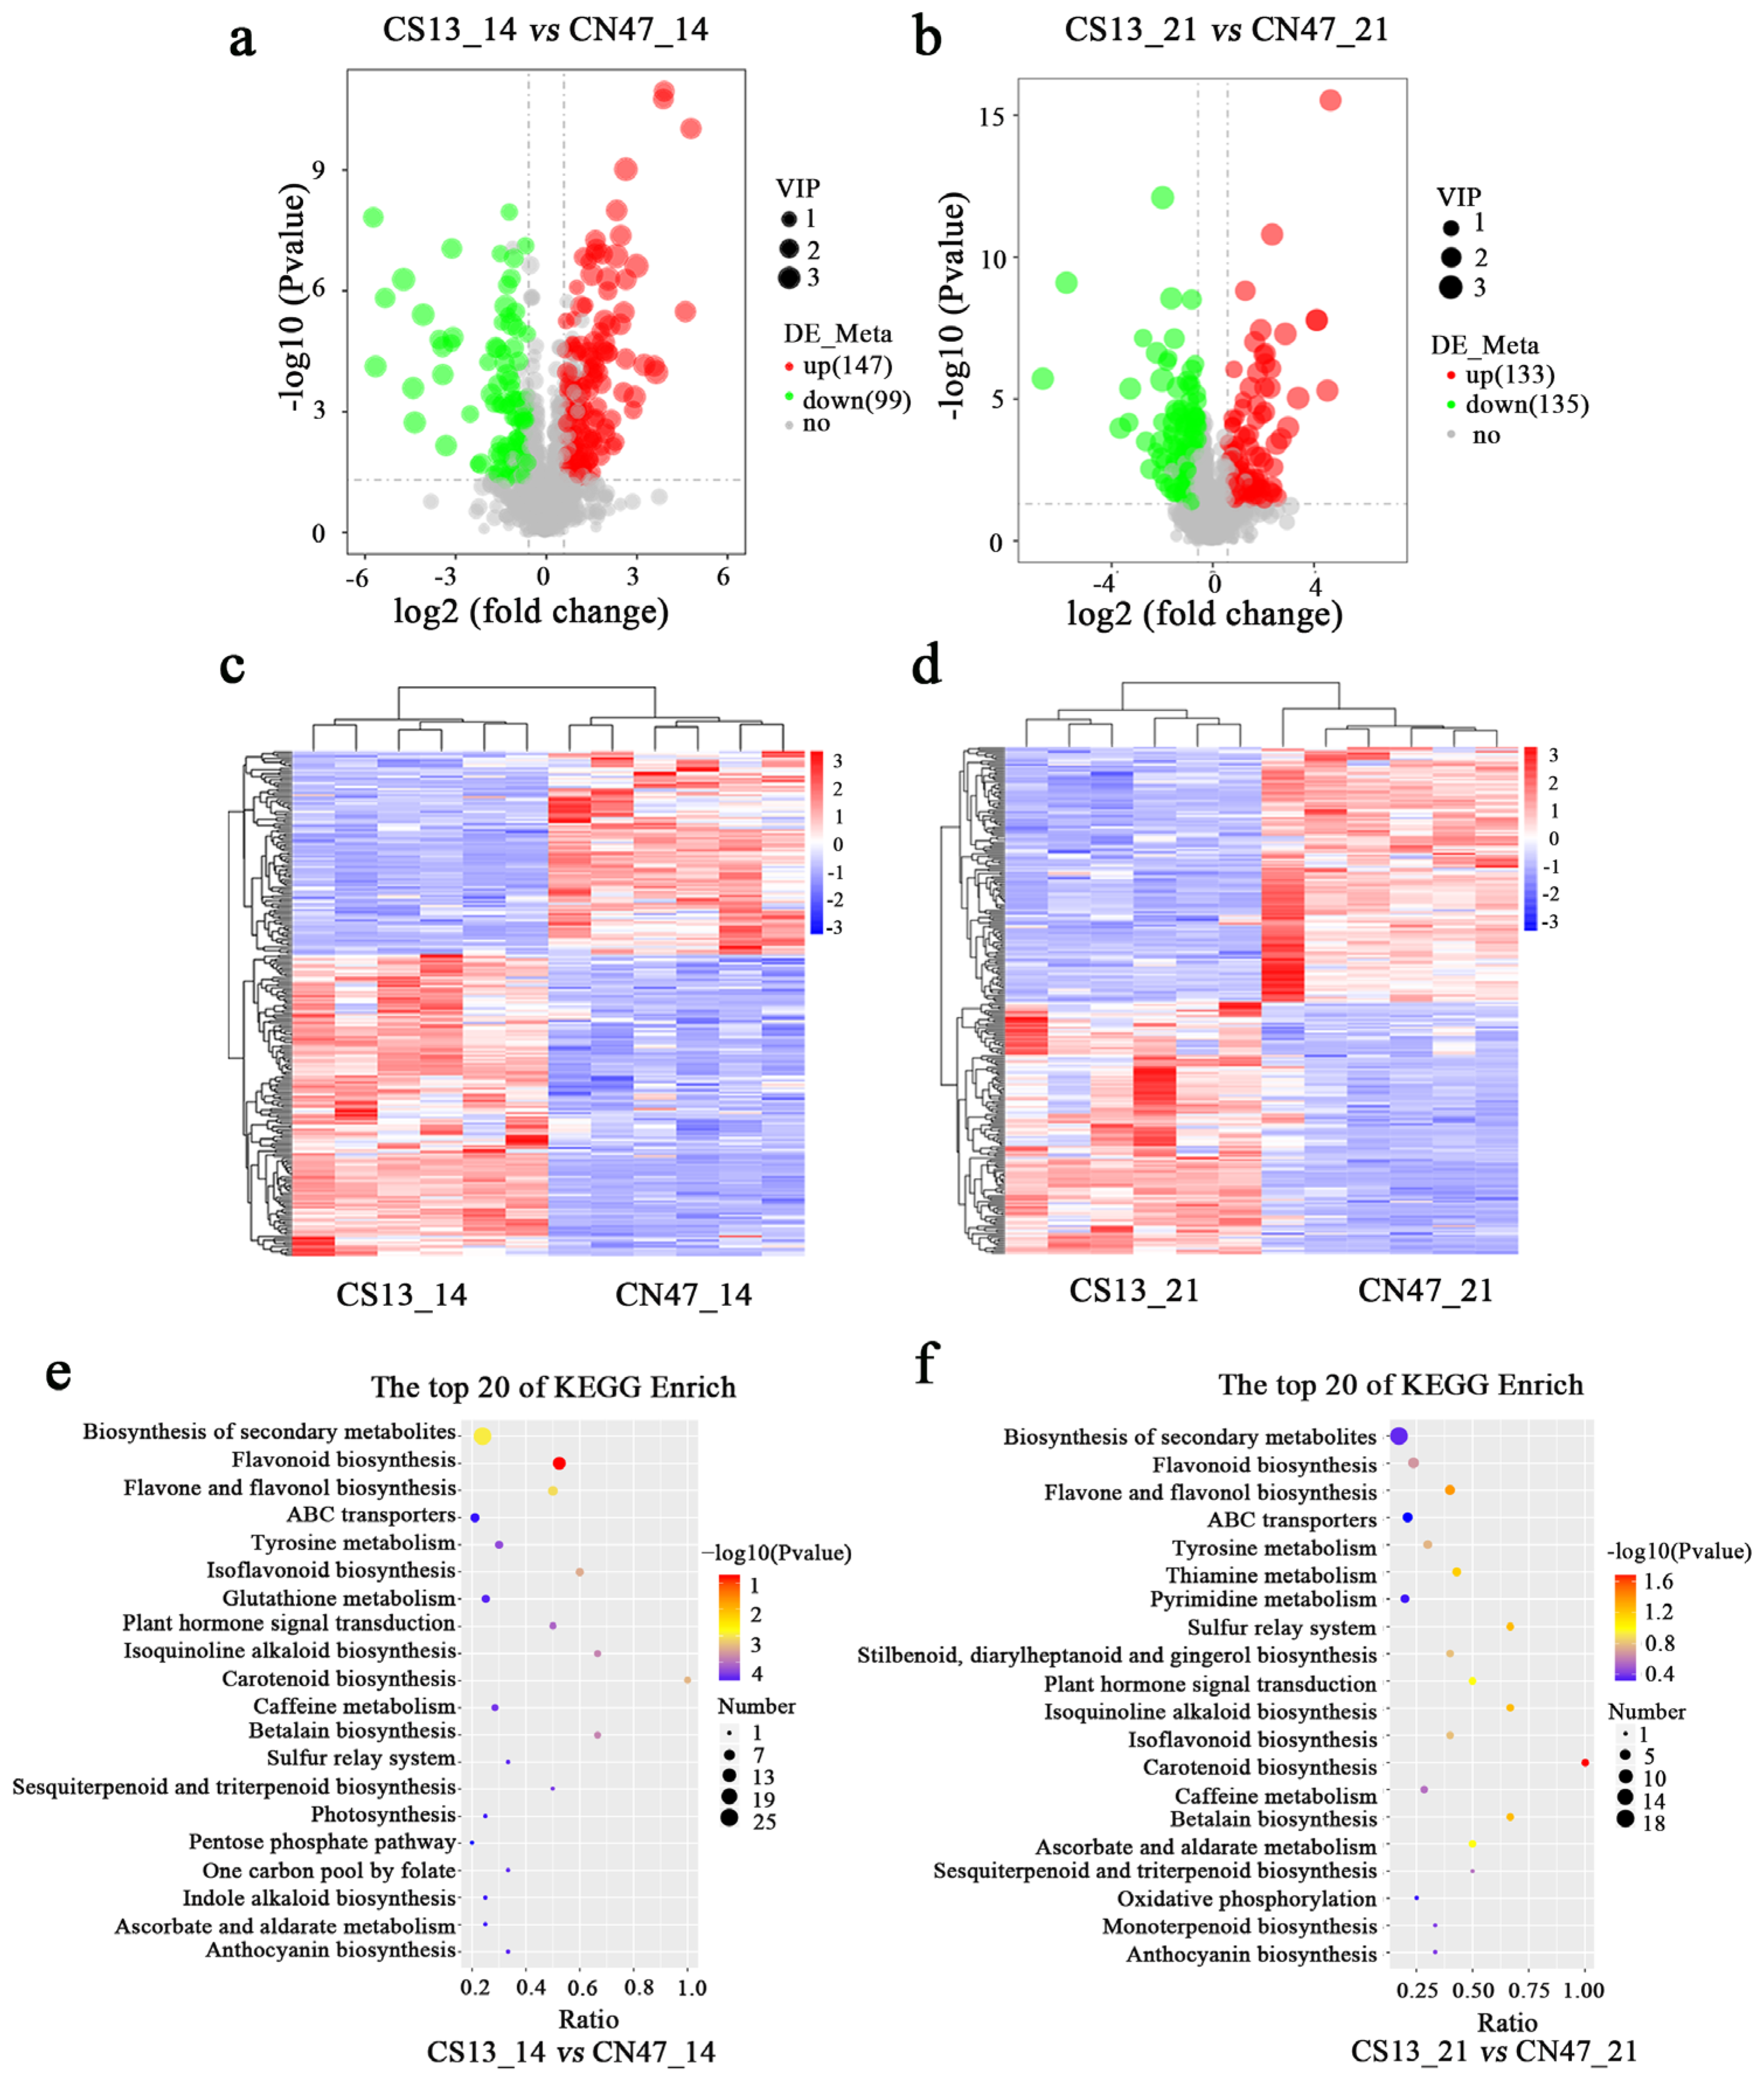
Figure 5.
Co-mapped pathway of DAMs and DEGs at two stages during grain filling of the two foxtail millets. (a) and (b) KEGG pathways analysis of the simultaneous annotation of DAMs and DEGs in the CS13_14 vs CN47_14, CS13_21 vs CN47_21 comparison, respectively. (c) and (d) Venn Diagram of DEGs and DAMs in the CS13_14 vs CN47_14, CS13_21 vs CN47_21 comparison, respectively. (e) The number of shared DAMs and DEGs related to co-mapped pathway.
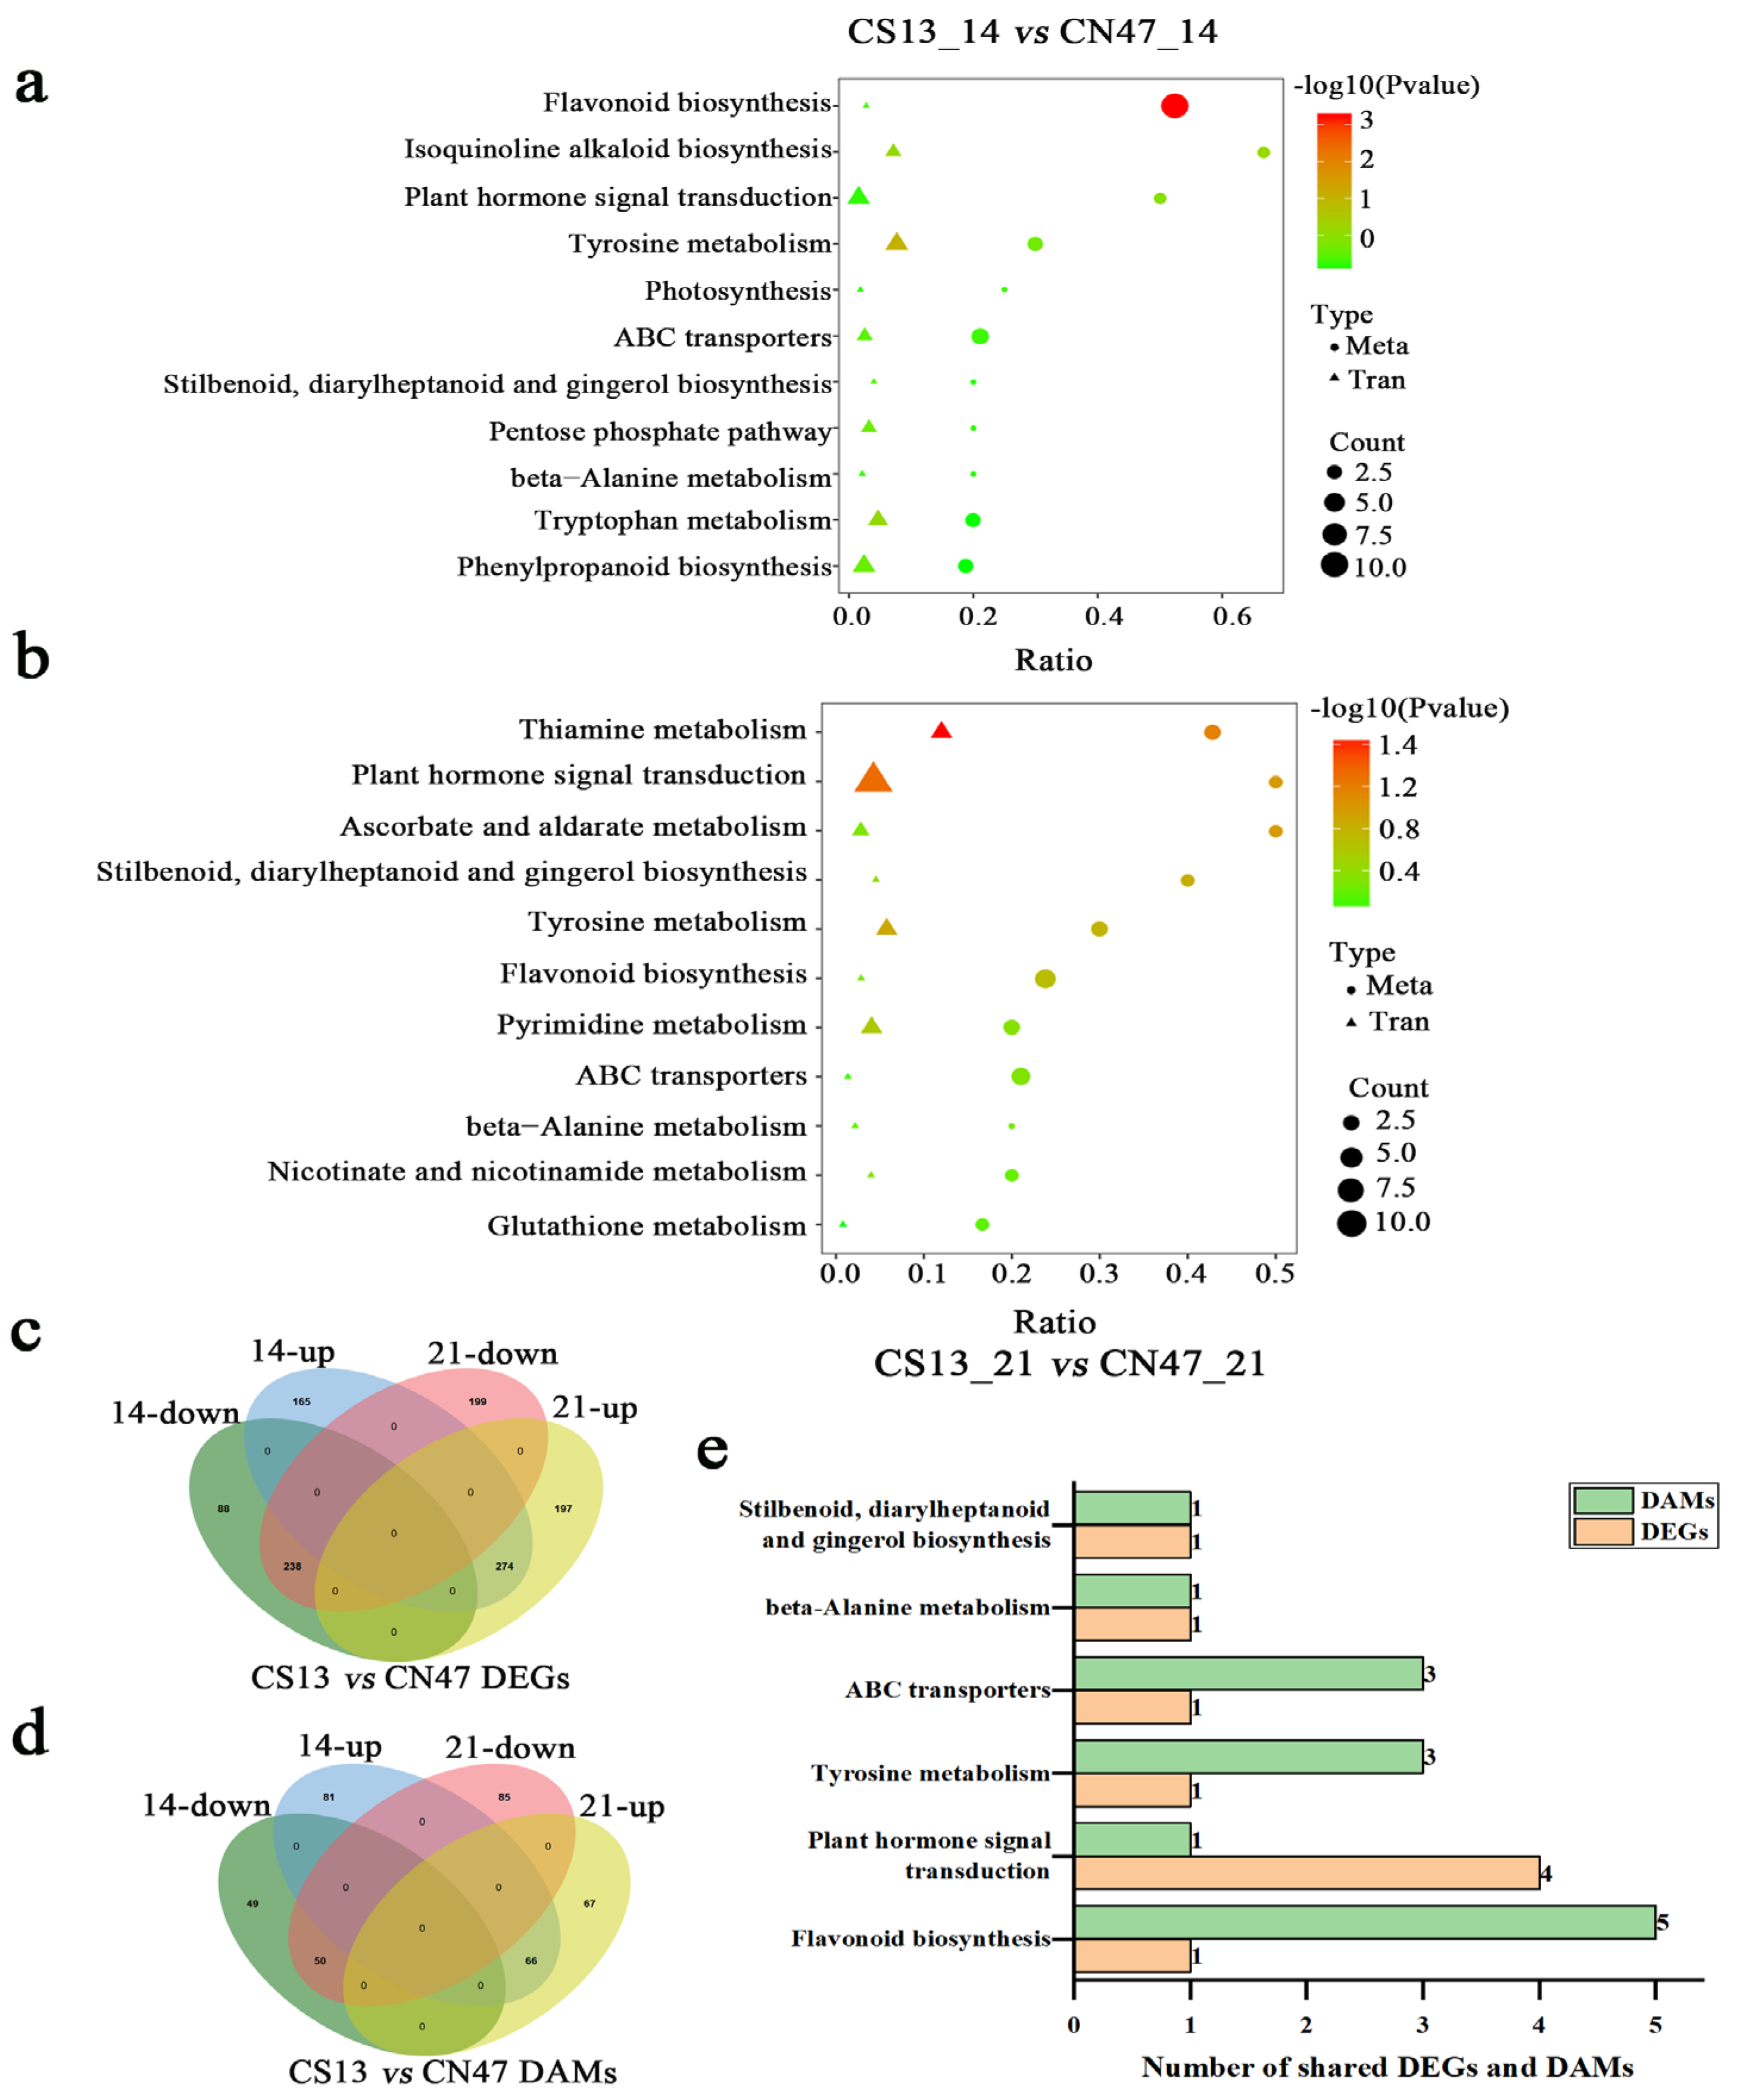
Figure 6.
The genes expression of auxin biosynthesis, transport and signal transduction pathway. The rectangles color represent the expression level of genes, blue means low level, red means high level.
Figure 6.
The genes expression of auxin biosynthesis, transport and signal transduction pathway. The rectangles color represent the expression level of genes, blue means low level, red means high level.
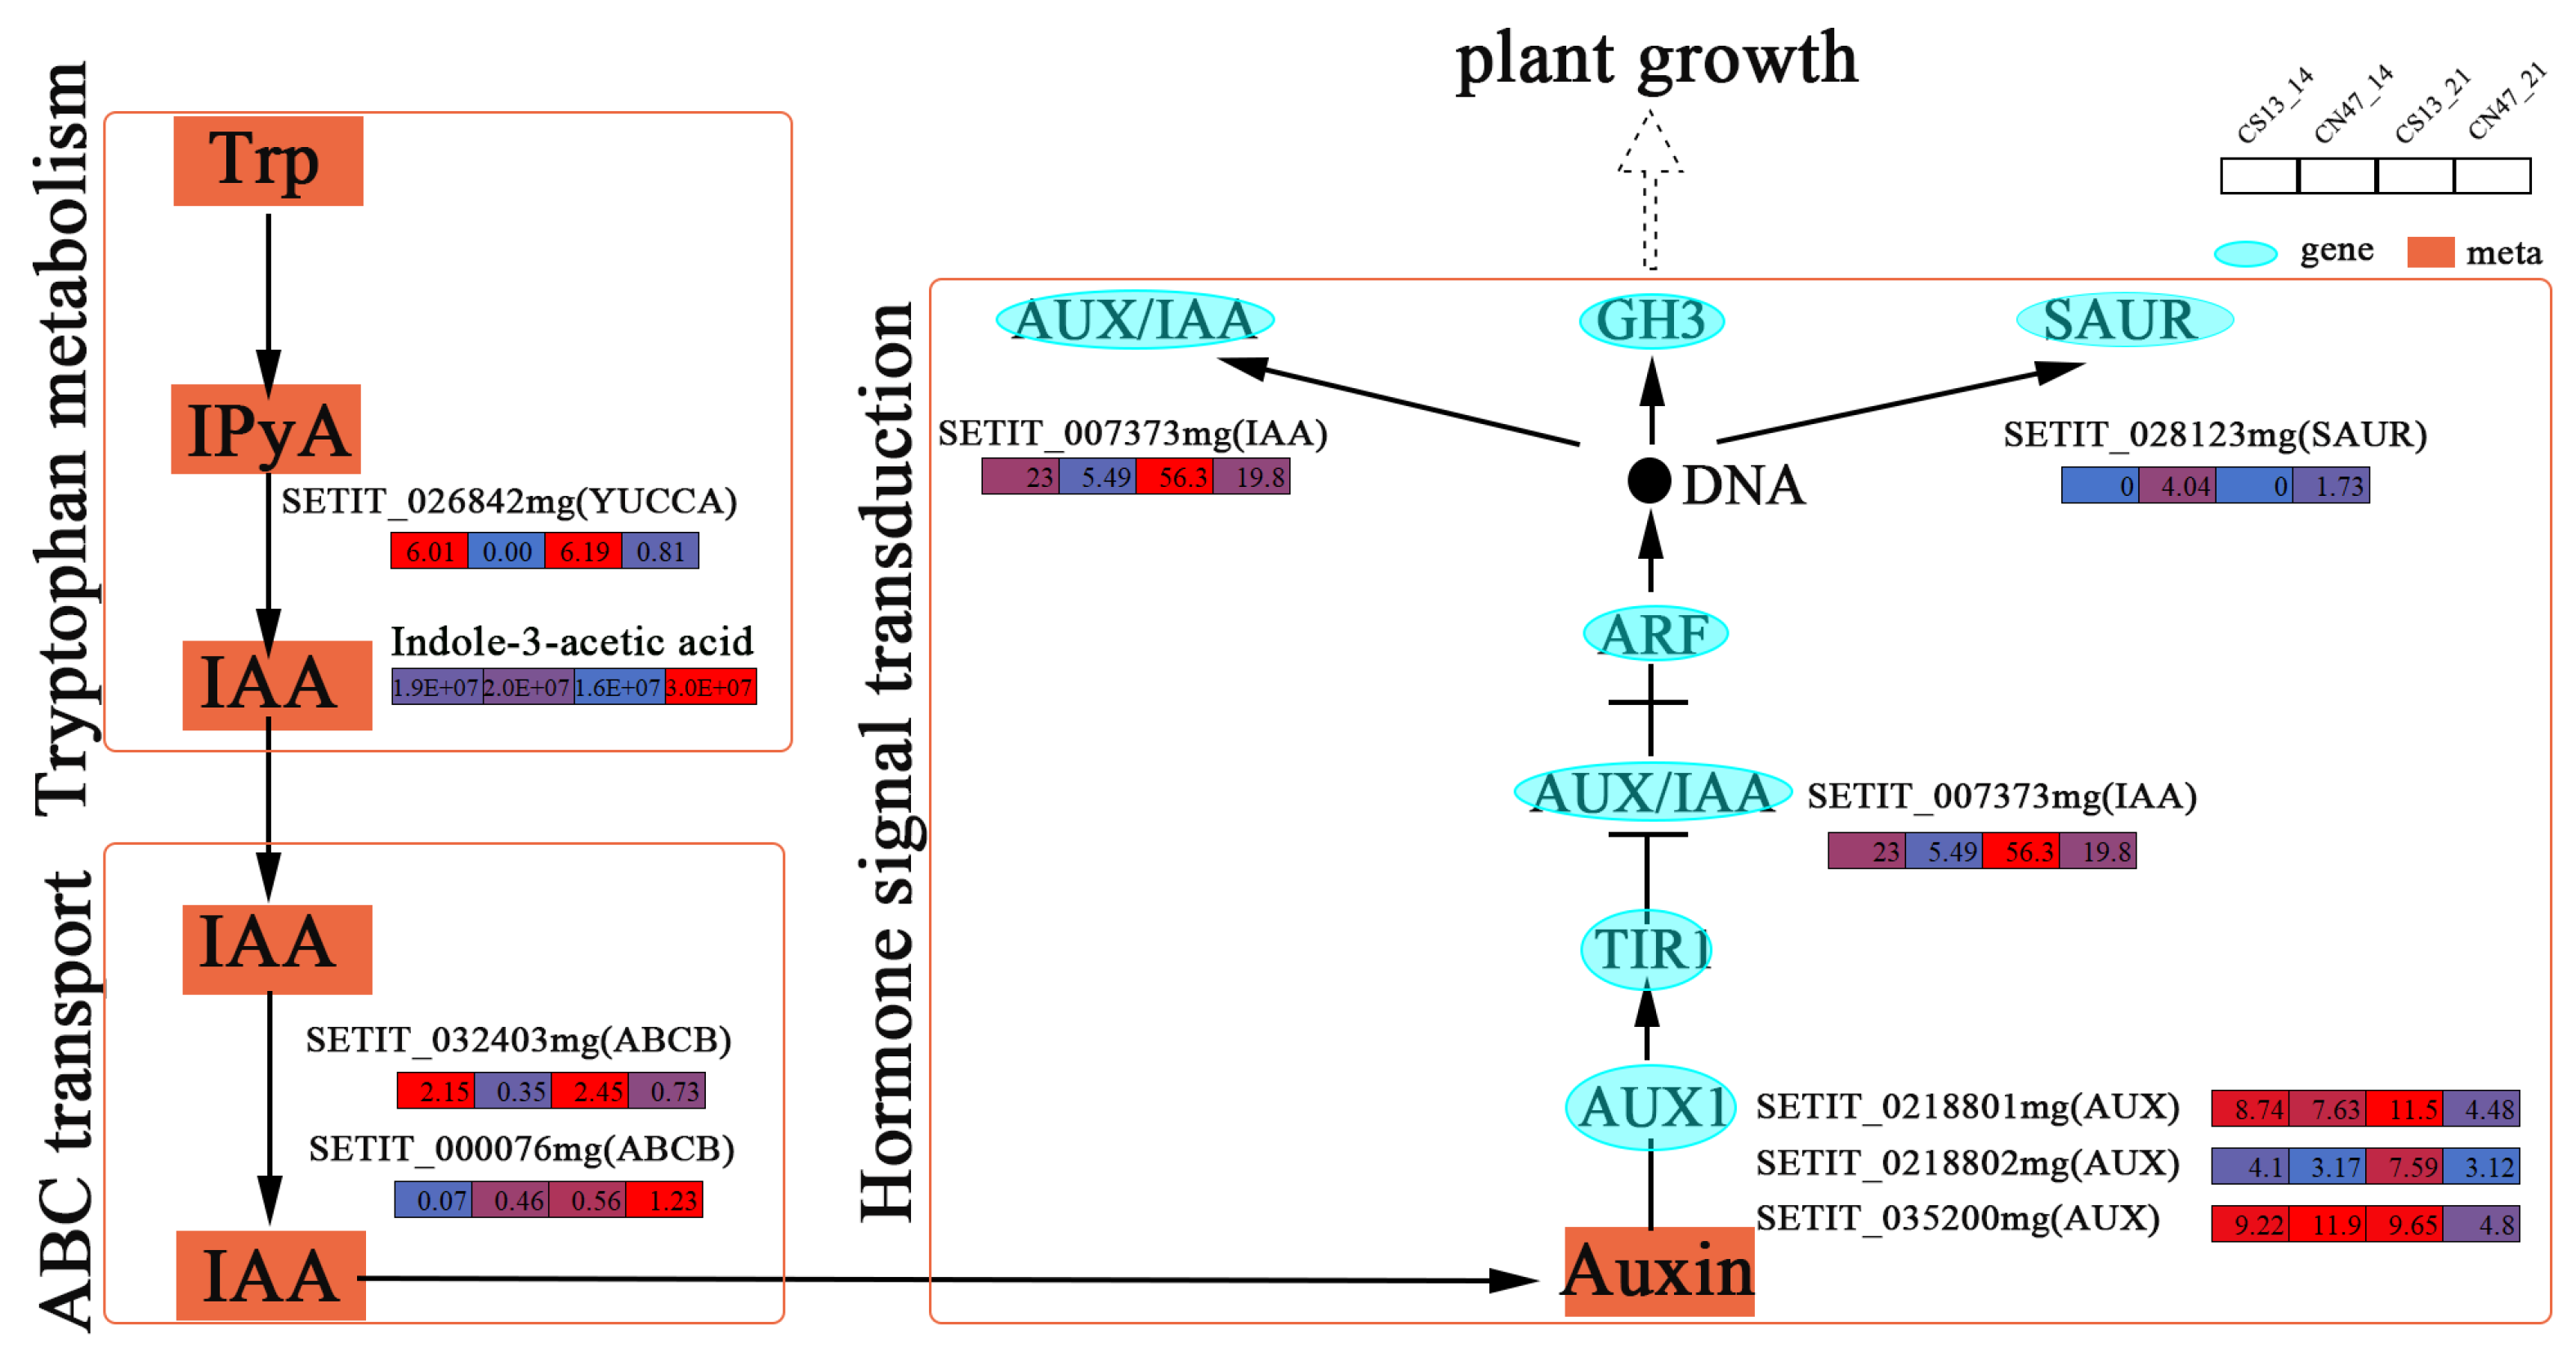
Figure 7.
The genes expression of cytokinin (CTK) biosynthesis, transport and signal transduction pathway. The rectangles color represent the expression level of genes, blue means low level, red means high level.
Figure 7.
The genes expression of cytokinin (CTK) biosynthesis, transport and signal transduction pathway. The rectangles color represent the expression level of genes, blue means low level, red means high level.
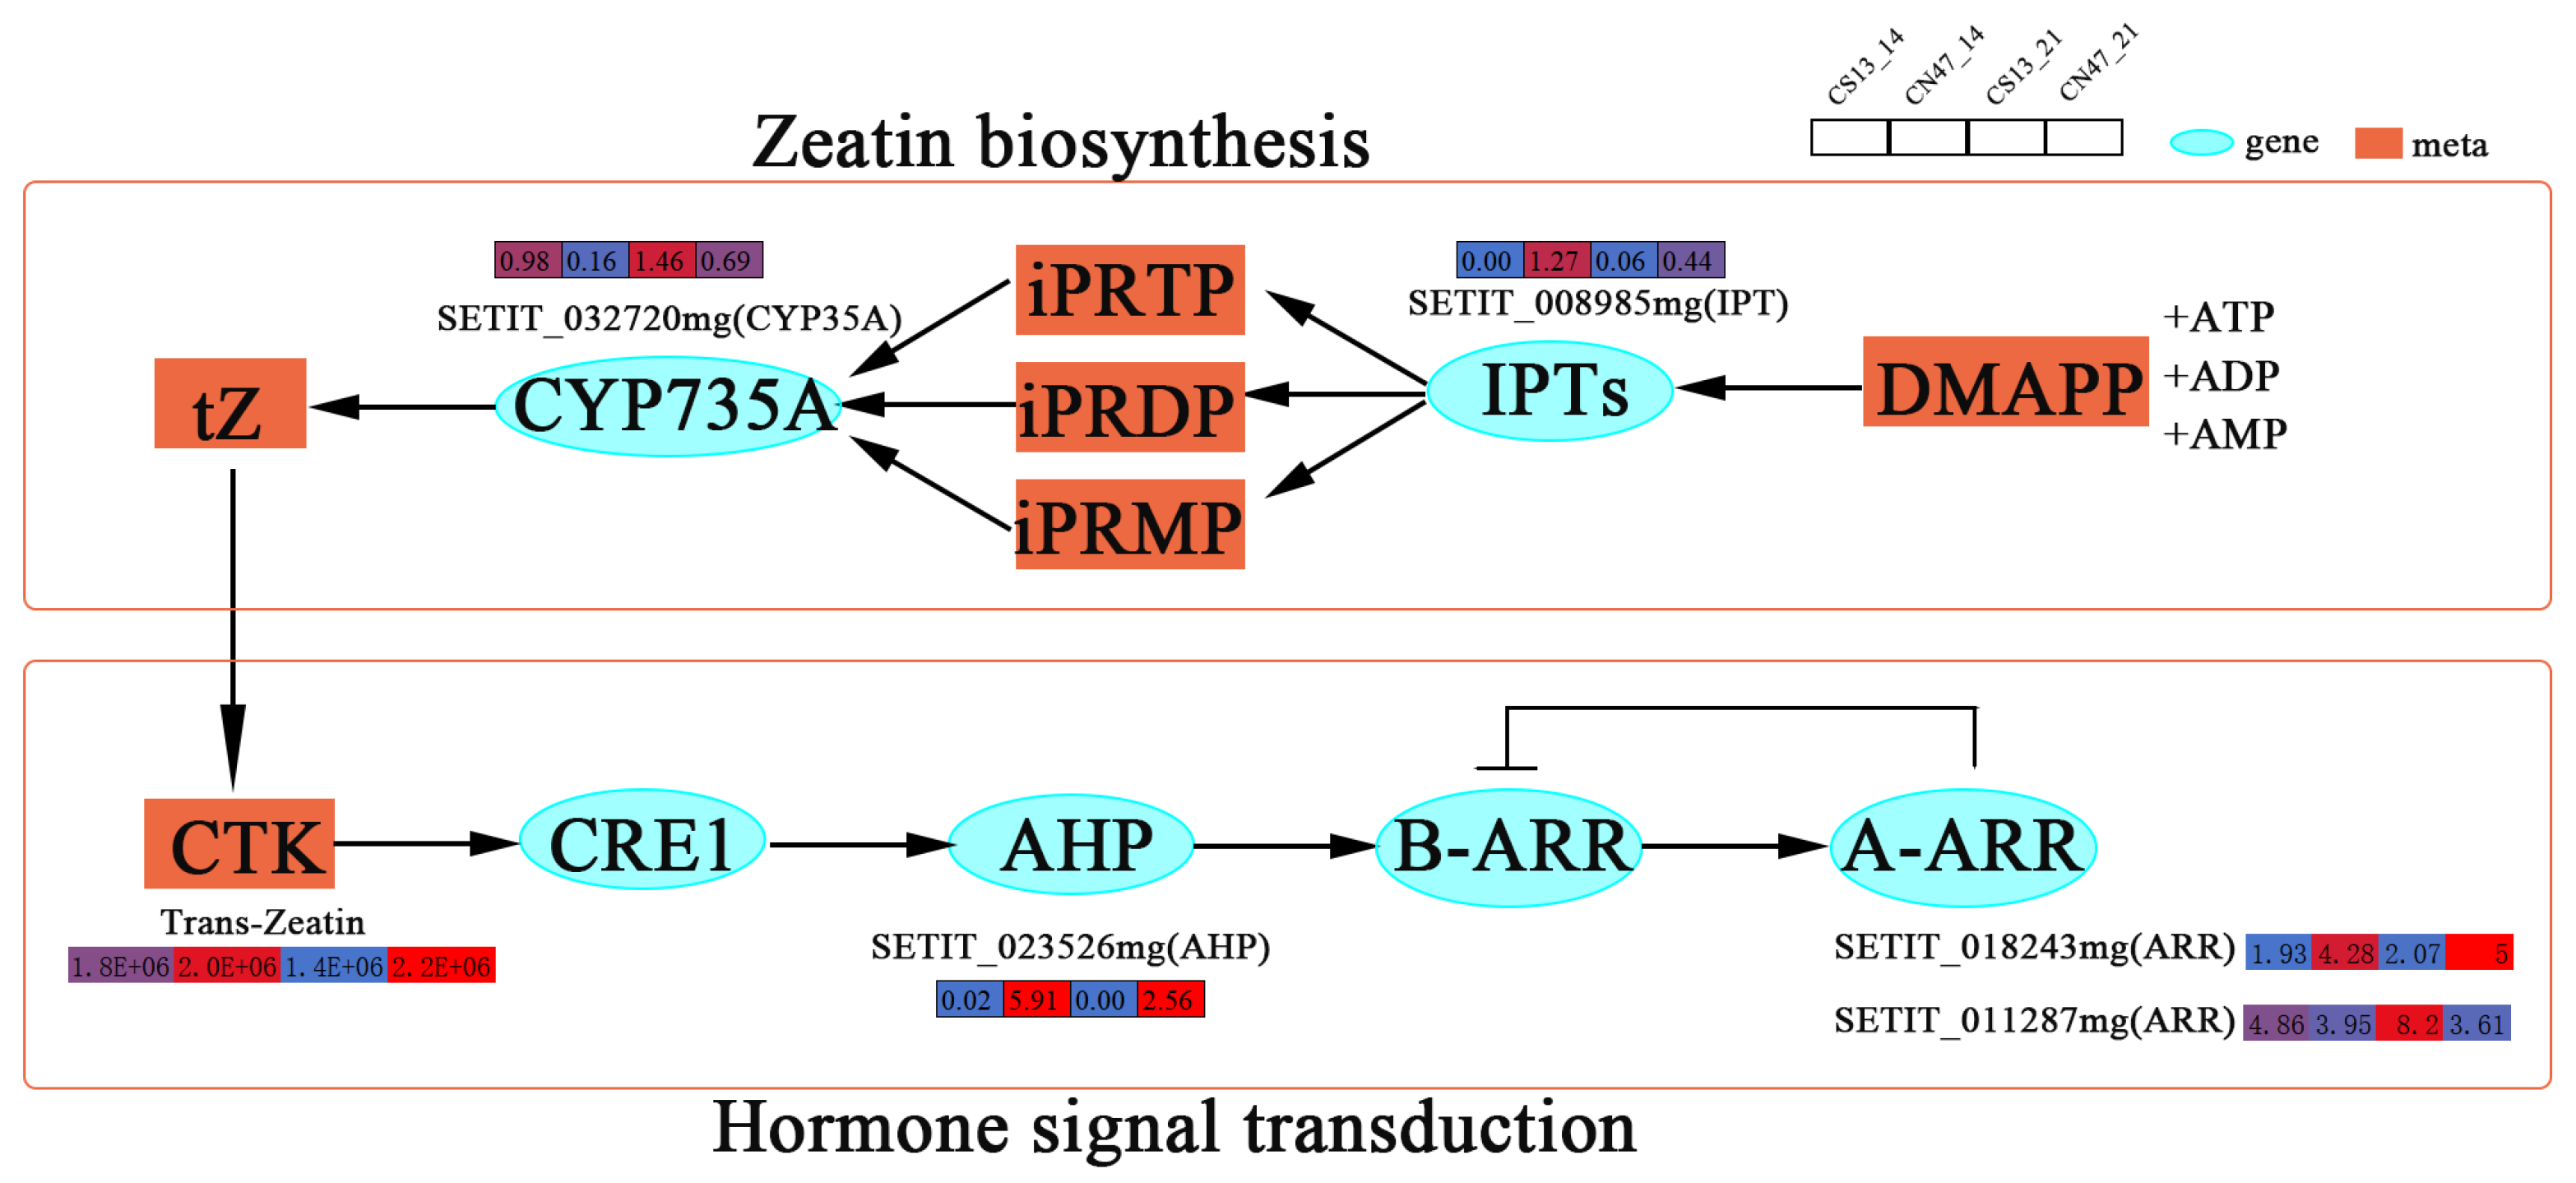
Figure 8.
Quantitative real-time PCR (qRT-PCR) validation and RNA-seq data of 12 selected DEGs.
Disclaimer/Publisher’s Note: The statements, opinions and data contained in all publications are solely those of the individual author(s) and contributor(s) and not of MDPI and/or the editor(s). MDPI and/or the editor(s) disclaim responsibility for any injury to people or property resulting from any ideas, methods, instructions or products referred to in the content. |
© 2024 by the authors. Licensee MDPI, Basel, Switzerland. This article is an open access article distributed under the terms and conditions of the Creative Commons Attribution (CC BY) license (http://creativecommons.org/licenses/by/4.0/).
Copyright: This open access article is published under a Creative Commons CC BY 4.0 license, which permit the free download, distribution, and reuse, provided that the author and preprint are cited in any reuse.


