Submitted:
15 April 2024
Posted:
16 April 2024
You are already at the latest version
Abstract
In breast cancer, epithelial-mesenchymal transition (EMT) is positively associated with programmed death ligand 1 (PD-L1) expression and immune escape, and TWIST1 induces EMT and cancer metastasis. However, how TWIST1 regulates PD-L1 and immune evasion is unknown. This study analyzed TWIST1 and PD-L1 expression in breast cancers, investigated the mechanism for TWIST1 to regulate PD-L1 transcription, and assessed the effects of TWIST1 and PD-L1 in cancer cells on the cytotoxicity of CD8+ effector T cells. Interestingly, TWIST1 expression is associated with high-level PD-L1 in triple negative breast cancers (TNBCs). Overexpression and knockdown of TWIST1 robustly upregulates and downregulate PD-L1 expression, respectively. TWIST1 binds to the PD-L1 promoter and recruits the TIP60 acetyltransferase complex in a BRD8-dependent manner to promote PD-L1 expression, which drives immune escape of breast cancer cells by accelerating the exhaustion of CD8+ T cells. Accordingly, knockdown of TWIST1 or BRD8 or blockade of PD-L1 with a PD-L1 antibody significantly enhances CD8+ T cells to inhibit breast cancer cell growth. These results demonstrate that TWIST1 directly induces PD-L1 expression in breast cancer cells to drive immune evasion. Targeting TWIST1, BRD8 or PD-L1 in TNBC should facilitate CD8+ T cell-mediated immune therapy. TWIST1 may also serve as a biomarker for anti-PD-L1 immunotherapy.
Keywords:
Breast cancer
; EMT
; TWIST1
; metastasis
; immunosuppression
; PD-L1
; immune-checkpoint-inhibitor therapy
1. Introduction
Genome instability is a hallmark of cancer, which results in accumulation of somatic gene mutations, leading to production of cancer cell-specific neoantigens. Presumably, these neoantigens presented by cancer cells should be detected by the immune surveillance system, and these cancer cells should be eliminated by the responses of the immune system. However, many cancers actually escape from immune suppression in multiple ways. Firstly, tumor-associated macrophages, infiltrated myeloid-derived suppressor cells and regulatory T cells may contribute to the formation of a suppressive tumor microenvironment that prevents cancer cells from immune destruction [4]. Secondly, although tumor antigen-specific cytotoxic CD8+ T cells can kill cancer cells [5], prolonged exposure of these CD8+ T cells to cancer cells leads to their exhaustion, a state in which these CD8+ T cells have lost their cytotoxicity to cancer cells [6,7]. Thirdly, cancer cells can express high-level immune checkpoint proteins, such as the programmed death ligand 1 (PD-L1) protein coded by the CD274 gene, to protect themselves from been attacked by the effector T cells [8]. PD-L1 expressed in cancer cells interacts with its receptor, the programmed death protein 1 (PD-1), on immune cells to suppress immune cell function [9]. Overexpression of PD-L1 in cancer cells are correlated with poor prognosis of patients with advanced non-small cell lung cancer (NSCLC) [10], breast cancer [11], head/neck cancer [12], gastric cancer [13] and prostate cancer [14]. PD-L1 neutralizing antibodies, including atezolizumab and avelumab, and PD-1 neutralizing antibodies, including nivolumab, pembrolizumab and dostarlimab, have been used to treat multiple types of cancers such as melanoma, renal cell carcinoma, squamous lung cancer, and metastatic NSCLC [15,16,17]. The combination of cancer immunotherapy based on PD-L1/PD-1 immune checkpoint inhibitors (ICIs) with chemotherapy has also been proven moderately effective, and clinically approved for treating triple negative breast cancer (TNBC) [18,19,20]. Currently, one of the major challenges for breast cancer immunotherapy using ICIs is to identify reliable predictive biomarkers of response for patient selection and treatment optimization. Current markers, such as PD-L1 expression and tumor mutational burden, are still inconsistent for predicting outcomes of ICI therapies across breast cancer subtypes.
TWIST1 is a transcription factor that induces epithelial-mesenchymal transition (EMT) to promote cancer cell invasion, metastasis, stemness and drug resistance when it is expressed in breast and other cancer cells [21,22,23,24,25,26,27]. A subset of primary mouse breast tumor cells and almost all circulating tumor cells express Twist1 and exhibit partial EMT, while knockout of Twist1 can inhibit partial EMT and intravasation of these tumor cells [23]. TWIST1 also induces therapeutic resistance by suppressing the expression of estrogen receptor α (ERα), the target of antiestrogen, by inhibiting p53, and by upregulating AKT2 [28,29,30,31,32]. Regarding the molecular mechanisms for TWIST1-mediated transcription in breast cancer cells, we have demonstrated that TWIST1 interacts with and recruits the nucleosome remodeling and deacetylase (NuRD) complex to repress the expression of epithelial genes such as CDH1 (E-cadherin), ESR1 (ERα), and FOXA1, while it interacts with and recruits the NuA4/TIP60 histone acetyltransferase (HAT) complex (TIP60-Com) to activate the expression of mesenchymal genes such as SNAI2 and growth genes such as MYC, WNT5A, and CCNE1 [3,33,34]. The TIP60-Com contains at least 16 subunits, including BRD8, p400, EPC1 and the TIP60 HAT [35,36]. The major acetylation targets of TIP60 are lysine residues (Ks) on nucleosomal histone H4, histone H2AK5, histone variants H2AZ and H2AX, and non-histone proteins such as p53 and TWIST1 [33,37]. On the chromatin, TIP60-Com functions to activate transcription involved in regulation of DNA repair, cell homeostasis, stress response, stem cell renewal and EMT [3,38,39,40,41,42]. BRD8 is a bromodomain (BD)-containing protein with two BDs. BD binds acetyl-Lys (acK) motifs in histones and non-histone proteins [43]. We have shown that TWIST1 interacts with TIP60-Com in a BRD8-dependent manner to activate mesenchymal gene expression in breast cancer cells [3].
Interestingly, EMT has been positively associated with cancer immune escape, though the molecular mechanisms are largely unclear [44]. Among the EMT-inducing transcription factors, SNAI1 and SNAI2 have been suggested to promote PD-L1 expression through upregulating ZEB1, and ZEB1 has been shown to indirectly upregulate PD-L1 expression through repressing the expression of miR-200 that targets PD-L1 RNA [45,46,47,48,49]. However, how TWIST1, a master EMT-inducing transcription factor, regulates PD-L1 expression and breast cancer immune escape is still unknown. In this study, we found that high levels of PD-L1 expression is associated with TWIST1 expression in estrogen receptor α-negative (ER-) and HER2-negative (HER2-) breast tumors and triple negative breast cancer (TNBC) cell lines. TWIST1 binds the CD274 promoter and recruits TIP60-Com to the promoter to robustly upregulate PD-L1 expression, which accelerates the exhaustion and death of CD8+ effector T cells to drive breast cancer immune evasion. Accordingly, blockade of PD-L1 activity largely diminishes immune evasion driven by TWIST1.
2. Materials and Methods
2.1. Data Mining of Human Breast Cancer Transcriptomes
Publicly accessible METABRIC datasets contain transcriptomes of a large number of human breast tumors [50,51]. Using their normalized expression data available from the cBioPortal (https://www.cbioportal.org) [52], we obtained and compared the mRNA expression profiles of TWIST1, VIM, SNAI2, CDH1, ESR1 and CD274 in different subtypes of breast tumors. Tukey’s multiple comparison tests were performed to compare the median log expression of each gene for each molecular subtype of breast cancer. P-value < 0.05 was considered statistically significant.
2.2. Western Blot
Western Blot was performed as described previously [3]. Cells were lysed with RIPA buffer containing 10 mM Tris-HCl, pH 8.0, 1 mM EDTA, 0.5 mM EGTA, 1% Triton X-100, 0.1% sodium deoxycholate, 0.1% SDS, and 140 mM NaCl. Protein concentration was determined by the BCA protein assay reagent (ThermoFisher Scientific, Waltham, MA). Five μg of total protein were separated by SDS-PAGE and blotted onto a nitrocellulose membrane. The membrane was incubated with primary antibodies, and matched secondary antibodies conjugated with horseradish peroxidase (HRP). The activity of HRP-conjugated secondary antibody (Bio-rad, Hercules, CA) was visualized using the SuperSignal West Pico Chemiluminescent Substrate (Thermo Scientific, Waltham, MA). Primary antibodies included those against TWIST1 (sc-81417, Santa Cruz, Dallas, TX), Ovalbumin (sc-65984, Santa Cruz), GAPDH (sc-32233, Santa Cruz), PD-L1 (13684S, Cell Signaling Technology, Danvers, MA), BRD8 (ab17969, Abcam, Cambridge, UK), ACTIN (A5441, Millipore Sigma, Burlington, MA).
2.3. Cell Culture and Generation of Cell Lines
MCF7 cells were obtained from ATCC and cultured in DMEM (Fisher Scientific, Hampton, NH) supplemented with 10% fetal bovine serum (FBS), 4.5 g/liter glucose, 0.36 mg/ml L-glutamine, 100 I.U./ml penicillin and 100 μg/ml streptomycin at 37oC with 5% CO2. MCF7-Ctrl1 and MCF7-TWIST1 cells were generated as described previously [3]. Briefly, 300,000 MCF7 cells in 60-mm dishes were transfected using 3.75 μl of Lipofectamine 3000 (Life technologies, Waltham, MA) and 5 μg of empty pcDNA3.1 plasmid for generating MCF7-Ctrl1 cell lines or 5 μg of pcDNA3.1-Flag-TWIST1 expression plasmid for generating MCF7-TWIST1 cell lines. Individual colonies surviving in the growth-selection medium containing 0.5 mg/ml G418 (Sigma-Aldrich, St. Louis, MO) were isolated, expanded, and assayed by Western blot for TWIST1 expression. MCF7-Ctrl1-2b and MCF7-TWIST1-Ctrl2b cell lines were generated by transducing MCF7-Ctrl1 and MCF7-TWIST1 cells, respectively, with the pGIPZ lentivirus that expresses a non-targeting control shRNA and the puromycin-resistant marker as described previously [3]. MCF7-Ctrl1-BRD8KD and MCF7-TWIST1-BRD8KD cell lines were generated as described previously by transducing MCF7-TWIST1 cells with the pGIPZ lentivirus that expresses a BRD8 mRNA-targeting shRNA and the puromycin-resistant marker [3]. To make MCF7-Ctrl1-2o, MCF7-TWIST1-Ctrl2o, MCF7-Ctrl1-OVA and MCF7-TWIST1-OVA cell lines, lentivirus particles for expressing mCherry or mCherry and ovalbumin (OVA) were packaged in 293T cells as described previously [3], and used to transduce MCF7-Ctrl1 and MCCF7-TWIST1 cells. The cells that stably expressed mCherry were isolated by flow cytometry, expanded, and examined by Western blot for OVA expression.
BT549 cells were obtained from ATCC and cultured in RPMI-1640 medium with 10% FBS, 5 μg/ml insulin, 100 I.U./ml penicillin and 100 μg/ml streptomycin at 37°C with 5% CO2. The BT549-Ctrl1, BT549-TWIST1KD, BT549-Ctrl1-2b, BT549-Ctrl1-BRD8KD, BT549-Ctrl1-2o, BT549-Ctrl1-OVA, BT549-TWIST1KD-Ctrl2o, and BT549-TWIST1KD-OVA cell lines were generated using the similar reagents and methods used for generating MCF7-derived cell lines as described above or previously [3]. The relationships and selection markers of all MCF7 cell- and BT549 cell-derived cell lines used in this study are summarized in Table 1.
2.4. RT-qPCR
Total RNA was isolated using TRIzol reagent (Life technologies, Grand Island, NY) from different cell lines in culture. Reverse transcription was performed with 2 μg RNA by using the High-capacity cDNA Reverse Transcription kit (Applied Biosystems, Waltham, MA). Quantitative real-time PCR (qPCR) for measuring CD274 mRNA was performed using gene-specific primer pairs (Forward: 5’-GGCCCAAGCACTGAAAATGG-3’, and Reverse: 5’- CAGGCTCCCTGTTTGACTCC-3’), and matched Universal TaqMan probes (Roche, Nutley, NJ). The relative mRNA expression level was normalized to the level of the endogenous ACTB (β-actin) mRNA.
2.5. ChIP-qPCR Assay
ChIP assays were performed by following the protocol of SimpleChIP Enzymatic Chromatin IP Kit (Cell Signaling, Danvers, MA). Briefly, 2 × 10⁷ of MCF7 cell-derived and BT549 cell-derived cell lines on culture plates were cross-linked with 1% formaldehyde for 10 min at room temperature, and quenched with 0.125 M Glycine. Fixed cells were washed, and lysed in a buffer containing 10 mM EDTA, 50 mM Tris-HCl, pH 8.0, 0.33% SDS, 0.5% Empigen BB and protease inhibitor cocktails. The crosslinked protein-DNA complexes in the lysates were digested with micrococcal nuclease, and sonicated using Branson Sonifier 250 to shear genomic DNA to a length range of 150-500 bp. Sheared samples were pre-cleaned, and then immunoprecipitated with 2 μg antibody overnight at 4°C with rotation, followed by incubation with protein A/G beads for 4 hours at 4°C. Immunoprecipitated DNA was eluted with 120 μl elution buffer containing 2 mM EDTA, 100 mM NaCl, 20 mM Tris-HCl, pH 8.0, 0.5% Triton X-100, 0.1 M NaHCO3 and 1% SDS. The eluted DNA was extracted with phenol-chloroform, recovered by precipitation, and measured by TaqMan-qPCR using a 5’ forward primer, 5’-GTAGGGAGCGTTGTTCCTCC, and a 3’ reverse primer, 5’-GCACTTTAGGACGGAGGGTC, and a matched Universal TaqMan probe (Roche, Nutley, NJ) to the promoter regions of the CD274 gene. As a negative control, equal amount of ChIP grade non-immune mouse IgG was used to replace the specific antibody. qPCR analysis of a gene desert region in chromosome 2 using a forward primer, 5’-CATCCCTGGACTGATTGTCA, and a reverse primer, 5’-GGTTGGCCAGGTACATGTTT served as a negative control for non-specific immunoprecipitation of protein-DNA complexes [53].
2.6. Isolation of OT-1 Mouse CD8+ T Cells
The OT-1 transgenic mouse line (#003831, The Jackson Lab, Bar Harbor, ME) expresses a T cell receptor on the CD8+ T cells that specifically recognizes amino acid residues 257-264 of the ovalbumin presented by the MHC-I of the antigen-presenting cells [54]. To isolate OT-1 CD8+ T cells, OT-1 mice were euthanized, and their spleens were isolated. The spleens were put in a 70 μM-filter strainer (352350, Corning, Corning, NY) sitting on a 50 ml Falcon tube, smashed with a 5-mL syringe plunger, and flushed with PBS containing 0.5% BSA and 2 mM EDTA. The filtered cell suspension was centrifuged at 1,500 rpm at room temperature for 5 min and washed with the same buffer. CD8+ T cells were prepared using a mouse CD8 T cell isolation kit (130-104-075, Miltenyi Biotec, Auburn, CA). The red blood cells (RBCs) in the enriched CD8+ T cell preparation by the kit were removed by incubating the cell suspension with 1X RBC lysis buffer (00-4300-54, Thermo Fisher, Waltham, MA) for 5 minutes. The cells were collected by centrifuge, re-suspended in DMEM containing 10% FBS, 100 I.U./ml penicillin and 100 μg/ml streptomycin, and activated and expanded treating the cells for 4 days with the Dynabeads Mouse T-activator CD3/CD28 reagent (11452D, Thermo Fisher).
2.7. Breast Cancer Cell Proliferation Assay
MCF7-derived or BT549-derived control, overexpression, or knockdown cell lines were suspended in DMEM supplemented with 10% fetal bovine serum (FBS), 4.5 g/liter glucose, 0.36 mg/ml L-glutamine, 100 I.U./ml penicillin and 100 μg/ml streptomycin, and seeded into 96-well tissue culture plate at a density of 2,500 cells per well. 10,000 OT-1 mouse OT-1 CD8+ T cells were added to each well and co-cultured with MCF7- or BT549-derived breast cancer cells in the presence or absence of 0.5 μg/ml PD-L1 mAb (13684S, Cell Signaling Technology, Danvers, MA) at 37°C for 3 days. For measuring the viability of adherent breast cancer cells, the non-adherent T cells were collected with the culture medium from each well. Then, 100 μl of fresh culture medium and 20 μl of CellTiter 96 Aqueous One Solution (Promega, Madison, WI) were sequentially added to each well. Cells in the plate were incubated at 37°C for 3 hours. The absorbance was measured at 490 nm using a Synergy HT plate reader (BioTek, Winooski, VT).
2.8. Vitality and Apoptosis Assays of CD8+ T Cells
The OT-1 mouse CD8+ T cells collected from the coculture described above were washed with ice-cold PBS, re-suspended in 98 μl of PBS containing 2% FBS and 1 mM EDTA, and mixed with 2 μl of PD-1 antibody for flow cytometry (130-111-952, Miltenyi Biotec). The cells in the mixture were incubated for 30 min at 4°C in dark, and then diluted by adding 150 μl buffer. The number of PD-1-high CD8+ T cells was determined by flow cytometry. In addition, apoptotic CD8+ T cells were determined using a BD PharmingenTM FITC Annexin V Apoptosis Detection kit I (556547, BD Biosciences, Franklin Lakes, NJ)
2.9. Statistical Analyses
Data were collected from at least three biological replicates as indicated in figure legends to ensure adequate power (> 80%) except those indicated. Data were expressed as mean ± standard deviation (SD). Graphpad Prism 10 Software (GraphPad, La Jolla, CA, USA) was used to perform unpaired two-sided Student’s t-test to analyze the difference between two datasets, and One-Way ANOVA to analyze the differences among three or more datasets. In all statistical analyses, P-value < 0.05 was considered statistically significant.
3. Results
3.1. TWIST1 Robustly Upregulates PD-L1 Expression in Breast Cancer Cells
We previously reported that TWIST1 induces transcriptional activation of mesenchymal genes such as VIM (Vimentin) and SNAI2 (Snail 2) but transcriptional repression of epithelial genes such as CDH1 (E- cadherin) and ESR1 (ERα) in breast cancer cells, which was supported in part by transcriptomic data showing that expression of TWIST1 in MCF-7 breast cancer cells induced Vim and Snai2 expression but repressed CDH1 and ESR1 expression (Figure 1A) [32,55,56,57]. Interestingly, the same transcriptomic analysis also revealed a robust increase in CD274 mRNA in TWIST1-expressing MCF-7 (MCF7-TWIST1) cells versus control MCF-7 (MCF7-Ctrl1) cells (Figure 1B). To assess the correlation of TWIST1 expression with its regulated genes in human breast tumors, we analyzed the METABRIC transcriptomic datasets downloaded from cBioPortal [50,51,52]. Among five subtypes of human breast tumors, the expression levels of TWIST1 and its upregulated genes Vim and SNAI2 are the highest while its repressed target genes CDH2 and ESR1 are the lowest in ERα-/HER2- breast cancers (Figure 1C). The expression level of CD274 mRNA is also the highest in ER-/HER2- breast tumors (Figure 1D). Furthermore, PD-L1 protein is expressed at low levels in ER+/TWIST1- breast cancer cell lines including MCF7, ZR-75-1 and T47D, while at high levels in ER-/TWIST1+ TNBC cell lines including MDA-MB-436, BT549 and SUM1315 (Figure 1E). These results suggest that the expression levels of TWIST1 and CD274 (PD-L1) are positively associated in breast cancer cells.
To establish the regulatory relationship between TWIST1 and CD274, we assayed the effects of TWIST1 overexpression in MCF7-TWIST1 cells and TWIST1 knockdown (KD) in BT549-TWIST1KD cells. Indeed, overexpression of TWIST1 in MCF7-TWIST1 cells robustly upregulated CD274 mRNA and PD-L1 protein (Figure 2A,B), while knockdown of TWIST1 in BT549-TWIST1KD cells drastically reduced CD274 mRNA and PD-L1 protein (Figure 2C,D). These results demonstrate that TWIST1 is required for high expression of PD-L1 in breast cancer cells.
3.2. TWIST1 Binds the CD274 Promoter and Recruits TIP60-Com in a BRD8-Dependent Manner
The human CD274 gene is located at the region bp 5,450,542 – 5,470,554 in chromosome 9, and its promoter is located within a 500 bp sequence adjacent to its transcriptional start site (TSS) as symbolled by the peaks of acetylated histones H3K9 and H3K27 in MCF7 and MDA-MB-468 cells (Figure 3A). Interestingly, our Chip-Seq analysis detected a sharp TWIST1-binding peak that overlapped with the CD274 promoter in MCF7-TWIST1 cells, which specificity is supported by using MCF7-Ctrl1 cells without TWIST1 expression as a negative control (Figure 3A). ChIP-qPCR analysis further confirmed that TWIST1 is specifically associated with the CD274 promoter in both MCF7-TWIST1 cells with ectopic TWIST1 expression and BT549 cells with endogenous TWIST1 expression (Figure 3B,C). These results indicate that CD274 is a direct target gene of TWIST1.
We previously reported that TWIST1 interacts with TIP60-Com, a histone acetyltransferase complex containing BRD8, TIP60, P400, EPC1 and other components, in a BRD8-dependent manner to acetylate histone H4 for transcriptional activation of its target genes, such as SNAI2 and MYC [3]. To determine whether TWIST1 also recruits this complex to the CD274 promoter, we performed ChIP-qPCR assays to assess the occupancy statuses of multiple components of TIP60-Com. We first used a gene desert region known to have no transcription factor binding as a negative control chromatin region for antibodies, and we detected no occupancy of all examined proteins including TWIST1, BRD8, TIP60, P400, EPC1 and acetylated histone H4 (acH4) in this region in both MCF7-TWIST1 and BT549 cells (Figure 3B,C). We then performed ChIP-qPCR assays for the CD274 promoter region using the antibodies to these same proteins. In both MCF7-TWIST1 and BT549 cells with TWIST1 expression, we detected abundant associations of the components of TIP60-Com, including BRD8, TIP60, P400 and EPC1 in addition to TWIST1 and high levels of acH4 with the CD274 promoter. However, in TWIST1-negative MCF7-Ctrl1 cells and TWIST1-knockdown BT549 cells, no significant occupancies of the components of TIP60-Com as well as TWIST1 were detected (Figure 3B,C). Importantly, knockdown of BRD8 in either MCF7-TWIST1 or BT549 cells did not affect TWIST1 binding to the CD274 promoter, but diminished the recruitments of TIP60-Com components to the CD274 promoter (Figure 3B,C). Collectively, these results indicate that TWIST1 effectively recruits TIP60-Com to the CD274 promoter in a BRD8-dependent manner.
3.3. TWIST1 Requires TIP60-Com to Transcriptionally Activate CD274 Expression
Since BRD8 is required for TWIST1 to recruit TIP60-Com to the CD274 promoter, we assessed the role of TIP60-Com in TWIST1-mediated transcriptional activation of the CD274 gene by knocking down BRD8. We found that in TWIST1-negative MCF7-Ctrl1 cells and TWIST1-KD BT549 cells, both CD274 mRNA and protein are expressed at low levels, suggesting that this low-level CD274 expression is independent of TWIST1. Knockdown of BRD8 in these two types of cells had no significant effects on the low-level CD274 mRNA and its protein PD-L1 expression, suggesting that BRD8 does not regulate CD274 expression in the absence of TWIST1. Importantly, CD274/PD-L1 is expressed at high levels in MCF7-TWIST1 cells and BT549 cells with high-level TWIST1 expression, and knockdown of BRD8 in these two types of cells dramatically reduced CD274/PD-L1 expression (Figure 4). These results, together with the results shown in Figure 3, demonstrate that TWIST1 relies on BRD8 to recruit TIP60-Com to the CD274 promoter to activate its expression.
3.4. TWIST1 Expressed in Breast Cancer Cells Promotes Their Immune Evasion by Accelerating CD8+ T Cell Exhaustion and Death
PD-L1 on the surface of cancer cells binds its receptor PD-1 on the surface of cytotoxic effector T cells such as CD8+ T cells to inhibit T cell activation and promote T cell exhaustion and death, resulting in immune escape of these cancer cells [58]. To examine whether TWIST1-upregulated CD274/PD-L1 expression in breast cancer cells promotes immune evasion, we established a coculture system consisting of breast cancer cells with the expression of ovalbumin (OVA), a tumor antigen mimic, and CD8+ T cells isolated from OT-1 mice that express OVA-specific T cell receptor [54]. We generated MCF7-Ctrl1-OVA and MCF7-TWIST1-OVA cell lines by lentivirus-mediated expression of ovalbumin and the mCherry cell-sorting marker in MCF7-Ctrl1 and MCF7-TWIST1 cell lines, respectively. We also made BT549-Ctrl1-OVA and BT549-TWIST1KD-OVA cell lines by the same approach from BT549-Ctrl1 and BT549-TWIST1-KD cell lines, respectively (Figure 5). In the coculture, OT-1 CD8+ T cells inhibited the growth of MCF7-Ctrl1-OVA cells by 20% versus MCF7-Ctrl1 cells, while they only inhibited the growth of MCF7-TWIST1-OVA cells by 11% versus MCF7-TWIST1-Ctrl2o cells (Figure 6A). Similarly, OT-1 CD8+ T cells inhibited the growth of BT549-TWIST1KD-OVA cells with low TWIST1 expression by 14% versus BT549-TWIST1KD-Ctrl2o cells, but they only inhibited the growth of BT549-Ctrl1-OVA cells with high TWIST1 expression by 8% versus BT549-Ctrl1-2o cells (Figure 6B). These results suggest that TWIST1 expressed in breast cancer cells drives immune evasion from CD8+ T cell-mediated immunity.
To examine the effect of TWIST1-upregulated PD-L1 in breast cancer cells on CD8+ T cell exhaustion, we measured the percentage of OT-1 CD8+ T cells with high CD279 (PD-1) expression, which is a marker of CD8+ T cell exhaustion [59]. The percentages of high PD-1 CD8+ T cells in the coculture of MCF7-TWIST1-Ctrl2o and MCF7-TWIST1-OVA cells with high-level TWIST1 and CD274 were significantly higher than that in the coculture of MCF7-Ctrl1-2o and MCF7-Ctrl1-OVA cells without TWIST1 expression (Figure 6C). In agreement with this finding, the percentage of high PD-1 CD8+ T cells were also much higher in coculture with BT549-Ctrl1-2o and BT549-Ctrl1-OVA cells versus BT549-TWIST1KD-Ctrl2o and BT549-TWIST1KD-OVA cells (Figure 6D). We further stained CD8+ T cells in the cocultures with propidium iodide (PI) and measured the percentages of PI-positive dead CD8+ T cells by flow cytometry. We found that the percentage of PI-positive CD8+ T cells in the cocultures with MCF7-TWIST1-Ctrl2o and MCF7-TWIST1-OVA cells were higher than that in the cocultures with MCF7-Ctrl1-2o and MCF7-Ctrl1-OVA cells (Figure 6E). The percentages of PI-positive CD8+ T cells in the cocultures with BT549-Ctrl1-2o and BT549-Ctrl1-OVA cells were also higher than that in the cocultures with BT549-TWIST1KD-Ctrl2o and BT549-TWIST1KD-OVA cells (Figure 6F). Collectively, these results indicate that breast cancer cells with TWIST1-promoted high expression of PD-1 significantly accelerate CD8+ cytotoxic T cell exhaustion and death.
3.5. Inhibition of TWIST1-Upregulated CD274 in Breast Cancer Cells Strongly Sensitizes CD8+ T Cells to Kill Cancer Cells
To test whether blockade of the TWIST1-upregulated PD-L1 in breast cancer cells to bind to PD-1 in the CD8+ T cells can enhance the function of CD8+ T cells to kill the breast cancer cells, we treated the cocultures with a PD-L1 neutralizing antibody. Our assays revealed that this antibody treatment robustly enhanced the growth inhibition of MCF7-TWIST1-OVA cells with high TWIST1 and PD-L1 expression, but exerted no obvious effect on MCF7-Ctrl1-OVA cells with no TWIST1 and low PD-L1 expression. Consistent results were also obtained from treated BT549-Ctrl1-OVA with high TWIST1 and PD-L1 expression and BT549-TWIST1KD-OVA cells with low TWIST1 and PD-L1 expression (Figure 7A,B). Accordingly, PD-L1 antibody treatment also rescued CD8+ T cells from exhaustion in the cocultures with MCF7-TWIST1-OVA cells or with BT549-Ctrl1-OVA cells as evidenced by the significant reduction in the number of high-CD279/PD-1 CD8+ T cells (Figure 7C,D). These results demonstrate that PD-L1 antibody treatment can effectively overcome the immune evasion of breast cancer cells promoted by TWIST1-upregulated PD-L1, suggesting that TWIST1-expressing breast cancer may be sensitive to anti-PD-L1 based immune check point therapy.
4. Discussion
Multiple EMT-inducing transcription factors, such as TWIST1, SNAIL1/2, and ZEB1/2, may be expressed to drive breast cancer cells undergo EMT and acquire increased invasion, metastasis and drug resistant capabilities. Occurring in parallel to EMT and metastasis are changes in the tumor microenvironment that suppress anti-tumor immunity. Although EMT has been proposed to be associated with cancer immune evasion, reports about the molecular linkage between EMT and the suppression of anti-tumor immunity has been limited. Previous studies have proposed an indirect crosstalk molecular mechanism among EMT, miR-200, ZEB1, PD-L1, and metastasis in cancer cells. In epithelial cells, miR-200 is high, and it targets ZEB1 and PD-L1 mRNAs and suppresses EMT and metastasis. In EMT cancer cells, ZEB1 is high, and it transcriptionally represses miR-200 expression, resulting in increased PD-L1, and enhanced EMT and metastasis [47,49,60,61]. In this study, we found that the expression levels of TWIST1 and its direct target genes are the highest in ER-/HER2- breast cancers, and are also correlated with PD-L1 expression. High PD-L1 expression is also positively associated with TWIST1 expression in TNBC cell lines. Furthermore, expression of TWIST1 in TWIST1-negative MCF7 cells, which is known to induce EMT [3,31], induced robust expression of PD-L1, while knockdown of TWIST1 in BT549 TWIST1-positive cells drastically downregulated PD-L1. These novel observations clearly demonstrate that TWIST1 strongly upregulates PD-L1 expression in breast cancer cells to drive immune evasion, in addition to induce EMT to promote invasion and metastasis. Therefore, these data makes a link between TWIST1-induced EMT and PD-L1-mediated immune escape for the first time.
We have recently demonstrated that TWIST1 binds to SNAI2 and MYC genes and recruits TIP60-Com to transcriptionally upregulate these genes [3]. In this study, we found that TWIST1 employs the similar mechanism to upregulate PD-L1. TWIST1 binds to the promoter of the CD274 gene, recruits TIP60-Com to the promoter through interacting with BRD8, a component of TIP60-Com, increases the level of acetylated histone H4, and robustly upregulates CD274 mRNA and its protein PD-L1. We also showed that knockdown of endogenous TWIST1 or BRD8 in BT549 TNBC cells drastically decreased PD-L1 expression to an exceedingly low level. These findings suggest that TWIST1 or BRD8 can be targeted to prevent PD-L1 overexpression and other mesenchymal target gene expression for inhibiting immune evasion, EMT and metastasis.
The dynamic interaction between immune and cancer cells in the tumor microenvironment plays a critical role in controlling cancer progression. Among the various immune cells, tumor neoantigen-specific CD8+ T cells appear to be the key immune cells showing strong cytotoxic activity [62]. Abundance of CD8+ T cells in the tumor microenvironment correlates with improved survival [63], while PD-L1 expression in tumor cells and other types of cells in the tumor microenvironment correlates with poor survival rates in breast cancer patients [64]. It is also well-established that high-level PD-L1 on the cancer cell surface binds its receptor PD-1 on the CD8+ T cell surface, leading to suppression and exhaustion of CD8+ T cells to facilitate cancer immune evasion. Indeed, this study confirmed that TWIST1-upregulated PD-L1 in breast cancer cells significantly suppresses the cancer cell-killing activity of CD8+ T cells, and accelerates their exhaustion and death in the coculture.
Exhaustion of CD8+ T cells have been one of the major barriers to tumor immunity, and reinvigorating those exhausted CD8+ T cells can provide opportunities to improve anti-tumor immunotherapy. In this study, we demonstrated that blocking PD-L1/PD-1 pathway by a PD-L1 neutralizing antibody greatly reversed the exhaustion status of CD8+ T cells, and reinvigorated CD8+ T cells to inhibit breast cancer cells in the coculture. These results suggest that blockade of TWIST1-upregulated PD-L1 function in breast cancer cells can effectively prevent immune escape of these cancer cells, and TWIST1-expressing breast cancer cells are sensitive to ICI-based immunotherapies.
5. Conclusion
TWIST1 expression is positively correlated with CD274/PD-L1 expression in ER-/HER2- breast cancers and TNBC cell lines. CD274 is a direct target gene of TWIST1, and TWIST1 binds to the CD274 promoter and recruits TIP60-Com in a BRD8-dependent manner to transcriptionally upregulate CD274/PD-L1 expression. The TWIST1-upregulated PD-L1 in the breast cancer cells drives immune evasion through strongly suppressing the cancer cell-killing activity and causing exhaustion and death of CD8+ T cells. Knockdown of TWIST1 or BRD8 or blockade of PD-L1 activity can successfully reverse CD8+ T cell exhaustion, and reinvigorates CD8+ T cells to inhibit breast cancer cells. These findings suggest that the immune evasion of TWIST1-expressing breast cancer cells can be targeted by inhibiting the function of TWIST1, BRD8 and/or PD-L1, and that TWIST1 may serve as a biomarker to predict the value of ICI based immunotherapies for patients with TNBC.
Author Contributions
Conceptualization, X.Y. and J.X.; Methodology, X.Y.; Validation, Formal Analysis, Investigation, and data curation, X.Y.; Resources, J.X., and X.Y.; Writing – Original Draft preparation, Review, Editing and Visualization, X.Y. and J.X; Supervision, Project Administration and Funding Acquisition, J.X.
Funding
This work was partially supported by NIH grants R01CA193455, R21CA267006, and R21DE033147 and a Gordon Cain-Endowed Professorship in Cell Biology to J.X.
Institutional Review Board Statement
The animal protocol is approved by the Institutional Animal Care and Use Committee at Baylor College of Medicine.
Data Available Statement: Data were generated by the authors and included in the article.
Acknowledgments
We thank Suoling Zhou, Lan Liao, and Bing Sun at Baylor College of Medicine (BCM) for experimental assistance. We also thank Dr. Longyong Xu and Dr. Xi Chen at BCM for animal resource, and Dr. Luis Becerra Dominguez and Dr. Xiang Zhang at BCM for providing the lentiviral mCherry and ovalbumin expression plasmids.
Conflicts of Interest
X.Y. and J.X. have been shareholders of CoRegen, Inc. J.X. has been involved as a consultant in CoRegen, Inc.
References
- Consortium, E.P. An integrated encyclopedia of DNA elements in the human genome. Nature 2012, 489, 57–74. [Google Scholar] [CrossRef] [PubMed]
- Davis, C.A.; Hitz, B.C.; Sloan, C.A.; Chan, E.T.; Davidson, J.M.; Gabdank, I.; Hilton, J.A.; Jain, K.; Baymuradov, U.K.; Narayanan, A.K.; Onate, K.C.; Graham, K.; Miyasato, S.R.; Dreszer, T.R.; Strattan, J.S.; Jolanki, O.; Tanaka, F.Y.; and Cherry, J.M. The Encyclopedia of DNA elements (ENCODE): data portal update. Nucleic Acids Res 2018, 46, D794–D801. [Google Scholar] [CrossRef] [PubMed]
- Yu, X.; He, T.; Tong, Z.; Liao, L.; Huang, S.; Fakhouri, W.D.; Edwards, D.P.; and Xu, J. Molecular mechanisms of TWIST1-regulated transcription in EMT and cancer metastasis. EMBO Rep 2023, 24, e56902. [Google Scholar] [CrossRef]
- Hanahan, D.; and Coussens, L.M. Accessories to the crime: functions of cells recruited to the tumor microenvironment. Cancer Cell 2012, 21, 309–322. [Google Scholar] [CrossRef]
- Restifo, N.P.; Dudley, M.E.; and Rosenberg, S.A. Adoptive immunotherapy for cancer: harnessing the T cell response. Nat Rev Immunol 2012, 12, 269–281. [Google Scholar] [CrossRef] [PubMed]
- Baessler, A.; and Vignali, D.A.A. T Cell Exhaustion. Annu Rev Immunol.
- Chen 2024, L.; and Flies, D.B. Molecular mechanisms of T cell co-stimulation and co-inhibition. Nat Rev Immunol 2013, 13, 227–242. [Google Scholar] [CrossRef]
- He, X.; and Xu, C. Immune checkpoint signaling and cancer immunotherapy. Cell Res 2020, 30, 660–669. [Google Scholar] [CrossRef]
- Tang, Q.; Chen, Y.; Li, X.; Long, S.; Shi, Y.; Yu, Y.; Wu, W.; Han, L.; and Wang, S. The role of PD-1/PD-L1 and application of immune-checkpoint inhibitors in human cancers. Front Immunol 2022, 13, 964442. [Google Scholar] [CrossRef] [PubMed]
- Sinoquet, L.; Jacot, W.; Gauthier, L.; Pouderoux, S.; Viala, M.; Cayrefourcq, L.; Quantin, X.; and Alix-Panabieres, C. Programmed Cell Death Ligand 1-Expressing Circulating Tumor Cells: A New Prognostic Biomarker in Non-Small Cell Lung Cancer. Clin Chem 2021, 67, 1503–1512. [Google Scholar] [CrossRef]
- Mazel, M.; Jacot, W.; Pantel, K.; Bartkowiak, K.; Topart, D.; Cayrefourcq, L.; Rossille, D.; Maudelonde, T.; Fest, T.; and Alix-Panabieres, C. Frequent expression of PD-L1 on circulating breast cancer cells. Mol Oncol 2015, 9, 1773–1782. [Google Scholar] [CrossRef]
- Strati, A.; Koutsodontis, G.; Papaxoinis, G.; Angelidis, I.; Zavridou, M.; Economopoulou, P.; Kotsantis, I.; Avgeris, M.; Mazel, M.; Perisanidis, C.; Sasaki, C.; Alix-Panabieres, C.; Lianidou, E.; and Psyrri, A. Prognostic significance of PD-L1 expression on circulating tumor cells in patients with head and neck squamous cell carcinoma. Ann Oncol 2017, 28, 1923–1933. [Google Scholar] [CrossRef] [PubMed]
- Gu, L.; Chen, M.; Guo, D.; Zhu, H.; Zhang, W.; Pan, J.; Zhong, X.; Li, X.; Qian, H.; and Wang, X. PD-L1 and gastric cancer prognosis: A systematic review and meta-analysis. PLoS One 2017, 12, e0182692. [Google Scholar] [CrossRef] [PubMed]
- Xu, Y.; Song, G.; Xie, S.; Jiang, W.; Chen, X.; Chu, M.; Hu, X.; and Wang, Z.W. The roles of PD-1/PD-L1 in the prognosis and immunotherapy of prostate cancer. Mol Ther 2021, 29, 1958–1969. [Google Scholar] [CrossRef] [PubMed]
- Rotte, A. Combination of CTLA-4 and PD-1 blockers for treatment of cancer. J Exp Clin Cancer Res 2019, 38, 255. [Google Scholar] [CrossRef] [PubMed]
- Kazandjian, D.; Suzman, D.L.; Blumenthal, G.; Mushti, S.; He, K.; Libeg, M.; Keegan, P.; and Pazdur, R. FDA Approval Summary: Nivolumab for the Treatment of Metastatic Non-Small Cell Lung Cancer With Progression On or After Platinum-Based Chemotherapy. Oncologist 2016, 21, 634–642. [Google Scholar] [CrossRef] [PubMed]
- Voena, C.; and Chiarle, R. Advances in cancer immunology and cancer immunotherapy. Discov Med 2016, 21, 125–133. [Google Scholar]
- Debien, V.; De Caluwe, A.; Wang, X.; Piccart-Gebhart, M.; Tuohy, V.K.; Romano, E.; and Buisseret, L. Immunotherapy in breast cancer: an overview of current strategies and perspectives. NPJ Breast Cancer 2023, 9, 7. [Google Scholar] [CrossRef] [PubMed]
- Cortes, J.; Rugo, H.S.; Cescon, D.W.; Im, S.A.; Yusof, M.M.; Gallardo, C.; Lipatov, O.; Barrios, C.H.; Perez-Garcia, J.; Iwata, H.; Masuda, N.; Torregroza Otero, M.; Gokmen, E.; Loi, S.; Guo, Z.; Zhou, X.; Karantza, V.; Pan, W.; Schmid, P.; and Investigators, K.-. . Pembrolizumab plus Chemotherapy in Advanced Triple-Negative Breast Cancer. N Engl J Med 2022, 387, 217–226. [Google Scholar] [CrossRef] [PubMed]
- Cortes, J.; Cescon, D.W.; Rugo, H.S.; Nowecki, Z.; Im, S.A.; Yusof, M.M.; Gallardo, C.; Lipatov, O.; Barrios, C.H.; Holgado, E.; Iwata, H.; Masuda, N.; Otero, M.T.; Gokmen, E.; Loi, S.; Guo, Z.; Zhao, J.; Aktan, G.; Karantza, V.; Schmid, P.; and Investigators, K.-. . Pembrolizumab plus chemotherapy versus placebo plus chemotherapy for previously untreated locally recurrent inoperable or metastatic triple-negative breast cancer (KEYNOTE-355): a randomised, placebo-controlled, double-blind, phase 3 clinical trial. Lancet 2020, 396, 1817–1828. [Google Scholar] [CrossRef]
- Yang, J.; Mani, S.A.; Donaher, J.L.; Ramaswamy, S.; Itzykson, R.A.; Come, C.; Savagner, P.; Gitelman, I.; Richardson, A.; and Weinberg, R.A. Twist, a master regulator of morphogenesis, plays an essential role in tumor metastasis. Cell 2004, 117, 927–939. [Google Scholar] [CrossRef]
- Mani, S.A.; Guo, W.; Liao, M.J.; Eaton, E.N.; Ayyanan, A.; Zhou, A.Y.; Brooks, M.; Reinhard, F.; Zhang, C.C.; Shipitsin, M.; Campbell, L.L.; Polyak, K.; Brisken, C.; Yang, J.; and Weinberg, R.A. The epithelial-mesenchymal transition generates cells with properties of stem cells. Cell 2008, 133, 704–715. [Google Scholar] [CrossRef] [PubMed]
- Xu, Y.; Lee, D.; Feng, Z.; Xu, Y.; Bu, W.; Li, Y.; Liao, L.; and Xu, J. Breast tumor cell-specific knockout of Twist1 inhibits cancer cell plasticity, dissemination and lung metastasis in Mice. Proc Natl Acad Sci U S A 2017, 114, 11494–11499. [Google Scholar] [CrossRef] [PubMed]
- Qin, Q.; Xu, Y.; He, T.; Qin, C.; and Xu, J. Normal and disease-related biological functions of Twist1 and underlying molecular mechanisms. Cell Res 2012, 22, 90–106. [Google Scholar] [CrossRef]
- Yang, J.; Hou, Y.; Zhou, M.; Wen, S.; Zhou, J.; Xu, L.; Tang, X.; Du, Y.E.; Hu, P.; and Liu, M. Twist induces epithelial-mesenchymal transition and cell motility in breast cancer via ITGB1-FAK/ILK signaling axis and its associated downstream network. Int J Biochem Cell Biol 2016, 71, 62–71. [Google Scholar] [CrossRef] [PubMed]
- Eckert, M.A.; Lwin, T.M.; Chang, A.T.; Kim, J.; Danis, E.; Ohno-Machado, L.; and Yang, J. Twist1-induced invadopodia formation promotes tumor metastasis. Cancer Cell 2011, 19, 372–386. [Google Scholar] [CrossRef] [PubMed]
- Battula, V.L.; Evans, K.W.; Hollier, B.G.; Shi, Y.; Marini, F.C.; Ayyanan, A.; Wang, R.Y.; Brisken, C.; Guerra, R.; Andreeff, M.; and Mani, S.A. Epithelial-mesenchymal transition-derived cells exhibit multilineage differentiation potential similar to mesenchymal stem cells. Stem Cells 2010, 28, 1435–1445. [Google Scholar] [CrossRef] [PubMed]
- Cheng, G.Z.; Chan, J.; Wang, Q.; Zhang, W.; Sun, C.D.; and Wang, L.H. Twist transcriptionally up-regulates AKT2 in breast cancer cells leading to increased migration, invasion, and resistance to paclitaxel. Cancer Res 2007, 67, 1979–1987. [Google Scholar] [CrossRef] [PubMed]
- Maestro, R.; Dei Tos, A.P.; Hamamori, Y.; Krasnokutsky, S.; Sartorelli, V.; Kedes, L.; Doglioni, C.; Beach, D.H.; and Hannon, G.J. Twist is a potential oncogene that inhibits apoptosis. Genes Dev 1999, 13, 2207–2217. [Google Scholar] [CrossRef] [PubMed]
- Vesuna, F.; Lisok, A.; van Diest, P.; and Raman, V. Twist activates miR-22 to suppress estrogen receptor alpha in breast cancer. Mol Cell Biochem 2021, 476, 2295–2306. [Google Scholar] [CrossRef]
- Xu, Y.; Qin, L.; Sun, T.; Wu, H.; He, T.; Yang, Z.; Mo, Q.; Liao, L.; and Xu, J. Twist1 promotes breast cancer invasion and metastasis by silencing Foxa1 expression. Oncogene 2017, 36, 1157–1166. [Google Scholar] [CrossRef]
- Fu, J.; Zhang, L.; He, T.; Xiao, X.; Liu, X.; Wang, L.; Yang, L.; Yang, M.; Zhang, T.; Chen, R.; and Xu, J. TWIST represses estrogen receptor-alpha expression by recruiting the NuRD protein complex in breast cancer cells. Int J Biol Sci 2012, 8, 522–532. [Google Scholar] [CrossRef] [PubMed]
- Shi, J.; Wang, Y.; Zeng, L.; Wu, Y.; Deng, J.; Zhang, Q.; Lin, Y.; Li, J.; Kang, T.; Tao, M.; Rusinova, E.; Zhang, G.; Wang, C.; Zhu, H.; Yao, J.; Zeng, Y.X.; Evers, B.M.; Zhou, M.M.; and Zhou, B.P. Disrupting the interaction of BRD4 with diacetylated Twist suppresses tumorigenesis in basal-like breast cancer. Cancer Cell 2014, 25, 210–225. [Google Scholar] [CrossRef] [PubMed]
- Srivastava, J.; Rho, O.; Youssef, R.M.; and DiGiovanni, J. Twist1 regulates keratinocyte proliferation and skin tumor promotion. Mol Carcinog 2016, 55, 941–952. [Google Scholar] [CrossRef] [PubMed]
- Allard, S.; Utley, R.T.; Savard, J.; Clarke, A.; Grant, P.; Brandl, C.J.; Pillus, L.; Workman, J.L.; and Cote, J. NuA4, an essential transcription adaptor/histone H4 acetyltransferase complex containing Esa1p and the ATM-related cofactor Tra1p. EMBO J 1999, 18, 5108–5119. [Google Scholar] [CrossRef] [PubMed]
- Doyon, Y.; Selleck, W.; Lane, W.S.; Tan, S.; and Cote, J. Structural and functional conservation of the NuA4 histone acetyltransferase complex from yeast to humans. Mol Cell Biol 2004, 24, 1884–1896. [Google Scholar] [CrossRef] [PubMed]
- Jacquet, K.; Fradet-Turcotte, A.; Avvakumov, N.; Lambert, J.P.; Roques, C.; Pandita, R.K.; Paquet, E.; Herst, P.; Gingras, A.C.; Pandita, T.K.; Legube, G.; Doyon, Y.; Durocher, D.; and Cote, J. The TIP60 Complex Regulates Bivalent Chromatin Recognition by 53BP1 through Direct H4K20me Binding and H2AK15 Acetylation. Mol Cell 2016, 62, 409–421. [Google Scholar] [CrossRef] [PubMed]
- Ravens, S.; Yu, C.; Ye, T.; Stierle, M.; and Tora, L. Tip60 complex binds to active Pol II promoters and a subset of enhancers and co-regulates the c-Myc network in mouse embryonic stem cells. Epigenetics Chromatin 2015, 8, 45. [Google Scholar] [CrossRef] [PubMed]
- Judes, G.; Rifai, K.; Ngollo, M.; Daures, M.; Bignon, Y.J.; Penault-Llorca, F.; and Bernard-Gallon, D. A bivalent role of TIP60 histone acetyl transferase in human cancer. Epigenomics 2015, 7, 1351–1363. [Google Scholar] [CrossRef]
- Rossetto, D.; Cramet, M.; Wang, A.Y.; Steunou, A.L.; Lacoste, N.; Schulze, J.M.; Cote, V.; Monnet-Saksouk, J.; Piquet, S.; Nourani, A.; Kobor, M.S.; and Cote, J. Eaf5/7/3 form a functionally independent NuA4 submodule linked to RNA polymerase II-coupled nucleosome recycling. EMBO J 2014, 33, 1397–1415. [Google Scholar] [CrossRef]
- Avvakumov, N.; and Cote, J. The MYST family of histone acetyltransferases and their intimate links to cancer. Oncogene 2007, 26, 5395–5407. [Google Scholar] [CrossRef]
- Voss, A.K.; and Thomas, T. MYST family histone acetyltransferases take center stage in stem cells and development. Bioessays 2009, 31, 1050–1061. [Google Scholar] [CrossRef] [PubMed]
- Zaware, N.; and Zhou, M.M. Bromodomain biology and drug discovery. Nat Struct Mol Biol 2019, 26, 870–879. [Google Scholar] [CrossRef] [PubMed]
- Terry, S.; Savagner, P.; Ortiz-Cuaran, S.; Mahjoubi, L.; Saintigny, P.; Thiery, J.P.; and Chouaib, S. New insights into the role of EMT in tumor immune escape. Mol Oncol 2017, 11, 824–846. [Google Scholar] [CrossRef] [PubMed]
- Jiang, Y.; and Zhan, H. Communication between EMT and PD-L1 signaling: New insights into tumor immune evasion. Cancer Lett 2020, 468, 72–81. [Google Scholar] [CrossRef] [PubMed]
- Messeha, S.S.; Zarmouh, N.O.; and Soliman, K.F.A. Polyphenols Modulating Effects of PD-L1/PD-1 Checkpoint and EMT-Mediated PD-L1 Overexpression in Breast Cancer. Nutrients 2021, 13. [Google Scholar]
- Chen, L.; Gibbons, D.L.; Goswami, S.; Cortez, M.A.; Ahn, Y.H.; Byers, L.A.; Zhang, X.; Yi, X.; Dwyer, D.; Lin, W.; Diao, L.; Wang, J.; Roybal, J.; Patel, M.; Ungewiss, C.; Peng, D.; Antonia, S.; Mediavilla-Varela, M.; Robertson, G.; Suraokar, M.; Welsh, J.W.; Erez, B.; Wistuba, II, Chen, L. ; Peng, D.; Wang, S.; Ullrich, S.E.; Heymach, J.V.; Kurie, J.M.; and Qin, F.X. Metastasis is regulated via microRNA-200/ZEB1 axis control of tumour cell PD-L1 expression and intratumoral immunosuppression. Nat Commun 2014, 5, 5241. [Google Scholar] [CrossRef] [PubMed]
- Tsutsumi, S.; Saeki, H.; Nakashima, Y.; Ito, S.; Oki, E.; Morita, M.; Oda, Y.; Okano, S.; and Maehara, Y. Programmed death-ligand 1 expression at tumor invasive front is associated with epithelial-mesenchymal transition and poor prognosis in esophageal squamous cell carcinoma. Cancer Sci 2017, 108, 1119–1127. [Google Scholar] [CrossRef] [PubMed]
- Noman, M.Z.; Janji, B.; Abdou, A.; Hasmim, M.; Terry, S.; Tan, T.Z.; Mami-Chouaib, F.; Thiery, J.P.; and Chouaib, S. The immune checkpoint ligand PD-L1 is upregulated in EMT-activated human breast cancer cells by a mechanism involving ZEB-1 and miR-200. Oncoimmunology 2017, 6, e1263412. [Google Scholar] [CrossRef] [PubMed]
- Curtis, C.; Shah, S.P.; Chin, S.F.; Turashvili, G.; Rueda, O.M.; Dunning, M.J.; Speed, D.; Lynch, A.G.; Samarajiwa, S.; Yuan, Y.; Graf, S.; Ha, G.; Haffari, G.; Bashashati, A.; Russell, R.; McKinney, S.; Group, M.; Langerod, A.; Green, A.; Provenzano, E.; Wishart, G.; Pinder, S.; Watson, P.; Markowetz, F.; Murphy, L.; Ellis, I.; Purushotham, A.; Borresen-Dale, A.L.; Brenton, J.D.; Tavare, S.; Caldas, C.; and Aparicio, S. The genomic and transcriptomic architecture of 2,000 breast tumours reveals novel subgroups. Nature 2012, 486, 346–352. [Google Scholar] [CrossRef]
- Pereira, B.; Chin, S.F.; Rueda, O.M.; Vollan, H.K.; Provenzano, E.; Bardwell, H.A.; Pugh, M.; Jones, L.; Russell, R.; Sammut, S.J.; Tsui, D.W.; Liu, B.; Dawson, S.J.; Abraham, J.; Northen, H.; Peden, J.F.; Mukherjee, A.; Turashvili, G.; Green, A.R.; McKinney, S.; Oloumi, A.; Shah, S.; Rosenfeld, N.; Murphy, L.; Bentley, D.R.; Ellis, I.O.; Purushotham, A.; Pinder, S.E.; Borresen-Dale, A.L.; Earl, H.M.; Pharoah, P.D.; Ross, M.T.; Aparicio, S.; and Caldas, C. The somatic mutation profiles of 2,433 breast cancers refines their genomic and transcriptomic landscapes. Nat Commun 2016, 7, 11479. [Google Scholar] [CrossRef]
- Cerami, E.; Gao, J.; Dogrusoz, U.; Gross, B.E.; Sumer, S.O.; Aksoy, B.A.; Jacobsen, A.; Byrne, C.J.; Heuer, M.L.; Larsson, E.; Antipin, Y.; Reva, B.; Goldberg, A.P.; Sander, C.; and Schultz, N. The cBio cancer genomics portal: an open platform for exploring multidimensional cancer genomics data. Cancer Discov 2012, 2, 401–404. [Google Scholar] [CrossRef] [PubMed]
- Barski, A.; Chepelev, I.; Liko, D.; Cuddapah, S.; Fleming, A.B.; Birch, J.; Cui, K.; White, R.J.; and Zhao, K. Pol II and its associated epigenetic marks are present at Pol III-transcribed noncoding RNA genes. Nat Struct Mol Biol 2010, 17, 629–634. [Google Scholar] [CrossRef] [PubMed]
- Hogquist, K.A.; Jameson, S.C.; Heath, W.R.; Howard, J.L.; Bevan, M.J.; and Carbone, F.R. T cell receptor antagonist peptides induce positive selection. Cell 1994, 76, 17–27. [Google Scholar] [CrossRef] [PubMed]
- Fu, J.; Qin, L.; He, T.; Qin, J.; Hong, J.; Wong, J.; Liao, L.; and Xu, J. The TWIST/Mi2/NuRD protein complex and its essential role in cancer metastasis. Cell Res 2011, 21, 275–289. [Google Scholar] [CrossRef] [PubMed]
- Casas, E.; Kim, J.; Bendesky, A.; Ohno-Machado, L.; Wolfe, C.J.; and Yang, J. Snail2 is an essential mediator of Twist1-induced epithelial mesenchymal transition and metastasis. Cancer Res 2011, 71, 245–254. [Google Scholar] [CrossRef]
- Liu, W.; Gajendran, B.; Sample, K.M.; Wang, C.; Hu, A.; Chen, B.; Li, Y.; Zacksenhaus, E.; and Ben-David, Y. A critical ETV4/Twist1/Vimentin axis in Ha-RAS-induced aggressive breast cancer. Cancer Gene Ther 2022, 29, 1590–1599. [Google Scholar] [CrossRef]
- Ghosh, C.; Luong, G.; and Sun, Y. A snapshot of the PD-1/PD-L1 pathway. J Cancer 2021, 12, 2735–2746. [Google Scholar] [CrossRef]
- Kamphorst, A.O.; Wieland, A.; Nasti, T.; Yang, S.; Zhang, R.; Barber, D.L.; Konieczny, B.T.; Daugherty, C.Z.; Koenig, L.; Yu, K.; Sica, G.L.; Sharpe, A.H.; Freeman, G.J.; Blazar, B.R.; Turka, L.A.; Owonikoko, T.K.; Pillai, R.N.; Ramalingam, S.S.; Araki, K.; and Ahmed, R. Rescue of exhausted CD8 T cells by PD-1-targeted therapies is CD28-dependent. Science 2017, 355, 1423–1427. [Google Scholar] [CrossRef]
- Bracken, C.P.; Gregory, P.A.; Kolesnikoff, N.; Bert, A.G.; Wang, J.; Shannon, M.F.; and Goodall, G.J. A double-negative feedback loop between ZEB1-SIP1 and the microRNA-200 family regulates epithelial-mesenchymal transition. Cancer Res 2008, 68, 7846–7854. [Google Scholar] [CrossRef]
- Gregory, P.A.; Bert, A.G.; Paterson, E.L.; Barry, S.C.; Tsykin, A.; Farshid, G.; Vadas, M.A.; Khew-Goodall, Y.; and Goodall, G.J. The miR-200 family and miR-205 regulate epithelial to mesenchymal transition by targeting ZEB1 and SIP1. Nat Cell Biol 2008, 10, 593–601. [Google Scholar] [CrossRef]
- Fridman, W.H.; Pages, F.; Sautes-Fridman, C.; and Galon, J. The immune contexture in human tumours: impact on clinical outcome. Nat Rev Cancer 2012, 12, 298–306. [Google Scholar] [CrossRef] [PubMed]
- Krishnamurti, U.; Wetherilt, C.S.; Yang, J.; Peng, L.; and Li, X. Tumor-infiltrating lymphocytes are significantly associated with better overall survival and disease-free survival in triple-negative but not estrogen receptor-positive breast cancers. Hum Pathol 2017, 64, 7–12. [Google Scholar] [CrossRef] [PubMed]
- Muenst, S.; Schaerli, A.R.; Gao, F.; Daster, S.; Trella, E.; Droeser, R.A.; Muraro, M.G.; Zajac, P.; Zanetti, R.; Gillanders, W.E.; Weber, W.P.; and Soysal, S.D. Expression of programmed death ligand 1 (PD-L1) is associated with poor prognosis in human breast cancer. Breast Cancer Res Treat 2014, 146, 15–24. [Google Scholar] [CrossRef] [PubMed]
Figure 1.
CD274 expression is associated with the expression levels of TWIST1 and its target genes in breast cancer. A. TWIST1 upregulates mesenchymal genes VIM and SANI2 and represses epithelial genes CDH1 and ESR1 to induce epithelial-to-mesenchymal transition. B. RNA-seq data suggested a robust increase in CD274 mRNA in MCF7-TWIST1 cells versus MCF7-Ctrl1 cells. C. Expression profiles of TWIST1, VIM, SNAI2, CDH1, and ESR1 mRNAs in the indicated five subtypes of human breast tumors, which were obtained from analysis of the METABRIC datasets from a total of 1970 clinical specimens including 617 ER+/HP (high-proliferation), 640 ER+/LP (low-proliferation), 309 ER-/HER2-, 198 HER2+, and 216 normal-like tumors. The P-values were calculated by One-Way ANOVA. *, P < 0.05; **, P < 0.01; ****, P < 0.0001. D. The expression profile of CD274 mRNA in the five subtypes of human breast tumors from analysis of the METABRIC datasets. The P-values were calculated as described above. E. Western blot analysis of TWIST1 and CD274 proteins expressed in the indicated breast cancer cell lines. β-actin served as a loading control. The relative band intensity for each protein was normalized to the band intensity of β-actin and presented as a number under each band.
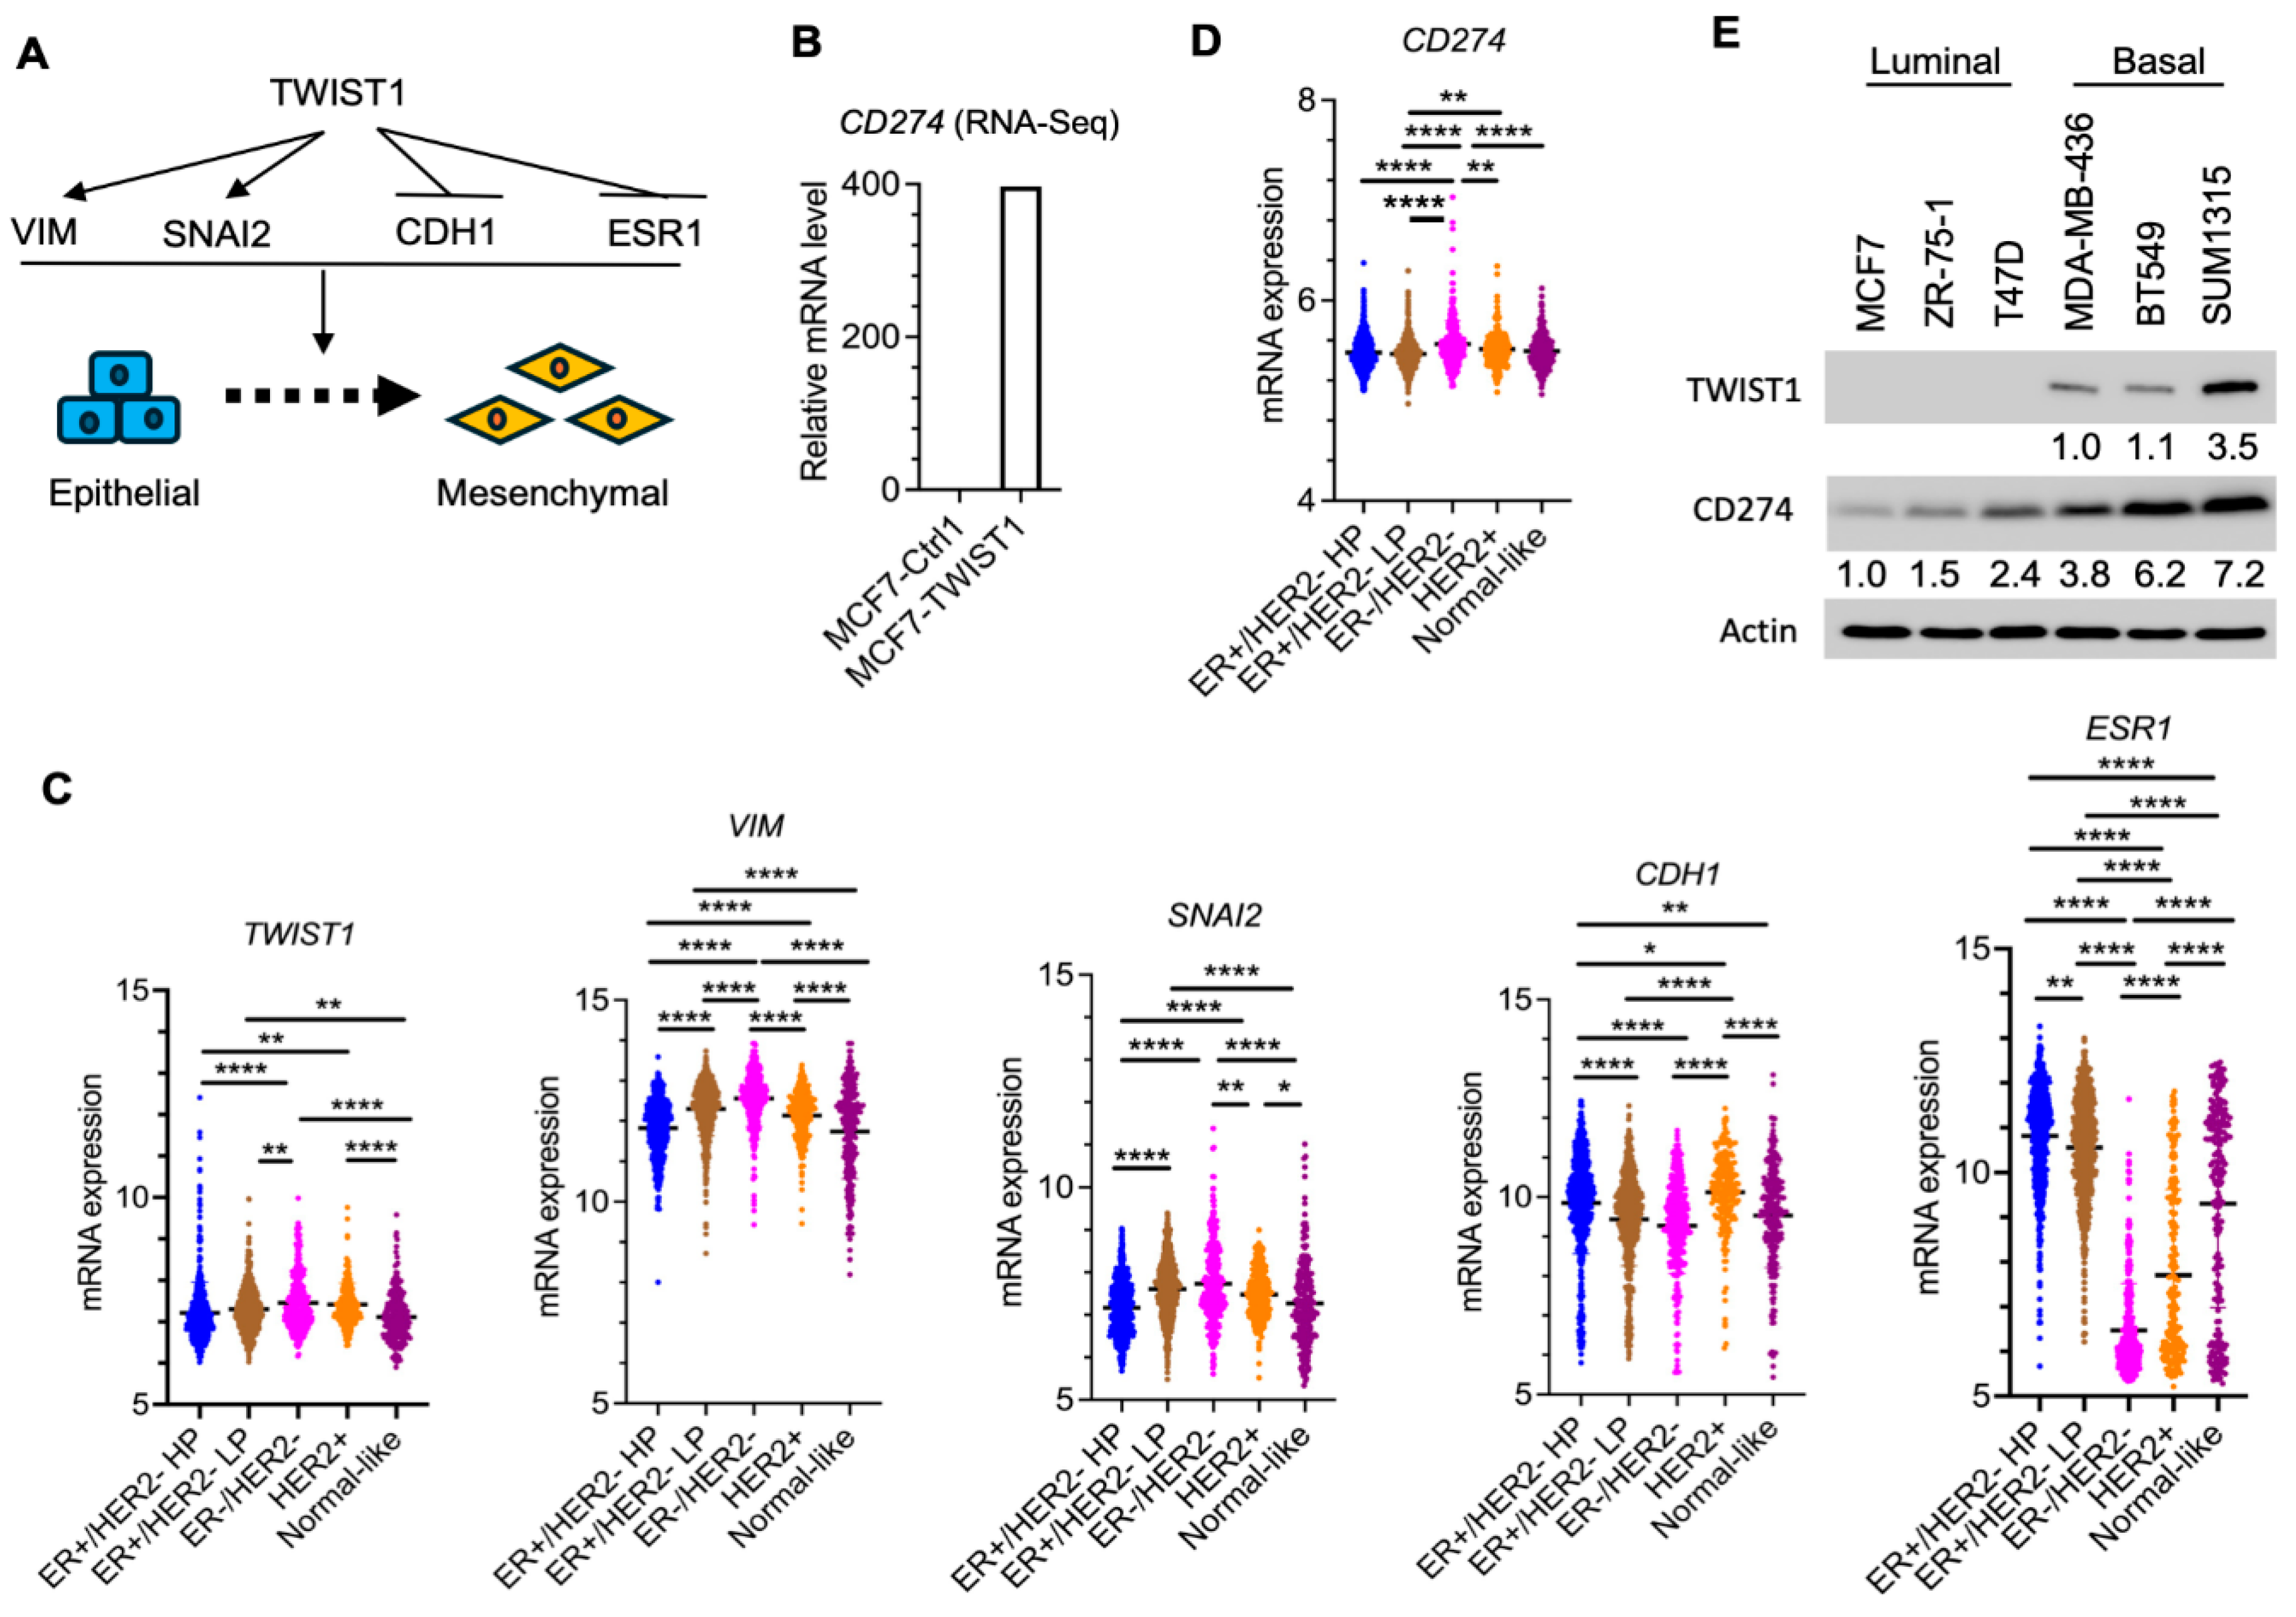
Figure 2.
Expression and knockdown of TWIST1 increased and decreased CD274 expression, respectively. A & B. CD274 mRNA and protein expressed in two different lines of MCF7-Ctrl1 and MCF7-TWIST1 cells, which were measured by RT-qPCR and Western blot, respectively. The P-values were calculated by One-Way ANOVA. ****, P < 0.0001. C & D. CD274 mRNA and protein expressed in two lines of BT549-Ctrl1 and BT549-TWIST1KD cells, which were measured as described above. The P-values were calculated as described above. *, P < 0.05. The data points in panels A and C represent biological replicates of assays.
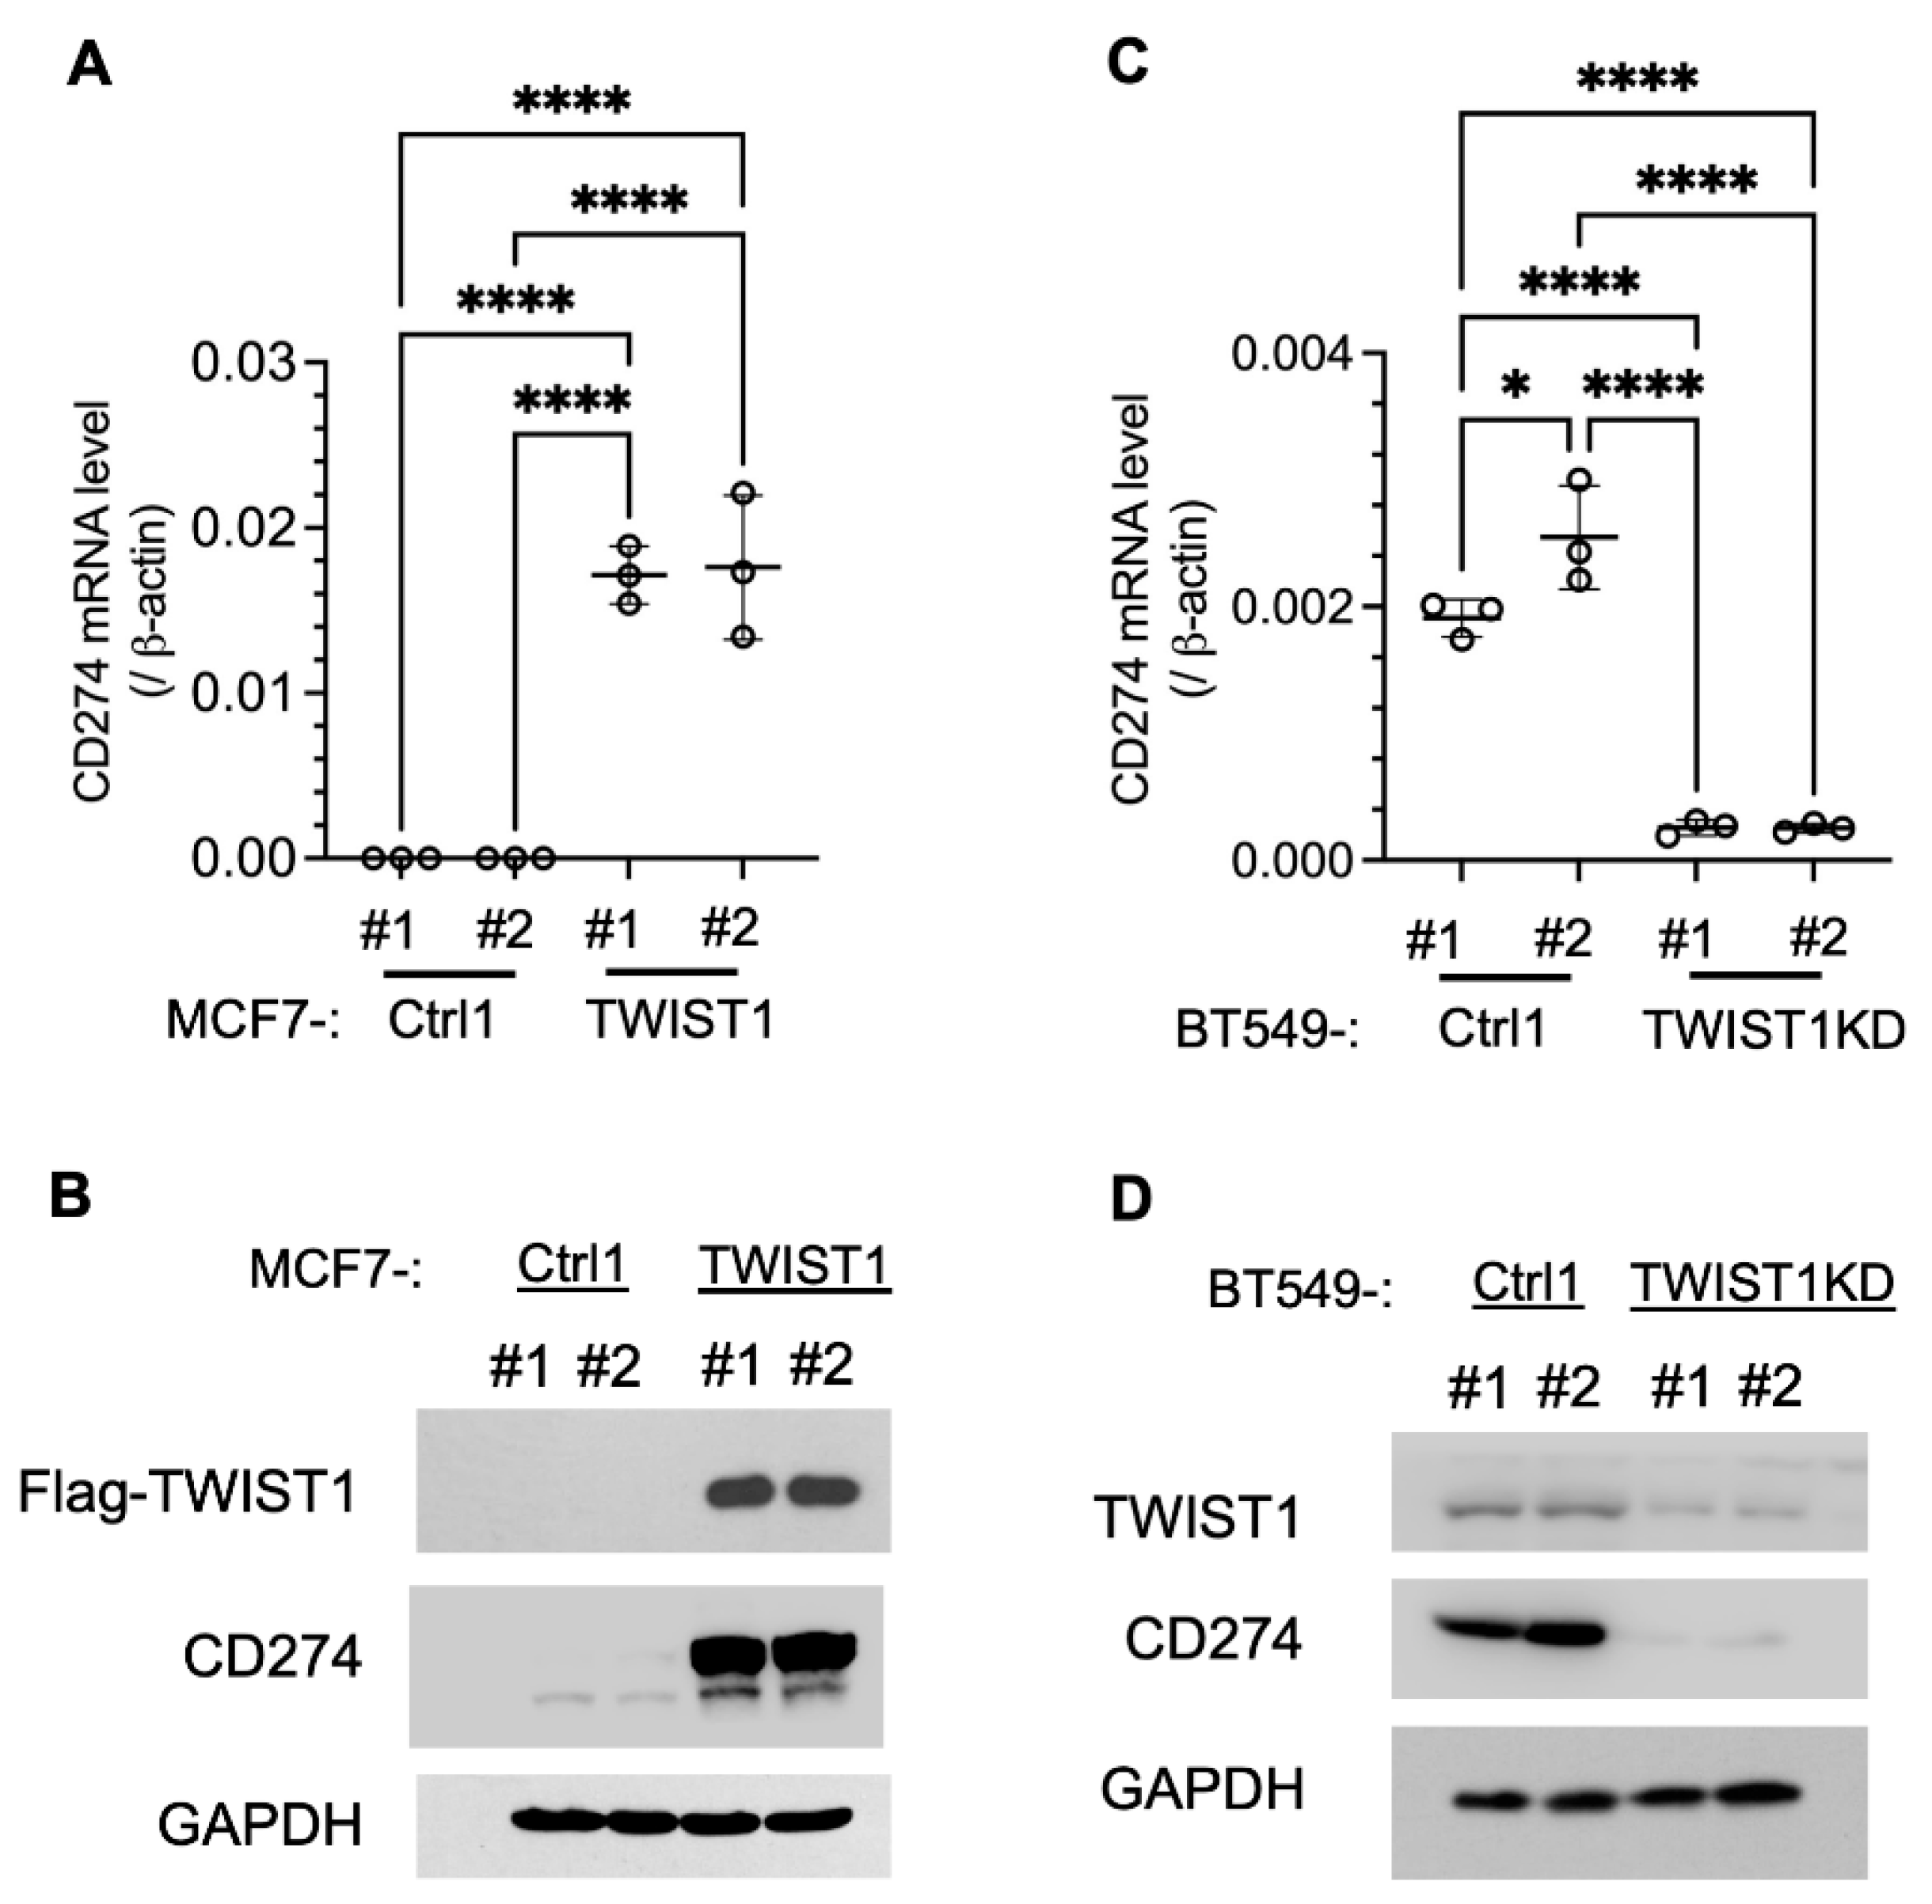
Figure 3.
TWIST1 binds the CD274 promoter and recruits the TIP60 complex in a BRD8-dependent manner. A. The location of the human CD274 gene in Chromosome 9 is indicated according to UCSC Genome Browser on Human (GRCh38/hg38). The transcriptional start site (TSS) of CD274 is indicated. The acetylated histone H3K9ac and H3K27ac peaks from bp -292 to +208 to the CD274 TSS in MCF7 cells [1,2] and MDA-MB-468 cells (ViMIC Database GSM2258896 and GSM2258884) are aligned with the CD274 gene. The TWIST1 binding peak in the same region in MCF7-TWIST1 cells was mapped by ChIP-Seq as described previously [3]. MCF7-Ctrl1 cells without TWIST1 expression served as a negative control for the ChIP-Seq assay. B & C. ChIP-qPCR assays for a gene desert negative control region and the TWIST1 binding site (TWIST1 BS) that overlaps with the H3K9ac and H3K27ac peaks near the CD274 TSS shown in panel A. ChIP-qPCR assays were performed using the indicated cell lines and the antibodies against the indicated proteins, and the non-immune IgG as a negative control. Quantitative data for each bar were obtained from three assays of biological replicates.
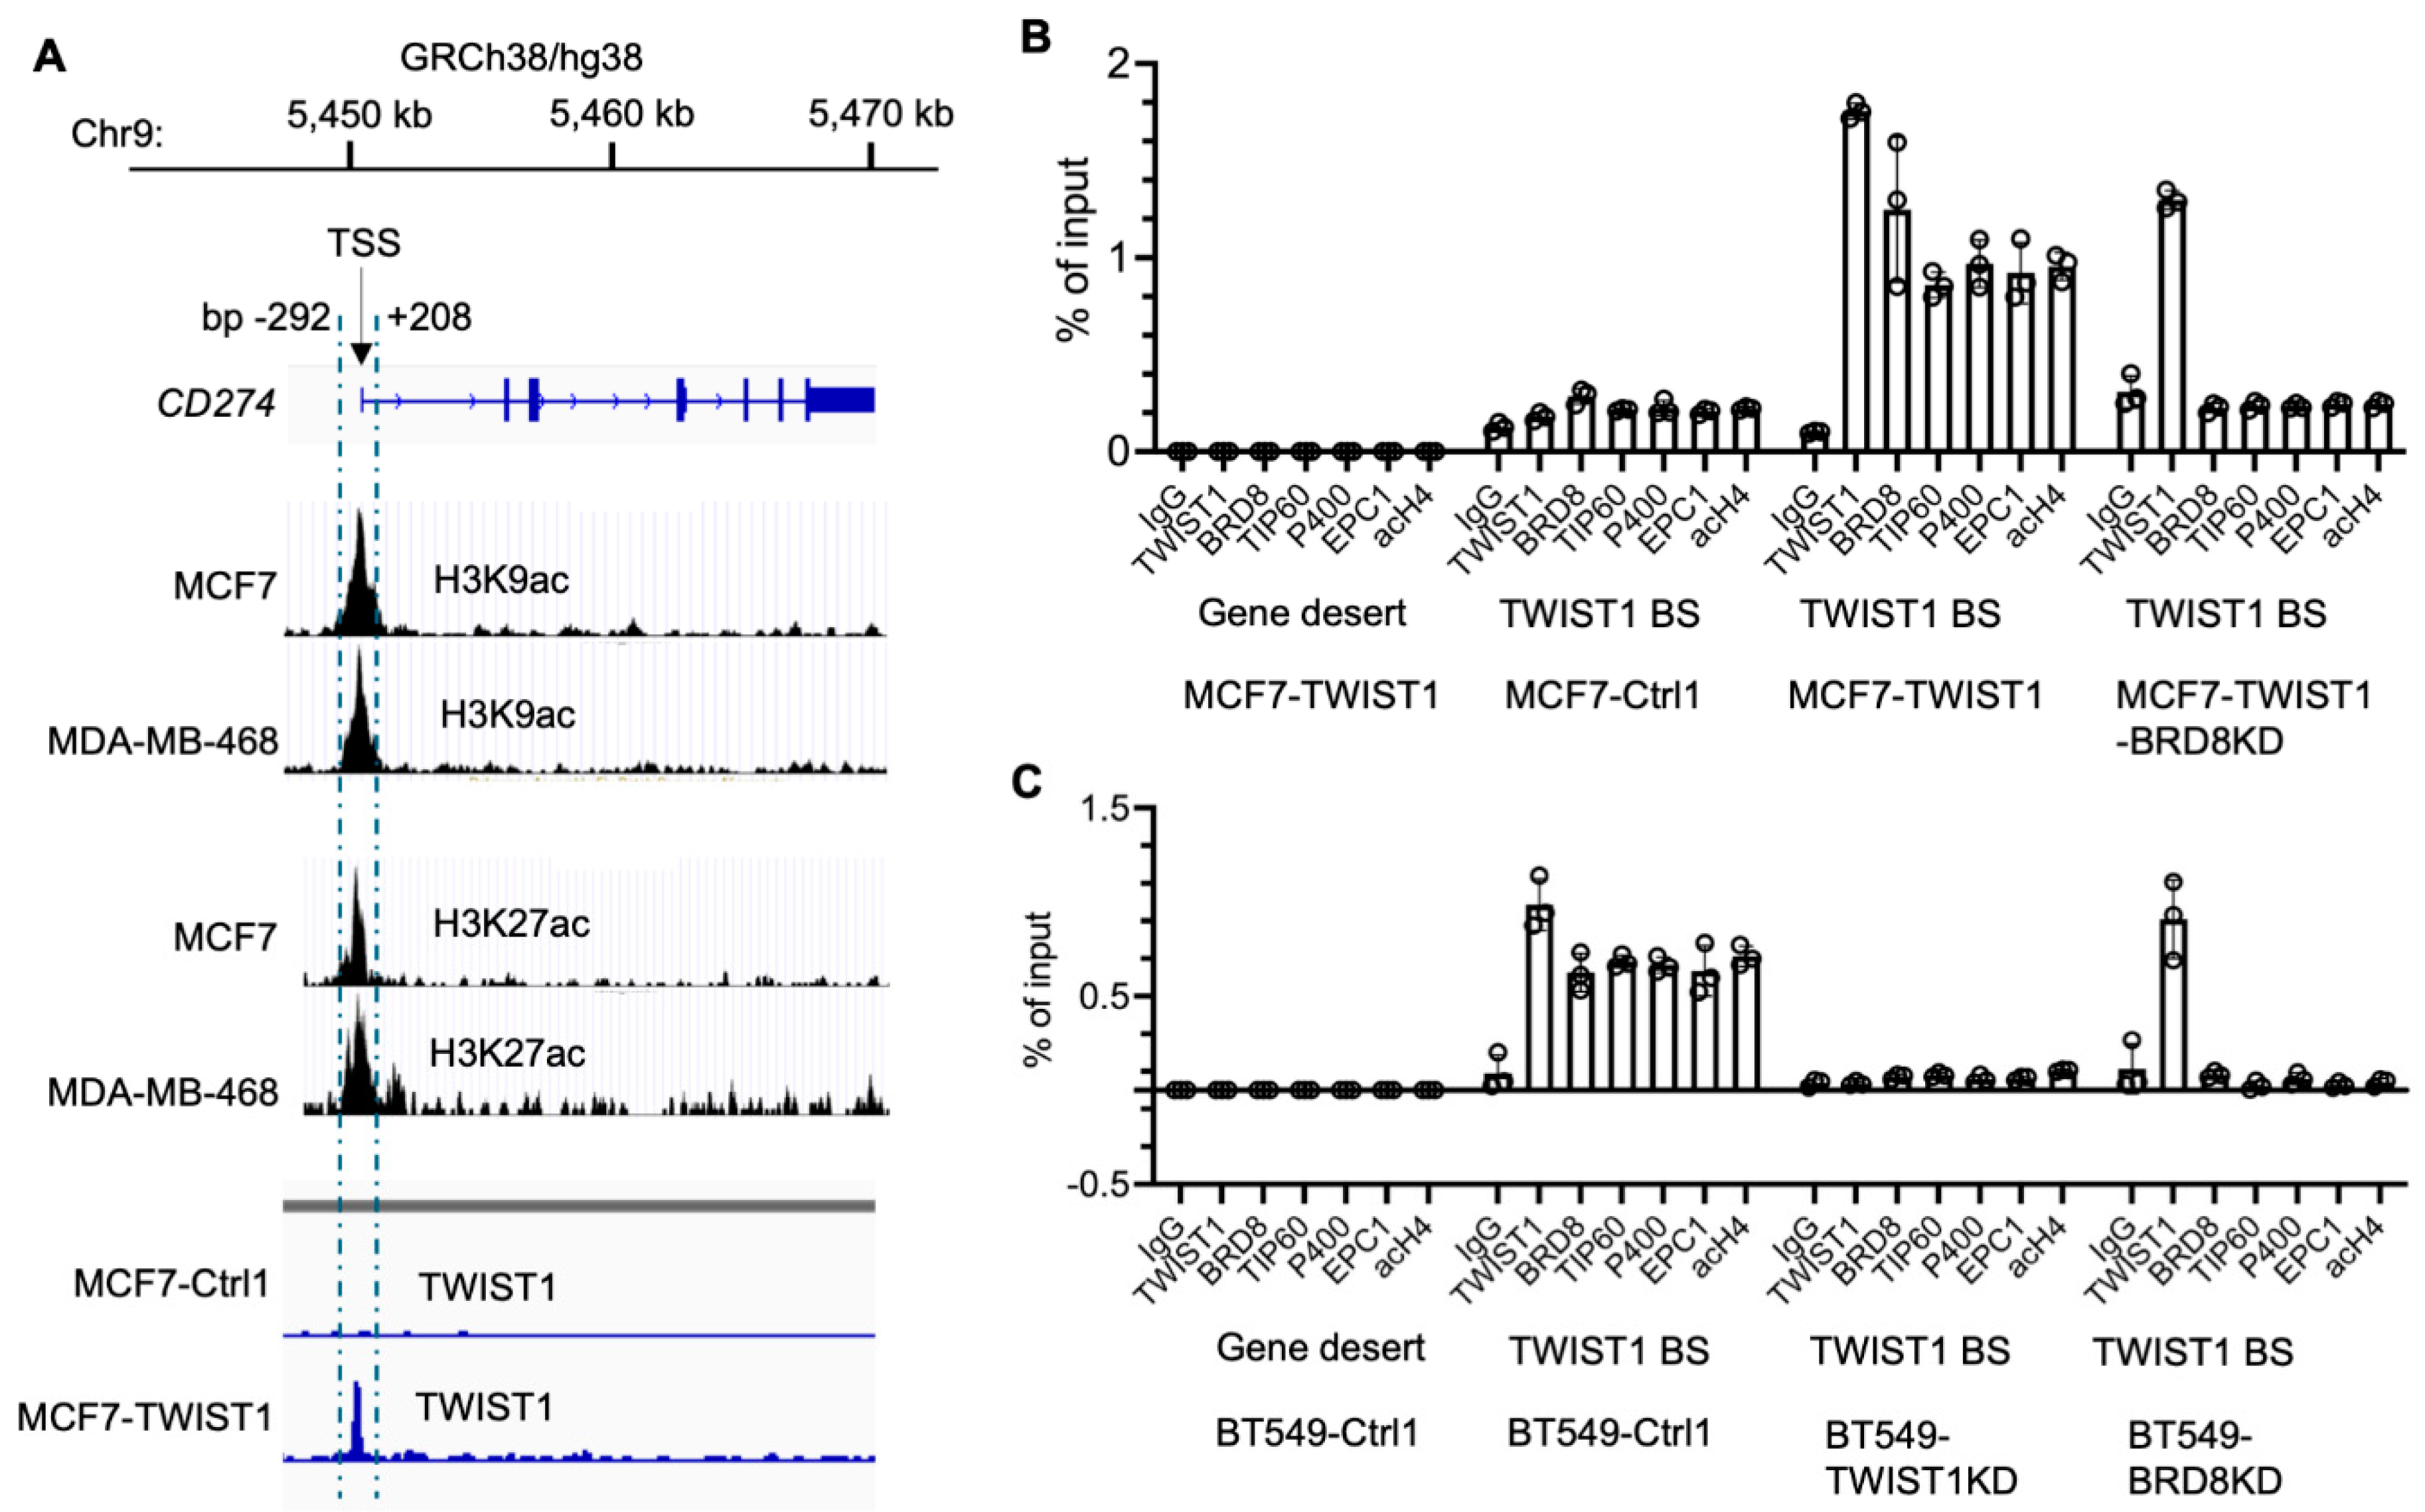
Figure 4.
Knockdown of BRD8 diminished TWIST1-promoted expression of CD274 mRNA and protein. A & B. CD274 mRNA and protein were measured in MCF7-Ctrl1-2b, MCF7-Ctrl1-BRD8KD, MCF7-TWIST1-Ctrl2b, and MCF7-TWIST1-BRD8KD cells by RT-qPCR and Western blot. The P-values were calculated by One-Way ANOVA. ***, P < 0.001; ****, P < 0.0001. C & D. CD274 mRNA and protein were measured in BT549-Ctrl1-2b, BT549-Ctrl1-BRD8KD, BT549-TWIST1KD-Ctrl2b, and BT549-TWIST1KD-BRD8KD cells by RT-qPCR and Western blot. The P-values were calculated as described above. **, P < 0.05. The data points in panels A and C represent biological replicates of assays.
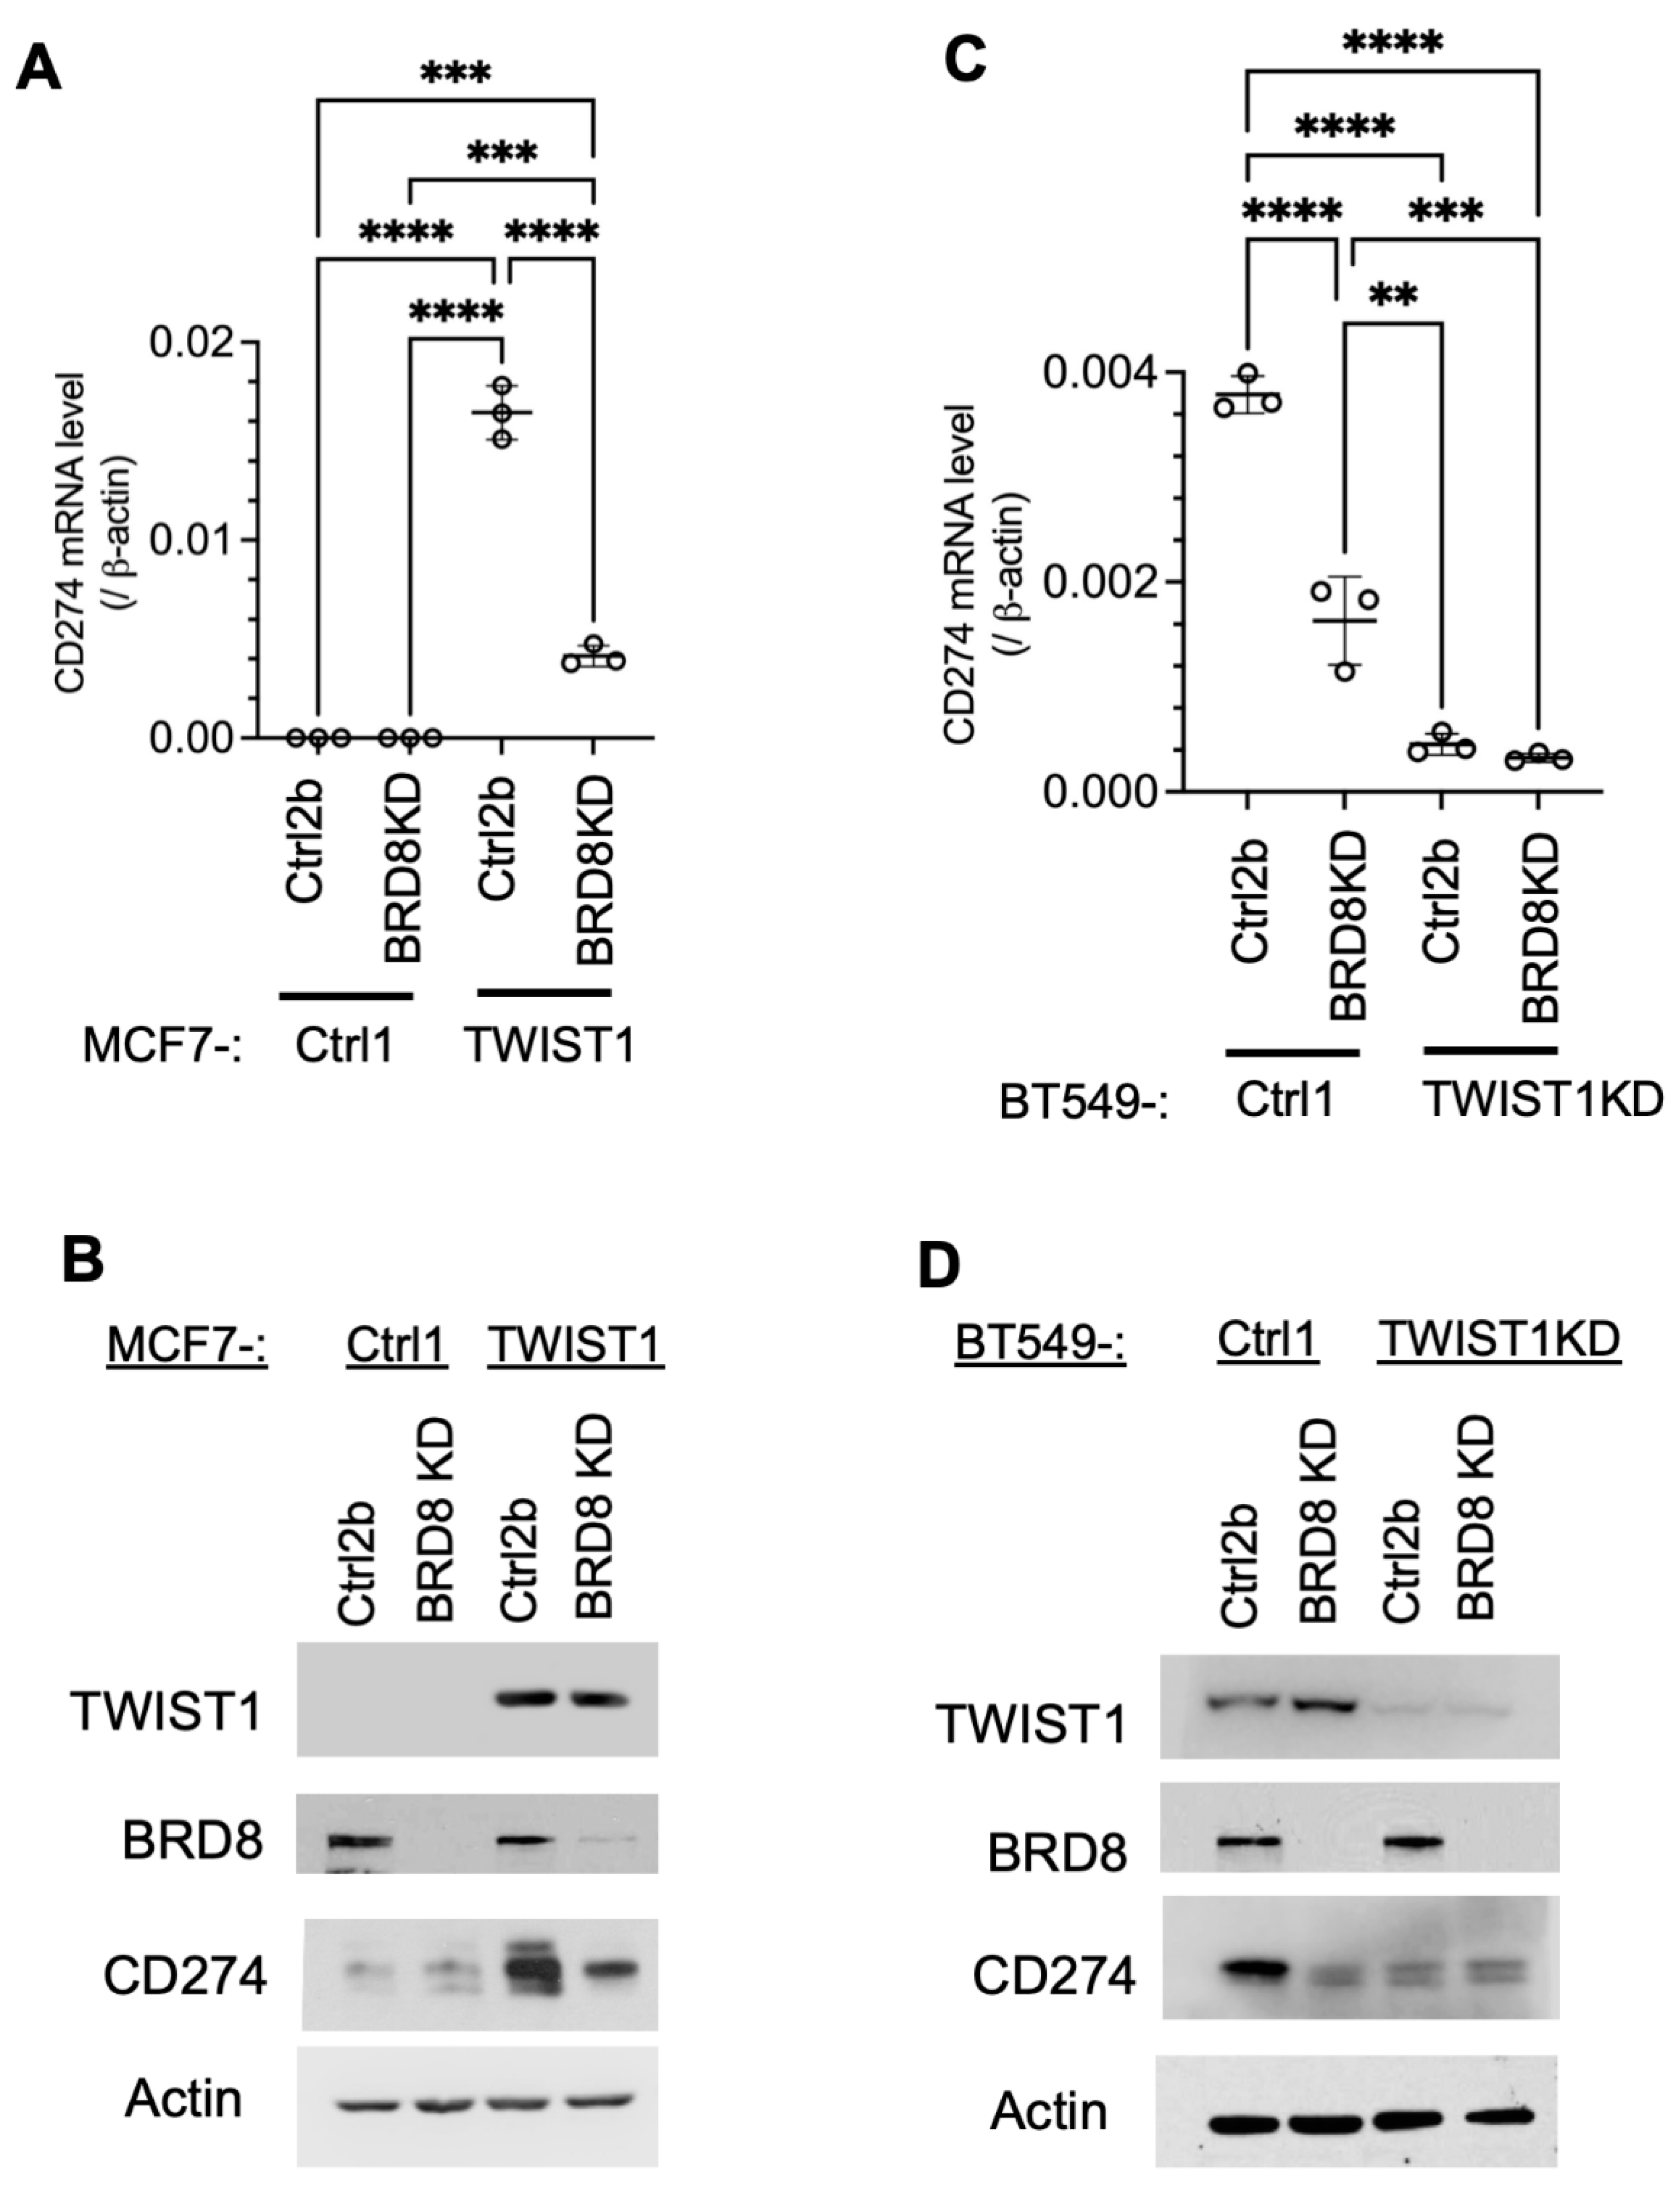
Figure 5.
Generation of stable OVA-expressing cell lines. The cell lines established previously were transduced with lentiviral particles that express only mCherry (labeled by Ctrl2o in the cell line names), or both mCherry and Ovalbumin (labeled by OVA in the cell line names). The stabilized mCherry-expressing cells were sorted out by flow cytometry, and expanded. Western blot was performed using an OVA-specific antibody. β-actin served as a loading control.
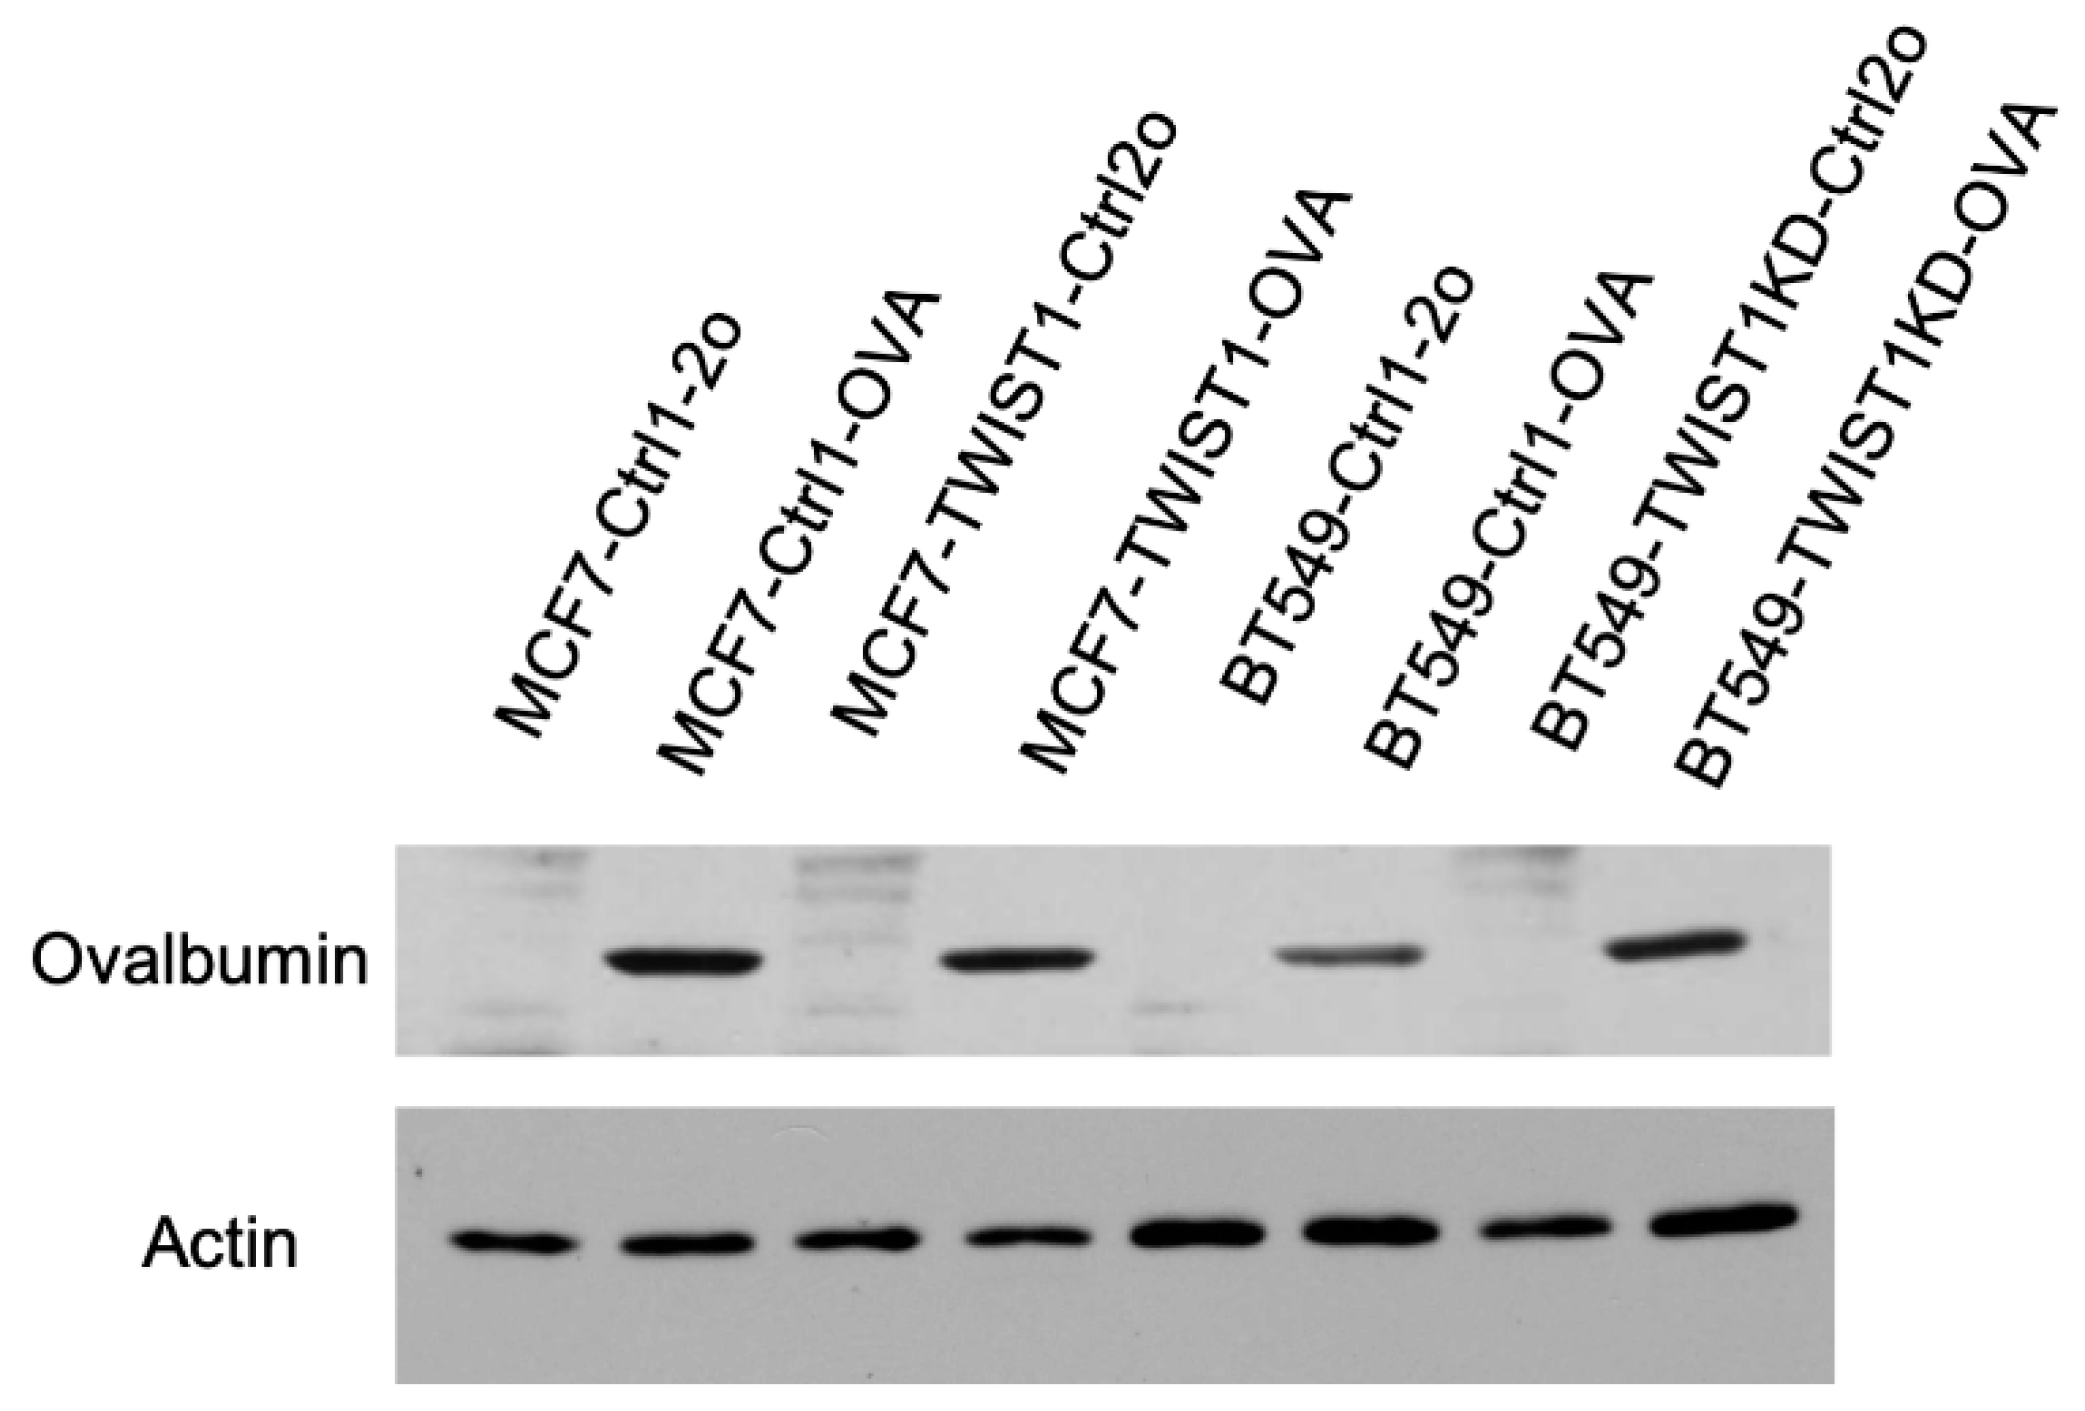
Figure 6.
TWIST1 promotes immune escape by inhibiting CD8+ T cells. A & B. The indicated breast cancer cells with or without OVA expression were cocultured with OT-1 CD8+ T cells at 1:4 ratio for 3 days. The viability of the adherent breast cancer cells in each coculture was measured by MTS assay. The relative percentage of cell growth inhibition for each OVA-expressing cell line was normalized by setting the relative percentage of cell growth inhibition for its matched control cell line at 0%. The P values were calculated by unpaired t test. ****, P < 0.0001. C & D. OT-1 CD8+ T cells were cocultured with the indicated breast cancer cell lines with or without OVA expression at the same ratio for the same time period as described in panels A & B. The percentages of CD279 (PD-1)-high OT-1 CD8+ T cells out of total OT-1 CD8+ T cells were measured by flow cytometry. The P-values were calculated by One-Way ANOVA. *, P < 0.05; **, P < 0.01; ***, P < 0.001; ****, P < 0.0001. E & F. OT-1 CD8+ T cells were cocultured with the indicated breast cancer cell lines with or without OVA expression at the same ratio for the same time period as described in panels A & B. PI staining was applied to the total unfixed OT-1 CD8+ T cells collected from the coculture to detect PI-permeable apoptotic cells. The percentages of PI staining-positive OT-1 CD8+ T cells out of total OT-1 CD8+ T cells were measured by flow cytometry. The p values were determined as described above. The data points in all panels represent biological replicates of assays.
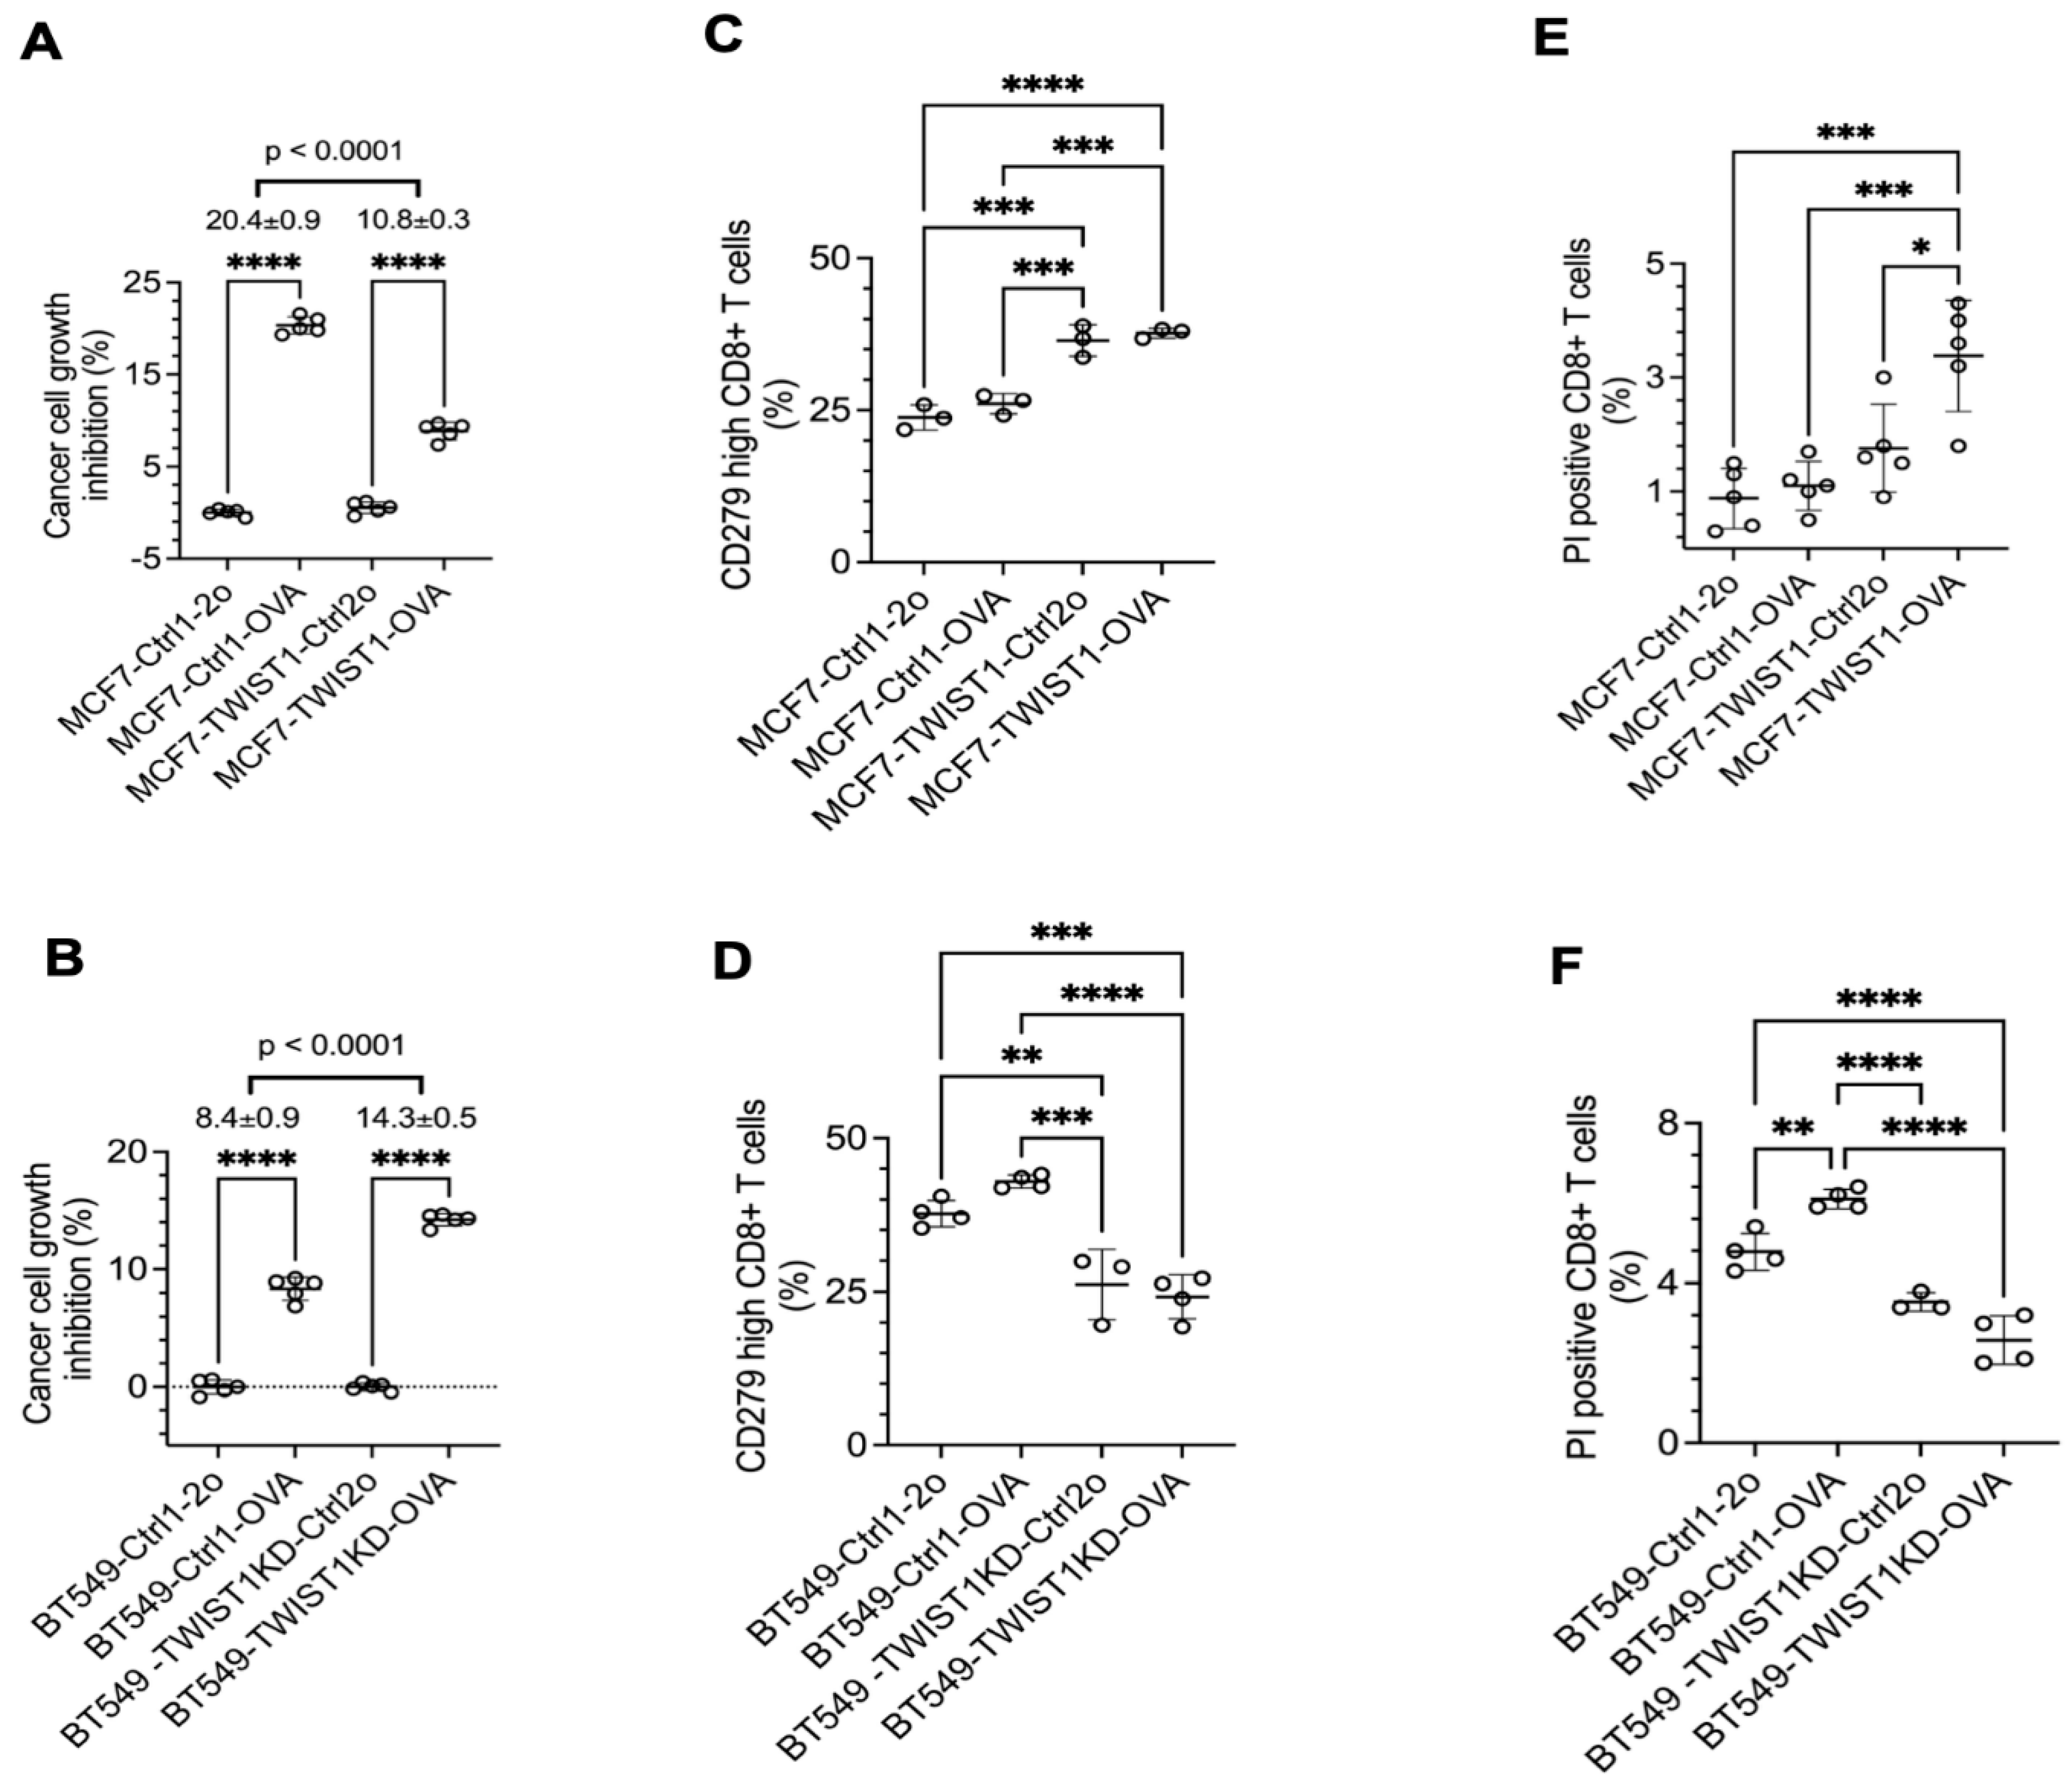
Figure 7.
Inhibition of CD274 with antibody strongly enhanced CD8+ T cells to kill breast cancer cells with TWIST1 expression. A & B. The indicated breast cancer cells with OVA expression were cocultured with OT-1 CD8+ T cells at 1:4 ratio, and treated with non-immune IgG or CD274 antibody for 3 days. The viability of the adherent breast cancer cells in each coculture was measured by MTS assay. The relative percentage of cell growth inhibition for each cell line treated with CD274 antibody was normalized by setting the relative percentage of cell growth inhibition for the same cell line treated with IgG at 0%. The P values were calculated by unpaired t test. ****, P < 0.0001. C & D. OT-1 CD8+ T cells were cocultured with the indicated breast cancer cell lines with OVA expression and treated with non-immune IgG or CD274 antibody as described in panels A & B. The percentages of CD279-high OT-1 CD8+ T cells out of total OT-1 CD8+ T cells were measured by flow cytometry. P-values were calculated by One-Way ANOVA. *, P < 0.05; **, P < 0.01; ***, P < 0.001. The data points in all panels represent biological replicates of assays.
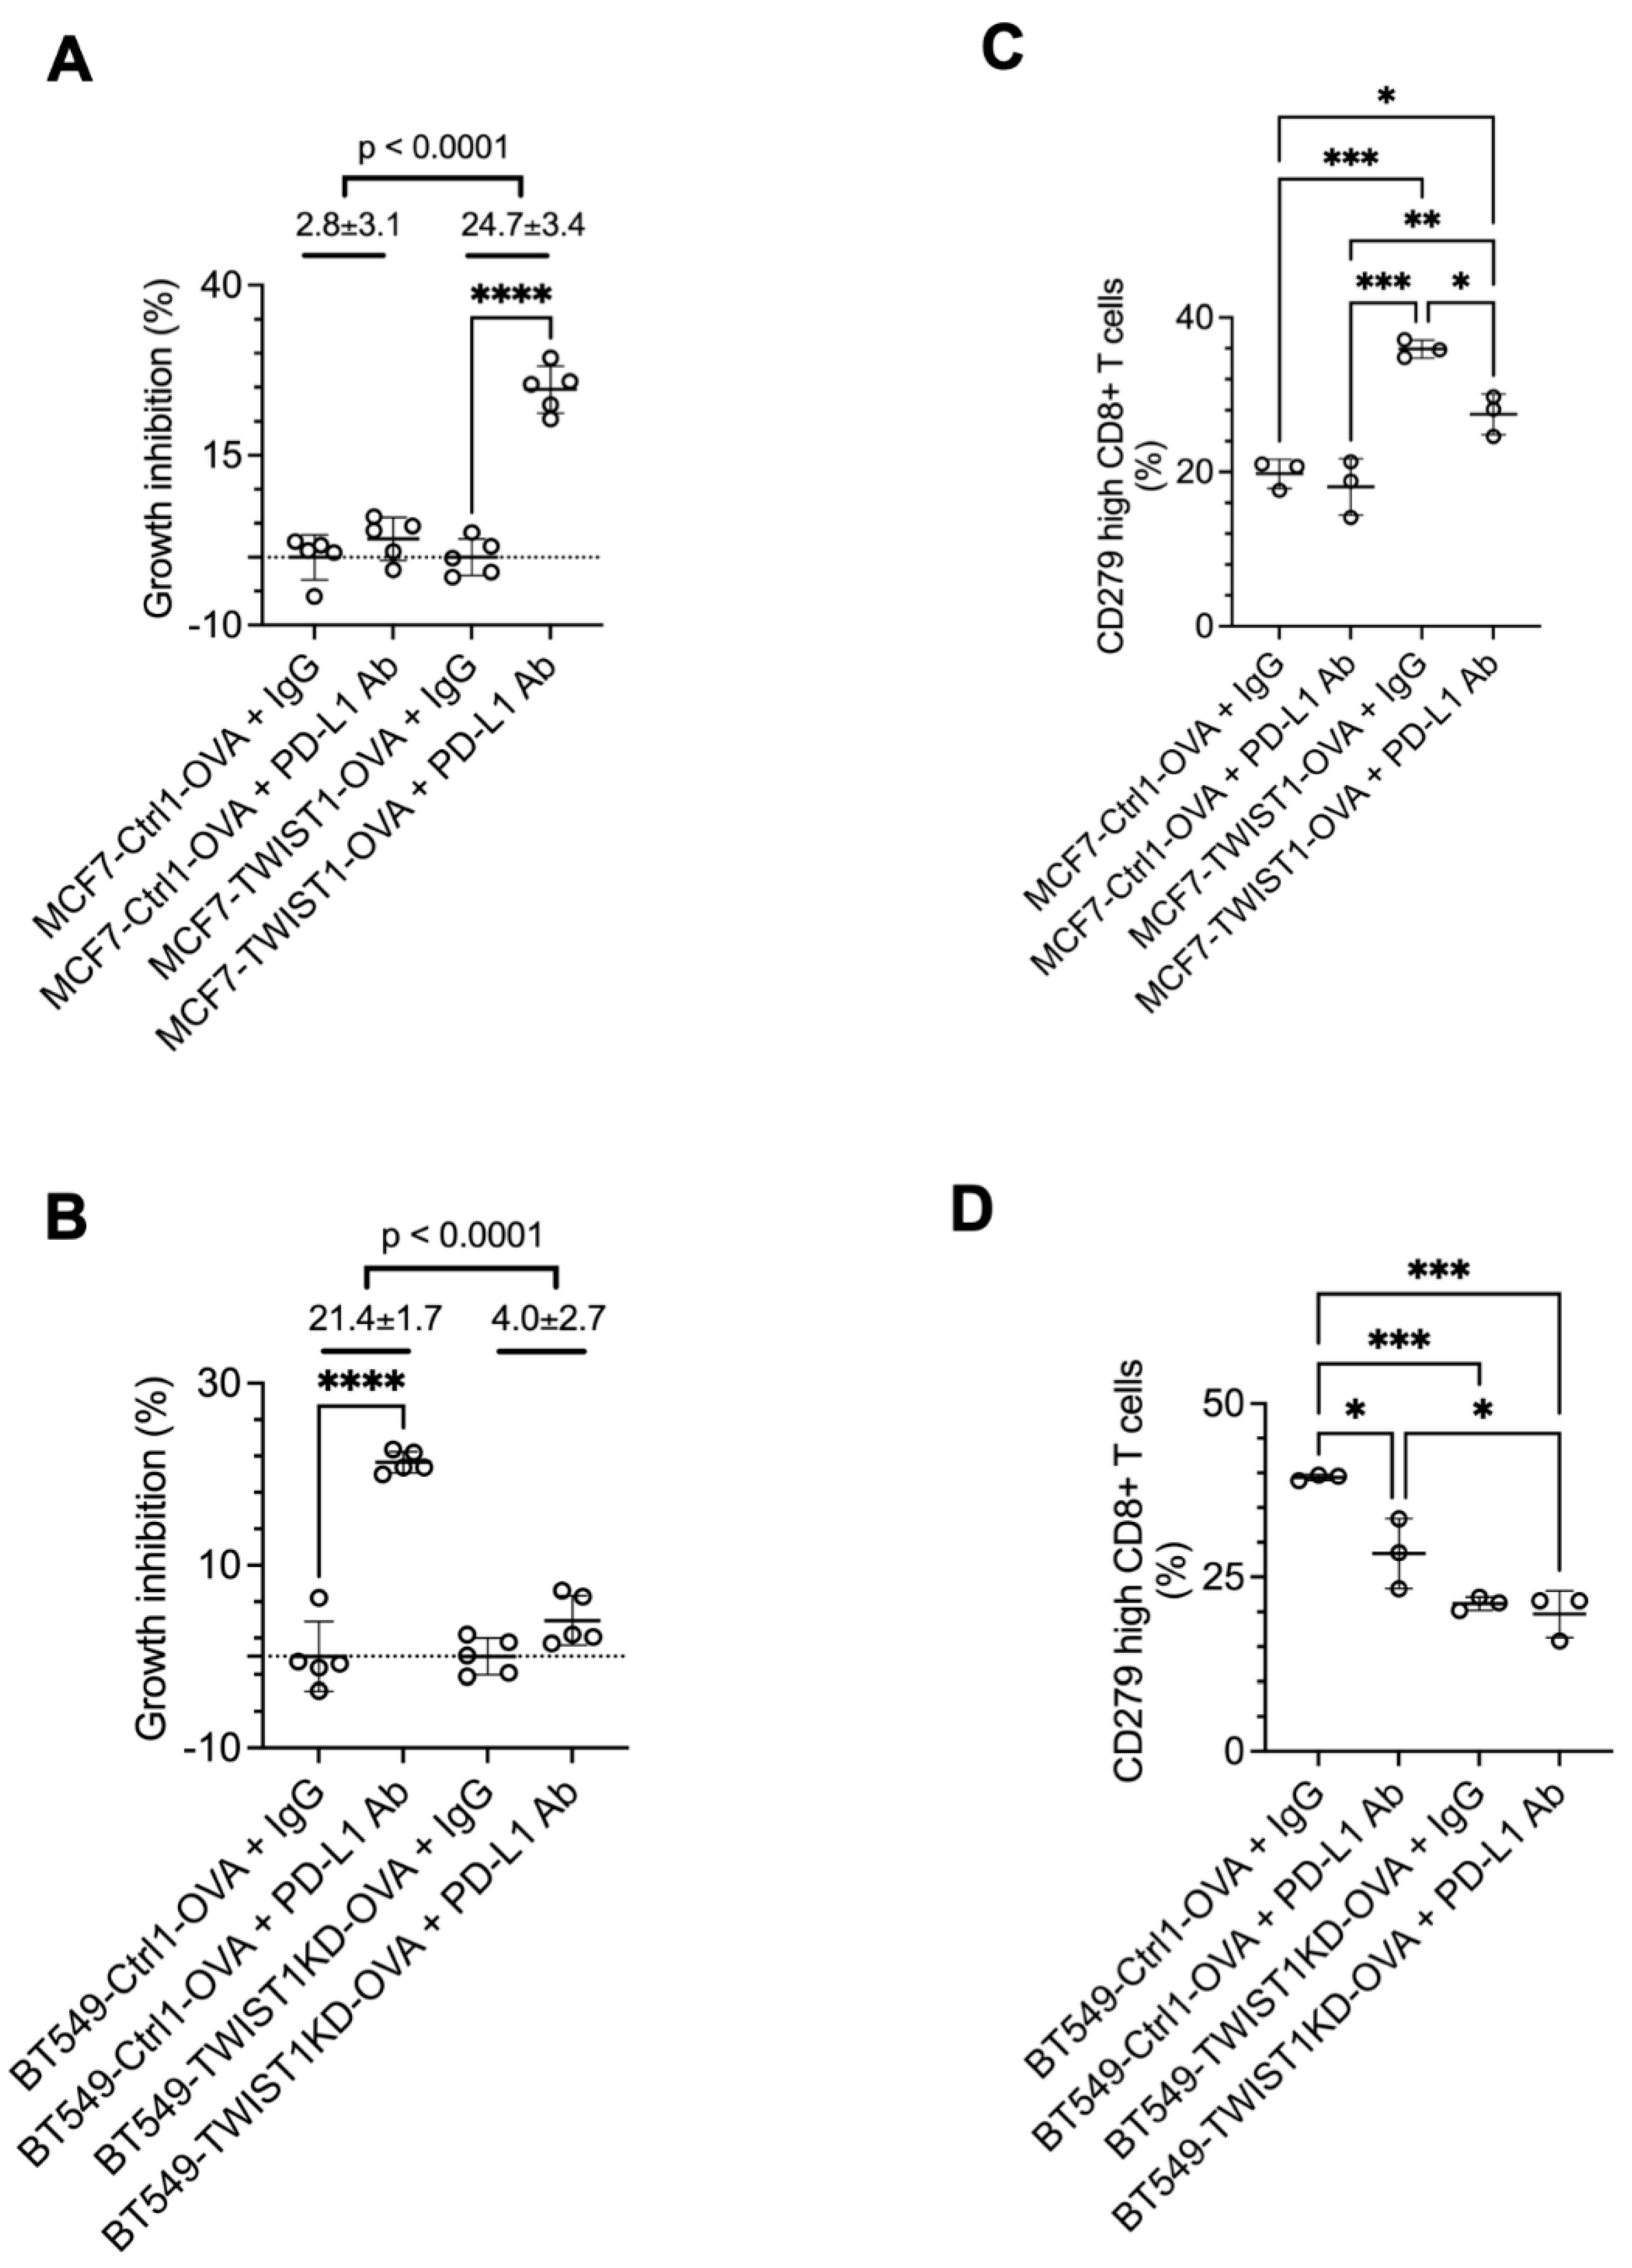

Table 1.
The nomenclature and relationships of cell lines derived from MCF7 and BT549 cells.
| 1st Generation | 2nd Generation | 3rd Generation | |
|---|---|---|---|
| Cell Lines | Selection Marker(s) | ||
| MCF7 | MCF7-Ctrl1 (G418) | MCF7-Ctrl1-2b | G418 & puromycin |
| MCF7-Ctrl1-BRD8KD | |||
| MCF7-Ctrl1-2o | G418 & mCherry | ||
| MCF7-Ctrl1-OVA | |||
| MCF7-TWIST1 (G418) | MCF7-TWIST1-Ctrl2b | G418 & puromycin | |
| MCF7-TWIST1-BRD8KD | |||
| MCF7-TWIST1-Ctrl2o | G418 & mCherry | ||
| MCF7-TWIST1-OVA | |||
| BT549 | BT549-Ctrl1 (puromycin) | BT549-Ctrl1-2b | puromycin |
| BT549-Ctrl1-BRD8KD | |||
| BT549-Ctrl1-2o | puromycin & mCherry | ||
| BT549-Ctrl1-OVA | |||
| BT549 TWIST1KD (puromycin) | BT549-TWIST1KD-Ctrl2b | puromycin | |
| BT549-TWIST1KD-BRD8KD | |||
| BT549-TWIST1KD-Ctrl2o | puromycin & mCherry | ||
| BT549-TWIST1KD-OVA | |||
Disclaimer/Publisher’s Note: The statements, opinions and data contained in all publications are solely those of the individual author(s) and contributor(s) and not of MDPI and/or the editor(s). MDPI and/or the editor(s) disclaim responsibility for any injury to people or property resulting from any ideas, methods, instructions or products referred to in the content. |
© 2024 by the authors. Licensee MDPI, Basel, Switzerland. This article is an open access article distributed under the terms and conditions of the Creative Commons Attribution (CC BY) license (http://creativecommons.org/licenses/by/4.0/).
Copyright: This open access article is published under a Creative Commons CC BY 4.0 license, which permit the free download, distribution, and reuse, provided that the author and preprint are cited in any reuse.


