Submitted:
15 April 2024
Posted:
16 April 2024
You are already at the latest version
Abstract
The skin is the largest organ in the human body and serves multiple functions such as barrier protection and thermoregulation. The maintenance of its integrity and healthy structure is of paramount importance. Accordingly, technological advances in cosmetic sciences have been directed towards optimizing these factors. Plant-derived ingredients have been explored for their bioactivity profiles and sustainable sources. Grape by-products carry a group of bioactive molecules that display important biological activities. Nonetheless, many of these molecules (e.g., phenolic compounds) are unstable and susceptible to degradation. So, its encapsulation using nano/microsystems (i.e. liposomes) has been explored as a promising solution. In this work, two grape seed extracts were obtained, one from a single grape variety (GSE-Ov), and another from a mix of five grape varieties (GSE-Sv). These extracts were analysed for their antioxidant and antimicrobial activities, as well as for their chemical composition and molecular structure. The extract that showed the most promising properties was the GSE-Ov with a DPPH IC50 of 0.079 mg.mL-1. This extract was encapsulated in soy lecithin liposomes coated with pectin, with an encapsulation efficiency of 88.8%. These showed an in vitro release of polyphenols of 59.4% during 24 h. The particles displayed a zeta potential of -20.3 mV, and an average diameter of 13.6 µm. Loaded liposomes proved to be safe under 5 and 2.5 mg.mL-1, in HaCaT and HDF cell models, respectively. Additionally, they demonstrated anti-inflammatory activity against IL-1α when tested at 2 mg.mL-1. This work enabled the valorization of a by-product from the wine industry, by using natural extracts in skincare products.
Keywords:
Grape by-products
; Phenolic compounds
; Liposomes
; Sustainability
; Skincare
Introduction
The skin is the largest organ of the human body with approximately 2 m2 (Gilaberte et al., 2016). It comprises functions such as protection against trauma, solar radiation, toxins, and infections; preservation of water and electrolytes; thermoregulation; storage of water, vitamin D, and fat (Gilaberte et al., 2016; Walters and Roberts, 2002). Over time, the skin is subjected to ageing, which is induced by both extrinsic/environmental factors (e.g., solar radiation, pollution) and intrinsic/chronological ones (e.g., cellular senescence, increased expression of skin-degrading enzymes), all leading to reduced structural integrity and loss of physiological function (Gu et al., 2020; Kammeyer and Luiten, 2015). Aside from ageing, the skin is also susceptible to a variety of disorders which have been mainly associated with inflammatory states and skin microbiota dysbiosis (Duarte et al., 2023). For example, diseases such as acne vulgaris, atopic dermatitis and psoriasis, which are characterized by inflammatory manifestations (e.g., papules, pustules, flares, peeling, etc), have been related to the imbalance of skin microorganisms mainly belonging to the Cutibacterium, Corynebacterium and Staphylococcus genera (Chang et al., 2018; Dréno et al., 2018; Lai and Gallo, 2008; Nakatsuji et al., 2017; Platsidaki and Dessinioti, 2018; Quan et al., 2019; Rozas et al., 2021).
In this regard, to preserve skin health, plant-derived ingredients have gained interest in the last few years. Grapes are one of the world’s biggest fruit crops, with approximately 80% of its production being destined for winemaking (Martin et al., 2020; Nunes et al., 2017). High levels of organic waste are produced during the winemaking process, being primarily composed of grape pomaces (62%), lees (14%), stalks (12%), and dewatered sludge (Salem et al., 2022), reaching approximately 14.5 million tons per year in Europe (Chouchouli et al., 2013). For instance, 25% of grape pomace are seeds (Hoss et al., 2021), which, as an agro-industrial by-product, may be responsible for environmental problems when improperly managed (Ferreira and Santos, 2022; Salem et al., 2022), due to the low pH and high concentration of phenolic compounds, which can resist biological degradation (Salem et al., 2022). Notwithstanding, it is possible to effectively valorise these wastes through the extraction of their bioactive compounds, especially the above-mentioned phenolic molecules (Ferreira and Santos, 2022; Salem et al., 2022). Phenolic compounds are secondary plant metabolites, and, in grapevine, they span from structural cell wall components, such as lignin and tannins, to specialized ones such as phenolic acids and flavonoids. Phenolic compounds are known to have several properties such as antioxidant, anti-inflammatory, antibacterial, anticarcinogenic, antidiabetic, and cardioprotective effects, exhibiting great potential for several sectors, particularly the cosmetic industry (Brezoiu et al., 2020; Carvalho et al., 2021; Goufo et al., 2020).
In recent years, the delivery of grape by-product-derived compounds in micro or nanocarriers has been pursued as an innovative and effective strategy to boost their stability, bioavailability, and biological activity at the target locations (Perra et al., 2022). In particular, micro-scaled encapsulation does not raise some concerns of nanostructures (e.g., bioaccumulation, penetration of cellular and subcellular structures, regulation (Castro et al. 2023; Joseph et al., 2023; Sahu, 2023)), and allows a better appearance and a smoother touch of the product, the encapsulation of high molecular weight compounds, greater stability over time or less ability to aggregate, and sometimes present more automated, simple and fast manufacturing processes (since size is not a restrictive criterion) (Ngwuluka et al., 2021). Among the several carriers designed for different activities (reviewed in Castro et al. (2023)), particularly tailored for skin delivery, liposomes have been the favoured option since they protect the encapsulated compounds, prevent their degradation, and can transport and release them more effectively on the targeted layers of the skin, due to their lipidic character. On their own, liposomes can also promote the repair of the skin's protective barrier (Perra et al., 2021; INdermal, 2022).
Thus, the main goal of this work was to obtain, develop and characterize a grape seed extract for potential skincare and cosmetic applications. In addition, we aimed to employ an encapsulation method that improves the extract stability, provides controlled delivery, and has high overall efficacy. Moreover, this research proposes a sustainable approach to a common by-product, therefore promoting a circular economy.
Materials and Methods
1. Biomass
The seeds were from red grapes grown in the Alto Douro region of Portugal and were provided by Symington Family Estates (Vila Nova de Gaia, Portugal), a table wine and Port wine company. In this study, two types of red grape seeds were used: (i) from one wine grape variety commonly used for table wine (GSE-Ov), and (ii) a mix from five selected grape varieties, commonly used for Port wine (GSE-Sv). The ethanol absolute anhydrous solvent was purchased from Carlo Erba Reagents S.A.S. (France). All the remaining reagents were analytical grade or higher, as discriminated below.
2. Preparation of Grape Seed Extracts (GSEs)
The GSE was obtained as described by Bucić-Kojić et al. (2013), with some modifications. Briefly, milled grape seed was subjected to a solid-liquid extraction process using a hydro-ethanolic solvent (1:1 (v.v-1)) at a 1:40 (w.v-1) ratio. The process was carried out in a shaking water bath (Shaking Bath UNITRONIC VAIVÉN, JP SELECTA, Barcelona, Spain), for 3 h, at 80 ºC. After extraction, the mixture was decanted for solid-liquid separation, and the ethanol of the supernatant was evaporated using a R-210 Rotavapor System (Rotary Evaporator BÜCHI R-210, Switzerland). Finally, the resultant supernatant was frozen at -80 ºC and then lyophilized (GAMMA 2–16 LSC plus, Christ, Germany). A schematic representation of the extraction process is shown in Figure 1.
3. Antioxidant activity
The antioxidant activity of both GSEs (GSE-Ov and GSE-Sv) was assessed using different methods: 2,2’-azinobis (3-ethylbenzothiazoline-6-sulfonic acid) (ABTS) assay, 2,2-diphenyl-1-picrylhydrazyl (DPPH) assay, and Folin-Ciocalteau method. For these, freeze-dried GSEs were weighed and solubilized in methanol.
3.1. ABTS Radical Cation Decolorization Assay
The ABTS assay was performed according to Gonçalves et al. (2009). The ABTS+ stock solution was prepared by mixing two aqueous solutions (ultrapure water), one of ABTS with a concentration of 7 mM, and the other of potassium persulfate (K2O8S2) with a concentration of 2.44 mM. The resulting solution was left stirring for approximately 16 h, covered with aluminium foil, and then stored at 4 ºC for a maximum of 1 month. The ABTS+ working solution was made by filtering the prior with a 0.45 µm syringe filter and diluting it with water until the absorbance at 734 nm was 0.70 ± 0.02. Also, a Trolox solution was prepared with a 1000 µM concentration and stored at -20 ºC. For this solution, Trolox was solubilized in methanol and the volume was completed with a PBS solution (75 mM NaH2PO4), pH 7.4. Briefly, for the assay procedure, in each well of a 96-well microplate, 20 µL of the sample (each dilution), Trolox, or solvent (methanol) for the control, were pipetted in triplicate, followed by 180 µL of ABTS+ working solution. After incubation for 6 min at 30 ºC, the absorbances were measured at 734 nm using a microplate reader (Microplate Reader Biotek Synergy H1, USA). The samples’ scavenging activity (SA) was determined using Equation (1), and the results were expressed as IC50 milligrams per gram of dry extract (mg.g-1 dry extract).
where, Abs CTL is the absorbance of the control and Abs SPL is the absorbance of the samples.
3.2. DPPH Radical Cation Decolorization Assay
The DPPH assay was performed according to Brand-Williams et al. (1995). First, a 100% methanolic DPPH stock solution was prepared with a 600 µM concentration and then stored protected from the light at -20 ºC. From the previous one, a DPPH working solution was prepared (by dilution with methanol) until its absorbance was 0.600 ± 0.100, at 515 nm. Also, a trolox solution was prepared in methanol with a 1000 µM concentration and stored at -20 ºC. Briefly, in each well of a 96-well microplate, 25 µL of sample (each dilution), trolox, or solvent (methanol) used as control, were pipetted in triplicate, followed by 175 µL of DPPH working solution. After incubation for 30 min at 25 ºC, the absorbance was measured at 515 nm using a microplate reader. The sample scavenging activity (SA) was also determined using Equation (1), and the results were expressed as IC50 milligrams per gram of dry extract (mg.g-1 dry extract).
3.3. Folin-Ciocalteau Colorimetric Method
The total phenolic content of GSE was determined by the Folin-Ciocalteau method with some modifications (Coscueta et al., 2018). First, a 7.4% (w.v-1) Na2CO3 solution was prepared in deionized water (dH2O). Also, a Folin-Ciocalteau working solution was prepared by diluting 2 mL of Folin-Ciocalteau reagent (Sigma Aldrich, St. Louis, Missouri, USA) in the final 10 mL with dH2O. This solution was prepared daily when needed. Furthermore, a gallic acid standard solution with a concentration of 1 mg.mL-1 was prepared in methanol and stored at -20 ºC. Briefly, for the procedure, in each well of a 96-well microplate, 30 μL of sample (each dilution), gallic acid, or solvent (methanol) for blank were pipetted in triplicate, followed by 100 μL of Folin-Ciocalteau working solution, and 100 μL of 7.4% Na2CO3, in this order. After incubation for 30 min at 25 ºC, the absorbance was measured at 765 nm using a microplate reader. The samples' total phenolics content was determined by interpolation with a gallic acid calibration curve (0.025 – 0.200 mg.mL-1) and expressed as milligrams of gallic acid equivalent per gram of dry extract (mg GAE.g-1 dry extract).
4. Antimicrobial Activity
For the evaluation of the GSE-Ov and GSE-Sv antimicrobial activity, several microbial-relevant strains usually present in skin microbiota were used: S. epidermidis, methicillin-susceptible S. aureus (MSSA), methicillin-resistant S. aureus (MRSA), and C. acnes (obtained from the collection culture of CBQF, Universidade Católica Portuguesa). The method was performed as described by Pinela et al. (2022), with modifications. Colonies of the microbial strains were transferred and cultured overnight in Mueller Hinton (MH) agar (Biokar, Allonne, France) plates at 37 ºC for 24 h. C. acnes was grown in Tryptic Soy (TS) agar (Biokar) supplemented with 5% sheep blood (Thermo Fisher Scientific, Waltham, Massachusetts, USA), with an anaerobic atmosphere controlled at 37 ºC for 48 h. After incubation, the inoculum suspensions were adjusted to a turbidity of 0.5 McFarland (equal to 1.5×10⁸ colony-forming units (CFU) mL-1)) in sterile saline solution. For antimicrobial activity, 100 µL GSEs (100 mg.mL-1) were mixed with 100 µL media and serially diluted in the same media. After, 100 μL of inoculant was added to each GSE dilution and incubated for ca. 24 h at 37 ºC. After incubation, all samples were plated using the drop technique (Miles and Misra, 1938) in MH agar or TS agar supplemented with blood and then incubated for ca. 24 h or 48 h at 37 ºC, for MBC (minimum bactericidal concentration) determination. Culture media with and without inoculum were used as controls.
5. Fourier-Transform Infrared (FTIR) Analysis
A FTIR analysis of the GSEs was carried out using a Spectrum 100 FTIR spectrometer with a horizontal attenuated total reflectance samples accessory (PIKE Technologies, Fitchburg, Wisconsin, USA), and a diamond/ZnSe crystal. The Horizon MBTM FTIR software was used. All spectra were collected with 16 scans and a 4 cm-1 resolution, in the 4500 – 500 cm-1 wavenumber interval. In addition, baseline, point adjustment, and spectra normalization were performed. All samples were analysed in triplicate.
6. GSEs Composition Analysis by High-Performance Liquid Chromatography (HPLC)
The GSEs were precisely weighed, dissolved in hydro-ethanolic solvent (1:1) at a final concentration of 10 mg.mL-1, and then filtered into vials using 0.45 μm syringe filters. For the extracts’ composition analysis, samples were analysed on a Waters Alliance e2695 Separate Module HPLC coupled to a C18 Phenomenex column (250 x 4.6 mm x 5 μm, Kromasil) and a Diode Array Detector (DAD), according to Ribeiro et al. (2021). Detection was achieved at wavelengths 280 (derivates of hydroxybenzoic acids), 320 (derivatives of hydroxycinnamic acids), 360 (flavonols), and 528 nm (anthocyanins). The mobile phase was composed of (A) acetonitrile/water (5:95 v.v-1) 0.1% Trifluoroacetic acid (TFA), and (B) acetonitrile 0.1% TFA. The flow rate was set at 1.0 mL.min-1, and the injection volume was 20 μL. Data acquisition and analysis were accomplished with Software Empower 3. The identification was performed by comparing the retention time and absorbance spectra with pure standards.
7. GSE-Ov Encapsulation with Liposomes
Liposomes were prepared by the lipid film hydration method, as described by Machado et al. (2014). Briefly, lecithin (Alfa Aesar, Haverhill, Massachusetts, USA) was solubilized in absolute ethanol at a 1:20 (w/v) ratio, and the mixture was stirred for 1 min. Then, an R-210 Rotavapor System (Rotary Evaporator BÜCHI R-210, Switzerland) was used to evaporate the ethanol until a lipid film was observed in the flask walls. Then, 0.2 g of GSE-Ov and 20 mL of dH2O (for loaded liposomes), or just 20 mL of dH2O (for empty liposomes) were added to the flask, and the mixture was left in a shaking water bath at 60 ºC for 90 min. Finally, 1% (w.v-1) pectin aqueous solution was mixed with the liposomal mixture in a 1:1 (v.v-1) ratio, to enhance liposome stability (adjust the electrical charge). A schematic representation of the encapsulation process is shown in Figure 2.
7.1. Liposomes Characterization
7.1.1. Zeta Potential
For liposomes characterization, measurements of zeta potential were performed at room temperature (25 ºC) in a folded capillary cell using a Zetasizer Nano ZS (Malvern Instruments Ltd., Malvern, UK) with a He-Ne laser wavelength of 633 nm and a detection angle of 173º. The analysis was performed in triplicate, and the results were expressed as average ± standard deviation (mV).
7.1.2. Particle Size Distribution
For particle size distribution assessment, it was used a Malvern Mastersizer 3000 - Laser Diffraction (Malvern Instruments Ltd.) with a refractive index of 1.457 and absorption index of 0.01 parameters selected. dH2O was used as a dispersant. According to the laser diffraction through the particles of material, a scattering pattern was generated and used to calculate the particle size via Mie theory. The sample was analysed six times, and the presented data was the mean of all measurements.
7.1.3. Morphology
Liposome morphology was assessed using a Pro Scanning Electron Microscope (Thermo Scientific™, MA, USA). Before the procedure, the liposome samples (empty liposomes) were freeze-dried and were analysed in splinters and powder forms. For sample preparation, they were placed onto metal plates and coated with a thin gold layer using a Sputter Coater (Polaron, Bad Schwalbach, Germany) under vacuum. SEM was used with the magnifications of 500, 1000, 2000, and 4000 x, and with an electron beam of 10 kV. The images presented are representative of the morphology of the sample.
7.1.4. FTIR Analysis
A FTIR analysis of encapsulated GSE-Ov and encapsulant was carried out as previously described in section 5.
7.1.5. Encapsulation Efficiency
The liposomes encapsulation efficiency (EE) was assessed by an indirect method, as follows. After GSE encapsulation by the liposomes, the supernatant was recovered and analysed by the Folin-Ciocalteau method for total phenolics content determination, as described in section 3.3. The EE was calculated by the difference between the total phenolic content of the extract and the total phenolic content of the supernatant after encapsulation, according to Equation (2).
where, TPC GSE is the total phenolic content of the GSE, and TPC SN is the total phenolic content of the supernatant after encapsulation. This analysis was performed in triplicate.
7.1.6. In Vitro Phenolic Compounds Release Assay
The release profile of phenolic compounds by the liposomes was assessed as follows. After GSE encapsulation by the liposomes, the mixture was centrifuged (5 000 rpm, 9 min; Hettich Zentrifugen, Tuttlingen, Germany), and a sample was retrieved for initial total phenolics content determination (0 h). After, the supernatant was removed and replaced with 5 mL PBS at pH 5.4, to mimic the skin physiological conditions. Then, 500 µL samples were taken at the following times: 1, 2, 4, 6 and 24 h. Immediately after collecting the samples, the retrieved volume was replaced with PBS for volume maintenance. Finally, all samples were centrifuged (13 220 rpm, 5 min; Andreas Hettich GmbH & Co. KG, Tuttlingen, Germany) and analysed using the Folin-Ciocalteau method as previously described in section 3.3. During the experiment, the mixture was kept under stirring at 100 rpm and 37 ºC, and the analysis was performed in triplicate.
8. Cell Culture
Immortalized human keratinocytes (HaCaT) and human dermal fibroblast (HDF) were obtained from ATCC. The cells were cultured at 37 ºC in a humidified atmosphere of 95% air and 5% CO2, as monolayers using Dulbecco’s Modified Eagle Medium (DMEM, Gibco, Thermo Fisher Scientific), supplemented with 10% (v.v-1) fetal bovine serum (FBS, Gibco, Thermo Fisher Scientific) and 1% (v.v-1) antibiotic/antimycotic. HaCaT were used between passages 52 and 56, and HDF between passages 4 and 6.
9. Cytotoxicity
Cytotoxicity of GSE-Ov, encapsulated GSE-Ov and encapsulant was assessed through the PrestoBlueTM Cell Viability test (Thermo Fisher Scientific), as specified by the manufacturer. HaCaT and HDF cells were seeded at 1.0 x 10⁵ cells.mL-1 in 96 well microplates and were left to adhere in incubation overnight. After, the cells were exposed to GSE-Ov or encapsulated GSE-Ov in serial dilutions starting at 10 mg.mL-1, or encapsulant at 10 mg.mL-1 for 24 h, at 37 ºC with 5% CO2 in a humidified environment, using DMEM. Concisely, 90 µL of the sample, culture medium for positive control or 10% dimethyl sulfoxide (DMSO, Sigma Aldrich) for negative control, were added to each well. In two separate studies, each sample was evaluated in quadruplicate.
After incubation, 10 µL of PrestoBlueTM Cell Viability Reagent was added to each well of the plate and left to incubate, protected from the light, for approximately 2 h in a humidified atmosphere at 37 ºC and 5% CO2. Lastly, the fluorescence was measured using a microplate reader. The results are presented in percentage of metabolic inhibition in comparison to the positive control, according to the ISO 10993-5 standard, where an inhibition of more than 30% is deemed cytotoxic.
10. Quantification of Pro-Inflammatory Cytokines
HaCaT cells were seeded at 2.5 x 10⁵ cells.mL-1 in 12 well (1 mL per well) microplates for 24 h. After, the cells were exposed to GSE-Ov, encapsulated GSE-Ov, or encapsulant in the following concentrations: 0.1 and 0.025 mg.mL-1, 2 and 0.5 mg.mL-1 and 10 mg.mL-1, respectively. The microplate was left to incubate for 24 h in the conditions mentioned above. Briefly, the culture medium was used as a control, and SRM 1648 Urban Particulate Matter obtained from the NIST (Gaithersburg, Maryland, USA) was used as an inflammatory stimulus. Each sample was evaluated in duplicate, in two independent studies.
After 24 h, the supernatants of each well were collected to quantify the level of proinflammatory cytokines IL-1α IL-6 using the respective ELISA MAX™ Deluxe Set Human kit (BioLegend, San Diego, California, USA), according to the manufacturer's instructions.
After, the cell total protein was quantified using the PierceTM BCA Protein Assay Kit (Thermo Fisher Scientific), as recommended by the manufacturer. Finally, the absorbance was measured at the wavelengths of 450 and 570 nm for IL-1α and 562 nm for IL-6 using a microplate reader (Microplate Reader Biotek Synergy H1, USA). The final results were presented in pg of cytokine.mg-1 of total protein.
11. Human Pro-Collagen I α1 Quantification
HDF cells were seeded at 3 x 10⁵ cells.mL-1 in 12 well (1 mL per well) microplates for 24 h. After that, the cells were exposed to GSE-Ov, encapsulated GSE-Ov, or encapsulant in the following concentrations 0.1 and 0.025 mg.mL-1, 2 and 0.5 mg.mL-1, and 10 mg.mL-1, respectively. Culture medium was used as a control. In two separate studies, each sample was evaluated in duplicate. Total protein was quantified as previously indicated.
The quantification of collagen I α1 was performed using the Human Pro-Collagen 1 alpha 1 CatchPoint® SimpleStep ELISA® Kit (ABCAM, ab229389), as recommended by the manufacturer. The total protein used was 100 ng. The fluorescence was measured at Ex/Cutoff/Em 530/570/590 nm using a microplate reader. The final results were expressed in pg of collagen.μg-1of total protein.
12. Statistical Analysis
The IBM® SPSS® Statistics 26 program was utilized for statistical analysis. The data was first checked for normality (Shapiro-Wilk test, n < 50, or Kolmogorov-Smirnov test, n > 50). To assess differences between more than two groups, a one-way ANOVA test (normal distribution) with Tukey's HSD post hoc test or a Kruskal-Wallis test (non-normal distribution) was used. A student's t-test (normal distribution) or a Mann-Whitney test (non-normal distribution) was used to compare two groups. The significance level was set at 0.05.
Results and Discussion
1. Initial Screening of GSEs Potential and Characterization
1.1. Antioxidant Activity
The antioxidant activity of both GSEs was evaluated using ABTS and DPPH assays, and the results are presented in Table 1. For both methods, the GSE-Ov presented higher antioxidant activity (i.e., lower IC50 – half-maximal inhibitory concentration). For this extract, the obtained values were 0.138 and 0.079 mg.mL-1 for ABTS and DPPH, respectively, whereas for GSE-Sv the obtained values were 0.163 and 0.088 mg.mL-1, respectively. Grape species, individual cultivars, cultivation conditions, maturation stage and seasonal fluctuations, according to Mandić et al. (2009), may impact phenolic biosynthesis and antioxidant capacity of grape seeds, which can be a possible explanation for the obtained differences between GSEs. GSE-Ov presented a higher total phenolics content (258.96 30.94 mg GA eq.g-1 dry extract) than the GSE-Sv (203.72 42.64 mg GA eq.g-1 dry extract), which is in accordance with the antioxidant activity results. Comparing both methods, the DPPH assay allowed us to obtain higher antioxidant activity for both GSEs. This is due to the nature of the assays themselves, once the samples were prepared in methanol and therefore only in a methanol-like solvent (like the one used for DPPH) they can present proper antioxidant activity (Duarte et al., 2023; Tournour, 2016).
Comparing the obtained results with the antioxidant activity of two benchmarks, ascorbic acid and butylated hydroxytoluene (BHT), which present IC50 values within 0.04 – 0.28 mg.mL-1 range (Duarte et al., 2023), we can conclude that grape seeds are, indeed, a relevant source of antioxidant compounds. Impressively, the GSEs, which are a complex mixture of different compounds, were able to present similar antioxidant capacity to the tested benchmarks, which are pure compounds. Previous studies have reported the potential of natural plant-derived compounds, including grapes, as antioxidant agents for cosmetic/skincare applications (Hoang et al., 2021; Michalak, 2022).

Table 1.
Total phenolics content and antioxidant activity values (mean SD) determined by Folin-Ciocalteau, ABTS and DPPH assays for both GSEs and the two antioxidant benchmarks (ascorbic acid and butylated hydroxytoluene (BHT)).
Table 1.
Total phenolics content and antioxidant activity values (mean SD) determined by Folin-Ciocalteau, ABTS and DPPH assays for both GSEs and the two antioxidant benchmarks (ascorbic acid and butylated hydroxytoluene (BHT)).
| Analysis | GSE-Ov | GSE-Sv | Ascorbic acid | BHT |
|---|---|---|---|---|
| Total phenolics (mg GA eq.g-1 dry extract) | 30.94 a | 42.64 | --- | --- |
| ABTS IC50 (mg.mL-1) | 0.034 a | 0.015 | 0.05 * | 0.13 * |
| DPPH IC50 (mg.mL-1) | 0.003 a, b | 0.004 b | 0.04 * | 0.28 * |
| a significantly different from GSE-Sv (p < 0.05) within a given row; b significantly different from ABTS (p < 0.05) within a given column; * values retrieved from Duarte et al. (2023) | ||||
1.2. Antimicrobial Activity
Both GSEs were also tested for their antimicrobial potential against skin microbiota commensal bacteria, such as S. epidermidis, methicillin-sensitive S. aureus (MSSA), methicillin-resistant S. aureus (MRSA), and C. acnes. The extracts were tested at the following concentrations: 50, 25, 12.5, 6.25, 3.13, and 1.56 mg.mL-1 for MBC determination. Minimum inhibitory concentrations (MICs) could not be evaluated since the extracts precipitated, making it impossible to assess the turbidity of the medium caused by microbial growth. Therefore, only the MBC results were evaluated and are presented in Table 2. From the tested microorganisms, only C. acnes was not inhibited by any of the extracts at the tested concentrations. Moreover, S. epidermidis, commonly found on human skin, was only inhibited by the highest tested concentration, for both GSEs. However, this concentration is quite high and, therefore, it is not considered for product incorporation. The non-inhibition of these bacteria can be seen as a positive outcome since, in balance, these bacteria are important for skin homeostasis maintenance, host defence, and innate immune response (Fournière et al., 2020). Furthermore, S. epidermidis is capable of inhibiting the adhesion of virulent S. aureus strains (Christensen and Brüggemann, 2014; Fournière et al., 2020). This is relevant since, as discussed before, S. aureus has been associated with exacerbating skin diseases, such as atopic dermatitis. Having that said, the obtained results for S. aureus inhibition are promising and may lead the way towards the treatment and/or prevention of skin conditions. Comparing both extracts, the results were similar, except for MSSA, where GSE-Ov showed higher antimicrobial capacity.
1.3. Individual Phenolic Compounds Identification by HPLC
As discussed earlier, phenolic compounds are secondary plant metabolites (e.g., derived from grapevine) which exhibit several biological properties of relevance, such as antimicrobial, antioxidant and anti-inflammatory activities, therefore, showing great potential for cosmetic applications. In this line, both GSEs were analysed by HPLC for individual polyphenol identification. In total, four different compounds were identified from the chromatograms (Figure 3):
gallic acid, catechin, procyanidin B1, and procyanidin B2. The latter was only found in GSE-Sv, as reported in Table 3. All the identified phenolic compounds are normally found in grape seed extracts (e.g., Pinot Noir, Cabernet Sauvignon, Marselan, Tamyanka) (Krasteva et al., 2023). Regarding the first three compounds, all were found in higher quantities in GSE-Ov, as revealed by the peak areas (Table 3). Apart from the procyanidin B2 case, these findings are consistent with the results of antioxidant activity, where GSE-Ov showed higher total phenolics content and radical scavenging activity. The comparison of area values is warranted since both extracts were analysed at the same concentration. Besides their known antioxidant potential, these compounds are also reported to be beneficial for skincare applications. For example, gallic acid has been suggested as a candidate for the prevention of UVB-induced premature skin ageing, by decreasing skin dryness, thickness, and wrinkle formation. Also, IL-6 production was suppressed (anti-inflammation) and type-I procollagen was stimulated (Hwang et al., 2014). Another study showed that gallic acid inhibited melanin production by down-regulation of tyrosinase activity, capable of acting as a skin-whitening agent (Kumar et al., 2013). Furthermore, (+)-catechin has been found to inhibit the inflammatory mediator prostaglandin E2, tumour necrosis factor-alpha (TNF-α), and proinflammatory cytokines IL-1β and IL-6 (Monga et al., 2014). Regarding procyanidins, anti-inflammatory activity of procyanidin B2 has also been reported, through the inhibition of NF-kB, IL-6 and pro-IL-1 β (Martinez-Micaelo et al., 2014). Lastly, both procyanidins (B1 and B2) have shown moderate inhibitory effects over collagenase and elastase activities, although in a dose-dependent manner (Wittenauer et al., 2015). By analysing the chromatogram, the biological activities described above are corroborated, and it can be concluded that there is a more pronounced profile of GSE-Ov phenolic compounds and, therefore, potentially greater biological activity.
1.4. Fourier Transform Infrared Analysis
Under Fourier Transform Infrared (FTIR) spectroscopy, each substance has a unique spectrum fingerprint that differentiates it from other compounds (Fadlelmoula et al., 2022). The results of the FTIR analysis of the GSEs are presented in Figure 4.
We can observe that both GSEs have identical spectra, and, therefore, share the main functional groups. It was possible to distinguish several peaks/bands which represent functional groups and modes of vibration, and also the components to which they are related. The broad band peaking at approximately 3250 cm-1 represents a stretching O-H bond, which may be due to the presence of phenolic compounds (rich in hydroxyl groups), polysaccharides and lignins. The zone between around 2800 and 3000 cm-1, which seems to be composed of two unresolved peaks, corresponds to asymmetric and symmetric stretching bonds of CH2 groups, derived from lignins and lipids. The peak around 1600 cm-1 is relative to COO- groups and aromatic C=C bonds, found in pectins and phenolics. The two peaks around 1500 cm-1 correspond to aromatic stretching C-C bonds from phenolic compounds. The peak around 1150 cm-1 is due to the aromatic stretching of C-H bonds from phenolics, and around 1000 cm-1 there is a peak relative to the stretching of C-O and C-C bonds from polysaccharides and pectins. This spectra analysis is in accordance with Günter and Popeyko (2022), Nogales-Bueno et al. (2017), and Lucarini et al. (2019), and supports that the extraction process was efficient.
2. GSE-Ov Encapsulation- Liposomes
Advanced delivery systems, at the nano and/or micro scales, offer several advantages for the administration of specific compounds. These personalized systems protect the encapsulated compounds, preventing their degradation, and can transport and release them more effectively on the targeted tissues. Herein, liposomes are the chosen system due to their lipid character and the perfect interaction with the skin and its ceramides, which are one of the main groups of lipids of the skin and play a vital role in its barrier function (Vovesná et al., 2021). For these reasons, we aimed to develop a liposome system capable of efficiently entrapping and delivering the GSE-Ov, the extract that demonstrated the best phenolic compound profile and biological properties, to the skin.
2.1. Optimization of the Encapsulation Process
To optimize the liposome preparation, several tests were carried out considering the Zeta potential (ζ) and Polydispersity Index (PDI) as fundamental parameters for the development of the system (Table 4). Concerning these two measurements, ζ is better the higher its absolute value, which represents a greater charge, and therefore a greater repulsion between the particles and consequent stability over time. A lower PDI value represents greater liposome size homogeneity. The lower the PDI, the lower the index of particle subpopulations (Mudalige et al., 2019; Samimi et al., 2019). For this purpose, two different liposome production methods were tested: (I) Lipid Film Hydration (LFH) and (II) Reverse Phase Evaporation (RPE). LFH allowed better ζ and PDI results and, therefore, was the method chosen to carry out the investigation. This method (LFH) is often preferred in laboratory settings as it is simple and does not require specialized equipment (Machado et al., 2014).
Once chosen the method, condition III consisted of adding the extract to the liposomes, which resulted in a relatively unstable and prone to agglomerate formation mixture (decreased ζ value). To solve this issue, for condition IV chitosan was added as a liposome coat (Kumar et al., 2020; Lee et al., 2019), leading to the intended increase of ζ value from -5.1 to -9.3 mV, although not that significant. However, the PDI value increased from 0.405 to 1.000, which was not intended. Moreover, chitosan precipitated which was also not desired. So, for condition V, chitosan was replaced by pectin (Kumar et al., 2020) and, indeed, the ζ improved significantly to -20.3 mV and the uniformity index (similar to PDI) was 0.637. Pectin was the biopolymer chosen, as it is found in grape pomace (Spinei and Oroian, 2023), and in future studies, the pectin itself can be extracted and used from the same pomace. No sonication step was needed because the measurement equipment already provided ultrasounds of its own. In this line, the final formulation consisted of the LFH method for GSE-Ov-loaded liposomes coated with pectin.
2.2. Characterization of the Selected Liposome Preparation
2.2.1. Zeta Potential, Size Distribution and Morphology
After the optimization of the production process, some physical tests were carried out on the selected liposomes. The first evaluated feature was zeta potential (ζ), and the obtained value was -20.3 mV. This suggests that the developed system is stable, with no tendency to agglomerate over time, since its charge is close to the reported in the literature (ζ ~ ± 30 mV) as ideal for long-term stability (Németh et al., 2022). The negative electrical surface charge is due to the presence of lecithin (Assis et al., 2014; Machado et al., 2019), and pectin was used to increase stability.
Another assessed characteristic was the size distribution. This variable is relevant since it directly impacts the cellular uptake, transportation, and accumulation behaviour of the liposomes (Choi et al., 2023). The results presented in Figure 5 indicated that the liposomes had a mean diameter of 13.6 µm, which meats the micro-scale range, as desired. This average size is appropriate for topical applications, such as in skin (INdermal, 2022). Liposomes in the micro-scale have some advantages, such as higher encapsulation efficiency with higher liposome size (Nsairat et al., 2022), namely relative to large biomolecules, and the fact that they allow avoiding nano-bioaccumulation issues and related legislation restrictions (labelling, etc.) (Castro et al., 2023). Furthermore, a uniformity size measure (similar to PDI) of 0.637 was obtained, which indicates some size heterogeneity, yet acceptable (Mudalige et al., 2019). Since PDI is close to 0.5, it indicates a prevalence of size close to 15 µm, in this case.
For liposome morphology, a scanning electron microscopy (SEM) analysis was performed, and the images are presented in Figure 6. In all pictures, close to spherical-shape and regular liposomes can be seen, in addition to some agglomerates. Also, some size heterogeneity is observed, associated with the liposome development process. The agglomerates seem to be formed out of larger liposomes. Also, it has been reported that sample preparation for SEM analysis may be also responsible for the formation of some agglomerates (Baldino and Reverchon, 2023). The results were similar for powdered (Figure 6A) and splintered (Figure 6B) lyophilized GSE-Ov-loaded liposomes.
2.2.2. FTIR Analysis
A FTIR analysis was performed for empty and GSE-Ov-loaded liposomes. The resultant spectra are presented in Figure 7.
Analysing the spectra, the first conclusion that can be made is that both empty and loaded liposomes present a similar fingerprint. Importantly, the lack of shifts in the identified bands reveals that the encapsulation process neither alters the structure of compounds in GSE, nor promotes new bond formation. Since the main component of the liposomes is soy lecithin, there is a group of bands/peaks that are characteristic of this substance. For instance, the region between 2800 and 3000 cm-1, composed of two peaks, corresponds to asymmetric and symmetric stretching bonds of CH2 groups. The peak around 1750 cm-1 corresponds to stretching C=O bonds from aliphatic ester groups. The peaks in the zone approximately between 950 and 1200 cm-1 refer to stretching vibrations of P=O, P-O-C and C-O-C groups. Besides lecithin, pectin was used for liposome-coating, being responsible for the broadband approximately between 3000 and 3600 cm-1, which corresponds to stretching O-H groups from intra- and intermolecular hydrogen bonds related to galacturonic acid. This spectra analysis was made according to Merino et al. (2016), Santos et al. (2020), Whittinghill et al. (2020), and Pezeshky et al. (2016).
2.3. Encapsulation efficiency and phenolic compounds release profile
The selected liposomes presented an encapsulation efficiency of 88.8%, which, in comparison with literature values (ranging from 52 to 91%, as reviewed in section 5.1. (Introduction)), is considered a very positive result. The phenolic compounds released from the liposomes were also assessed, and the results are presented in Table 5. The assays were carried out for 24 h and the maximum percentage of phenolic compounds released was reached with 59.4% of the initial content. Within the first 6 h, the release profile was nearly linear, with almost 50% of the phenolic compounds being in solution at this time and slowing down considerably onwards. Interestingly, a study by Lu et al. (2011) reported a similar release profile of phenolic compounds from GSE entrapped in liposomes, at this time. Moreover, in another study, Gibis et al. (2016) obtained 55.5% of release within 24 h, which also resembles the presented result.
Hereupon, it can be concluded that the systems revealed a prolonged release over time. However, being an in vitro study, real application parameters, such as topical placement, mechanical abrasion, and/or enzymatic action were not considered (Chen et al., 2021; Jeong et al., 2021). In this way, it is expected that in vivo release will be higher and faster in time. Nevertheless, these results appear promising for a topical delivery system.
3. Safety and Skincare Potential of Encapsulated GSE-Ov
After physicochemical characterization, the GSE-Ov, GSE-Ov-loaded liposomes, and empty liposomes were tested for their skincare potential, including a safety assay and the assessment of their anti-inflammatory activity and capacity to increase pro-collagen I α1 production.
3.1. Cytotoxicity
Regarding their safety, these samples were tested on HaCaT and HDF cell lines, and the results are presented in Figure 8. GSE-Ov was safe for concentrations below ~0.15 mg.mL-1 for HaCaT and HDF cell lines, reaching metabolic inhibitions of 27.9 and 32.5%, respectively. Concerning GSE-Ov-loaded liposomes, they showed to be safe approximately up to concentrations of 5 mg.mL-1 for HaCaT and 2.5 mg.mL-1 for HDF cells, with metabolic inhibitions of 25.4 and 29.8%, respectively. According to this, liposome application seems to be favourable, highlighting the importance of the GSE-Ov encapsulation, since the extract alone showed to be significantly more cytotoxic. Even so, the results of the antioxidant activities are compatible with these, since the obtained IC50 values are within the safe range for both cells. Finally, for both cell lines, empty liposomes showed to be non-cytotoxic in the maximum tested concentration (10 mg.mL-1), with metabolic inhibitions of -29.4 and 11.6% for HaCaT and HDF, respectively. In all cases, HDF cells were shown to be more sensitive to the tested extracts. Similar results had been reported by Duarte et al. (2023). We note that negative inhibition values may result from an increase in cellular proliferation (Teixeira et al., 2021), i.e., in these cases, there may have been an over-metabolization of the PrestoBlueTM reagent caused by the samples and, therefore, an emission of fluorescence superior even to the positive controls.
3.2. Anti-Inflammatory Activity
As discussed before, inflammation plays a major role in some skin diseases, and, therefore, it is important to evaluate the anti-inflammatory potential of the extracts. For this purpose, the effect of GSE-Ov, GSE-Ov-loaded liposomes, and empty liposomes on the production of pro-inflammatory cytokines (IL-1α and IL-6) by keratinocytes exposed to urban air dust particles were measured and are presented in Figure 9. All samples were tested according to their safe concentration range.
Regarding IL-1α, its overexpression has been associated with symptom exacerbation and disease progression in psoriasis, atopic dermatitis, and neutrophilic dermatoses (e.g., hidradenitis supurrativa). Nonetheless, this interleukin has important functions in the skin. For example, in psoriasis and atopic dermatitis lesions, keratinocytes extensively produce IL-1α, which has been suggested as a skin disease biomarker, also being capable of helping to maintain skin integrity and barrier (Cavalli et al., 2021; Galozzi et al., 2021; Iznardo and Puig, 2022). Concerning the anti-inflammatory potential of the samples, the GSE-Ov was able to reduce IL-1α production in a concentration-dependent manner. In the case of 0.1 mg.mL-1 GSE-Ov, the amount of cytokine produced decreased from 16.1 to 5.1 pg IL-1α.mg-1 of protein (p < 0.05). For GSE-Ov-loaded liposomes, only the most concentrated samples (2 mg.mL-1) were able to decrease the amount of cytokine (from 16.1 to 8.1 pg IL-1α.mg-1 of protein, p < 0.05). Such an effect could be due to the encapsulation of the GSE, leading to higher protection, and therefore decreased immediate bioavailability. For a more complete evaluation, this study should be conducted over time. Finally, the empty liposomes did not exert any anti-inflammatory activity over IL-1α production, as expected.
On the other hand, IL-6 is produced by many different types of cells and is expressed under many states of cellular stress, including inflammation, infection, wound sites, and cancer (Choy and Rose-John, 2017). None of the tested samples presented significant anti-inflammatory activity over IL-6 production, although a slight reduction in cytokine amount was observed for the GSE-Ov at 0.1 mg.mL-1 (p < 0.05). Interestingly, a study by Nallathambi et al. (2020) reported that GSE was able to reduce IL-1α and IL-6 expression. However, this was carried out with intestinal cellular models and, regarding IL-6, data showed a smaller expression than that found in our essay. It is possible that, in our work, the tested GSE-Ov concentration was not enough to induce such effects. Similarly to the GSE-Ov composition, catechin and procyanidin B1 were also detected in the mentioned extract. To better understand the anti-inflammatory effect of the extract, studies on other cytokines could be conducted. Nevertheless, the results show some specificity of the extract towards skincare since it inhibits IL-1α, which is a cytokine specifically linked to skin inflammation. On the other hand, IL-6 is a more systemic cytokine.
3.3. Human Pro-Collagen I α1 Production
Collagen is the most abundant component of the extracellular matrix (ECM) and the skin's principal structural protein (Alves et al., 2017; Sibilla et al., 2015). It is responsible for structure, stability, and strength, particularly within the dermal layers (Kwatra, 2020), and it plays an important role in preventing skin ageing. Decreasing collagen density has been linked to the process of skin ageing, particularly when related to sun exposure (photoaging), leading to loss of skin integrity and elasticity (Jhawar et al., 2020; Kwatra, 2020). For these reasons, the effect of GSE-Ov, GSE-Ov-loaded liposomes, and empty liposomes on Human pro-Collagen I α1 production by HDF was assessed and the results are presented in Figure 10. Empty liposomes, at 10 mg.mL-1, inhibited collagen production, reducing from 773.32 to 191.46 pg collagen.ug-1 protein (p < 0.05). Interestingly, lecithin, the main component of liposome formulation, has been reported to exert negative effects on collagen, like decreased accumulation (by stimulating collagenase activity) and gene expression (Akit et al., 2016; Li et al., 1992). These findings could be relevant for future improvement of the GSE-Ov encapsulation process and the selection of the right concentration of this material. Moreover, GSE-Ov-loaded liposomes, at both concentrations, also inhibited some collagen production, with the most concentrated sample exerting higher inhibition. Concerning the GSE-Ov, at 0.025 mg.mL-1, it stimulated the average production of collagen by 5.13%, although with no significant differences with the control (p > 0.05). Nevertheless, GSE has been reported to promote collagen fibre deposition and, strengthen collagen-based tissues (Gupta et al., 2020). Likewise, it could be beneficial to conduct studies on the extracellular deposition of collagen, and also on the impact of the extract on the production of other extracellular matrix components, e.g., elastin and fibronectin.
Conclusions
The objectives of this work were the production and characterization of a GSE for potential skincare and cosmetic applications. For that, two different GSEs were studied. Based on their antioxidant and antimicrobial activities, the more promising extract was the GSE-Ov. The antioxidant results showed a huge radical scavenging potential, while the inhibition of S. aureus strains (MRSA and MSSA), together with the non-inhibition of S. epidermidis, suggests beneficial effects on several skin pathologies. Furthermore, we aimed to use an encapsulation technique to promote GSE stability. Liposomes provided a stable and size-appropriate delivery system. In this sense, soy lecithin liposomes coated with pectin was the best formulation, presenting an encapsulation efficiency of 88.8%, and a controlled release of phenolic compounds over several hours.
Regarding safety, GSE-Ov-loaded liposomes were shown to be safe below 5 and 2.5 mg.mL-1 for HaCaT and HDF cells; therefore, the sample could be used as an antioxidant ingredient since the DPPH IC50 falls within the safe range. Furthermore, the extract showed some potential as a skincare ingredient, as it also downregulated IL-1α production.
In summary, it is believed that the use of GSE in skincare holds great potential in particular when delivered in liposomes.
Author Contributions
Conceptualisation, MLC, OLR, SB, SBS, MP; methodology, MLC, SB, SBS, JAS, DV, AM, TR; validation, MLC, OLR, SB, SBS; formal analysis, MLC, OLR, SB, SBS; investigation, MLC, JAS; DV, AM, TR; writing—original draft preparation, MLC, OLR, SB, SBS; writing—review and editing, MLC, OLR, SB, SBS, JAS, DV, AM, TR, JPF, MP; visualisation, MLC, OLR, SB, SBS, JAS, DV, AM, TR, JPF, MP; supervision, OLR, SB, SBS. All authors have read and agreed to the published version of the manuscript.
Funding
This work was supported by National Funds from Fundação para a Ciência e a Tecnologia (FCT), through project UID/Multi/50016/2020 and Sara Baptista-Silva gratefully acknowledges FCT for the grants (ref. SFRH/BPD/116024/2016).
Institutional Review Board Statement
Not applicable.
Informed Consent Statement
Not applicable.
Data Availability Statement
No data were reported in this study.
Conflicts of Interest
The authors declare no conflict of interest.
Abbreviations
ABTS, 2,20-azinobis (3-ethylbenzothiazoline-6-sulfonic acid); CTRL, control; CTRL+, positive control; DAD, Diode Array Detector; dH2O, deionized water; DMEM, Dulbecco's Modified Eagle Medium; DMSO, dimethyl sulfoxide; DPPH, 2,2-diphenyl-1-picrylhydrazyl; EE, encapsulation efficiency; FBS, fetal bovine serum; FTIR, Fourier-Transform Infrared; GSE-Ov, grape seed extract one variety; GSE-Sv, grape seed extract several varieties; HaCaT, immortalized human keratinocytes; HDF, human dermal fibroblasts; HPLC, High Performance Liquid Chromatography; IL-1α, Interleukin 1α; IL-6, Interleukin 6; MBC, Minimum bactericidal concentration; MH, Mueller Hinton; MIC, Minimum inhibitory concentration; MRSA, methicillin-resistant S. aureus; MSSA, methicillin-susceptible S. aureus; TFA, Trifluoroacetic acid; TS, Tryptic Soy.
References
- Akit, H.; Collins, C.; Fahri, F.; Hung, A.; D’souza, D.; Leury, B.; Dunshea, F. Dietary Lecithin Decreases Skeletal Muscle COL1A1 and COL3A1 Gene Expression in Finisher Gilts. Animals 2016, 6, 38,. [CrossRef] [PubMed]
- Alves, A.L.; Marques, A.L.P.; Martins, E.; Silva, T.H.; Reis, R.L. Cosmetic Potential of Marine Fish Skin Collagen. Cosmetics 2017, 4, 39,. [CrossRef]
- de Assis, L.M.; Machado, A.R.; Motta, A.d.S.d.; Costa, J.A.V.; de Souza-Soares, L.A. Development and Characterization of Nanovesicles Containing Phenolic Compounds of Microalgae Spirulina Strain LEB-18 and Chlorella pyrenoidosa. Adv. Mater. Phys. Chem. 2014, 04, 6–12,. [CrossRef]
- Baldino, L.; everchon. Production of Nanoliposomes by a Supercritical CO2 Assisted Process: Application to Cosmetics. Chemical Engineering Transactions 2023, 101, 61–66. [Google Scholar] [CrossRef]
- Brand-Williams, W.; Cuvelier, M.E.; Berset, C. Use of a free radical method to evaluate antioxidant activity. LWT Food Sci. Technol. 1995, 28, 25–30. [CrossRef]
- Brezoiu, A.-M.; Bajenaru, L.; Berger, D.; Mitran, R.-A.; Deaconu, M.; Lincu, D.; Guzun, A.S.; Matei, C.; Moisescu, M.G.; Negreanu-Pirjol, T. Effect of Nanoconfinement of Polyphenolic Extract from Grape Pomace into Functionalized Mesoporous Silica on Its Biocompatibility and Radical Scavenging Activity. Antioxidants 2020, 9, 696,. [CrossRef] [PubMed]
- Bucić-Kojić, A.; Sovová, H.; Planinić, M.; Tomas, S. Temperature-dependent kinetics of grape seed phenolic compounds extraction: Experiment and model. Food Chem. 2013, 136, 1136–1140,. [CrossRef]
- Carvalho, M.J.; Oliveira, A.L.; Pedrosa, S.S.; Pintado, M.; Madureira, A.R. Potential of sugarcane extracts as cosmetic and skincare ingredients. Ind. Crop. Prod. 2021, 169, 113625,. [CrossRef]
- Castro, M.L.; Ferreira, J.P.; Pintado, M.; Ramos, O.L.; Borges, S.; Baptista-Silva, S. Grape By-Products in Sustainable Cosmetics: Nanoencapsulation and Market Trends. Appl. Sci. 2023, 13, 9168,. [CrossRef]
- Cavalli, G.; Colafrancesco, S.; Emmi, G.; Imazio, M.; Lopalco, G.; Maggio, M.C.; Sota, J.; Dinarello, C.A. Interleukin 1α: a comprehensive review on the role of IL-1α in the pathogenesis and treatment of autoimmune and inflammatory diseases. Autoimmun. Rev. 2021, 20, 102763,. [CrossRef]
- Chang, H.-W.; Yan, D.; Singh, R.; Liu, J.; Lu, X.; Ucmak, D.; Lee, K.; Afifi, L.; Fadrosh, D.; Leech, J.; et al. Alteration of the cutaneous microbiome in psoriasis and potential role in Th17 polarization. Microbiome 2018, 6, 1–27,. [CrossRef]
- Chen, Z.; Farag, M.A.; Zhong, Z.; Zhang, C.; Yang, Y.; Wang, S.; Wang, Y. Multifaceted role of phyto-derived polyphenols in nanodrug delivery systems. Adv. Drug Deliv. Rev. 2021, 176, 113870,. [CrossRef]
- Choi, S.; Kang, B.; Yang, E.; Kim, K.; Kwak, M.K.; Chang, P.-S.; Jung, H.-S. Precise control of liposome size using characteristic time depends on solvent type and membrane properties. Sci. Rep. 2023, 13, 1–12,. [CrossRef] [PubMed]
- Chouchouli, V.; Kalogeropoulos, N.; Konteles, S.J.; Karvela, E.; Makris, D.P.; Karathanos, V.T. Fortification of yoghurts with grape (Vitis vinifera) seed extracts. LWT—Food Sci. Technol. 2013, 53, 522–529,. [CrossRef]
- Choy, E.; Rose-John, S. Interleukin-6 as a Multifunctional Regulator: Inflammation, Immune Response, and Fibrosis. J. Scleroderma Relat. Disord. 2017, 2, S1–S5,. [CrossRef]
- Christensen, G.J.M.; Brüggemann, H. Bacterial skin commensals and their role as host guardians. Benef. Microbes 2014, 5, 201–215,. [CrossRef] [PubMed]
- Coscueta, E.R.; Malpiedi, L.P.; Nerli, B.B. Micellar systems of aliphatic alcohol ethoxylates as a sustainable alternative to extract soybean isoflavones. Food Chem. 2018, 264, 135–141,. [CrossRef] [PubMed]
- Dréno, B.; Pécastaings, S.; Corvec, S.; Veraldi, S.; Khammari, A.; Roques, C. Cutibacterium acnes (Propionibacterium acnes) and acne vulgaris: a brief look at the latest updates. J. Eur. Acad. Dermatol. Venereol. 2018, 32 (Suppl. S2), 5–14,. [CrossRef]
- Duarte, M.; Carvalho, M.J.; de Carvalho, N.M.; Azevedo-Silva, J.; Mendes, A.; Ribeiro, I.P.; Fernandes, J.C.; Oliveira, A.L.S.; Oliveira, C.; Pintado, M.; et al. Skincare potential of a sustainable postbiotic extract produced through sugarcane straw fermentation by Saccharomyces cerevisiae. BioFactors 2023, 49, 1038–1060,. [CrossRef]
- Fadlelmoula, A.; Pinho, D.; Carvalho, V.H.; Catarino, S.O.; Minas, G. Fourier Transform Infrared (FTIR) Spectroscopy to Analyse Human Blood over the Last 20 Years: A Review towards Lab-on-a-Chip Devices. Micromachines 2022, 13, 187,. [CrossRef]
- Ferreira, S.M.; Santos, L. A Potential Valorization Strategy of Wine Industry by-Products and Their Application in Cosmetics—Case Study: Grape Pomace and Grapeseed. Molecules 2022, 27, 969,. [CrossRef] [PubMed]
- Fournière, M.; Latire, T.; Souak, D.; Feuilloley, M.G.J.; Bedoux, G. Staphylococcus epidermidis and Cutibacterium acnes: Two Major Sentinels of Skin Microbiota and the Influence of Cosmetics. Microorganisms 2020, 8, 1752,. [CrossRef] [PubMed]
- Galozzi, P.; Bindoli, S.; Doria, A.; Sfriso, P. The revisited role of interleukin-1 alpha and beta in autoimmune and inflammatory disorders and in comorbidities. Autoimmun. Rev. 2021, 20, 102785,. [CrossRef] [PubMed]
- Gibis, M.; Ruedt, C.; Weiss, J. In vitro release of grape-seed polyphenols encapsulated from uncoated and chitosan-coated liposomes. Food Res. Int. 2016, 88, 105–113,. [CrossRef] [PubMed]
- Gilaberte, Y.; rieto-Torres; astushenko; uarranz. Anatomy and Function of the Skin. In: Nanoscience in Dermatology (Eds. M. Hamblin, P. Avci, & T. Prow). Academic Press, San Diego, CA, USA, pp. 1–14 2016. [Google Scholar] [CrossRef]
- Gonçalves, B.; Falco, V.; Moutinho-Pereira, J.; Bacelar, E.; Peixoto, F.; Correia, C. Effects of Elevated CO2 on Grapevine (Vitis vinifera L.): Volatile Composition, Phenolic Content, and in Vitro Antioxidant Activity of Red Wine. J. Agric. Food Chem. 2008, 57, 265–273,. [CrossRef] [PubMed]
- Goufo, P.; Singh, R.K.; Cortez, I. A Reference List of Phenolic Compounds (Including Stilbenes) in Grapevine (Vitis vinifera L.) Roots, Woods, Canes, Stems, and Leaves. Antioxidants 2020, 9, 398,. [CrossRef]
- Gu, Y.; Han, J.; Jiang, C.; Zhang, Y. Biomarkers, oxidative stress and autophagy in skin aging. Ageing Res. Rev. 2020, 59, 101036,. [CrossRef]
- Günter, E.A.; Popeyko, O.V. Delivery system for grape seed extract based on biodegradable pectin-Zn-alginate gel particles. Int. J. Biol. Macromol. 2022, 219, 1021–1033,. [CrossRef]
- Gupta, M.; Dey, S.; Marbaniang, D.; Pal, P.; Ray, S.; Mazumder, B. Grape seed extract: having a potential health benefits. J. Food Sci. Technol. 2019, 57, 1205–1215,. [CrossRef]
- Hoang, H.T.; Moon, J.-Y.; Lee, Y.-C. Natural Antioxidants from Plant Extracts in Skincare Cosmetics: Recent Applications, Challenges and Perspectives. Cosmetics 2021, 8, 106,. [CrossRef]
- Hoss, I.; Rajha, H.N.; El Khoury, R.; Youssef, S.; Manca, M.L.; Manconi, M.; Louka, N.; Maroun, R.G. Valorization of Wine-Making By-Products’ Extracts in Cosmetics. Cosmetics 2021, 8, 109,. [CrossRef]
- Hwang, E.; Park, S.; Lee, H.J.; Lee, T.Y.; Sun, Z.; Yi, T.H. Gallic Acid Regulates Skin Photoaging in UVB-exposed Fibroblast and Hairless Mice. Phytotherapy Res. 2014, 28, 1778–1788,. [CrossRef] [PubMed]
- INdermal. 2022. Available: https://indermal.com/en/index-english/ [date visited: 30/04/2023].
- Iznardo, H.; Puig, L. IL-1 Family Cytokines in Inflammatory Dermatoses: Pathogenetic Role and Potential Therapeutic Implications. Int. J. Mol. Sci. 2022, 23, 9479,. [CrossRef] [PubMed]
- Jeong, W.Y.; Kwon, M.; Choi, H.E.; Kim, K.S. Recent advances in transdermal drug delivery systems: a review. Biomater. Res. 2021, 25, 1–15,. [CrossRef]
- Jhawar, N.; Wang, J.V.; Saedi, N. Oral collagen supplementation for skin aging: A fad or the future? J. Cosmet. Dermatol. 2019, 19, 910–912,. [CrossRef] [PubMed]
- Joseph, T.M.; Mahapatra, D.K.; Esmaeili, A.; Piszczyk,.; Hasanin, M.S.; Kattali, M.; Haponiuk, J.; Thomas, S. Nanoparticles: Taking a Unique Position in Medicine. Nanomaterials 2023, 13, 574,. [CrossRef] [PubMed]
- Kammeyer, A.; Luiten, R.M. Oxidation events and skin aging. Ageing Res. Rev. 2015, 21, 16–29,. [CrossRef] [PubMed]
- Krasteva, D.; Ivanov, Y.; Chengolova, Z.; Godjevargova, T. Antimicrobial Potential, Antioxidant Activity, and Phenolic Content of Grape Seed Extracts from Four Grape Varieties. Microorganisms 2023, 11, 395,. [CrossRef]
- Kumar, K.J.S.; Vani, M.G.; Wang, S.; Liao, J.; Hsu, L.; Yang, H.; Hseu, Y. In vitro and in vivo studies disclosed the depigmenting effects of gallic acid: A novel skin lightening agent for hyperpigmentary skin diseases. BioFactors 2013, 39, 259–270,. [CrossRef]
- Kumar, S.; Dutta, J.; Dutta, P.; Koh, J. A systematic study on chitosan-liposome based systems for biomedical applications. Int. J. Biol. Macromol. 2020, 160, 470–481,. [CrossRef] [PubMed]
- Kwatra, B. Collagen Supplementation : Therapy for Skin Disorders: a Review. World Journal of Pharmaceutical Research 9(5): 2504–2518 2020. [Google Scholar] [CrossRef]
- Lai, Y.; Gallo, R.L. Toll-Like Receptors in Skin Infections and Inflammatory Diseases. Infect. Disord. - Drug Targets 2008, 8, 144–155,. [CrossRef] [PubMed]
- Lee, E.-H.; Lim, S.-J.; Lee, M.-K. Chitosan-coated liposomes to stabilize and enhance transdermal delivery of indocyanine green for photodynamic therapy of melanoma. Carbohydr. Polym. 2019, 224, 115143,. [CrossRef] [PubMed]
- Li, J.; Kim, C.-I.; Leo, M.A.; Mak, K.M.; Rojkind, M.; Lieber, C.S. Polyunsaturated lecithin prevents acetaldehyde-mediated hepatic collagen accumulation by stimulating collagenase activity in cultured lipocytes. J. Hepatol. 1992, 15, 373–381,. [CrossRef] [PubMed]
- Lu, Q.; Li, D.-C.; Jiang, J.-G. Preparation of a Tea Polyphenol Nanoliposome System and Its Physicochemical Properties. J. Agric. Food Chem. 2011, 59, 13004–13011,. [CrossRef] [PubMed]
- Lucarini, M.; Durazzo, A.; Kiefer, J.; Santini, A.; Lombardi-Boccia, G.; Souto, E.B.; Romani, A.; Lampe, A.; Nicoli, S.F.; Gabrielli, P.; et al. Grape Seeds: Chromatographic Profile of Fatty Acids and Phenolic Compounds and Qualitative Analysis by FTIR-ATR Spectroscopy. Foods 2020, 9, 10,. [CrossRef] [PubMed]
- Machado, A. R.; ssis; M, L.; osta; V, J. A.; adiale-Furlong; otta; S, A.; icheletto; S, Y. M.; ouza-Soares; A, L. Application of sonication and mixing for nanoencapsulation of the cyanobacterium Spirulina platensis in liposomes; 2201: International Food Research Journal 21(6), 2014. [Google Scholar]
- Machado, A.R.; Pinheiro, A.C.; Vicente, A.A.; Souza-Soares, L.A.; Cerqueira, M.A. Liposomes loaded with phenolic extracts of Spirulina LEB-18: Physicochemical characterization and behavior under simulated gastrointestinal conditions. Food Res. Int. 2019, 120, 656–667,. [CrossRef]
- Mandic, A.; Djilas, S.; Canadanovic-Brunet, J.; Cetkovic, G.; Vulic, J. Antioxidant activity of white grape seed extracts on DPPH radicals. Acta Period. Technol. 2009, 53–61,. [CrossRef]
- Martin, M.E.; Grao-Cruces, E.; Millan-Linares, M.C.; Montserrat de la Paz, S. Grape (Vitis vinifera L.) Seed Oil: A Functional Food from the Winemaking Industry. Foods 2020, 9, 1360,. [CrossRef]
- Martinez-Micaelo, N.; González-Abuín, N.; Pinent, M.; Ardévol, A.; Blay, M. Procyanidin B2 inhibits inflammasome-mediated IL-1β production in lipopolysaccharide-stimulated macrophages. Mol. Nutr. Food Res. 2014, 59, 262–269,. [CrossRef] [PubMed]
- Merino, D.; Ollier, R.; Lanfranconi, M.; Alvarez, V. Preparation and characterization of soy lecithin-modified bentonites. Appl. Clay Sci. 2016, 127-128, 17–22,. [CrossRef]
- Michalak, M. Plant-Derived Antioxidants: Significance in Skin Health and the Ageing Process. Int. J. Mol. Sci. 2022, 23, 585,. [CrossRef] [PubMed]
- Miles, A.A.; Misra, S.S.; Irwin, J.O. The estimation of the bactericidal power of the blood. Epidemiol. Infect. 1938, 38, 732–749,. [CrossRef] [PubMed]
- Monga, J.; Aggarwal, V.; Suthar, S.K.; Monika, M.; Nongalleima, K.; Sharma, M. Topical (+)-catechin emulsified gel prevents DMBA/TPA-induced squamous cell carcinoma of the skin by modulating antioxidants and inflammatory biomarkers in BALB/c mice. Food Funct. 2014, 5, 3197–3207,. [CrossRef] [PubMed]
- Mudalige, T.; u; Haute, Van; nsar; M, S.; aredes; ngle. Characterization of nanomaterials: Tools and challenges. In: Nanomaterials for Food Applications (Eds, A. L. Rubio, M. J. F. Rovira, M. M. Sanz, & L. G. Gómez-Mascaraque). Elsevier, Oxford, UK, pp. 313-353 2019. [Google Scholar] [CrossRef]
- Nakatsuji, T.; Chen, T.H.; Narala, S.; Chun, K.A.; Two, A.M.; Yun, T.; Shafiq, F.; Kotol, P.F.; Bouslimani, A.; Melnik, A.V.; et al. Antimicrobials from human skin commensal bacteria protect against Staphylococcus aureus and are deficient in atopic dermatitis. Sci. Transl. Med. 2017, 9, eaah4680,. [CrossRef] [PubMed]
- Nallathambi, R.; Poulev, A.; Zuk, J.B.; Raskin, I. Proanthocyanidin-Rich Grape Seed Extract Reduces Inflammation and Oxidative Stress and Restores Tight Junction Barrier Function in Caco-2 Colon Cells. Nutrients 2020, 12, 1623,. [CrossRef]
- Németh, Z.; Csóka, I.; Jazani, R.S.; Sipos, B.; Haspel, H.; Kozma, G.; Kónya, Z.; Dobó, D.G. Quality by Design-Driven Zeta Potential Optimisation Study of Liposomes with Charge Imparting Membrane Additives. Pharmaceutics 2022, 14, 1798,. [CrossRef]
- Ngwuluka, N. C.; bu-Thabit; Y, N.; waezuoke; J, O.; rebor; O, J.; lomuanya; O, M.; ohamed; R, R.; oliman; A, S. M.; lella; A, M. H.; brahim; A, N A. Natural Polymers in Micro- and Nanoencapsulation for Therapeutic and Diagnostic Applications: Part I: Lipids and Fabrication Techniques. In: Nano- and Microencapsulation - Techniques and Applications (Ed. N. Abu-Thabit). InTech, London, UK, pp. 3-54 2021. [Google Scholar] [CrossRef]
- Nogales-Bueno, J.; Baca-Bocanegra, B.; Rooney, A.; Hernández-Hierro, J.M.; Byrne, H.J.; Heredia, F.J. Study of phenolic extractability in grape seeds by means of ATR-FTIR and Raman spectroscopy. Food Chem. 2017, 232, 602–609,. [CrossRef] [PubMed]
- Nsairat, H.; Khater, D.; Sayed, U.; Odeh, F.; Al Bawab, A.; Alshaer, W. Liposomes: structure, composition, types, and clinical applications. Heliyon 2022, 8, e09394,. [CrossRef]
- Nunes, M. A.; odrigues; liveira; P, M. B. Grape processing by-products as active ingredients for cosmetic proposes. In: Handbook of grape processing by-products (Ed. C. M. Galanakis). Academic Press, San Diego, CA, USA, pp. 267-292 2017. [Google Scholar] [CrossRef]
- Perra, M.; Bacchetta, G.; Muntoni, A.; De Gioannis, G.; Castangia, I.; Rajha, H.N.; Manca, M.L.; Manconi, M. An outlook on modern and sustainable approaches to the management of grape pomace by integrating green processes, biotechnologies and advanced biomedical approaches. J. Funct. Foods 2022, 98,. [CrossRef]
- Perra, M.; Lozano-Sánchez, J.; Leyva-Jiménez, F.-J.; Segura-Carretero, A.; Pedraz, J.L.; Bacchetta, G.; Muntoni, A.; De Gioannis, G.; Manca, M.L.; Manconi, M. Extraction of the antioxidant phytocomplex from wine-making by-products and sustainable loading in phospholipid vesicles specifically tailored for skin protection. Biomed. Pharmacother. 2021, 142, 111959,. [CrossRef] [PubMed]
- Pezeshky, A.; Ghanbarzadeh, B.; Hamishehkar, H.; Moghadam, M.; Babazadeh, A. Vitamin A palmitate-bearing nanoliposomes: Preparation and characterization. Food Biosci. 2016, 13, 49–55,. [CrossRef]
- Pinela, J.; de la Fuente, B.; Rodrigues, M.; Pires, T.C.S.P.; Mandim, F.; Almeida, A.; Dias, M.I.; Caleja, C.; Barros, L. Upcycling Fish By-Products into Bioactive Fish Oil: The Suitability of Microwave-Assisted Extraction. Biomolecules 2022, 13, 1,. [CrossRef] [PubMed]
- Platsidaki, E.; Dessinioti, C. Recent advances in understanding Propionibacterium acnes (Cutibacterium acnes) in acne. F1000Research 2018, 7, 1953,. [CrossRef] [PubMed]
- Quan, C.; Chen, X.-Y.; Li, X.; Xue, F.; Chen, L.-H.; Liu, N.; Wang, B.; Wang, L.-Q.; Wang, X.-P.; Yang, H.; et al. Psoriatic lesions are characterized by higher bacterial load and imbalance between Cutibacterium and Corynebacterium. J. Am. Acad. Dermatol. 2019, 82, 955–961,. [CrossRef]
- Ribeiro, T.B.; Campos, D.; Oliveira, A.; Nunes, J.; Vicente, A.A.; Pintado, M. Study of olive pomace antioxidant dietary fibre powder throughout gastrointestinal tract as multisource of phenolics, fatty acids and dietary fibre. Food Res. Int. 2021, 142, 110032,. [CrossRef]
- Rozas, M.; de Ruijter, A.H.; Fabrega, M.J.; Zorgani, A.; Guell, M.; Paetzold, B.; Brillet, F. From Dysbiosis to Healthy Skin: Major Contributions of Cutibacterium acnes to Skin Homeostasis. Microorganisms 2021, 9, 628,. [CrossRef] [PubMed]
- Sahu, S. C. Impact of Nanotechnology in the Modern World; 1082: Annals of Clinical Case Studies 5(4), 2023. [Google Scholar]
- Salem, Y.; Rajha, H.N.; Franjieh, D.; Hoss, I.; Manca, M.L.; Manconi, M.; Castangia, I.; Perra, M.; Maroun, R.G.; Louka, N. Stability and Antioxidant Activity of Hydro-Glyceric Extracts Obtained from Different Grape Seed Varieties Incorporated in Cosmetic Creams. Antioxidants 2022, 11, 1348,. [CrossRef]
- Samimi, S.; aghsoudnia; ftekhari; B, R.; orkoosh. Lipid-based nanoparticles for drug delivery systems. IN: Characterization and Biology of Nanomaterials for Drug Delivery (Eds. S. S. Mohapatra, S. Ranjan, N. Dasgupta, R. K. Mishra, & S. Thomas). Elsevier, Oxford, UK, pp. 47-76 2019. [Google Scholar] [CrossRef]
- Santos, E.E.; Amaro, R.C.; Bustamante, C.C.C.; Guerra, M.H.A.; Soares, L.C.; Froes, R.E.S. Extraction of pectin from agroindustrial residue with an ecofriendly solvent: use of FTIR and chemometrics to differentiate pectins according to degree of methyl esterification. Food Hydrocoll. 2020, 107, 105921,. [CrossRef]
- Sibilla, S.; Godfrey, M.; Brewer, S.; Budh-Raja, A.; Genovese, L. An overview of the beneficial effects of hydrolysed collagen intake on joint and bone health and on skin ageing. Open Nutraceuticals J. 2015, 8, 29–42,. [CrossRef]
- Spinei, M.; Oroian, M. Structural, functional and physicochemical properties of pectin from grape pomace as affected by different extraction techniques. Int. J. Biol. Macromol. 2023, 224, 739–753,. [CrossRef]
- Teixeira, F.S.; Vidigal, S.S.M.P.; Pimentel, L.L.; Costa, P.T.; Tavares-Valente, D.; Azevedo-Silva, J.; Pintado, M.E.; Fernandes, J.C.; Rodríguez-Alcalá, L.M. Phytosterols and Novel Triterpenes Recovered from Industrial Fermentation Coproducts Exert In Vitro Anti-Inflammatory Activity in Macrophages. Pharmaceuticals 2021, 14, 583,. [CrossRef]
- Tournour, H. Re: How does the difference happen between ABTS and DPPH radical scavenging activity; Available: https://www.researchgate.net/post/How-does-the-difference-happen-between-ABTS-and-DPPH-radical-scavenging-activity/5774553aed99e1e7a531f53a/citation/download [date visited: 28/11/2023].
- Vovesná, A.; Zhigunov, A.; Balouch, M.; Zbytovská, J. Ceramide liposomes for skin barrier recovery: A novel formulation based on natural skin lipids. Int. J. Pharm. 2021, 596, 120264,. [CrossRef]
- Walters, K. A., Roberts, M. S. 2002. The structure and function of skin. In: Dermatological and Transdermal Formulations (Ed. K. A. Walters). CRC Press, Boca Raton, FL, USA, pp. 19-58. [CrossRef]
- Whittinghill, J.M.; Norton, J.; Proctor, A. Stability determination of soy lecithin-based emulsions by Fourier transform infrared spectroscopy. J. Am. Oil Chem. Soc. 2000, 77, 37–42,. [CrossRef]
- Wittenauer, J.; Mäckle, S.; Sußmann, D.; Schweiggert-Weisz, U.; Carle, R. Inhibitory effects of polyphenols from grape pomace extract on collagenase and elastase activity. Fitoterapia 2015, 101, 179–187,. [CrossRef] [PubMed]
Figure 1.
Schematic representation of the extraction of the GSEs. Created with BioRender.
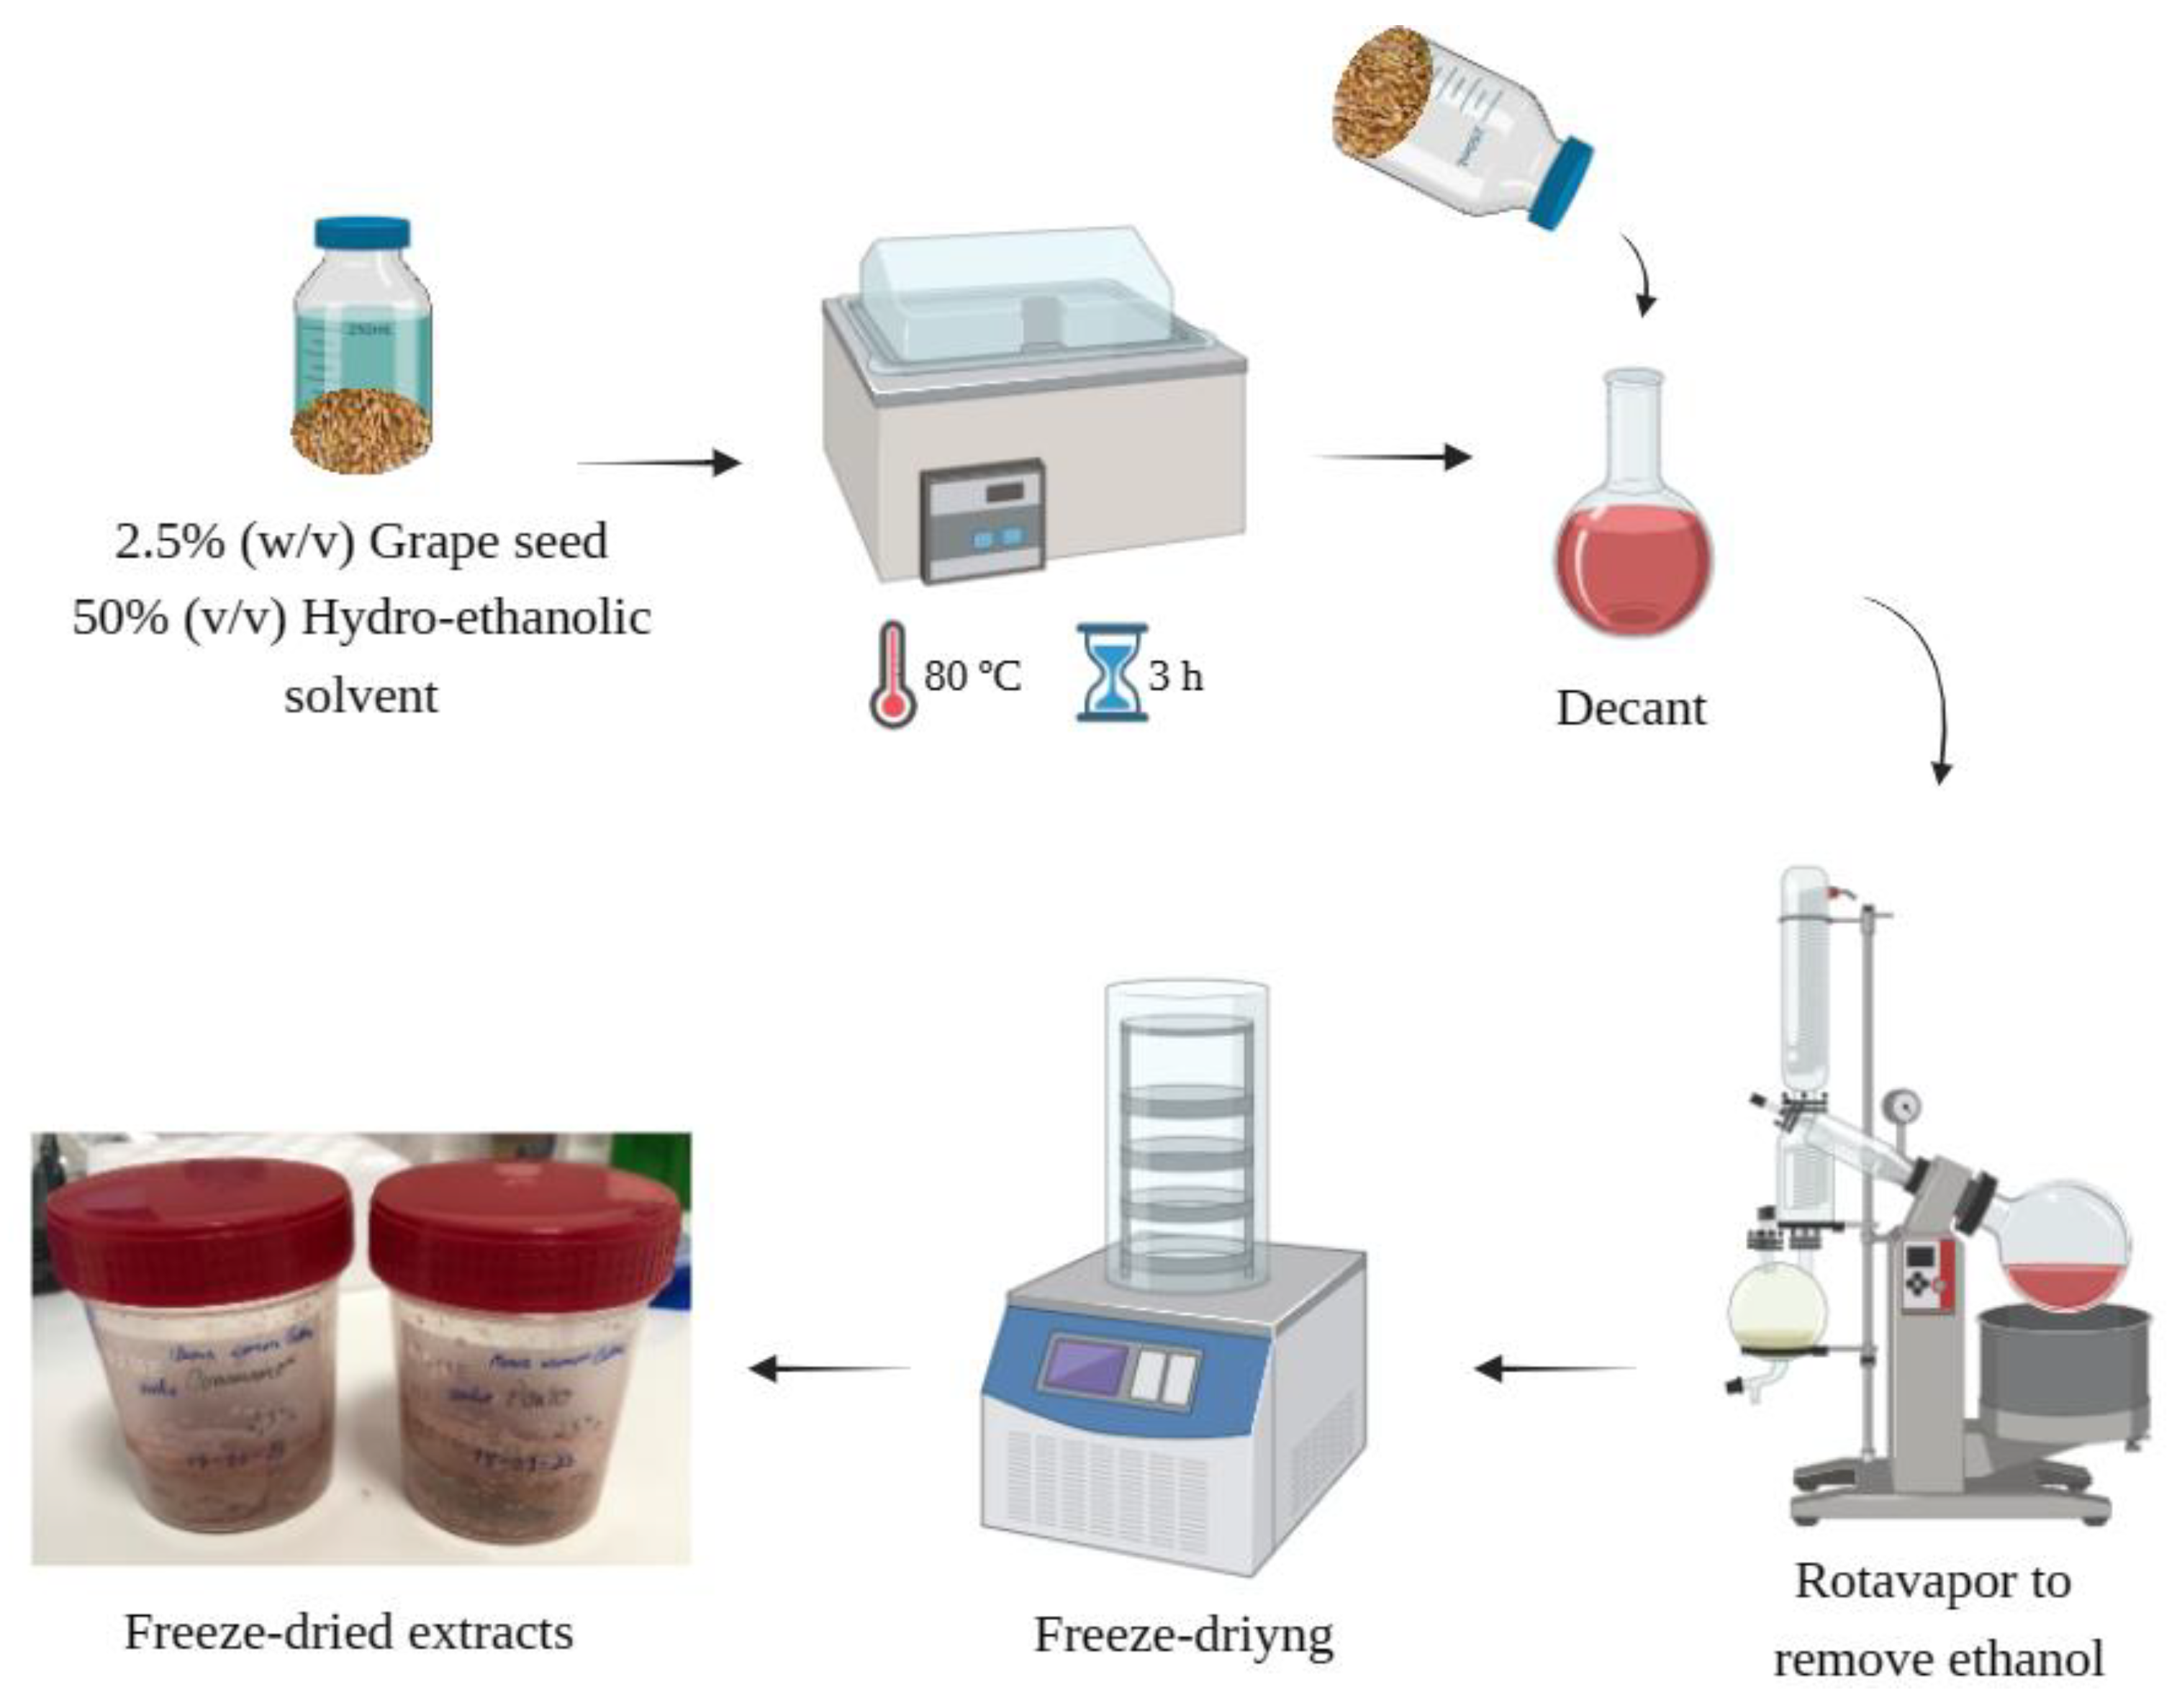
Figure 2.
Schematic representation of the encapsulation process. Created with BioRender.
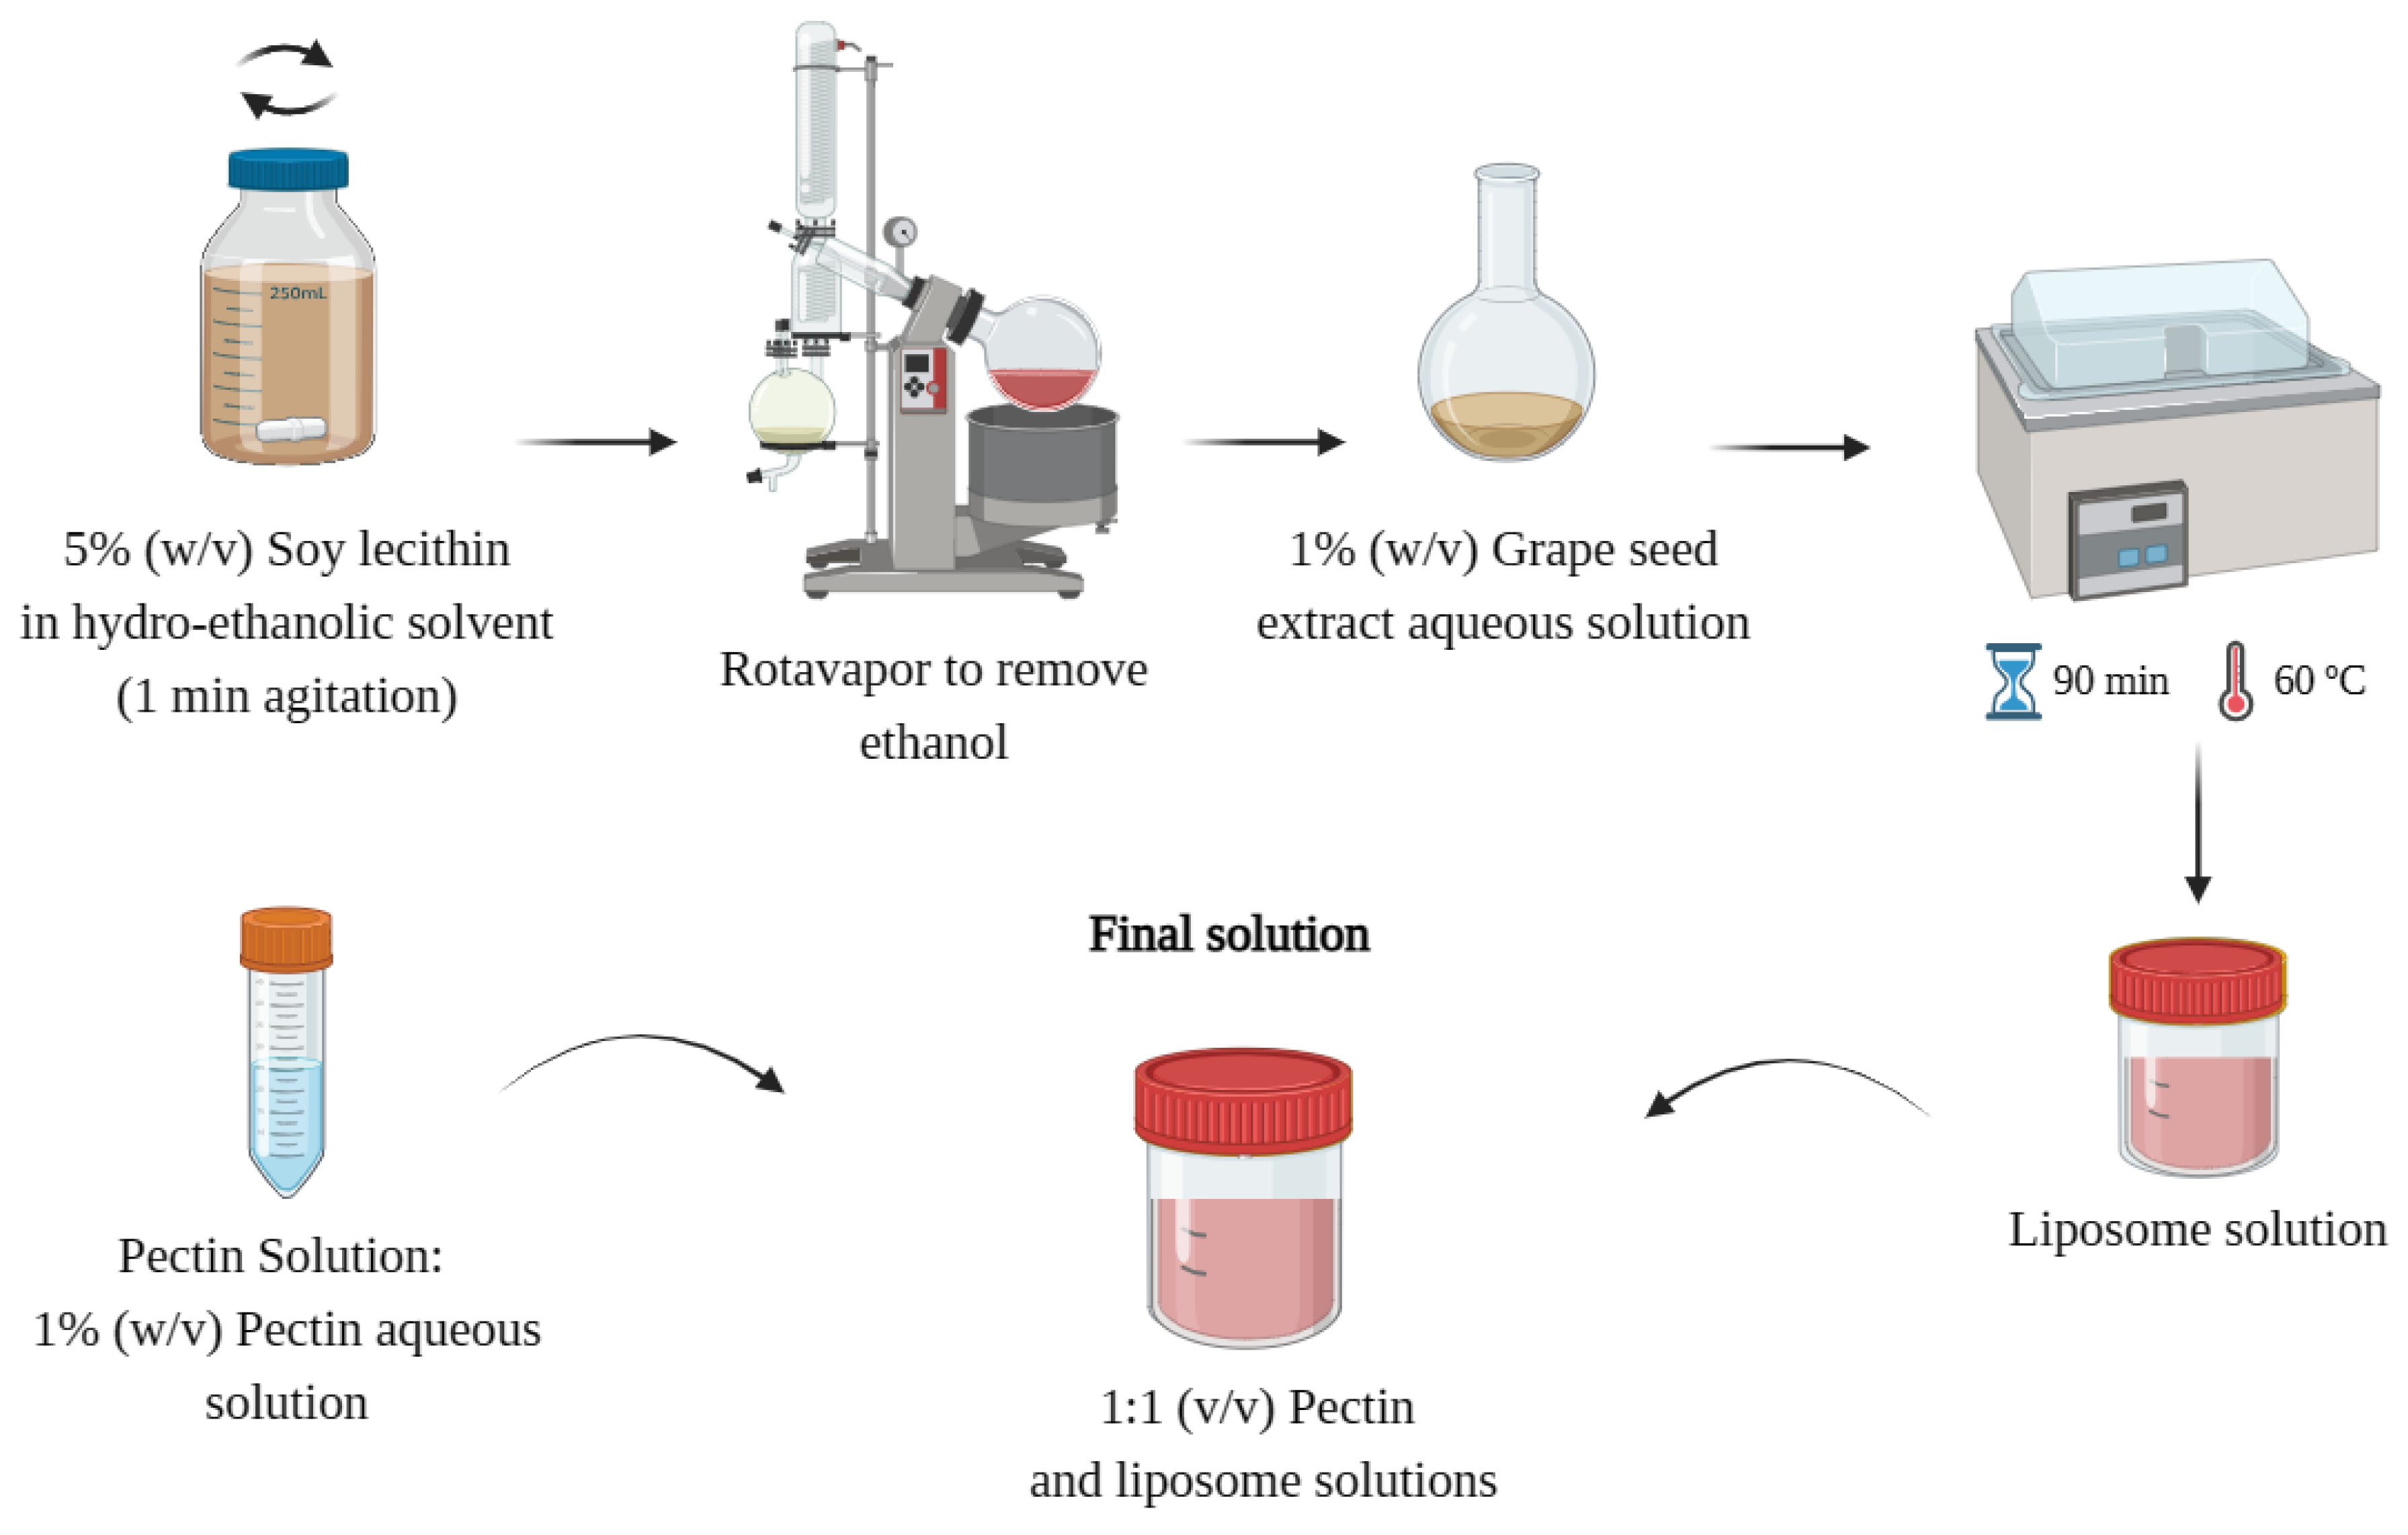
Figure 3.
Chromatogram of the HPLC analysis of the GSEs and respective identified phenolic compounds.
Figure 3.
Chromatogram of the HPLC analysis of the GSEs and respective identified phenolic compounds.
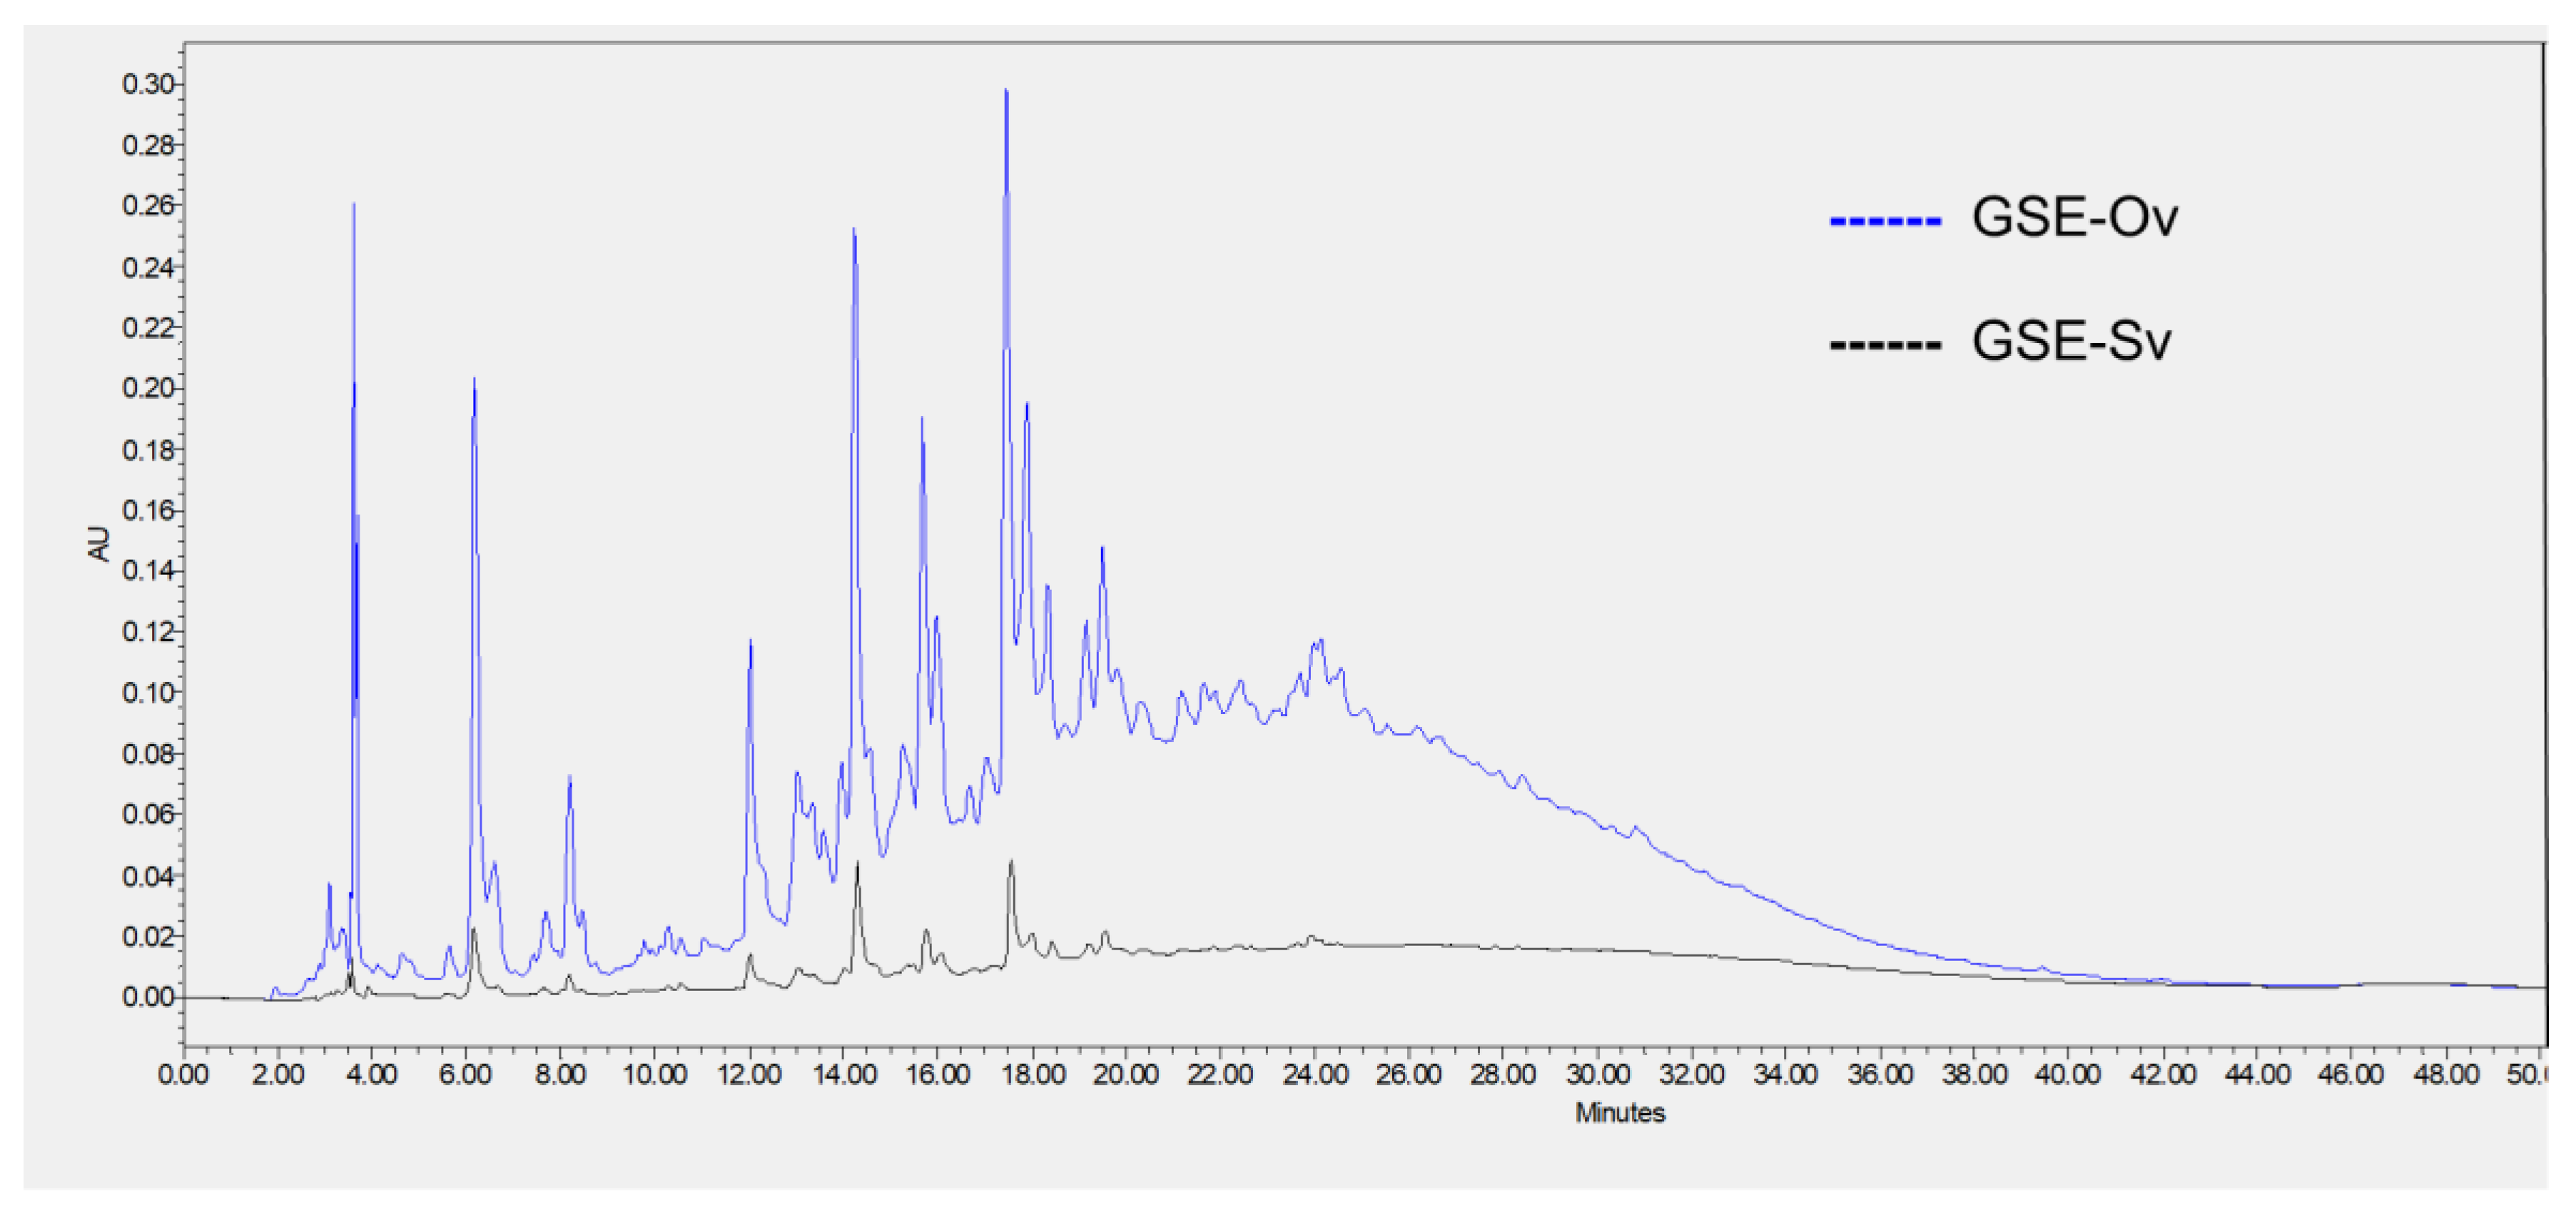
Figure 4.
FTIR spectra of the GSEs.
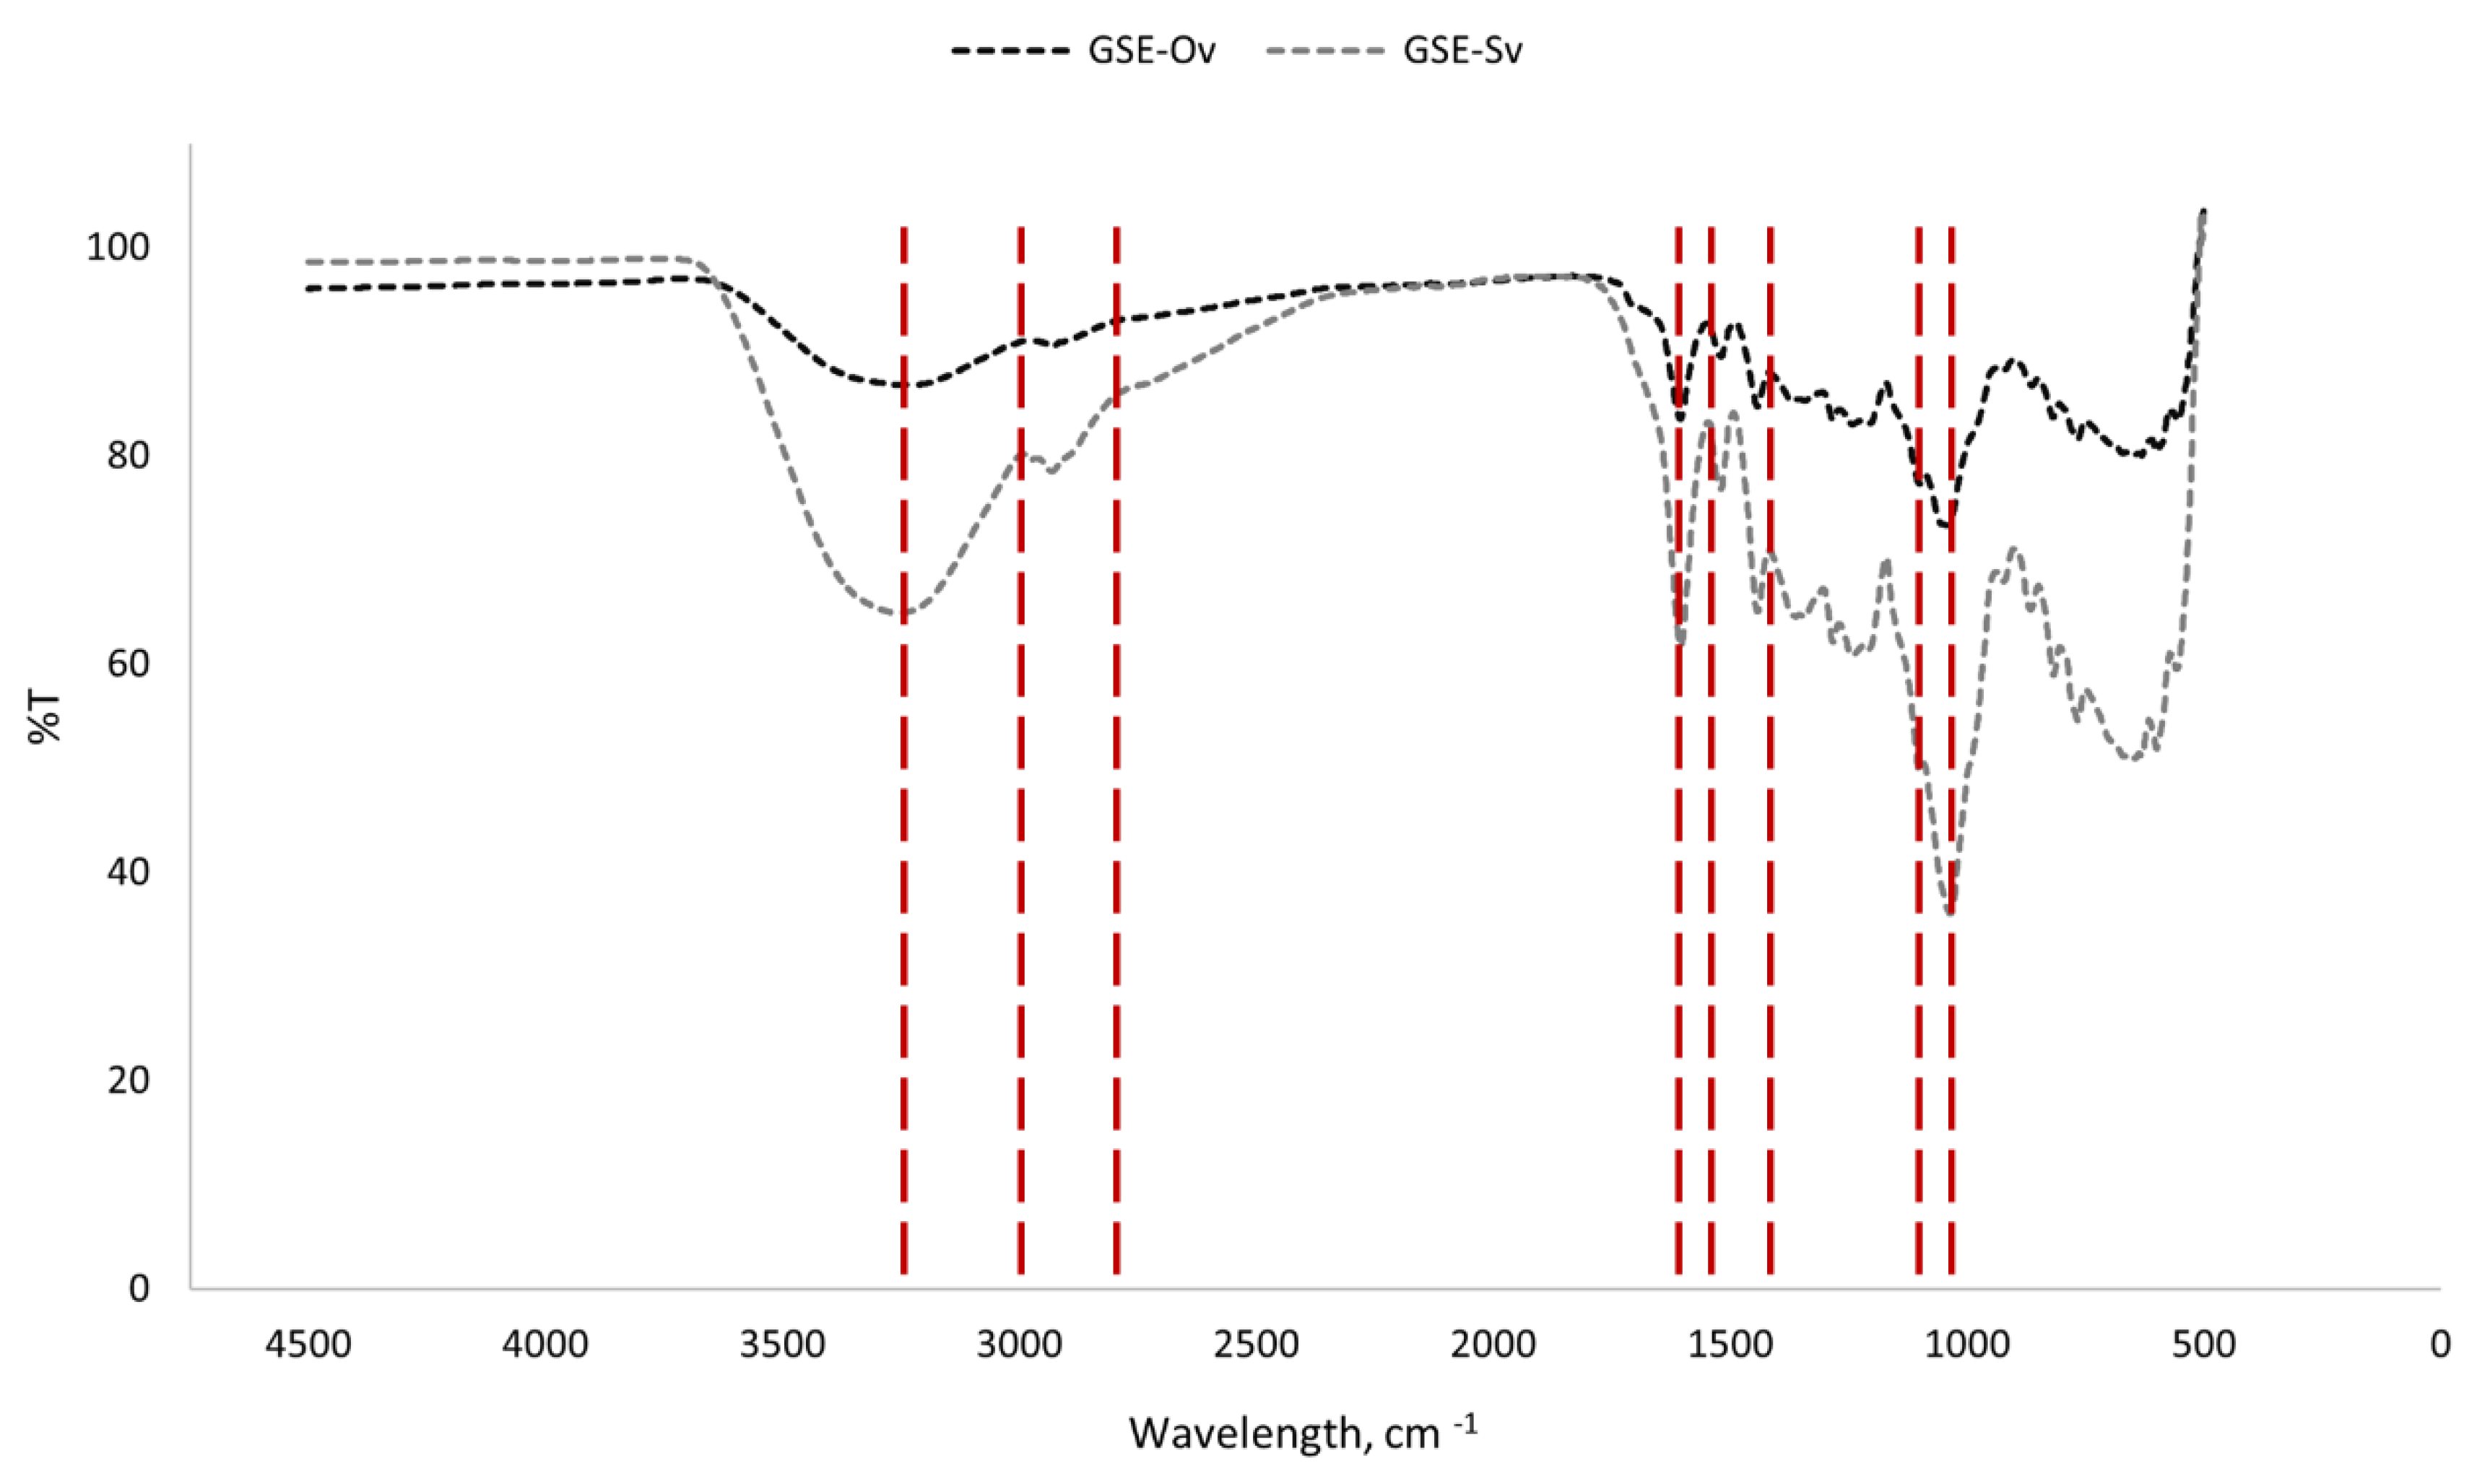
Figure 5.
Size distribution of GSE-Ov-loaded liposomes.
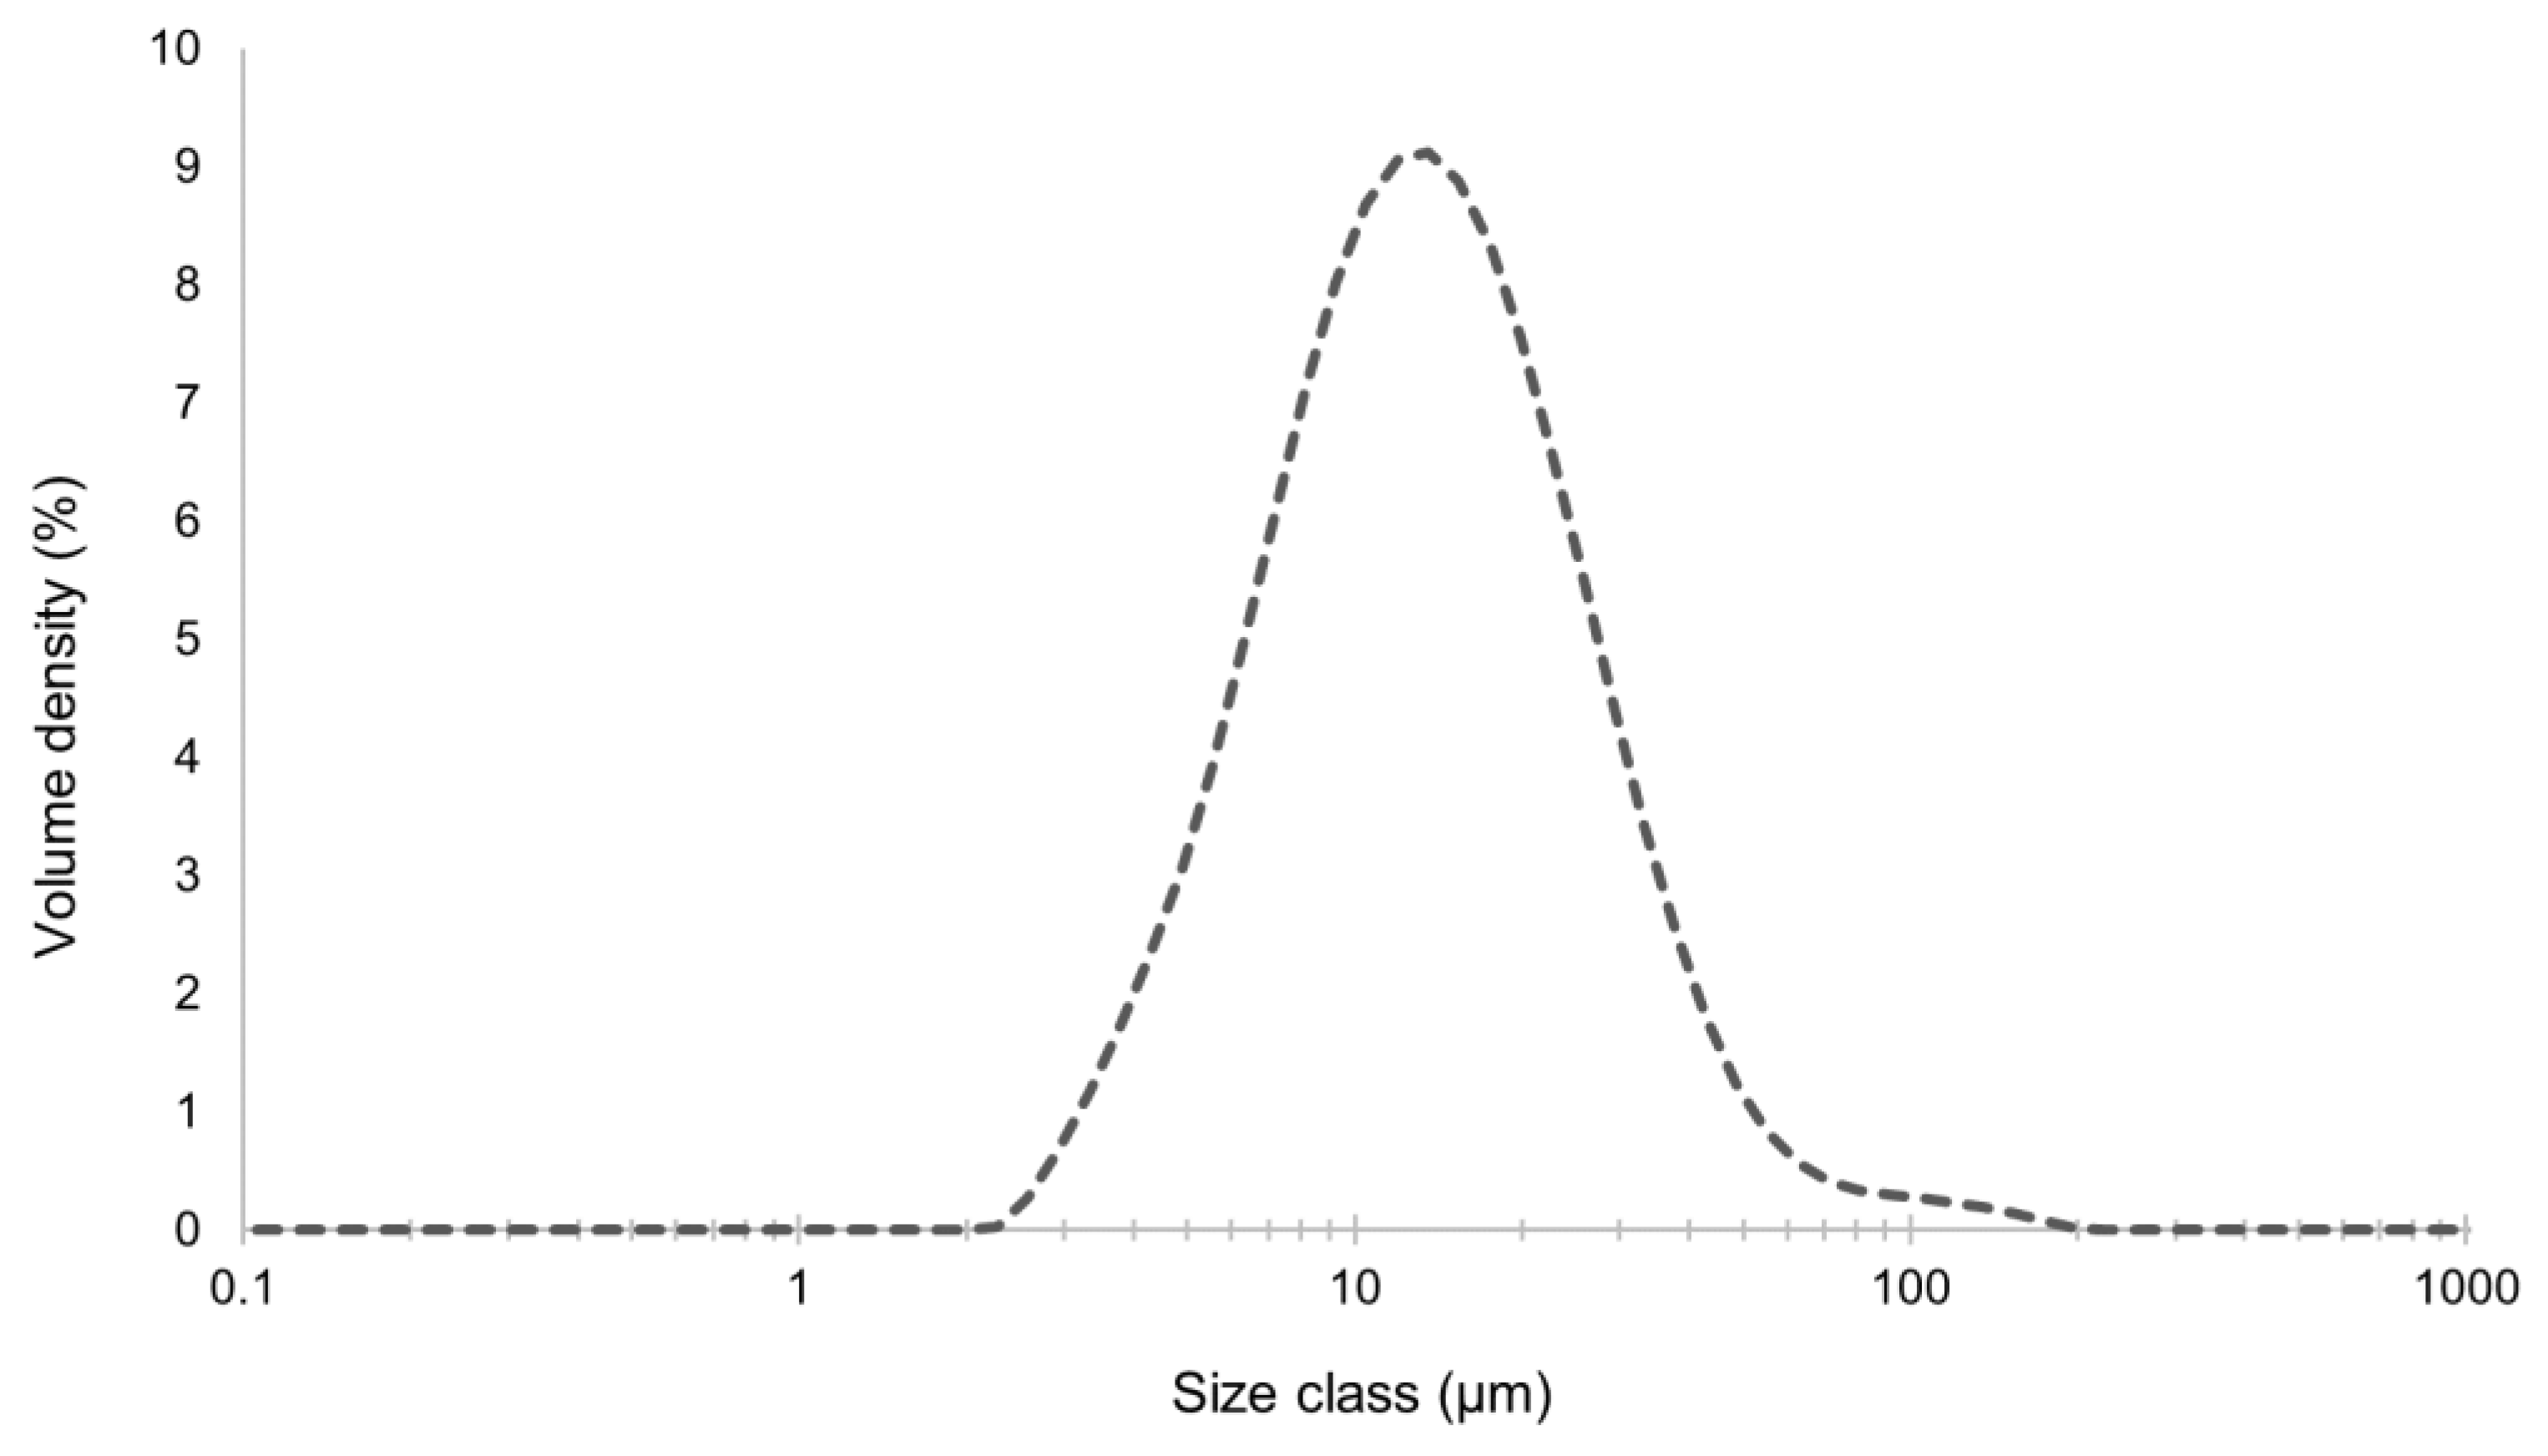
Figure 6.
SEM images of powdered (A; magnification of 4000 x) and splintered (B; magnification of 2000 x) lyophilized GSE-Ov loaded liposomes.
Figure 6.
SEM images of powdered (A; magnification of 4000 x) and splintered (B; magnification of 2000 x) lyophilized GSE-Ov loaded liposomes.
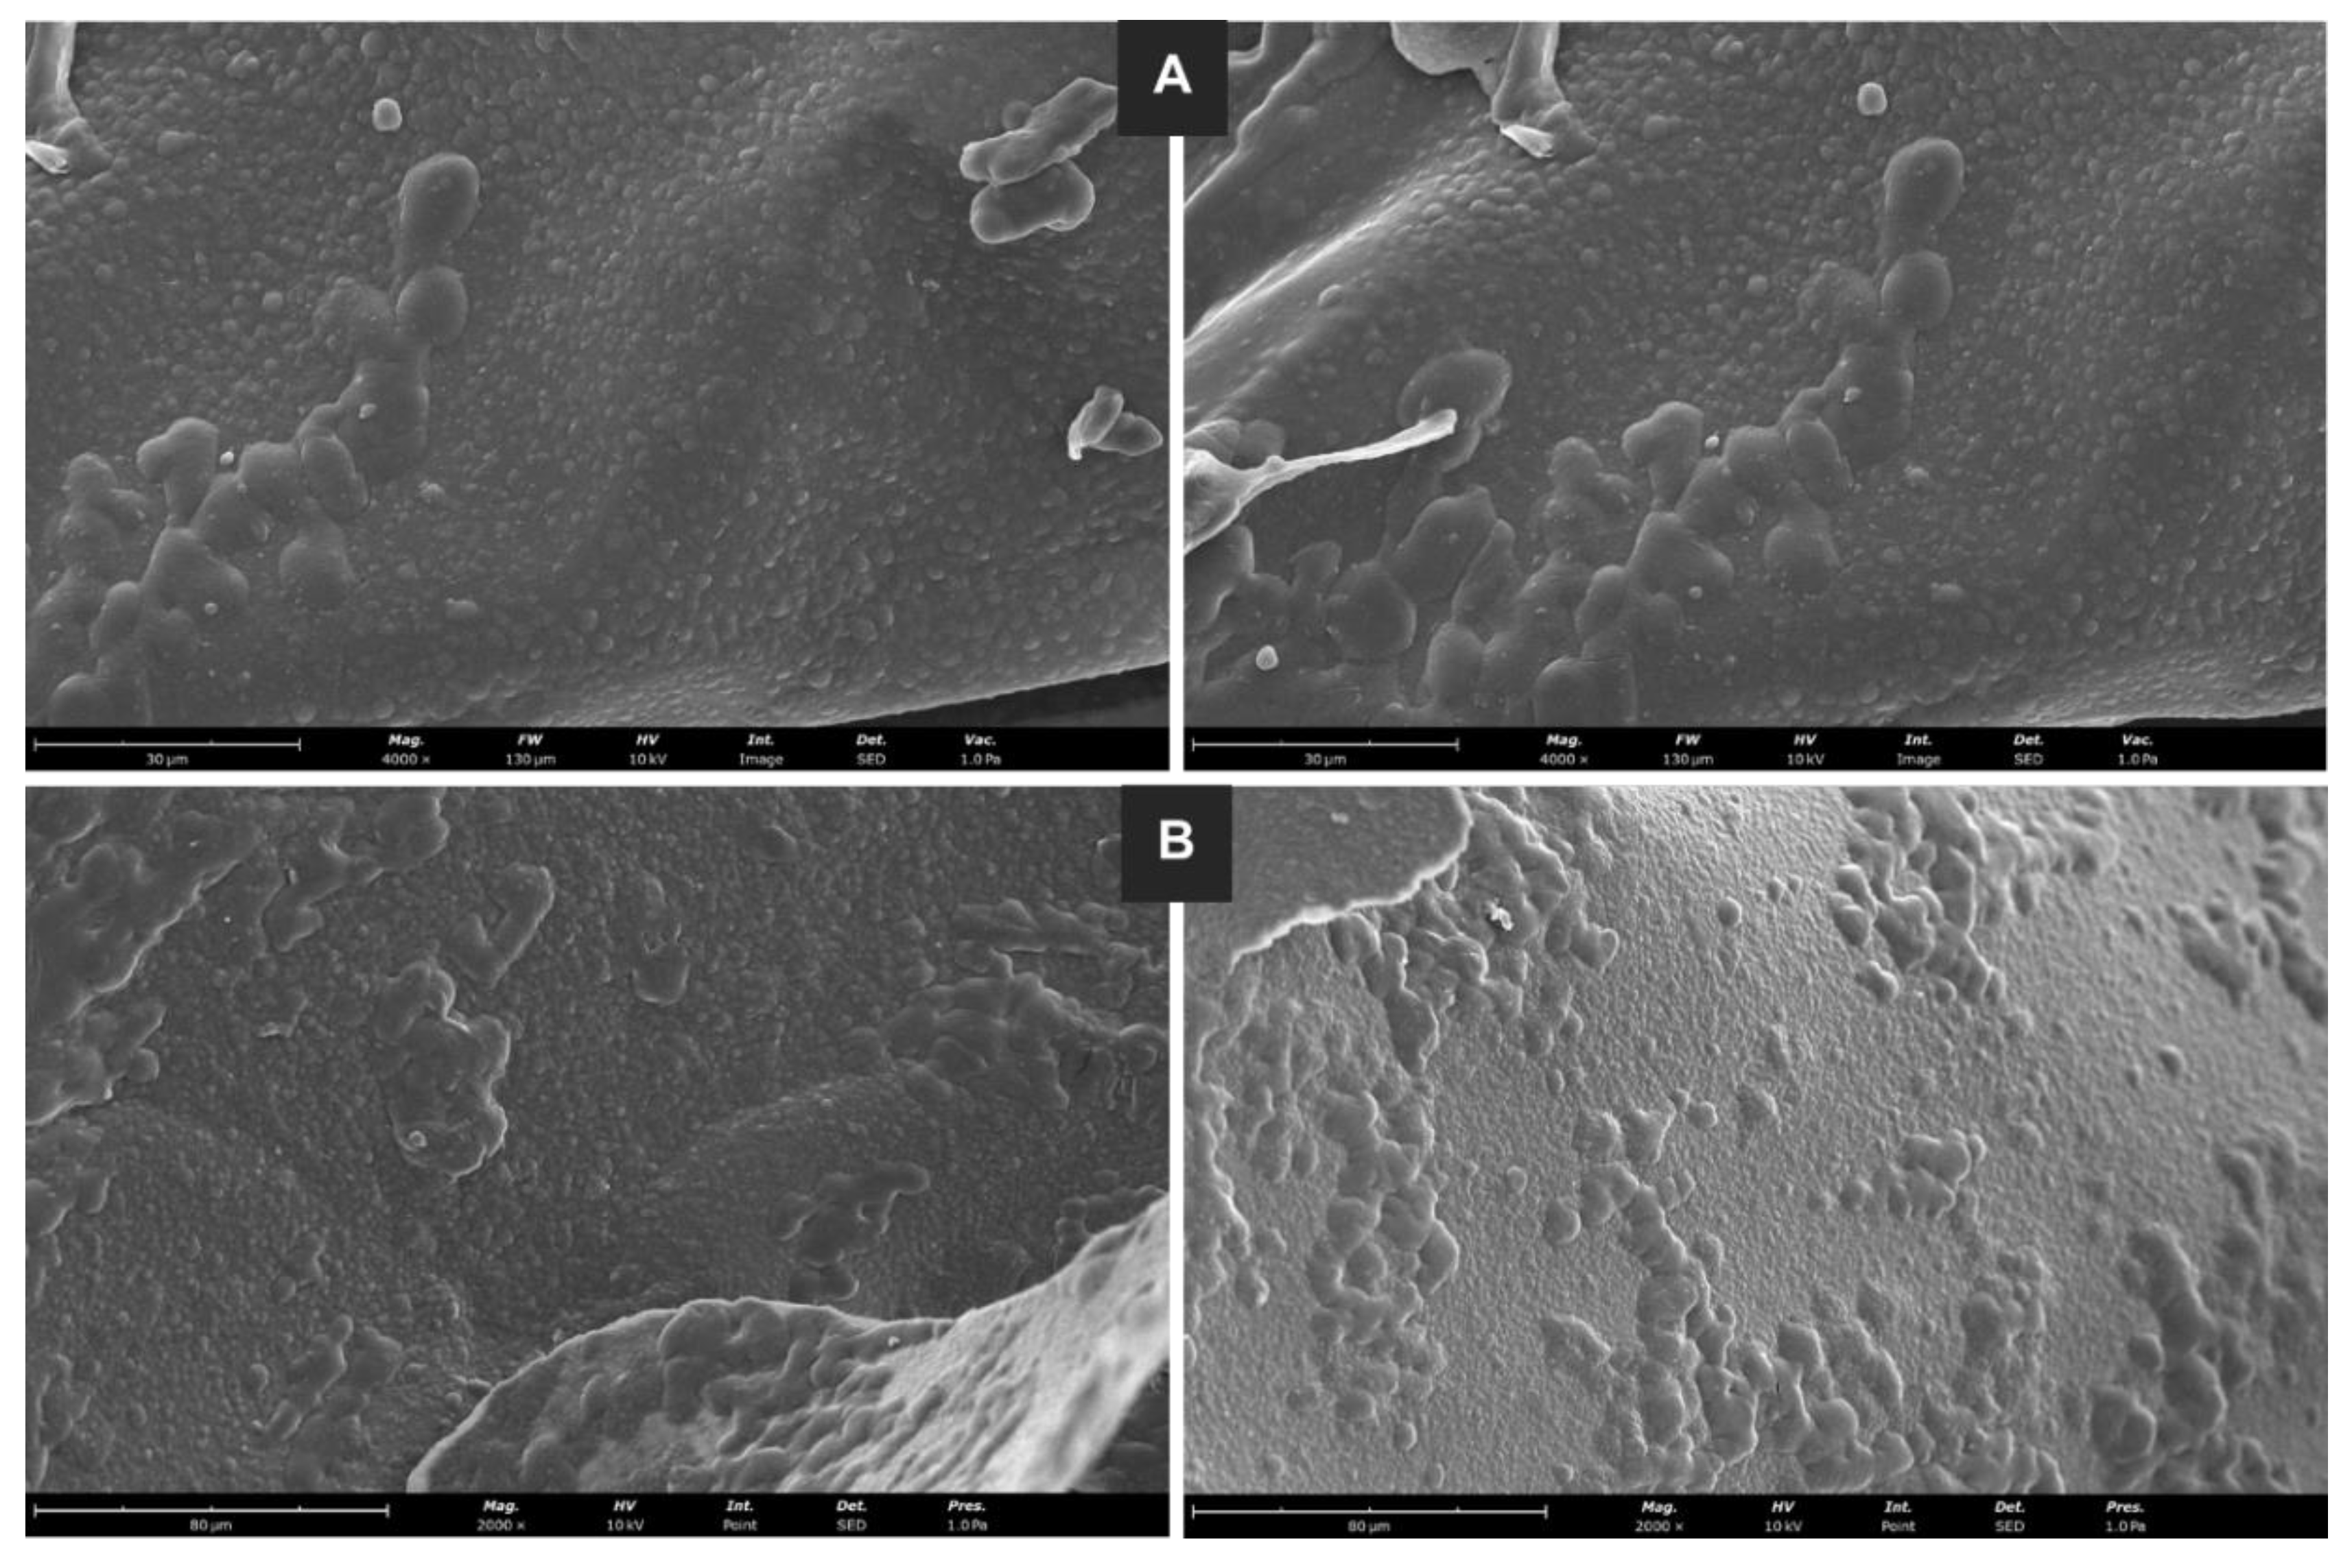
Figure 7.
FTIR spectra of empty and GSE-OV-loaded liposomes.
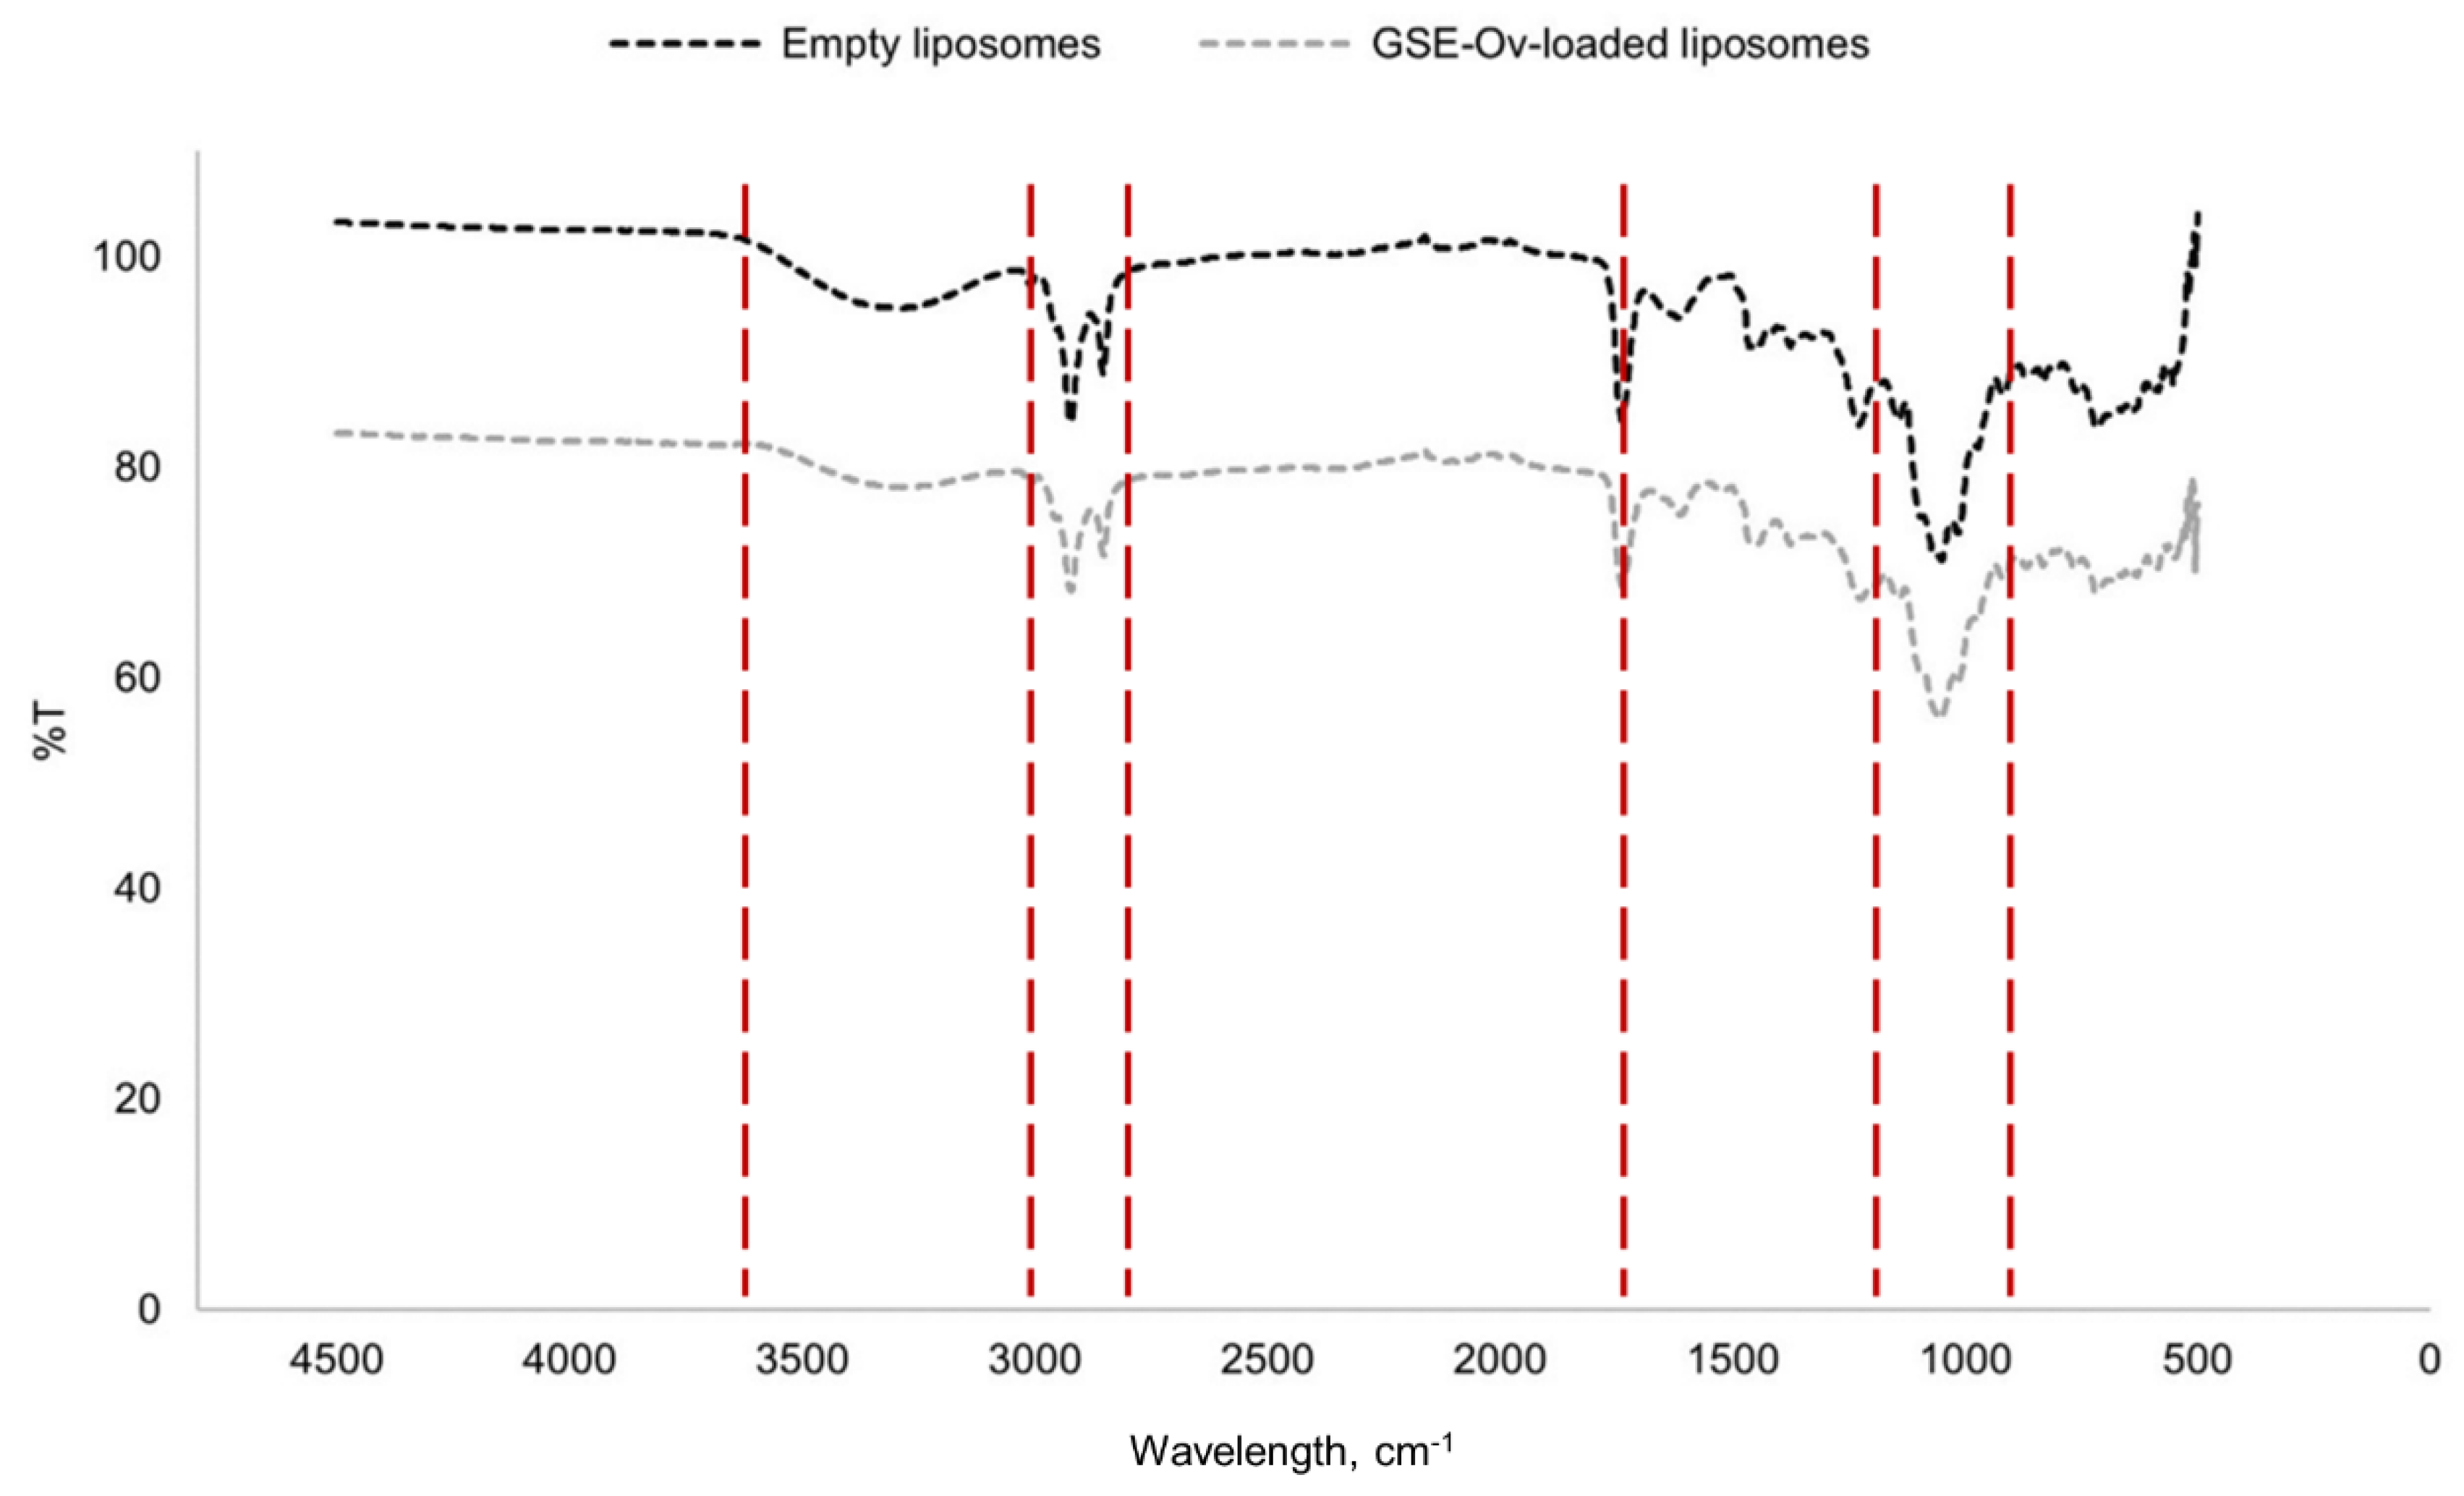
Figure 8.
Cytotoxicity study of GSE-Ov, GSE-Ov-loaded liposomes, and empty liposomes on HaCaT and HDF cell lines.
Figure 8.
Cytotoxicity study of GSE-Ov, GSE-Ov-loaded liposomes, and empty liposomes on HaCaT and HDF cell lines.
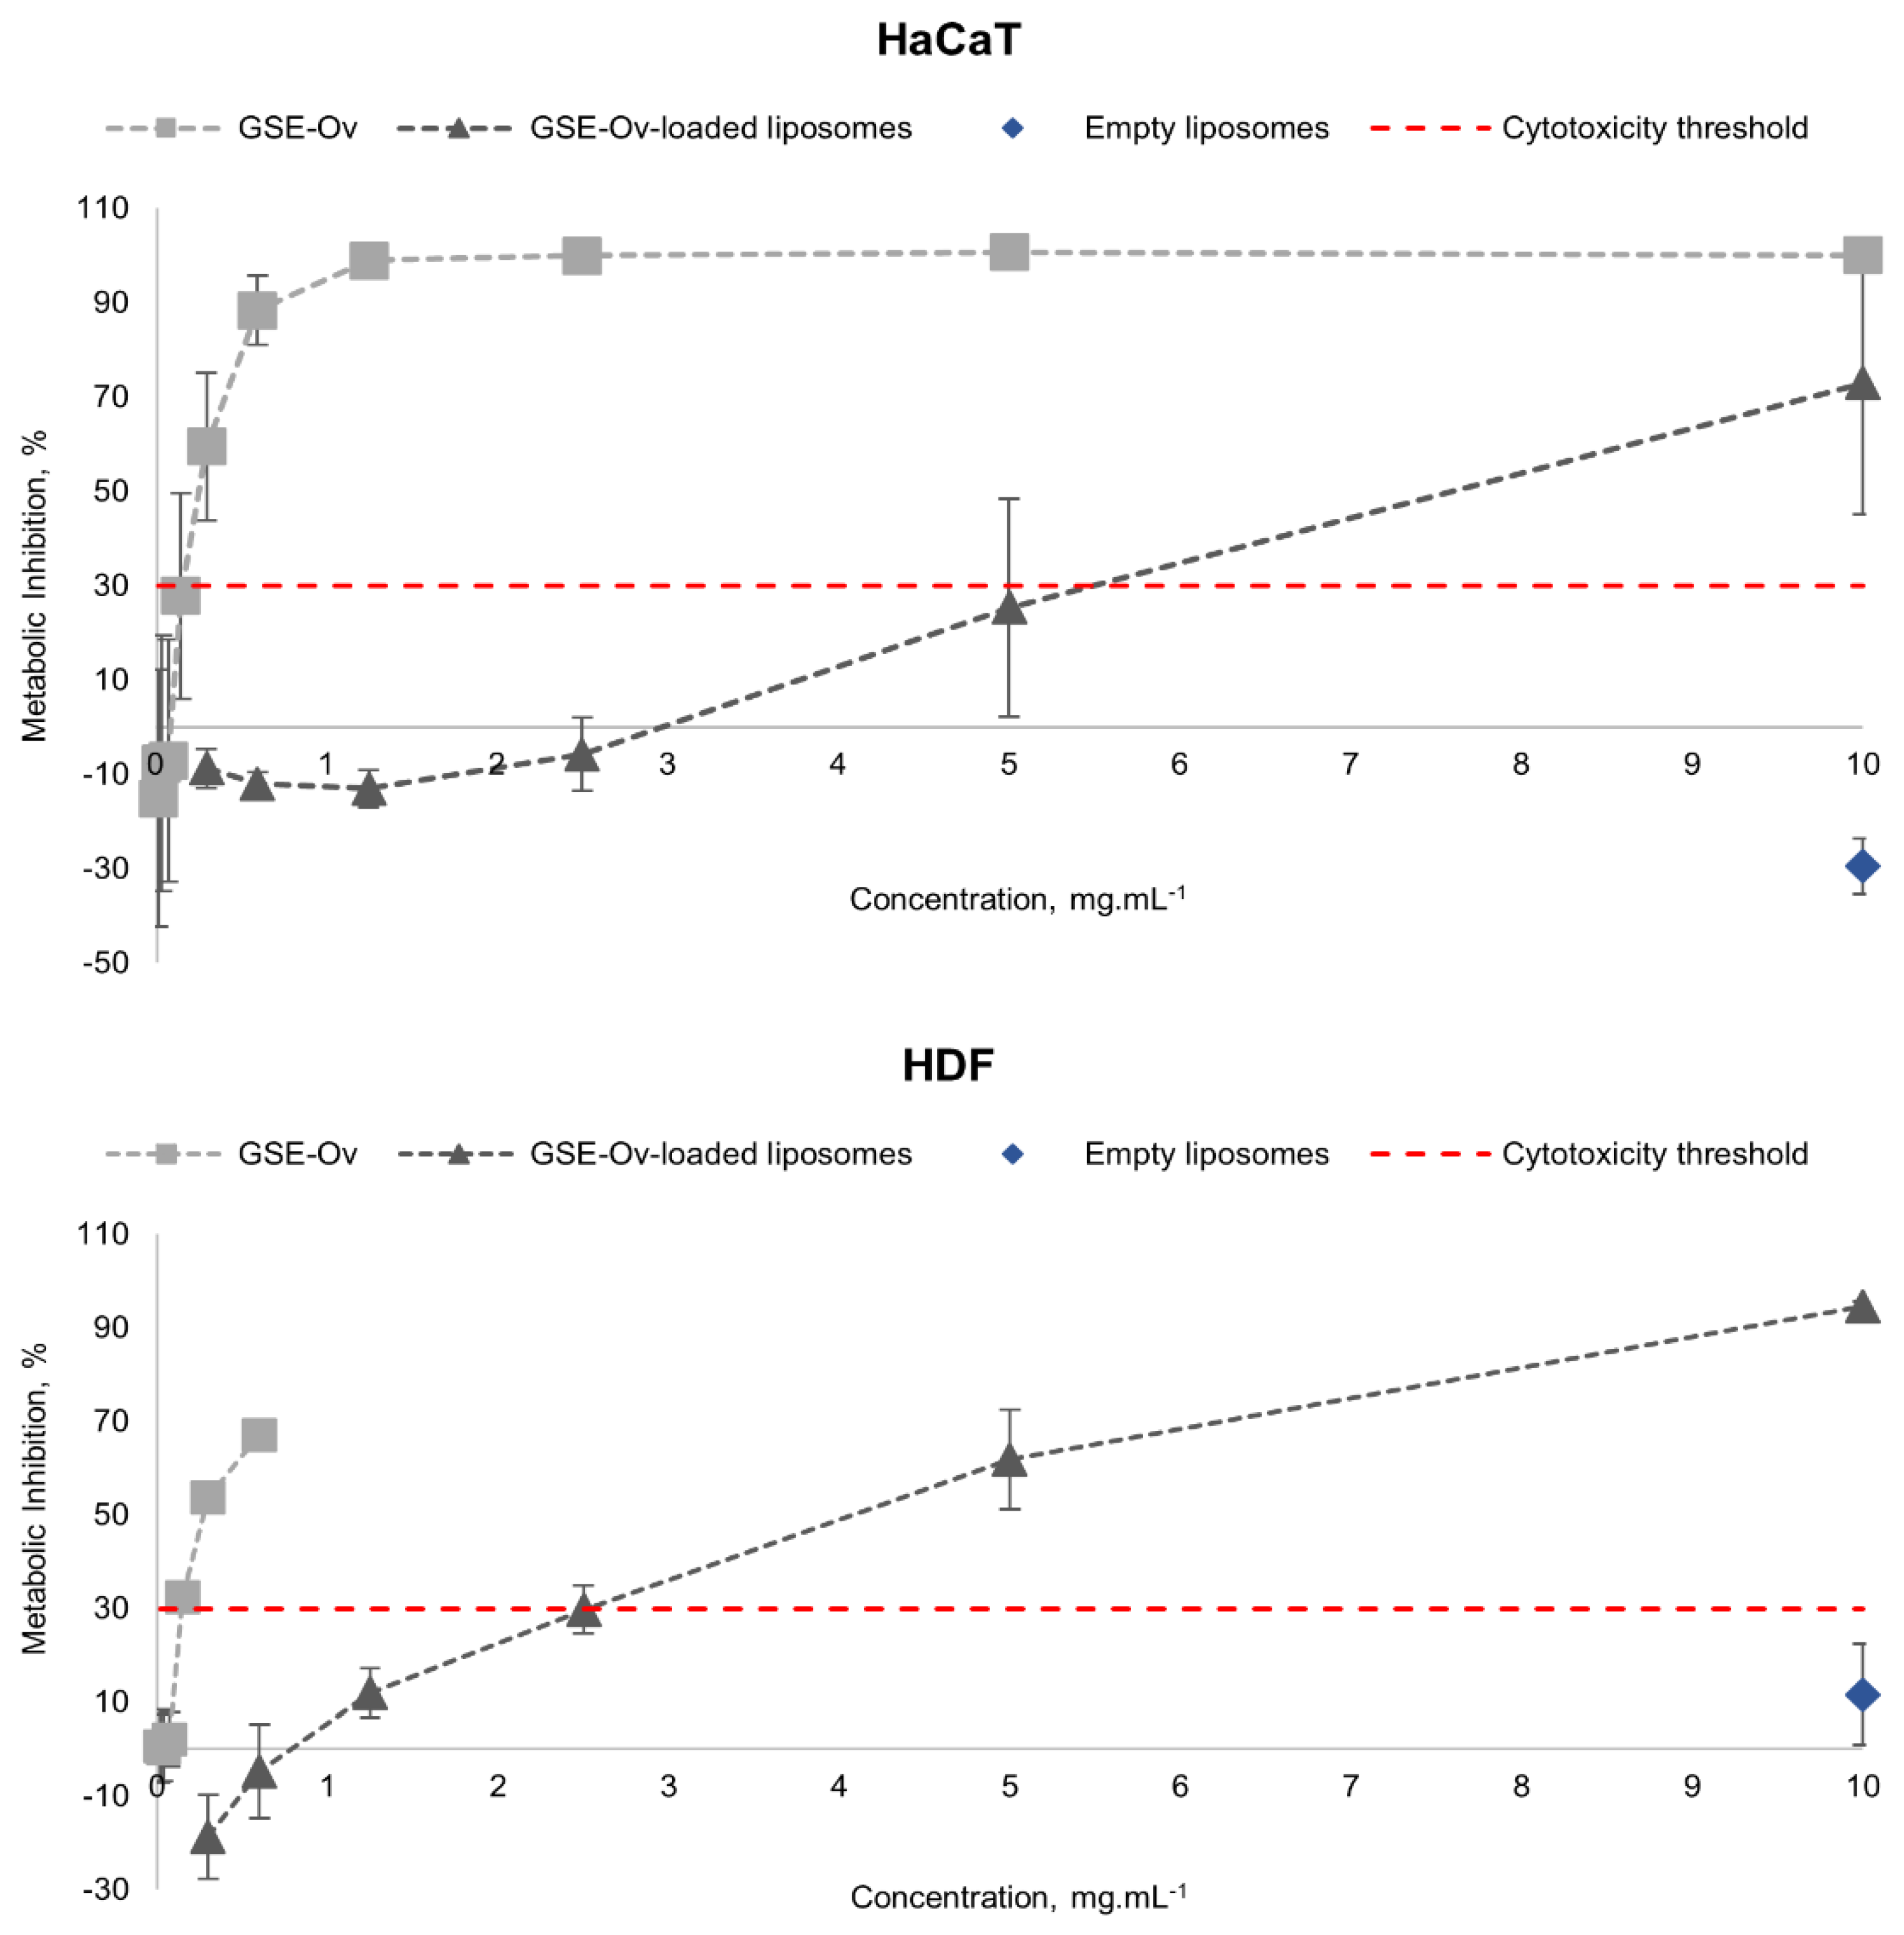
Figure 9.
Effect of GSE-Ov, GSE-Ov-loaded liposomes, and empty liposomes on keratinocytes (HaCaT) by assessing pro-inflammatory cytokines IL-1α and IL-6 levels under an inflammatory stimulus (pollution particles); Mean values (solid bars) are expressed as pg cytokine.mg-1 total protein, and standard deviations are represented by bars; * significantly different from positive control (CTR+) (p < 0.05).
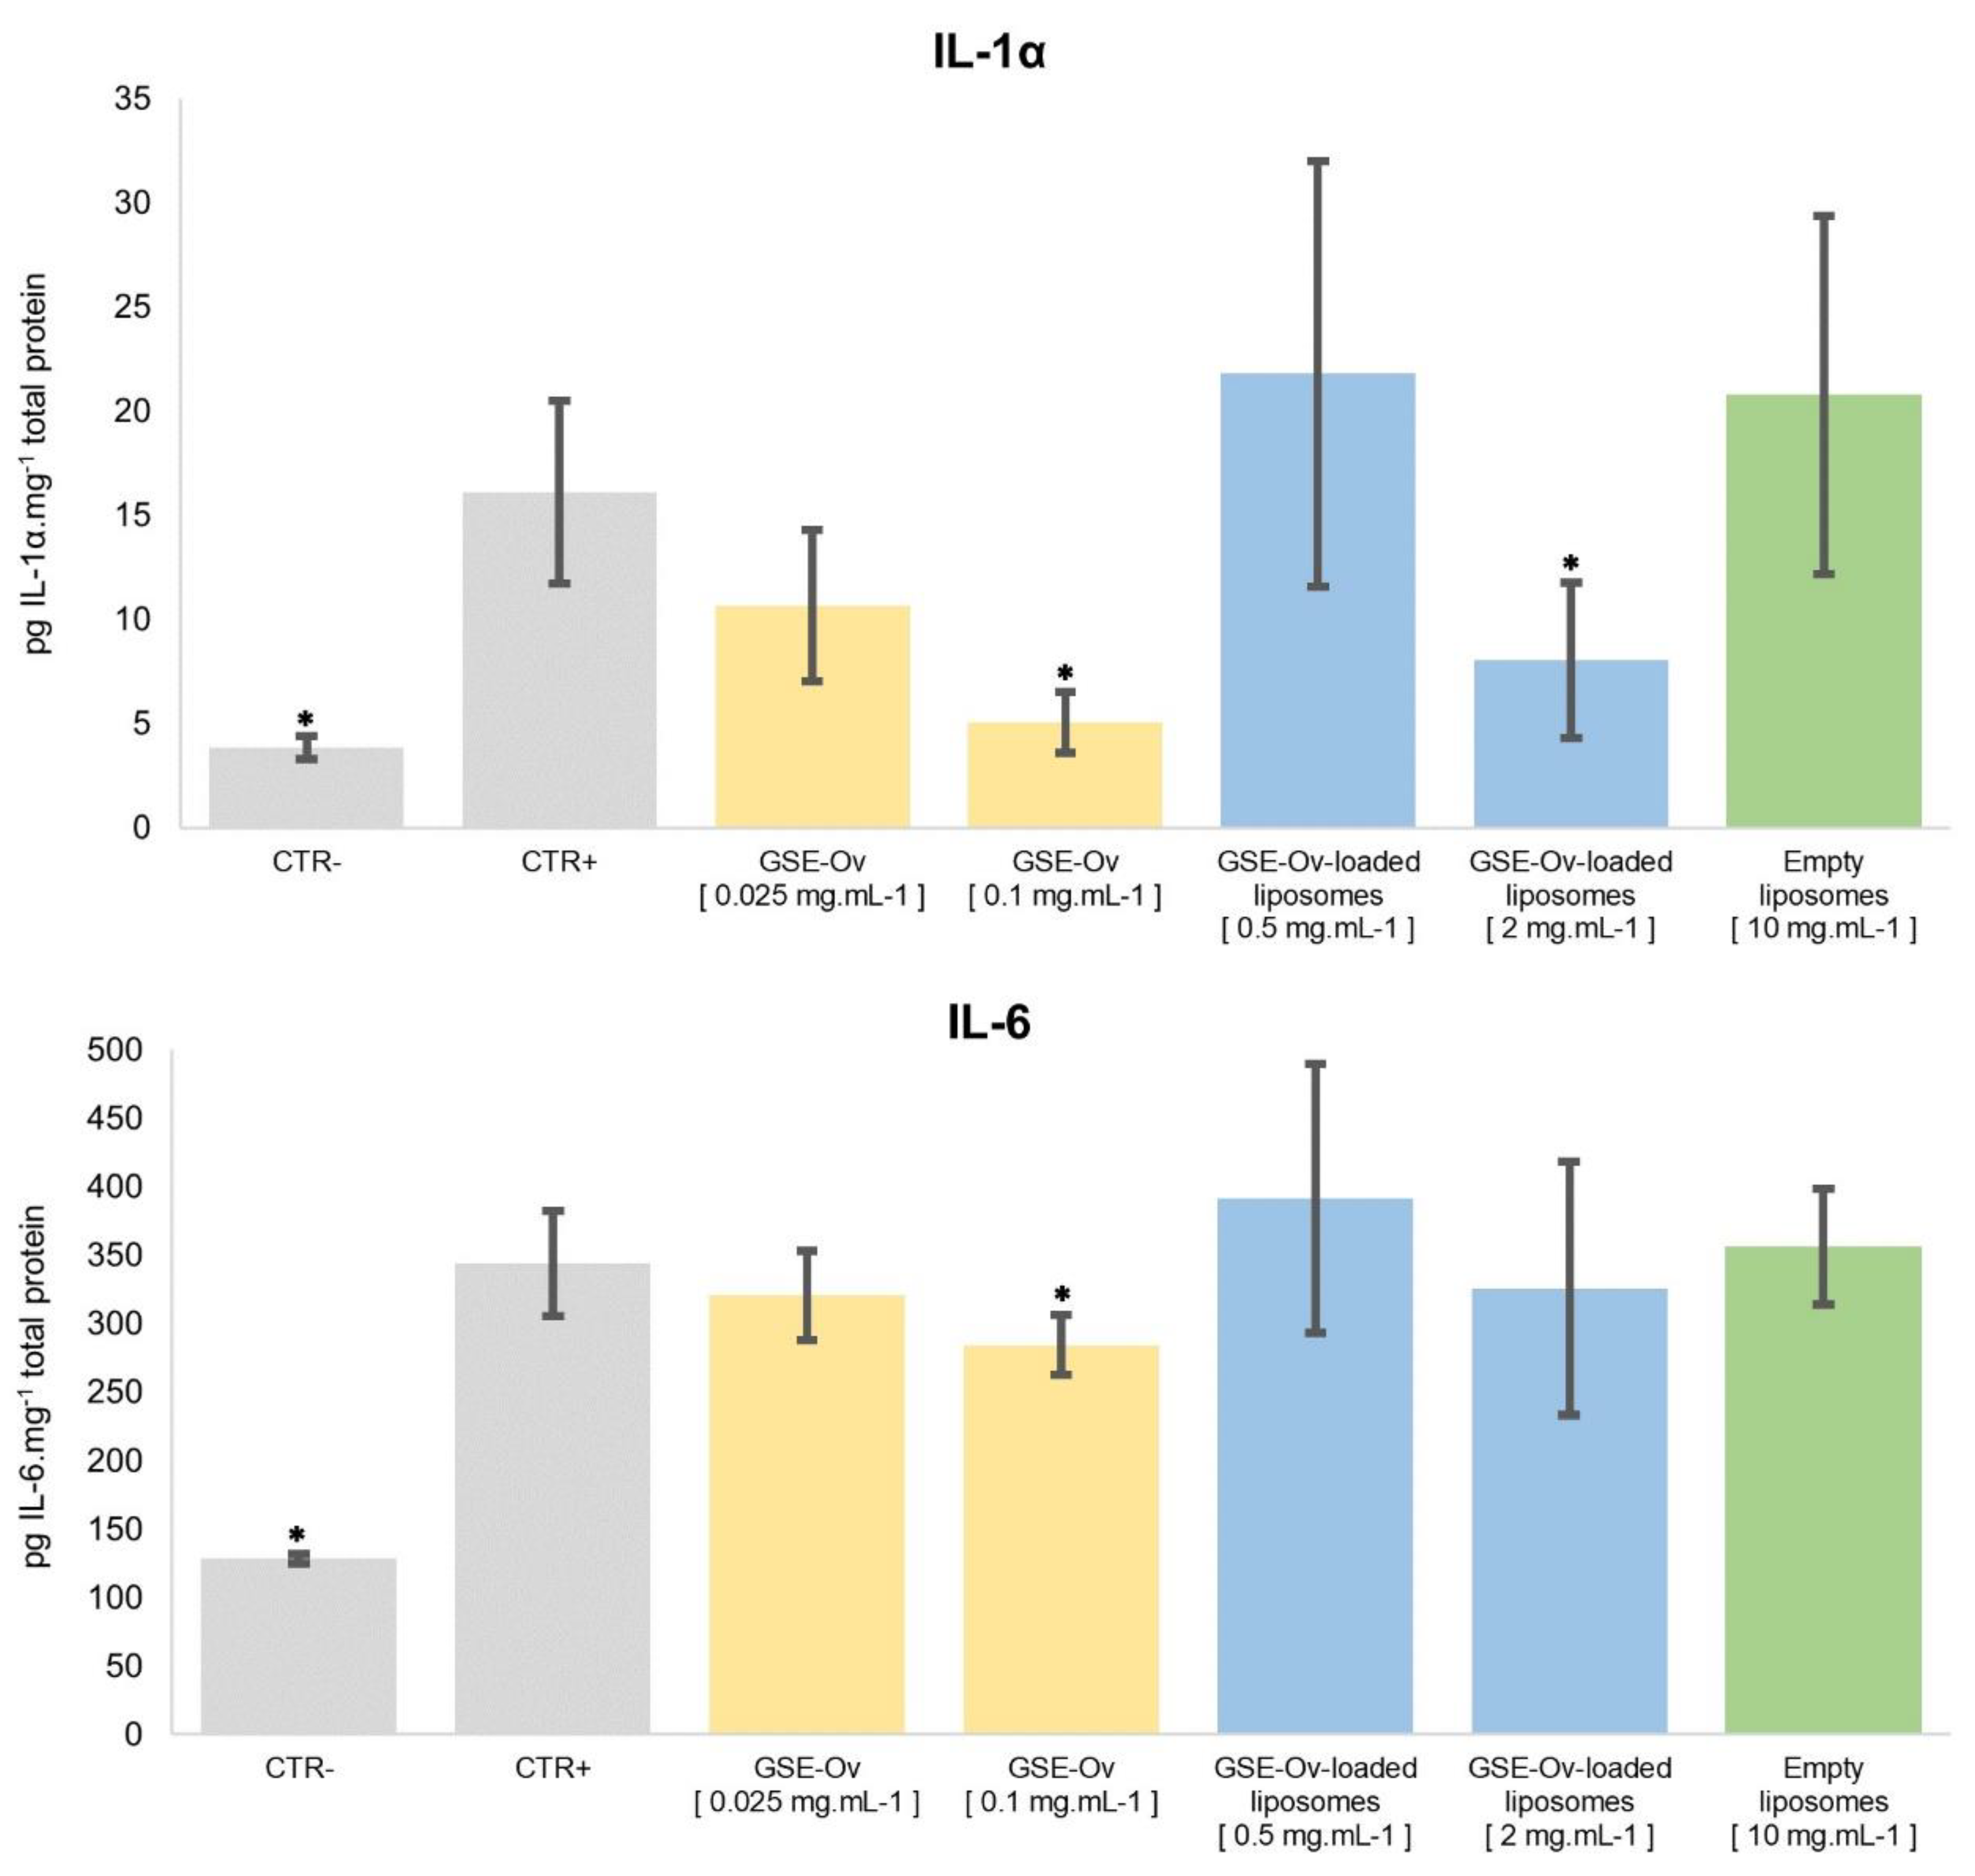
Figure 10.
Effect of GSE-OV, GSE-Ov-loaded liposomes, and empty liposomes on the production of collagen I α1 by HDF cells; Mean values (solid bars) are expressed as pg collagen.µg-1 protein, and standard deviation is represented by bars; * significantly different from control (CTR) (p < 0.05).
Figure 10.
Effect of GSE-OV, GSE-Ov-loaded liposomes, and empty liposomes on the production of collagen I α1 by HDF cells; Mean values (solid bars) are expressed as pg collagen.µg-1 protein, and standard deviation is represented by bars; * significantly different from control (CTR) (p < 0.05).
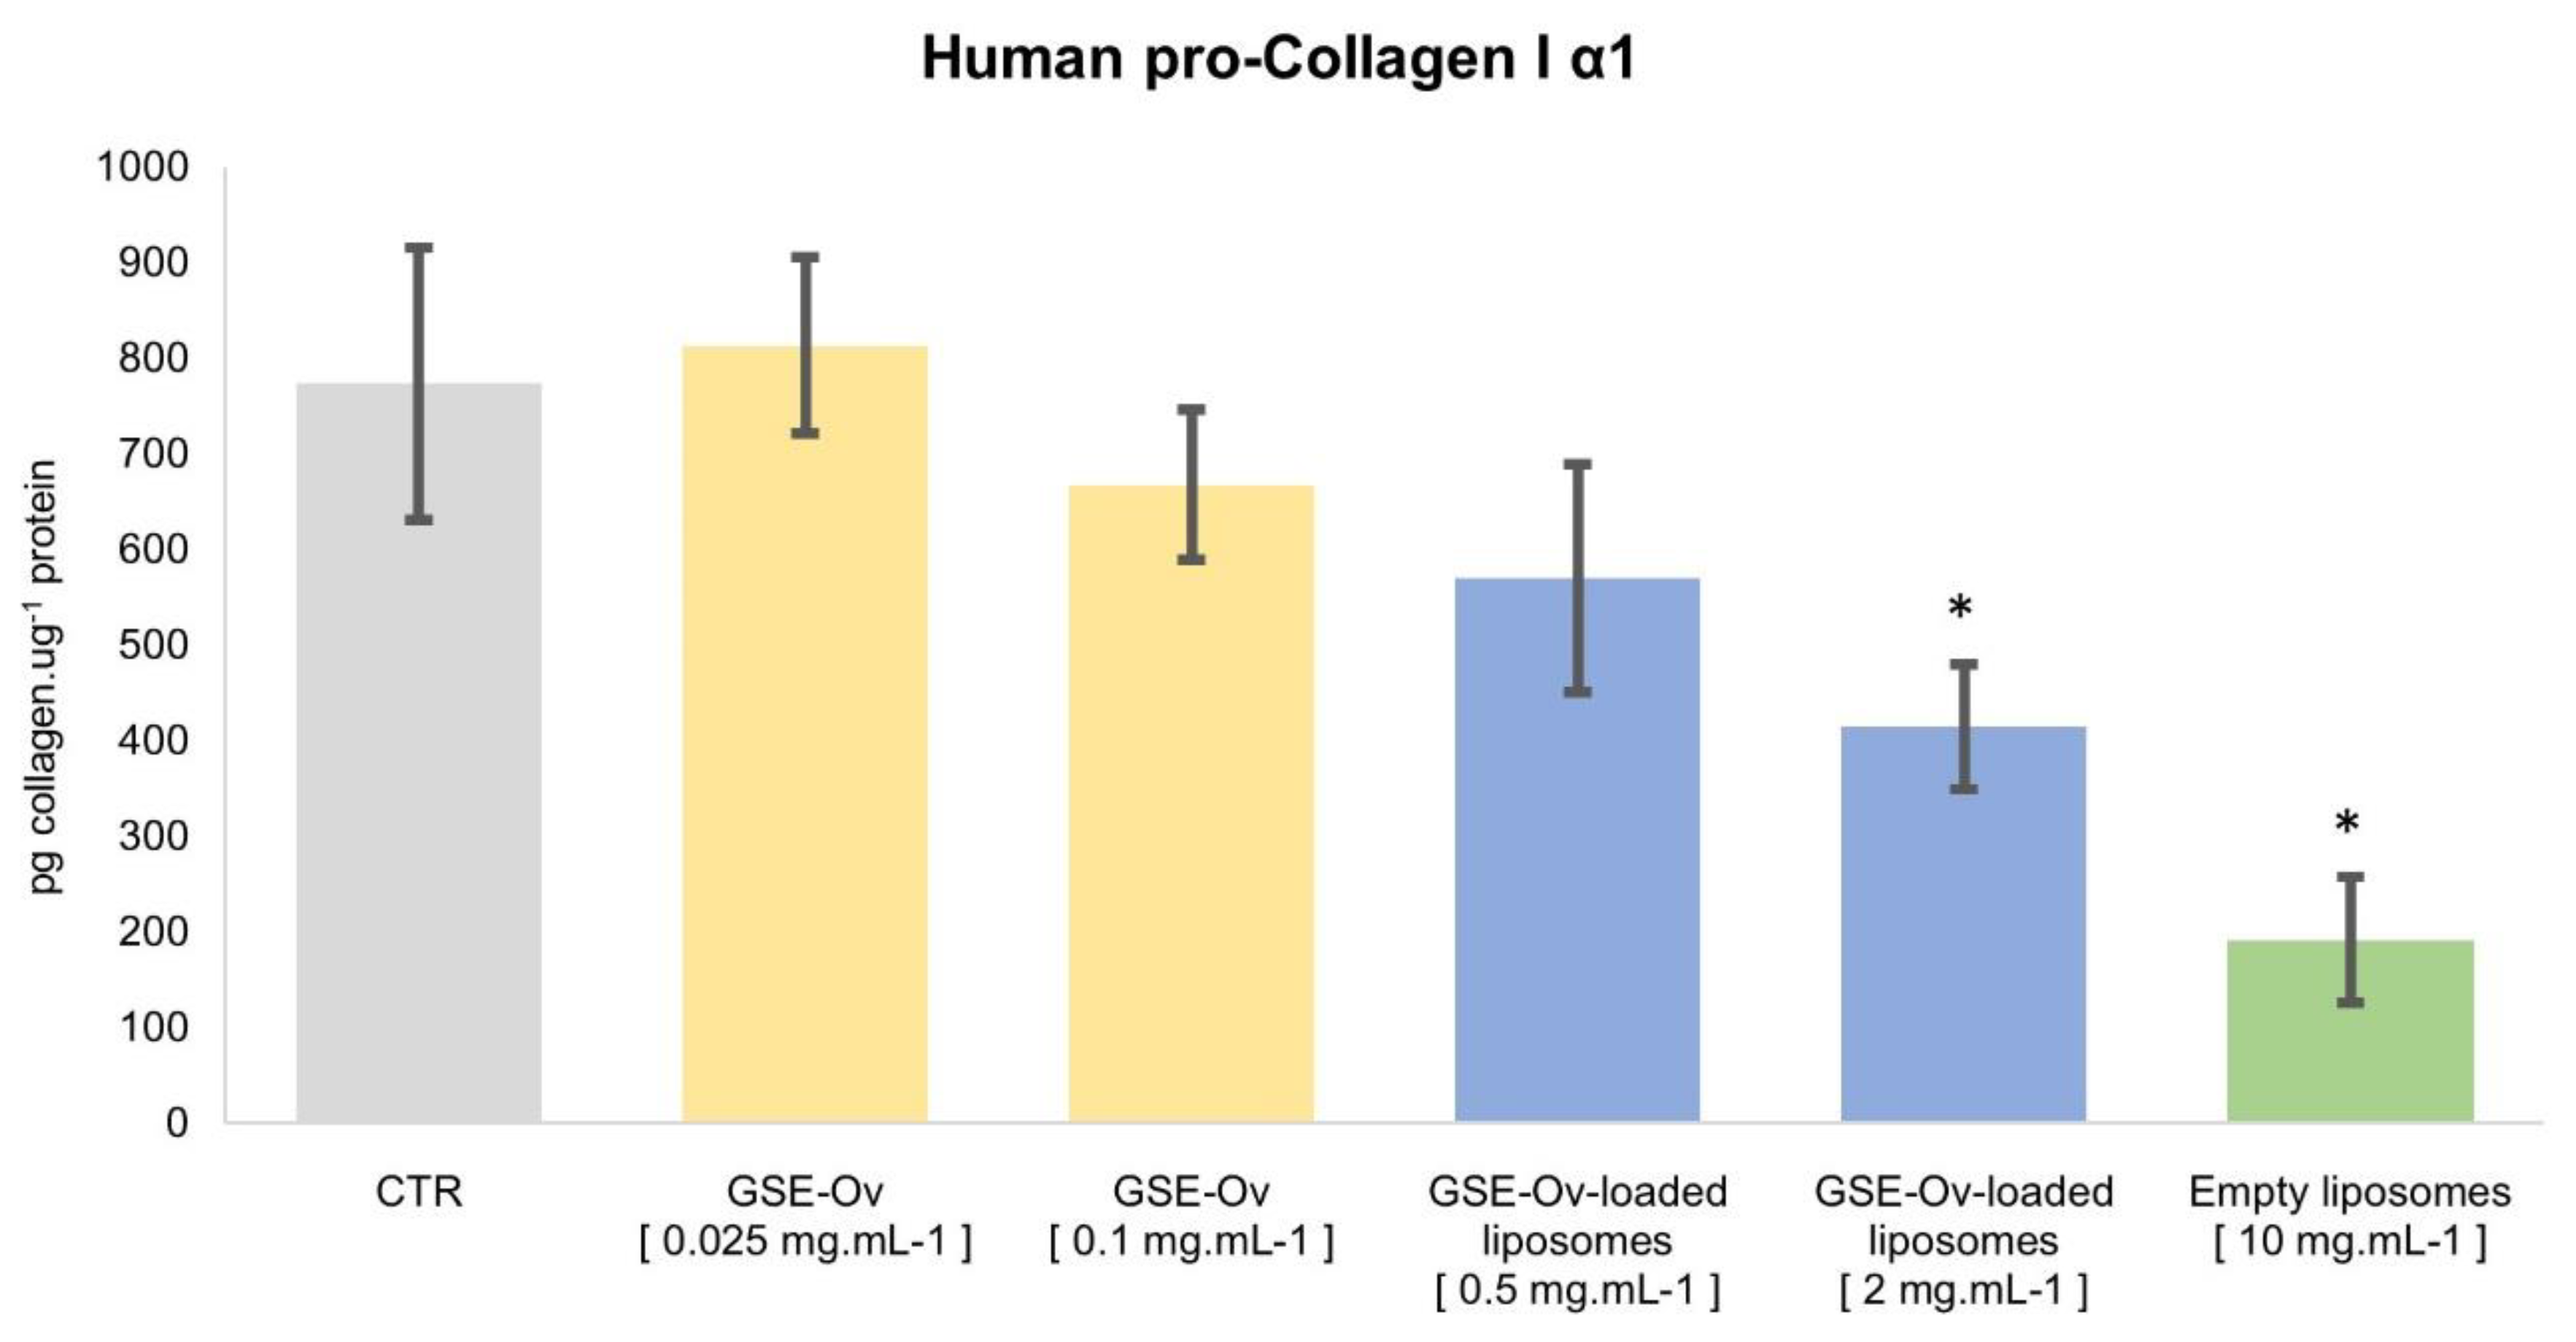
Table 2.
GSEs antimicrobial activity against Staphylococcus epidermidis, Methicillin Sensitive Staphylococcus aureus (MSSA), Methicillin Resistant Staphylococcus aureus (MRSA), and Cutibacterium acnes.
Table 2.
GSEs antimicrobial activity against Staphylococcus epidermidis, Methicillin Sensitive Staphylococcus aureus (MSSA), Methicillin Resistant Staphylococcus aureus (MRSA), and Cutibacterium acnes.
| Microorganism | GSE-Ov | GSE-Sv |
|---|---|---|
| MBC mg.mL-1 | ||
| Staphylococcus epidermidis | 50 | 50 |
| Methicillin-sensitive Staphylococcus aureus (MSSA) | 3.125 | 6.25 |
| Methicillin-resistant Staphylococcus aureus (MRSA) | 6.25 | 6.25 |
| Cutibacterium acnes | > 50 | > 50 |
Table 3.
Retention times and peak areas (A) of phenolic compounds identified in both GSEs by HPLC.
| Polyphenol | Retention Time (min) | GSE-Ov (A1) | GSE-Sv (A2) | A1 / A2 |
|---|---|---|---|---|
| Gallic acid | 6.422 | 2130502 | 52335 | 40.7 |
| Catechin | 14.274 | 2613543 | 331686 | 7.9 |
| Procyanidin B1 | 13.193 | 951038 | 26698 | 35.6 |
| Procyanidin B2 | 17.569 | --- | 386677 | --- |
Table 4.
Optimization of liposome production: values of zeta potential (ζ) and PDI / Uniformity (mean SD) for each condition.
Table 4.
Optimization of liposome production: values of zeta potential (ζ) and PDI / Uniformity (mean SD) for each condition.
| Conditions # | Process description | ζ (mV) | PDI / Uniformity |
|---|---|---|---|
| I | LFH + 1 min sonication (70% amplitude) | 2.9 | 0.008 |
| II | RPE (Reverse Phase Evaporation) method | 1.3 | 0.031 |
| III | Condition #I + GSE-Ov | 1.1 | 0.014 |
| IV | Condition #III + chitosan | 0.7 | 0.000 |
| V (final) | LFH + GSE-Ov + pectin | 2.4 | 0.637 * |
| * Uniformity was measured instead of PDI. | |||
Table 5.
Phenolic compounds release profile by the liposomes.
| Time (h) | Percentage of released GSE SD) |
|---|---|
| 1 | 0.46% |
| 2 | 0.69% |
| 4 | 0.40% |
| 6 | 0.75% |
| 24 | 0.41% |
Disclaimer/Publisher’s Note: The statements, opinions and data contained in all publications are solely those of the individual author(s) and contributor(s) and not of MDPI and/or the editor(s). MDPI and/or the editor(s) disclaim responsibility for any injury to people or property resulting from any ideas, methods, instructions or products referred to in the content. |
© 2024 by the authors. Licensee MDPI, Basel, Switzerland. This article is an open access article distributed under the terms and conditions of the Creative Commons Attribution (CC BY) license (https://creativecommons.org/licenses/by/4.0/).
Copyright: This open access article is published under a Creative Commons CC BY 4.0 license, which permit the free download, distribution, and reuse, provided that the author and preprint are cited in any reuse.


