

Submitted:
15 April 2024
Posted:
15 April 2024
You are already at the latest version
Abstract
Floods are a common natural disaster whose severity in terms of duration, water resource volume, peak and accumulated rainfall-based damage are likely to differ significantly for different geographical regions. In this paper, we first propose a novel hourly flood index (SWRI24−hr−S), derived from normalising the existing 24-hourly water resources index (WRI24−hr−S) in literature, to monitor flash flood risks on an hourly scale. The proposed SWRI24−hr−S is adopted to identify a flood situation and derive its characteristics, such as the duration (D), volume (V) and peak (Q). The comprehensive result analysis establishes the practical utility of SWRI24−hr−S in identifying flood situations at seven study sites in Fiji between 2014 and 2018 and deriving their characteristics (i.e., D, V, and Q). Secondly, this study develops a vine copula-probabilistic risk analysis system that models the joint distribution of flood characteristics (i.e., D, V, and Q) to extract their joint exceedance probability for the seven study sites in Fiji, enabling probabilistic flood risk assessment. The vine copula approach, particularly suited to Fiji’s study sites, introduces a novel probabilistic framework for flood risk assessment. The results show moderate differences in the spatial patterns of joint exceedance probability of flood characteristics in different combination scenarios generated by the proposed vine copula approach. In the worst-case scenario, the probability of any flood event occurring where the flood volume, peak and duration are likely to exceed the 95th-quantile value (representing an extreme flood event) is found to be less than 5% for all study sites. The proposed hourly flood index and the vine copula approach can be feasible and cost-effective tools for flood risk monitoring and assessment. The methodologies proposed in this study can be applied to other data-scarce regions where only rainfall data is available, offering crucial information for flood risk monitoring, assessment, and the development of effective mitigation strategies.
Keywords:
flood characteristics
; flood monitoring
; hourly flood index
; joint distribution
; risk mitigation
; vine copulas
1. Introduction
Flooding is a catastrophic natural disaster progressively growing in frequency and severity, primarily attributed to climate change-induced phenomena such as heightened rainfall intensity. Generally, there are three prevalent flood types: fluvial or river floods, pluvial or flash floods, and coastal floods. A flash flood is a sudden and severe local inundation often resulting from high-intensity rainfall (e.g., tropical cyclones, slow-moving tropical depressions, or thunderstorms) within a short period (usually less than six hours) and/or may also be caused by sudden discharge of impounded water (e.g., dam or levee failures, ice jam release, or a glacier lake outburst) [1,2]. Flash floods can affect a range of locations, including river plains, valleys, and areas with steep terrain, elevated surface runoff rates, constrained stream channels, and persistent heavy convective rainfall [1]. They often necessitate prompt action to mitigate their severe impact, typically relying on expeditious decision-making and emergency response. Flash floods make up about 85% of all floods, resulting in more than 5,000 deaths annually and causing severe social, economic, and environmental impacts [3]. The repercussions of flood disasters are more devastating in developing countries such as Fiji [4], where this study is focused. Therefore, developing a real-time flood risk monitoring tool remains an ongoing research motivation to enable an assessment of flood occurrences for early warning systems in Fiji.
Fiji experiences regular flooding events arising from orographic rainfall due to the topography of its larger islands, including Viti Levu and Vanua Levu, which have a maximum elevation of 1300 meters above sea level, along with the impact of prevailing southeast trade winds [5]. For Fiji, about 90% of its population resides in coastal areas susceptible to floods [6]. Between 1970 and 2016, Fiji faced 44 major flood events, impacting approximately 563,310 people and resulting in 103 fatalities [7]. The most catastrophic floods occurred in 2004, 2009, 2012 (including the January and March flood events), and 2014. The 2009 and 2012 events, considered among the worst in the nation’s history, resulted in over 200 million FJD in damages and losses, causing 15 fatalities and directly affecting more than 160,000 people [7]. For Fiji, the estimated average annual flood losses exceed 400 million FJD, equivalent to 4.2 percent of Fiji’s Gross Domestic Product (GDP) [7]. These are substantial losses for a small island nation with a population of less than a million and a GDP of less than 5 billion USD [8]. Under the assumption that climate change conditions will significantly increase rainfall, flood-related asset losses could exceed 5 percent of the GDP by 2050 [7]. As a result, it is imperative to develop reliable methods for accurately monitoring flood risk on near real-time (e.g., hourly) timescales to mitigate the severe impacts of flooding.
In many developing nations where flood monitoring resources, hydro-meteorological datasets and risk monitoring facilities are underdeveloped, applying a mathematically derived flood index utilising only the rainfall data provides a key incentive to assess an impending flood risk situation. Some of the key mathematical indices used previously in flood risk monitoring include the Standardised Precipitation Index () [9], the Available Water Resources Index () [10], the Weighted Average of Precipitation () [11], the Standardised () [12], the Flood Index () [13] and the Standardised Antecedent Precipitation Index () [14]. The flood indices, such as , , , and , are robust as they are designed to account for changes in antecedent or immediate past rainfall by employing a suitable time-dependent reduction function that accounts for the depletion of water resources through various hydrological processes. For example, the daily flood index, applied in Australia [13], Iran [15], Bangladesh [16] and Fiji [4] has shown good performance in monitoring flood events albeit over daily scales. Despite its benefits, one primary weakness of and other indices, such as , lies in their utilisation of daily, monthly, or annual accumulated rainfall data, which represent much longer timescales than what is required in a flash flood monitoring system. Consequently, these indices fail to adequately represent the flood risk caused by bursts of high-intensity rainfall and rapid responses leading to flash flood events.
The present study draws relevance from a pilot study conducted by Deo et al. [17] that has proposed a 24-hourly water resource index () based on the concept similar to the , which was applied in two study locations, Australia and South Korea, to monitor the flash flood risk in sustained extreme rainfall periods. The monitors flood risk by considering the contribution of accumulated rainfall in the past 24 hours, whereby the rainfall contribution from the preceding hours is subjected to the time-dependent reduction function that accounts for the depletion of water resources through various hydrological processes such as evaporation, percolation, seepage, runoff, and drainage [17]. However, unlike and , which are normalised values derived from the Antecedent Precipitation Index () and the , respectively, the identification of flood events and the computation of their characteristics are not achievable with the current form of , primarily because this index is unnormalised and does not enable objective assessment of flood risk.
To comprehensively understand flood risks, it is essential to calculate the flood characteristics, including the volume (V), peak (Q) and duration (D) that concurrently results in major collateral damage [14]. As the flood characteristics such as the D, V and Q are mostly interrelated, we envisage that these characteristics should be jointly considered in a multivariate analysis model to estimate the actual probability of a flood occurrence [14,18]. Importantly, any model representing the joint distribution of D, V, Q, and other crucial flood characteristics, such as the onset and withdrawal of a flood event, can provide significant insights into the relative severity of any flood event. After the initial study of Sklar [19], copula-based models became attractive in modelling interrelated variables, albeit using a multivariate approach. As such, copulas can jointly model the distribution of flood characteristics such as the D, V and Q, regardless of their marginal distributions or whether their dependence structure is linear or non-linear [14]. Vine copulas have recently shown superior capabilities in modelling flood characteristics compared to traditional Archimedean and elliptical copulas [14,20,21,22]. Therefore, this research follows a recent study by Nguyen-Huy et al. [14], which used the vine copulas to model the joint distribution of extreme flood characteristics derived using the in Myanmar. Their study has provided interesting insights into the probabilistic flood risk analysis. Besides the study of Nguyen-Huy et al. [14] in Myanmar, no prior research has applied vine copulas to analyse the probabilistic flood risk in Fiji despite flash floods being a catastrophic phenomenon in this small island nation.
The scientific contributions of this paper, with significant implications for flood risk monitoring and assessment, are threefold. Firstly, the paper advances the concept of the 24-hour water resources index pioneered by Deo et al. [17] and formulates a novel hourly flood index () (a normalised metric) by normalising the 24-hourly water resources index in such a way that enables the objective assessment of flood risk at an hourly scale. Secondly, the present study adopts the , which is computed using real-time hourly rainfall data from 2014 to 2018 obtained from the Fiji Meteorological Services (FMS), to evaluate its practical utility in identifying flood situations and computing their associated flood characteristics (i.e., D, V, and Q) for seven different study sites in Fiji. Thirdly, the present study develops the vine copula approach for the first time to model the joint distribution of D, V and Q derived from the for specific cases of Fiji’s flood events to extract their joint exceedance probabilities for probabilistic flood risk assessment. The methodologies presented in this study aim to enhance and contribute to the existing monitoring and early warning systems for flash floods in Fiji and their potential application to other flood-prone regions around the globe.
The rest of the paper is structured as follows. Section 2 provides information on the study area, the dataset used, and data pre-processing steps. It also encompasses the mathematical methodology for computing the hourly flood index and the flood characteristics. Additionally, it provides details on Vine copula models and equations used for computing the joint exceedance probability of flood characteristics. Section 3 provides the results and discussion. Section 4 highlights the key findings, the study’s limitations, and insights for future research.
2. Materials and Methods
2.1. Study Area
The proposed copula-probabilistic flood risk analysis system based on the hourly flood index is applied to geographically diverse sites in Fiji. Fiji is located in the South Pacific Ocean at a latitude of 15°S to 22°S and a longitude of 177°W to 174°E (see Figure 1) [23], with a tropical maritime climate characterised by warm temperatures throughout the year [24]. The nation comprises an archipelago of 332 islands, 111 of which are permanently inhabited, with a total land area of about 18,333 km2 [24]. Viti Levu (10,400 km2) and Vanua Levu (5,540 km2) are two large mountainous islands covering about 87% of the total land area [23].
Fiji has a distinct dry season (May-October) and wet season (November-April). This seasonal variation is mainly attributed to the South Pacific Convergence Zone (SPCZ), the primary rainfall-producing system for the region, which lies typically over Fiji during the wet season [23,25]. The rivers and stream basins in Fiji are predominantly small in size and flow from steep mountainous terrain, resulting in rapid shifts in water levels during periods of intense rainfall, which can lead to flash floods within a few hours [26]. This study included sites only in Viti Levu due to the lack of rainfall data in other locations. These sites are areas in Fiji prone to recurrent and severe flooding events. Figure 2 shows the map of the study area and the corresponding study sites.
2.2. Dataset
The rainfall data for Lautoka, Sigatoka, Nasinu, Rakiraki, Navua, Nadi, Ba, and Tavua sites from 1st January 2014 to 31st December 2018 (5 years) were successfully acquired from the Fiji Meteorological Services. The rainfall data was provided in 5-minute intervals for Tavua, Rakiraki, Nasinu, Sigatoka, and Lautoka and in 10-minute intervals for Ba, Nadi, and Navua sites. During the data pre-processing phase, the rainfall data for each site was aggregated to obtain the hourly rainfall needed for this study. If at least 66.67% of the data points (i.e., at least 4 out of 6 data points for a 10-minute interval and at least 8 out of 12 data points for a 5-minute interval) were available for a particular hour, they were summed to determine the total rainfall for that hour. Otherwise, the rainfall value for that hour was marked as missing. This approach was adopted to maximise the recovery of data values.
Table 1 summarises the hourly rainfall datasets and geographic settings of the study sites. The Ba site, which had a high percentage of missing values, was excluded from this study. The remaining sites had less than 5% missing values; therefore, any gap-filling method could fill in the missing values [27]. Based on the study by Oriani et al. [28], the Iterative K-nearest Neighbour (IKNN) technique was used to fill in all the missing data. The data from 1st January 2014 to 31st December 2018 were used for all the computations. However, followed by were calculated from 2nd January 2014 as antecedent rainfall of 24 hours (the hourly rainfall data for 1st January 2014) was necessary to allow the calculations of these metrics.
2.3. Development of Hourly Flood Index and Vine Copula Model
2.3.1. Hourly Flood Index and Flood Characteristics
This research formulates a novel hourly flood index (), which is a normalised version of the 24-hourly water resources index () proposed by Deo et al. [17]. Applying this index to Fiji gives a significant advantage because it is mathematically derived using only the hourly rainfall data, which are readily available for the present study sites. The proposed is implemented using the Python programming language.
The following steps are taken to obtain the . The first step is calculating the . The for the current (ith) hour proposed by Deo et al. [17] is given by the following equation:
where is the total rainfall recorded an hour before, is the total rainfall recorded 2 hours before, and so on; W is the time-reduction weighting factor (W = 3.8) verified by Deo et al. [17] that incorporates the contributions of accumulated rainfall in the latest 24 hours. This weighting factor ensures that the decay of accumulated rainfall or its potential impact on a flood event depends on several hydrological effects such as evapotranspiration, percolation, seepage, run-off, drainage, etc. in accordance with earlier works, see Lu [11], Deo et al. [17]. The substitution of W = 3.8 into Equation 1 yields:
Notably, the for a current () hour is expected to accumulate 100% of rainfall received an hour before, ≈74% of that received two hours before, ≈ 61% of that received three hours before, and eventually, ≈2% of that received 24 hours before.
After calculating for any study period, the mathematical form of for a current () hour is calculated as a normalised version of :
where is the mean monthly maximum values of for the respective study period and is the standard deviation of the monthly maximum values of for the respective study period.
For the purpose of this paper, we follow the notion that if the magnitude of for the current () hour is greater than zero (or that the water resources are higher than normal), it is regarded as a flood situation. In this paper, we defined flood characteristics using a running-sum methodology of Yevjevich [29], which has also been used by several other studies such as Deo et al. [13], Moishin et al. [4] and Nguyen-Huy et al. [14]. With reference to Figure 3, the flood duration, D, is estimated as the number of hours between the start of a flood, , and the end of a flood, , derived from the time-series. In accordance with the onset of a flood, the volume of the flood, V, is calculated as the sum of all values of between and of a flood situation, and the peak of the flood, Q, is determined as the maximum during any flood situation.
Equations 4-6 shows the mathematical equations used to calculate the flood characteristics before developing the copula-probabilistic flood risk analysis model.
where, SWRI24-hr-S > 0
where, and are the onset and end timestamps of a flood situation, respectively.
To demonstrate the practical use of for hourly risk flood monitoring, Figure 3 illustrates the applied to identify flood events in January 2014 at the Nadi site located in the western division of Fiji. As illustrated in Figure 3, the onset timestamp of the flood situation, i.e., the exact hour when the magnitude of starts to rise above zero, was on the 29th of January 2014 at 8 a.m. To verify this particular flood situation, we now refer to the report from the FMS [30], which showed indeed that an active trough that caused widespread rain across Fiji was noticeable from the 29th to the 30th of January 2014 and resulted in flooding, particularly in the western division of Fiji, where this study site is located. Thus, this verification confirms that the proposed has correctly identified this flood event, demonstrating its practicality in identifying a flood situation at an hourly scale.
To further verify the potency of the for the hourly flood risk monitoring, in Figure 4, the is plotted alongside the hourly rainfall data for the same study site during the same period. Compared to the or the raw hourly rainfall data, the simplifies the process of identifying a flood situation. This is because a simple criterion, , provides a good indicator of flood risk, which is impossible when using the and the raw hourly rainfall values.
2.3.2. Joint Exceedance Probability Between Flood Characteristics
For a comprehensive flood risk assessment, this study follows the original approach of Nguyen-Huy et al. [14] to develop vine copula-based joint exceedance probability models. This task entails developing a multivariate analysis system of flood characteristics that considers the joint exceedance probability of a flood duration D, volume V and peak Q for the present study sites. This study specifically aimed to estimate the probability that the duration, volume, and peak were concurrently greater than or equal to some threshold scenarios, as presented below:
Equation 7 requires the modelling of a joint distribution function of such three variables, ). Thus, in this study, we have developed a copula-based model, described in the following section, to estimate the joint exceedance probability of the flood characteristics, i.e., D, V and Q to perform a probabilistic flood risk analysis.
2.3.3. Copula Analytical Approach
A copula is a function that links univariate marginal distribution functions of random variables to form a joint cumulative distribution function (JCDF), i.e.:
with the corresponding joint density distribution function (JPDF) in terms of marginal and copula probability density functions:
where, and are the corresponding marginal and copula PDFs, respectively. When the marginal distributions are continuous, a unique copula exists. Equations 8 and 9 demonstrate an advanced capability of copulas, allowing a JCDF of random variables to be constructed through two separate processes: (i) modelling a copula function that captures the dependence structure among correlated variables and (ii) modelling the univariate marginal distributions. This aspect of copulas presents a more flexible approach for choosing suitable univariate distribution functions to fit the observed data in practical applications. From Equation 8, the joint distribution of duration, volume, and peak given in Equation 7 can be written using copulas as:
Different copula families, such as empirical, Archimedean, extreme value, elliptical, vine, and entropy copulas, can be used to model the copula function given in Equation 10. Vine copulas, among other things, can be used to achieve the utmost flexibility in constructing the JCDF and JPDF, given in Equation 8 and Equation 9, respectively. The following section provides more details on vine copulas.
2.3.4. Vine Copulas
The vine copula was first introduced by Joe [31], whose concept was to decompose the JPDF into a cascade of iteratively conditioned bivariate copulas, also called pair copulas. While this decomposition is not unique, all possible decomposition can be organised into a graphical model called a regular vine (R-vine) [32].
Within the R-vine framework, two main types of vine copula decomposition exist: the canonical (C-vine) and drawable (D-vine) distributions. These modes determine the parametric construction of R-vine [33]. The D-vine structure is more useful when we want to consider all the mutual inter-correlations between the targeted random variables one by one. However, the C- and D-vine frameworks are the same when considering a 3-dimensional (or tri-variate) joint distribution framework [14,33].
In this study, we have focused on tri-variate cases as conducted by Nguyen-Huy et al. [14] to model the joint distribution of flood duration, volume, and peak for a detailed probabilistic risk analysis of any flood event. Figure 5 shows a graphical representation of D- and C-vine copulas in the form of trees, edges, and nodes.
In the tri-variate case where D, V and Q are modelled simultaneously, the C-vine copula is the D-vine copula with a specified centre variable, as previously mentioned. For instance, when the flood duration (D) variable serves as the centre variable, the D-vine copula depicted in Figure 5b is identical to the C-vine copula shown in Figure 5d. The edges are linked to bivariate copulas, such as the edge associated with the bivariate copula , which captures the dependence structure between D and V.
To fit the univariate marginal distribution functions, we employed the univariate local-polynomial likelihood kernel density estimation method capable of handling discrete (duration) and continuous (volume and peak) data [34]. Additionally, all bivariate copula families were utilised for modelling the vine copulas, including independence, parametric (elliptical, Archimedean, and their rotated versions), and non-parametric (transformation kernel) families [34].
To estimate the parameters of bivariate copulas, we employed maximum likelihood for parametric models and local-likelihood approximations for non-parametric models. Moreover, the modified vine copula Bayesian information criteria (mBICv) has also been employed to select the bivariate copulas and tree sequences. The vine copula models were developed using the R programming language utilising the ‘rvinecopulib’ library package [34].
3. Results and Discussion
We now provide a detailed appraisal of the hourly flood index in detecting hourly flood possibility in terms of the onset and the end timestamps, duration, peak, volume and total accumulated rainfall during any flood situation for seven study sites in Fiji over the study period (2014-2018). We also provide joint distribution model results using the newly proposed vine copulas to provide a probabilistic risk analysis framework for flash floods.
3.1. Application of Hourly Flood Index for Flood Event Analysis
The , followed by the for the study period (2014-2018), were successfully computed for each of the seven study sites. The practicality of in determining a flood situation has already been demonstrated in Figure 3. Similarly, the flood events between the 3rd and 6th of April 2016 were quantified. This was first done for the Tavua site as it was one as it was one of the severely flooding-impacted areas in the western division of Fiji [35].
Our analysis identified four flood events using the criterion, > 0 to indicate a flood situation (see Figure 6) for the Tavua site. Of four flood events, the two significant events were predominantly caused by heavy rain in the past 24 hours. The first major flood event started on the 3rd of April at 5 p.m. and ended on the 4th of April at 4 p.m. with a total duration of 23 hours, a volume of 20.37, and a peak of 2.36. Approximately 154 mm of rainfall was recorded during this event. The second major flood event started on the 6th of April at 3 a.m. and lasted for 14 hours. This flood event recorded a total volume of 8.77, with a peak of 1.03, while approximately 69.50 mm of rainfall was recorded for this event. The combined volume of all four flood events for the Tavua site between 3rd April 2016 and 6th April 2016 (96 hours) was 30.59.
The flood events for the same period were also determined for the other six sites. The flood characteristics, i.e., D, V, and Q of the floods, varied among these sites, as shown in Figure 7. The results showed that areas in the western division of Fiji were severely affected by flooding, as was reported by FMS [35] [Tavua (V≈ 30.59), Lautoka (V≈25.63), Sigatoka (V≈19.45), Nadi (V≈9.12), and Rakiraki (V≈8.79)] compared to the areas in the central division [Navua (V≈0.12) (Minor flood event), and Nasinu (No Floods)]. These results demonstrate the utility of in identifying flood situations and determining their characteristics. Consequently, the proposed can be considered a feasible and cost-effective tool to monitor the flash flood risk in Fiji. The variation in flood characteristics among our study sites demonstrates the importance of flood risk assessments for each site separately, despite the proximity of these sites, as also highlighted in the previous work by Moishin et al. [4]. Figure 8 depicts the occurrence of floods, encompassing minor events with minimal volume and potentially insignificant impacts at each of the seven study sites over 2014-2018. Over the five-year study period, a slight fluctuation in flood frequency is observed across study sites, as illustrated in Figure 8. Notably, the Tavua study site has exhibited the highest frequency, while the Nasinu study site recorded the lowest frequency of flood events.
The occurrence of frequent severe weather events, such as tropical cyclones and depressions, result in significant flood events in Fiji, and this usually occurs during the Wet season (November-April) and occasionally in the Dry season (May-October), especially in La Niña years [26]. This is evident in Figure 9, which indicates the Wet season, including May and October, experiencing high rainfall, leading to a higher frequency of flood events and greater flood volume (see Figure 10) compared to the other months. This emphasises the need for Fiji’s National Disaster Management Office (NDMO) and other relevant stakeholders to implement a comprehensive flood mitigation and resilience measure. Public education on flood safety and preparedness for the wet season is also crucial, particularly for those residing in flood-prone areas.
The annual rainfall and the occurrence of flood events across seven sites from 2014 to 2018 are illustrated in Figure 11. This figure shows that the year 2015 has experienced the lowest rainfall among all years examined. According to FMS [36], the rainfall trends in 2015 exhibited a typical El Niño pattern, characterised by below-average rainfall at most of the study stations. Consequently, there were fewer flood events, for example, see Figure 11 and a lower flood volume (Figure 12) in 2015 compared to the other years in the present study.
Table 2 lists the five severe floods at each of the seven sites during the study period. The flood severity was determined by ranking the flood events at each site based on their volume, with 1 indicating the most severe and 5 indicating the least severe. For each of the seven sites, the table displays the onset time, duration, volume, peak, total , total rain, and maximum for each flood event. Statistics such as these may aid relevant organisations in understanding past flood events at these sites, which will facilitate future flood mitigation decisions to minimise the severity of floods at these locations.
A brief analysis of the most severe flood event at each study site was performed and validated using the annual climate summaries published by the Fiji Meteorological Services to ensure that the accurately identified them. The analysis of floods in Nadi (Table 2(a)) showed that the most severe flood started on the 29th of January 2014 at 8 a.m. and recorded a volume of 157.28. This flood lasted 49 hours and reached a peak of 6.80, making it the most severe flood event with the most prolonged duration among all the study sites during the 5-year study period. During this flood event, about 1590 mm of rainfall was recorded. This flood event was described in Figure 3 and validated using Fiji’s annual climate summary for 2014 [30].
Table 2(b) shows that the most severe flood event in Lautoka recorded a total volume of 25.05. This flood event started on the 14th of January 2018 at 2 p.m. and lasted 19 hours, reaching a peak of 3.29. During this flood event, about 175 mm of rainfall was recorded. This flood event was verified using Fiji’s climate summaries 2018, which stated that heavy rainfall occurred from the 13th to the 15th of January 2018 due to an active trough of low pressure, resulting in widespread flooding [37,38].
According to Table 2(c), the most severe flood in Nasinu started on the 27th of February 2014 at 9 a.m. and lasted 18 hours. This flood had a volume of 24.90 and reached a peak of 2.83. Approximately 173 mm of rainfall was recorded during this flood event. As reported by FMS [30], the tropical depressions TD14F and TD15F caused heavy rainfall in Fiji’s central and eastern divisions between the 25th and 27th of February 2014. As a result, parts of Fiji, particularly the major river systems in the central division (where this study site is located), experienced flooding during this period [30].
The most severe flood, both in Navua (shown in Table 2(d)) and Rakiraki (shown in Table 2(e)), occurred in December 2016. For Navua, this event started on the 15th of December 2016 at 6 a.m. and lasted for 28 hours, during which it recorded a volume of 56.98 and reached a peak of 4.29. For Rakiraki, it started on the 19th of December at 5 a.m. and lasted for 21 hours, during which it recorded a volume of 33.99 and reached a peak of 4.28. Approximately 392.50 mm and 265.50 mm of rainfall were recorded during this flood event for Navua and Rakiraki, respectively. The most severe flood event that occurred at Navua and Rakiraki sites was validated using Fiji’s climate summaries 2016, which stated that the trough of low pressure and active rain bands associated with the tropical depression TD04F resulted in heavy rainfall that caused severe flooding in some parts of the country’s main island of Viti Levu (where these study sites are located) from the 12th to the 20th of December 2016 [35].
Based on Table 2(f), the most severe flood event in Sigatoka started on the 30th of January 2014, at 10 a.m. and lasted for 16 hours. This flood had a volume of 23.32 and reached a peak of 2.84. Approximately 121 mm of rainfall was recorded during this flood event. As mentioned earlier, an active trough that caused widespread rain across Fiji from the 29th to the 30th of January 2014 resulted in flooding, particularly in the western division of Fiji, where this site is located [30].
Lastly, the analysis of floods in Tavua (Table 2(g)) showed that the most severe flood started on the 8th of February 2017 at 10 a.m. and recorded a volume of 45.88. This flood lasted 23 hours and reached a peak of 4.04. During this flood event, about 238 mm of rainfall was recorded. As per FMS [39], the tropical depression TD09F affected the country between the 6th and 8th of February 2017 and led to flooding in parts of the western division of Fiji, where this study site is located.
3.2. Application of Vine Copula Model for Probabilistic Flood Risk Analysis
The frequency of flood events at each study site has been previously demonstrated in Figure 8. Similarly, the flood characteristics, i.e., D, V, and Q, for each flood event were calculated for all study sites. Table 3 shows the five-number summary, including the mean, standard deviation, skewness, and kurtosis for each flood characteristic at each study site.
Divulging deeper into the results, as shown in Table 3, the minimum flood duration was 1 hour at all study sites. The maximum flood duration, volume and peak were recorded at the Nadi site (this flood event has been previously described in Figure 3). The skewness and kurtosis information of each flood characteristic, which describes the shape and distribution of a dataset, were more than +1 and +3, respectively, for all study sites, indicating that their distribution is highly right-skewed. This means the flood characteristics dataset for all study sites contains extreme flood duration, volume, and peak values.
The results in Table 3 also show that flood characteristics exhibit high variability across all study sites in terms of their median and inter-quartile range (IQR). The median flood duration for all study sites was 3 hours, while the median volume and peak ranged from approximately 0.52 to 0.89 and 0.24 to 0.42, respectively. The IQR for flood duration, volume, and peak varied from 4 to 7 hours, 1.78 to 2.94, and 0.52 to 0.91, respectively. The high spatiotemporal variation in flood characteristics highlights the importance of modelling these characteristics simultaneously, and employing a robust model like the copulas used in this study is crucial for accurately capturing the dependence among these flood characteristics.
Conducting a comprehensive correlation analysis among the flood characteristics and understanding the relationship between each characteristic pair is another crucial step in modelling their joint distribution [14]. In this study, both Pearson’s correlation coefficient (r) and Spearman’s rank correlation coefficient () were employed to examine the relationship between each pair of flood characteristics.
The results obtained are presented in Table 4. The correlation coefficients, i.e., r and , obtained between each flood characteristic pair were statistically significant (the p-values are not shown here) at the 1% level of significance. Both correlation metrics (i.e., r and ) indicate a strong positive correlation among flood characteristics across all study sites, as shown in Table 4. However, it was noted that Spearman’s rank correlation coefficient between duration-volume and volume-peak was substantially higher than Pearson’s correlation coefficient r, ranging from 0.93 to 0.95 and 0.96 to 0.99, respectively.
A similar pattern was noted between duration and peak at most study sites. These findings imply a strong, positive monotonic correlation between flood duration with volume and peak and between flood volume and peak. In other words, as flood duration increases, volume and peak also increase at a non-constant rate that deviates from a linear relationship. The same holds for the relationship between flood volume and peak. As mentioned earlier, a benefit of employing the copula function used in this study is its ability to comprehensively capture the complex dependence among variables, irrespective of their relationship pattern.
To model the joint distribution of the flood characteristics (i.e., D, V and Q) using vine copulas to extract their joint exceedance probability in different combination scenarios, we first quantify the probability that flood duration, volume, and peak exceed specific thresholds simultaneously (see Equation 7). The thresholds were selected at 50th-quantile (median), 75th-quantile (moderate), and 95th-quantile (extreme). The quantile values of each flood characteristic were computed and subsequently averaged for all study sites, as presented in Table 5. As seen in Table 5, for example, the averaged 50th-quantile value of duration, hours. Similarly, the averaged 75th-quantile value of duration, hours and the averaged 95th-quantile value of duration, hours. As for the spatial pattern, Table 5 demonstrates a moderate variation in the quantile values of each flood characteristic across all study sites.
By applying the vine copula probabilistic model, we show the joint exceedance probabilities of the duration, volume, and peak in different combination scenarios for each study site in Figure 13, Figure 14 and Figure 15. From a flood risk analysis perspective, the present result clearly demonstrates a moderate yet notable difference in spatial patterns of the joint exceedance probability of flood event characteristics in different combination scenarios. As shown in Figure 13a, the probability of a flood event occurring where both volume and peak exceed the 50th-quantile (median) values (i.e., V≥q (0.50) = 0.622 and Q≥q (0.50) = 0.352), and the duration (D) exceeds the median (i.e., D≥q (0.50) = 3 hours), moderate (i.e., D≥q (0.75) = 6 hours), and extreme (i.e., D≥q (0.95) = 15 hours) values, were approximately 50-59%, 23-39%, and 4-10% across all study sites, respectively.
The similar probabilistic flood risk analysis was conducted with both volume and peak exceeding the 75th-quantile (moderate) values (i.e., V≥q (0.75) = 2.473 and Q≥q (0.75) = 0.821) and the duration (D) exceeding the median (i.e., D≥q (0.50) = 3 hours), moderate (i.e., D≥q (0.75) = 6 hours), and extreme (i.e., D≥q (0.95) = 15 hours) values showed that the probability of flood occurrence was approximately 18-35%, 18-28%, and 4-9% across all study sites, respectively (see Figure 14b).
In general, the probability of a flood event with volume exceeding the 50th-quantile (median) or 75th-quantile (moderate) values and both peak and duration exceeding the 95th-quantile (extreme) value was less than 5% across all study sites. In the case when both flood volume and duration exceed the 95th-quantile (extreme) value, the probability of a flood event with peak exceeding the 50th-quantile (median) or 75th-quantile (moderate) values was less than 6% across all study sites.
In the worst-case scenario, when the flood risk could be more severe, we refer to the probability of that flood event occurring where the volume, peak, and duration exceed the extreme values (i.e., V≥q (0.95) = 12.799, Q≥q (0.95) = 1.915, and D≥q (0.95) = 15 hours), was less than 5% at all study sites (see Figure 15c). These findings imply a moderate probability of a flood event characterised by median (i.e., 50th-quantile) duration, volume, and peak values across all study sites. The results also suggest that the likelihood of a flood event characterised by extreme duration, volume, and peak is exceptionally low across all study sites.
4. Conclusions, Limitations of the Study and Future Research Directions
This study has made novel contributions to flood risk monitoring and assessment by developing a mathematically convenient hourly flood index, and testing its practical use in identifying flood situations over 2014-2018 at seven different study sites in Fiji while jointly modelling the flood characteristics such as flood duration, volume, and peak using a vine copula model for probabilistic flood risk assessment.
The results have unambiguously established the practical use of the newly proposed
as a potent indicator to identify the flood situation at an hourly scale while computing the associated flood characteristics that were impossible with a 24-hourly water resources index used in literature. The results also showed that Fiji mainly experienced high rainfall during the wet/cyclone season (November to April), including May and October. Consequently, the number of flood events was higher in these months than in the other months. This highlights the critical importance of implementing comprehensive and well-structured flood preparedness and risk mitigation strategies tailored explicitly for these months characterised by heightened rainfall and food events, thus ensuring the safety and security of communities and their properties. This study also presented the flood characteristics and water-intensive properties of five severe flood events for each study site. Relevant organisations, such as Fiji’s NDMO, are expected to use these findings to understand the attributes of past flood events at these study sites. This, in turn, can support future decision-making on flood mitigation, ultimately reducing the severe impacts of such events.
The correlation analysis showed a strong positive correlation among flood characteristics. Vine copulas were applied to model the joint distributions amongst the extreme flood characteristics derived from the hourly flood index to extract their joint exceedance probability, thus providing vital information for probabilistic flood risk assessment at each study site. The results revealed moderate variations in the spatial patterns of joint exceedance probability of extreme flood event characteristics across different combination scenarios, highlighting exceptionally low probabilities of floods with extreme duration, volume, and peak at all study sites.
Despite the merits of the present study, a primary limitation of this research was the unavailability of rainfall data required for many of the flood-prone sites across Fiji. Consequently, this research was confined to selected sites within the western and central divisions of the country. As a result, this study could not perform a comparative analysis across all four divisions (i.e., the western, central, northern, and eastern divisions), which could have provided valuable insights into extreme flood risk areas in the nation. It is important to note that the Ba study site in the western division of Fiji, a frequent flooding zone, had to be excluded due to a high percentage of missing rainfall data. Therefore, in future research, our methodology can be improved with derived from satellite-based rainfall products covering a wider area, including major towns and cities, following the recent approach for Myanmar [14].
Another limitation of the present study was using a prior/fixed time-dependent reduction function with the weighting factor, W = 3.8, derived by the earlier study [17], to determine the contributions of accumulated rainfall in the latest 24 hours. As discussed, the proposed is a normalised version of an existing that used a suitable time-dependent reduction function to account for the depletion of water resources through various hydrological processes. In future, further studies can test the correctness of this weighting factor more comprehensively for study sites where the topography may vary widely. This could require a major correlation of this weighting factor against rainfall-runoff and other physical models to capture more accurately the actual value of the decay of accumulated rainfall and its impacts on a flood event [11,17]. Several tests with hydrological parameters, including evapotranspiration rates, percolation, seepage, surface run-off and drainage conditions, etc., may be required to ascertain the time-dependent reduction function for the . In regions with different decay rates of rainfall-accumulated water volume, it is crucial to incorporate them when formulating the . The proposed must also be verified for its broader adoption as an index-based risk monitoring tool. Therefore, its feasibility is expected to be demonstrated in other flood-prone regions globally in future studies, contingent on the availability of well-documented flood records for validation and hourly rainfall data.
This study has undertaken a purely mathematical-based approach to monitoring flood risk, so in future studies, it is anticipated that the proposed , in conjunction with additional data such as the catchment hydrology as well as drainage information, river flows, etc., are being utilised to develop hourly hydrograph for various sites. This approach will further cement the accuracy of flood characteristic estimation and the monitoring of flash flood events. There is also a potential to develop an innovative -based forecasting system with sufficient lead time, presenting a novel approach for early flash flood warnings in Fiji and other regions.
A key advantage of , as an hourly flood risk monitoring tool, is its simplistic mathematical formula that is easy to compute, analyse, and interpret for non-expert audiences compared to physical or hydrological models, including rainfall-runoff models for flood risk monitoring that involves complex development. However, in future, especially in varied hydrological and topographic settings, it is crucial to comprehensively compare the proposed with other established flood monitoring systems, including a Flash Flood Guidance System (FFGS).
Despite these limitations, using has demonstrated acceptable accuracy in detecting flood situations on an hourly scale. Therefore, our proposed methodology can be considered a feasible and cost-effective tool for hourly flood risk monitoring in Fiji and perhaps elsewhere with similar geographical locations. Applying the proposed probabilistic flood risk analysis using vine copula can enhance the nation’s overall flood risk assessment and mitigation strategies.
Author Contributions
Conceptualization, R.C., T.N.-H. and R.C.D.; methodology, R.C., T.N.-H. and R.C.D.; software, R.C. and T.N.-H.; validation, R.C., T.N.-H. and R.C.; formal analysis, R.C.; investigation, R.C.; resources, T.N.-H. and R.C.D.; data curation, R.C.; writing—original draft preparation, R.C.; writing—review and editing, R.C., T.N.-H., R.C.D., S.G., and M.A.; visualisation, R.C.; supervision, T.N.-H. and R.C.D; project administration, T.N.-H. and R.C.D.; funding acquisition, T.N.-H. All authors have read and agreed to the published version of the manuscript.
Funding
This research was funded by the Asia-Pacific Network for Global Change Research grant number CRRP2023-07MY-Nguyen Huy.
Data Availability Statement
The data presented in this study are available on request from the first author, excluding some data protected by copyright.
Acknowledgments
The first author is an Australia Awards Scholar supported by the Australian Government Department of Foreign Affairs and Trade (DFAT). We thank DFAT for funding this study via the Australia Awards Scholarship Scheme 2022. The authors are also grateful to Fiji Meteorological Services for providing the rainfall data needed for this study. Disclaimer: The views and opinions expressed in this paper belong to the authors and do not represent the views of the Australian Government or the Fiji Meteorological Services.
Conflicts of Interest
The authors declare no conflicts of interest.
Abbreviations
The following abbreviations are used in this manuscript:
| API | Antecedent Precipitation Index |
| AWRI | Available Water Resources Index |
| D | Flood Duration |
| FFGS | Flash Flood Guidance System |
| FJD | Fijian Dollar |
| FMS | Fiji Meteorological Services |
| GDP | Gross Domestic Product |
| Daily Flood Index | |
| IQR | Interquartile Range |
| JCDF | Joint Cumulative Distribution Function |
| JPDF | Joint Density Distribution Function |
| mBICv | Modified Vine Copula Bayesian Information Criteria |
| NDMO | Fiji’s National Disaster Management Office |
| Probability Density Function | |
| Q | Flood Peak |
| r | Pearson’s Correlation Coefficient |
| SAPI | Standardised Antecedent Precipitation Index |
| SPCZ | South Pacific Convergence Zone |
| SPI | Standardised Precipitation Index |
| SWAP | Standardised Weighted Average of Precipitation |
| Hourly Flood Index | |
| USD | United States Dollar |
| V | Flood Volume |
| WAP | Weighted Average of Precipitation |
| 24-Hourly Water Resources Index | |
| Spearman’s Rank Correlation Coefficient |
References
- Associated Programme on Flood Management. Management of Flash Floods. Integrated flood management tools series no. 16, World Meteorological Organization, 2012. (Accessed on 11 January 2024).
- Shah, V.; Kirsch, K.R.; Cervantes, D.; Zane, D.F.; Haywood, T.; Horney, J.A. Flash flood swift water rescues, Texas, 2005–2014. Climate Risk Management 2017, 17, 11–20. [Google Scholar] [CrossRef]
- Dordevic, M.; Mutic, P.; Kim, H. Flash Flood Guidance System: Response to one of the deadliest hazards. WMO Bulletin 1, World Meteorological Organization, 2020. (Accessed on 11 January 2024).
- Moishin, M.; Deo, R.C.; Prasad, R.; Raj, N.; Abdulla, S. Development of Flood Monitoring Index for daily flood risk evaluation: case studies in Fiji. Stochastic Environmental Research and Risk Assessment 2021, 35, 1387–1402. [Google Scholar] [CrossRef]
- Sharma, K.K.; Verdon-Kidd, D.C.; Magee, A.D. A decision tree approach to identify predictors of extreme rainfall events–a case study for the Fiji Islands. Weather and Climate Extremes 2021, 34, 100405. [Google Scholar] [CrossRef]
- Davis, J.; Henion, D.; Murro, M.J. The Impacts of Coastal Flooding on Physical Infrastructure: Case Studies in Fiji, Kiribati, and Papua New Guinea. Report, Center for Excellence in Disaster Management & Humanitarian Assistance, 2022.
- Government of Fiji. Climate vulnerability assessment: Making Fiji climate resilient. Report, Government of Fiji, 2017. (Accessed on 11 January 2024).
- The World Bank Group. Data, 2024. (Accessed on 11 January 2024).
- Seiler, R.; Hayes, M.; Bressan, L. Using the standardized precipitation index for flood risk monitoring. International Journal of Climatology: A Journal of the Royal Meteorological Society 2002, 22, 1365–1376. [Google Scholar] [CrossRef]
- Byun, H.R.; Lee, D.K. Defining three rainy seasons and the hydrological summer monsoon in Korea using available water resources index. Journal of the Meteorological Society of Japan 2002, 80, 33–44. [Google Scholar] [CrossRef]
- Lu, E. Determining the start, duration, and strength of flood and drought with daily precipitation: Rationale. Geophysical research letters 2009, 36. [Google Scholar] [CrossRef]
- Lu, E.; Cai, W.; Jiang, Z.; Zhang, Q.; Zhang, C.; Higgins, R.W.; Halpert, M.S. The day-to-day monitoring of the 2011 severe drought in China. Climate Dynamics 2014, 43, 1–9. [Google Scholar] [CrossRef]
- Deo, R.C.; Byun, H.R.; Adamowski, J.F.; Kim, D.W. A real-time flood monitoring index based on daily effective precipitation and its application to Brisbane and Lockyer Valley flood events. Water Resources Management 2015, 29, 4075–4093. [Google Scholar] [CrossRef]
- Nguyen-Huy, T.; Kath, J.; Nagler, T.; Khaung, Y.; Aung, T.S.S.; Mushtaq, S.; Marcussen, T.; Stone, R. A satellite-based Standardized Antecedent Precipitation Index (SAPI) for mapping extreme rainfall risk in Myanmar. Remote Sensing Applications: Society and Environment 2022, 26, 100733. [Google Scholar] [CrossRef]
- Nosrati, K.; Saravi, M.M.; Shahbazi, A. Investigation of flood event possibility over Iran using Flood Index. Survival and Sustainability: Environmental concerns in the 21st Century, 2011; 1355–1361. [Google Scholar]
- Deo, R.C.; Adamowski, J.F.; Begum, K.; Salcedo-Sanz, S.; Kim, D.W.; Dayal, K.S.; Byun, H.R. Quantifying flood events in Bangladesh with a daily-step flood monitoring index based on the concept of daily effective precipitation. Theoretical and Applied Climatology 2019, 137, 1201–1215. [Google Scholar] [CrossRef]
- Deo, R.C.; Byun, H.R.; Kim, G.B.; Adamowski, J.F. A real-time hourly water index for flood risk monitoring: Pilot studies in Brisbane, Australia, and Dobong Observatory, South Korea. Environmental monitoring and assessment 2018, 190, 1–27. [Google Scholar] [CrossRef] [PubMed]
- Chebana, F.; Ouarda, T.B. Index flood–based multivariate regional frequency analysis. Water Resources Research 2009, 45. [Google Scholar] [CrossRef]
- Sklar, M. Fonctions de répartition à n dimensions et leurs marges. In Proceedings of the Annales de l’ISUP; 1959; Volume 8, pp. 229–231. [Google Scholar]
- Daneshkhah, A.; Remesan, R.; Chatrabgoun, O.; Holman, I.P. Probabilistic modeling of flood characterizations with parametric and minimum information pair-copula model. Journal of Hydrology 2016, 540, 469–487. [Google Scholar] [CrossRef]
- Shafaei, M.; Fakheri-Fard, A.; Dinpashoh, Y.; Mirabbasi, R.; De Michele, C. Modeling flood event characteristics using D-vine structures. Theoretical and Applied Climatology 2017, 130, 713–724. [Google Scholar] [CrossRef]
- Tosunoglu, F.; Gürbüz, F.; İspirli, M.N. Multivariate modeling of flood characteristics using Vine copulas. Environmental Earth Sciences 2020, 79, 1–21. [Google Scholar] [CrossRef]
- Feresi, J.; Kenny, G.J.; de Wet, N.; Limalevu, L.; Bhusan, J.; Ratukalou, I. Climate change vulnerability and adaptation assessment for Fiji. Technical report, The International Global Change Institute (IGCI), University of Waikato, 2000.
- Kuleshov, Y.; McGree, S.; Jones, D.; Charles, A.; Cottrill, A.; Prakash, B.; Atalifo, T.; Nihmei, S.; Seuseu, F.L.S.K.; et al. Extreme weather and climate events and their impacts on island countries in the Western Pacific: cyclones, floods and droughts. Atmospheric and Climate Sciences 2014, 4, 803. [Google Scholar] [CrossRef]
- Kumar, R.; Stephens, M.; Weir, T. Rainfall trends in Fiji. International Journal of Climatology 2014, 34, 1501–1510. [Google Scholar] [CrossRef]
- McGree, S.; Yeo, S.W.; Devi, S. Flooding in the Fiji Islands between 1840 and 2009. Risk Frontiers Technical Report, Risk Frontiers, Macquarie University, Australia 2010.
- Lo Presti, R.; Barca, E.; Passarella, G. A methodology for treating missing data applied to daily rainfall data in the Candelaro River Basin (Italy). Environmental monitoring and assessment 2010, 160, 1–22. [Google Scholar] [CrossRef] [PubMed]
- Oriani, F.; Stisen, S.; Demirel, M.C.; Mariethoz, G. Missing data imputation for multisite rainfall networks: a comparison between geostatistical interpolation and pattern-based estimation on different terrain types. Journal of Hydrometeorology 2020, 21, 2325–2341. [Google Scholar] [CrossRef]
- Yevjevich, V.M. Objective approach to definitions and investigations of continental hydrologic droughts. PhD thesis, Colorado State University, 1967.
- FMS. Fiji Annual Climate Summary 2014. Report, Fiji Meteorological Service, 2015. (Accessed on 11 January 2024).
- Joe, H. Multivariate models and multivariate dependence concepts; CRC press: United States of America, 1997. [Google Scholar]
- Nagler, T.; Krüger, D.; Min, A. Stationary vine copula models for multivariate time series. Journal of Econometrics 2022, 227, 305–324. [Google Scholar] [CrossRef]
- Latif, S.; Simonovic, S.P. Parametric Vine copula framework in the trivariate probability analysis of compound flooding events. Water 2022, 14, 2214. [Google Scholar] [CrossRef]
- Nagler, T.; Vatter, T. rvinecopulib: High performance algorithms for vine copula modeling. R package version 3, CRAN, 2023. (Accessed on 11 January 2024).
- FMS. Fiji Annual Climate Summary 2016. Report, Fiji Meteorological Service, 2017. (Accessed on 11 January 2024).
- FMS. Fiji Annual Climate Summary 2015. Report, Fiji Meteorological Service, 2016. (Accessed on 11 January 2024).
- FMS. Fiji’s Climate in 2018. Report, Fiji Meteorological Service, 2019. (Accessed on 11 January 2024).
- FMS. Fiji Climate Summary January 2018. Report, Fiji Meteorological Service, 2018. (Accessed on 11 January 2024).
- FMS. Fiji Annual Climate Summary 2017. Report, Fiji Meteorological Service, 2018. (Accessed on 11 January 2024).
Figure 1.
The geographical map shows Fiji situated in the South Pacific region.
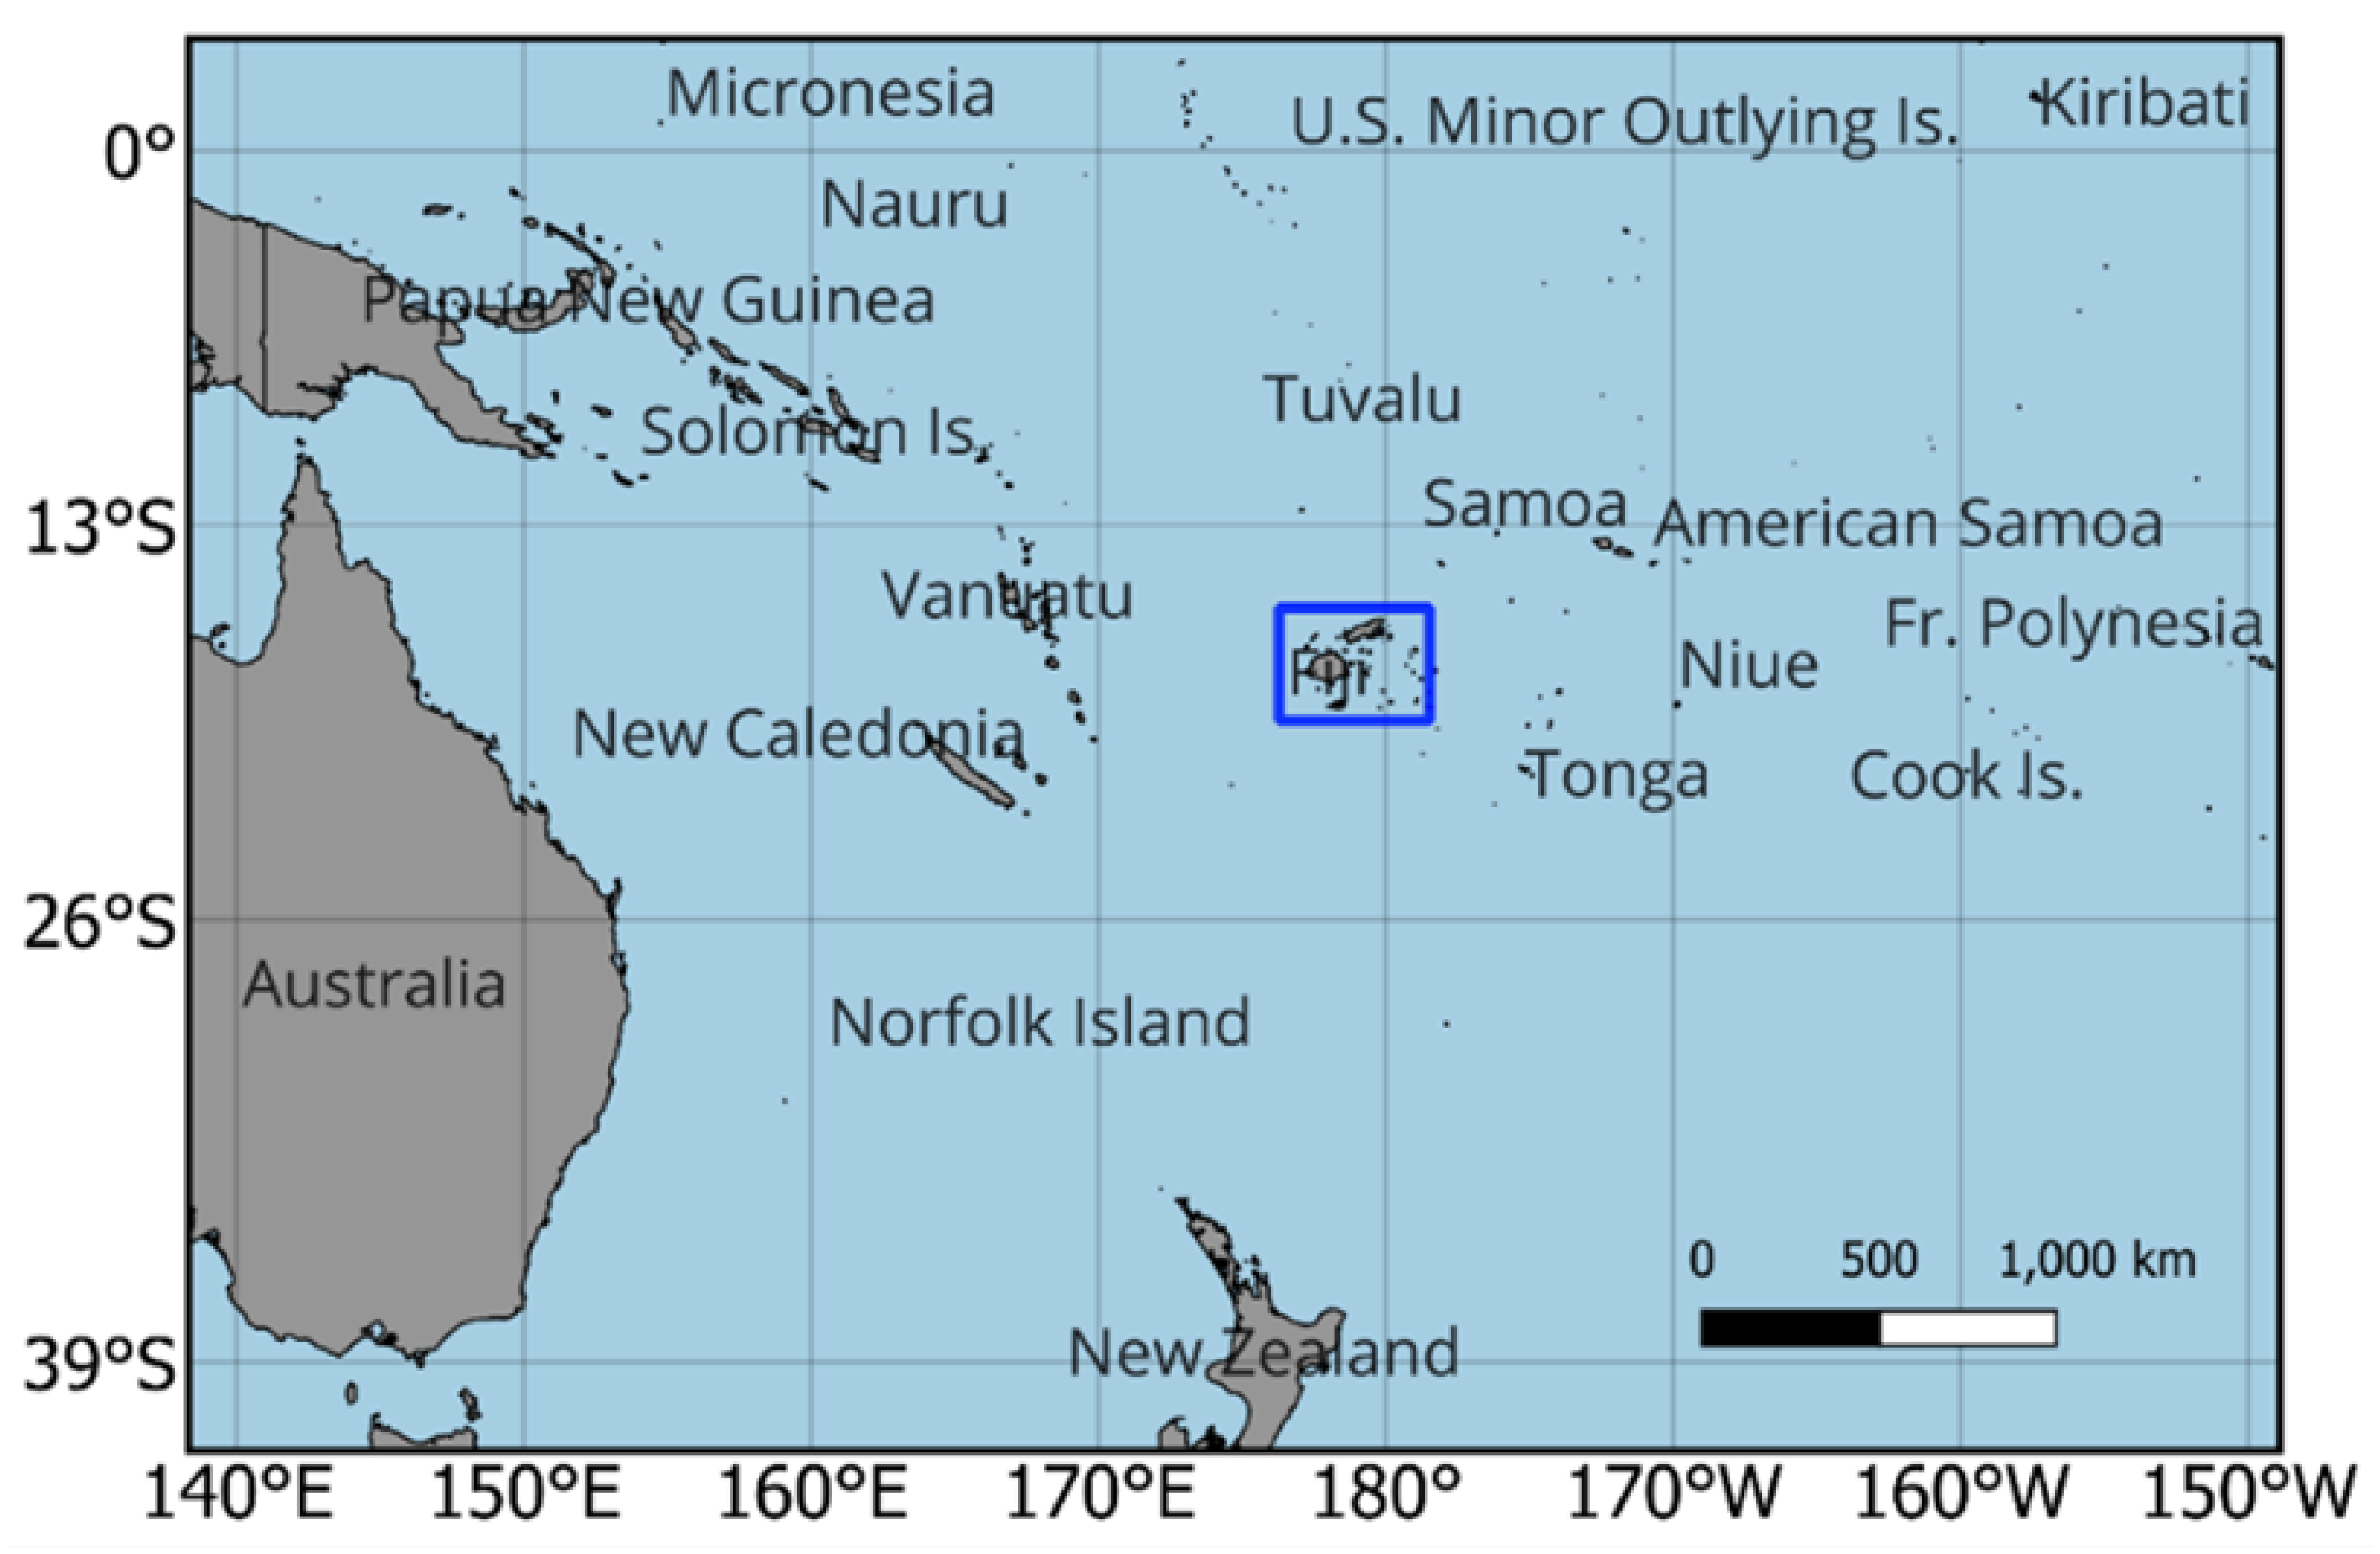
Figure 2.
The map of Fiji shows the various study sites.
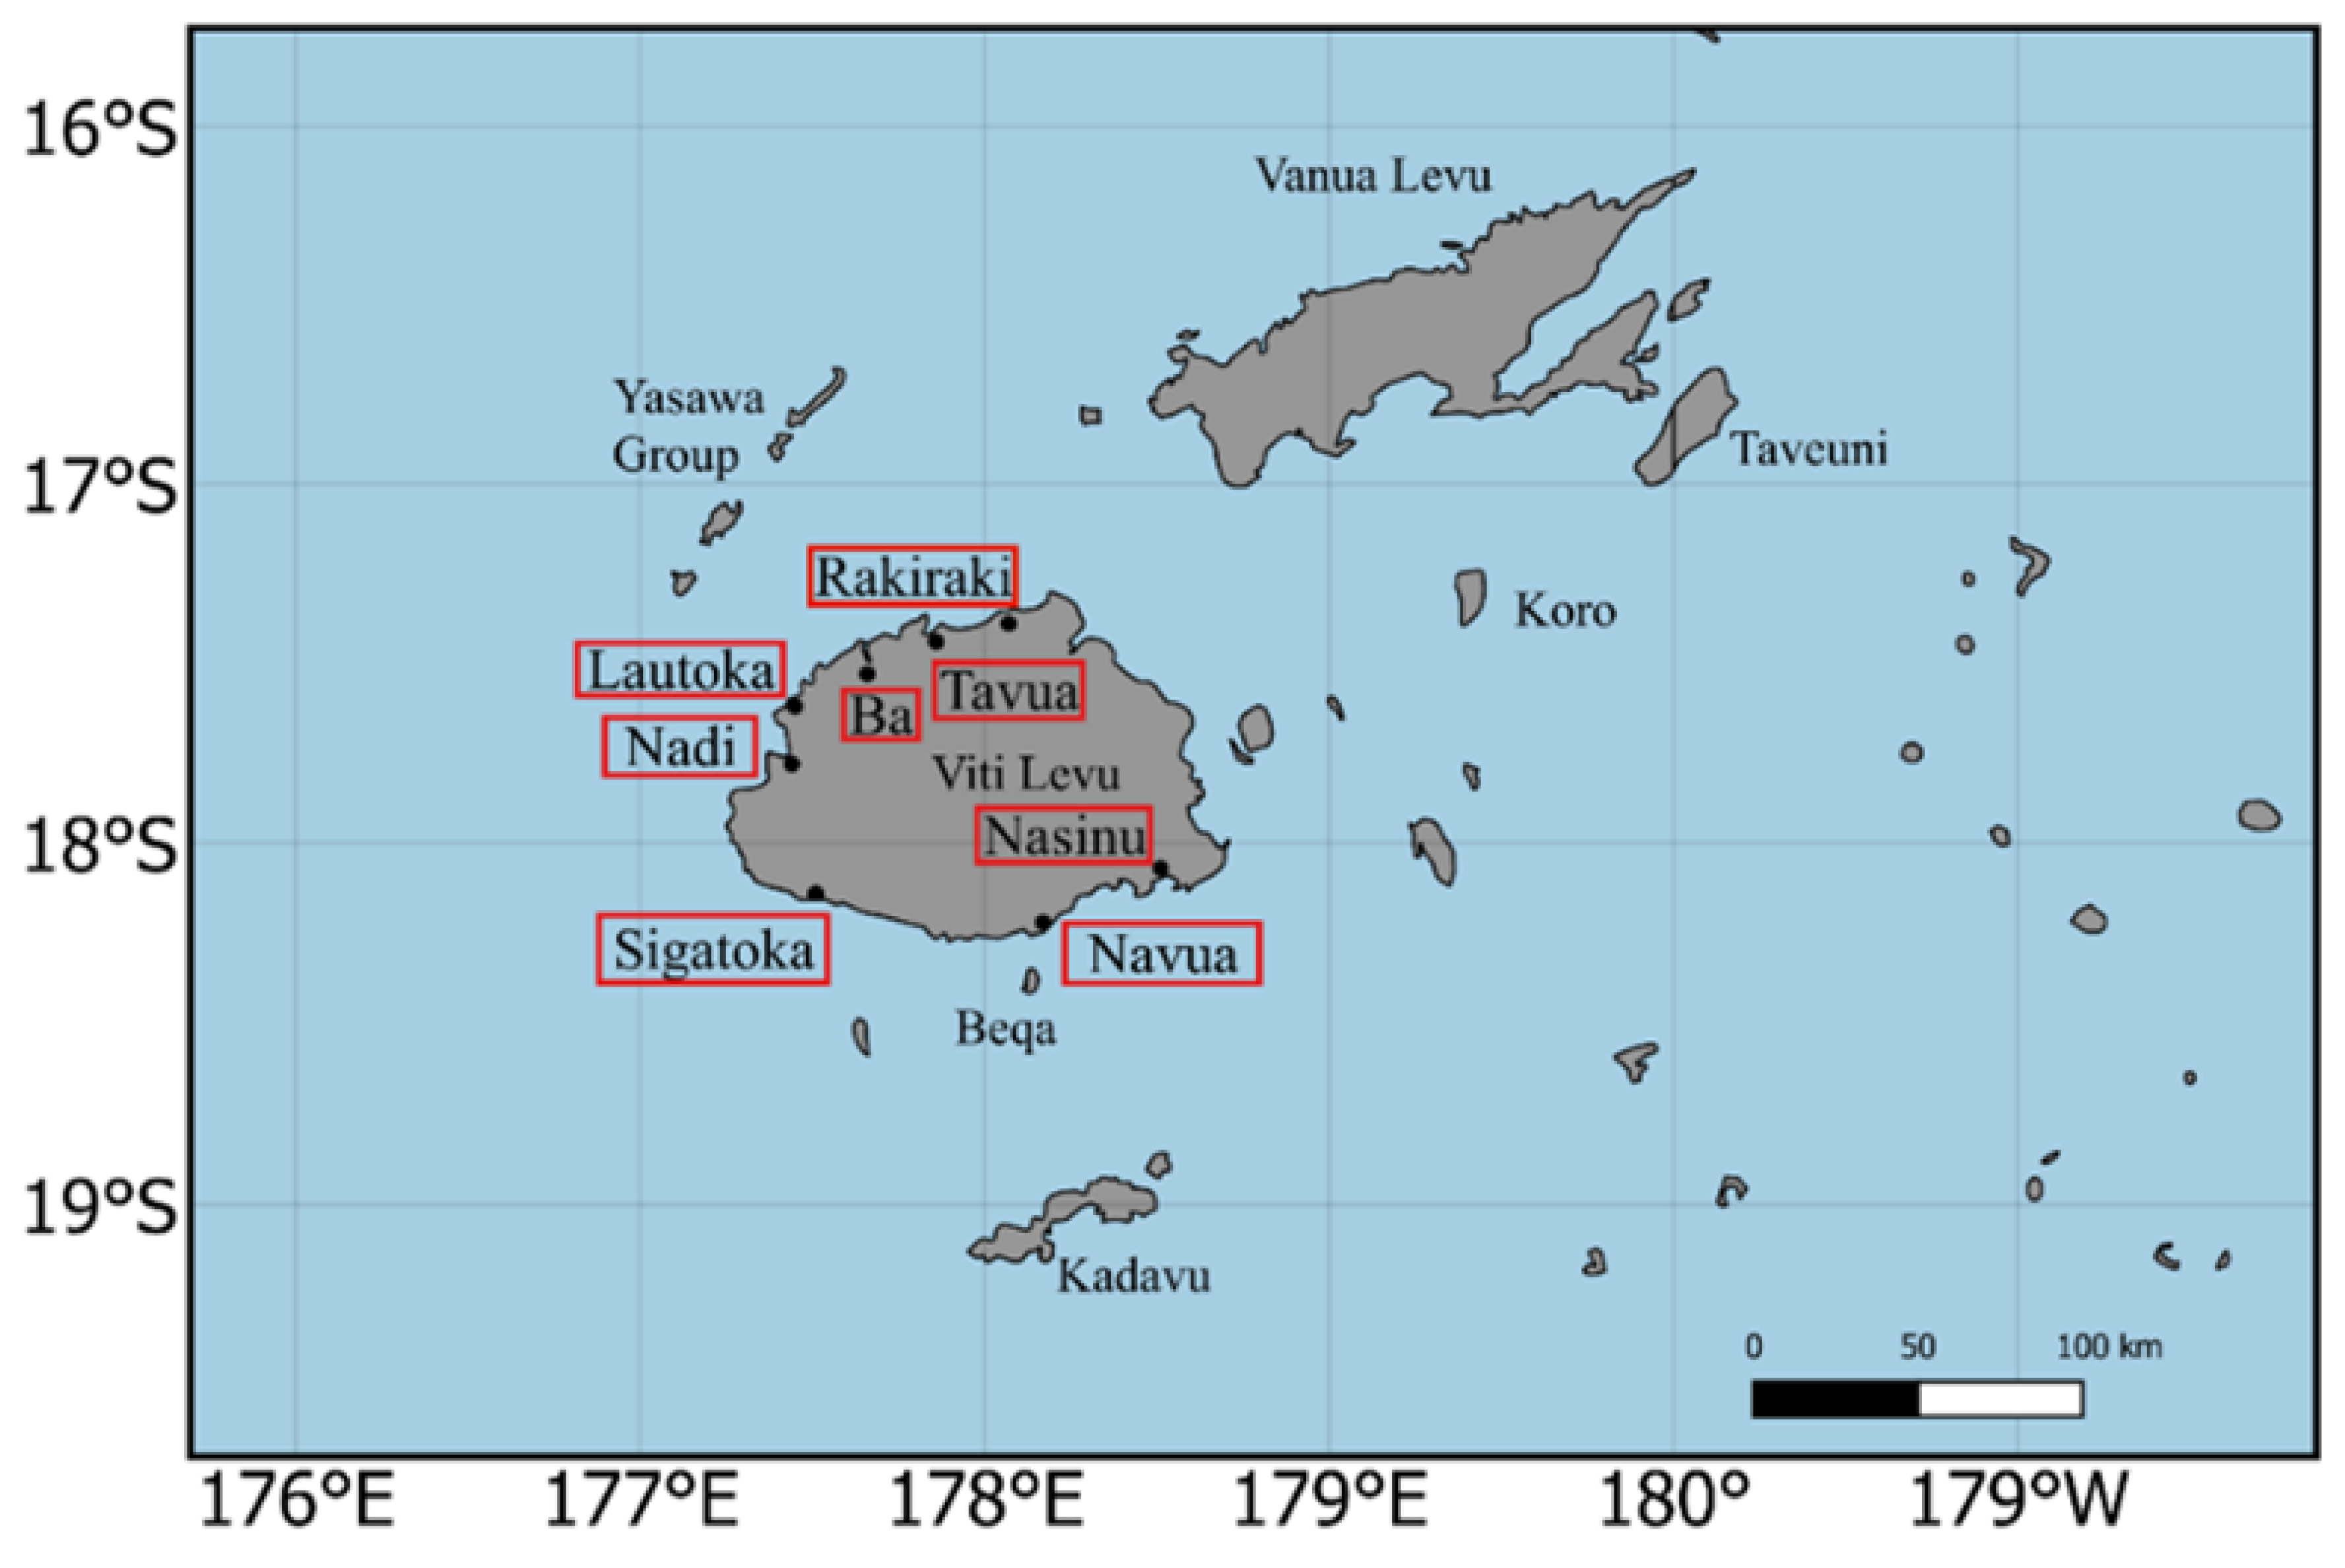
Figure 3.
The developed to identify a flood event in January 2014 at the Nadi study site demonstrating its capability to determine the duration, volume, and peak of any flood event. The flood volume, representing the accumulated water resources, is the cumulative under the curve closed by the onset and end of a flood situation and the zero line.
Figure 3.
The developed to identify a flood event in January 2014 at the Nadi study site demonstrating its capability to determine the duration, volume, and peak of any flood event. The flood volume, representing the accumulated water resources, is the cumulative under the curve closed by the onset and end of a flood situation and the zero line.
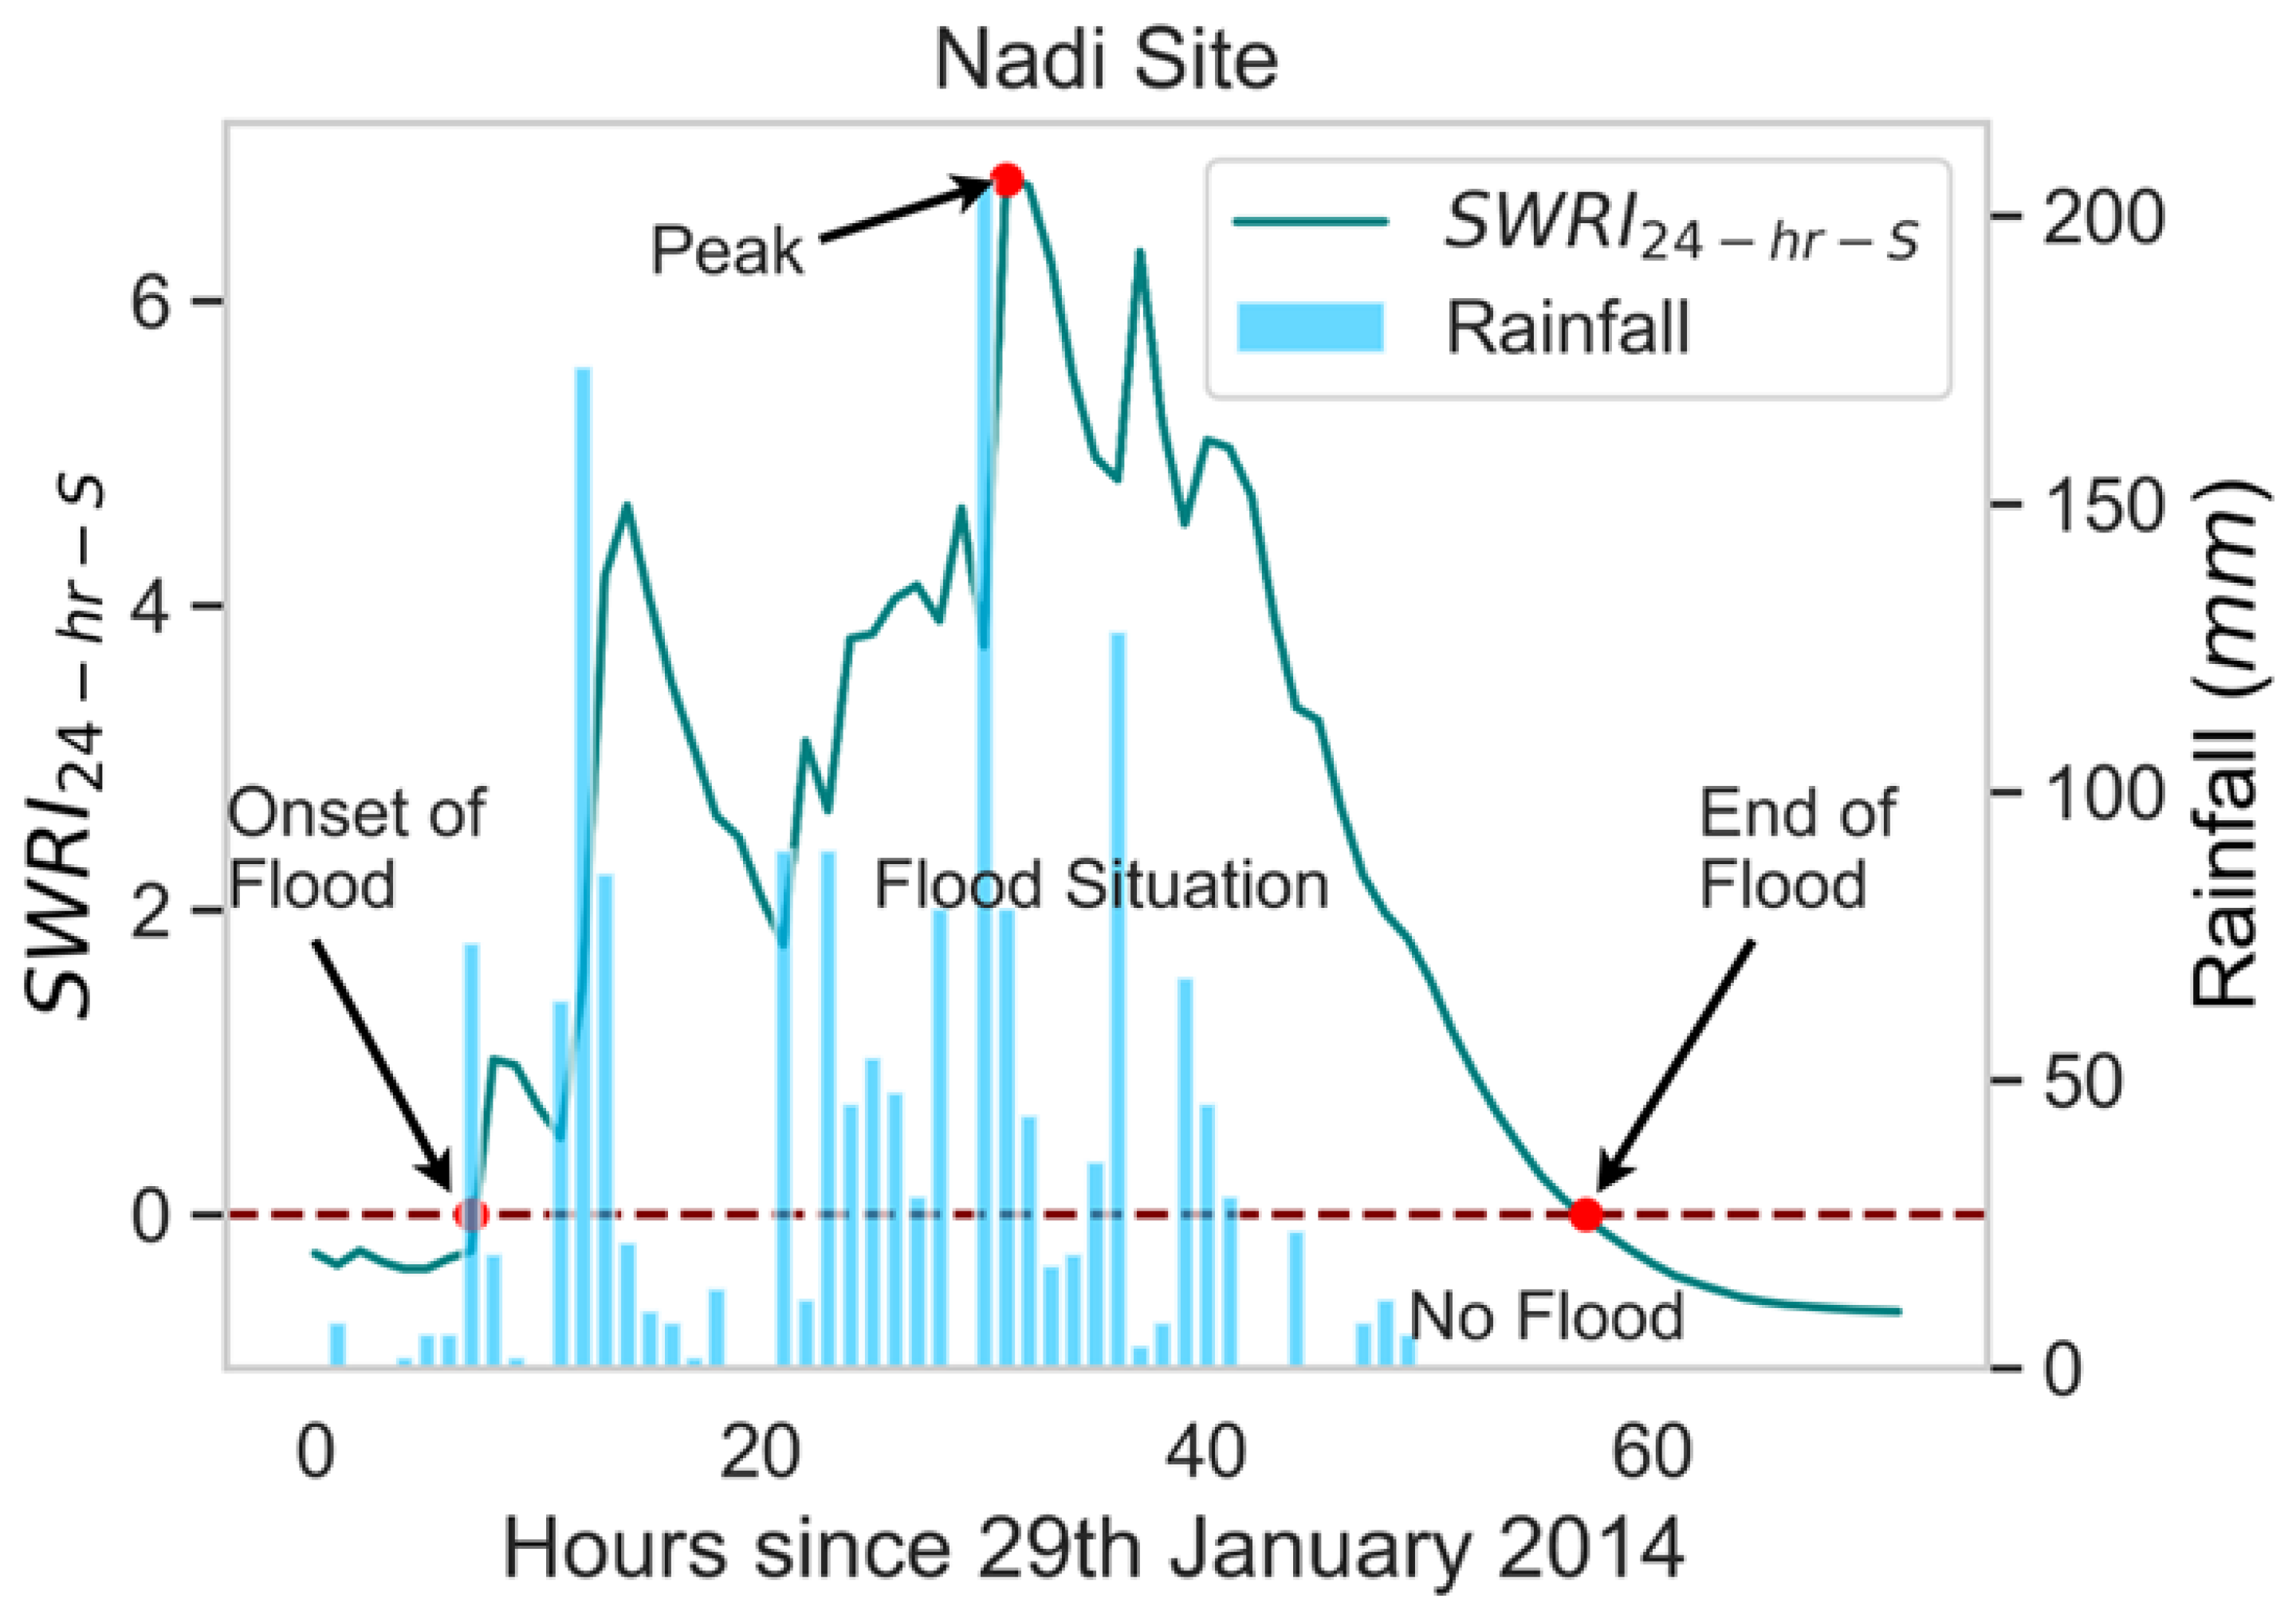
Figure 4.
The and rainfall since 29th of January 2014 (72 hours) for the Nadi site.

Figure 5.
An example of a 3-dimensional D-vine copula (a-c) and a C-vine copula (d). The vine copulas have 3 trees and 3 edges with duration (D), volume (V), and peak (Q) as nodes, and each edge is associated with a pair-copula. Source: Adapted from Nguyen-Huy et al. [14].
Figure 5.
An example of a 3-dimensional D-vine copula (a-c) and a C-vine copula (d). The vine copulas have 3 trees and 3 edges with duration (D), volume (V), and peak (Q) as nodes, and each edge is associated with a pair-copula. Source: Adapted from Nguyen-Huy et al. [14].
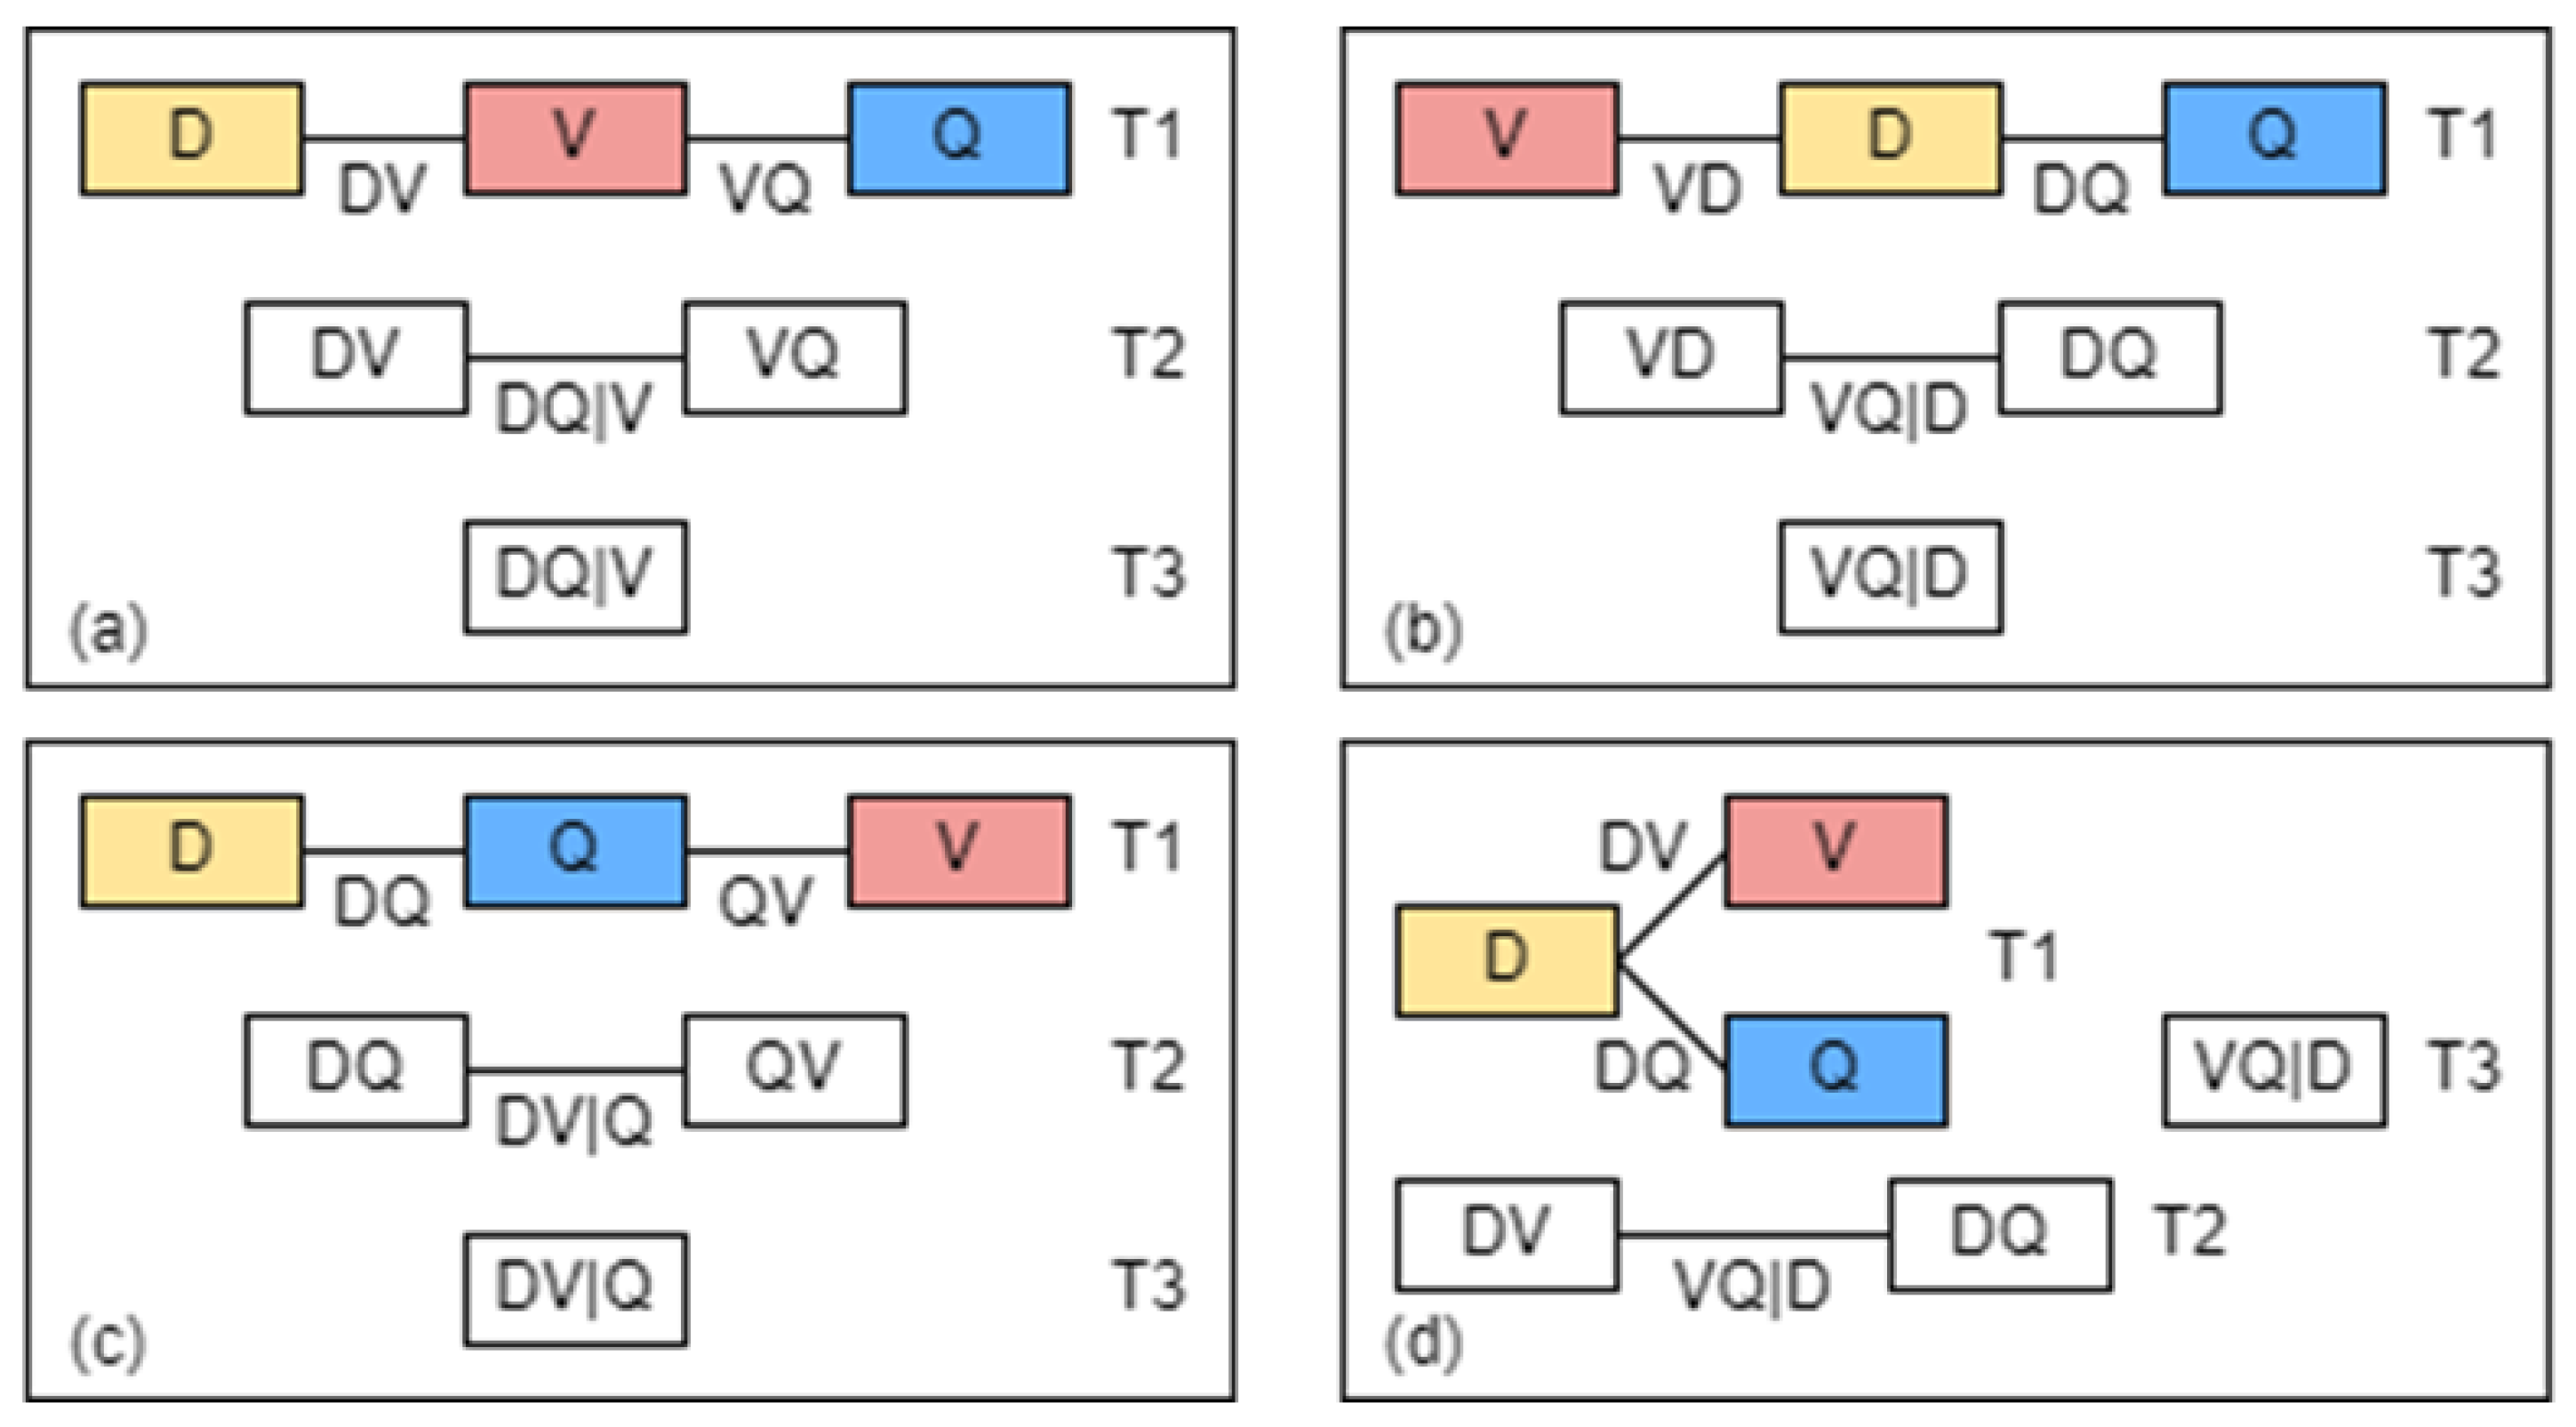
Figure 6.
The applied to identify the flood events in April 2016 at the Tavua site (96 hours).
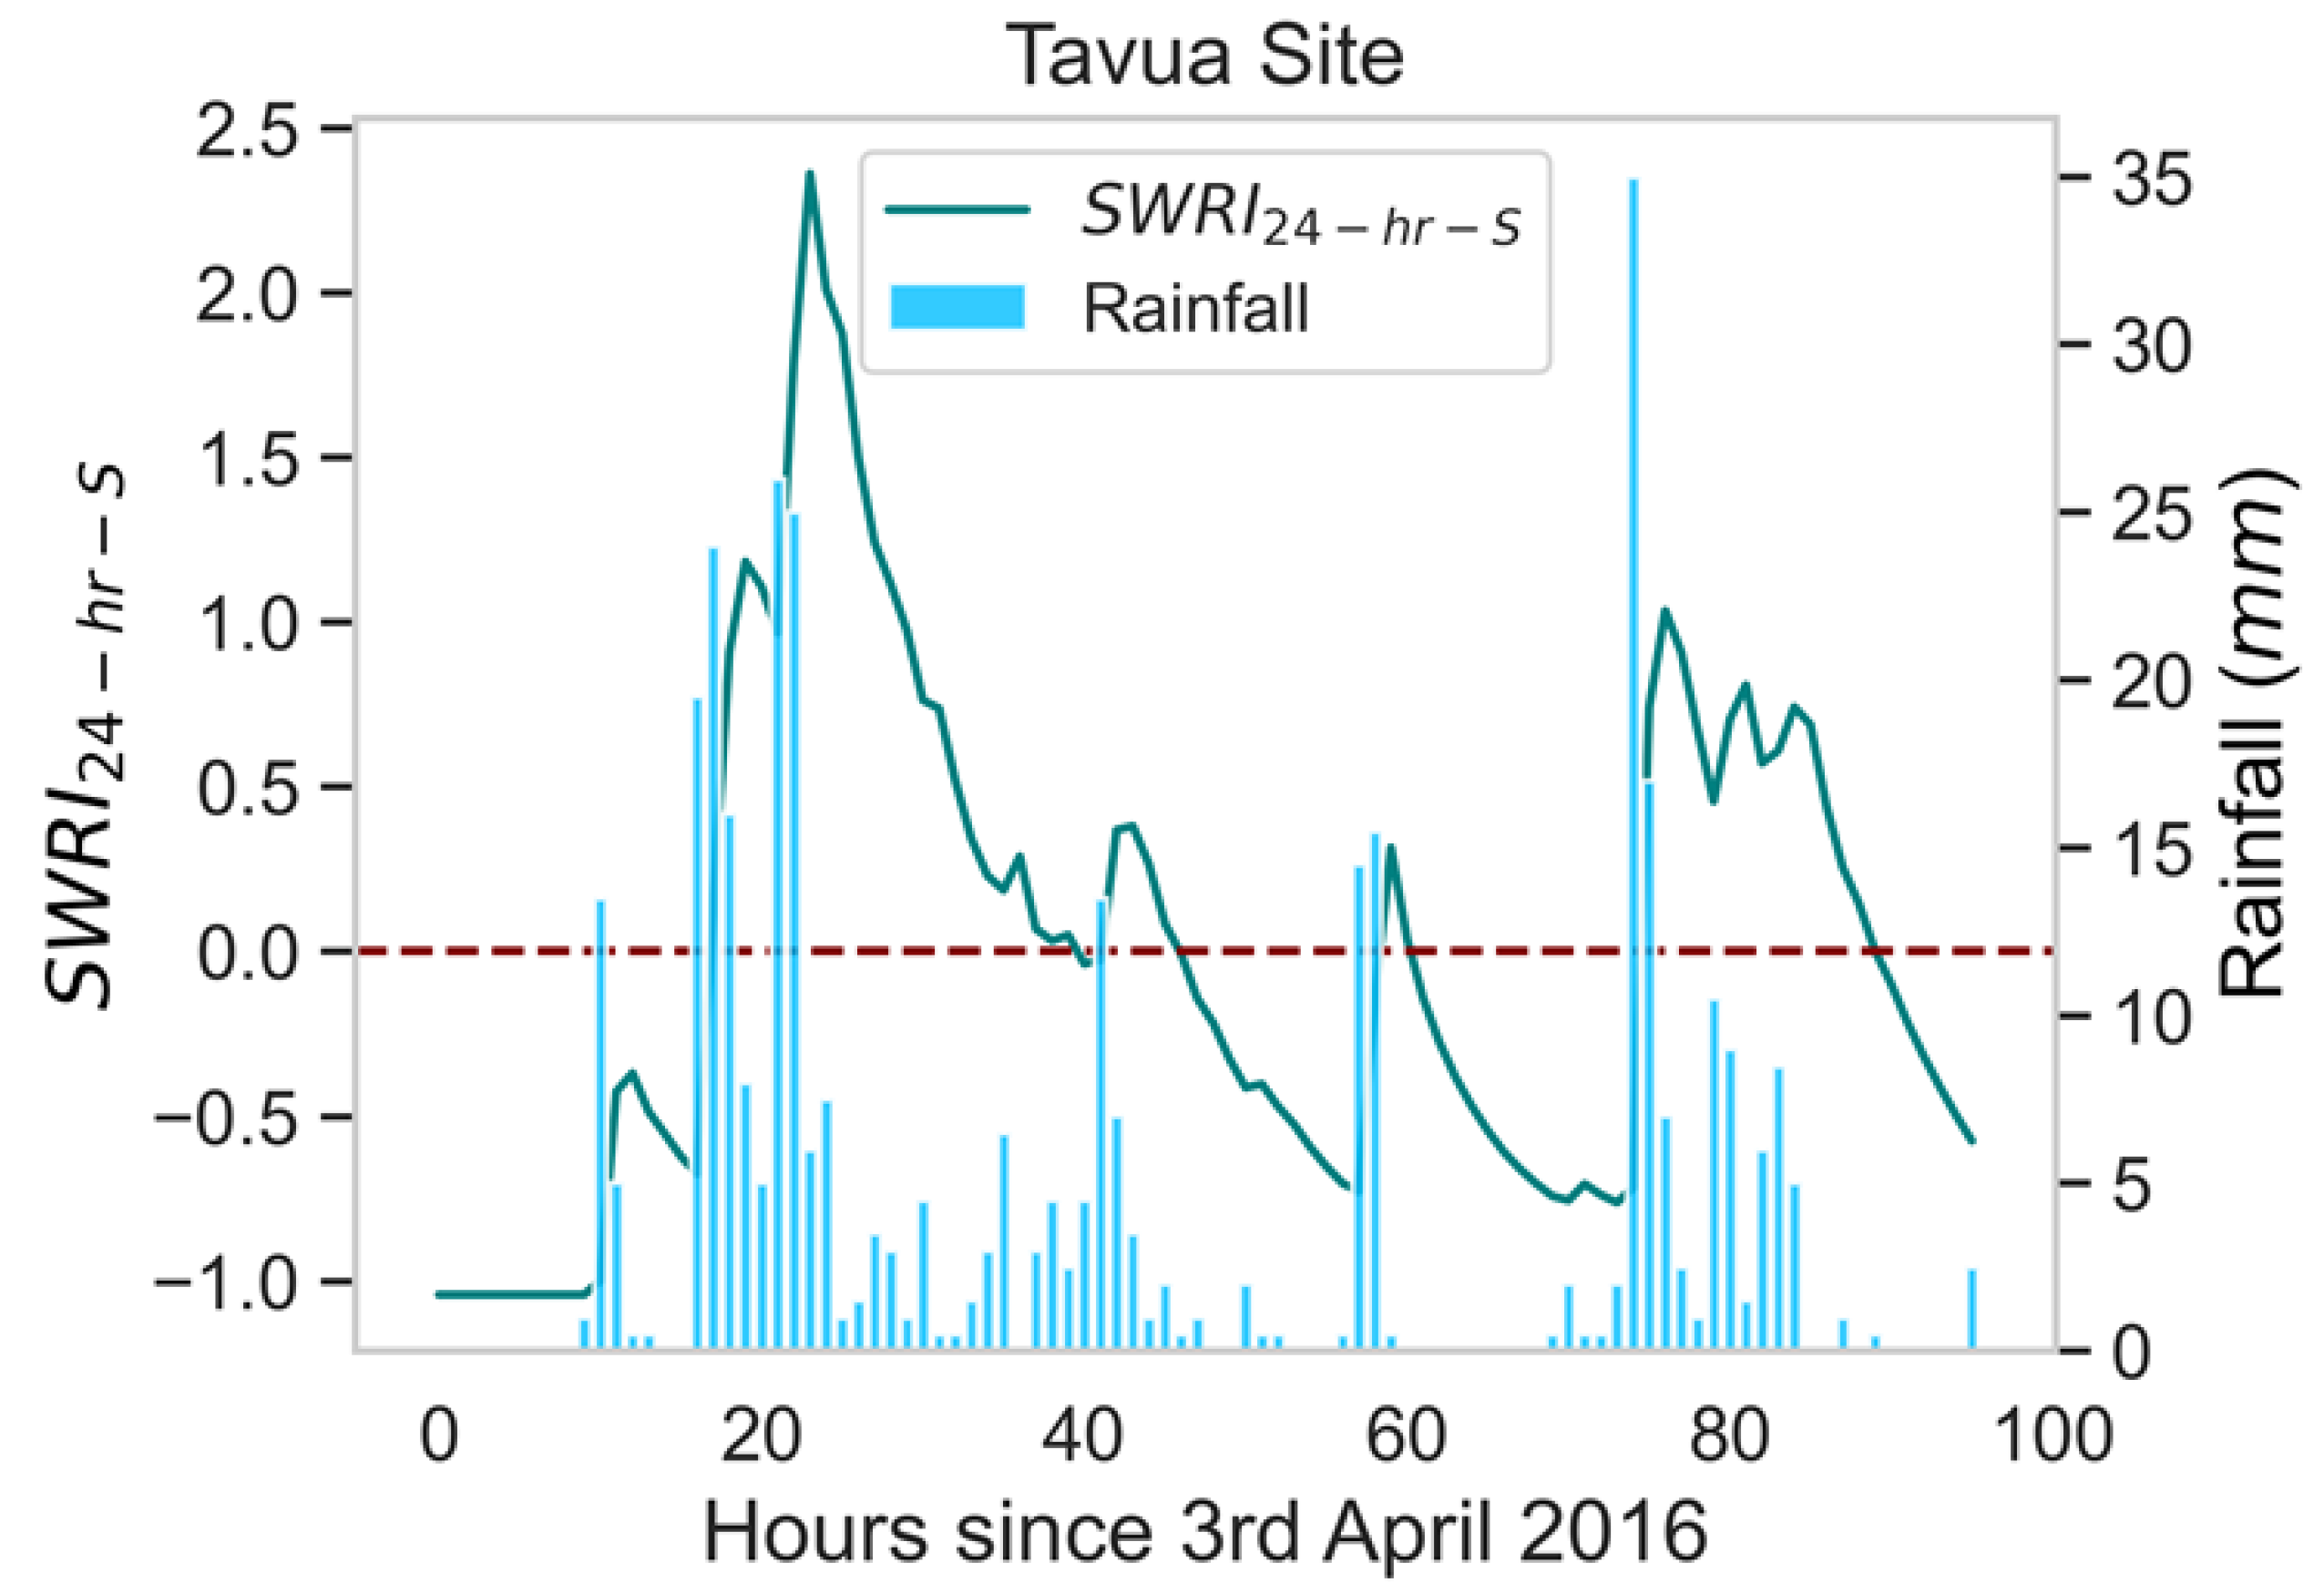
Figure 7.
The applied to identify the flood events in April 2016 at the other study sites (96 hours).
Figure 7.
The applied to identify the flood events in April 2016 at the other study sites (96 hours).
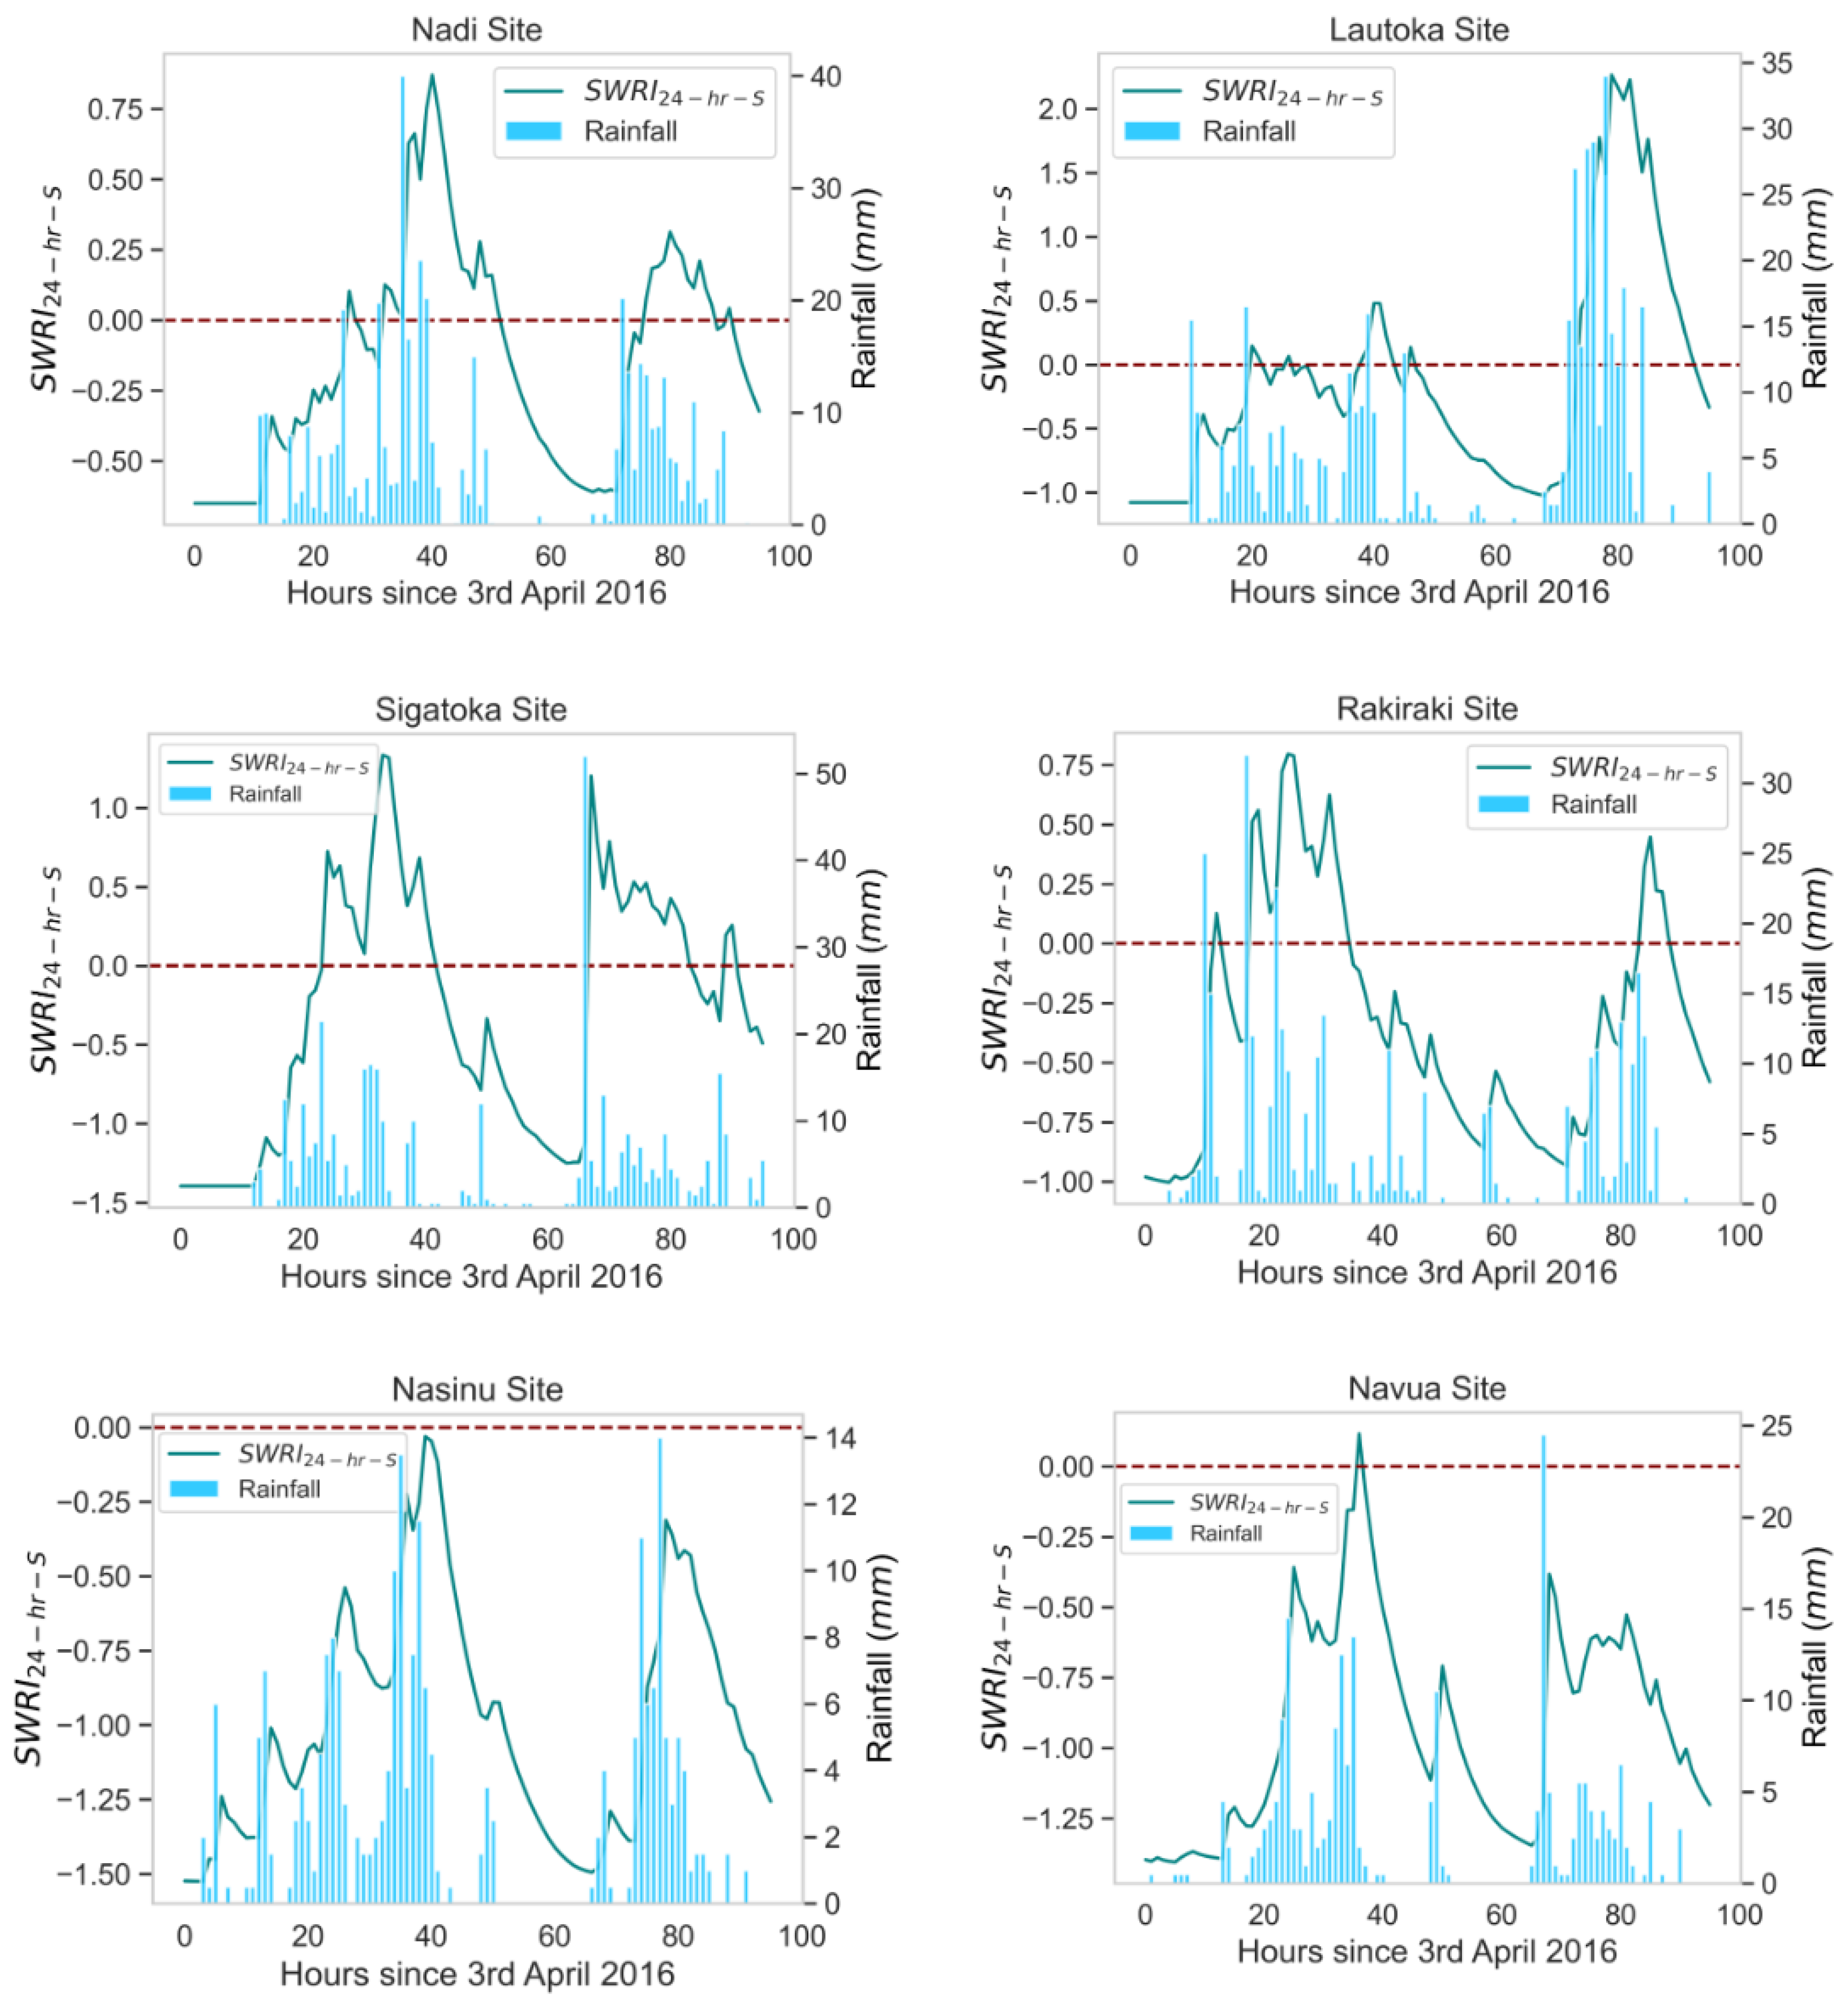
Figure 8.
Geographic analysis of flood frequency between 2014 and 2018.
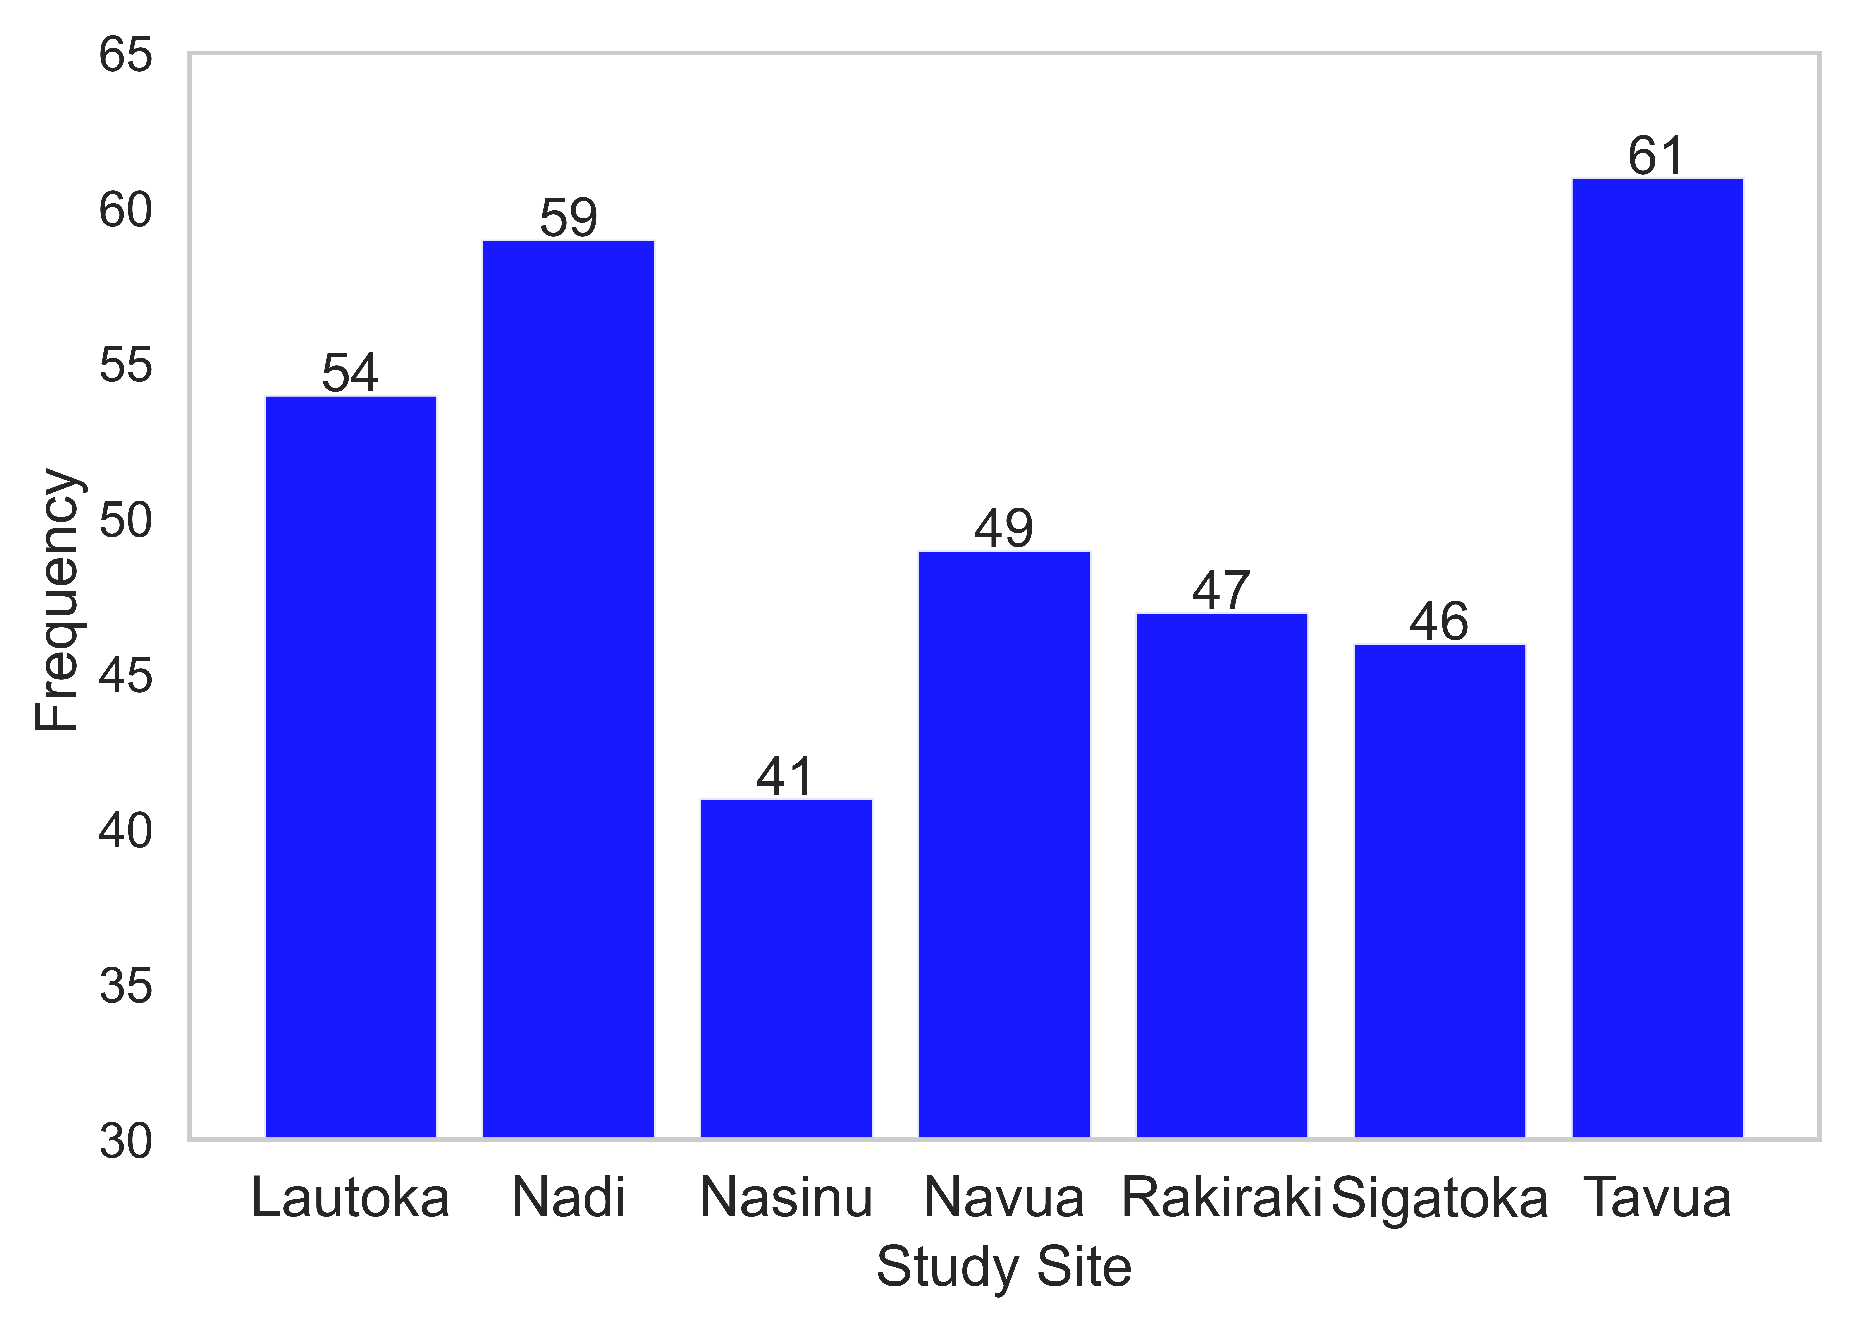
Figure 9.
Temporal (monthly) analysis of flood frequency and total monthly rainfall aggregated from 2014-2018.
Figure 9.
Temporal (monthly) analysis of flood frequency and total monthly rainfall aggregated from 2014-2018.
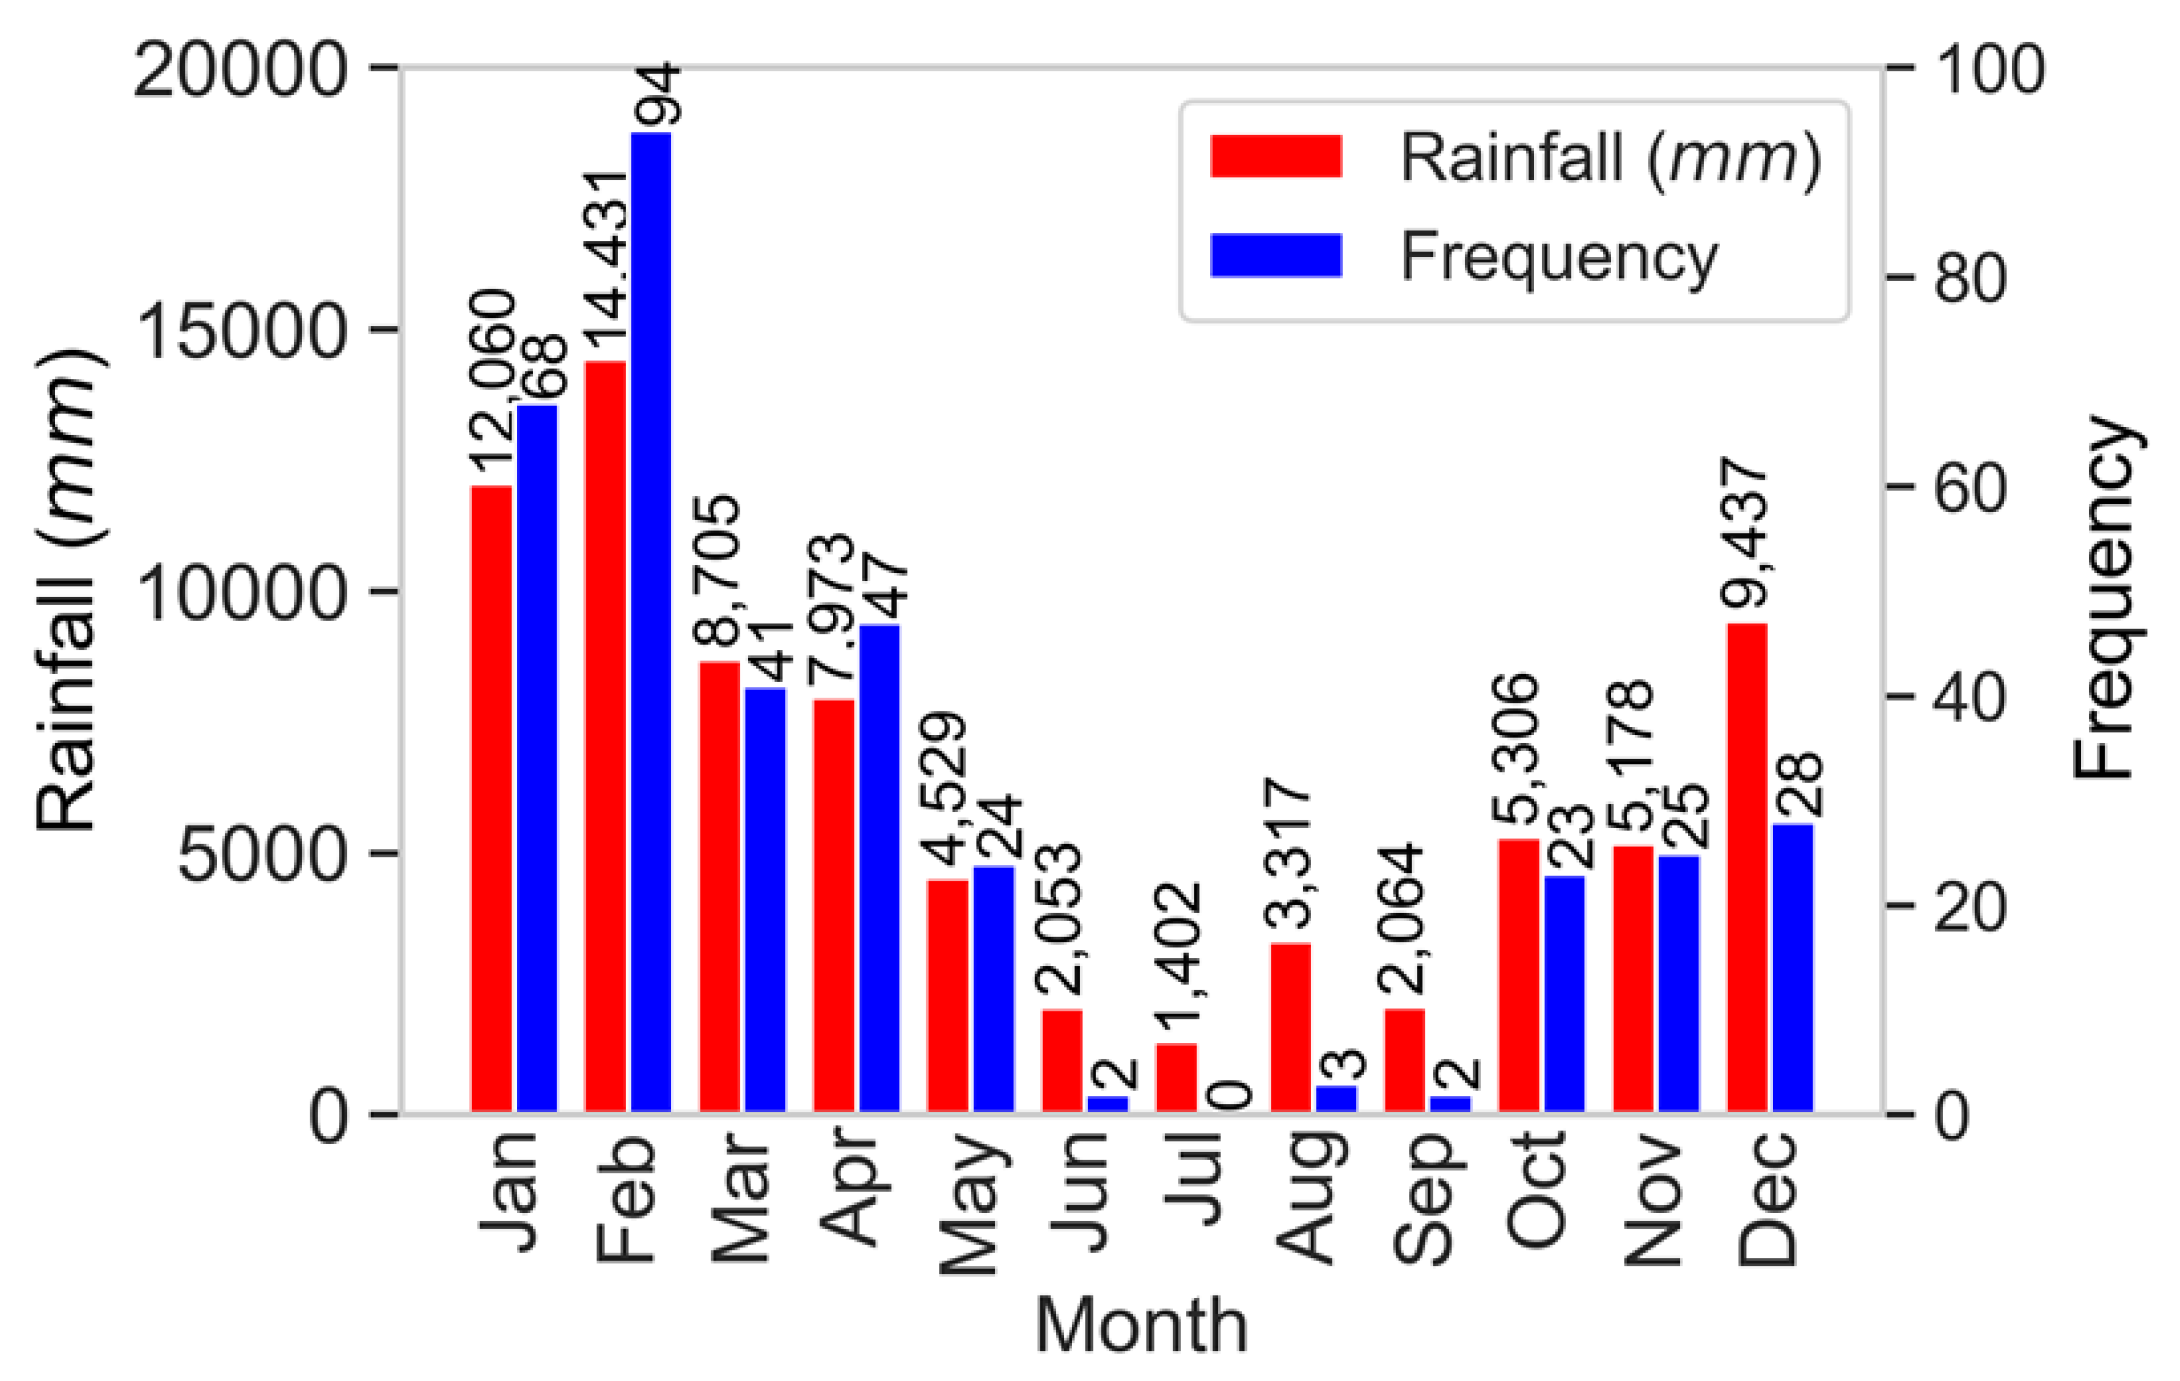
Figure 10.
Temporal (monthly) analysis of the combined volume of flood events across 7 study sites from 2014-2018.
Figure 10.
Temporal (monthly) analysis of the combined volume of flood events across 7 study sites from 2014-2018.
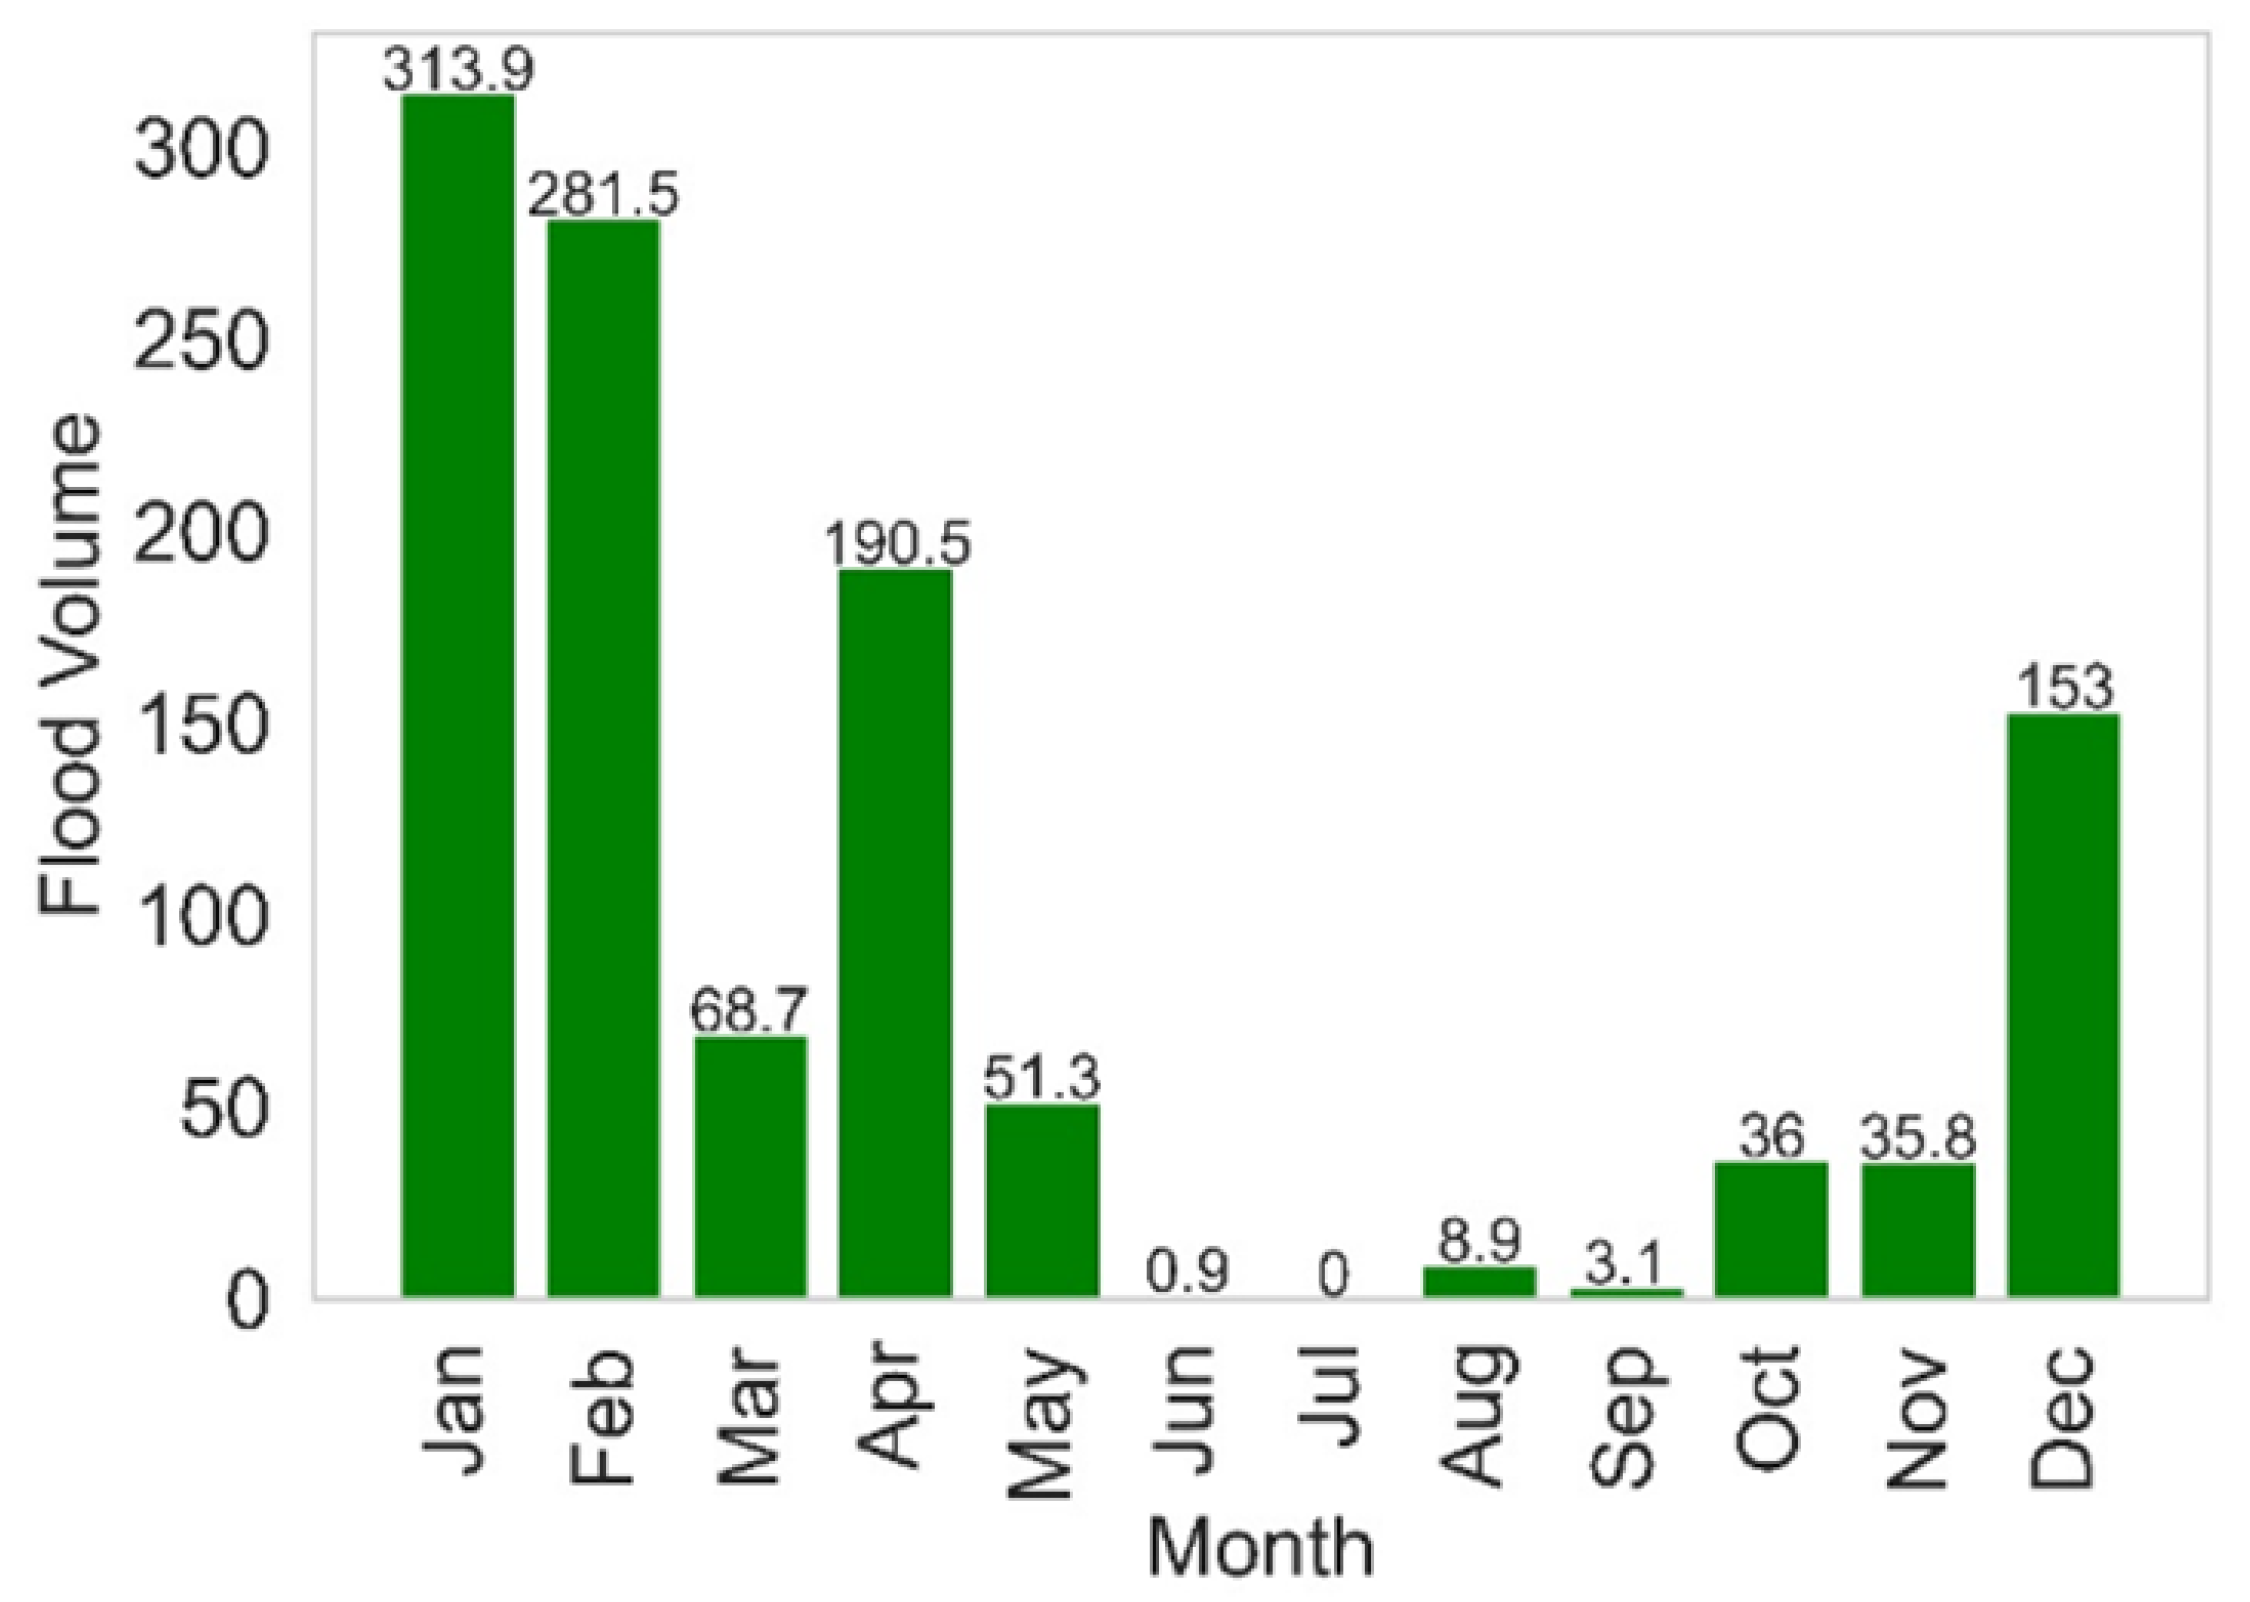
Figure 11.
Frequency of floods and total rainfall across 7 study sites aggregated from 2014 to 2018.
Figure 11.
Frequency of floods and total rainfall across 7 study sites aggregated from 2014 to 2018.
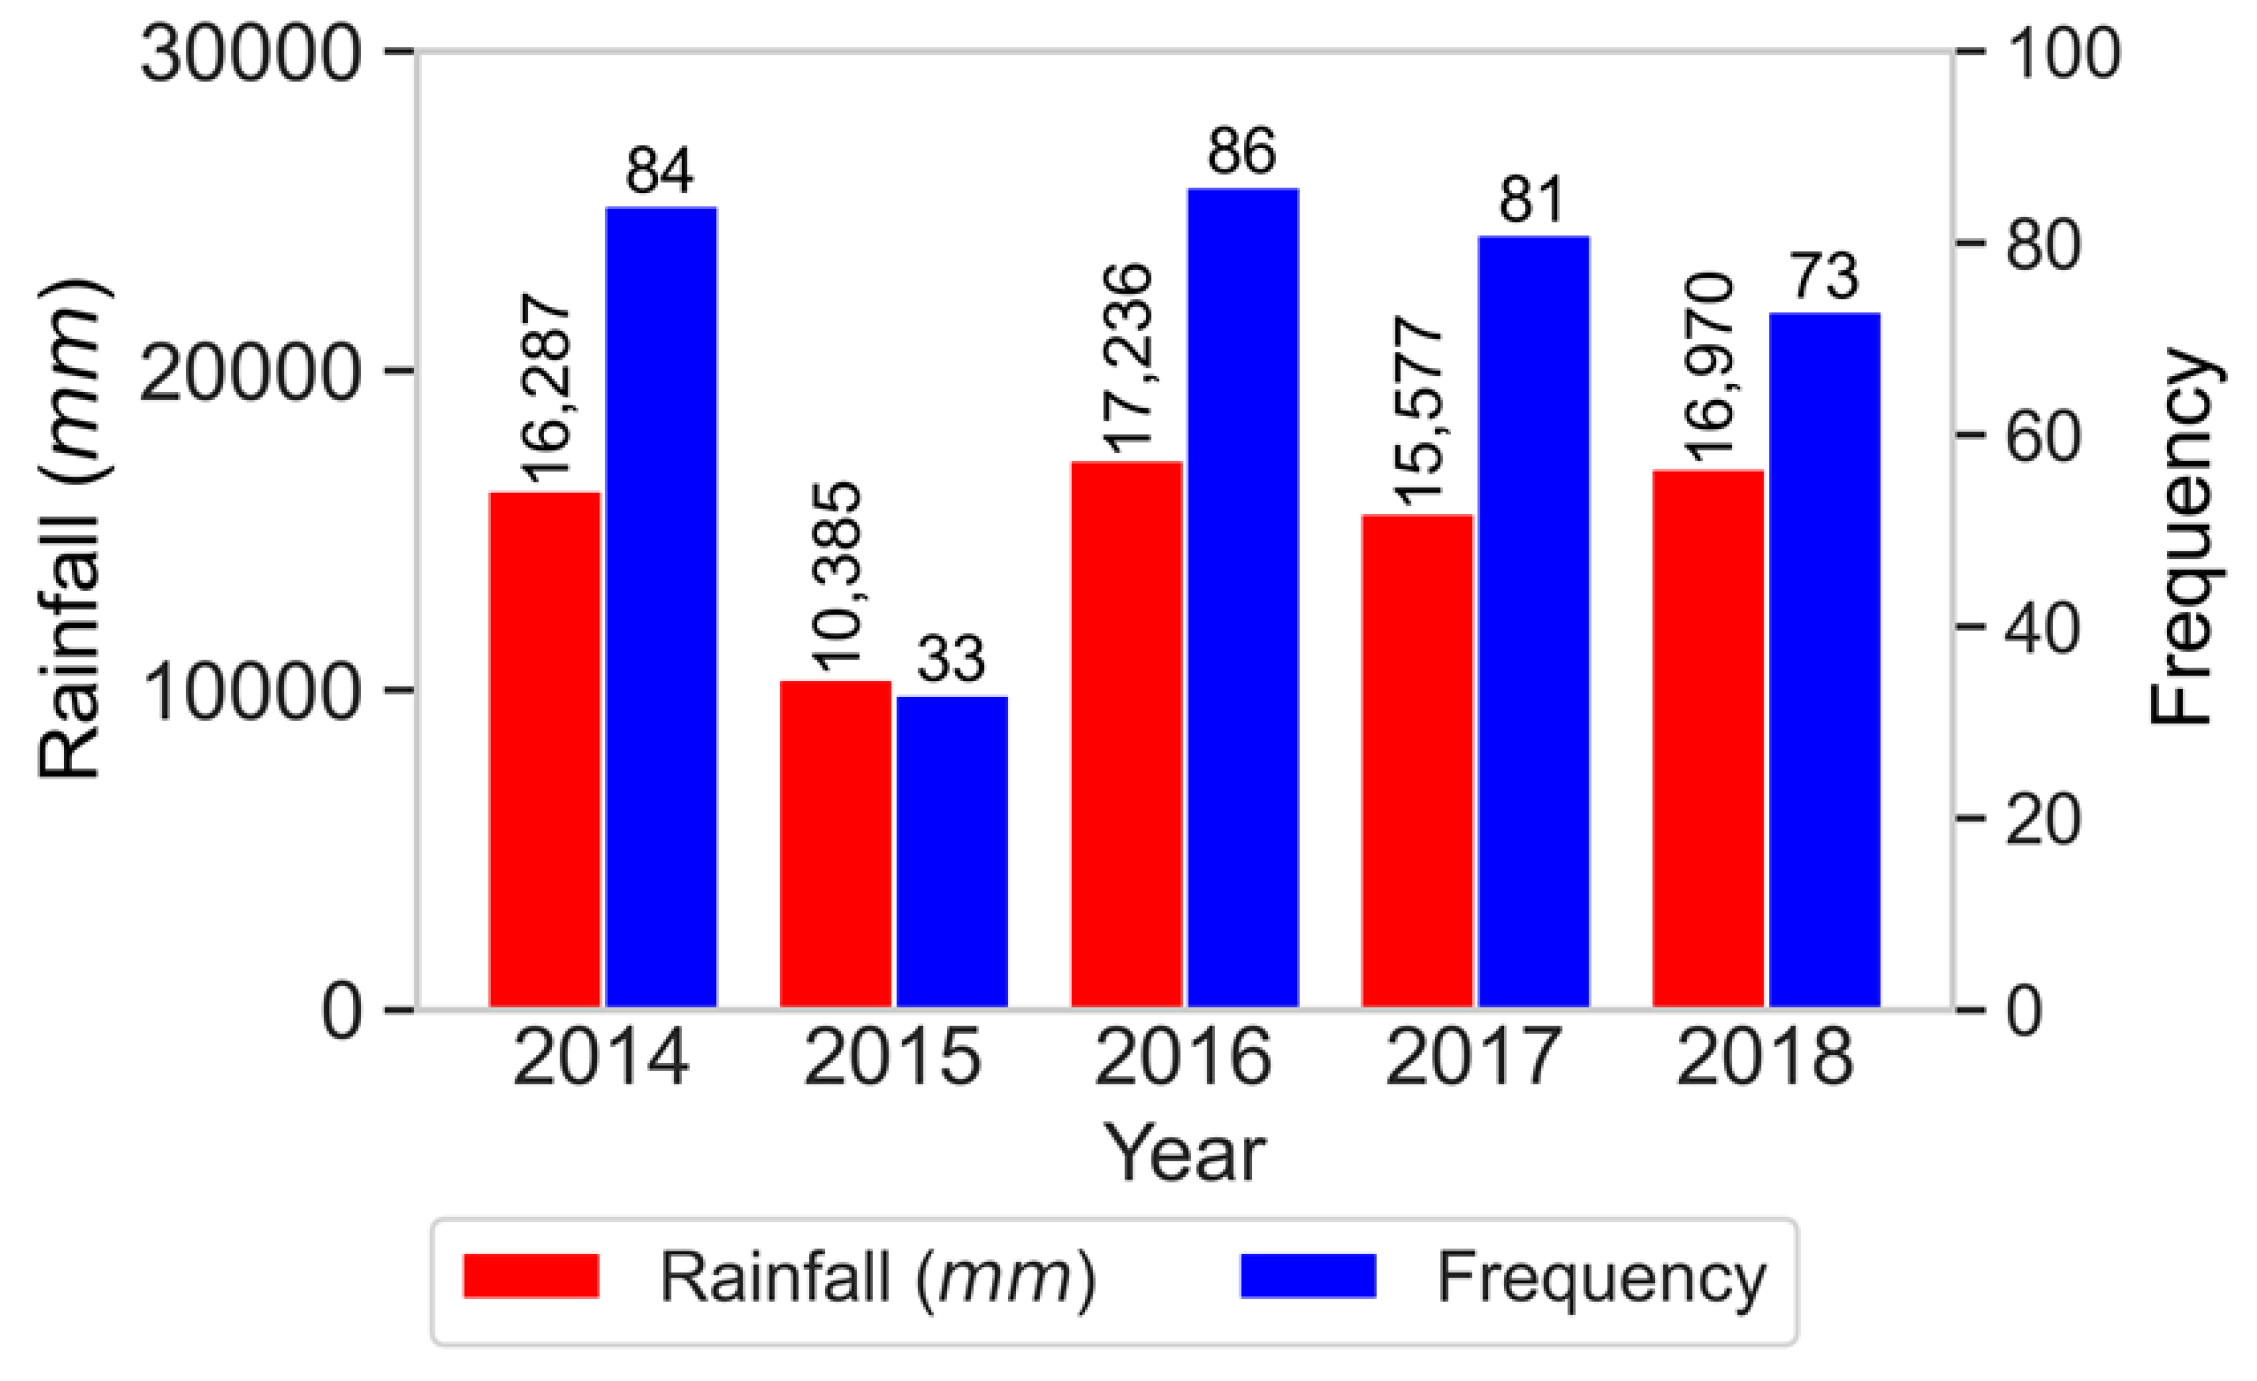
Figure 12.
Yearly combined volume of flood events across the 7 study sites from 2014 to 2018.
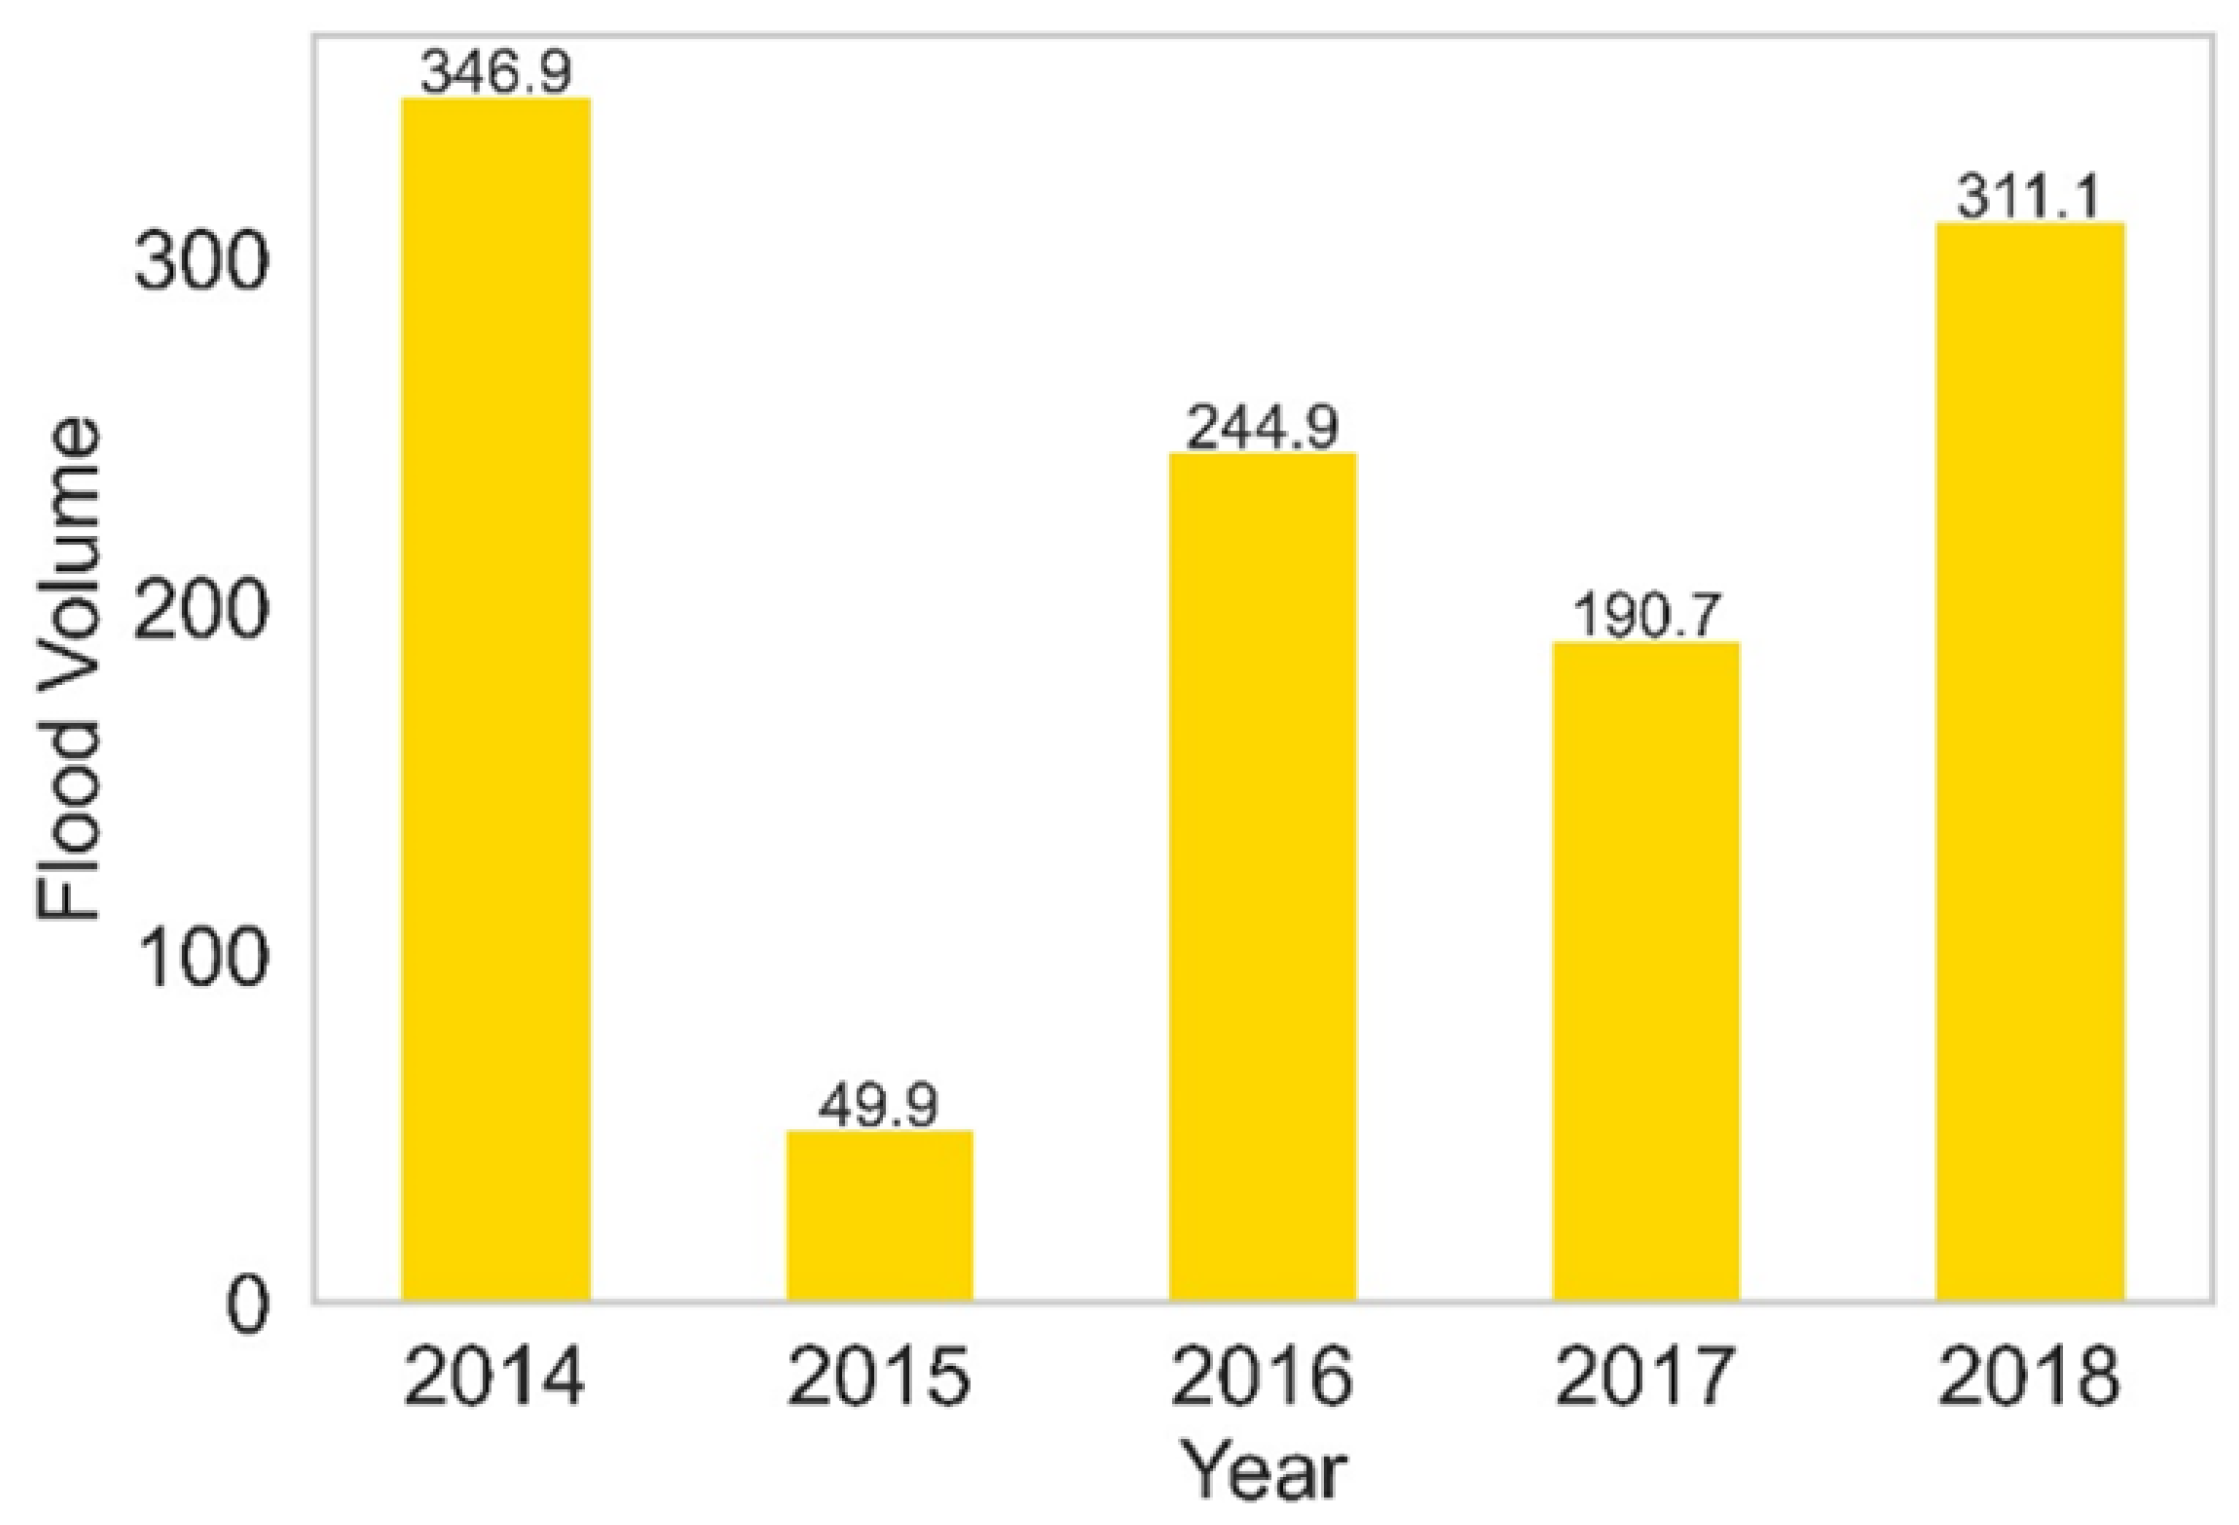
Figure 13.
The flood risk assessment presented in terms of the joint exceedance probability of a flood event’s duration (D) being greater than or equal to 50th-quantile (median) (i.e., D ≥q (0.5) = 3 hours), 75th-quantile (moderate) (i.e., D≥q (0.75) = 6 hours), and 95th-quantile (extreme) (i.e., D≥q (0.95) = 15 hours) combined with: (a) both volume and peak being greater than or equal to 50th-quantile (i.e., V≥q (0.5) = 6.222 & Q≥q(0.5) = 0.352)), (b) volume being greater than or equal to 50th-quantile and peak being greater than or equal to 75th-quantile (i.e., V≥q (0.5) = 6.222 & Q≥q (0.75) = 0.821), (c) volume being greater than or equal to 50th-quantile and peak being greater than or equal to 95th-quantile (i.e., V≥ q (0.5) = 6.222 & Q≥ q (0.95) = 1.915).
Figure 13.
The flood risk assessment presented in terms of the joint exceedance probability of a flood event’s duration (D) being greater than or equal to 50th-quantile (median) (i.e., D ≥q (0.5) = 3 hours), 75th-quantile (moderate) (i.e., D≥q (0.75) = 6 hours), and 95th-quantile (extreme) (i.e., D≥q (0.95) = 15 hours) combined with: (a) both volume and peak being greater than or equal to 50th-quantile (i.e., V≥q (0.5) = 6.222 & Q≥q(0.5) = 0.352)), (b) volume being greater than or equal to 50th-quantile and peak being greater than or equal to 75th-quantile (i.e., V≥q (0.5) = 6.222 & Q≥q (0.75) = 0.821), (c) volume being greater than or equal to 50th-quantile and peak being greater than or equal to 95th-quantile (i.e., V≥ q (0.5) = 6.222 & Q≥ q (0.95) = 1.915).
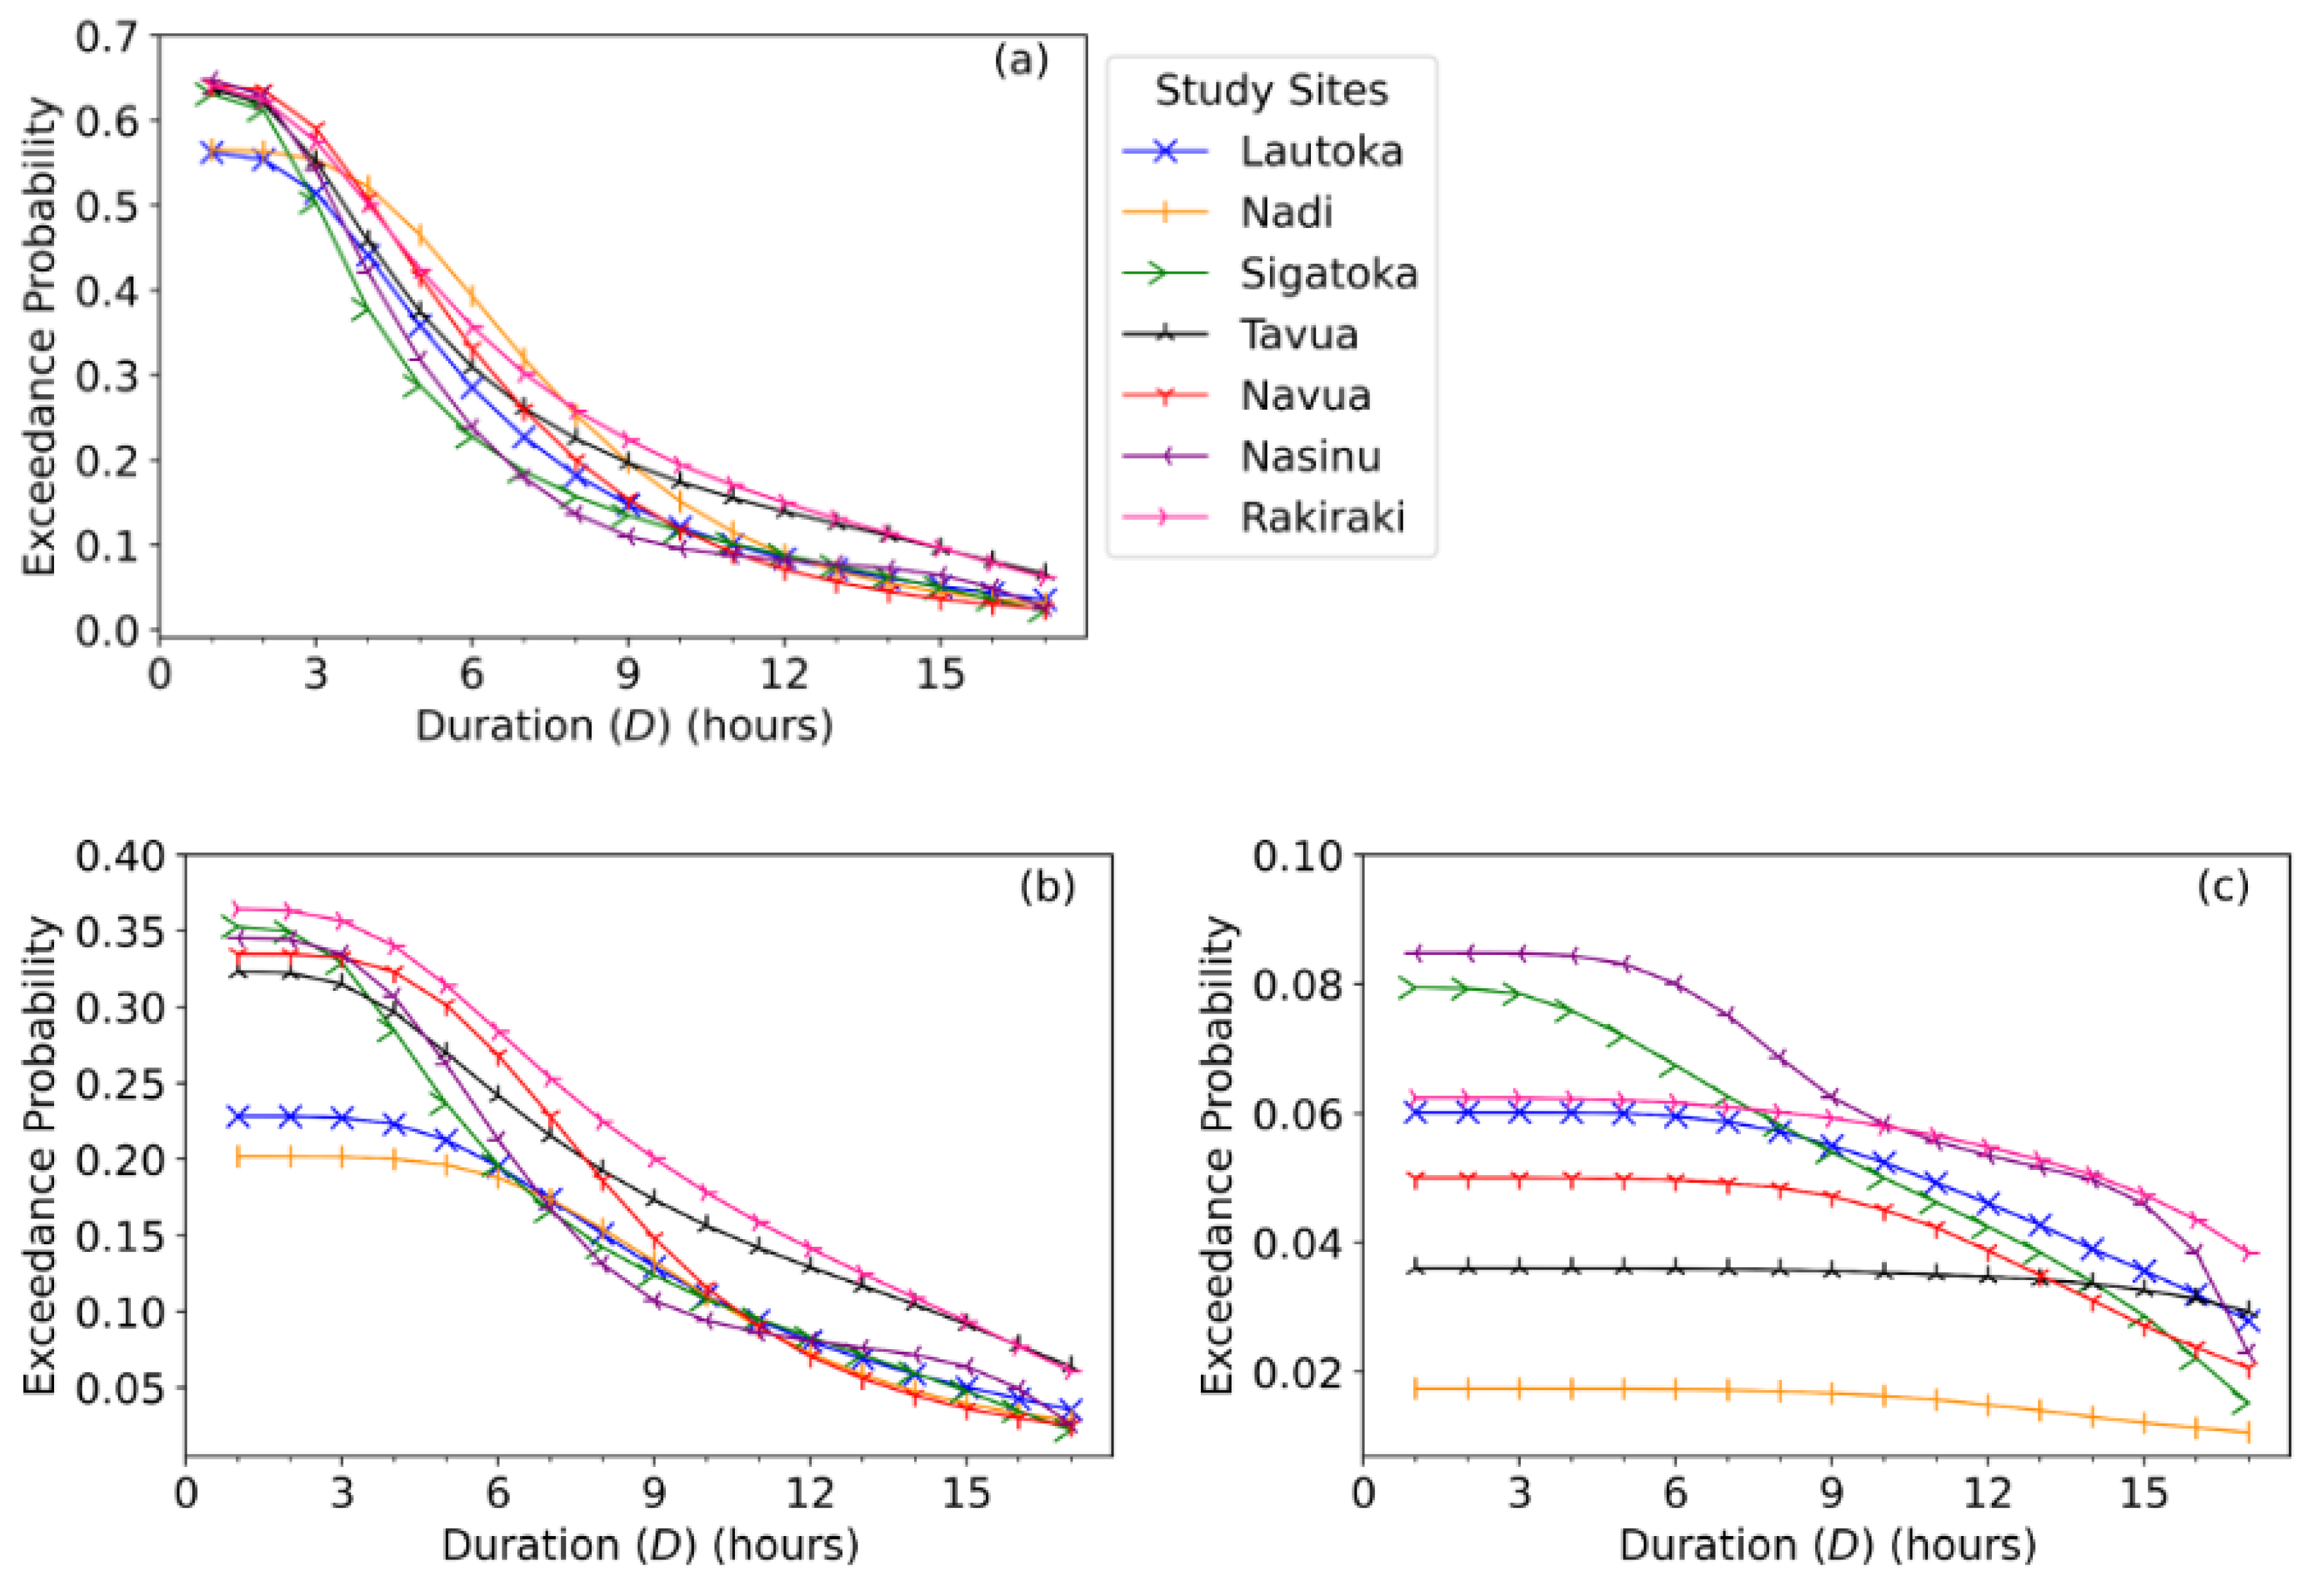
Figure 14.
The flood risk assessment presented in terms of the joint exceedance probability of flood duration (D) being greater than or equal to 50th-quantile (median) (i.e., D ≥q (0.5) = 3 hours), 75th-quantile (moderate) (i.e., D≥q (0.75) = 6 hours), and 95th-quantile (extreme) (i.e.,D≥q (0.95) = 15 hours) combined with: (a) volume being greater than or equal to 75th-quantile and peak being greater than or equal to 50th-quantile (i.e., V≥q (0.75) = 2.473 & Q≥q (0.5) = 0.352), (b) both volume and peak being greater than or equal to 75th-quantile (i.e., V≥q (0.75) = 2.473 & Q≥q (0.75) = 0.821), (c) volume being greater than or equal to 75th-quantile and peak being greater than or equal to 95th-quantile (i.e., V≥q (0.75) = 2.473 & Q≥ q (0.95) = 1.915).
Figure 14.
The flood risk assessment presented in terms of the joint exceedance probability of flood duration (D) being greater than or equal to 50th-quantile (median) (i.e., D ≥q (0.5) = 3 hours), 75th-quantile (moderate) (i.e., D≥q (0.75) = 6 hours), and 95th-quantile (extreme) (i.e.,D≥q (0.95) = 15 hours) combined with: (a) volume being greater than or equal to 75th-quantile and peak being greater than or equal to 50th-quantile (i.e., V≥q (0.75) = 2.473 & Q≥q (0.5) = 0.352), (b) both volume and peak being greater than or equal to 75th-quantile (i.e., V≥q (0.75) = 2.473 & Q≥q (0.75) = 0.821), (c) volume being greater than or equal to 75th-quantile and peak being greater than or equal to 95th-quantile (i.e., V≥q (0.75) = 2.473 & Q≥ q (0.95) = 1.915).
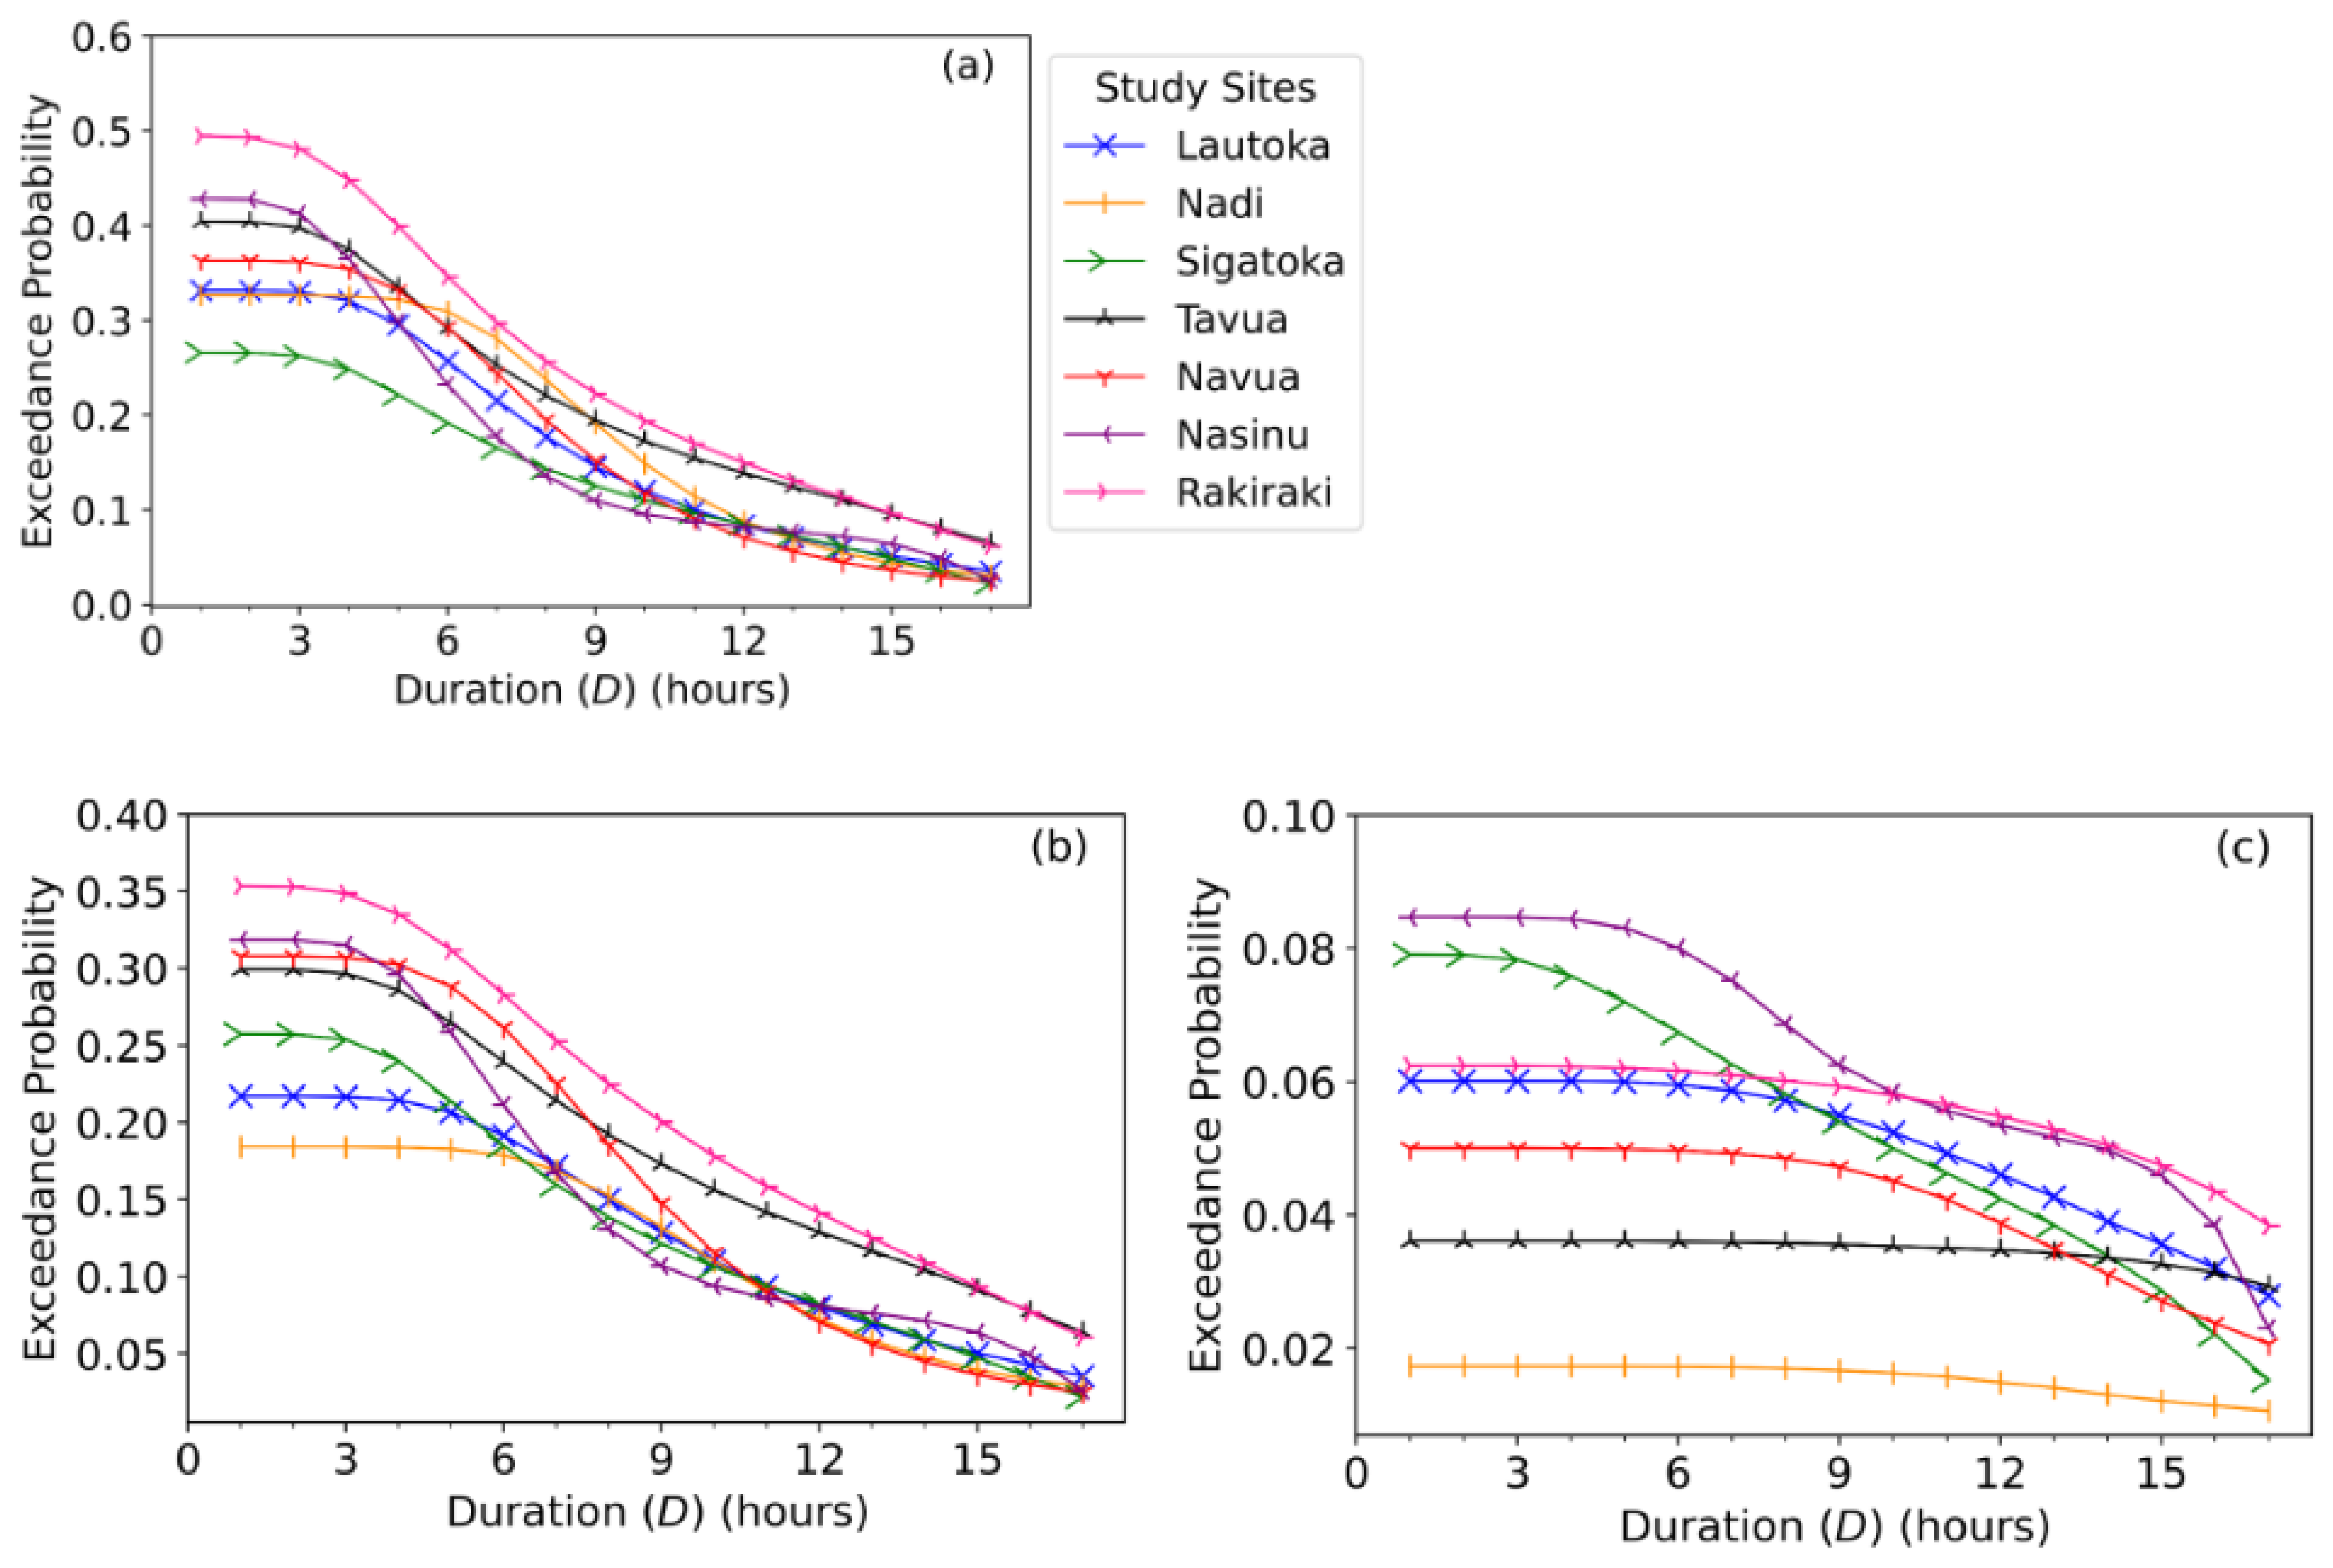
Figure 15.
The flood risk assessment presented in terms of the joint exceedance probability of flood duration (D) being greater than or equal to 50th-quantile (median) (i.e., D ≥q (0.5) = 3 hours), 75th-quantile (moderate) (i.e., D≥q (0.75) = 6 hours), and 95th-quantile (extreme) (i.e., D≥q (0.95) = 15 hours) combined with: (a) volume being greater than or equal to 95th-quantile and peak being greater than or equal to 50th-quantile (i.e., V≥q (0.95) = 12.799 & Q≥q (0.5) = 0.352), (b) volume being greater than or equal to 95th-quantile and peak being greater than or equal to 75th-quantile (i.e., V≥q (0.95) = 12.799 & Q≥q (0.75) = 0.821), (c) both volume and peak being greater than or equal to 95th-quantile (i.e., V≥q (0.95) = 12.799 & Q≥ q(0.95) = 1.915).
Figure 15.
The flood risk assessment presented in terms of the joint exceedance probability of flood duration (D) being greater than or equal to 50th-quantile (median) (i.e., D ≥q (0.5) = 3 hours), 75th-quantile (moderate) (i.e., D≥q (0.75) = 6 hours), and 95th-quantile (extreme) (i.e., D≥q (0.95) = 15 hours) combined with: (a) volume being greater than or equal to 95th-quantile and peak being greater than or equal to 50th-quantile (i.e., V≥q (0.95) = 12.799 & Q≥q (0.5) = 0.352), (b) volume being greater than or equal to 95th-quantile and peak being greater than or equal to 75th-quantile (i.e., V≥q (0.95) = 12.799 & Q≥q (0.75) = 0.821), (c) both volume and peak being greater than or equal to 95th-quantile (i.e., V≥q (0.95) = 12.799 & Q≥ q(0.95) = 1.915).
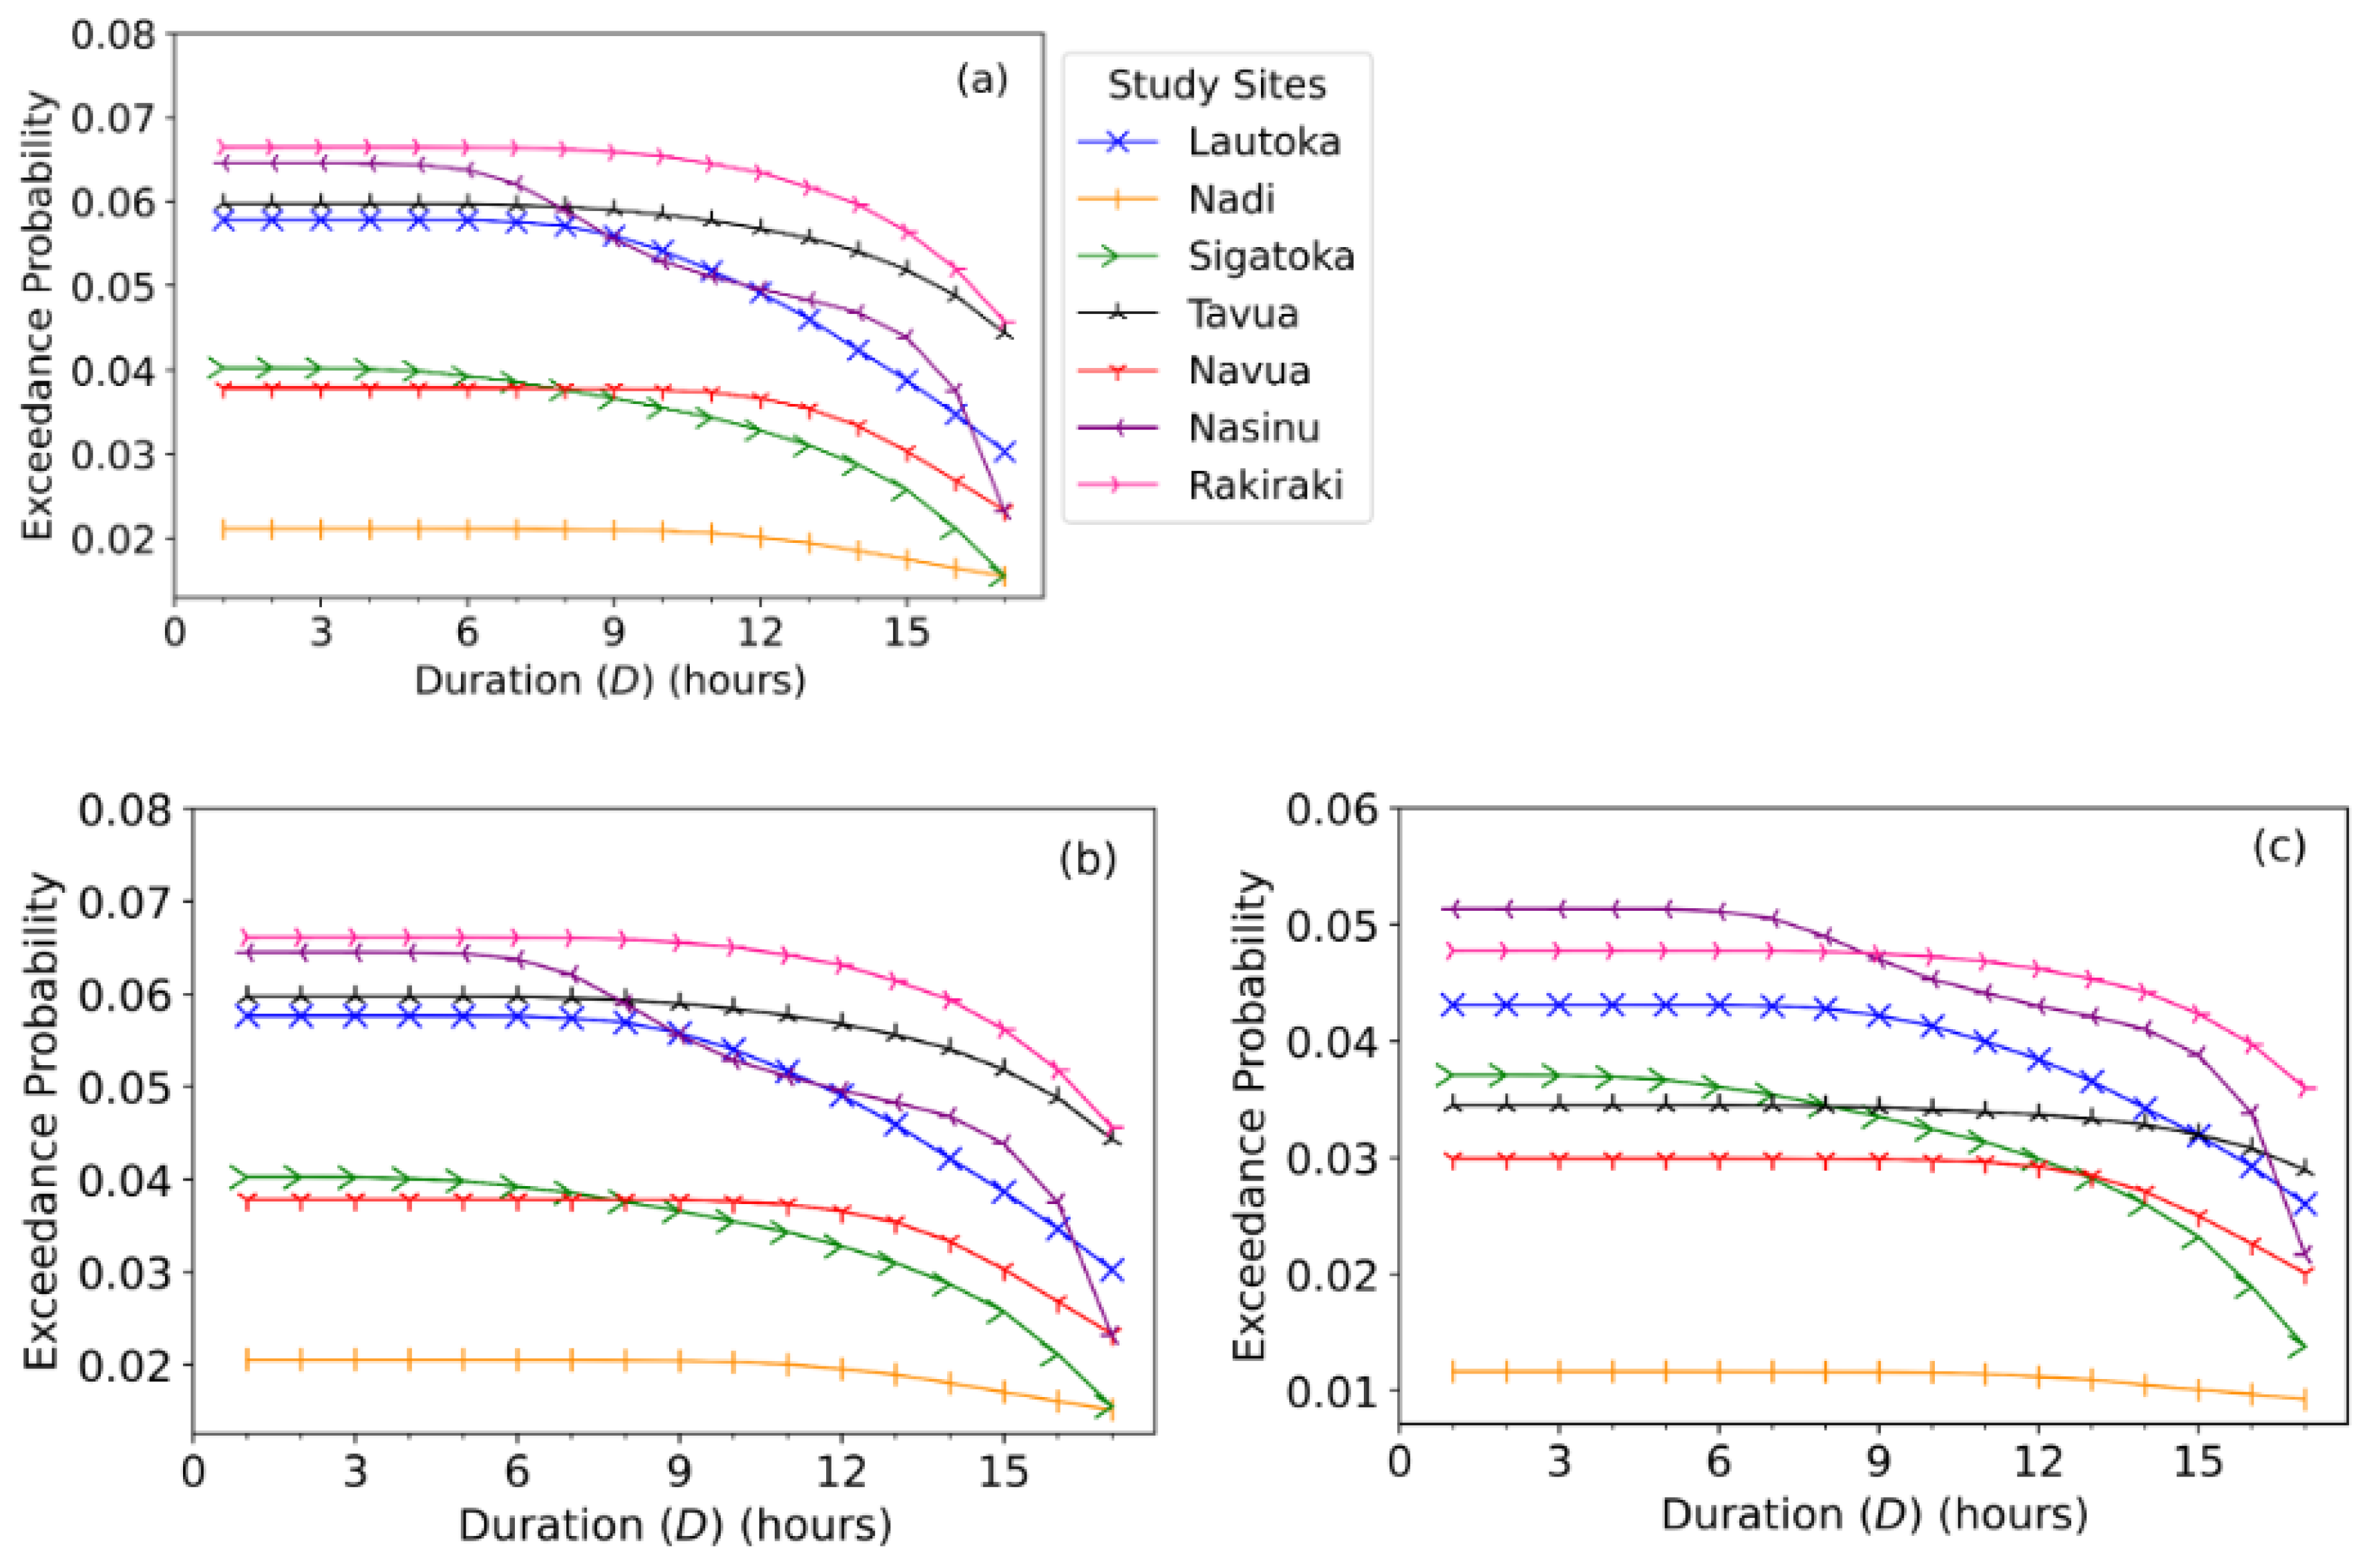

Table 1.
Geographic settings and the relevant metadata of hourly rainfall for the different study sites. Note that the hourly rainfall spans from January 1, 2014, to December 31, 2018, with 43,824 expected observations.
Table 1.
Geographic settings and the relevant metadata of hourly rainfall for the different study sites. Note that the hourly rainfall spans from January 1, 2014, to December 31, 2018, with 43,824 expected observations.
| Study Site | Location | Missing Data | Average | Maximum |
|---|---|---|---|---|
| (%) | Hourly Rainfall (mm) | Hourly Rainfall (mm) | ||
| Ba | 17.53 °S, 177.66 °E | 23.76 | 0.24 | 56.00 |
| Lautoka | 17.62 °S, 177.45 °E | 0.83 | 0.19 | 83.50 |
| Nadi | 17.78 °S, 177.44 °E | 1.17 | 0.27 | 260.00 |
| Nasinu | 18.07 °S, 178.51 °E | 1.18 | 0.33 | 72.00 |
| Navua | 18.22 °S, 178.17 °E | 1.57 | 0.36 | 62.50 |
| Rakiraki | 17.39 °S, 178.07 °E | 3.76 | 0.23 | 68.50 |
| Sigatoka | 18.14 °S, 177.51 °E | 1.99 | 0.21 | 59.00 |
| Tavua | 17.44 °S, 177.86 °E | 3.45 | 0.16 | 57.50 |
Table 2.
Analysis of the 5 severest flood events for different study sites in Fiji from 2014 to 2018. (a) Nadi, (b) Lautoka, (c) Nasinu, (d) Navua, (e) Rakiraki, (f) Sigatoka, (g) Tavua. Note that D = total number of hours between start and end of a flood event, V = sum of between start and end, and Q = maximum during a flood situation as per Eqs. 4-6.
Table 2.
Analysis of the 5 severest flood events for different study sites in Fiji from 2014 to 2018. (a) Nadi, (b) Lautoka, (c) Nasinu, (d) Navua, (e) Rakiraki, (f) Sigatoka, (g) Tavua. Note that D = total number of hours between start and end of a flood event, V = sum of between start and end, and Q = maximum during a flood situation as per Eqs. 4-6.
| Study Site | Onset Time | Volume | Duration | Peak | Total | Total Rain | Maximum | |
|---|---|---|---|---|---|---|---|---|
| () | () | () (hrs) | () | (mm) | ||||
| a | Nadi | |||||||
| 1 | 29-01-2014 at 8 a.m. | 157.28 | 49 | 6.80 | 10557.06 | 1590 | 416.05 | |
| 2 | 08-02-2017 at 4 a.m. | 11.88 | 18 | 1.31 | 1316.32 | 195.40 | 109.56 | |
| 3 | 04-04-2016 at 8 a.m. | 6.86 | 20 | 0.87 | 1108.52 | 161.40 | 84.87 | |
| 4 | 07-01-2014 at 6 p.m. | 6.31 | 10 | 1.73 | 715.09 | 84 | 133.10 | |
| 5 | 15-01-2014 at 6 p.m. | 5.77 | 13 | 1.18 | 794.02 | 84 | 102.03 | |
| b | Lautoka | |||||||
| 1 | 14-01-2018 at 2 p.m. | 25.05 | 19 | 3.29 | 1315.15 | 175 | 126.10 | |
| 2 | 06-04-2016 at 2 a.m. | 23.95 | 19 | 2.27 | 1283.34 | 180 | 96.59 | |
| 3 | 01-04-2014 at 7 a.m. | 18.39 | 13 | 3.49 | 935.98 | 109 | 131.92 | |
| 4 | 06-02-2017 at 3 p.m. | 11.48 | 20 | 1.53 | 954.55 | 131.50 | 75.40 | |
| 5 | 08-02-2017 at 9 a.m. | 10.85 | 13 | 1.49 | 718.16 | 98 | 74.18 | |
| c | Nasinu | |||||||
| 1 | 27-02-2014 at 9 a.m. | 24.90 | 18 | 2.83 | 1388.83 | 173 | 115.53 | |
| 2 | 21-02-2015 at 6 p.m. | 23.15 | 16 | 2.48 | 1261.37 | 163.50 | 106.16 | |
| 3 | 06-12-2014 at 4 a.m. | 19.15 | 16 | 2.92 | 1155.37 | 140 | 117.79 | |
| 4 | 11-11-2018 at 11 p.m. | 7.46 | 8 | 1.91 | 521.64 | 37 | 91.16 | |
| 5 | 28-05-2018 at 8 a.m. | 7.20 | 7 | 2.10 | 474.23 | 21 | 96.15 | |
| d | Navua | |||||||
| 1 | 15-12-2016 at 6 a.m. | 56.98 | 28 | 4.29 | 2732.99 | 392.50 | 161.35 | |
| 2 | 17-03-2017 at 4 a.m. | 16.37 | 14 | 2.10 | 1023.68 | 114.50 | 99.48 | |
| 3 | 16/01/2014 at 1 a.m. | 9.82 | 14 | 1.16 | 838.28 | 123.50 | 72.87 | |
| 4 | 02-05-2016 at 6 a.m. | 8.15 | 13 | 1.38 | 751.01 | 110 | 79.03 | |
| 5 | 27-02-2014 at 3 p.m. | 7.98 | 10 | 1.61 | 626.25 | 83.50 | 85.60 | |
| 1 | 19-12-2016 at 5 a.m. | 33.99 | 21 | 4.28 | 1783.89 | 265.50 | 170.39 | |
| 2 | 14-01-2018 at 2 p.m. | 19.89 | 17 | 2 | 1199.35 | 156.50 | 97.02 | |
| 3 | 20-02-2016 at 8 p.m. | 16.89 | 17 | 2.68 | 1103.01 | 112.50 | 119.05 | |
| 4 | 17-12-2016 at 4 p.m. | 11.28 | 19 | 1.25 | 989.33 | 145.50 | 73.09 | |
| 5 | 05-03-2017 at 9 a.m. | 10.06 | 15 | 1.52 | 818.03 | 114.50 | 81.73 | |
| f | Sigatoka | |||||||
| 1 | 30-01-2014 at 10 a.m. | 23.32 | 16 | 2.84 | 999.93 | 121 | 92.83 | |
| 2 | 03-02-2018 at 3 p.m. | 15 | 12 | 2.25 | 695.39 | 93 | 79.78 | |
| 3 | 01-05-2018 at 6 p.m. | 11.10 | 14 | 1.67 | 671.12 | 65 | 67.25 | |
| 4 | 04-04-2016 at 12 a.m. | 10.91 | 18 | 1.33 | 789.16 | 103 | 59.79 | |
| 5 | 01-04-2018 at 6 a.m. | 9.74 | 11 | 1.55 | 549.66 | 73 | 64.62 | |
| g | Tavua | |||||||
| 1 | 08-02-2017 at 10 a.m. | 45.88 | 23 | 4.04 | 1612.79 | 238 | 117.34 | |
| 2 | 03-04-2016 at 5 p.m. | 20.37 | 23 | 2.36 | 1023.74 | 154 | 78.55 | |
| 3 | 17-05-2014 at 10 a.m. | 17.16 | 17 | 1.81 | 805.30 | 103.50 | 65.93 | |
| 4 | 06-02-2017 at 11 a.m. | 14.77 | 18 | 1.69 | 774.08 | 89.50 | 63.11 | |
| 5 | 06-03-2017 at 1 p.m. | 14.23 | 17 | 1.75 | 737.52 | 98.50 | 64.47 |
Table 3.
Descriptive statistics of flood characteristics at each study site. Note that D = total number of hours between start and end of a flood event, V = sum of between start and end, and Q = maximum during a flood situation as per Eq. 4-6.
Table 3.
Descriptive statistics of flood characteristics at each study site. Note that D = total number of hours between start and end of a flood event, V = sum of between start and end, and Q = maximum during a flood situation as per Eq. 4-6.
| Flood Characteristic | Site | Min. | Lower Quartile (Q1) | Median (Q2) | Upper Quartile (Q3) | Max. | Mean | Standard Dev. | Skewness | Kurtosis |
|---|---|---|---|---|---|---|---|---|---|---|
| Duration (D) (hours) | Lautoka | 1 | 1 | 3 | 6 | 20 | 4.796 | 4.791 | 1.771 | 5.511 |
| Nadi | 1 | 1 | 3 | 7 | 49 | 5.424 | 7.135 | 4.286 | 24.981 | |
| Rakiraki | 1 | 1 | 3 | 8 | 21 | 5.681 | 5.801 | 1.248 | 3.243 | |
| Tavua | 1 | 2 | 3 | 7 | 23 | 5.525 | 5.749 | 1.590 | 4.492 | |
| Sigatoka | 1 | 1 | 3 | 5 | 18 | 4.413 | 4.578 | 1.746 | 4.848 | |
| Navua | 1 | 1 | 3 | 5 | 28 | 4.367 | 5.003 | 2.753 | 11.676 | |
| Nasinu | 1 | 2 | 3 | 6 | 18 | 4.415 | 4.153 | 1.962 | 6.236 | |
| Volume (V) | Lautoka | 0.003 | 0.204 | 0.633 | 1.983 | 25 | 2.746 | 5.473 | 3.022 | 11.168 |
| Nadi | 0.002 | 0.132 | 0.517 | 2.271 | 157.276 | 4.156 | 20.404 | 7.538 | 55.625 | |
| Rakiraki | 0.005 | 0.097 | 0.529 | 3.038 | 33.993 | 3.272 | 6.329 | 3.257 | 13.998 | |
| Tavua | 0.016 | 0.185 | 0.617 | 2.272 | 45.879 | 3.190 | 7.123 | 4.230 | 22.984 | |
| Sigatoka | 0.021 | 0.220 | 0.632 | 2.834 | 23.316 | 2.826 | 4.777 | 2.523 | 9.293 | |
| Navua | 0.005 | 0.167 | 0.557 | 2.058 | 56.983 | 3.012 | 8.495 | 5.656 | 34.803 | |
| Nasinu | 0.033 | 0.159 | 0.886 | 2.854 | 24.903 | 3.028 | 5.853 | 2.951 | 10.098 | |
| Peak (Q) | Lautoka | 0.003 | 0.179 | 0.348 | 0.701 | 3.490 | 0.597 | 0.725 | 2.519 | 9.356 |
| Nadi | 0.002 | 0.108 | 0.244 | 0.674 | 6.803 | 0.527 | 0.940 | 5.369 | 35.042 | |
| Rakiraki | 0.005 | 0.097 | 0.323 | 0.816 | 4.282 | 0.606 | 0.809 | 2.663 | 10.954 | |
| Tavua | 0.016 | 0.124 | 0.338 | 0.799 | 4.040 | 0.573 | 0.688 | 2.719 | 12.339 | |
| Sigatoka | 0.021 | 0.207 | 0.393 | 1.121 | 2.841 | 0.718 | 0.714 | 1.369 | 3.945 | |
| Navua | 0.005 | 0.167 | 0.401 | 0.723 | 4.289 | 0.601 | 0.747 | 2.924 | 13.398 | |
| Nasinu | 0.033 | 0.139 | 0.419 | 0.916 | 2.915 | 0.720 | 0.763 | 1.566 | 4.596 |
Table 4.
The statistical correlation in terms of the Pearson’s correlation coefficient (r) and the Spearman’s rank correlation coefficient () computed between the pairs of various flood characteristics in respect to the Duration (D, in hours), Volume (V) and Peak (Q) for each study site. D = total number of hours between start and end of a flood event, V = sum of between start and end and Q = maximum during a flood situation (see Eq. 4-6).
Table 4.
The statistical correlation in terms of the Pearson’s correlation coefficient (r) and the Spearman’s rank correlation coefficient () computed between the pairs of various flood characteristics in respect to the Duration (D, in hours), Volume (V) and Peak (Q) for each study site. D = total number of hours between start and end of a flood event, V = sum of between start and end and Q = maximum during a flood situation (see Eq. 4-6).
| Study Site | D & V | D & Q | V & Q | |||
|---|---|---|---|---|---|---|
| Lautoka | 0.895 | 0.941 | 0.860 | 0.877 | 0.931 | 0.971 |
| Nadi | 0.863 | 0.950 | 0.929 | 0.891 | 0.924 | 0.978 |
| Rakiraki | 0.855 | 0.934 | 0.842 | 0.902 | 0.949 | 0.987 |
| Sigatoka | 0.895 | 0.929 | 0.810 | 0.869 | 0.887 | 0.979 |
| Tavua | 0.838 | 0.946 | 0.859 | 0.902 | 0.942 | 0.960 |
| Navua | 0.891 | 0.937 | 0.937 | 0.892 | 0.899 | 0.982 |
| Nasinu | 0.942 | 0.945 | 0.895 | 0.844 | 0.896 | 0.964 |
Table 5.
The duration (D) (hours), volume (V), and peak (Q) at the 50th-quantile (median), 75th-quantile (moderate), and 95th-quantile (extreme) for each study site.
Table 5.
The duration (D) (hours), volume (V), and peak (Q) at the 50th-quantile (median), 75th-quantile (moderate), and 95th-quantile (extreme) for each study site.
| Flood Characteristic | Study Site | 50th-quantile | 75th-quantile | 95th-quantile |
|---|---|---|---|---|
| D (hours) | Lautoka | 3 | 6 | 15 |
| Nadi | 3 | 7 | 13 | |
| Rakiraki | 3 | 8 | 17 | |
| Tavua | 3 | 7 | 17 | |
| Sigatoka | 3 | 5 | 16 | |
| Navua | 3 | 5 | 14 | |
| Nasinu | 3 | 6 | 16 | |
| Average | 3 | 6 | 15 | |
| V | Lautoka | 0.633 | 1.983 | 13.898 |
| Nadi | 0.517 | 2.271 | 6.365 | |
| Rakiraki | 0.529 | 3.038 | 15.205 | |
| Tavua | 0.617 | 2.272 | 14.767 | |
| Sigatoka | 0.632 | 2.834 | 11.054 | |
| Navua | 0.557 | 2.058 | 9.149 | |
| Nasinu | 0.866 | 2.854 | 19.153 | |
| Average | 0.622 | 2.473 | 12.799 | |
| Q | Lautoka | 0.348 | 0.701 | 1.840 |
| Nadi | 0.244 | 0.674 | 1.365 | |
| Rakiraki | 0.323 | 0.816 | 1.976 | |
| Tavua | 0.338 | 0.799 | 1.750 | |
| Sigatoka | 0.393 | 1.121 | 2.305 | |
| Navua | 0.401 | 0.723 | 1.694 | |
| Nasinu | 0.419 | 0.916 | 2.477 | |
| Average | 0.352 | 0.821 | 1.915 |
Disclaimer/Publisher’s Note: The statements, opinions and data contained in all publications are solely those of the individual author(s) and contributor(s) and not of MDPI and/or the editor(s). MDPI and/or the editor(s) disclaim responsibility for any injury to people or property resulting from any ideas, methods, instructions or products referred to in the content. |
© 2024 by the authors. Licensee MDPI, Basel, Switzerland. This article is an open access article distributed under the terms and conditions of the Creative Commons Attribution (CC BY) license (http://creativecommons.org/licenses/by/4.0/).
Copyright: This open access article is published under a Creative Commons CC BY 4.0 license, which permit the free download, distribution, and reuse, provided that the author and preprint are cited in any reuse.


