
Submitted:
12 April 2024
Posted:
15 April 2024
You are already at the latest version
Preprints on COVID-19 and SARS-CoV-2
Abstract
COVID-19, caused by the SARS-CoV-2 virus, has spread around the world and killed around 6.9 million people. Rapid and accurate diagnosis is essential for preventing and controlling the disease, reducing transmission and consequently saving lives. RT-PCR is the gold standard test used to detect the disease. However, the test is expensive and the result is time-consuming, which makes mass testing difficult, especially in countries with limited resources. In addition, the test has high analytical specificity and low diagnostic sensitivity, which leads to false-negative results. Several studies in the literature report the presence of hematological and biochemical alterations in infected patients and use these alterations with machine learning algorithms to help diagnose the disease. Therefore, this article presents the results obtained by different neural network architectures based on Adaptive Resonance Theory (ART) for the diagnosis of COVID-19. The study was conducted in two distinct stages: the first consisted of selecting the best ART network among several, using three open-access datasets and comparing the results with the literature. In the second stage, the chosen model was tested on a dataset containing patients from various hospitals in four countries. In addition, the model was subjected to external validation, including data from a country not present during the training and adjustment of the model, in order to validate the robustness and generalization capacity of the model. The results obtained by the ART networks in this study are promising, outperforming not only classical models, but also the deep learning models often used in the literature. Validation on data from different countries strengthens the model’s reliability and effectiveness.
Keywords:
Adaptive Resonance Theory
; Artificial Neural Networks
; Blood tests
; Coronavirus
; COVID-19
1. Introduction
On Dec. 31 2019, the severe acute respiratory syndrome coronavirus 2 (SARS-CoV-2) causing coronavirus disease (COVID-19) was discovered in Wuhan in China. The virus has spread rapidly around the world and as of Apr. 21 2020 there were more than 2.3 million confirmed cases and a total of 162.000 deaths [1]. Currently, the virus has infected more than 775 million people and caused the deaths of 7 million worldwide [2]. Despite the high number of recorded deaths, the World Health Organization estimates the total number of deaths directly or indirectly from COVID-19 to be 14.9 million people [3], three times higher than recorded.
The symptoms of COVID-19 can be divided into three categories being common symptoms such as fever, cough, tiredness and loss of taste or smell, less common symptoms such as sore throat, headache, myalgia and diarrhea, and the critical symptoms which are dyspnea, loss of speech, mobility or confusion and chest pain [4]. Despite having several symptoms, a large proportion of infected people do not experience them. According to Wang et al. [5] the proportion of asymptomatic people may represent about a third or a fifth of the total number of cases.
Although infected individuals develop mild or moderate disease and recover without hospitalization, a proportion of those infected may have severe symptoms, requiring hospitalization or intensive care unit (ICU) treatment.
To ensure the prevention of COVID-19, it is crucial to implement effective measures of detection, isolation and immediate medical care for infected people, in order to contain the spread of the virus [6,7,8,9]. This approach has proved effective in combating the spread of COVID-19. It is worth noting that, in addition to overloading the health system, the spread of the virus can have considerable economic impacts [10]. The costs associated with treating infected patients put significant pressure on health systems, especially in regions with limited resources [10]. Infected patients may require a diverse range of medical resources, from hospitalization in wards and ITUs to specialized interventions [11,12].
Among the various tests available to detect the disease, the reverse transcription polymerase chain reaction (RT-PCR) test, which detects the genetic material of the virus, is considered the gold standard for detecting COVID-19 and is carried out by collecting nasopharyngeal and/or oropharyngeal secretions [13]. Although RT-PCR has high analytical specificity, its diagnostic sensitivity is limited, especially in the early stages of infection, when the viral concentration may not be high enough to produce accurate results, leading to possible false negative results [14,15,16,17]. In addition, SARS-CoV-2 is an RNA virus prone to mutations, and since the beginning of the spread of the virus we have seen the emergence of several variants with different replication capacities and clinical manifestations [18]. Furthermore, the test has some limitations for testing patients on a large scale, requiring certified laboratories, expensive equipment and trained personnel, as well as the delay in obtaining results [19,20]. These limitations become even more serious in countries with limited resources, such as underdeveloped countries [21].
In addition to the RT-PCR mentioned above, computed tomography (CT) and X-ray have also been proposed to aid in the detection of COVID-19, playing a powerful role in detecting and judging the progression of the disease [22,23,24,25,26,27]. However, these tests are not efficient for the proper management of patients and the control of the spread of the virus, as their sensitivity and specificity are higher only in advanced stages of COVID-19 or other diseases [28,29,30], as these tests detect characteristics associated with COVID-19, such as lesions and lung inflammation, when the disease is already at an advanced stage of lung involvement. This is because the virus needs to replicate and cause significant damage to the lungs before changes are visible on the images. In addition, these exams subject patients to significant doses of ionizing radiation, which can pose major health risks [31,32].
Currently, machine learning has been an important tool to help doctors diagnose various diseases [33,34], including COVID-19 [35,36,37]. Studies have made use of this technology to detect COVID-19, either through images such as x-rays or CT scans, or through laboratory tests [38,39,40], since many clinical studies have shown hematological changes in infected patients [41,42,43,44]. While others focus on analyzing how these parameters vary throughout the course of the disease and their relationship with more serious clinical outcomes [45,46,47]. Given the need for efficient and more accurate diagnoses in the early stages of COVID-19, the relevant attributes of laboratory tests can be used to train machine learning algorithms, making it possible to predict the risk and evolution of the disease, as well as the early classification of infected patients. It is worth noting that laboratory tests have the advantage of being relatively more accessible in terms of cost compared to RT-PCR and imaging tests such as x-rays and CT scans, as well as avoiding exposure to radiation. This approach, based on hematological evaluations, could enable its use on a large scale, with specialist algorithms, which is especially relevant for developing countries with limited resources to carry out RT-PCR tests on the entire population, thus avoiding adverse social and economic impacts.
Several studies in the literature have used machine learning to detect COVID-19 from laboratory tests. One of the first articles, by Wu et al. [35], used the Random Forest (RF) algorithm with data collected from hospitals in China, achieving an AUC-ROC of 0.9926 in predicting patients with COVID-19. However, the model underperformed when tested with external samples. The authors Batista et al. [48] used data collected in a hospital in São Paulo, Brazil, and trained five algorithms for the detection of COVID-19 patients, Support Vector Machine (SVM) and RF were the ones that showed the best results, with an AUC-ROC of 0.847.
Sun et al. [36] employed the SVM algorithm to predict severe or critical cases of COVID-19 with patient data from a clinical center in China, obtaining a sensitivity of 77.5%, specificity of 78.4% and AUC-ROC of 0.9757. Tordjman et al. [49] developed a strategy using binary logistic regression (LR) to estimate the probability of a patient being diagnosed with COVID-19 before RT-PCR, achieving an AUC-ROC of 0.918, with sensitivity and specificity of 79% and 90%, respectively. Yang et al. [50] created a model using routine laboratory tests of patients at a medical center in the United States, and among the models tested, the Gradient Boosting Decision Tree (GBDT) obtained the best performance with an AUC-ROC of 0.854 in the internal validation and 0.838 in the external validation.
Joshi et al. [51] developed a decision support tool using LR to predict COVID-19 negative patients. The model achieved AUC-ROC of 0.78 for Stanford Health Care data, with AUC-ROC ranging from 0.75 to 0.81 at other centers. Goodman-Meza et al. [52] combined the probabilities of several algorithms to detect COVID-19 patients, achieving an AUC-ROC of 0.91 after adding certain tests such as ferritin, CRP and LDH. AlJame et al. [53] proposed ERLX, a model that stacks algorithms such as extremely randomized trees (ET), RF, LR and Extreme Gradient Boosting (XGB) to diagnose COVID-19 patients from blood tests, obtaining an AUC-ROC of 0.9938. Brinati et al. [21] proposed a model capable of predicting which patients were or were not infected with COVID-19, using data from patients admitted to the San Raffaele Hospital in Italy. Among the various algorithms tested, RF obtained the best performance, achieving an AUC-ROC of 0.84, sensitivity of 92% and specificity of 65%.
Alakus and Turkoglu [54] used a dataset containing hematological and biochemical attributes of patients from the Hospital Israelita Albert Einstein in São Paulo, Brazil, to train six deep learning architectures, with the aim of detecting patients with COVID-19. The best performance was obtained with Long Short-Term Memory (LSTM), achieving AUC-ROC of 0.625 in cross-validation and AUC-ROC of 0.90 in hold-out validation. Kukar et al. [55] created Smart Blood Analytics (SBA), a model for diagnosing COVID-19 from blood tests using algorithms such as RF, Deep Neural Network (DNN) and XGB. The best result with an AUC-ROC of 0.97 was obtained by XGB.
Using patient data from the Kepler University Hospital in Linz, Austria, Tschoellitsch et al. [56] applied the RF algorithm to predict the RT-PCR result using blood tests, achieving an AUC-ROC of 0.74. Soltan et al. [57] trained three models to identify COVID-19 patients in emergency departments and verify the need for hospitalization from patient data from Oxford University Hospitals in the UK. The best performance was obtained with XGB, achieving AUC-ROC of 0.939 in detecting patients and 0.94 in predicting hospitalization.
Cabitza et al. [58] evaluated several algorithms, including RF, Naive Bayes (NB), LR, SVM and KNN, to predict COVID-19 patients using data from patients admitted to the San Raphael Hospital in Italy. The models achieved AUC-ROC between 0.74 and 0.90, and during internal-external validation, they obtained AUC-ROC between 0.75 and 0.78. Alves et al. [59] developed a decision tree-based model to aid in the diagnosis of COVID-19 and provide explanations to healthcare teams, achieving AUC-ROC of 0.87, sensitivity of 67% and specificity of 91%. Rahman et al. [60] created the QCoVSML model, which uses stacked machine learning and a nomogram scoring system to detect COVID-19 based on biomarkers. Seven different datasets were used, and the combined model achieved an AUC-ROC of 0.96 and accuracy of 91.45%. There are many other studies that make use of laboratory tests and demonstrate the ability of machine learning algorithms to assist in medical decision-making, speeding up the diagnosis of the disease.
Although the algorithms used have achieved promising results, it is essential to recognize that they have some limitations, especially those based on backpropagation. According to Grossberg [61], these limitations include offline training, catastrophic forgetting, slow learning and sensitivity to outliers. To overcome these problems, Grossberg [62] developed Adaptive Resonance Theory (ART), which is described in detail in Section 2.
Therefore, this article presents the use of neural networks based on Adaptive Resonance Theory (ART) for the classification of COVID-19, using laboratory tests (blood tests) in order to improve the detection of infected patients. Comparisons were made between seven different ART architectures, including online training algorithms. The most successful architecture was subjected to a dataset containing laboratory tests from patients from different countries. This aspect is of paramount importance, as it allows us to evaluate the algorithm’s ability to detect relevant patterns and characteristics in data from different sources, thus increasing its usefulness in a global detection context.
2. Adaptive Resonance Theory
Developed Adaptive resonance theory in order to solve the stability-plasticity dilemma [63], such a dilemma can be understood as the ability of the network to remain able to adapt or group input patterns, and continue learning even with the inclusion of new patterns, without catastrophically forgetting its past knowledge Carpenter and Grossberg [64], this being a fundamental characteristic of ART family networks.
The first architecture based on this theory was developed by Grossberg [62] and named Grossberg Network (GN), in 1987, the ART1 network was created with the purpose of binary grouping patterns and was based on the GN network of Grossberg [64]. In the same year, Carpenter and Grossberg [65] improved ART1 creating ART2. This new network had the purpose of processing patterns with binary or continuous values. Considering the need to solve problems with analog input patterns, in 1991 Carpenter et al. [66], based on ART1 [64], developed the ART Fuzzy neural network (Figure 1), which employs the fuzzy min operator (∧) in place of the intersection operator (∩) present in ART1 network. The first ART network with supervised training was developed by Carpenter et al. [67] and has two interconnected ART modules, the ART module receives and processes the input pattern. In contrast, the ART module receives the desired response for the presented pattern, and the Inter-ART module is in charge of performing the “matching” between the two ART modules. The following year Carpenter et al. [68] presented the Fuzzy ARTMAP that also has supervised training. However, its calculations are based on Fuzzy Logic [69].
Different ART network architectures have been tested in order to find the one that best classifies the data. These architectures have different characteristics, whether in their topology (cluster geometry), training method (supervised or unsupervised) or online learning capacity (Continuous Training), these characteristics appear in isolation or combined in the models to optimize data classification. The networks used in this study were:
- Self-expanding Fuzzy ART Neural Network [66]
- Self-Expanding Euclidean ART neural network [70]
- Self-Expanding Fuzzy ARTMAP neural network [68]
- Self-expanding Fuzzy ART neural network with Continuous Training [71]
- Self-expanding Fuzzy ARTMAP neural network with Continuous Training [71]
- Self-expanding Euclidean ARTMAP neural network with Continuous Training [73]
Although the self-expanding mechanism is not present in the original structure of the first three models, it was used because it adds advantages, as will be discussed in Section 2.5. The other characteristics will be detailed in Section 2.1, Section 2.2, Section 2.3, Section 2.4 and Section 2.6.
In these architectures, some parameters play a fundamental role in controlling the functioning of the model, namely , and . The parameter, also known as the learning rate (), is crucial, indicating the extent to which new patterns will influence the category when the weights are updated in the next training cycle. The parameter, or training rate (), regulates the speed of training, with lower values indicating a slower process and values close to 1 implying faster training. Finally, the parameter, or vigilance parameter (), plays a crucial role in determining the degree of similarity required to create a new category. These parameters are essential for adjusting the network’s dynamics and adapting it effectively to the input data.
2.1. ART - Unsupervised
Unsupervised ART models are effective in environments where the training data does not need to be labeled. The model’s independence from labels allows it to autonomously explore the complexity of the data and identify relevant patterns. The basic architecture of an ART network can be seen in Figure 1, and consists of three levels, the F comparison level, the F recognition level and the F level responsible for pre-processing the data, in which the input data is normalized and encoded (Fuzzy Topology). In addition, there is a reset mechanism responsible for controlling the degree of similarity of the patterns associated with the same category.
It is worth noting that, although they adopt an unsupervised approach, labels are assigned to each cluster after the model has been trained. This process is explained in detail in Section 3.4.
Algorithm 1: Algorithm ART. |
|
Input: Input data, parameters [, , (Fuzzy)]
Output: Cluster
|
2.2. ARTMAP - Supervised
The ARTMAP model with supervised learning is made up of two ART modules, ART and ART, as shown in Figure 2. Unlike their unsupervised counterparts, these modules do not operate in the dark. They use both the input data and the corresponding labels, providing guidance during training. Furthermore, ARTMAP doesn’t just passively accept information. It actively searches for meaningful connections. The inter-ART associative memory module is responsible for checking whether there is a match between the input patterns and the output. The vigilant match-tracking mechanism minimizes prediction errors and maximizes the model’s ability to generalize. The weight matrices associated with the ART (), ART () and Inter-ART () modules are initialized with values equal to 1, indicating the absence of active categories. However, as training takes place, there is resonance between the input patterns and the output, causing specific categories to be activated. This dynamic activation process allows ARTMAP to learn and adapt in a controlled manner.
Although it is a powerful architecture, it is a model sensitive to noise in the labels due to supervised learning, accuracy can be compromised if the labels are inaccurate or noisy.
| Algorithm 2: ARTMAP algorithm. |
|
Input: Input data, parameters [, , (Fuzzy)]
Output: Cluster
|
2.3. Fuzzy Topology in ART Networks
In the fuzzy topology, ART networks use the fuzzy logic connectives developed by [69]. These connectives are used both to assess the similarity between input patterns and in the vigilance test. Furthermore, in this topology the data needs to be normalized and coded by complement as specified by Equation (1) and (2), in order to avoid the proliferation of categories [68].
The Equation (3) in turn is responsible for checking the similarity between the input pattern and the existing categories, the winning category will be the one with the greatest similarity to the input data as seen in the Equation (4). The j index refers to the cluster in which the calculations are being performed, while the J index identifies the winning category in this process.
Resonance occurs if the vigilance criterion given by Equation (5) is met. This process acts as a filter preventing the unbridled creation of categories. It ensures that only significantly different patterns trigger the formation of new categories, preventing the network from becoming full of redundant categories. The parameter sets the threshold for this filter, determining the level of similarity required between an input pattern and the existing categories for the network to accept it or not within the cluster.
When resonance is achieved, the network starts a weight adjustment process, as detailed in Equation (6). In this way, the weights associated with the winning category are modified to accommodate the new pattern.
By using fuzzy logic in the network calculations, together with normalization and complement coding, the clusters take the form of hyperrectangles, giving flexibility to the complexity of the input patterns.
2.4. Euclidean Topology in ART Networks
By adopting Euclidean topology, ART networks use Euclidean distance as a metric to measure the proximity between input patterns and existing categories. As a result, the network generates hyperspheres centered on the cluster representing the class, instead of hyperectangles. This approach eliminates the need to normalize and encode the input vector, thus reducing computational costs [72]. The Equation (7) indicates how the distance between the input pattern and the existing clusters is calculated. The category chosen is the one with the smallest distance according to Equation (8), in contrast to the fuzzy approach, where the choice is based on maximum activation.
The vigilance criterion will be given by Equation (9) and follows a similar pattern to that used in fuzzy topology, as detailed above in Section 2.3.
Another change is in the Equation (10) responsible for the network’s learning process. Here, the weight matrix () is updated according to a weighted combination of the input pattern () and the previous weight matrix (), controlled by the parameter.
2.5. Self-Expanding Mechanism
The self-expanding mechanism proposed by Moreno [71,72] starts training the network by adopting the first pattern as the center of the first cluster and expands according to the need to create new clusters, i.e. as the new input patterns do not fit into the pre-existing categories, a new cluster is created to allocate that pattern. This modification reduces the processing time and, consequently, the computational expense [71,72], as it only checks the similarity of active clusters, unlike traditional architectures, in which similarity is checked with all clusters, including inactive ones. Furthermore, when inputting data that is incompatible with any of the existing clusters, the network starts a new cluster with the new pattern that is not in resonance with the input data and the empty cluster. These changes do not alter the stability of the network or compromise its ability to recognize new information in the training data.
| Algorithm 3: Self-expansion mechanism algorithm. |
|
Require: Initialization of the weight matrix with the first pattern
|
2.6. Continuous Training in ART Neural Networks
The continuous training strategy enables networks to learn online and continuously so that prediction and training are carried out constantly, making them more efficient. This approach eliminates the need to restart training when incorporating new data, resulting in a network that constantly adjusts to changes in the environment. The inclusion of this module in ART networks is only possible due to their characteristics of stability and plasticity [72]. With online learning, there is no need to restart training when new data becomes available; this module allows new patterns to be added to the network’s memory permanently [72].
In order to incorporate this module, the network needs to have temporary and definitive categories, a necessary process so that data that appears rarely is not incorporated into the network’s memory. In addition, two new parameters are added: the first, called the permanence parameter (), defines the number of patterns needed for a temporary category to become definitive. The second, called the novelty index (), checks for the need to update the weights of the definitive category, discarding information that is not very relevant to the network, avoiding overloading the network’s memory [72]. Whenever a pattern belongs to a temporary cluster, resonance will occur; on the other hand, if the category to which the pattern belongs is definitive, resonance will only occur if the distance/similarity between the entry and the center of the category is greater than the parameter () [72].
Thus, Equation (3) and Equation (7) are calculated for their respective topologies, for both temporary and permanent categories. The selection process remains the same. If the chosen category is definitive and passes the surveillance criterion, resonance will only occur if the condition imposed by Equation (11) (Fuzzy) or Equation (12) (Euclidean) is met, i.e. resonance will only occur if the pattern is significantly different.
3. Application of ART Networks in the diagnosis of COVID-19
The simulations were carried out using ten open-access datasets. These datasets contain information on clinical biomarkers collected from patients in hospitals located in Brazil, Spain, Italy and Ethiopia. The number of instances and features contained in each of the datasets can be seen in Table 1.
The methodology used in this article consisted of two stages. In the first stage, the main objective was to select the best ART model from the seven architectures tested. In the second stage, the model selected in the previous stage was used to verify its generalization capacity in relation to data from different countries. Specific details of each stage are described in Section 3.1 and Section 3.2, respectively.
3.1. First Stage
In this stage, three different data sets were selected: Data, Data and Data. This choice was made considering the diversity of attributes and the fact that they have been subjected to simulations with various algorithms, including deep learning models. This is to make it easier to compare the performance of the ART models with those in the literature. The Table 2 presents in detail the attributes present in each dataset used in this stage, providing an overview of the attributes used during the experiments conducted.
The simulations were conducted using the same attributes as those previously used by other researchers. More specifically, the Data set underwent the same pre-processing carried out by Brinati et al. [21]. This set contains data from patients who were admitted to the IRCCS San Raffaele Hospital, located in Segrate, in the province of Milan, Italy, between February and March 2020.
The Data set was used in the same way as in Cabitza et al. [58]. This set includes the results of routine blood tests carried out on 1925 patients admitted to the emergency room of San Raffaele Hospital between mid-February and May 2020.
For its part, the Data set was made available pre-processed by Alakus and Turkoglu [54]. This set was obtained from data made available by the Hospital Israelita Albert Einstein1. The data was collected from 5644 patients and contains information from 111 laboratory tests carried out on patients treated at the hospital located in São Paulo, Brazil. It is worth noting that all datasets were used without any modification.
3.2. Second Stage
In this stage, Data, Data, Data, Data, Data, Data, Data and Data were merged to create a new dataset containing hematological information from different countries. This combination was carried out in order to provide more comprehensive information to verify the model’s ability to predict COVID-19, since hematological parameters are influenced by individual factors such as age, gender and lifestyle, as well as population and ecological factors such as ethnic origin, climate, exposure to pathogens and altitude [75,76,77].
The Table 3 shows the averages and standard deviations of the common attributes between all the data sets. The Variance Inflation Factor (VIF) and the Mann-Whitney (MW) test [78] were used to carefully select the attributes for the simulations.
The MW test is a non-parametric statistical technique used to compare the medians of two independent samples [78,79]. The test was used to check for significant differences between the classes in relation to each attribute analyzed. The determination of statistical significance was established at a confidence level of , which indicates that values of p below this threshold are considered statistically significant, indicating relevant differences between the medians of the compared groups.
On the other hand, VIF is a statistical measure used to assess multicollinearity between variables. It is obtained from the elements on the main diagonal of the inverse correlation matrix, as expressed in Equation (14) [80].
Where represents the correlation matrix, and is the matrix of centered and reduced data. It is important to note that the matrix will be invertible if, and only if, the rank () is complete, i.e. the columns/rows of are linearly independent [81]. The literature points out that VIF values above 5.0 or 10.0 indicate the presence of multicollinearity [82]. On this basis, it was decided not to include attributes with a VIF above 8.0 in the simulations.
The results obtained after the tests are shown in Table 4. The attributes highlighted were selected for the simulations because they were relevant in both tests. It is worth noting that attributes expressed as percentages were not included in the selection, even though they were indicated as relevant by the tests. The decision to exclude these attributes was based on the consideration that absolute values have clinical significance and provide more complete information than relative values (%) [83].
The selected attributes are part of the white blood series and play a fundamental role in the immune system, helping to fight infections, viruses and bacteria. Analyzing the attributes, it was possible to see some relevant information in relation to patients affected by COVID-19, such as the reduction in cell counts, such as basophils (Figure 3b), eosinophils (Figure 3c) and lymphocytes (Figure 3d). These factors are supported in the literature by authors such as Kermali et al. [84], Samprathi and Jayashree [85] and Keykavousi et al. [86].
After using the combined data set to train and test the model, it was subjected to an external validation process using the Data and Data sets to assess its ability to generalize on data never before seen by the model. It is worth noting that the same attributes used in training and testing were also used in the external validation phase. Data1 was chosen because it comes from Italy, a country already present in the training data, but with data collected in a different period, while Data11 was selected because it comes from Spain, a different country to those included in the training.
3.3. Evaluation Metrics
To evaluate the performance obtained by each network some metrics frequently present in the literature were used such as accuracy (ACC), sensitivity (Se), specificity (Sp), F-Score (F), Matthews correlation coefficient (MCC) given respectively by (15), (16), (17), (18), and (19) [87,88,89].
Along with the metrics mentioned above, we use the ROC (Receiver Operating Characteristics) curve to evaluate the quality of the model classification. This curve is generated by plotting the Sensitivity and False Positive Rate ( Specificity) for different thresholds of the probability estimated by the model. Based on [90] work, the AUC (Area Under the Curve) can be understood as a summary of the ROC curve, the AUC value and the quality of the model can be seen in Table 5.
3.4. Classifier
In the unsupervised learning models, it was necessary to use a classifier to convert the clusters to the respective classes of the problem, “COVID-19” and “non-COVID-19”. The probability required to generate the ROC curves was also extracted in this step, in which the number of patterns contained in each cluster and the class to which it belonged were analyzed. For example, suppose 10 patterns are allocated to a certain cluster during training, of which 9 are from patients with COVID-19. In this case, this cluster will be labeled as COVID-19 by majority vote, the probability of being COVID-19 will be 0.9, and the complementary probability, that is, of the patient being non-COVID-19 will be 0.1, any pattern allocated to this cluster in the test stage will receive this probability. It is worth noting that for the ARTMAP models that have supervised learning it was not possible to extract the probability and consequently generate the ROC curve, due to the model having discrete output.
3.5. Validation
To partition the data, the hold-out cross-validation method was used, randomly dividing the data into training and test sets based on a pre-determined rate. In addition, the best model found during hold-out validation on each data set was subjected to the repeated hold-out method, also known as Monte Carlo cross-validation [91,92], was employed as a way to obtain a more consistent estimate of model performance. The data was partitioned using the 70–30 ratio, that is, 70% of the samples for training and 30% for testing. For Monte Carlo cross-validation, the process was repeated 50 times, with the data split randomly in each repetition.
4. Computational Results
This section will present the results obtained for COVID-19 diagnostics using the ART networks on each dataset.
4.1. Primeita Etapa
4.1.1. Data
The performance of various ART networks was evaluated, and the results are presented in Table 6. The SE Fuzzy ART CT network showed the highest accuracy, reaching 0.871, and also demonstrated the greatest ability in correctly detecting patients with COVID-19, as shown by the sensitivity of 0.926. Notably, fuzzy logic-based networks were found to perform better than Euclidean distance-based networks for this particular dataset.
Considering that the network with the best performance in the simple hold-out validation was the SE Fuzzy ART CT, it was used in the Monte Carlo validation to evaluate the network’s generalization ability. Table 7 shows the mean metrics as well as the 95% confidence interval (CI) for the Monte Carlo validation.
To illustrate the results obtained by the best network in each iteration of the Monte Carlo validation, Figure 5 shows the ACC, Se, and Sp for each iteration. It can be seen that the network’s performance was not constant in all iterations, reaching a maximum accuracy of 0.9294 and a minimum of 0.7176. On the other hand, Figure 6 presents the average ROC curve and the average AUC obtained by the network in this validation. According to [90], an AUC score above 0.8 can be considered a good performance achieved by the network.
4.1.2. Data
Table 8 presents the results obtained by the networks for Data. The tested model’s achieved approximate performance with MCC ≈ 0.5, and the SE Fuzzy ART CT network achieved the best result, almost perfectly detecting positive and negative patients for COVID-19. Although the SE Euclidean ART CT network achieved the best result in specificity, it was not the best model since it correctly detected only 54.7% of the COVID-19 patients.
The SE Fuzzy ART CT Network, which demonstrated the best performance, was subjected to Monte Carlo cross-validation to ensure the reliability of the results, reducing the risk of overfitting. The results are presented in Table 9, where the average results and 95% confidence intervals for the different metrics are presented. The network’s performance was remarkable, with an average accuracy of 0.9348, indicating that it successfully classified the data. In addition, the network obtained an MCC of 0.8721, a vital performance measure that considers the balance between sensitivity and specificity.
Figure 7 illustrates the network’s performance in ACC, Se, and Sp for each iteration of the Monte Carlo validation. The results showed that the network was highly stable performing well in almost all iterations. The network achieved a maximum accuracy of 0.9775 and a minimum of 0.875, and of the 50 iterations, only five were below 0.91 in accuracy. These results suggest that the network is highly robust and can be used effectively for the classification task. It should also be noted that the stability in the network’s performance over the different iterations of the Monte Carlo validation strongly indicates its generalizability and ability to handle different types of input data.
4.1.3. Data
This dataset needs to more balanced, containing 13.33% data from patients with COVID-19 and 86.67% non-COVID-19 patients. As expected, this unbalance impaired the classification ability of the implemented models, resulting in a low predictive performance as can be seen in Table 10.
When working with unbalanced classes, evaluating the performance of a model can be challenging, as traditionally used metrics such as accuracy, sensitivity, and specificity can be misleading and may not provide an accurate representation of model performance [87,88]. Instead, it is recommended to use metrics suitable for unbalanced data, such as the Matthews Correlation Coefficient (MCC) and Area Under the ROC Curve (AUC) [88,89].
In this context, the best performing network for the dataset in question was the SE Euclidean ART CT, achieving an MCC of 0.876. This indicates that the model had a strong correlation between the predicted and actual classes, taking into account both true and false positives and negatives. Table 11 presents the average metrics as well as the 95% confidence interval obtained by the SE Euclidean ART CT network after Monte Carlo validation.
By analyzing the results presented in Table 11, it can be seen that the specificity obtained by the network was very high, with a value of 99.65%. This result was expected since most of the dataset samples were from patients who were not infected with COVID-19. However, the average sensitivity obtained by the network was only 0.4714, which indicates that the network did not perform well in detecting COVID-19 positive cases.
Looking at the MCC, a suitable metric for unbalanced data sets, it is noted that the SE Euclidean ART CT network obtained an average MCC of 0.6195 after Monte Carlo validation. While this is not a high value, it is still considered acceptable. Comparing the results obtained in Table 10 and Table 11, it is evident that there was a reduction in the network’s performance after Monte Carlo validation. The network could not correctly detect positive COVID-19 cases in some iterations of the validation, with the sensitivity falling below 30% in some iterations, as illustrated in Figure 9.
The ROC curve and the AUC can be seen in Figure 10. By analyzing them, we can see that while specificity remained relatively stable at all cut-off points, there was considerable variation in sensitivity, i.e., the ability to detect positive patients correctly. The mean AUC was 0.7458, with a standard deviation of 0.1265, achieving acceptable performance according to [90].
Table 12 Comparison the results obtained by the neural networks used in this paper and the results found in the literature for the same data sets. The table includes metrics such as ACC, Se, Sp, MCC, F, and AUC (ROC).
The results obtained for Data were quite promising, as the SE Fuzzy ART CT network achieved AUC of 0.8501 and 0.8006 in hold-out and Monte Carlo validation, respectively. These results were better than those obtained by commonly used models such as RF and ET, often used for classification tasks. Although the performance of the SE Fuzzy ART CT network was good, the DNN deep learning model used by [93] obtained even better results, achieving an AUC value of 0.9220.
When examining the results for Data, it can be seen that the SE Fuzzy ART CT network achieved outstanding performance. It obtained an AUC of 0.9481 in the hold-out validation, indicating high accuracy in distinguishing between COVID-19 positive and negative patients. It outperformed machine learning models traditionally used in classification tasks such as ET, KNN, and even the deep learning algorithm DNN, which achieved an AUC of 0.9320. The sensitivity of the ART network was also significantly higher at 97.03%, indicating it is effective in correctly identifying positive patients. It is worth noting that even when the SE Fuzzy ART CT network was subjected to Monte Carlo cross-validation, it maintained its good performance with an AUC of 0.9395, outperforming DNN once again.
For Data, the SE Euclidean ART CT network achieved AUC of 0.8962, a result similar to that obtained with the CNN-LSTM model used by [54], which achieved AUC of 0.9000. However, after performing Monte Carlo cross-validation, a decrease in the performance of the SE Euclidean ART CT network was observed due to a significant imbalance between classes.
The Comparison of the computational time (in seconds) between the two best models implemented in this paper (SE Fuzzy ART CT and SE Euclidean ART CT), with the best model obtained by [93] the Deep Neural Network (DNN), can be seen in Table 13. It is worth noting that the computational time given in the table considers only the training and testing time. Also, the best algorithms for each dataset are highlighted in bold.
When analyzing the computational time in Table 13, it is clear that the ART networks showed significantly faster convergence than the DNN. This is due to the nature of the network and accentuated by the self-expansion mechanism. In addition, it can be seen that the Euclidean distance-based neural network obtained a slightly shorter time than the fuzzy neural network. This difference can be attributed to the fact that the Euclidean network not requiring normalization and encoding of the input data. Consequently, the size of the input data entered into the Euclidean network is halved, leading to faster processing. Another relevant feature of ART networks is that they do not suffer from catastrophic forgetting, unlike those based on the back-propagation algorithm and deep learning models, as reported by [61].
4.2. Second Stage
In this second stage, we sought to compare the performance of the winning model from the previous stage, SE Fuzzy ART CT, with traditional models frequently used in the literature. To do this, the combination of data described in Section 3.2 was used. Algorithms such as K-Nearest Neighbors (KNN), Random Forest (RF), Multi-layer Perceptron (MLP), Logistic Regression (LR), Extra Trees (ET), XGBoost (XGB) and Naive Bayes (NB) were implemented in Python with the Scikit-Learn library [94]. The parameters of each model were optimized using the GridSearchCV method, exploring various combinations of hyperparameters in order to identify the one that resulted in the best performance. The results obtained are presented in the Table 14, highlighting the superiority of the ART network over traditional models, achieving an MCC of 0.9628.
In addition, the Figure 11 shows the ROC curve and AUC for each model. The SE Fuzzy ART CT network obtained the best AUC, with a value of 0.9770, indicating that it has a high ability to distinguish between classes. Among the traditional models tested, the RF algorithm obtained the best performance, with AUC and MCC of 0.8504 and 0.5510, respectively. However, these results are significantly lower than those of the ART network. The RF algorithm’s ability to distinguish between classes is around 12% lower than that of the ART network.
The Table 15 and Figure 12 show, respectively, the metrics and the ROC curve along with the AUC of the models trained with the combined data and validated with Dados, i.e. the data collected in Spain.
Although it showed a slight decline in performance when compared to the results presented in Table 15 and Figure 11, the SE Fuzzy ART CT network still outperformed the traditional models, which also showed a reduction in performance when tested with the new data. The model obtained an AUC of 0.9759, a significantly better performance than the traditional models, which obtained AUCs of 0.8413 for XGB and 0.8409 for RF.
When the SE Fuzzy ART CT network trained with the combined data was submitted to the Data validation set, there was a reduction in its performance compared to the results obtained with the combined data. This reduction was only 1.71% in terms of AUC, from 0.9770 to 0.9606. The traditional models, on the other hand, showed an increase of less than 0.01% in relation to the AUC obtained with the combined data. However, even with this reduction in performance, the ART network still remained the most effective model in distinguishing between patients with and without COVID-19.
4.3. Discussão
The combined analysis of the two stages highlights not only the effectiveness of SE Fuzzy ART CT in detecting COVID-19, but also its ability to handle new patient data. In the first part, it did better than other models mentioned in the literature. In the second stage, when we compared conventional models with SE Fuzzy ART CT, we confirmed its superiority. The network’s results remained consistent even with data from different countries. The online training capacity, combined with the unsupervised training, were the attributes responsible for the excellent performance and places it as an adaptable and promising tool for accurate, real-time classifications.
In addition to its positive results, the study also addresses some limitations listed by other articles. A study by [95], for example, cites the lack of patients from other geographical locations as a limitation. [95] states that it is necessary to consider patients from different demographic groups in order to establish reliable results. This study addresses this limitation by training and testing the models on data from several hospitals in four countries. This allows the results to be more representative of the population.
In addition, the study tests models with unsupervised learning, a limitation pointed out in the work by [96]. Since unsupervised learning allows models to learn to identify patterns in the data without the need for labels.
5. Conclusion
This article presents the results obtained by neural networks based on Adaptive Resonance Theory (ART) for the classification of COVID-19, using laboratory tests (blood tests) in order to correctly classify infected and healthy patients. A comparison was made between seven different ART architectures, including online training algorithms. The most successful architecture was subjected to a dataset made up of laboratory tests from patients in different countries. When comparing the results of the first stage, it can be seen that the self-expanding fuzzy ART network with continuous training (SE Fuzzy ART CT) and the self-expanding Euclidean ART network with continuous training (SE Euclidean ART CT) outperformed the other ART networks implemented. In addition, in some cases, the networks outperformed the DNN and CNN deep learning models frequently used in the literature. The SE Fuzzy ART CT obtained an AUC of 0.8501 for Data, 0.9481 for Data and 0.8962 for Data. When considering computational time, the self-expanding ART neural networks with continuous training were more efficient in the three data sets tested.
In the second stage, the self-expanding SE Fuzzy ART CT that won out in the first stage was subjected to a data set from various hospitals in four countries. This network was compared with traditional algorithms in the literature, maintaining an excellent performance that significantly outperformed all traditional models. Even during external validation with data from a different country to that included in the training, validating its generalization capacity.
In addition to the superior results compared to most of the models analyzed, the networks used do not face the main problems associated with traditional algorithms, such as slow learning, catastrophic forgetting and off-line training. Thus, these results highlight the potential of networks based on adaptive resonance theory, such as SE Fuzzy ART CT and SE Euclidean ART CT, as highly effective and reliable tools to aid in the detection of COVID-19, reducing the false negative rate of RT-PCR or even as a viable solution for detection in places with limited resources or underdeveloped countries.
Despite the promising results obtained by the ART networks, in future studies we intend to reduce the size of the data sets, selecting the most significant attributes to detect healthy and COVID-19 patients, and we can also add more information to aid classification, such as the use of imaging tests or symptoms. In addition, it is possible to make some adjustments to the models to improve the quality of the classification, such as modifying the normalization used, extending the research to the parameter, using the k-Fold cross-validation method as a way of validating and evaluating the model’s generalization capacity.
Author Contributions
Conceptualization, R.J.d.S. and M.L.M.L; methodology, R.J.d.S.; software, R.J.d.S.; validation, R.J.d.S., C.R.d.S.J, M.L.M.L, T.A and C.R.M; formal analysis, R.J.d.S., C.R.M and M.L.M.L; investigation, R.J.d.S. and M.L.M.L; resources, R.J.d.S.; data curation, R.J.d.S.; writing—original draft preparation, R.J.d.S.; writing—review and editing, M.L.M.L, C.R.d.S.J, T.A and C.R.M; visualization, R.J.d.S.; supervision, M.L.M.L; project administration, M.L.M.L; funding acquisition, M.L.M.L and C.R.M All authors have read and agreed to the published version of the manuscript.
Funding
This work was supported by National Council for Scientific and Technological Development (CNPq) and Coordenação de Aperfeiçoamento de Pessoal de Nível Superior - Brasil (CAPES) - Finance Code 001.
Institutional Review Board Statement
Not applicable.
Informed Consent Statement
Not applicable.
Data Availability Statement
The data used to support the findings of this study are available from the corresponding author upon request.
Conflicts of Interest
The authors declare no conflict of interest.
References
- World Health Organization. Coronavirus disease 2019 (covid-19) situation report 92, 2020. https://www.who.int/emergencies/diseases/novel-coronavirus-2019/situation-reports (Accessed on Feb 2, 2024).
- World Health Organization. Coronavirus disease (covid-19) dashboard, 2020. https://covid19.who.int/ (Accessed on Apr. 6, 2024).
- World Health Organization. 14.9 million excess deaths associated with the covid-19 pandemic in 2020 and 2021, 2020. www.who.int/news/item/05-05-2022-14.9-million-excess-deaths-were-associated-with-the-covid-19-pandemic-in-2020-and-2021 (Accessed on Dec 5, 2023).
- World Health Organization. Coronavirus disease (covid-19)., 2020. https://www.who.int/health-topics/coronavirus/#tab=tab_3 (Accessed on Apr. 6, 2024).
- Wang, Y.; Zheng, K.; Gao, W.; Lv, J.; Yu, C.; Wang, L.; Wang, Z.; Wang, B.; Liao, C.; Li, L. Asymptomatic and pre-symptomatic infection in Coronavirus Disease 2019 pandemic. Medical Review 2022, 2, 66–88. [Google Scholar] [CrossRef] [PubMed]
- Weissleder, R.; Lee, H.; Ko, J.; Pittet, M.J. COVID-19 diagnostics in context. Science translational medicine 2020, 12, eabc1931. [Google Scholar] [CrossRef]
- Corman, V.; Bleicker, T.; Brünink, S.; Drosten, C.; Landt, O.; Koopmans, M.; Zambon, M.; Peiris, M. Diagnostic detection of Wuhan coronavirus 2019 by real-time RT-PCR. Geneva: World Health Organization 2020, 13. [Google Scholar]
- Zhang, L.; Xiao, M.; Wang, Y.; Peng, S.; Chen, Y.; Zhang, D.; Zhang, D.; Guo, Y.; Wang, X.; Luo, H.; et al. Fast screening and primary diagnosis of COVID-19 by ATR–FT-IR. Analytical chemistry 2021, 93, 2191–2199. [Google Scholar] [CrossRef]
- Salathé, M.; Althaus, C.L.; Neher, R.; Stringhini, S.; Hodcroft, E.; Fellay, J.; Zwahlen, M.; Senti, G.; Battegay, M.; Wilder-Smith, A.; et al. COVID-19 epidemic in Switzerland: on the importance of testing, contact tracing and isolation. Swiss medical weekly 2020. [Google Scholar] [CrossRef] [PubMed]
- Kaye, A.D.; Okeagu, C.N.; Pham, A.D.; Silva, R.A.; Hurley, J.J.; Arron, B.L.; Sarfraz, N.; Lee, H.N.; Ghali, G.; Gamble, J.W.; et al. Economic impact of COVID-19 pandemic on healthcare facilities and systems: International perspectives. Best Practice & Research Clinical Anaesthesiology 2021, 35, 293–306. [Google Scholar] [CrossRef]
- Gholipour, K.; Behpaie, S.; Iezadi, S.; Ghiasi, A.; Tabrizi, J.S. Costs of inpatient care and out-of-pocket payments for COVID-19 patients: A systematic review. PLOS ONE 2023, 18, 1–18. [Google Scholar] [CrossRef] [PubMed]
- An, X.; Xiao, L.; Yang, X.; Tang, X.; Lai, F.; Liang, X.H. Economic burden of public health care and hospitalisation associated with COVID-19 in China. Public Health 2022, 203, 65–74. [Google Scholar] [CrossRef] [PubMed]
- Reis, A.A.d.S.; Santos, R.d.S. The gold standard on the molecular diagnosis for COVID19: What do we know about the sovereignty of this method? Brazilian Journal of Health Review 2020, 3, 5986–5992. [Google Scholar] [CrossRef]
- Hope, M.D.; Raptis, C.A.; Shah, A.; Hammer, M.M.; Henry, T.S. A role for CT in COVID-19? What data really tell us so far. The Lancet 2020, 395, 1189–1190. [Google Scholar] [CrossRef] [PubMed]
- Pradhan, A.; Prabhu, S.; Chadaga, K.; Sengupta, S.; Nath, G. Supervised learning models for the preliminary detection of COVID-19 in patients using demographic and epidemiological parameters. Information 2022, 13, 330. [Google Scholar] [CrossRef]
- Ai, T.; Yang, Z.; Hou, H.; Zhan, C.; Chen, C.; Lv, W.; Tao, Q.; Sun, Z.; Xia, L. Correlation of chest CT and RT-PCR testing in coronavirus disease 2019 (COVID-19) in China: a report of 1014 cases. Radiology 2020. [Google Scholar] [CrossRef] [PubMed]
- Tahamtan, A.; Ardebili, A. Real-time RT-PCR in COVID-19 detection: issues affecting the results. Expert review of molecular diagnostics 2020, 20, 453–454. [Google Scholar] [CrossRef] [PubMed]
- Shrestha, L.B.; Foster, C.; Rawlinson, W.; Tedla, N.; Bull, R.A. Evolution of the SARS-CoV-2 omicron variants BA. 1 to BA. 5: Implications for immune escape and transmission. Reviews in Medical Virology 2022, 32, e2381. [Google Scholar] [CrossRef] [PubMed]
- Li, Z.; Yi, Y.; Luo, X.; Xiong, N.; Liu, Y.; Li, S.; Sun, R.; Wang, Y.; Hu, B.; Chen, W.; et al. Development and clinical application of a rapid IgM-IgG combined antibody test for SARS-CoV-2 infection diagnosis. Journal of Medical Virology 2020, 92, 1518–1524. [Google Scholar] [CrossRef]
- Kistenev, Y.V.; Vrazhnov, D.A.; Shnaider, E.E.; Zuhayri, H. Predictive models for COVID-19 detection using routine blood tests and machine learning. Heliyon 2022, p.e11185. [CrossRef]
- Brinati, D.; Campagner, A.; Ferrari, D.; Locatelli, M.; Banfi, G.; Cabitza, F. Detection of COVID-19 infection from routine blood exams with machine learning: a feasibility study. Journal of medical systems 2020, 44, 1–12. [Google Scholar] [CrossRef] [PubMed]
- Riquelme, D.; Akhloufi, M.A. Deep learning for lung cancer nodules detection and classification in CT scans. Ai 2020, 1, 28–67. [Google Scholar] [CrossRef]
- Chung, M.; Bernheim, A.; Mei, X.; Zhang, N.; Huang, M.; Zeng, X.; Cui, J.; Xu, W.; Yang, Y.; Fayad, Z.A.; et al. CT Imaging Features of 2019 Novel Coronavirus (2019-nCoV). Radiology 2020, 295, 202–207. [Google Scholar] [CrossRef] [PubMed]
- Suganya, D.; Kalpana, R. Prognosticating various acute covid lung disorders from COVID-19 patient using chest CT Images. Engineering Applications of Artificial Intelligence 2023, 119, 105820. [Google Scholar] [CrossRef]
- Nafisah, S.I.; Muhammad, G.; Hossain, M.S.; AlQahtani, S.A. A Comparative Evaluation between Convolutional Neural Networks and Vision Transformers for COVID-19 Detection. Mathematics 2023, 11. [Google Scholar] [CrossRef]
- Khishe, M.; Caraffini, F.; Kuhn, S. Evolving Deep Learning Convolutional Neural Networks for Early COVID-19 Detection in Chest X-ray Images. Mathematics 2021, 9. [Google Scholar] [CrossRef]
- Hassan, M.M.; AlRakhami, M.S.; Alabrah, A.A.; AlQahtani, S.A. An Intelligent Edge-as-a-Service Framework to Combat COVID-19 Using Deep Learning Techniques. Mathematics 2023, 11. [Google Scholar] [CrossRef]
- Kovács, A.; Palásti, P.; Veréb, D.; Bozsik, B.; Palkó, A.; Kincses, Z.T. The sensitivity and specificity of chest CT in the diagnosis of COVID-19. European radiology 2021, 31, 2819–2824. [Google Scholar] [CrossRef] [PubMed]
- Pan, F.; Ye, T.; Sun, P.; Gui, S.; Liang, B.; Li, L.; Zheng, D.; Wang, J.; Hesketh, R.L.; Yang, L.; et al. Time course of lung changes on chest CT during recovery from 2019 novel coronavirus (COVID-19) pneumonia. Radiology 2020. [Google Scholar] [CrossRef] [PubMed]
- Raptis, C.A.; Hammer, M.M.; Short, R.G.; Shah, A.; Bhalla, S.; Bierhals, A.J.; Filev, P.D.; Hope, M.D.; Jeudy, J.; Kligerman, S.J.; et al. Chest CT and coronavirus disease (COVID-19): a critical review of the literature to date. AJR Am J Roentgenol 2020, 215, 839–842. [Google Scholar] [CrossRef] [PubMed]
- Smith-Bindman, R. CT Radiation and the Risk of Cancer. Current Radiology Reports 2015, 3, 3. [Google Scholar] [CrossRef]
- Wiest, P.W.; Locken, J.A.; Heintz, P.H.; Mettler, F. CT scanning: A major source of radiation exposure. Seminars in Ultrasound, CT and MRI 2002, 23, 402–410. [Google Scholar] [CrossRef]
- Ahsan, M.M.; Luna, S.A.; Siddique, Z. Machine-Learning-Based Disease Diagnosis: A Comprehensive Review. In Proceedings of the Healthcare. MDPI, 2022, Vol. 10, p. 541. [CrossRef]
- Mirzaei, G.; Adeli, H. Machine learning techniques for diagnosis of alzheimer disease, mild cognitive disorder, and other types of dementia. Biomedical Signal Processing and Control 2022, 72, 103293. [Google Scholar] [CrossRef]
- Wu, J.; Zhang, P.; Zhang, L.; Meng, W.; Li, J.; Tong, C.; Li, Y.; Cai, J.; Yang, Z.; Zhu, J.; et al. Rapid and accurate identification of COVID-19 infection through machine learning based on clinical available blood test results. MedRxiv preprint 2020. [Google Scholar] [CrossRef]
- Sun, L.; Song, F.; Shi, N.; Liu, F.; Li, S.; Li, P.; Zhang, W.; Jiang, X.; Zhang, Y.; Sun, L.; et al. Combination of four clinical indicators predicts the severe/critical symptom of patients infected COVID-19. Journal of Clinical Virology 2020, 128, 104431. [Google Scholar] [CrossRef] [PubMed]
- Lv, C.; Guo, W.; Yin, X.; Liu, L.; Huang, X.; Li, S.; Zhang, L. Innovative applications of artificial intelligence during the COVID-19 pandemic. Infectious Medicine 2024, 3, 100095. [Google Scholar] [CrossRef] [PubMed]
- Hussain, L.; Nguyen, T.; Li, H.; Abbasi, A.A.; Lone, K.J.; Zhao, Z.; Zaib, M.; Chen, A.; Duong, T.Q. Machine-learning classification of texture features of portable chest X-ray accurately classifies COVID-19 lung infection. BioMedical Engineering OnLine 2020, 19, 1–18. [Google Scholar] [CrossRef] [PubMed]
- Zargari Khuzani, A.; Heidari, M.; Shariati, S.A. COVID-Classifier: An automated machine learning model to assist in the diagnosis of COVID-19 infection in chest x-ray images. Scientific Reports 2021, 11, 1–6. [Google Scholar] [CrossRef]
- Marar, R.W.; Marar, H.W. A 15-Gbps BiCMOS XNOR gate for fast recognition of COVID-19 in binarized neural networks. International Journal of Electrical and Computer Engineering 2022, 12, 997. [Google Scholar] [CrossRef]
- Carelli, G.Z.; Carvalho, B.R.d.B.; Molin, B.D.; Duarte, C.R.; Martins, G.K.F.; Wendt, G.W.; Silva, M.C.B.; Guedes, S.J.K.O.; Ferreto, L.E.D. Laboratory markers in patients with COVID-19. Research, Society and Development 2020, 9, e30191211115–e30191211115. [Google Scholar] [CrossRef]
- Silva, G.F.R.; Callante, A.A.; Nascimento, D.P.; Araujo, I.P.; Ribeiro, C.H.M.A.; Prete, A.C.L. Comparison of the biochemical and hematological profiles of patients with COVID-19 in their different outcomes: Hospital discharge and death. Research, Society and Development 2022, 11, e25611225772–e25611225772. [Google Scholar] [CrossRef]
- Liu, Y.; Yang, Y.; Zhang, C.; Huang, F.; Wang, F.; Yuan, J.; Wang, Z.; Li, J.; Li, J.; Feng, C.; et al. Clinical and biochemical indexes from 2019-nCoV infected patients linked to viral loads and lung injury. Science China Life Sciences 2020, 63, 364–374. [Google Scholar] [CrossRef] [PubMed]
- Khartabil, T.; Russcher, H.; van der Ven, A.; De Rijke, Y. A summary of the diagnostic and prognostic value of hemocytometry markers in COVID-19 patients. Critical reviews in clinical laboratory sciences 2020, 57, 415–431. [Google Scholar] [CrossRef] [PubMed]
- Palladino, M. Complete blood count alterations in COVID-19 patients: A narrative review. Biochemia medica 2021, 31, 0–0. [Google Scholar] [CrossRef] [PubMed]
- Sun, D.w.; Zhang, D.; Tian, R.h.; Li, Y.; Wang, Y.s.; Cao, J.; Tang, Y.; Zhang, N.; Zan, T.; Gao, L.; et al. The underlying changes and predicting role of peripheral blood inflammatory cells in severe COVID-19 patients: A sentinel? Clinica chimica acta 2020, 508, 122–129. [Google Scholar] [CrossRef] [PubMed]
- Elderdery, A.Y.; Elkhalifa, A.M.; Alsrhani, A.; Zawbaee, K.I.; Alsurayea, S.M.; Escandarani, F.K.; Alhamidi, A.H.; Idris, H.M.; Abbas, A.M.; Shalabi, M.G.; et al. Complete Blood Count Alterations of COVID-19 Patients in Riyadh, Kingdom of Saudi Arabia. Journal of Nanomaterials 2022, 2022. [Google Scholar] [CrossRef]
- Batista, A.F.d.M.; Miraglia, J.L.; Donato, T.H.R.; Chiavegatto Filho, A.D.P. COVID-19 diagnosis prediction in emergency care patients: a machine learning approach. MedRxiv preprint 2020. [Google Scholar] [CrossRef]
- Tordjman, M.; Mekki, A.; Mali, R.D.; Saab, I.; Chassagnon, G.; Guillo, E.; Burns, R.; Eshagh, D.; Beaune, S.; Madelin, G.; et al. Pre-test probability for SARS-Cov-2-related infection score: The PARIS score. PLoS One 2020, 15, e0243342. [Google Scholar] [CrossRef] [PubMed]
- Yang, H.S.; Hou, Y.; Vasovic, L.V.; Steel, P.A.; Chadburn, A.; Racine-Brzostek, S.E.; Velu, P.; Cushing, M.M.; Loda, M.; Kaushal, R.; et al. Routine laboratory blood tests predict SARS-CoV-2 infection using machine learning. Clinical chemistry 2020, 66, 1396–1404. [Google Scholar] [CrossRef] [PubMed]
- Joshi, R.P.; Pejaver, V.; Hammarlund, N.E.; Sung, H.; Lee, S.K.; Furmanchuk, A.; Lee, H.Y.; Scott, G.; Gombar, S.; Shah, N.; et al. A predictive tool for identification of SARS-CoV-2 PCR-negative emergency department patients using routine test results. Journal of Clinical Virology 2020, 129, 104502. [Google Scholar] [CrossRef] [PubMed]
- Goodman-Meza, D.; Rudas, A.; Chiang, J.N.; Adamson, P.C.; Ebinger, J.; Sun, N.; Botting, P.; Fulcher, J.A.; Saab, F.G.; Brook, R.; et al. A machine learning algorithm to increase COVID-19 inpatient diagnostic capacity. Plos one 2020, 15, e0239474. [Google Scholar] [CrossRef] [PubMed]
- AlJame, M.; Ahmad, I.; Imtiaz, A.; Mohammed, A. Ensemble learning model for diagnosing COVID-19 from routine blood tests. Informatics in Medicine Unlocked 2020, 21, 100449. [Google Scholar] [CrossRef] [PubMed]
- Alakus, T.B.; Turkoglu, I. Comparison of deep learning approaches to predict COVID-19 infection. Chaos, Solitons & Fractals 2020, 140, 110120. [Google Scholar] [CrossRef]
- Kukar, M.; Gunčar, G.; Vovko, T.; Podnar, S.; Černelč, P.; Brvar, M.; Zalaznik, M.; Notar, M.; Moškon, S.; Notar, M. COVID-19 diagnosis by routine blood tests using machine learning. Scientific reports 2021, 11, 1–9. [Google Scholar] [CrossRef]
- Tschoellitsch, T.; Dünser, M.; Böck, C.; Schwarzbauer, K.; Meier, J. Machine learning prediction of SARS-CoV-2 polymerase chain reaction results with routine blood tests. Laboratory medicine 2021, 52, 146–149. [Google Scholar] [CrossRef] [PubMed]
- Soltan, A.A.; Kouchaki, S.; Zhu, T.; Kiyasseh, D.; Taylor, T.; Hussain, Z.B.; Peto, T.; Brent, A.J.; Eyre, D.W.; Clifton, D.A. Rapid triage for COVID-19 using routine clinical data for patients attending hospital: development and prospective validation of an artificial intelligence screening test. The Lancet Digital Health 2021, 3, e78–e87. [Google Scholar] [CrossRef]
- Cabitza, F.; Campagner, A.; Ferrari, D.; Resta, C.D.; Ceriotti, D.; Sabetta, E.; Colombini, A.; Vecchi, E.D.; Banfi, G.; Locatelli, M.; et al. Development, evaluation, and validation of machine learning models for COVID-19 detection based on routine blood tests. Clinical Chemistry and Laboratory Medicine (CCLM) 2021, 59, 421–431. [Google Scholar] [CrossRef] [PubMed]
- Alves, M.A.; Castro, G.Z.; Oliveira, B.A.S.; Ferreira, L.A.; Ramírez, J.A.; Silva, R.; Guimarães, F.G. Explaining machine learning based diagnosis of COVID-19 from routine blood tests with decision trees and criteria graphs. Computers in Biology and Medicine 2021, 132, 104335. [Google Scholar] [CrossRef] [PubMed]
- Rahman, T.; Khandakar, A.; Abir, F.F.; Faisal, M.A.A.; Hossain, M.S.; Podder, K.K.; Abbas, T.O.; Alam, M.F.; Kashem, S.B.; Islam, M.T.; et al. QCovSML: A reliable COVID-19 detection system using CBC biomarkers by a stacking machine learning model. Computers in Biology and Medicine 2022, 143, 105284. [Google Scholar] [CrossRef]
- Grossberg, S. A path toward explainable AI and autonomous adaptive intelligence: deep learning, adaptive resonance, and models of perception, emotion, and action. Front Neurorobot 2020, 14, 36. [Google Scholar] [CrossRef] [PubMed]
- Grossberg, S. Adaptive pattern classification and universal recoding: II. Feedback, expectation, olfaction, illusions. Biological cybernetics 1976, 23, 187–202. [Google Scholar] [CrossRef] [PubMed]
- Grossberg, S. How does a brain build a cognitive code? In Studies of mind and brain; Springer, 1982; pp. 1–52. [CrossRef]
- Carpenter, G.A.; Grossberg, S. A massively parallel architecture for a self-organizing neural pattern recognition machine. Computer vision, graphics, and image processing 1987, 37, 54–115. [Google Scholar] [CrossRef]
- Carpenter, G.A.; Grossberg, S. ART 2: Self-organization of stable category recognition codes for analog input patterns. Applied optics 1987, 26, 4919–4930. [Google Scholar] [CrossRef] [PubMed]
- Carpenter, G.A.; Grossberg, S.; Rosen, D.B. Fuzzy ART: Fast stable learning and categorization of analog patterns by an adaptive resonance system. Neural Networks 1991, 4, 759–771. [Google Scholar] [CrossRef]
- Carpenter, G.A.; Grossberg, S.; Reynolds, J.H. ARTMAP: Supervised real-time learning and classification of nonstationary data by a self-organizing neural network. Neural Networks 1991, 4, 565–588. [Google Scholar] [CrossRef]
- Carpenter, G.A.; Grossberg, S.; Markuzon, N.; Reynolds, J.H.; Rosen, D.B. Fuzzy ARTMAP: A neural network architecture for incremental supervised learning of analog multidimensional maps. IEEE Transactions on neural networks 1992, 3, 698–713. [Google Scholar] [CrossRef] [PubMed]
- Zadeh, L.A. Fuzzy sets. Information and control 1965, 8, 338–353. [Google Scholar] [CrossRef]
- Kenaya, R.; Cheok, K.C. Euclidean ART neural networks. In Proceedings of the World Congress on Engineering and Computer Science, San Francisco, US; 2008; pp. 963–968. [Google Scholar]
- Moreno, A.L. ART and ARTMAP Neural Networks with Continuous Training: A detailed presentation of the main types of ART and ARTMAP neural networks.; Novas Edicoes Academicas: Brazil, 2016. (In Portuguese) [Google Scholar]
- Moreno, A.L. Transient stability analysis using a modified Euclidean fuzzy Art-Artmap neural network with continuous training. PhD thesis, São Paulo State University, Ilha Solteira, BR, 2010. Available at: http://hdl.handle.net/11449/100305. (In Portuguese).
- Barros, A.C.; Tonelli-Neto, M.S.; Decanini, J.G.M.S.; Minussi, C.R. Detection and classification of voltage disturbances in electrical power systems using a modified Euclidean ARTMAP neural network with continuous training. Electric Power Components and Systems 2015, 43, 2178–2188. [Google Scholar] [CrossRef]
- Cabitza, F.; Campagner, A.; Soares, F.; de Guadiana-Romualdo, L.G.; Challa, F.; Sulejmani, A.; Seghezzi, M.; Carobene, A. The importance of being external. methodological insights for the external validation of machine learning models in medicine. Computer Methods and Programs in Biomedicine 2021, 208, 106288. [Google Scholar] [CrossRef] [PubMed]
- Odhiambo, C.; Oyaro, B.; Odipo, R.; Otieno, F.; Alemnji, G.; Williamson, J.; Zeh, C. Evaluation of locally established reference intervals for hematology and biochemistry parameters in Western Kenya. Plos one 2015, 10, e0123140. [Google Scholar] [CrossRef] [PubMed]
- Rosenfeld, L.G.; Malta, D.C.; Szwarcwald, C.L.; Bacal, N.S.; Cuder, M.A.M.; Pereira, C.A.; Figueiredo, A.W.; Silva, A.G.d.; Machado, Í.E.; Silva, W.A.d.; et al. Reference values for blood count laboratory tests in the Brazilian adult population, National Health Survey. Brazilian Journal of Epidemiology 2019, 22. (In Portuguese) [Google Scholar] [CrossRef]
- Lugada, E.S.; Mermin, J.; Kaharuza, F.; Ulvestad, E.; Were, W.; Langeland, N.; Asjo, B.; Malamba, S.; Downing, R. Population-based hematologic and immunologic reference values for a healthy Ugandan population. Clinical and Vaccine Immunology 2004, 11, 29–34. [Google Scholar] [CrossRef] [PubMed]
- Mann, H.B.; Whitney, D.R. On a Test of Whether one of Two Random Variables is Stochastically Larger than the Other. The Annals of Mathematical Statistics 1947, 18, 50–60. [Google Scholar] [CrossRef]
- Norman, G.R.; Streiner, D.L. Biostatistics: the bare essentials, 4 ed.; People’s Medical Publishing House-USA: Shelton, Connecticut, 2014. [Google Scholar]
- Montgomery, D.C.; Peck, E.A.; Vining, G.G. Introduction to linear regression analysis; John Wiley & Sons: New York, 2006; p. 612. [Google Scholar]
- Hoffman, K.; Kunze, R.A. Linear Algebra, 2 ed.; PHI Learning, 2004.
- Craney, T.A.; Surles, J.G. Model-Dependent Variance Inflation Factor Cutoff Values. Quality Engineering 2002, 14, 391–403. [Google Scholar] [CrossRef]
- Agnello, L.; Giglio, R.V.; Bivona, G.; Scazzone, C.; Gambino, C.M.; Iacona, A.; Ciaccio, A.M.; Lo Sasso, B.; Ciaccio, M. The Value of a Complete Blood Count (CBC) for Sepsis Diagnosis and Prognosis. Diagnostics 2021, 11. [Google Scholar] [CrossRef] [PubMed]
- Kermali, M.; Khalsa, R.K.; Pillai, K.; Ismail, Z.; Harky, A. The role of biomarkers in diagnosis of COVID-19–A systematic review. Life sciences 2020, 254, 117788. [Google Scholar] [CrossRef] [PubMed]
- Samprathi, M.; Jayashree, M. Biomarkers in COVID-19: an up-to-date review. Frontiers in pediatrics 2021, 8, 607647. [Google Scholar] [CrossRef] [PubMed]
- Keykavousi, K.; Nourbakhsh, F.; Abdollahpour, N.; Fazeli, F.; Sedaghat, A.; Soheili, V.; Sahebkar, A.; et al. A Review of Routine Laboratory Biomarkers for the Detection of Severe COVID-19 Disease. International journal of analytical chemistry 2022, 2022. [Google Scholar] [CrossRef]
- Parikh, R.; Mathai, A.; Parikh, S.; Sekhar, G.C.; Thomas, R. Understanding and using sensitivity, specificity and predictive values. Indian journal of ophthalmology 2008, 56, 45. [Google Scholar] [CrossRef] [PubMed]
- Huang, J.; Ling, C. Using AUC and accuracy in evaluating learning algorithms. IEEE Transactions on Knowledge and Data Engineering 2005, 17, 299–310. [Google Scholar] [CrossRef]
- Boughorbel, S.; Jarray, F.; El-Anbari, M. Optimal classifier for imbalanced data using Matthews Correlation Coefficient metric. PloS one 2017, 12, e0177678. [Google Scholar] [CrossRef] [PubMed]
- Mandrekar, J.N. Receiver operating characteristic curve in diagnostic test assessment. Journal of Thoracic Oncology 2010, 5, 1315–1316. [Google Scholar] [CrossRef]
- Dudoit, S.; van der Laan, M.J. Asymptotics of cross-validated risk estimation in estimator selection and performance assessment. Statistical methodology 2005, 2, 131–154. [Google Scholar] [CrossRef]
- Borra, S.; Di Ciaccio, A. Measuring the prediction error. A comparison of cross-validation, bootstrap and covariance penalty methods. Computational statistics & data analysis 2010, 54, 2976–2989. [Google Scholar] [CrossRef]
- Rikan, S.B.; Azar, A.S.; Ghafari, A.; Mohasefi, J.B.; Pirnejad, H. COVID-19 diagnosis from routine blood tests using artificial intelligence techniques. Biomedical Signal Processing and Control 2022, 72, 103263. [Google Scholar] [CrossRef]
- Pedregosa, F.; Varoquaux, G.; Gramfort, A.; Michel, V.; Thirion, B.; Grisel, O.; Blondel, M.; Prettenhofer, P.; Weiss, R.; Dubourg, V.; et al. Scikit-learn: Machine Learning in Python. Journal of Machine Learning Research 2011, 12, 2825–2830. [Google Scholar]
- Krishnaraj Chadaga, Srikanth Prabhu, V. B.N.S.S.U.; Chadaga, R. Artificial intelligence for diagnosis of mild–moderate COVID-19 using haematological markers. Annals of Medicine 2023, 55, 2233541. [Google Scholar] [CrossRef] [PubMed]
- Chadaga, K.; Prabhu, S.; Bhat, V.; Sampathila, N.; Umakanth, S.; Chadaga, R. A Decision Support System for Diagnosis of COVID-19 from Non-COVID-19 Influenza-like Illness Using Explainable Artificial Intelligence. Bioengineering 2023, 10. [Google Scholar] [CrossRef] [PubMed]
| 1 | The dataset is available at https://www.kaggle.com/einsteindata4u/covid19
|
Figure 1.
Fuzzy ART Architecture.
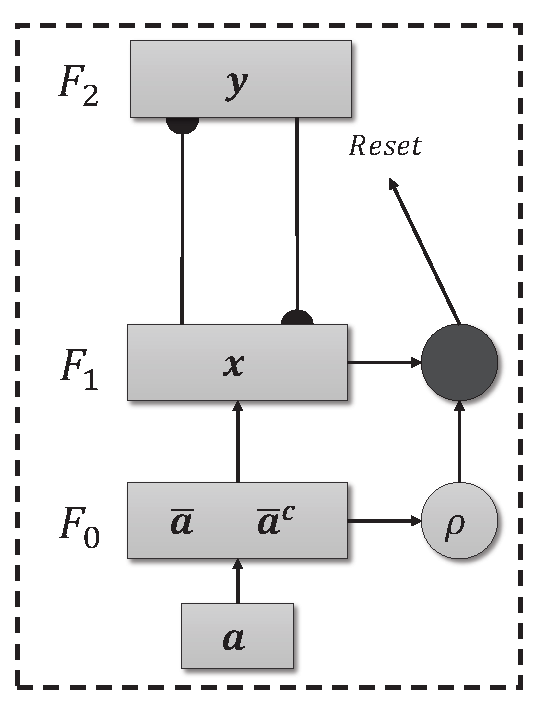
Figure 2.
Architecture ARTMAP.
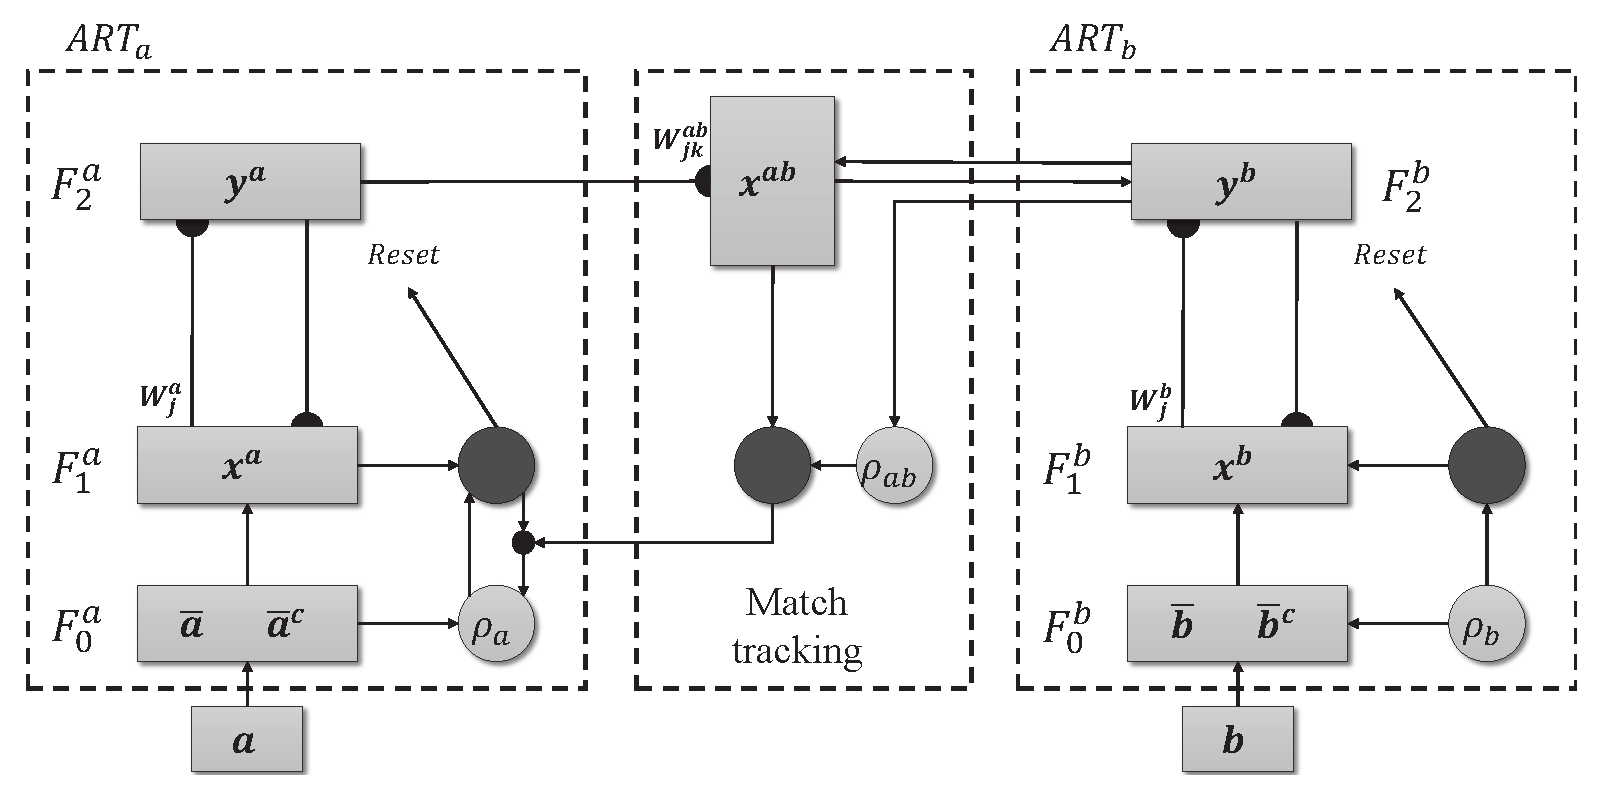
Figure 3.
Histogram and estimate of the probability density function for each of the attributes separated by class.
Figure 3.
Histogram and estimate of the probability density function for each of the attributes separated by class.
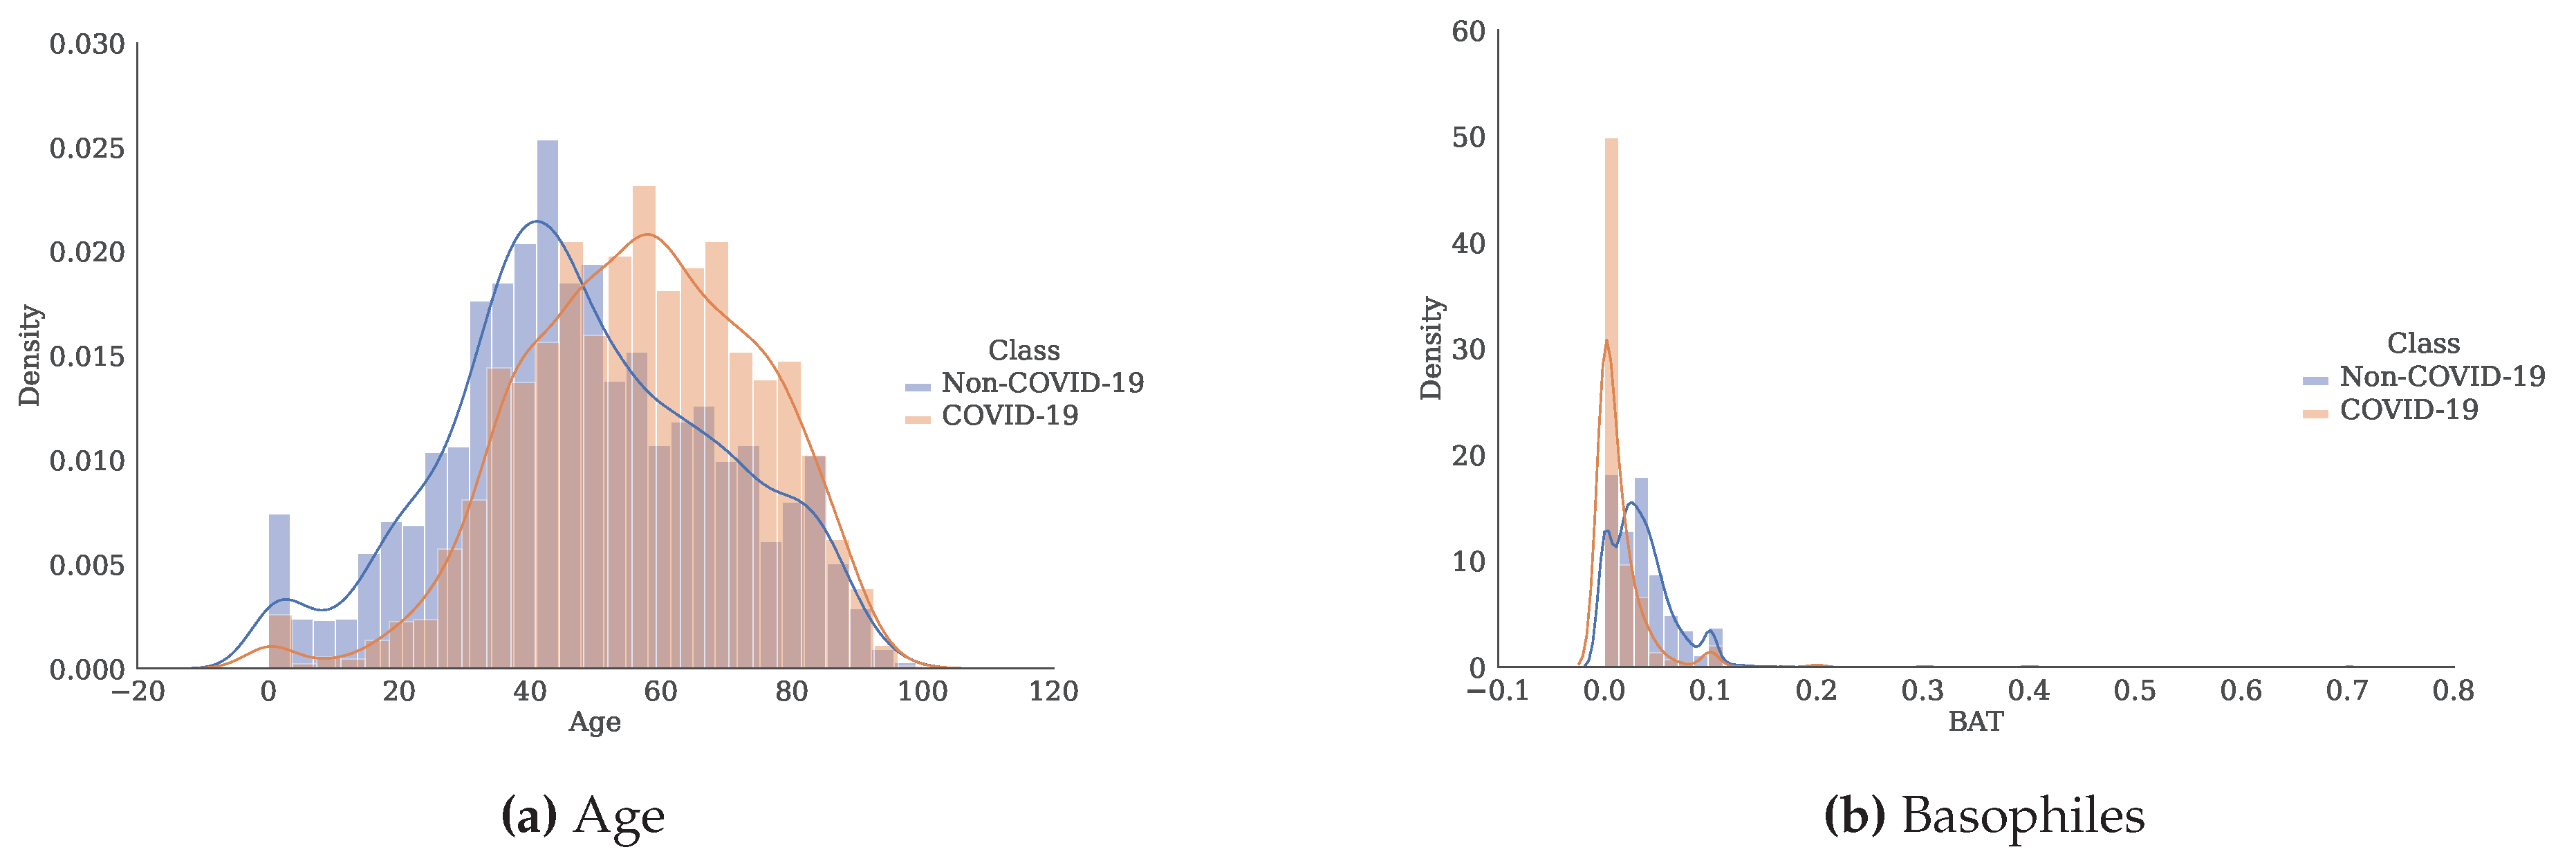
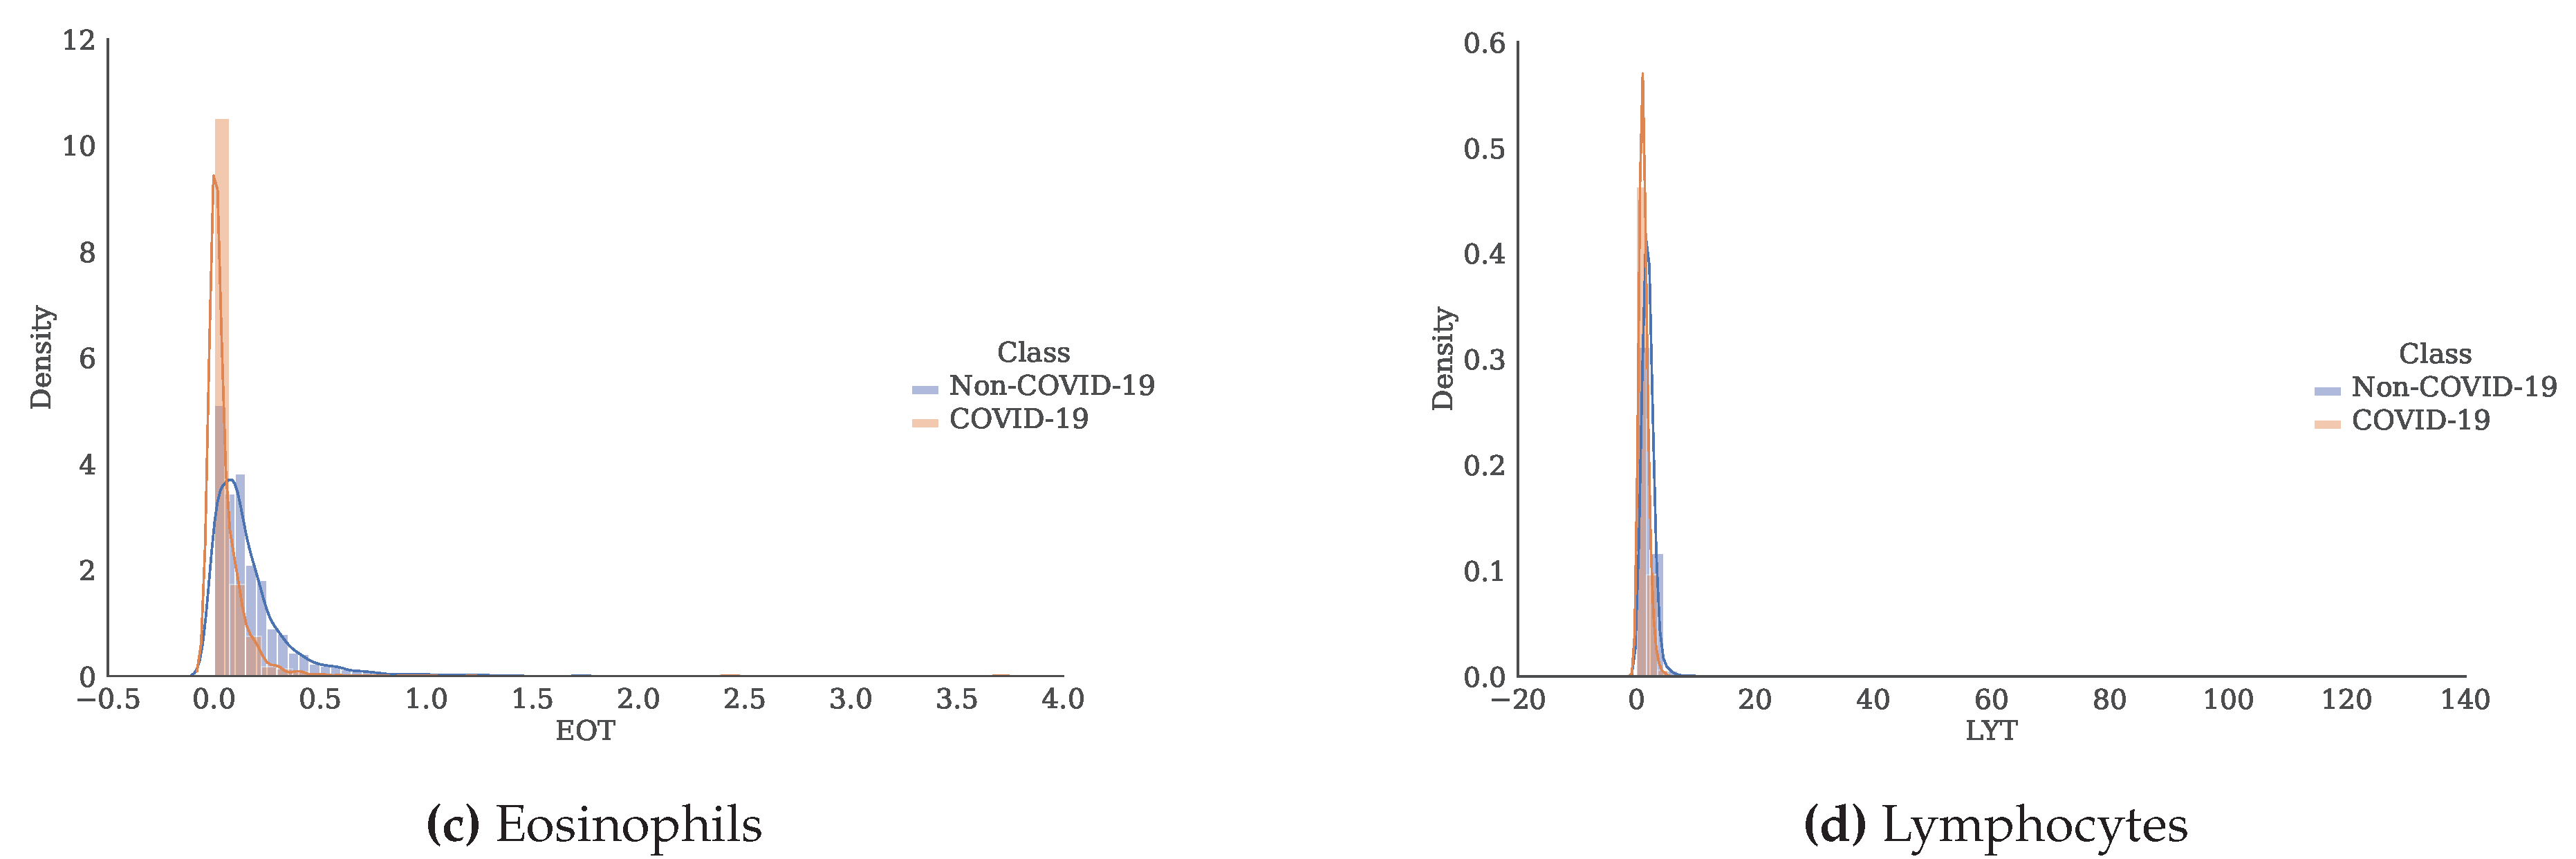
Figure 4.
Validation Overview.
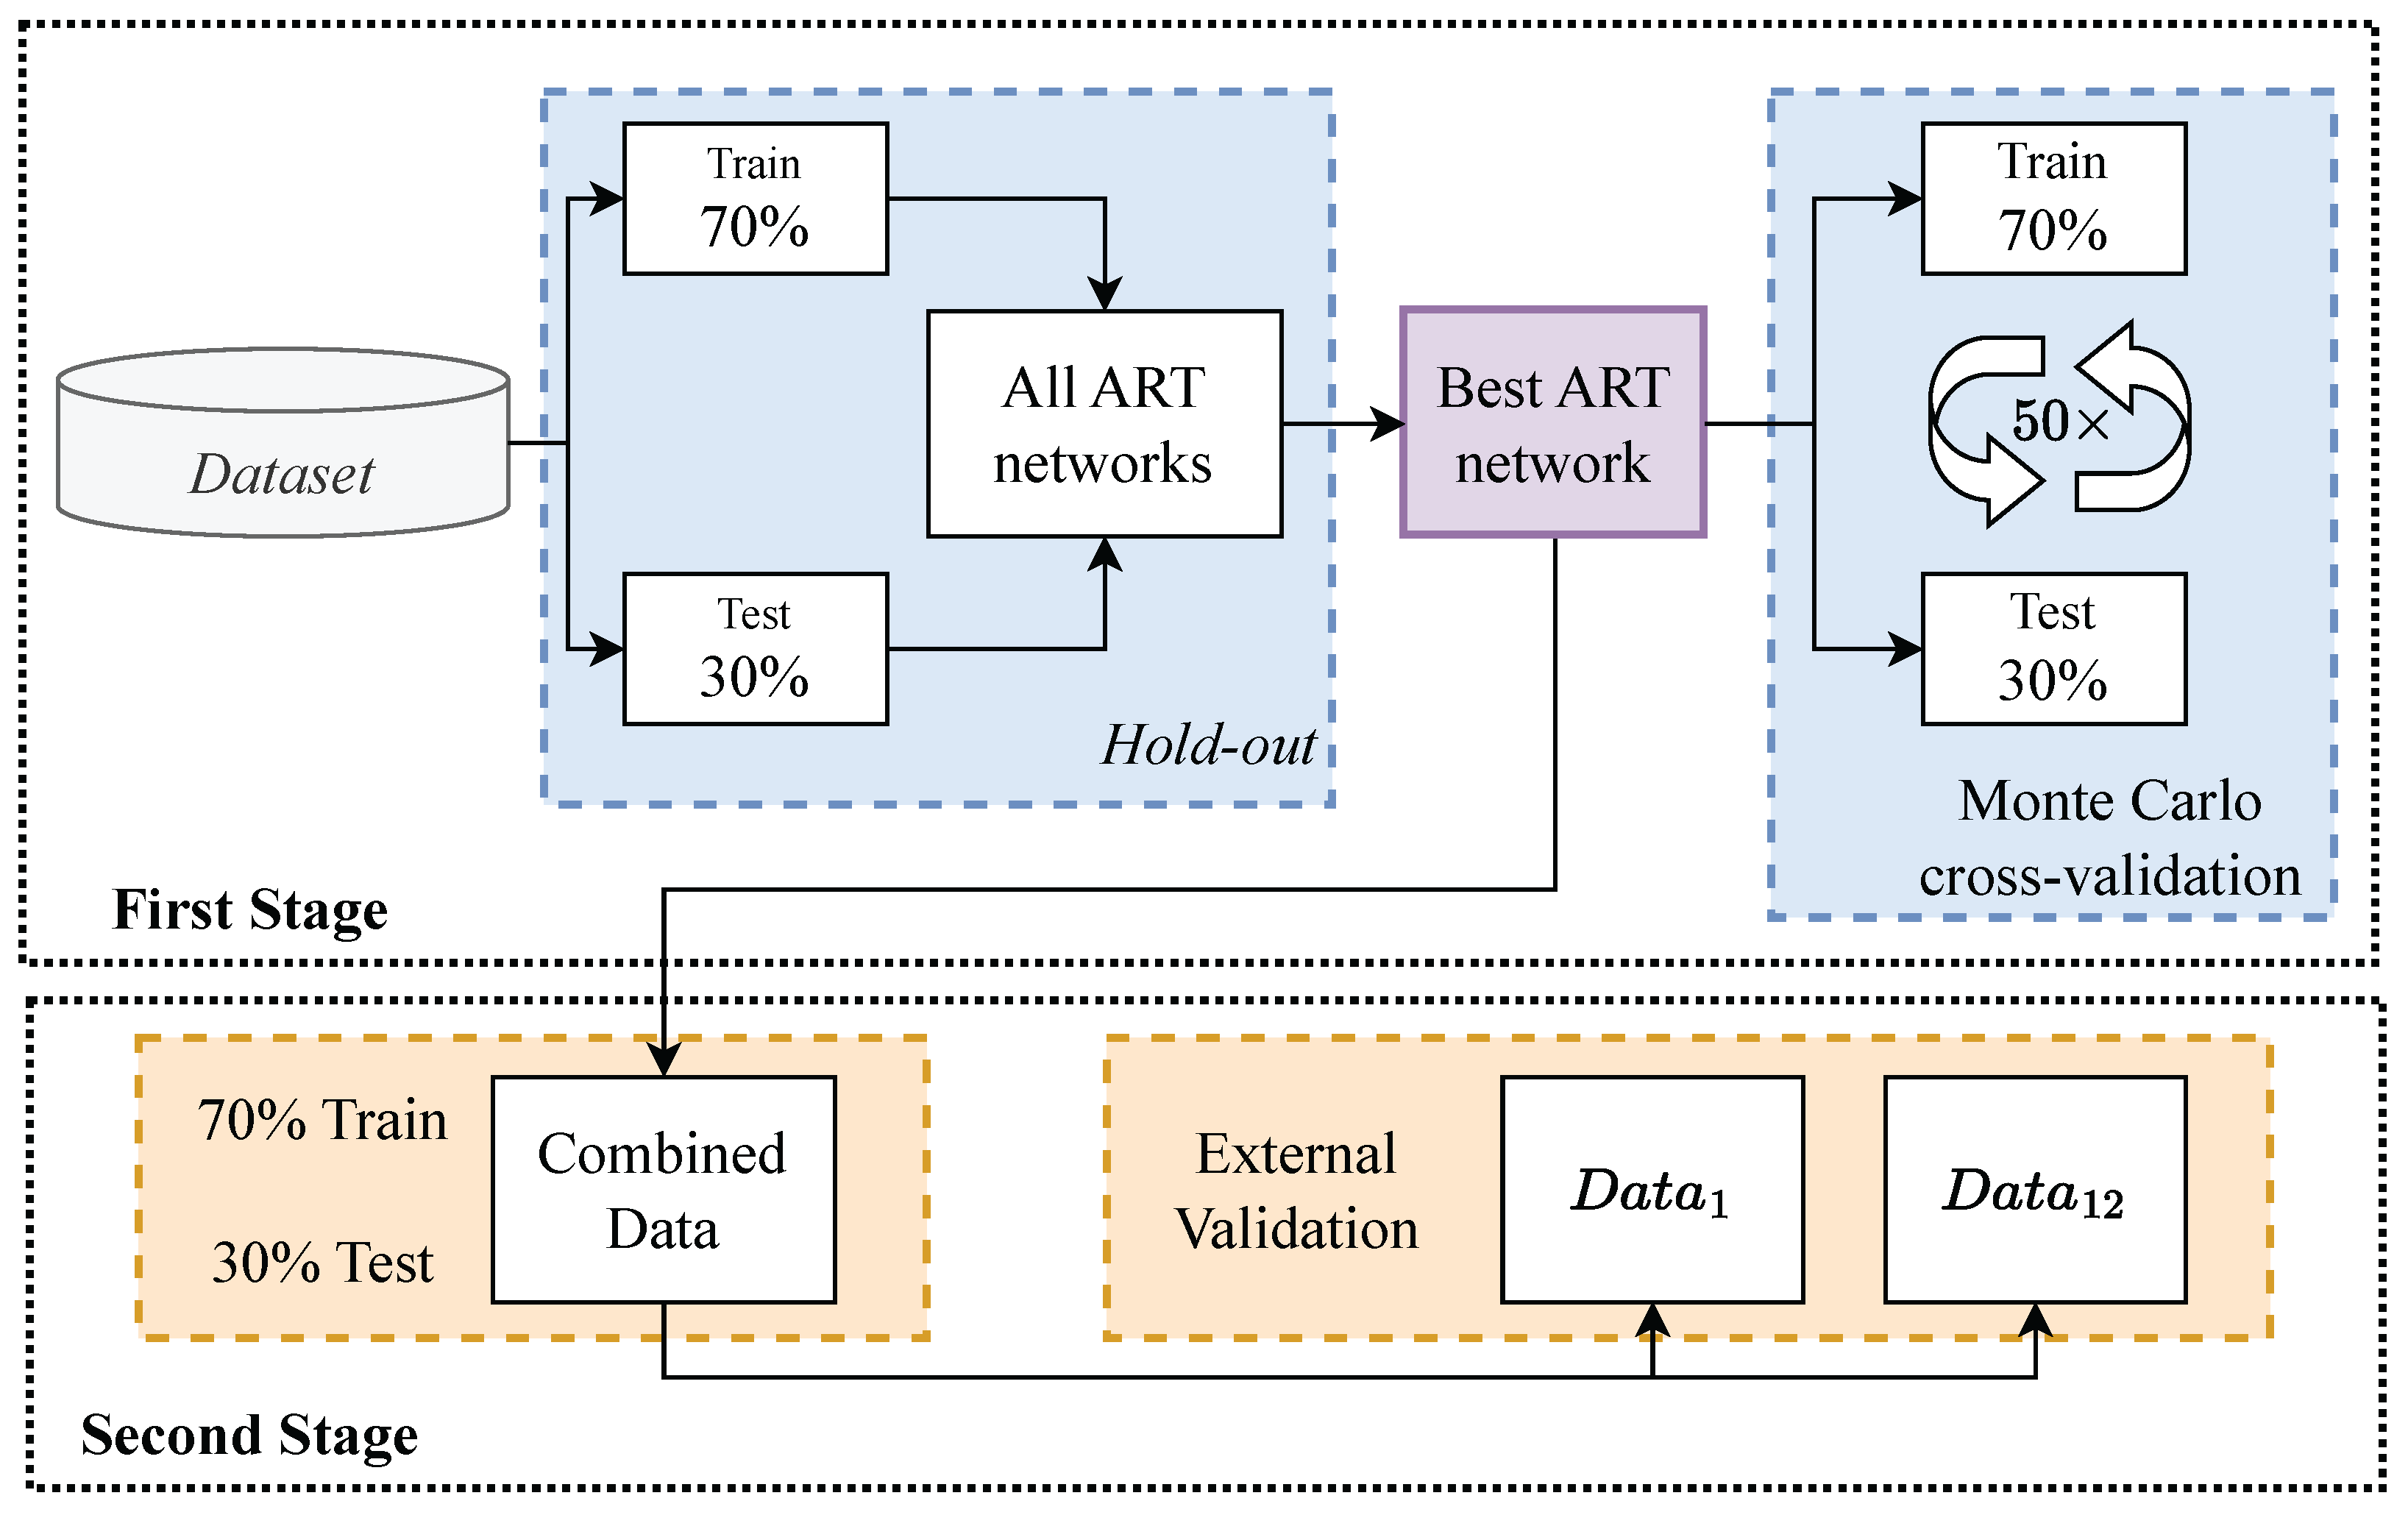
Figure 5.
Performance for each of the 50 iterations of the Monte Carlo cross-validation for the Data.
Figure 5.
Performance for each of the 50 iterations of the Monte Carlo cross-validation for the Data.
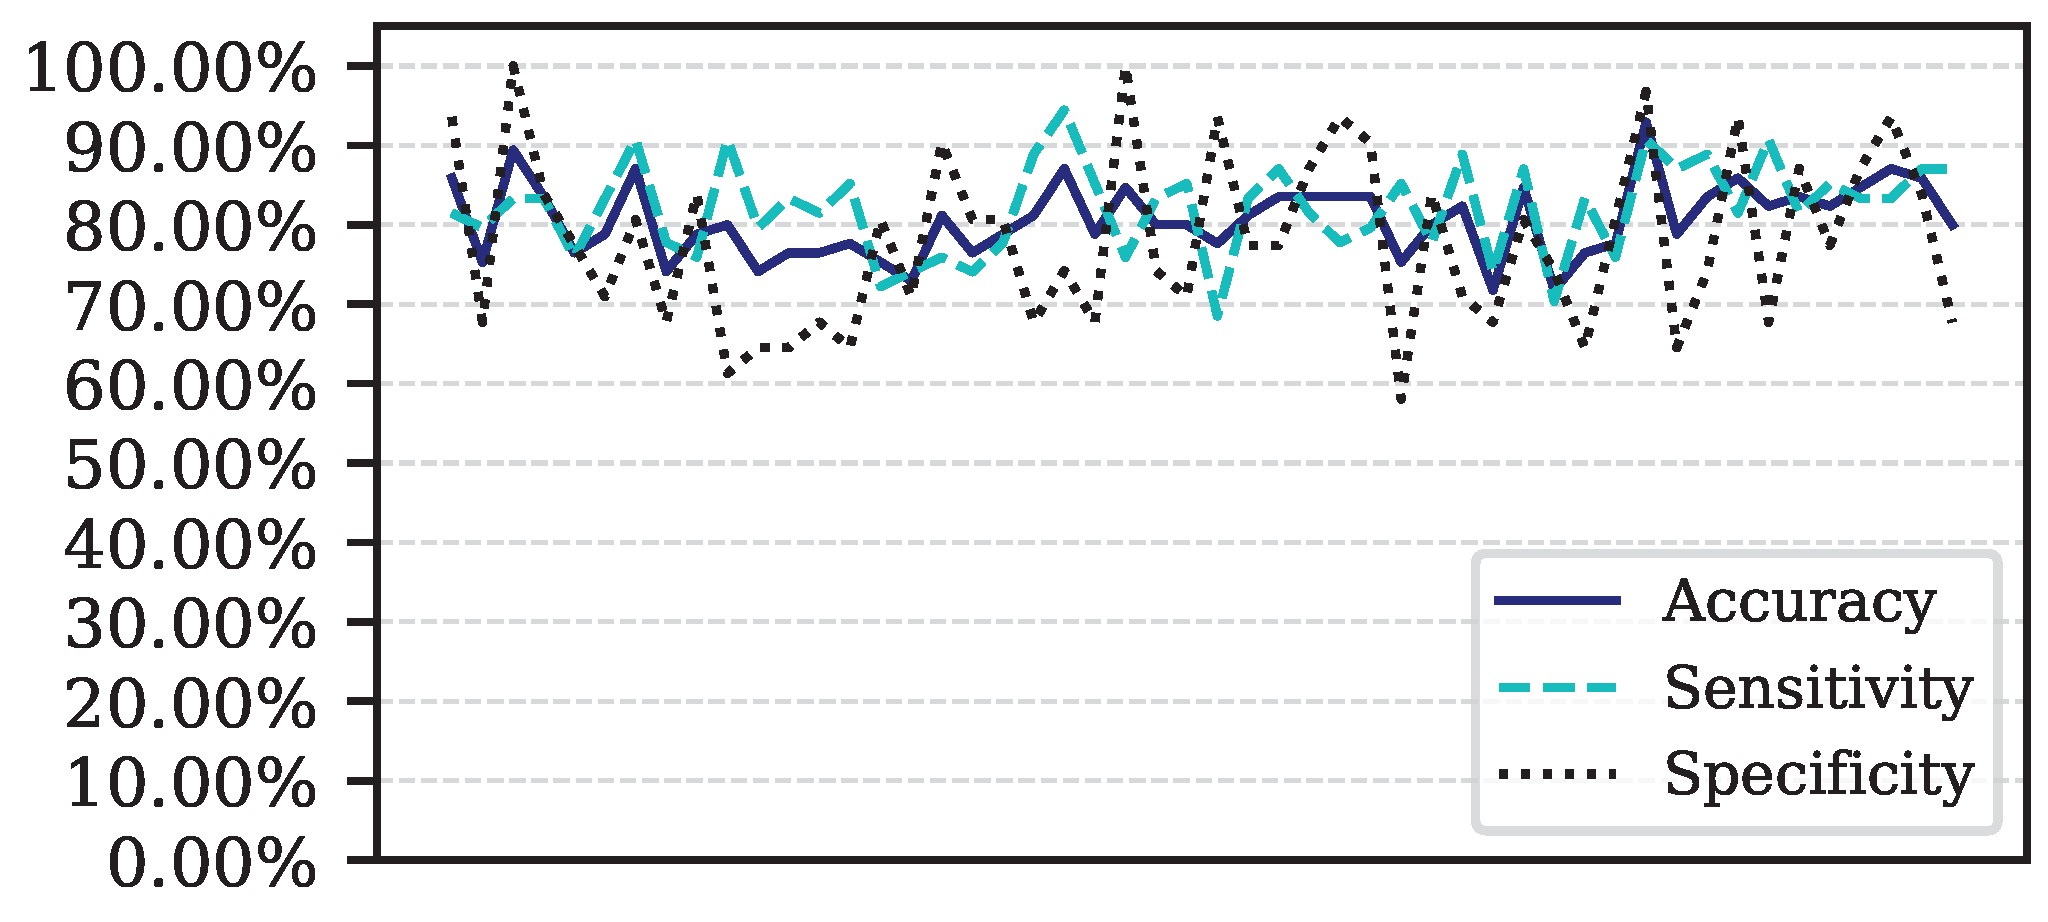
Figure 6.
ROC curve for Data.
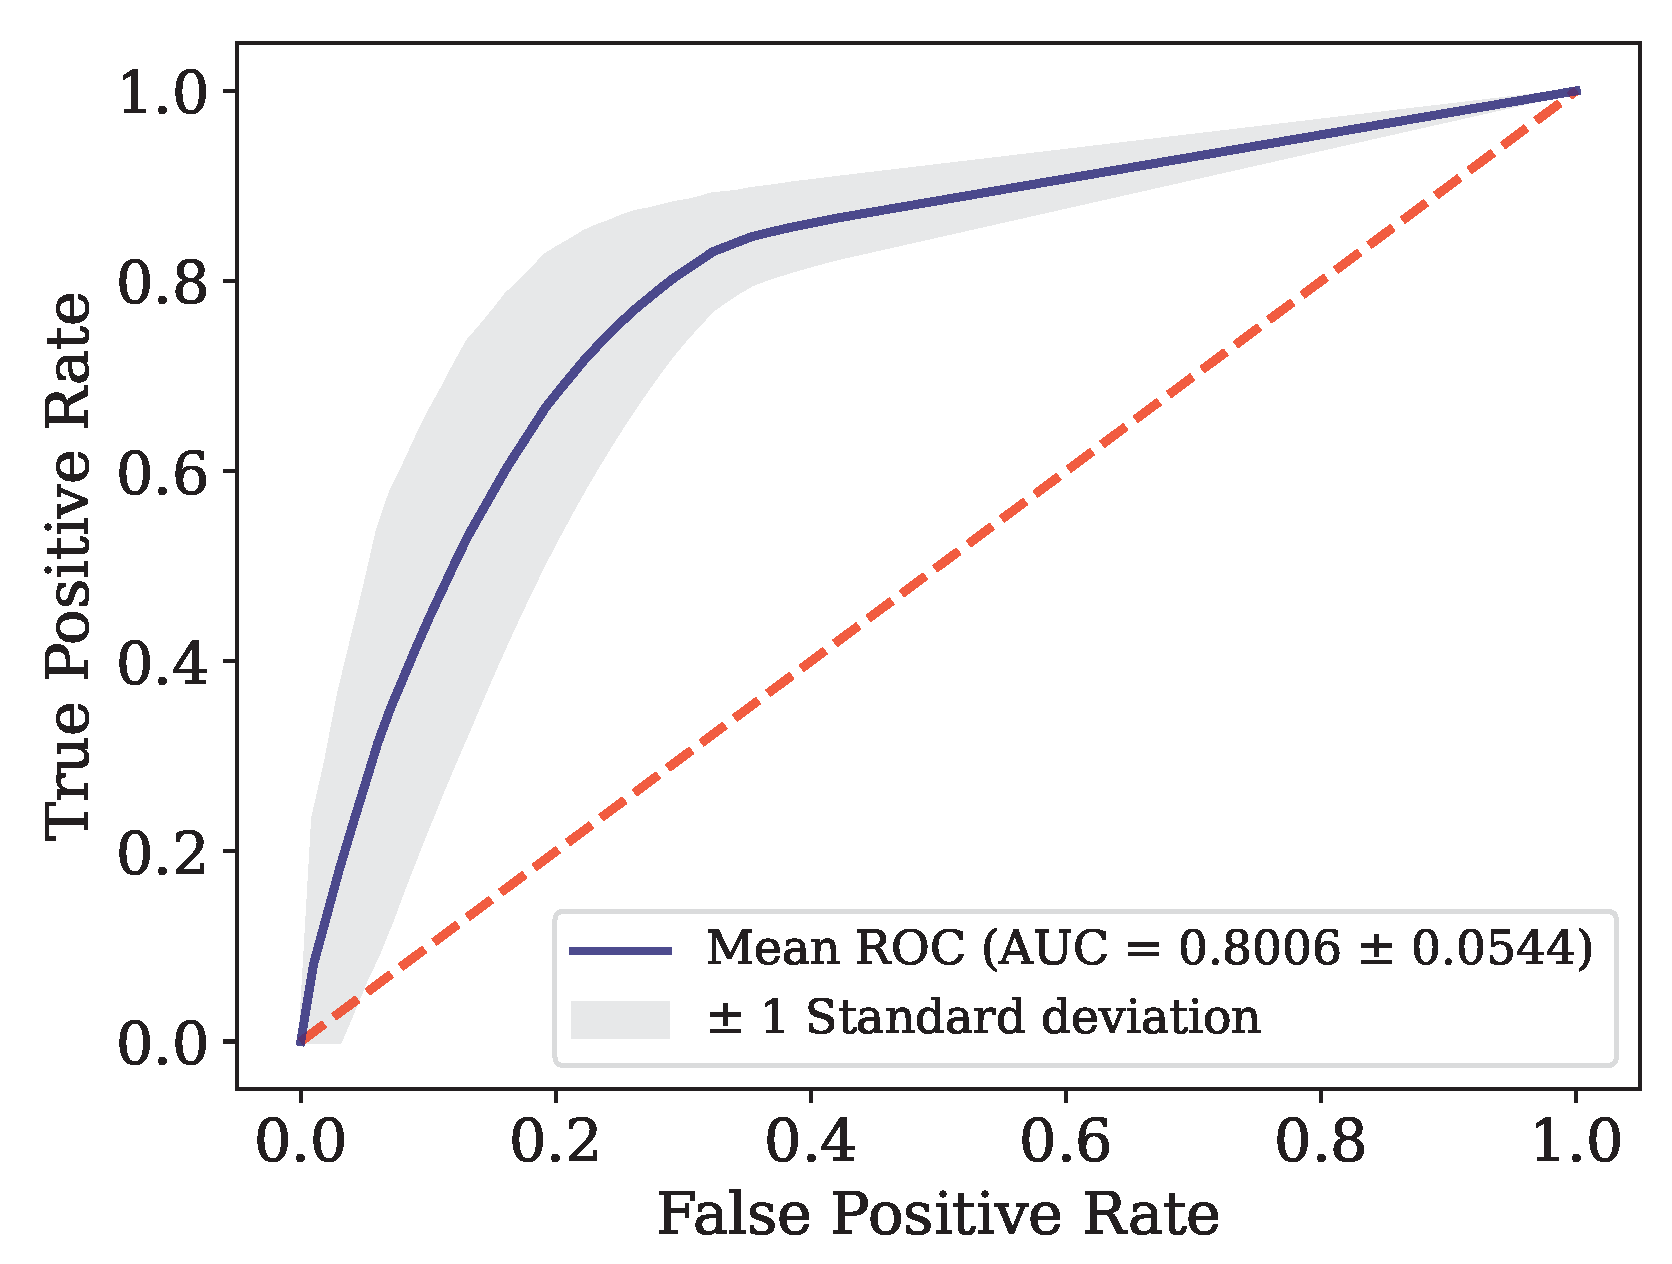
Figure 7.
Performance for each of the 50 iterations of the Monte Carlo cross-validation for the Data.
Figure 7.
Performance for each of the 50 iterations of the Monte Carlo cross-validation for the Data.
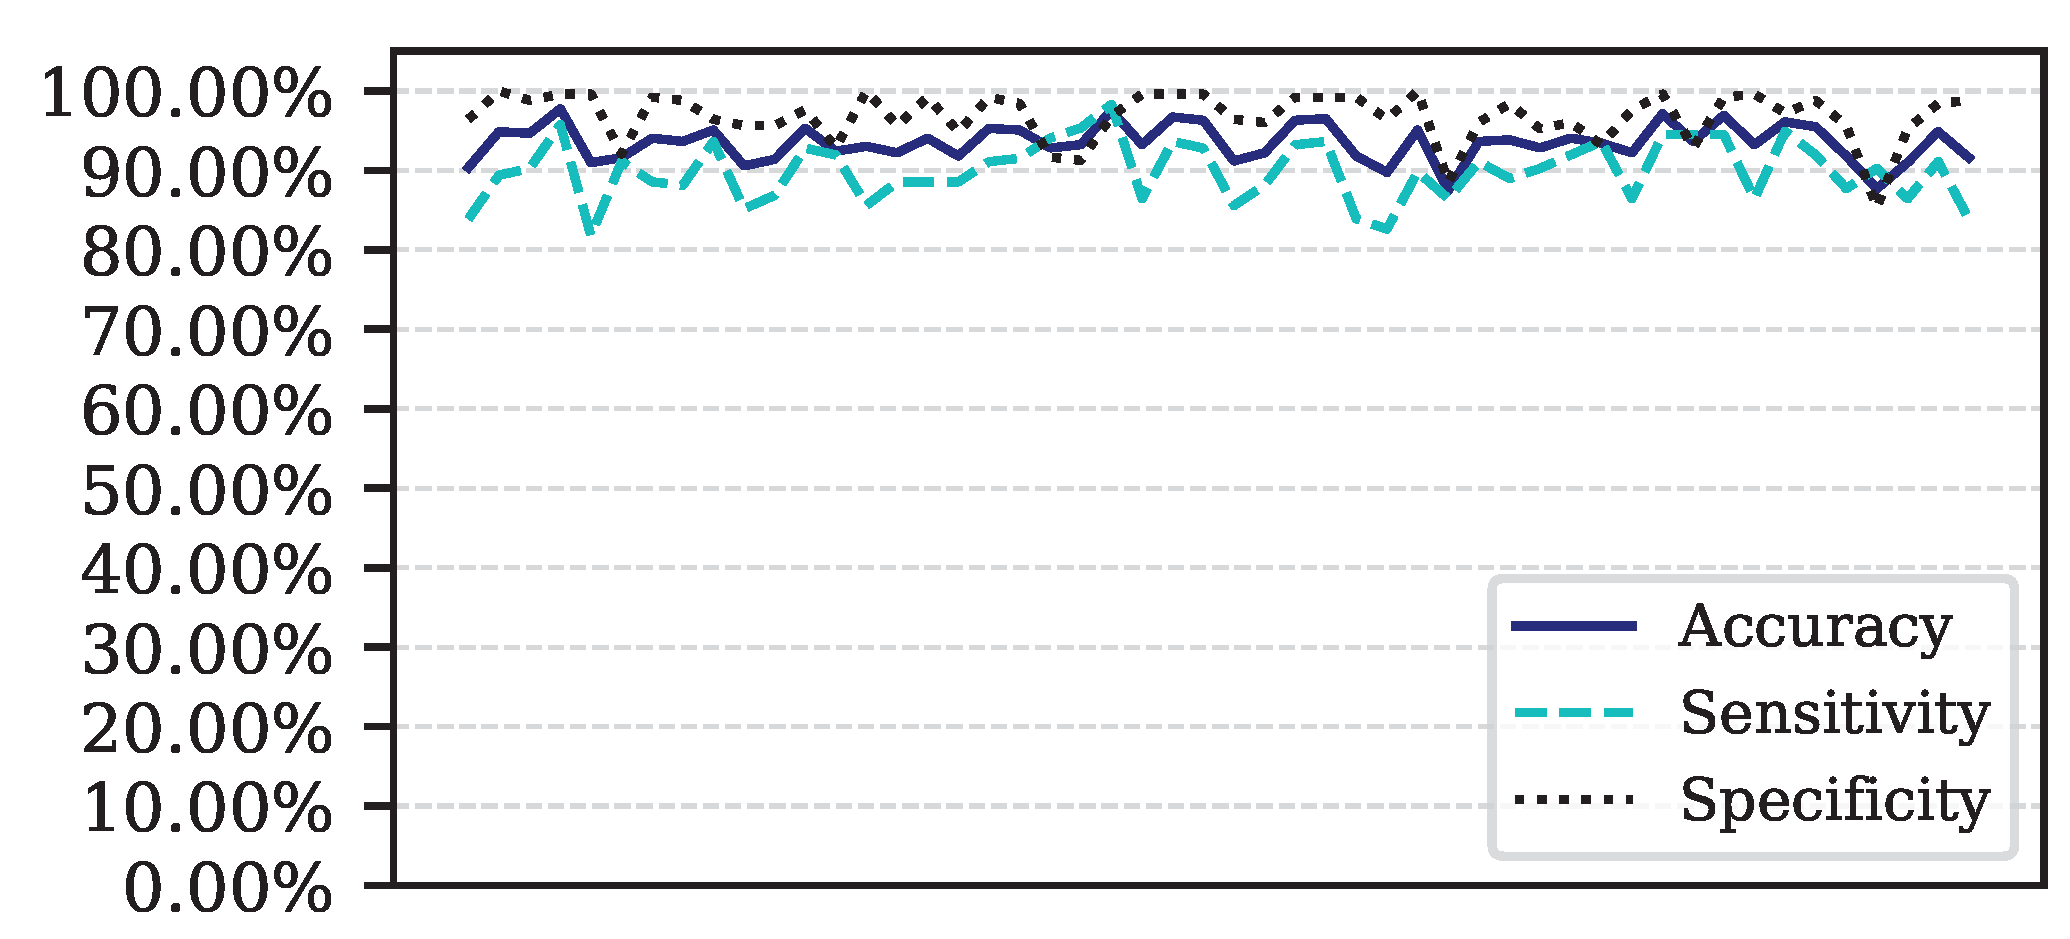
Figure 8.
ROC Curve for Data.
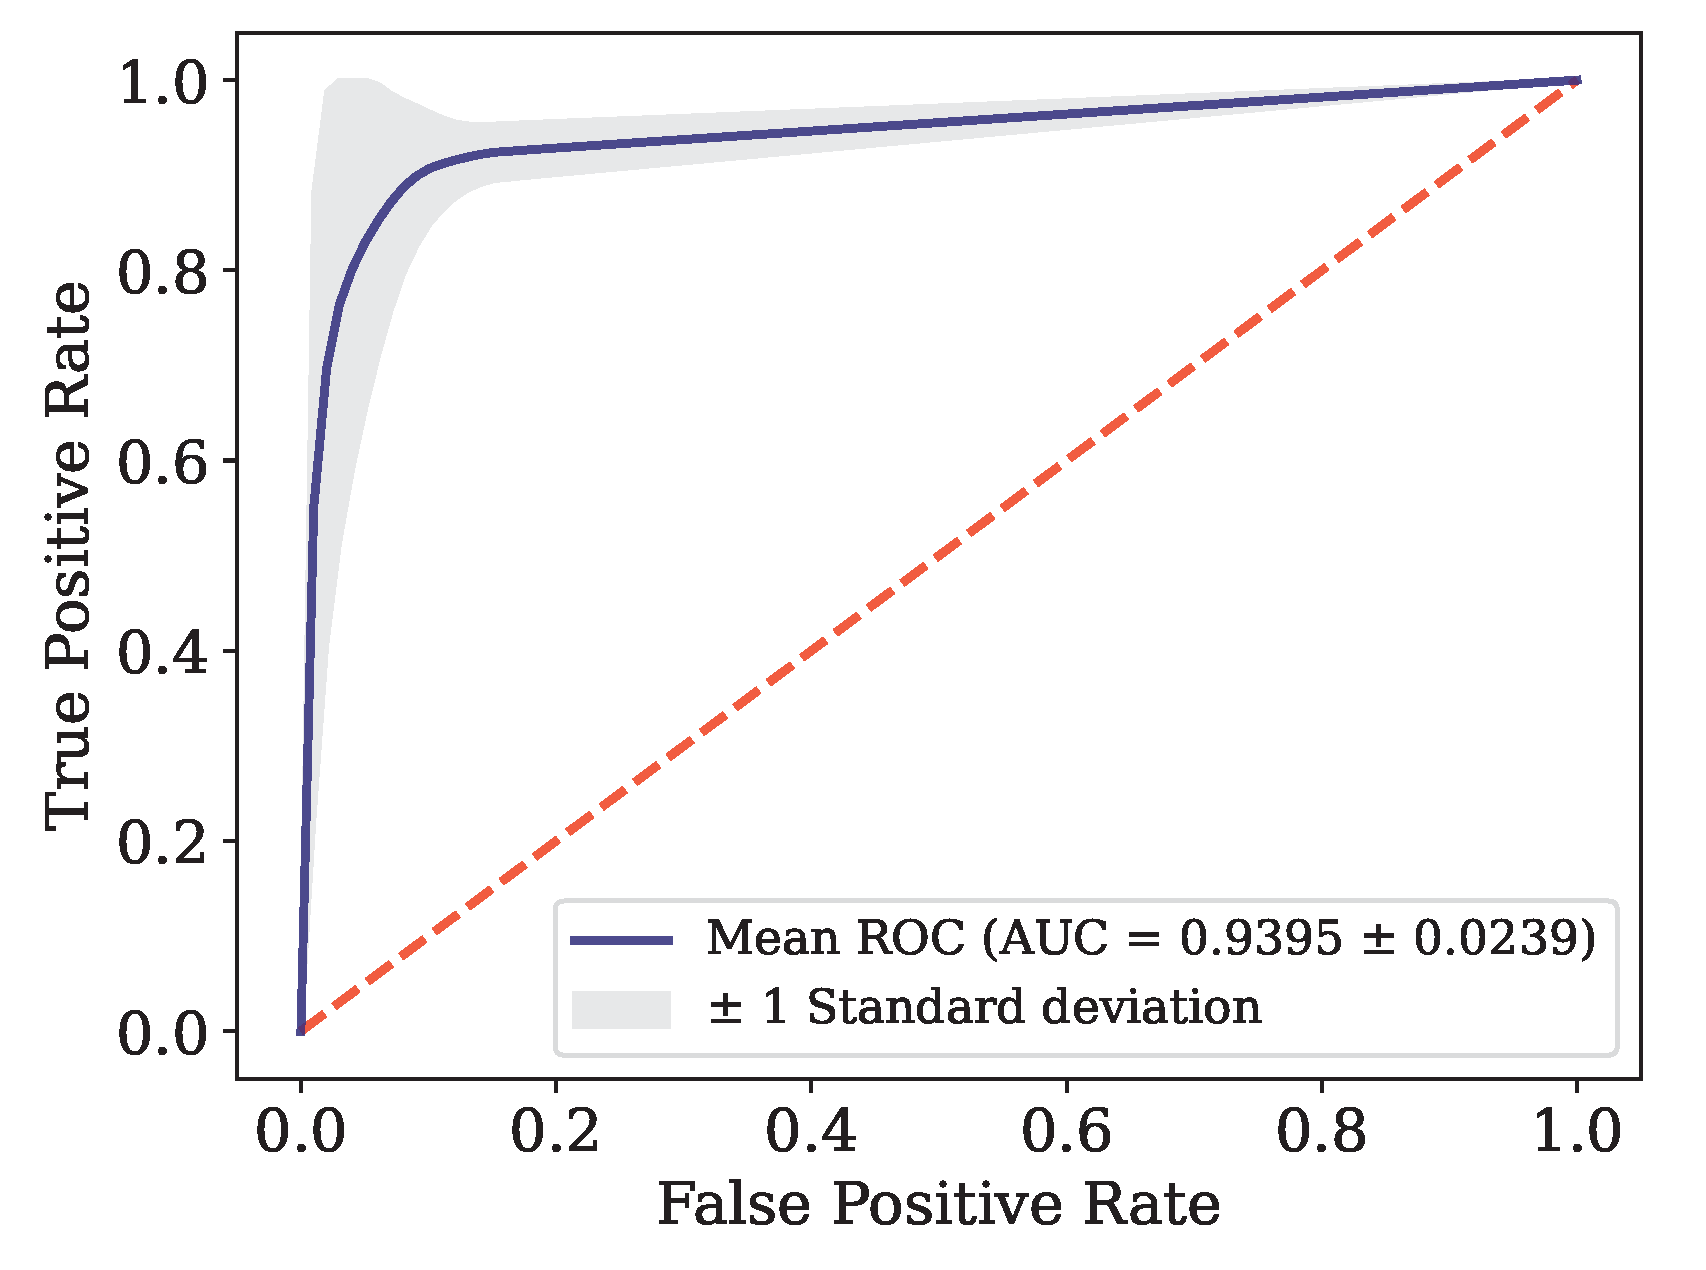
Figure 9.
Performance for each of the 50 iterations of the Monte Carlo cross-validation for the Data.
Figure 9.
Performance for each of the 50 iterations of the Monte Carlo cross-validation for the Data.
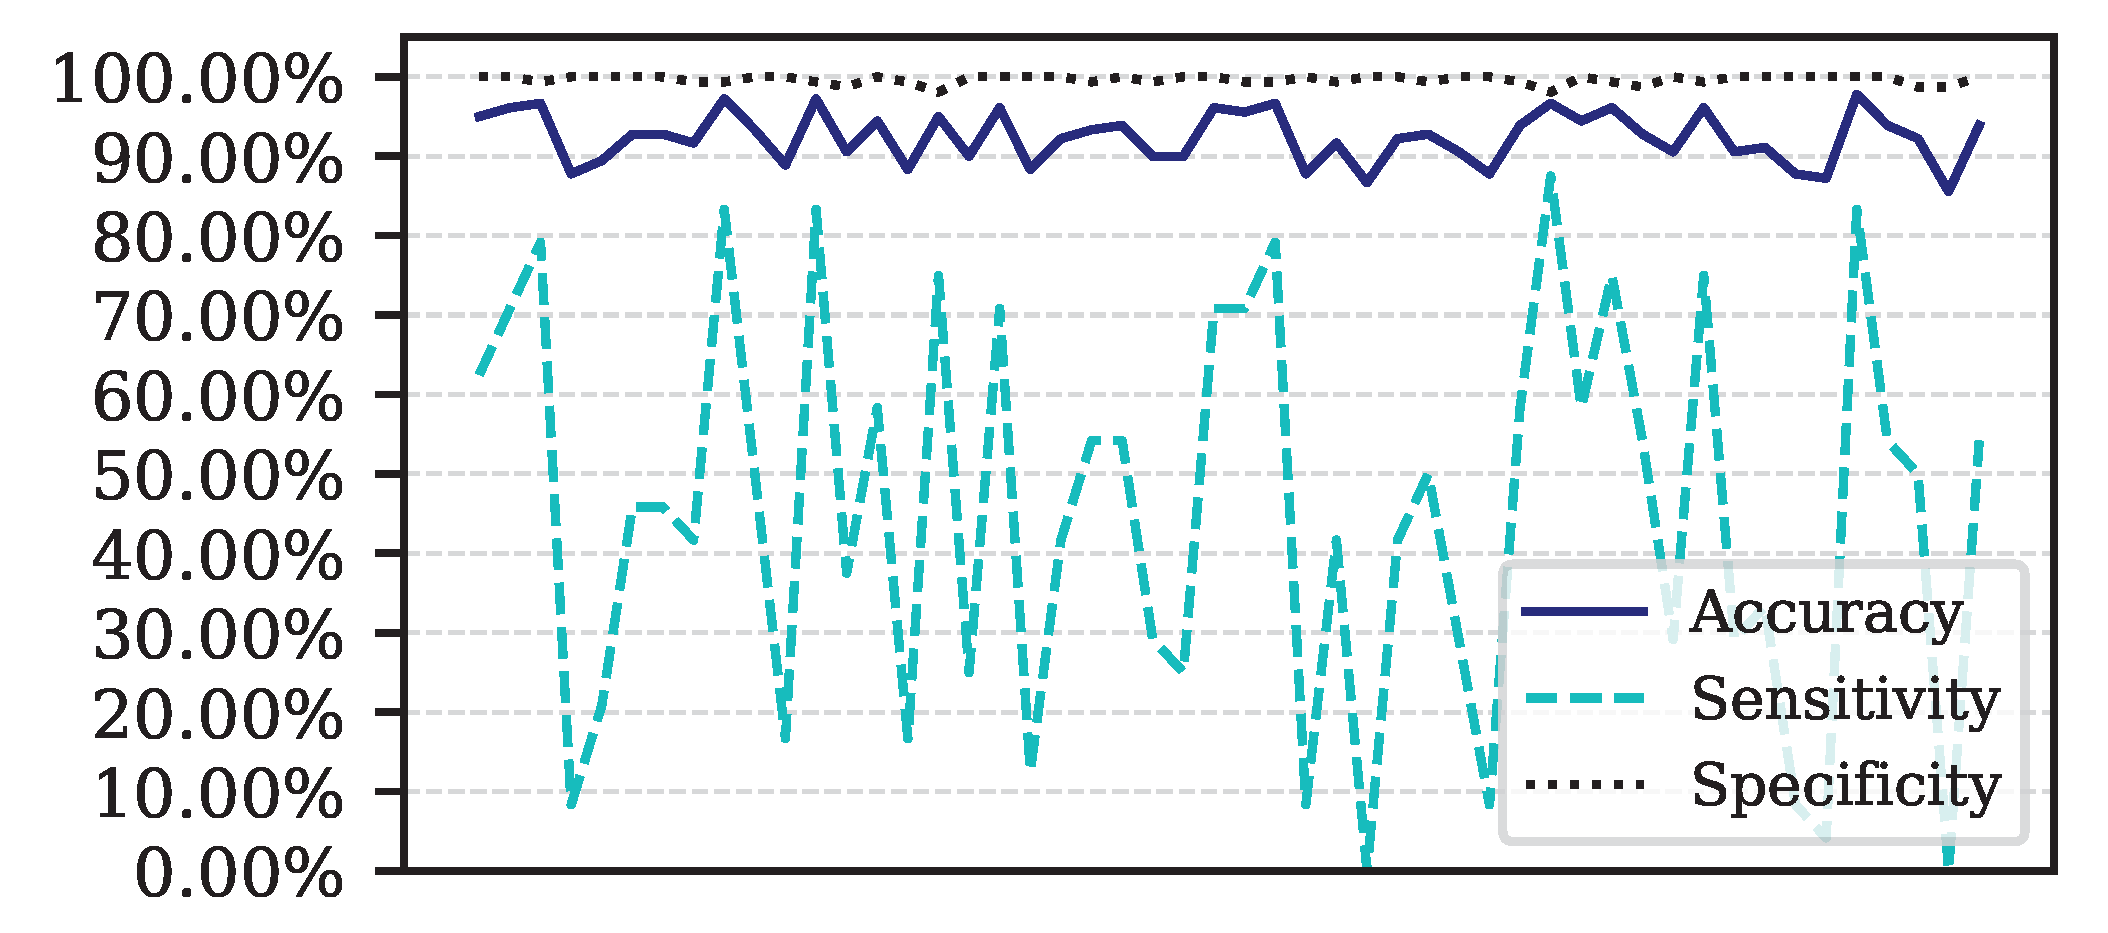
Figure 10.
ROC curve for Data.
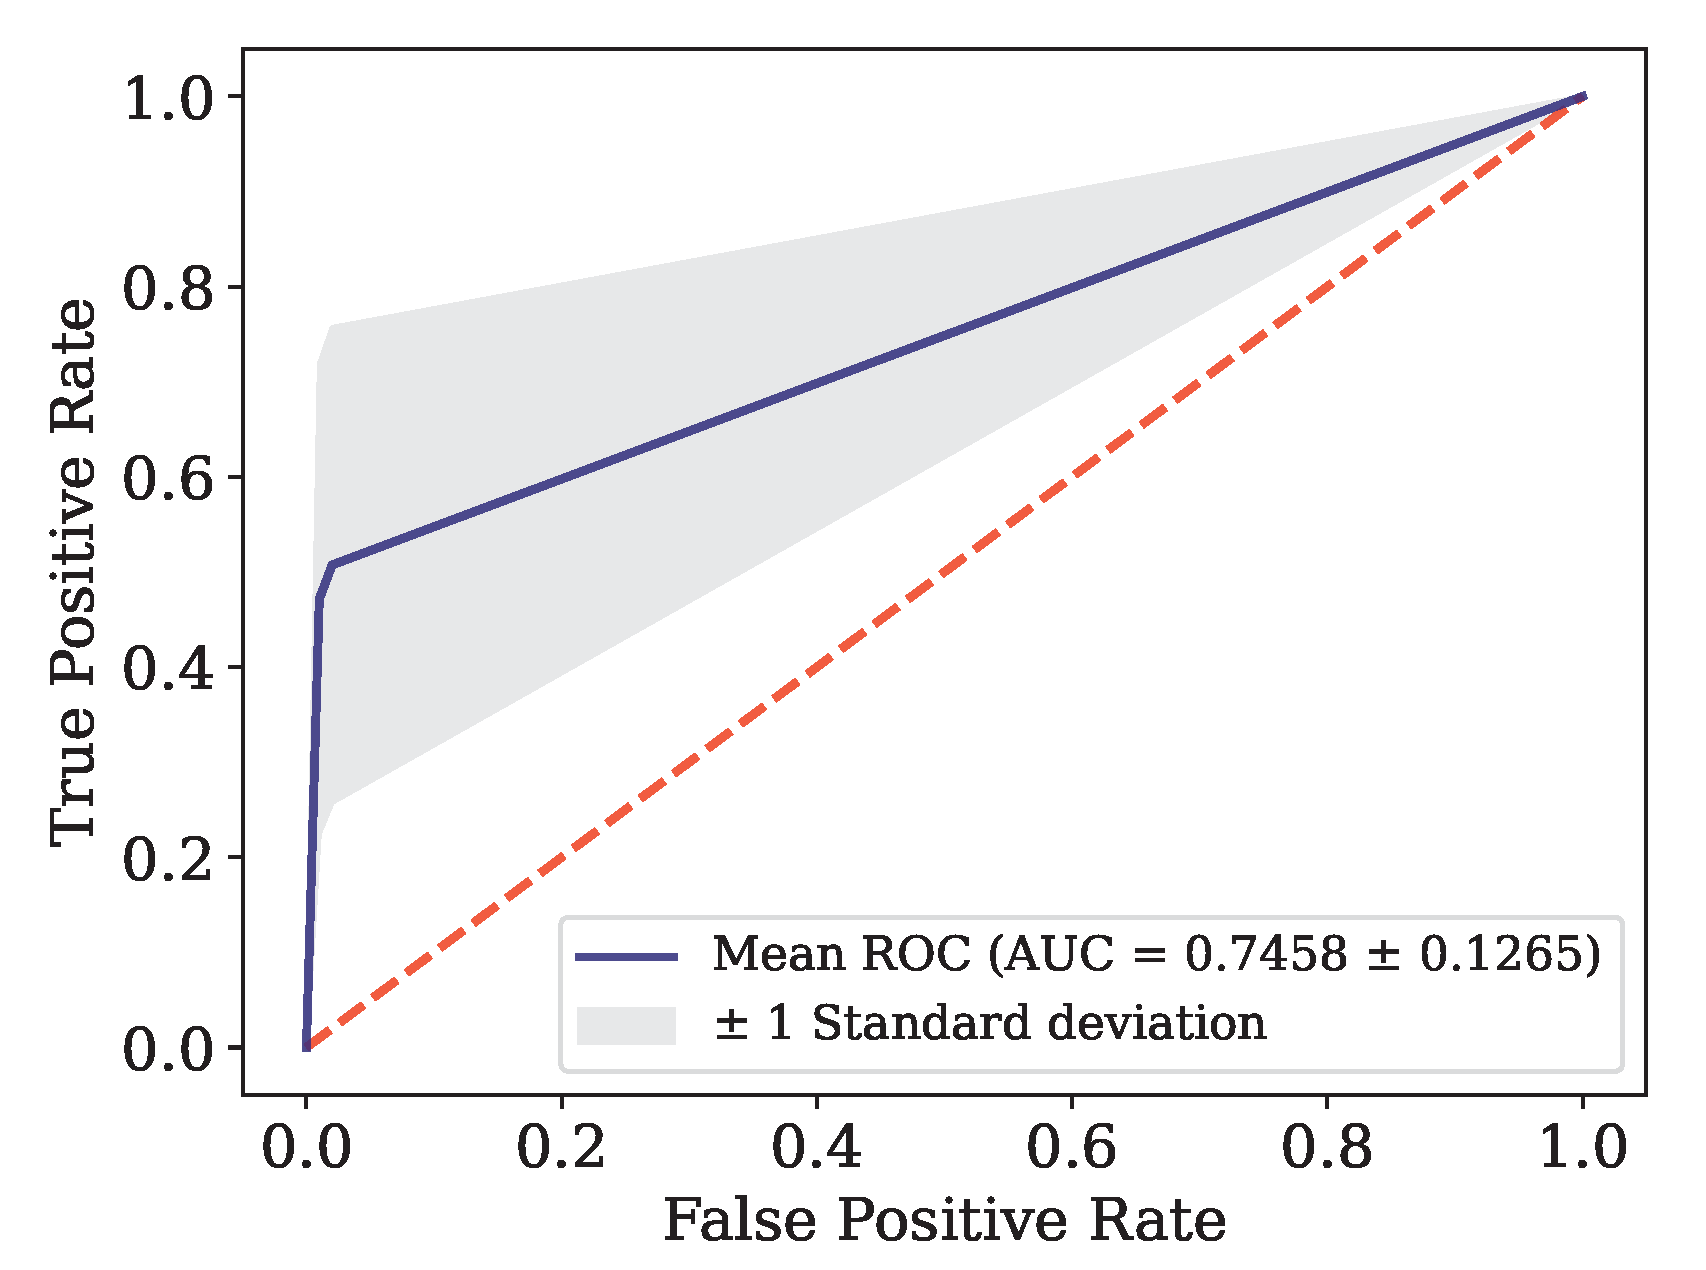
Figure 11.
ROC curve and AUC for the combined data set.
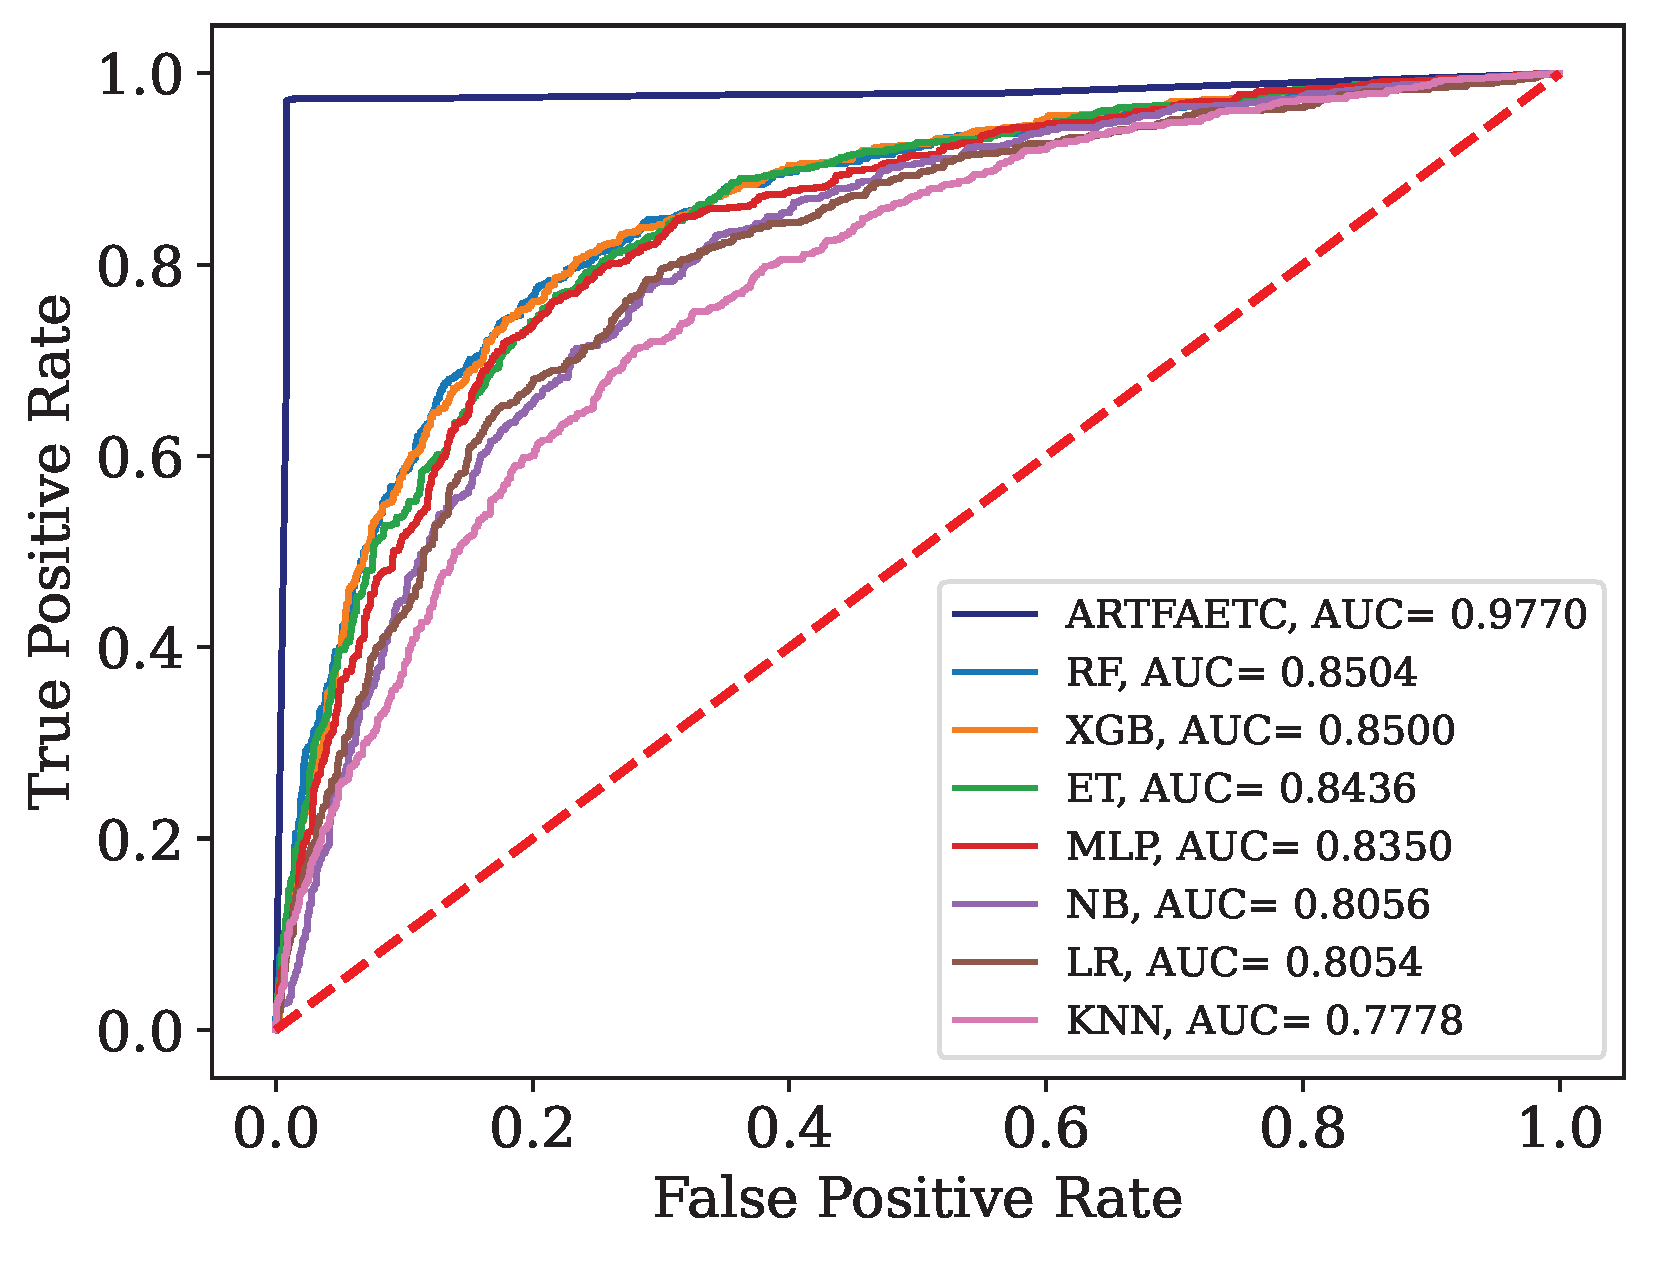
Figure 12.
ROC curve and AUC obtained by each model trained with the combined data and validated by Dados.
Figure 12.
ROC curve and AUC obtained by each model trained with the combined data and validated by Dados.
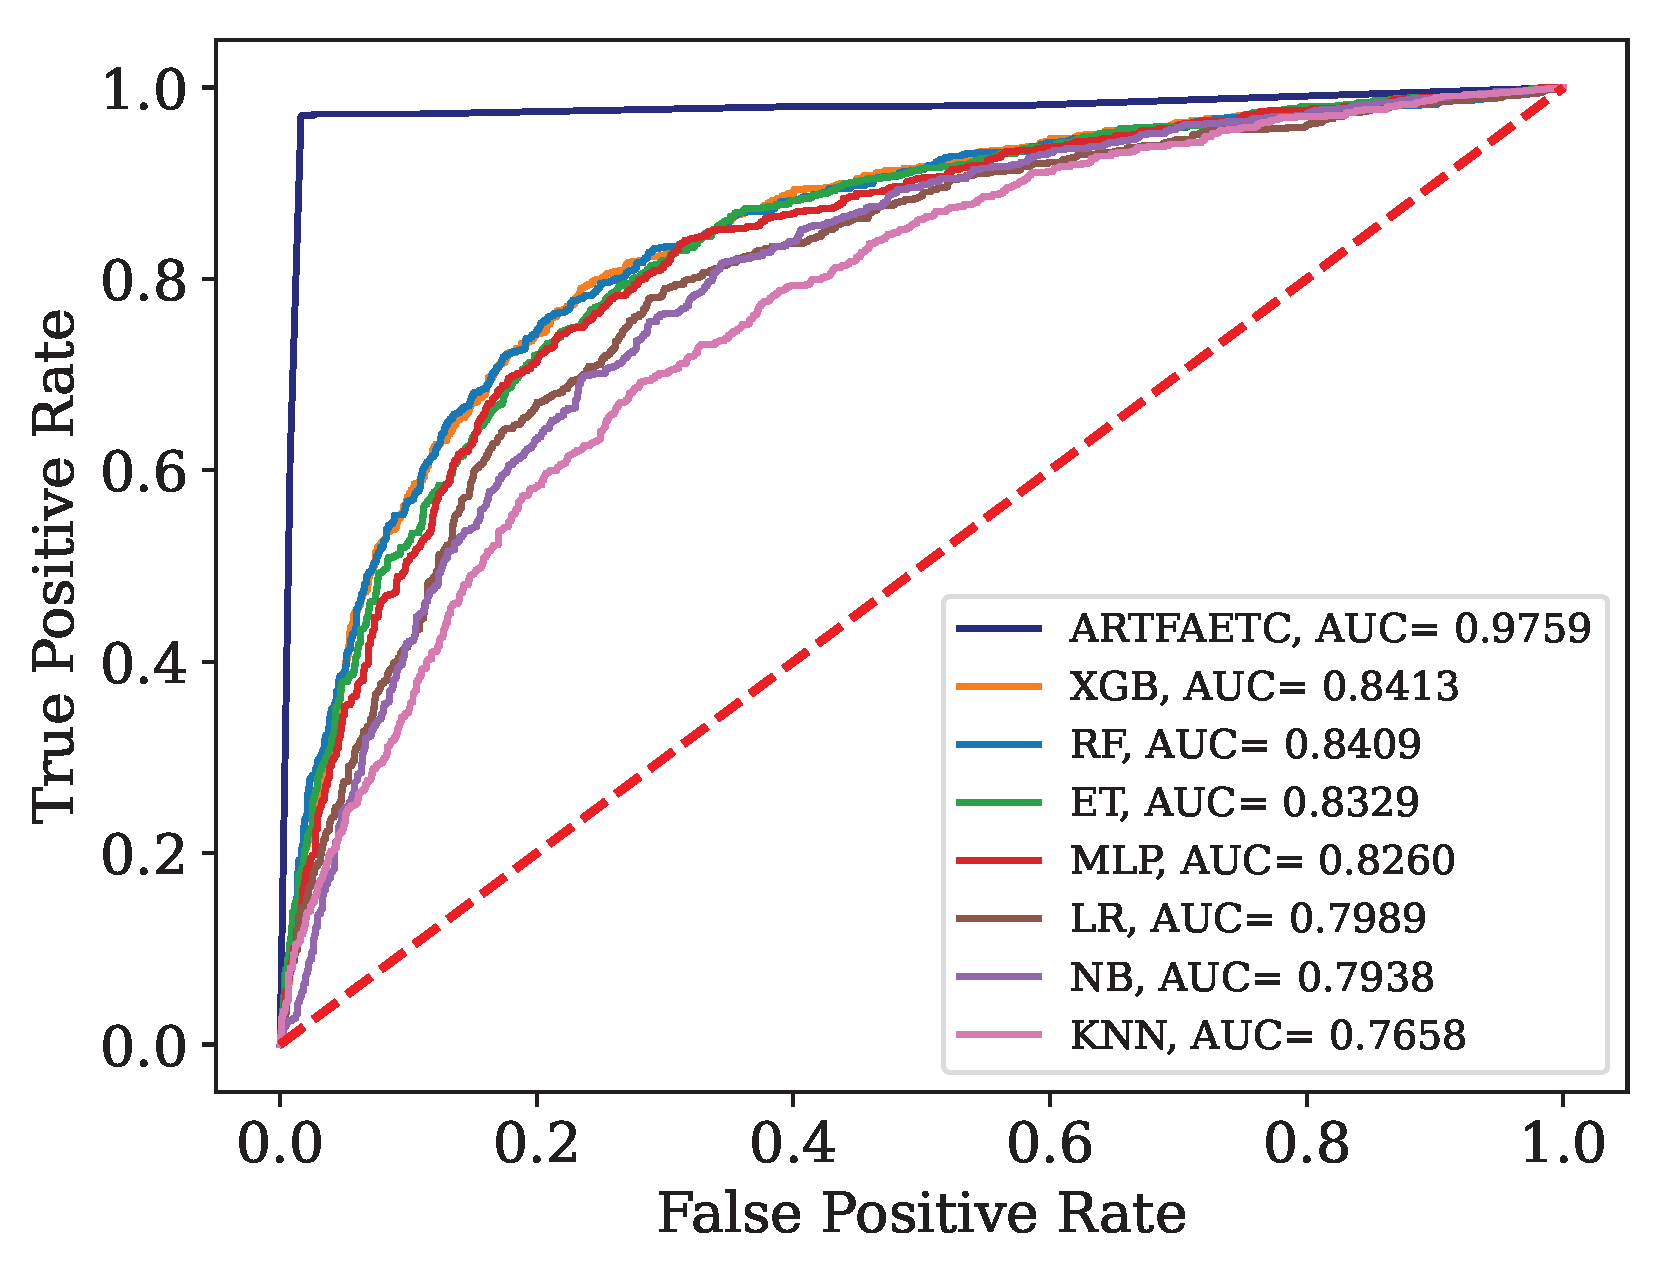
Figure 13.
ROC curve and AUC obtained by each model trained with the combined data and validated by Data.
Figure 13.
ROC curve and AUC obtained by each model trained with the combined data and validated by Data.
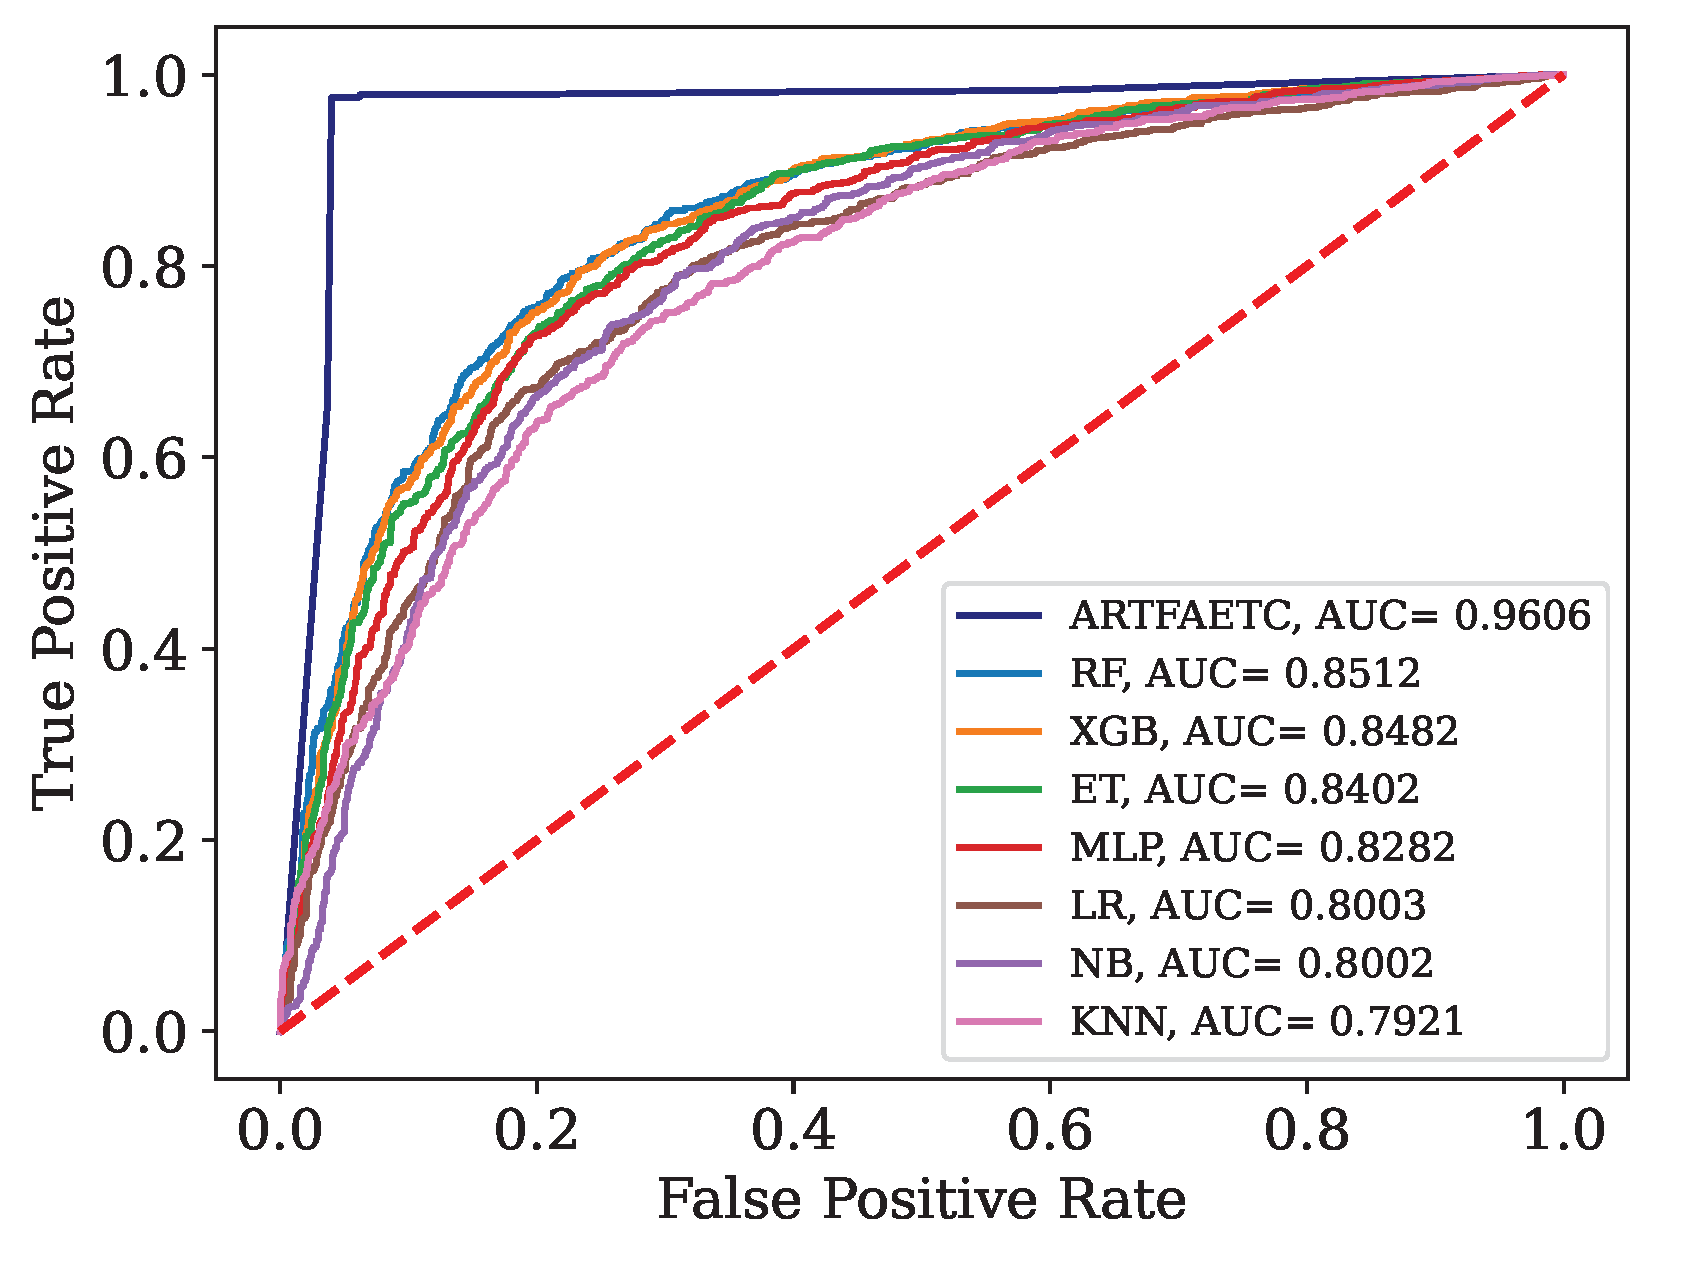

Table 1.
Amount of data and features.
| Available in: | Name | Country | Features | Positive | Negative |
|---|---|---|---|---|---|
| [21] | Data | Italy | 14 | 177 | 102 |
| [58] | Data | Italy | 35 | 786 | 838 |
| [54] | Data | Brazil | 19 | 80 | 520 |
| [74] | Data | Italy | 22 | 163 | 174 |
| [74] | Data | Italy | 22 | 104 | 145 |
| [74] | Data | Italy | 22 | 118 | 106 |
| [74] | Data | Brazil | 23 | 334 | 11 |
| [74] | Data | Brazil | 23 | 352 | 949 |
| [74] | Data | Brazil | 23 | 375 | 1960 |
| [74] | Data | Ethiopia | 24 | 200 | 0 |
| [74] | Data | Spain | 24 | 78 | 42 |
Table 2.
Attributes present in the data.
| Data | Attributes |
|---|---|
| Data | Alanine Aminotransferase, Aspartate Aminotransferase, Basophils, Class, Eosinophils, Gamma GT, Gender, Age, Lactate Dehydrogenase, Leukocytes, Lymphocytes, Monocytes, Neutrophils, C-Reactive Protein, Platelets |
| Data | Alanine Aminotransferase, Aspartate Aminotransferase, Basophils (10), Basophils (%), Calcium, Average Corpuscular Hemoglobin Concentration, Creatine Kinase, Class, Creatinine, Eosinophils (10), Eosinophils (%), Alkaline Phosphatase, Gamma GT, Gender, Glucose, Average Corpuscular Hemoglobin, RBC, Hematocrit, Hemoglobin, Age, Lactate Dehydrogenase, Leukocytes, Lymphocytes (10), Lymphocytes (%), Monocytes (10), Monocytes (%), Neutrophils, Neutrophils (%), C-reactive protein, Platelets, Potassium, Suspected COVID-19, Urea, Mean Corpuscular Volume, Mean Platelet Volume |
| Data | Alanine Aminotransferase, Aspartate Aminotransferase, Basophils, Class, Creatinine, Eosinophils, Serum glucose, RBC, Hematocrit, Hemoglobin, Age, Leukocytes, Lymphocytes, Monocytes, Neutrophils, C-reactive protein, Platelets, Potassium, Sodium, urea |
Table 3.
Average and standard deviation of attributes.
| Attributes | Data | Data | Data | Data | Data | Data | Data | Data |
|---|---|---|---|---|---|---|---|---|
| Age | 60,55 | 54,38 | 66,35 | 60,53 | 54,40 | 47,01 | 42,87 | 59,73 |
| ± 19,6 | ± 25,0 | ± 18,5 | ± 20,2 | ± 15,5 | ± 17,4 | ± 17,0 | ± 13,1 | |
| BA (%) | 0,34 | 0,46 | 0,18 | 0,32 | 0,30 | 0,52 | 0,48 | 0,29 |
| ± 0,3 | ± 0,4 | ± 0,4 | ± 0,3 | ± 0,3 | ± 0,3 | ± 0,3 | ± 0,4 | |
| BAT | 0,02 | 0,03 | 0,02 | 0,02 | 0,02 | 0,03 | 0,03 | 0,04 |
| ± 0,04 | ± 0,04 | ± 0,05 | ± 0,04 | ± 0,03 | ± 0,02 | ± 0,02 | ± 0,1 | |
| EO (%) | 0,83 | 1,23 | 0,74 | 0,60 | 1,05 | 2,30 | 2,27 | 0,62 |
| ± 1,6 | ± 2,1 | ± 1,6 | ± 1,2 | ± 1,6 | ± 2,4 | ± 2,5 | ± 1,1 | |
| EOT | 0,06 | 0,09 | 0,06 | 0,05 | 0,06 | 0,15 | 0,17 | 0,08 |
| ± 0,1 | ± 0,2 | ± 0,1 | ± 0,1 | ± 0,1 | ± 0,2 | ± 0,2 | ± 0,3 | |
| HCT | 39,41 | 37,77 | 38,20 | 39,67 | 40,75 | 41,47 | 41,18 | 39,96 |
| ± 5,6 | ± 7,4 | ± 6,3 | ± 6,1 | ± 5,0 | ± 4,0 | ± 4,1 | ± 7,9 | |
| HGB | 13,21 | 12,86 | 13,21 | 13,11 | 13,74 | 13,82 | 14,11 | 13,36 |
| ± 2,0 | ± 2,7 | ± 2,3 | ± 2,2 | ± 1,9 | ± 1,5 | ± 1,5 | ± 3,2 | |
| LY (%) | 18,54 | 21,90 | 16,56 | 18,30 | 23,14 | 31,10 | 27,57 | 7,58 |
| ± 11,1 | ± 14,5 | ± 11,6 | ± 11,9 | ± 11,4 | ± 11,2 | ± 11,0 | ± 7,1 | |
| LYT | 1,37 | 1,84 | 1,63 | 1,82 | 1,31 | 2,01 | 2,00 | 0,77 |
| ± 1,0 | ± 4,9 | ± 6,3 | ± 6,1 | ± 1,0 | ± 1,9 | ± 0,9 | ± 0,6 | |
| MCH | 29,20 | 30,41 | 29,62 | 29,51 | 29,60 | 29,37 | 29,59 | 29,58 |
| ± 2,7 | ± 2,9 | ± 3,1 | ± 2,4 | ± 1,9 | ± 1,9 | ± 1,8 | ± 2,8 | |
| MCHC | 33,47 | 33,98 | 34,49 | 33,00 | 33,68 | 33,31 | 34,25 | 33,09 |
| ± 1,4 | ± 1,4 | ± 1,5 | ± 1,3 | ± 1,1 | ± 1,1 | ± 1,0 | ± 2,0 | |
| MCV | 87,22 | 89,44 | 85,72 | 89,41 | 87,90 | 88,19 | 86,39 | 88,69 |
| ± 7,1 | ± 7,4 | ± 8,0 | ± 6,5 | ± 5,1 | ± 5,1 | ± 4,7 | ± 8,3 | |
| MO (%) | 7,76 | 8,86 | 7,17 | 8,13 | 9,64 | 9,29 | 8,64 | 5,74 |
| ± 3,9 | ± 4,7 | ± 3,9 | ± 5,0 | ± 4,4 | ± 3,7 | ± 3,2 | ± 8,2 | |
| MOT | 0,62 | 0,73 | 0,64 | 0,64 | 0,56 | 0,59 | 0,63 | 0,63 |
| ± 0,5 | ± 0,9 | ± 0,4 | ± 0,3 | ± 0,3 | ± 0,3 | ± 0,3 | ± 0,8 | |
| NE (%) | 72,50 | 67,54 | 75,03 | 72,48 | 65,78 | 56,79 | 61,02 | 85,77 |
| ± 13,3 | ± 17,2 | ± 14,2 | ± 14,5 | ± 14,1 | ± 12,4 | ± 12,4 | ± 12,7 | |
| NET | 6,47 | 5,62 | 7,47 | 6,76 | 4,35 | 3,92 | 4,82 | 11,60 |
| ± 4,5 | ± 4,3 | ± 4,9 | ± 4,3 | ± 3,1 | ± 2,1 | ± 2,4 | ± 8,5 | |
| PLT | 234,49 | 204,00 | 220,23 | 218,00 | 199,81 | 246,96 | 239,92 | 268,69 |
| ± 94,9 | ± 113,7 | ± 90,0 | ± 84,8 | ± 73,4 | ± 70,3 | ± 64,6 | ± 146,8 | |
| RBC | 4,55 | 4,25 | 4,49 | 4,46 | 4,65 | 4,72 | 4,78 | 4,46 |
| ± 0,7 | ± 0,9 | ± 0,8 | ± 0,8 | ± 0,7 | ± 0,5 | ± 0,5 | ± 0,9 | |
| WBC | 8,69 | 8,31 | 9,81 | 9,53 | 6,30 | 6,70 | 7,66 | 14,18 |
| ± 4,7 | ± 7,1 | ± 8,0 | ± 7,5 | ± 3,5 | ± 3,0 | ± 2,7 | ± 17,8 | |
| BA: Basophils; BAT: Basophil Count; EO: Eosinophils; EOT: Eosinophil Count; HCT: Hematocrit; HGB: Hemoglobin; LY: Lymphocytes; LYT: Lymphocyte Count; MCH: Mean Corpuscolar Hemoglobin; MCHC: Mean Corpuscular Hemoglobin Concentration; MCV: Mean Corpuscular Volume; MO: Monocytes; MOT: Monocyte Count; NE: Neutrophils; NET: Neutrophil Count; PLT: Platelets; RBC: Red Blood Cells | ||||||||
Table 4.
Selection of attributes by different methods.
| Attributes | p-value MW | VIF | Attributes | p-value MW | VIF |
|---|---|---|---|---|---|
| Age | 0.0000 | 1.4213 | MCHC | 0.0000 | 10.5313 |
| BA (%) | 0.0000 | 2.8222 | MCV | 0.3976 | 81.7446 |
| BAT | 0.0000 | 2.6595 | MO (%) | 0.7285 | 12.1883 |
| EO (%) | 0.0000 | 10.5956 | MOT | 0.0000 | 2.8672 |
| EOT | 0.0000 | 7.2687 | NE (%) | 0.0000 | 140.5236 |
| HCT | 0.0003 | 400.5673 | NET | 0.0000 | 5.4626 |
| HGB | 0.0137 | 351.4449 | PLT | 0.0627 | 1.2310 |
| LY (%) | 0.0000 | 100.8982 | RBC | 0.0007 | 59.8770 |
| LYT | 0.0000 | 2.1397 | WBC | 0.0000 | 3.8370 |
| MCH | 0.0136 | 105.2796 |
Table 5.
Interpretation of AUC Values.
| Range | Result | Range | Result |
|---|---|---|---|
| 0.5 – 0.6 | Bad | 0.7 – 0.8 | Acceptable |
| 0.8 – 0.9 | Good | > 0.9 | Excellent |
Table 6.
Results obtained by each model for Data.
| Model | ACC | Se | Sp | MCC |
|---|---|---|---|---|
| SE Fuzzy ART | 0.800 | 0.870 | 0.670 | 0.561 |
| SE Euclidean ART | 0.706 | 0.759 | 0.613 | 0.370 |
| SE Fuzzy ARTMAP | 0.835 | 0.870 | 0.774 | 0.645 |
| SE Fuzzy ART CT | 0.871 | 0.926 | 0.774 | 0.717 |
| SE Euclidean ART CT | 0.741 | 0.778 | 0.677 | 0.450 |
| SE Fuzzy ARTMAP CT | 0.800 | 0.759 | 0.871 | 0.608 |
| SE Euclidean ARTMAP CT | 0.635 | 0.778 | 0.387 | 0.176 |
Table 7.
Average result after Monte Carlo cross-validation for Data.
| Metrics | Average result (CI 95%) |
|---|---|
| ACC | 0.8061 (0.7932 – 0.8191) |
| Se | 0.8211 (0.8049 – 0.8373) |
| Sp | 0.7800 (0.7495 – 0.8105) |
| MCC | 0.6555 (0.6264 – 0.6846) |
| F | 0.8679 (0.8569 – 0.8788) |
Table 8.
Results obtained by each model for Data.
| Model | ACC | Se | Sp | MCC |
|---|---|---|---|---|
| SE Fuzzy ART | 0.750 | 0.746 | 0.754 | 0.500 |
| SE Euclidean ART | 0.727 | 0.691 | 0.762 | 0.454 |
| SE Fuzzy ARTMAP | 0.783 | 0.792 | 0.774 | 0.566 |
| SE Fuzzy ART CT | 0.984 | 0.970 | 0.996 | 0.967 |
| SE Euclidean ART CT | 0.781 | 0.547 | 1.000 | 0.619 |
| SE Fuzzy ARTMAP CT | 0.738 | 0.712 | 0.762 | 0.474 |
| SE Euclidean ARTMAP CT | 0.697 | 0.712 | 0.683 | 0.394 |
Table 9.
Average result after Monte Carlo cross-validation for Data.
| Metrics | Average result (CI 95%) |
|---|---|
| ACC | 0.9348 (0.9282 – 0.9413) |
| Se | 0.8992 (0.8885 – 0.9098) |
| Sp | 0.9682 (0.9594 – 0.9770) |
| MCC | 0.8721 (0.8592 – 0.8850) |
| F | 0.9301 (0.9231 – 0.9371) |
Table 10.
Results obtained by each model for Data.
| Model | ACC | Se | Sp | MCC |
|---|---|---|---|---|
| SE Fuzzy ART | 0.889 | 0.208 | 0.994 | 0.382 |
| SE Euclidean ART | 0.878 | 0.500 | 0.936 | 0.452 |
| SE Fuzzy ARTMAP | 0.867 | 0.375 | 0.942 | 0.359 |
| SE Fuzzy ART CT | 0.944 | 0.583 | 1.000 | 0.740 |
| SE Euclidean ART CT | 0.972 | 0.792 | 1.000 | 0.876 |
| SE Fuzzy ARTMAP CT | 0.889 | 0.458 | 0.955 | 0.468 |
| SE Euclidean ARTMAP CT | 0.872 | 0.458 | 0.936 | 0.417 |
Table 11.
Average result after Monte Carlo cross-validation for the Data.
| Metrics | Average result (CI 95%) |
|---|---|
| ACC | 0.9265 (0.9180 – 0.9350) |
| Se | 0.4714 (0.4045 – 0.5382) |
| Sp | 0.9965 (0.9951 – 0.9979) |
| MCC | 0.6195 (0.5656 – 0.6734) |
| F | 0.5924 (0.5268 – 0.6580) |
Table 12.
Comparison of the results for each data set.
| Author | Model | Data | Partition | ACC | Se | Sp | MCC | F-Score | AUC |
|---|---|---|---|---|---|---|---|---|---|
| This study | SE Fuzzy ART | Data | 70–30 | 0.8000 | 0.8704 | 0.6774 | 0.5610 | 0.8468 | 0.7739 |
| SE Euclidean ART | Data | 70–30 | 0.7059 | 0.7593 | 0.6129 | 0.3697 | 0.7664 | 0.6861 | |
| SE Fuzzy ARTMAP | Data | 70–30 | 0.8353 | 0.8704 | 0.7742 | 0.6446 | 0.8704 | - | |
| SE Fuzzy ART CT | Data | 70–30 | 0.8706 | 0.9259 | 0.7742 | 0.7170 | 0.9009 | 0.8501 | |
| SE Euclidean ART CT | Data | 70–30 | 0.7412 | 0.7778 | 0.6774 | 0.4496 | 0.7925 | 0.7276 | |
| SE Fuzzy ARTMAP CT | Data | 70–30 | 0.8000 | 0.7593 | 0.8710 | 0.6078 | 0.8283 | - | |
| SE Euclidean ARTMAP CT | Data | 70–30 | 0.6353 | 0.7778 | 0.3871 | 0.1763 | 0.7304 | - | |
| SE Fuzzy ART CT | Data | Monte Carlo | 0.8061 | 0.8211 | 0.7800 | 0.6555 | 0.8679 | 0.8006 | |
| [93] | ET | Data | 4-Fold | 0.8000 | 0.7500 | 0.9444 | 0.6133 | 0.8478 | 0.7710 |
| DNN | Data | 4-Fold | 0.9211 | 0.9614 | 0.8456 | 0.8250 | 0.9388 | 0.9220 | |
| TWRF | Data | 70-30 | 0.8600 | 0.9500 | 0.7500 | - | - | - | |
| [21] | RF | Data | 80-20 | 0.8200 | 0.9200 | 0.6500 | - | - | 0.8400 |
| This study | SE Fuzzy ART | Data | 70–30 | 0.7500 | 0.7459 | 0.7540 | 0.4996 | 0.7426 | 0.7499 |
| SE Euclidean ART | Data | 70–30 | 0.7275 | 0.6907 | 0.7619 | 0.4540 | 0.7102 | 0.7263 | |
| SE Fuzzy ARTMAP | Data | 70–30 | 0.7828 | 0.7924 | 0.7738 | 0.5659 | 0.7792 | - | |
| SE Fuzzy ART CT | Data | 70–30 | 0.9836 | 0.9703 | 0.9960 | 0.9674 | 0.9828 | 0.9481 | |
| SE Euclidean ART CT | Data | 70–30 | 0.7807 | 0.5466 | 1.000 | 0.6194 | 0.7068 | 0.7733 | |
| SE Fuzzy ARTMAP CT | Data | 70–30 | 0.7377 | 0.7119 | 0.7619 | 0.4745 | 0.7241 | - | |
| SE Euclidean ARTMAP CT | Data | 70–30 | 0.6967 | 0.7119 | 0.6828 | 0.3942 | 0.6942 | - | |
| SE Fuzzy ART CT | Data | Monte Carlo | 0.9348 | 0.8992 | 0.9682 | 0.8721 | 0.9301 | 0.9395 | |
| [93] | ET | Data | 4-Fold | 0.8498 | 0.8788 | 0.8221 | 0.7012 | 0.8509 | 0.8510 |
| DNN | Data | 4-Fold | 0.9316 | 0.9327 | 0.9302 | 0.8633 | 0.9263 | 0.9320 | |
| [58] | KNN | Data | hold-out | 0.8600 | 0.8000 | 0.9200 | - | - | 0.8700 |
| This study | SE Fuzzy ART | Data | 70–30 | 0.8889 | 0.2083 | 0.9936 | 0.3824 | 0.3333 | 0.6010 |
| SE Euclidean ART | Data | 70–30 | 0.8778 | 0.5000 | 0.9359 | 0.4524 | 0.5217 | 0.7179 | |
| SE Fuzzy ARTMAP | Data | 70–30 | 0.8667 | 0.3750 | 0.9423 | 0.3595 | 0.4286 | - | |
| SE Fuzzy ART CT | Data | 70–30 | 0.9444 | 0.5833 | 1.0000 | 0.7404 | 0.7368 | 0.7917 | |
| SE Euclidean ART CT | Data | 70–30 | 0.9722 | 0.7917 | 1.0000 | 0.8758 | 0.8837 | 0.8962 | |
| SE Fuzzy ARTMAP CT | Data | 70–30 | 0.8889 | 0.4583 | 0.9551 | 0.4685 | 0.5238 | - | |
| SE Euclidean ARTMAP CT | Data | 70–30 | 0.8722 | 0.4583 | 0.9359 | 0.4175 | 0.4889 | - | |
| SE Euclidean ART CT | Data | Monte Carlo | 0.9265 | 0.4714 | 0.9965 | 0.6195 | 0.5924 | 0.7458 | |
| [93] | ET | Data | 4-Fold | 0.9200 | 0.7143 | 0.9301 | 0.4530 | 0.4545 | 0.6590 |
| DNN | Data | 4-Fold | 0.9333 | 0.7705 | 0.9547 | 0.6904 | 0.7249 | 0.8597 | |
| [54] | LSTM | Data | 10-Fold | 0.8666 | 0.9942 | - | - | 0.9189 | 0.6250 |
| CNN-LSTM | Data | 80–20 | 0.9230 | 0.9368 | - | - | 0.9300 | 0.9000 | |
| SE: Self-Expanding; CT: Continuous Training; ET: Extremely Randomized Trees; DNN: Deep Neural Network; RF: Random Forest; TWRF: Three-way Random Forest; KNN: K Nearest neighbors; LSTM: Long short-term memory; CNN: Convolutional Neural Networks. | |||||||||
Table 13.
Computational time (in seconds) for each dataset.
| Model | Data | Data | Data |
|---|---|---|---|
| SE Fuzzy ART CT | 1.25 | 6.34 | 5.14 |
| SE Euclidean ART CT | 1.22 | 0.62 | 1.67 |
| DNN | 20.2 | 40.32 | 21.01 |
Table 14.
Results obtained by each model for the combined data set.
| Model | SE Fuzzy ART CT | KNN | RF | MLP | LR | ET | XGB | NB |
|---|---|---|---|---|---|---|---|---|
| ACC | 0.9828 | 0.7277 | 0.7931 | 0.7825 | 0.7617 | 0.7748 | 0.7333 | 0.7429 |
| Se | 0.9667 | 0.5986 | 0.7014 | 0.6806 | 0.6389 | 0.5806 | 0.8722 | 0.6806 |
| Sp | 0.9920 | 0.8019 | 0.8458 | 0.8411 | 0.8323 | 0.8866 | 0.6534 | 0.7788 |
| F-Score | 0.9762 | 0.6162 | 0.7123 | 0.6955 | 0.6619 | 0.6531 | 0.7048 | 0.6590 |
| MCC | 0.9628 | 0.4059 | 0.5510 | 0.5267 | 0.4790 | 0.4988 | 0.5076 | 0.4536 |
Table 15.
Results obtained by each model trained with the combined data and validated with Dados.
| Model | SE Fuzzy ART CT | KNN | RF | MLP | LR | ET | XGB | NB |
|---|---|---|---|---|---|---|---|---|
| 0.9770 | 0.7169 | 0.7834 | 0.7724 | 0.7547 | 0.7633 | 0.7308 | 0.7331 | |
| 0.9661 | 0.5834 | 0.6813 | 0.6625 | 0.6286 | 0.5609 | 0.8595 | 0.6637 | |
| 0.9838 | 0.7991 | 0.8462 | 0.8400 | 0.8323 | 0.8879 | 0.6515 | 0.7759 | |
| F-Score | 0.9698 | 0.6110 | 0.7057 | 0.6893 | 0.6614 | 0.6436 | 0.7087 | 0.6547 |
| 0,9513 | 0,3903 | 0,5355 | 0,5112 | 0,4714 | 0,4838 | 0,5076 | 0,4374 |
Table 16.
Results obtained by each model trained with the combined data and validated by Dados.
| Modelo | SE Fuzzy ART CT | KNN | RF | MLP | LR | ET | XGB | NB |
|---|---|---|---|---|---|---|---|---|
| 0,9645 | 0,7326 | 0,7863 | 0,7699 | 0,7539 | 0,7654 | 0,7326 | 0,7370 | |
| 0,9710 | 0,6388 | 0,7168 | 0,6901 | 0,6589 | 0,6042 | 0,8796 | 0,7101 | |
| 0,9601 | 0,7947 | 0,8323 | 0,8227 | 0,8168 | 0,8722 | 0,6352 | 0,7548 | |
| F-Score | 0,9561 | 0,6556 | 0,7278 | 0,7050 | 0,6809 | 0,6725 | 0,7239 | 0,6827 |
| 0,9266 | 0,4377 | 0,5522 | 0,5168 | 0,4817 | 0,5011 | 0,5090 | 0,4597 |
Disclaimer/Publisher’s Note: The statements, opinions and data contained in all publications are solely those of the individual author(s) and contributor(s) and not of MDPI and/or the editor(s). MDPI and/or the editor(s) disclaim responsibility for any injury to people or property resulting from any ideas, methods, instructions or products referred to in the content. |
© 2024 by the authors. Licensee MDPI, Basel, Switzerland. This article is an open access article distributed under the terms and conditions of the Creative Commons Attribution (CC BY) license (http://creativecommons.org/licenses/by/4.0/).
Copyright: This open access article is published under a Creative Commons CC BY 4.0 license, which permit the free download, distribution, and reuse, provided that the author and preprint are cited in any reuse.


