Submitted:
12 April 2024
Posted:
15 April 2024
You are already at the latest version
Abstract
Electrochemical Impedance Spectroscopy (EIS) is a powerful non-invasive technique used to characterize Lithium-ion cells. Its application allows to identify and track the evolutions of cell degradation processes within a short testing time. This review collects all the available works which have used EIS spectra either to characterize Li-ion cell degradation or to develop Electric Circuit Models (ECMs). The objectives of this work are: (i) to highlight the influence of different aging test conditions on the EIS spectra; (ii) to find the correlations between EIS spectra variations and the underlying degradation mechanisms and (iii) to list the available options to formulate ECMs from EIS spectra of aged cells. After an exhaustive analysis of the state-of-the-art, a critical review is presented to discuss the existing links between degradation mechanisms and the most reliable solutions to model them.
Keywords:
batteries
; ecm
; eis
; modelling
1. Introduction
Lithium-ion (Li-ion) batteries represent a pivotal technology to fulfil the ambitions of the European Green Deal [1]. They will contribute to the specific objectives of ensuring the supply of clean energy and accelerating the shift to sustainable mobility. On one side, Li-ion stationary solutions allow indeed the large-scale utilization of intermittent renewable energy sources; on the other side, their high gravimetric and volumetric energy density allow the electrification and hybridization of vehicles overcoming space and weight limitations [2]. However, degradation and improper operation of Li-ion batteries can significantly affect performances. Battery leakage, insulation damage and partial short circuit problems lead to unsafe operation and, in the wort case, to accidents [3]. So that, Li-ion batteries require the so-called Battery Management System (BMS) to ensure safe and reliable operations during their lifetime, to guarantee a more efficient use and possibly reuse in second-life applications [4]. The detection of battery aging is challenging due to the interdependency of the various degradation mechanisms that manifest themselves by capacity and power fade and can have chemical and mechanical origins [2]. State of Health (SoH) is the indicator used to evaluate the status (i.e. health) of the battery, accounting the ability to convey a specific performance compared with a new battery [5]. Several different estimation methods have been developed to calculate the SoH, depending on the battery chemistry, computational complexity, battery model and data processing mode. The simplest solutions are to track the decrease of cell capacity and the increase of internal resistance [6]. A comprehensive review of the models and method developed in the last years and nowadays used is given by Ungurean et al. in [7]. All these methods are based on measurements done on the full cell and they can be categorized as non-invasive characterization technique.
Another class of characterization technique is given by physico-chemical post-mortem analyses. By opening the cell and harvesting the materials, these techniques provide valuable and detailed information on the chemical composition and eventual degradation of the elements inside the cell (i.e. electrodes, residual electrolyte and separator) [8,9]. The effects occurring at the electrodes can be separated by making experimental half cells that contain li-metal as counter-electrode or by including a reference electrode in the cell (three-electrodes configuration) [11,13,14,30,36]. The chemical structure and surface morphology of the electrodes harvested from dismantled cells can be investigated with several different techniques. The most used ones can be classified in three categories:
- X-ray based techniques: such as X-Ray Diffraction (XRD) [8,10,14,15,16,17,18,19,20]; Energy Dispersive Spectroscopy (EDS) [8,12,16,19,21], X-ray Absorption Spectroscopy (XAS) [9,17], and X-ray Photoelectron Technique (XPS) [22,23,24,25].
- Electron and Scanning probe microscopy: such as Scanning Electron Microscopy (SEM) [10,15,26] Transmission Electron Microscopy (TEM) [8,10,15,22,26], Electron Probe Microscopic Analysis (EPMA) [27] and Focused Ion Beam (FIB) technique [22].
- Spectroscopic techniques: such as Fourier Transform InfraRed spectrometry (FTIR) [18], Raman spectroscopy [9] and Prompt Gamma Activation Analysis (PGAA) [14].
Even if all these invasive techniques allow a more precise under-standing of the degradation mechanisms, their application in a BMS is clearly unfeasible [28]. The BMS monitors simple variables, such as voltage, current and temperature and combines them with variable complexity depending on the available algorithm and computational power: degradation monitoring in real-time condition could be an issue [28]. In the last years, efforts have been made to determine battery states like temperature, State of Charge (SoC) and SoH by means of EIS coupled with an ECM [29]. EIS characterizes the impedance of an electrochemical system using low amplitude sinusoidal current or voltage signals excitations over a range of frequencies [30]. Being based on voltage and current measurements acquisition, EIS has been proposed as a fast, non-invasive and reliable technique, able to identify the actual origin of cell degradation processes [31,32]. So that, the impedance rise and the processes occurring inside the cell can be directly tracked with the Electric Circuit Model (ECM) parameters evolution [33].
Here, we collect the available articles where EIS has been exploited to analyse Li-ion cell degradation and to model it by means of ECMs. This review is addressed to both scientists and industrial representatives who aim to approach degradation modelling of Li-ion cells via EIS characterization. The readers will be able to replicate the described experiments or to apply the same methodology for their own experiments.
2. Methodology and Outline
The reviewed papers are listed in Table 1, where the main author, year of publication, cathode chemistry type (i.e. Li-ion cells with graphite-based anode), the testing type and information about the use of invasive characterization techniques are given for each specific article. Since Li-ion cells show different characteristics (i.e. energy density, open circuit voltage and degradation phenomena) depending on the chemical composition of the cathode, four main chemistries have been taken into account in the review: Lithium Cobalt Oxide (LCO) cells [8,10,13,15,26,27,34,35,36,37,38,39]; Lithium Iron Phosphate (LFP) [16,17,18,40,41,42,43,44,45,46], Lithium Nickel Manganese Cobalt Oxide (NMC) cells [9,11,12,14,19,21,23,47,48,49,50,51,52,53,54,55,56,57,58,59,60,61] and Lithium Nickel Cobalt Aluminium Oxide (NCA) cells [20,24,25,32,62,63,64,65]. Minor influence and also smaller number of publication have been found for Li-ion Polymer (LiPO) [66] and Lithium Manganese Oxide (LMO) cells [22,67]. It is remarkable that, even if two cells have the same cathode chemistry type, they can have slightly different behaviour due to chemistry (e.g. different fractions of each element with respect the total mass of the electrode or presence of additives) and due to physical variables (e.g. thickness of the electrode). Looking at the year of publication and cathode chemistry type, it results that the oldest studies done in the first decade of 2000 are mostly related to LCO and LMO, while the studies published in the second decade of 2000 are related to LFP, NMC and NCA. This trend follows the development of Li-ion cells cathode materials with respect to the main technologies that have been commercialized along the years [68]. Two main testing types are normally exploited to study battery degradation: cycling and calendar aging tests. The first class consists in charging and discharging the cells with a predefined set of parameters: current rate, Depth of Discharge (DoD - voltage window used to run the test) and temperature. These parameters could be fixed differently for charging and discharging phase; symmetric cycling is defined when the current rate is fixed to the same value for both charge and discharge. The second class of tests consists in storing the cells for a predefined period at a specific temperature and SoC. Further details on the parameters used in the aging tests will be given in Section 3. To verify the existence of a link between EIS results and physical processes occurring inside the cell, it is possible to exploit invasive characterization techniques. This type of validation, combining EIS and other optical, chemical and electrochemical analyses is very often applied [69]. The last column of Table 1 lists the techniques exploited in the works under review. The description on the use of these techniques to detect specific processes or degradation mechanisms that occurred in the cell will be given in the next sections, where the findings of the reviewed articles are presented.
All the works listed in Table 1 have been used to understand how the EIS curve is related to the cell application, to the cell degradation and to the ECM solutions applied to model the cell behaviour. These connections are showed by the chart in Figure 1 and they represent how this review article is organised (4 sections). In Section 3, the relationship between the cell application (i.e. the test characteristics) and the variations in the impedance curve are analysed in the reviewed papers. In Section 4, the relationship between the registered impedance curve variations and the associated degradation mechanisms is highlighted. In Section 5, the proposed ECMs are analysed with specific attention on how the EIS variations are modelled. Finally, in Section 6, a critical review will be made on all the works included in this article and on any link between Section 4 and Section 5, that is between the degradation mechanism occurring in the cell and the ECM specificity to model them. The final remarks and conclusions are given in Section 7.
3. How the Application Impacts on the EIS Spectra
The slower or faster degradation of a Li-ion cell depends on how the cell is used during its lifetime. On top of the calendar and cycling aging difference, specific testing-types are a combination of the so-called extrinsic factors [28]: time, temperature, SoC level (or voltage level), current rate (C-rate), DoD (or voltage interval) and mechanical stress. Their magnitude and variation affect the impedance of the cell and consequently the EIS curve. Table 2 and Table 3 describe respectively calendar aging and cycling aging experiments with the parameters chosen for the different experiments in the reviewed articles and the effects on the impedance curve. The first and second coloumns of the two tables give information about the article reference and the cathode chemistry type. A specific notation is introduced to define different regions of the impedance curve and to follow their changes with aging (i.e. impedance rise). This notation has been already used in other works, such as in [50,71], and it is shown in Figure 2. The high frequency inductive behaviour of the cell does not provide useful information about the cell behaviour and is neglected in this work. EIS spectrum could be divided in 3 regions:
- Ohmic region (frequency higher than 1000 Hz): it represents the internal resistance of the cell measured where the cell impedance switch from an inductive to capacitive behaviour [29]. The value of the internal resistance could be use as indicator of the state of health of the battery [33].
- Mid-frequency region (frequency interval between 1000 Hz and 0.1 Hz): it represents the charge-transfer processes, both from electrolyte to electrodes surface and from electrodes surface into the bulk active material of the electrodes. It has always the shape of depressed semi-circular arches. It is usually composed by a singular semiarch or by two semiarches, depending on the cell chemistries and/or the specific ongoing aging mechanism [33,50].
- Low-frequency region (frequency lower than 0.1 Hz): it represents the diffusion processes at the two electrodes [29]. This region is often neglected [11,57,60] or even not measured [37]: the reasons could be traced in the longer time required to measure impedance at lower frequencies.
When a specific part of the EIS curve is affected by the testing conditions, a X symbol is marked into the corresponding cell of Table 2 and Table 3. This symbol is followed by a qualitative indicator of its magnitude:
- the single sign “-” means a decrease of the impedance, that in the Nyquist plot corresponds to a shift of the curve on the left side or a decrease of the size of the Mid-frequency semiarch;
- the sign “+” means an impedance rise, that in the Nyquist plot corresponds to a shift of the curve on the right side or an increase of the size of the Mid-frequency semiarch.
When a double sign is used (e.g. “++“) it means that the effect is stronger than in the other regions where only a single sign is present.
Looking at calendar aging experiments, from Table 2 it emerges that the impedance growth affects the different regions depending on the cathode chemistry type. In detail, the tests done on LCO cells in [10,35] show that at high temperature there is no effect on Ohmic region but only in the Mid-frequency region. It is remarkable the different duration of the tests: in [35], the experiments done by Osaka et al. lasted only 20 days and show an impedance increase only in the 2nd semiarch of Mid-frequency region; in [10] the experiments lasted 5 times more (100 days) and show an increase in both the semiarches. Looking at the SoC level, when it is high (up to 100% SoC), an impedance rise is also visible in the Low-frequency region [10]. A similar behaviour is described by Jungst et al. in [64] and by Abraham et al. in [25] for NCA cells: the tests were performed at 55 ◦C for about 140 days with SoC respectively of 100% and 80%. A general impedance rise was observed in the Mid-frequency region for both the papers and a rise in the Low-frequency region was also observed in [25]. Looking at the other cathode chemistry types, i.e. at LMO, LFP and NMC cells, the effects of calendar aging have been also observed in the Ohmic region. In the first case, i.e. LMO cells, Yoshida et al. stored cells at 40 ◦C and 50% SoC for 400 days [22]. The evolution of EIS spectrum shows a homogeneous impedance rise with a shift of the curve on the right side and a growth of the semiarch in the Mid-frequency region. Looking at LFP cells, no common results are highlighted between the articles under review. The effects of calendar aging appear only in one region per each different article. In [44] Stroe et al. observed a large increase of ohmic resistance, storing the cells for a duration up to 24 months, at high temperature and at three SoC levels (10%, 50% and 90%). Also Zavalis et al. observed the effects of calendar aging in the Ohmic region, but in this case with a decrease of ohmic resistance: the tests were performed at ambient temperature and 60% SoC; the test duration is not specified in days but the calendar tests lasted until the cells under cycling aging reached End of Life (EoL) [45]. The EoL condition is reached when the residual capacity of a Li-ion cell is 80% of the nominal capacity given in the datasheet by the manufacturer (SoH = 80%). In [18] instead, Kassem et al. stored the cells for 8 months at 60 ◦C and 100% SoC observing only a rise in the size of Mid-frequency semiarch. As regards NMC cathode chemistry type, Schmitt et al. observed a homogeneous impedance rise within the Ohmic and Mid-frequency regions, storing the cells at 45 ◦C and 100% SoC for about 12 months [58]. Similar results have been collected by Sabet et al. in [59]: they observed a marked impedance rise in the Ohmic region and in both the two semiarches of Mid-frequency region storing the cells at 100% SoC and at 35 ◦C for about 23 months. The authors also performed calendar aging tests storing cells at 80% SoC at two different temperatures: 35 ◦C and 45 ◦C. The article does not include the evolution of EIS spectra in these two cases but includes the discussion about the specific impedance rise related to SEI layer (i.e. 1st semiarch of Mid-frequency region). With respect to the case at 100% SoC and 35 ◦C, at 80% SoC the calendar aging is less severe at 35 ◦C and more severe at 45 ◦C. In the remaining cases the impedance rise is stronger in the Mid-frequency region than in the Ohmic one. Stiasnzy et al. observed a large impedance rise in the 2nd semiarch of Mid-frequency region storing the cells at 100% SoC level and high temperature (60 ◦C) for about 10 months [57]. In [61] Wang et al. combined calendar and cycling aging experiments to simulate the application in an electric vehicle. They stored the cells at various SoC levels and at different temperatures between 25 ◦C and 50 ◦C and they observed a negligible impedance rise in the Ohmic region compared to Mid-frequency one. Finally, Ecker et al. observed a doubled impedance value with respect to initial one in the Mid-frequency region, storing the cell for 420 days at three levels of temperature (35 ◦C, 50 ◦C and 65 ◦C) and at 50% SoC in [60].
Having analysed the articles listed in Table 2, the effects of the different parameters involved in calendar aging experiments onto the EIS spectra can be now analysed. A graphical representation of the EIS spectrum evolution during calendar aging experiments is given in the Nyquist plot of Figure 3a. The Mid-frequency region is represented with a singular semiarch. The black arrows show the expected EIS shifts during aging: a homogeneous impedance rise in the Ohmic region (i.e. a shift from the left to the right) together with an enlargement of the semiarch. When the application of the cell implies high temperatures and/or storage at high or low SoC, the calendar aging becomes stronger. The effects are shown by the dotted arrows in Figure 3a: a larger shift on the X-axis and a larger expansion of the Mid-frequency semiarch, which implies a greater shift of the diffusive tail to the right side. Across the different chemistry types, LCO and NCA cells showed an impedance rise only in the Mid- and Low-frequency regions [10,25,35,64]; LFP, LMO and NMC showed an impedance rise in the Ohmic and Mid-frequency regions [18,22,44,45,57,59,60,61]. Moreover, NMC cells exhibited the largest EIS spectra shifts with respect to the other cathode chemistries [57,59,60,61]. Further details and a critical assessment about the reviewed works on calendar aging will be given in Section 6.
Looking at the cycling aging experiments in Table 3, it emerges that the effect of degradation is observable both in the Ohmic and in the Mid-frequency regions for all the different cathode chemistry types. For an effective analysis of the experimental results, the SoH values of the cells have been reported with the number of cycles. When this variable was not available in the article under review, it has been calculated as fraction of the measured capacity after cycling over the nominal capacity. Almost the totality of the works reviewed exploited the full capacity of the cells: only in four cases the DoD is lower than 100% [21,37,42,59]. As regards the current rate, most of the articles used high rates (equal or higher than 1C) obtaining EIS spectra that could be categorized depending on their evolution: (i) impedance rise only in one frequency region; (ii) homogeneous impedance rise in different frequency regions and (iii) generalized impedance rise with larger increase in one or more areas of the whole EIS spectrum. Looking at the first category, a further distinction could be based on the cathode chemistry. LFP cells showed only an increase of ohmic resistance with 1C cycling at - 22 °C and at 30 °C respectively in [41] and in [16]. At very low temperature (- 22 °C) the cells under testing reached 74% SoH after 300 cycles while at higher temperature (30 °C) the cells reached 80% SoH after 3200 cycles. The same EIS spectrum evolution has been observed by Zavalis et al. in [45] simulating the Hybrid Electric Vehicle (HEV) application until the cells reached 80% SoH. For LCO and NMC cathode chemistry types the impedance changes have been observed in the Mid-frequency region. LCO cells showed an impedance rise in both the two semiarches of Mid-frequency region in [26] and in [27] with respectively 3C and 0.8C symmetric cycling reaching 83% SoH (300 cycles) and 68% SoH (800 cycles). A peculiar behaviour is observed by Osaka et al. cycling LCO cells at 2C in [35]: after 20 cycles the cell reached 78% SoH and showed an impedance reduction in the 1st semiarch and an augmentation in the 2nd semiarch. In the case of NMC cells, the impedance rise in the Mid-frequency region (both the semiarches) has been observed by Leng et al. in [47] with 1C charge-2C discharge cycling; by Heins et al. in [54] with 1.5C symmetric cycling and by Buchberger et al. in [14] with 1C symmetric cycling conditions. The same behaviour has also been detected by Li et al. in [12] with lower current rate (0.5C). In other works testing NMC cells, the impedance rise was detected only in the first semiarch of the Mid-frequency region [23,55,56]. In [55] the authors applied 1C symmetric cycling, reaching 85% SoH after 450 cycles at 20 °C; in [56] Xiong et al. applied a constant charging rate of 1C and different discharging rates (1C, 2C and 3C) at 10 °C and they reached 70% SoH after 650 cycles; in [23] Joshi et al. made laboratory cells and applied a lower rate cycling (0.5C)reaching 96% SoH after 50 cycles. As regards the second category (homogeneous impedance rise in different frequency regions) similar results have been observed for different cathode chemistry types with impedance rise both in the Ohmic and Mid-frequency regions: applying 1C symmetric cycling to LCO cells [15,38], to LiPO cells [66] and to NMC cells [48]; applying C/3 charge and 1C discharge cycling to NMC cells in [59] and applying 0.5C charge and 1C discharge cycling to NCA cells in [32]. The same result has been also obtained by Sabet et al. for NCA cells in [62] and by Wang et al. for LFP cells in [46]. In the first case, Sabet et al. applied very severe testing conditions: the cells reached 70% SoH after 400 cycles down to - 10 °C and with a current rate up to 3C. In the second case, Wang et al. performed 800 cycles at 45 °C with high current rate (2C) reaching 80% SoH. The third category includes all the works where a generalized impedance rise with larger increase in one or more areas of the whole EIS spectrum was observed. As regards NMC cells, 1C symmetric cycling was performed in [11,19,50,52] reaching respectively 5%, 86%, 80% and 97% of SoH. In the first case, Stiaszny et al. performed 800 cycles at ambient temperature and observed a large increase of ohmic resistance, coupled with a small decrease and a small increase of impedance respectively in the first and second semiarches of Mid-frequency region [11]. In the second case, Westerhoff et al. tested the cells in a temperature range between 20 °C and 50 °C observing a strong impedance rise in the 2nd semiarch of the Mid-frequency region [50]. In the latter cases, Jalkanen et al. performed long term cycling tests (1500 cycles) at high temperature (45 °C during charging phase and 65 °C during discharging phase) while Aurora et al. performed a short test campaign (50 cycles) obtaining similar results: an increase of ohmic resistance and an augmentation of the 2nd semiarch with a small or negligible impedance rise in the 1st semiarch of Mid-frequency region [19,52]. Looking at other experimental conditions, Maheshwari et al. performed 500 cycles at 1C in charging phase and 2C in discharging phase with 50% DoD in [21]. After cycling they reached 55% SoH and the EIS spectrum evolution showed a large increase of ohmic resistance coupled with a small impedance rise in the 1st semiarch of Mid-frequency region. In [61] instead, Waag et al. applied a specific current profile to simulate EV use: they reached 90% SoH with 1900 cycles. As already mentioned, they coupled cycling and calendar aging tests and they observed a larger impedance rise in the Mid-frequency region than in the Ohmic one. As regards NCA cells, a strong impedance rise was observed in the 2nd semiarch of Mid-frequency region by Zhang et al. performing symmetric cycles at high current rate and temperature (5C and 40 °C) reaching 82% SoH with 5250 cycles [20]. The same impedance evolution behaviour has been observed by Wong et al. in [63]. They studied the impact of high pulsed rate discharge with current peak of 83C; the charging phase was fixed to 1C to neglect its effect on the impedance curve with respect to the discharging phase. The cells under testing reached 80% SoH after 400 cycles. A different result was observed by Zhang et al. in [24]: they cycled different cells at different symmetric cycling conditions obtaining a strong increase of Ohmic resistance and a small augmentation of the Mid-frequency semiarch. Testing the cells at 1C, 2C and 3C, they reached respectively 75%, 72% and 64% SoH after 400 cycles. As regards LFP cathode chemistry, Zhang et al. simulated Plug-in Hybrid Electric Vehicle (PHEV) application applying a pulsed profile defined by the United States Environmental Protection Agency (US EPA) and named Urban Dynamometer Driving Schedule (UDDS) [42]. A general impedance rise is observed, with an increase of three times of the size of the Mid-frequency semiarch with respect to the value before cycling. Looking at the other works where high rate cycling experiments were performed (Table 3), a peculiar behaviour is observed in [17,39,67,70] where the 2nd semiarch of Mid-frequency region appeared and grew due to cycling. In [39] Lyu et al. performed 1C and 2C symmetric cycling tests on LCO cells at 25 °C. In the first case the authors observed an impedance rise in the Ohmic region and in the 1st semiarch, with the rise of the 2nd semiarch. With higher rate, they observed a similar behaviour with a more pronounced impedance rise in the 2nd semiarch. In [67] Popp et al. cycled LMO cells with a symmetric rate of 2C and reached 67% SoH after 1400 cycles. The EIS spectrum evolution showed a general impedance rise for the whole curve and the appearance and large growth of a 2nd semiarch in the Mid-frequency region. In [70] Eddahech et al. monitored aging of Li-ion cells during power cycling tests: they reached 81% SoH performing 3.8⋅105 micro-cycles with current pulses from 1C to 7C. They observed the appearance and growth of 2nd semi-arch in the Mid-frequency region and a small shift to the right of the EIS curve due to grow of the ohmic resistance. The same behaviour was observed by Wong et al. in [17]. They tested LFP cells with pulsed current up to 15C: after 40 full cycles the ions intercalation was completely inhibited leading to no available capacity for cycling (i.e. SoH = 0%). In a smaller number of cases, a large impedance rise in the 1st or 2nd semiarch of Mid-frequency region is observed when cycling tests were performed at reduced current rate (i.e. lower than 1C). This is the case in [37], where Kato et al. tested LCO cells with a protocol composed by repetition of 200 symmetric cycles at 0.3C with 10% DoD and one full cycle (i.e. 100% DoD) at 0.1C. After 19,800 cycles, the cells reached 68% of SoH showing a large augmentation of the 2nd semiarch. The same result was obtained by Zhou et al. for LCO cells in [8] and by Yang et al. for NMC cells in [51]. In [8] the authors performed 0.5C symmetric cycling tests and they reached 87% SoH after 500 cycles; in [51] the authors applied C/3 symmetric cycling protocol and they reached 82% SoH after 550 cycles. Another example is given by Li et al. in [9], where they reached a very low residual capacity (43% SoH) with 1500 cycles at 0.5C. Among all the works listed in Table 3, only few cases present impedance variations in the Low-frequency region: these variations are always coupled with impedance rise in the Ohmic and in the Mid-frequency regions, as in the work on LMO cells of Popp et al. already presented [67]. In [36] Tro¨ltzsch et al. performed cycling tests on LCO cells with high rate charging phase (1C) and 0.5C discharging phase. They observed the impedance rise in the Ohmic region, in the 2nd semiarch of Mid-frequency and in the Low-frequency region. As regards LFP cells, the impedance rise in the Low-frequency region was observed with high current rate testing at different temperatures in [40,42,43]. In the first case, Schindler et al. performed 100 cycles at - 22 °C reaching 80% SoH; they applied 2C symmetric cycling protocol and they observed a homogeneous impedance growth among the different frequency re-gions [40]. In the second case, Zhang et al. simulated PHEV application at 45 °C (the cycling tests have been already presented) [42]. In the third case, Monem et al. evaluated different pulsed charging protocols [43]. Exploiting a constant current-constant voltage with negative pulse (maximum 1C) protocols and constant discharge at 5C at ambient temperature, the authors reached 95% SoH after 500 cycles. Looking at NMC cells, the impedance rise in the Low-frequency region was observed in [49] and in [53]. In the first case, Zhou et al. performed cycling tests at 45 °C with two different cycling rates: 1C symmetric rate and more severe conditions not specified. In the worst case the cell reached 72% SoH [49]. In the second case, Klett et al. performed a short test campaign, composed by 50 symmetric cycles at 30 °C. They reached 95% SoH with a current rate of C/3. Finally, concerning NCA cells, Sun et al. performed 1C symmetric cycling at two different temperatures: 25 °C and 45 °C [65]. In both the cases the impedance rise was generalized overall the EIS spectra. However, at 25 °C a larger increase of Ohmic resistance was observed compared to the other part of EIS spectrum. At 45 °C instead, the impedance rise was larger than at 45 °C but it was homogeneous overall the different frequency regions.
Having analysed the articles listed in Table 3, the effects of the different parameters involved in cycling aging experiments onto the EIS spectra can be now analysed. The graphical representation in the Nyquist plot is given in Figure 3b, where only one semiarch is represented in the Mid-frequency region. In general, as the number of cycles increases (i.e. the cycled energy increases), the EIS spectrum is shifted on the right side (increase of ohmic resistance) together with a specific impact on the Mid- and Low-frequency regions. A stronger impedance rise, marked by the dotted arrows in Figure 3b, is caused by severe temperatures. On the one side, low temperatures mainly impact on the ohmic resistance of the cell, leading to large shift of the EIS spectrum on the right side of the Nyquist plot [41]. On the other side, high temperatures impact mainly on the Mid-frequency region, leading to an enlargement of the semiarch (or of the two semiarches if present) [19,42,61]. High current rates also have their impacts onto the EIS spectra and mainly on the 2nd semiarch, when it is present [15,20,50,63,70]. The combination of severe conditions, e.g. low temperature and high C-rate clearly shows an even more severe effect on the cycled cell [40,61,62]. On the contrary, a parameter that usually reduces the severity of cycling is DoD. At reduced DoD the impedance rise is slowed if compared to higher DoD [59]. Further comments and the critical assessment of the impact of the cycling aging application on the EIS spectra will be given in Section 6.
4. How EIS Spectra Are Linked to Degradation
Degradation in Li-ion cells is caused by many physical and chemical mechanisms, which affect the different elements inside a cell: the electrodes, the electrolyte, the separator and the current collectors [31,72,73]. The most common reported degradation mechanisms in Li-ion cells will be mentioned in this review; the list is given in the left side of Figure 4 (first column). These degradation mechanisms do not leave a unique fingerprint in the cell’s OCV and impedance curve, but they can be clustered into the so-called degradation modes, as shown in Figure 4. The three commonly reported modes, with the respective degradation mechanisms, are [32,74,75,76]:
- Loss of Lithium inventory: lithium ions are consumed by processes such as parasitic reactions, decomposition reactions (SET layer decomposition, electrolyte decomposition), SET layer growth, lithium plating and they are no longer available for cycling between anode and cathode. So that, the available capacity of the cell decreases leading to capacity fade.
- Loss of anode active material: active material of the anode is no longer available due to structural disordering, particle cracking, graphite exfoliation, loss of electrical contact or blocking of the active sites by passivation surface layers. Consequently, the effects can be accounted both in capacity and power fade.
- Loss of cathode active material: this mode is similar to the previous one but it concerns the cathode. Active material is no longer available due to structural disordering, particle cracking, loss of electrical contact or Cathode Electrolyte Tnterface (CET) formation. This degradation mode leads both to capacity and power fades.
A more specific description of the degradation mechanisms is out of the objective of this work. However, the readers interested in more details are addressed to the work of Vetter et al. [31] and to the review article of Agubra et al. [73].
The relationship between Li-ion cell degradation and impedance curve variations is shown in Table 4: the four main row-sections of the table represent the three distinctive regions of ETS curve with the specific distinction of Mid-frequency region semiarches. These row-sections are divided in 5 rows representing the different cell chemistries. On the other side, each column represents a different degradation mechanism. For a more effective analysis of the literature, the degradation mecha¬nisms (graphite exfoliation, structural disordering and particle cracking) related to the anode have been grouped in the “loss of anode active material” degradation mode. When a correspondence between ETS re¬gion and degradation mechanism is found, the article reference number is used to mark the link in the correspondent cell.
As will emerged in the discussion below, most of the degradation mechanisms are not uniquely assigned to a specific region of the impedance curve. When available from the reviewed paper, the vali-dation of ETS observation via more detailed characterization has been included in the analyses to deepen the investigation.
As regards of LCO chemistry, in [34] De Vries et al. studied the cell lifetime depending on the DoD in cycling. Tn the results, they showed the impedance spectra of a cell aged with 100% DoD. They observed a pronounced impedance rise in the Mid-frequency region, assigning this variation to SET layer growth, in agreement to previous investigations. Similarly, Mukoyama et al. observed variations along the whole impedance spectra in [38]: they assigned SET layer growth to semiarch 1 and disconnection/cracking of cathode particles to semiarch 2. Tn [35] Osaka et al. observed an increase of interfacial resistance of the cathode during cycling and nearly a constant value for the anode. They explained this observation with the formation of stable SET layer on anode surface during formation and a growing CET layer on the cathode surface due to the strong oxidizing power of cobalt ions. This effect is assigned to the Mid-frequency region of impedance spectra. The same degradation mechanism has also been addressed in the Mid-frequency region by the analyses of Li et al. in [15] and of Zhang et al. in [27]. Tn the first case, the authors validated their results by detecting the formation of defect on the cathode and the growth of passivation layer by means of SEM, TEM and XRD [15]; in the latter case the authors made half-cells to analyse the ETS spectra of the two electrodes separately [27]. Differ¬ently, Tro¨ltzsch et al. measured an increase of the ohmic resistance and an impedance rise in the Mid- and Low-frequency regions in [36]. They assigned the variations in the Ohmic region to electrolyte decomposition and the variations in the Mid- and Low-frequency regions to cathode charge transfer slow down. Analogous result was obtained by Lyu et al. in [39]: however, in this case, the 1st semiarch of Mid-frequency region was not assigned to cathode related degradation but it was assigned to SEI growth. In [8] Zhou et al. used half-cells for the characterization of the electrodes. They found out that the variations in anode impedance are negligible and they focussed on the cathode: the EIS spectra showed variations in the Ohmic and in the Mid-frequency regions (2nd semi-arch). These variations have been respectively assigned to CEI layer formation and growth and to cracks and defects in the cathode structure (validation with TEM imaging). A similar analysis has been performed by Ning et al. in [26], using half-cells and SEM imaging to validate the results. They observed degradation and charge transfer slow down on the cathode side in the second semiarch of Mid-frequency region. Differently from the previous work, the anode impedance rise was not negligible and SEI layer growth has been addressed in the 1st semiarch of Mid-frequency region.
As regards of LMO chemistry, in [67] Popp et al. addressed the changes in the impedance curve of the cell to lithium plating and to electrolyte decomposition. These mechanisms have been identified by a huge shift of the impedance curve to the right-hand side of the Nyquist plot and by a growth of the size of the semiarches related to Mid-frequency region. So that the degradation has been assigned to all the three regions of the impedance spectra. Different results have been presented by Yoshida et al. in [22]. They exploited FIB, XPS and SEM imaging to characterize the electrodes after aging and to measure the thickness of the SEI layer. They concluded that both the electrodes contribute to the cell degradation: increase of ohmic resistance is due to SEI layer growth and the impedance rise in the Mid-frequency region is due to cathode charge transfer slow down.
As regards of LFP chemistry, in [40] Schindler et al. assigned the increase of ohmic resistance to corrosion of current collector and electrolyte decomposition. Observing the EIS spectra variations in the Mid-and Low-frequency regions, they addressed the impedance rise respectively to SEI layer processes (growth and decomposition) and particle cracking of the cathode. In [41] Petzl et al. assigned the increase of ohmic resistance to electrolyte decomposition caused by surface film formation on plated lithium and to SEI layer growth; these investigations have been validated by material characterization of the anode. Also Zhang et al. highlighted the relationship between the electrolyte decomposition and passivation film formation on the negative electrode in [42].
The first mechanism has been assigned to the Ohmic region and the second one to the Mid-frequency region, coupled with formation of a passivation layer on the positive electrode (GET). All the remaining works on LFP cells exploited invasive characterization techniques to validate the ETS characterization results: in [16] Sarasketa-Zabala et al. exploited SEM, EDS and XRD and they observed an increase of the ohmic resistance due to SET layer growing and non-uniform electrolyte decomposition; in [18] Kassem et al. exploited half-cells attributing the cathode impedance rise to formation of GET layer and the anode impedance rise to decomposition of SET layer. They demonstrated that the cell degradation is mainly due to loss of lithium inventory (by means of XRD and residual capacity measurements) and that there is no loss of active material (by means of capacity measurements on separate electrodes). Similar conclusions have been presented by Wong et al., in [17]. They showed that the rapid impedance rise in the Mid-frequency region, with the appearance of the 2nd semiarch, is mainly due to the formation of GET layer; minor influence is due to SET layer growth. Tn this case, the authors validated their results exploiting SEM and X-ray techniques (XRD and XAS). Tn [46] Wang et al. performed cycling tests to develop a model for SoH estimation. Analysing the ETS spectra evolution, they assigned the impedance rise of the Mid-frequency region to SET layer growth (1st semiarch) and to charge transfer slow down (2nd semiarch).
As regards of NMG chemistry, many studies are available in literature. The results of the characterizations lead to clustering the works in two groups: the ones addressing the degradation only to loss of lithium inventory related processes and the ones addressing the degradation also to loss of active material at positive, negative or both the electrodes. Looking at the first group, in [21] Maheshwari et al. addressed the ohmic resistance rise to electrolyte decomposition and the impedance rise in the Mid-frequency region to SET layer growth; they validated the results with electrochemical measurements and material analyses (SEM and EDS). Tn [56] Xiong et al. confirmed that the impedance rise in the Mid-frequency region is due to SET layer growth and they indicated this phenomenon as the most sensitive one to describe cell degradation. Also Joshi et al. assigned the Mid-frequency region impedance rise to SET layer growth in [23]. The authors demonstrated that the addition of transition metal species in the electrolyte facilitate the growth of SET layer. The ETS measurement were coupled with SEM and XPS experiments to analyse the SET layer and measure its thickness. Tn [48,50] the degradation mechanisms have been attributed indistinctly to the impedance rise in Ohmic and Mid-frequency regions. Tn the first case, Schuster et al. studied the nonlinear aging characteristic of NMG cells: until 80% SoH the impedance rise is mainly due to SET layer growth (linear aging behaviour); afterwards, the cell capacity drops with a nonlinear behaviour and the impedance rise is faster. This degradation has been attributed to SET layer growth and lithium plating (validation with SEM experiments) [48]. Tn the second case, Westerhoff et al. attributed the impedance rise to SET layer growth and to electrolyte decomposition. Tn [60] Ecker et al. analysed the ETS spectra of a cell stored at high temperature: the impedance rise is larger in the Mid-frequency region than in the Ohmic region. This huge rise has been addressed to SET layer growth and decomposition. The minor rise of the Ohmic region has been addressed to electrolyte decomposition and corrosion of current collector. Looking at the second group of works, i.e. the ones considering both loss of lithium inventory and loss of active material related processes, in [54] Heins et al. applied Distribution of Relaxation Time (DRT) to ETS, observing an impedance rise in the Mid-frequency region due to loss of anode active material. DRT is a mathematical operation that allows to find the time constants of the different processes and to track their changes to understand how the behaviour of the cell evolves [77]; this method is effective to extract useful information by the ETS spectra that are not so evident only analysing the ETS curve in the Nyquist plot. DRT has been also applied in the same research group by Heins et al. in [55] to evaluate the impact of erroneous cell assembly on aging of NMG cells. They discovered a faster degradation of the cathode due to incomplete coverage: in this case the impedance rise was assigned to anode active material loss and to structural disordering of the cathode. Tn [59] Sabet et al. assigned the impedance rise in the Ohmic region and in the first semiarch of Mid-frequency to SET layer growth and the impedance rise in the second part of Mid-frequency region to GET formation. Tn [19] Jalkanen et al. performed cycling aging on NMG cells, characterizing them by means of ETS, SEM imaging, XRD and EDS. Disassembling the cell, they found almost dry electrodes, meaning the electrolyte was consumed during testing: they assigned the increase of ohmic resistance to electrolyte decomposition. As regards the impedance rise in the Mid-frequency region, they assigned it to SET layer growth and lithium plating for the 1st semiarch and to mechanical cracking and loss of contact of the cathode active material for the 2nd semiarch. Tn [11] and in [57] Stiaszny et al. performed electrochemical characterization and post-mortem analyses of cells subjected respectively to cycling and calendar aging experiments. They exploited half-cells and imaging techniques (light microscopy and SEM) to separate the effects at the two electrodes and to validate their results of ETS characterization. They found that the increase in ohmic resistance is caused by the growth of the SET layer and by electrolyte decomposition while the impedance rise in the Mid-frequency region is caused by GET layer formation. Analogous results have been found by Schmitt et al. in [58], exploiting only ETS characterization and adding also structural disordering to the causes of Mid-frequency region impedance rise. Tn [53] Klett et al. exploited a three-electrodes configuration to address separately the phenomena occurring at the two electrodes: for the cathode ETS curve, they attributed the general impedance rise to electrolyte decomposition; for the anode ETS curve they assigned loss of anode active material to the Ohmic and Mid-frequency regions. Analogous results have been presented by Li et al. in [12] using half-cells and validating the measurements by means of SEM and EDS. The Mid-frequency region impedance rise was attributed to electrolyte decomposition and to GET formation for the cathode half-cell and to SET layer growth (1st semiarch) and loss of anode active material (2nd semiarch) for the anode half-cell. Tnteresting results are showed by Buchberger et al. in [14] performing cycling aging tests at different temperatures. At ambient temperature the pronounced impedance rise has been observed in the Mid-frequency region and it has been assigned to electrolyte decomposition and dissolution of transition metal from NMG cathode. At 60 ◦G instead the impedance spectrum showed negligible variations with respect to the reference one: this effect has been attributed to partial SET dissolution, that is a decrease of SET layer resistance that compensate the resistance increase at cathode side. The authors validated their results by means of XRD and PGAA [14]. As observed in the ETS spectra evolution by Buchberger et al., also in [47] and in [9] the cell degradation caused an impedance rise only in the Mid-frequency region. Tn [47] Leng et al. introduced a novel methodology to perform three electrodes measurements without dismantling the cell. Analysing the ETS spectra of the two electrodes they stated the cathode has the highest influence on the full cell ETS spectrum and the impedance rise is due to GET formation. Tn [9] Li et al. applied several material characterization techniques to validate the results obtained with ETS measurements on a three electrodes cell. Gomparing the ETS spectrum of the full cell with the ones of the two electrodes, they found the cathode is the main responsible of the impedance rise of the full cell. This impedance rise is concentrated in the 2nd semiarch, with almost no variations in the 1st semiarch and it has been attributed to cathode’s structural disordering and particle cracking.
As regards of NGA chemistry, in [20] Zhang et al. exploited a three-electrodes configuration to study the impedance variations of NGA cells. The impedance rise is observed in the Mid-frequency region: the variation of the 1st semiarch is assigned to SET layer growth and the variation of the 2nd semiarch is assigned to cathode charge transfer slow down. Similar results have been presented by Sabet et al. in [62], exploiting half-cells and DRT analysis. They identified electrolyte decomposition and in the Ohmic region, lithium plating and cathode structural disordering in the Mid-frequency region and SEI layer growth in both the two mentioned regions. In [24] Zhang et al. exploited XRD, XPS and SEM to characterize the SEI layer during cell degradation and to validate the results of EIS. They assigned the impedance rise in the Ohmic and Mid-frequency regions to SEI layer growth and to electrolyte decomposition. A more detailed attribution of EIS spectra variations has been carried out by Pastor-Ferna`ndez et al. in [32]. They assigned corrosion of current collector to the Ohmic region, lithium plating and SEI layer processes (growth and decomposition) to the Mid-frequency region and cathode particle cracking to the Low-frequency region. In this case no material characterization or separation of electrodes contributions was directly applied: the EIS spectra characterization was based on an exhaustive review of previous works [32]. As in the previous work, Sun et al. assigned the impedance rise in the Low-frequency region to particle cracking [65]. The two semiarches of the Mid-frequency region instead, were assigned respectively to SEI layer growth and decomposition and to charge transfer slow down at the cathode side. In [63] Wong et al. studied the impact of high rate discharge on aging of NCA cells. The characterization results showed an impedance rise in the Mid-frequency region: SEI layer growth and small structural damage of the cathode were attributed to the 1st semiarch and SEI layer decomposition and CEI formation on the cathode side were attributed to the 2nd semiarch. In [64] instead, Jungst et al. performed accelerated calendar aging tests. The experimental results showed a large variation in the Mid-frequency region semiarch after 20 weeks. This impedance rise has been attributed to CEI formation and charge transfer slow down exploiting three-electrodes measurements of a previous work [78]. Similarly, calendar aging tests have been carried out by Abraham et al. in [25]. The authors analysed the EIS spectra of half-cells and exploited XPS for material characterization. They observed that the EIS variations of the full cell could be almost entirely attributed to the positive electrode. The impedance rise in the Mid-frequency region is due to cathode’s particle cracking and to CEI formation, with consequent consumption of the electrolyte. So that, they stated that during cell degradation, the CEI formation process enable and speed up the electrolyte decomposition.
5. How EIS Spectra Are Modelled trough ECMs
The most common approach used to evaluate impedance spectra of Li-ion cells is to choose an ECM according to the shape of the impedance curve on the Nyquist plot and a subsequent Complex Nonlinear Least Square (CNLS) fitting [69]. The choice of the elements constituting the circuit depends on the complexity of the impedance curve. In general, the model includes a resistor for the Ohmic region and an inductance or a parallel circuit of inductance and resistor when the inductive tail is present. This scheme is shown in Figure 5. The Mid- and Low-frequency regions are represented with a general impedance because they can be modelled with several different elements. These elements are:
- RC element: parallel circuit of resistor and capacitor. In electro-chemistry, this element is usually applied for the description of interface loss processes, for instance a charge transfer process between electrode and electrolyte. The resistor represents the limited exchange rate and the capacitor describes the double layer capacity [69].
- Constant Phase Element (CPE): the CPE is an empirical element without a direct physical meaning; it is used to describe the dispersion effect and its behaviour deviates from the capacitance [79]. When its exponent is equal to 1 it behaves as capacitor and when its exponent is equal to 0 it corresponds to a resistor [69,80].
- Zarc element: parallel circuit of resistor and CPE. This element is used to increase the accuracy when fitting the impedance curve of Li-ion cell [81]. The CPE leads to fit semiarches that does not have constant radius.
- HN element: it is a generalized Zarc element. This element has been developed by Havriliak and Negami. They introduced empirical equations to describe relaxation processes in polymer. These HN-equations were applied to describe dielectric relaxation in Li-ion conducting polymer electrolytes [82].
- Warburg (W) element: it is used to describe the diffusion mechanism in the low frequency region. Several different models of Warburg element are available in literature, depending on the dimensions considered in the problem and on boundary conditions [83,84,85]. One dimensional elements are the mostly used in ECM of Li-ion cells [69]. - Transmission Line Model (TLM): it defines a complex ECM design to take the impact of the electrode structure on its loss mechanisms into account. In detail, a TLM is designed to describe a porous electrode structure comprising an electron and an ion conducting path and an interface between them [69].
Table 5 shows how these elements have been combined in literature to model the Mid- and Low-frequency regions of impedance curve. Each column includes an element or series of elements that are intended to be in series with the elements given in the other columns on the same circuit. The first and second columns include respectively the reference of the article and the cathode chemistry type, while the last column includes information about the presence of a voltage source in series to simulate the SoC of the cell.
The description of the work listed in Table 5 will be given by analysing the similarities of ECMs across the different cathode chemistry types. In most of the cases the circuit configuration is independent by the cathode chemistry type and it presents different layouts depending on how the elements are combined. Several publications use RC elements to characterize the Mid-frequency region of the impedance: in [8,26,34,35,36,37,39] for LCO cells; in [43] for LFP cells; in [54,55,56,61] for NMC cells; in [20,63] for NCA cells. As shown in Table 5, most of these cases present RC elements in series and an element to describe the Low-frequency region. However, in specific cases, the RC elements are modified with additional elements on the two different branches. This is the case in [35], where the authors use an RC with additional Warburg element on the resistive branch to describe the anode processes and a capacitance in parallel to two series of a resistor and a Warburg element to describe the cathode. This choice has been made with the presumption that the electrode is constituted of two different particle sizes. Looking at low level of model complexity, in [37] the authors used 4 RC elements in series: 3 for the 1st semiarch and the latter for the 2nd semiarch. They explained that the elements do not completely correspond to separated physical processes but all together they describe the double layer capacity, reaction resistance and possible SEI at anode and cathode. An analogous choice has been made by Ning et al. in [26] exploiting 3 RC elements to represent: (i) the SEI layer; (ii) charge transfer resistance and double layer capacitance and (iii) the electric conductivity of the bulk of electrode material. This model has been derived by studies of [86]. Looking at NMC cathode cells, a similar solution has been adopted by Heins et al. in [54,55]: 4 RC elements are used to model the Mid-frequency region. However, in this case the number of elements is defined by the number of peaks identified applying the DRT transformation to the impedance curve. In this way, each element is related to a physical process occurring at a specific time constant [87]. A different approach, with the same objective of modelling the physical processes, is presented in [36] for LCO cells. For an accurate modelling of the EIS paired with an easily handling model, Tro¨ltzsch et al. combined an RC element with a composite electrode model to represent the cell behaviour in Mid- and Low-frequency regions. This model gives a clear idea of the processes occurring at the cathode. With 8 parameters, the authors claimed a simple estimation process able to represent the porous structure of the electrode, the electrolyte and their interactions. A simpler solution is given in [34] for LCO cells: the 1st semiarch is modelled with a RC element and the 2nd semiarch with a modified RC that includes a CPE to describe the diffusive behaviour of the cell and also fit the low frequency tail of the impedance curve. In [39] instead, the authors exploited a simple RC element to model the 2nd semiarch, representing the cathode, and a more sophisticated element to model the anode and its passivation layer: a capacitance in parallel to a series connection of an RC element and a resistor. The resistor and the capacitance are used to describe the SEI layer and the RC element for the anode.
To increase the robustness of the model and to reinforce the connection with the physical processes occurring inside the cell, it is possible to exploit the results of invasive characterization to build the ECMs. So that the model is not anymore only based on fitting of EIS spectra and experience gained by previous works dealing with the same topic. Half-cells, three-electrodes configuration and material characterization can be used to validate the results of EIS and to distinguish the contribution of anode and cathode in the Nyquist plot. This is the case in [10] where half-cells have been exploited to make cathode- and anode-ECMs. Both the two models include a Zarc element for semiarch 1, respectively to describe SEI layer for anode-cell and the CEI layer for the cathode-cell. Then, they show two different structures: the anode ECM includes a Zarc element to describe charge transfer and double layer and a CPE for the diffusion processes of Low-frequency region; the cathode ECM instead includes a modified RC element with a Warburg element in the capacitive branch. This choice allowed to a better description of the cathode EIS spectrum. A similar solution, exploiting half cells, has been applied by Li et al. in [12] for NMC cells. The anode -cell model includes two Zarc elements (as in [10]) and a Warburg element to describe the diffusive tail; the cathode-cell model presents an identical configuration to [10], using CPE elements instead of Warburg to describe the diffusive behaviour. In [8] Zhou et al. stated that the positive electrode contributes almost solely to the increase of the total battery impedance in LCO cells. So that, they introduced an ECM to evaluate the impedance variation only of the cathode half-cell. This circuit is a modified Randles model: an RC element is used to model surface layer process; a second RC element is used to model charge transfer and double layer effects and a Warburg element in parallel to a capacitance is used to model the low frequency tail. A similar result is presented by Zhang et al. in [20], where the tests have been done on NCA cells in a three-electrodes configuration. The EIS spectra evolution of the negative electrode did not show a rising trend during aging. The authors built the ECM for the positive electrode including a RC element to describe the 1st semiarch of Mid-frequency region and a modified RC element with a Warburg element on the resistive branch to describe the 2nd semiarch of Mid-frequency region and the diffusive tail. The impedance rise is tracked with the two resistors that represent respec-tively the CET layer and the charge transfer resistance. Finally, Stiaszny et al. exploited half cells to study NMC cells in [11]. Tn their models they only considered the Mid-frequency region. As regards the 1st semiarch, the two models are identical, exploiting a Zarc element to describe the particle-current collector resistance. As regards the 2nd semiarch, the two models are different: for the anode ECM two Zarc elements are used to describe SET layer and charge transfer; for the cathode ECM the charge transfer process is described by a TLM. As already mentioned, the TLM is used to account the impact of the electrode structure on the cell degradation [69].
Tn the other works under review, material characterization has been used to build a unique ECM for the full cell. Tn [47] Leng et al. exploited a three-electrodes configuration and modelled the Mid-frequency region with two Zarc elements. The first element describes the migration of ions through the surface film on the positive electrode and the electronic transport in the positive electrode; the second element represents the charge transfer phenomena at positive and negative electrodes. Tn [21] Maheshwary et al. applied ETS and characterize the electrodes with SEM and EDS. They developed an ECM with two Zarc elements for the Mid-frequency region (one per each semiarch) and a CPE for the Low-frequency region. The three elements represent respectively the SET layer related processes, the cathode related processes and the solid state mass diffusion effects. Tn [57], Stiaszny et al. created a model based on the DRT analysis of the impedance spectra. The DRT showed three main peaks corresponding to three different processes: SET layer, modelled with Zarc element; anode charge transfer, modelled with a Zarc element and cathode charge transfer modelled with a TLM. A solution similar to TLM is applied by Xiong et al. in [56]: the authors identified the ECM considering the inner structure and general behaviour of Li-ion cells. The model consists in two Zarc elements to describe the Mid-frequency region (the first one corresponding to the SET layer of the anode and the second one accounting for the charge transfer processes) in series with a Warburg element to model the diffusion processes. However, to achieve the objective of online identification, Xiong et al. decided to simplify their model by substituting the Zarc elements with RC elements and by neglecting the Low-frequency region. Furthermore, an ideal voltage source has been added to describe open circuit voltage. This simplified model is the so called “dual polarization model” [88].
Looking at Table 5, there are modelling solutions that have not been clustered in any of the groups already discussed. These models can be classified in three categories. The first one, where the ECM is made only of two Zarc elements, as in [15,44,51,60]. Tn the first two cases, one element is assigned to the Mid-frequency region and the other one to the Low-frequency region for LCO [15] and for LFP cells [44]. Tn [51] instead, Yang et al. applied the same model to NMC cells, exploiting one element to describe the 1st semiarch and the other one for the 2nd semiarch and the Low-frequency region. Also in [60] Ecker et al. exploited the same structure for NMC cells ECM but describing only the two semiarches of the Mid-frequency region. The second category includes the solutions where Zarc elements are modified or coupled with other elements to model and describe the diffusive tail. Galeotti et al. in [66] and Eddahech et al. in [70] applied the same ECM, with two Zarc elements describing the Mid-frequency region and a CPE describing the Low-frequency region. The same choice was taken by Lyu et al. in [46], exploiting a Warburg element instead of a CPE to describe the Low-frequency region. A similar configuration with only two elements was adopted by Schmitt et al. in [58], with a Zarc element to describe the 1st semiarch (capacitive effects and polarization resistance) and a CPE to describe the 2nd semiarch of Mid-frequency region (solid state mass diffusion). Tn [32] Ferna`ndez et al. tested NCA cells and adopted a so¬lution with a Zarc element to model the 1st semiarch and a modified Zarc element with a Warburg element on the resistive branch to model the remaining part of the ETS spectrum and to describe cathode related processes and diffusion processes. The same configuration was also adopted for NCA cells by Sun et al. in [65]. For NMC cells instead, Aurora et al. modified the configuration used by the two previous works placing an additional modified Zarc element [52]. An additional level of complexity, with respect to the previous work, has been presented by Mukoyama et al. in [38] for LCO cells. To model the 2nd semiarch and the Low-frequency region the authors exploited a modified Zarc ele¬ments (with Warburg element on the resistive branch) and an element made of a CPE in parallel to two series connections of a resistor with a Warburg element. This modelling choice has been taken to represent respectively the anode and the cathode with two different particle size components [38]. The third category includes two articles of the same research group where the same ECM has been adopted for NMC [59] and NCA cells [62]. The authors exploited HN elements to model the Mid-frequency region; they adopted an ECM that was developed by Witzenhausen in [89]. As mentioned before, HN elements are generalized Zarc elements; in the ETS fitting process they could represent better than Zarc elements the depressed semiarches [82].
Several different model options have been found in literature, but no predominant model architecture per each different cathode chemistry type. Tn some case, as for LFP cells, the few publications cannot motivate any conclusion. Tn other cases, such as LCO, NCA and NMC cells, the larger number of publications clearly allow for a comparison. Figure 6 shows the main ECMs emerged from the reviewed works listed in Table 6. LCO cells are commonly modelled by exploiting RC elements for the Mid-frequency region and Warburg element for the Low-frequency region. Two main ECM options are found for this chemistry: (a) the Warburg element is placed in series with respect to the other circuital elements, (b) the Warburg element is placed on the resistive branch of the 2nd RC element. NMC and NCA cells are usually modelled similarly (i.e. they have similar performances). The model, showed in Figure 6c, includes two Zarc elements to describe the two semiarches of the Mid-frequency region and an in-series connected Warburg element to describe the diffusive tail. Tn all chemistry types, a resistor is used to account for the Ohmic resistance changes. Further analyses and the critical assessment of the reviewed works will be given in Section 6.
6. Critical Assessment
After having detailed the impact of cell application on EIS spectra in Section 3, the connections among EIS spectra and degradation mechanisms in Section 4 and the multiple options to build ECM from EIS in Section 5, a critical assessment of the reviewed papers (Table 1) is proposed in this section aiming at investigating the link between degradation mechanisms and the most correct option to model them.
Figure 7A analyses the findings of Section 3 by showing the impact of different types of aging tests on the EIS. The analysis has been done by clustering the publications with similar testing conditions (e.g. calendar aging tests with SoC lower than 20%) and counting the cases in which a specific EIS region was impacted; the results are normalized on the total number of publications per each different set of parameters.
Calendar aging tests: Figure 7A–a shows how the EIS spectrum is similarly impacted both in the Ohmic and in the Mid-frequency regions; almost the totality of the tests have been performed at temperature higher than 30 ◦C. The different SoC levels at which the cells have been stored did not show different behaviours across the EIS regions; however an impedance rise in the Low-frequency region was only detected with SoC ≥80% [10,25]. Among the different cathode chemistries, the experimental results of LCO and NCA cells showed an impedance rise concentrated in the Mid- and Low-frequency regions while the tests on NMC, LFP and LMO cells showed EIS variations in the Ohmic and Mid-frequency regions.
Cycling aging tests: Figure 7A and b shows how the different tests conditions impact on the EIS regions, accounting all the experiments at 100% DoD. Here the impedance rise is stronger than in calendar aging tests. Specifically:
- For medium temperature (10 ◦C < T < 25 ◦C) and high current rate (equal or larger than 1C) experiments, the EIS curve is mainly impacted in the Mid-frequency region, specifically in the 2nd semiarch.
- For medium temperature and low current rate (lower than 1C) experiments, the behaviour is similar, impacting mainly Mid-frequency region. However, the EIS variations are smoother than in the previous case and are concentrated in the area of 1st semiarch.
- For low temperature (T < 10 ◦C) and high current rate experiments, the rise of ohmic resistance is stronger and the impact on EIS is equivalent both in the Ohmic and Mid-frequency regions (mainly in the 1st semiarch).
- For high temperature (T > 25 ◦C) and high current rate experiments, the impact is relevant in the ohmic region but mostly concentrated in the Mid-frequency region.
In a small number of the reviewed publications a reduced DoD is applied. The impact is generally observable in the Ohmic region and in the 1st semiarch of Mid-frequency region. In contrast to the reviewed articles on calendar aging tests, it is not possible to clearly describe different behaviours depending on the cathode chemistry type for the works related to cycling aging tests. The impedance rise is mostly impacted by the experimental parameters described above.
Figure 7B analyses the findings of Section 4 by showing how the different degradation mechanisms have been assigned to the different EIS regions for all the cathode chemistries under review. The chart
The resistance rise in the Ohmic region is mainly attributed to electrolyte decomposition, as shown in 49% of the cases and to SEI layer growth (29% of the cases). Among the other mechanisms assigned to this region, corrosion of current collector is the only one that is univocally attributed to ohmic resistance rise. However, it has been reported only in three of the articles under review: by Schindler et al. in [40] for LFP cells, by Ecker et al. in [60] for NMC cells and by Pastor-Ferna`ndez et al. in [32] for NCA cells.
The Mid-frequency region has been attributed mainly to two different classes of degradation:
- Loss of lithium inventory processes. SEI layer growth and decom-position are mentioned in 40% of the studies, while electrolyte decomposition and lithium plating are mentioned in 14% of the cases.
- Loss of cathode active material. The degradation is attributed to structural disordering/particle cracking in 14% of the studies and CEI formation in 28% of the studies. Minor influence is given to loss of anode active material mentioned in less than 5% of the cases.
When two separated semiarches are highlighted in the study, a clearer separation of processes occurs and these processes are often assigned to the two different electrodes (Figure 7B – details about Mid-frequency region). The 1st semiarch is attributed to SEI layer growth and decomposition in 49% of the cases, to lithium plating and electrolyte decomposition in 24% of the cases and to loss of anode active material in 5% of the cases. This leads to a value of 78% of the cases where semiarch 1 is related to the anode, its passivation layer and loss of lithium ions. The remaining 22% of cases is referred to the cathode side. However, the cathode is the main actor of the 2nd semiarch, representing 61% of the cases with respectively 18% of the cases addressing particle cracking and 42% of the cases addressing CEI formation.
The Low-frequency region is considered only by 7 reviewed works: in 4 cases the impedance rise is attributed to structural disordering of the cathode and to CEI formation while in the other 3 cases is attributed more in general to loss of lithium inventory processes. The predominant attribution to cathode-related processes can be justified knowing that in this region it is possible to track the intercalation process. This process describes the accumulation and depletion of lithium ions within the cathode. So that, the capacity fade related processes observed in this region could be directly pointed to the cathode degradation. In fact, in some studies the authors coupled the variations of the Low-frequency region to the ones occurring in correspondence of the second semiarch of the Mid-frequency region (i.e. to the degradation of the positive electrode) [10,12,20,32,36,38,51,52]. Other works instead, truncated the EIS measurement at 0.1 Hz [11,37,47,56,57,58,60,61].
If one would like to separately analyse the main findings for the different chemistry, Figure 7B–b presents the distribution of degradation mechanisms for LCO, NMC and NCA cells in the Mid-frequency region (the remaining cathode chemistries have been neglected due to few available publications).
Tn LGO cells, the impedance rise is mainly addressed to the degradation of the cathode, with the formation of GET and structural degradation/cracking. Tn a smaller number of cases the impedance rise is attributed to the anode passivation layer growth.
Tn NMG cells, the distribution of degradation mechanisms is very similar to the general distribution showed in Figure 7B-a. Lithium plating, electrolyte decomposition, SET layer growth and decomposition account for 64% of the cases; the remaining share is attributed to loss of active material in the anode and in the cathode. The separation of contribution between the first and the second semiarch shows respectively prevalence of SET and anode related degradation in the first area and cathode related degradation in the second area.
NGA cells show similar results with respect to NMG cells. However, it is peculiar the observation of SET layer decomposition, not present in the other cases.
Finally, Figure 7C analyses the findings of Section 5 by showing how different circuital elements have been assigned to the different ETS characteristic regions to build EGMs. These elements have been analysed in the Mid- and Low-frequency regions; the Ohmic region is always modelled with a resistor.
The resistive-capacitive behaviour observable in the Mid-frequency region of the impedance curve have been mainly described with 2 elements:
- RG element: it is the simplest element that can be used in this region, describing a perfect semicircle; it has been chosen in 31% of the cases under review.
- Zarc element: it has the advantage to reproduce the depression of the semicircles and it has been chosen in 51% of the cases. Tts disadvantage is the absence of Laplace transformation that make its use in time domain models problematic [90].
These two elements are used without big distinctions in both the two semiarches. Tt is remarkable the exploitation of other elements to describe the 2nd semiarch region, mostly assigned to cathode-related processes. Specifically:
- HN element has been used in 6% of the cases, allowing to a similar description of depressed semicircle as the Zarc element.
- GPE has been used in 6% of the cases to specifically describe the diffusion processes that are usually attributed to Low-frequency region.
The diffusion processes observable in the Low-frequency region have been mainly described with two elements. However, these elements present different placement in the EGM. Specifically:
- Warburg element is applied in 59% of the cases. As described in Section 5, this is a more complex solution to describe the diffusive processes, with different structure depending on the boundary condition chosen for the specific problem [83]. This element has been placed on the resistive branch of RG and Zarc, such as in [10,20,32]. More complex configurations have been exploited in [35,38,52].
A smaller number of publications exploited the Zarc element to describe the diffusive processes (7% of the cases). A specific mention is needed to the small number of works (another 7% of the cases) that exploited a capacitor in this region: this element is used to describe the intercalation process, that, has already mentioned, represents the accumulation and depletion of lithium ions within the cathode. So that, in passive electrical model the charge stored in this capacitor is assumed to be the charge stored in the battery [91,92].
Tf one would like to separately analyse the main findings for the different chemistry, Figure 7C–b presents the distribution of circuital elements used to describe the Mid-frequency region for LGO, NMG and NGA cells (as before, the remaining cathode chemistries have been neglected due to few available publications).
Tn LGO cells the most used element is RG (57% of the cases); it is used singularly to describe a semiarch or in a series chain up to 3 elements. Tncreasing the number of RG elements in series is a way of improving the quality of the approximation [50].
Tn NMG cells the most used element is Zarc (60% of the cases). Tt is dominant in the first semiarch area and less used in the second semiarch, where other solutions have been applied. A specific mention is needed for GPE, used in 10% of the reviewed articles. This element is not used to model the electrodes but for the diffusion processes occurring at low frequency. This is the case in [58], where the Low-frequency region is not measured and the ETS is truncated at 0.1 Hz.
NGA cells shows a prevalence of the elements able to describe depressed semicircles: Zarc element and HN element exploited respectively in 50% and 17% of the cases. Tn the remaining cases, RG elements have been chosen.
By cross-referencing the information collected in Figure 7B and in Figure 7G, one can now infer which is the most occurring degradation mode in each specific region of the ETS spectrum and which is the most used circuital element to model it. The results are showed in Table 6. Specifically:
- Ohmic region: degradation is caused by loss of lithium inventory (78% of the reviewed cases); the most occurring degradation mechanism is electrolyte decomposition. The effect is an increase of ohmic resistance and it is modelled in all the reviewed publications by a simple resistor.
- Mid-frequency region: the impedance rise is mainly caused by loss of lithium inventory and loss of cathode active material, respectively in 54% and 42% of the cases. Looking at the two separated semiarches, the first one is related to loss of lithium ions (mainly SET growth and SET layer decomposition mechanisms) and loss of anode active material degradation modes in 78% of the cases. The second semiarch is related to loss of cathode active material in 61% of the cases, mainly due to GET formation and electrode particle cracking. The most effective way to model the resistive-capacitive behaviour and the shape variations of the semiarches is using the Zarc element. Tt is applied in 51% of the reviewed articles and more specifically in 59% of the cases to describe the first semiarch and in 50% of the cases to describe the second semiarch. However, simple RG elements are more suitable when dealing with time domain models, thanks to their Laplace transformation.
- Low-frequency region: the impedance rise is caused by loss of cathode active material in 57% of the cases, mainly addressed to structural changes of the electrode and charge transfer slow down. The attribution of this region to the cathode is strengthened by the presence of the intercalation process. The most effective way to model the diffusive tail is to use the Warburg element, exploited in the 59% of the reviewed publications.
Finally, Figure 8 summarises the main findings of this critical assessment. The typical ETS spectrum of a Li-ion cell is represented at the top, specifying the different frequency regions. For each of these regions, the most occurring degradation mechanisms (described in the previous paragraphs) are shown at the middle of the figure, grouped in the corresponding degradation modes. At the bottom of the figure, the most used ECM option is presented; the model includes a resistor for the Ohmic region, two Zarc elements for the Mid-frequency region (one element per each semiarch) and a Warburg element for the Low-frequency region.
7. Conclusions
This paper work presented a comprehensive review on the use of Electrochemical Impedance Spectroscopy (EIS) to characterize Li-ion battery degradation phenomena and to model them through Electric Circuit Models (ECMs). The review process allowed to highlight three main aspects: (i) the existence of links between the cell application (i.e. experimental parameters) and their impacts on the EIS spectra, presented in Section 3; (ii) the existence of links between the EIS spectra variations and the underlying degradation mechanisms, presented in Section 4 and (iii) the existence of many options to build ECMs from EIS spectra, presented in Section 5. Finally, the critical assessment given in Section 6 allowed to formulate links between the degradation mechanisms and the most reliable options to model them.
As regards of point (i) – cell application, the EIS spectra showed clear impedance shifts in different frequency regions depending on the magnitude of the chosen parameters (T, DoD, C-rate, etc.). The EIS variations were more pronounced for cycling aged cells than calendar aged cells. The use of heavy calendar or cycling aging conditions (e.g. high temperature, high current rate) led to accelerated degradation which can be easily sensed via EIS.
As regards of point (ii) – cell characterization, the observed EIS variations have been attributed to specific degradation mechanisms for each characteristic frequency region. Specifically, electrolyte decomposition was associated to Ohmic region shift; anode degradation and SEI layer growth to shifts in the first semiarch of Mid-frequency region; CEI layer formation and cathode particle cracking to shifts in the second semiarch of Mid-frequency region and cathode structural disordering to shifts in the Low-frequency region. Minor differences have been found among the different cathode chemistries. Many studies used invasive techniques to properly attribute degradation mechanisms and validate EIS interpretation. Alternatively, an effective solution to improve the EIS interpretation is the application of DRT transformation. DRT allowed to understand how the behaviour of the cell evolves by tracking the time constants of the different processes.
As regards of point (iii) – cell modelling, many ECM options have been reviewed which were not strictly related to the cathode chemistry type. Specifically, in-series resistor is usually used for the Ohmic region; one or two Zarc elements for the Mid-frequency region and Warburg element for the Low-frequency region. Most of the works used ECMs to fit the EIS measurements and to track the evolution of the degradation phenomena through the associated model’s parameters. Few cases showed that the same modelling approaches can be implemented into BMS to improve the estimation of main battery indicators (i.e. SoC, SoH, etc.) or to enhance battery lifetime prediction.
In short, the results of this work motivate the exploitation of EIS as a fast, non-invasive, and reliable characterization tool which help in building cell’s models able to track the main degradation phenomena. However, further studies and analyses are needed to reinforce the strength and reliability of this characterization method: an important role is played by the validation process via half-cell tests, three-electrodes tests and material characterization.
References
- European Commission, Communication from the Commission to the European parliament, the European council, the council, the European economic and social committee and the committee of the regions: the European Green Deal, Accessed: Oct. 15, 2020. [Online]. Available. https://ec.europa.eu/info/sites/info/files/eur opean-green-deal-communication_en.pdf, Dec. 11, 2019.
- Kabir, M.M.; Demirocak, D.E. Degradation mechanisms in Li-ion batteries: a state-of-the-art review: degradation mechanisms in Li-ion batteries: a state-of-the-art review, Int. J. Energy Res. 41 (14) (Nov. 2017) 1963–1986. [CrossRef]
- Tian, H.; Qin, P.; Li, K.; Zhao, Z. A review of the state of health for lithium-ion batteries: research status and suggestions, J. Clean. Prod. 261 (Jul. 2020) 120813. https://doi.org/10.1016/j.jclepro.2020.120813. [0] Y. Hu, S. Yurkovich, Y. Guezennec, B.J. Yurkovich, Electro-thermal battery model identification for automotive applications, J. Power Sources 196 (Jan. 2011), https://doi.org/10.1016/J.JPOWSOUR.2010.06.037. [1] M. Berecibar, I. Gandiaga, I. Villarreal, N. Omar, J. Van Mierlo, P. Van den Bossche, Critical review of state of health estimation methods of Li-ion batteries for real applications, Renew. Sustain. Energy Rev. 56 (Apr. 2016) 572–587, https://doi. org/10.1016/j.rser.2015.11.042. [2] P. Weicker, A Systems Approach to Lithium-Ion Battery Management, Artech House, 2013. [3] L. Ungurean, G. Caˆrstoiu, M.V. Micea, V. Groza, Battery state of health estimation: a structured review of models, methods and commercial devices: battery State of Health Estimation: a Structured Review, Int. J. Energy Res. 41 (2) (Feb. 2017) 151–181, https://doi.org/10.1002/er.3598.
- Zhou, J.; Notten, P.H.L. Studies on the degradation of Li-ion batteries by the use of microreference electrodes, J. Power Sources 177 (2) (Mar. 2008) 553–560. [CrossRef]
- Li, Y.; Bettge, M.; Polzin, B.; Zhu, Y.; Balasubramanian, M.; Abraham, D.P. ‘Understanding long-term cycling performance of Li1.2Ni0.15Mn0.55Co0.1O2–graphite lithium-ion cells’, J. Electrochem. Soc. 160 (5) (Feb. 2013) A3006. [CrossRef]
- Li, J.; Zhang, J.; Zhang, X.; Yang, C.; Xu, N.; Xia, B. Study of the storage performance of a Li-ion cell at elevated temperature, Electrochim. Acta 55 (3) (Jan. 2010) 927–934. [CrossRef]
- Stiaszny, B.; Ziegler, J.C.; Krauß, E.E.; Schmidt, J.P.; Ivers-Tiffe, E. ‘Electrochemical characterization and post-mortem analysis of aged LiMn2O4–Li(Ni0.5Mn0.3Co0.2) O2/graphite lithium ion batteries. Part I: cycle aging’, J. Power Sources 251 (Apr. 2014) 439–450. [CrossRef]
- Li, X.; et al. Degradation mechanisms of high capacity 18650 cells containing Si-graphite anode and nickel-rich NMC cathode, Electrochim. Acta 297 (Feb. 2019) 1109–1120. [CrossRef]
- Wu, M.-S.; Chiang, P.-C.J.; Lin, J.-C. Electrochemical investigations on advanced lithium-ion batteries by three-electrode measurements, J. Electrochem. Soc. 152 (1) (Nov. 2004) A47. [CrossRef]
- Buchberger, I.; et al. Aging analysis of graphite/LiNi1/3Mn1/3Co1/3O2 cells using XRD, PGAA, and AC impedance, J. Electrochem. Soc. 162 (14) (Oct. 2015) A2737. [CrossRef]
- Li, J.; Murphy, E.; Winnick, J.; Kohl, P.A. ‘Studies on the cycle life of commercial lithium ion batteries during rapid charge–discharge cycling’, J. Power Sources 102 (1) (Dec. 2001) 294–301. [CrossRef]
- Sarasketa-Zabala, E.; Aguesse, F.; Villarreal, I.; Rodriguez-Martinez, L.M.; Lo, C.M.; Kubiak, P. Understanding lithium inventory loss and sudden performance fade in cylindrical cells during cycling with deep-discharge steps, J. Phys. Chem. C 119 (2) (Jan. 2015) 896–906. [CrossRef]
- Wong, D.N.; Wetz, D.A.; Mansour, A.M.; Heinzel, J.M. The influence of high C rate pulsed discharge on lithium-ion battery cell degradation, in: 2015 IEEE Pulsed Power Conference (PPC), May 2015, pp. 1–6. [CrossRef]
- Kassem, M.; Delacourt, C. Postmortem analysis of calendar-aged graphite/LiFePO4 cells, J. Power Sources 235 (Aug. 2013) 159–171. [CrossRef]
- Jalkanen, K.; Karppinen, J.; Skogstro, L.; Laurila, T.; Nisula, M.; Vuorilehto, K. Cycle aging of commercial NMC/graphite pouch cells at different temperatures, Appl. Energy 154 (Sep. 2015) 160–172. [CrossRef]
- Zhang, Y.; Wang, C.-Y. Cycle-life characterization of automotive lithium-ion batteries with LiNiO2 cathode, J. Electrochem. Soc. 156 (7) (May 2009) A527. [CrossRef]
- Maheshwari, A.; Heck, M.; Santarelli, M. Cycle aging studies of lithium nickel manganese cobalt oxide-based batteries using electrochemical impedance spectroscopy, Electrochim. Acta 273 (May 2018) 335–348. [CrossRef]
- Yoshida, T.; et al. Degradation mechanism and life prediction of lithium-ion batteries, J. Electrochem. Soc. 153 (3) (Feb. 2006) A576. [CrossRef]
- Joshi, T.; Eom, K.; Yushin, G.; Fuller, T.F. Effects of dissolved transition metals on the electrochemical performance and SEI growth in lithium-ion batteries, J. Electrochem. Soc. 161 (12) (Sep. 2014) A1915. [CrossRef]
- Zhang, X. A novel quantitative electrochemical aging model considering side reactions for lithium-ion batteries, Electrochim. Acta 343 (May 2020) 136070. [CrossRef]
- Abraham, D.P.; Reynolds, E.M.; Sammann, E.; Jansen, A.N.; Dees, D.W. Aging characteristics of high-power lithium-ion cells with LiNi0.8Co0.15Al0.05O2 and Li4/3Ti5/3O4 electrodes, Electrochim. Acta 51 (3) (Oct. 2005) 502–510. https:// doi.org/10.1016/j.electacta.2005.05.008.
- Ning, G.; Haran, B.; Popov, B.N. Capacity fade study of lithium-ion batteries cycled at high discharge rates, J. Power Sources 117 (1) (May 2003) 160–169. [CrossRef]
- Zhang, D.; Haran, B.S.; Durairajan, A.; White, R.E.; Podrazhansky, Y.; Popov, B.N. Studies on capacity fade of lithium-ion batteries, J. Power Sources 91 (2) (Dec. 2000) 122–129. [CrossRef]
- Pastor-Ferna, C.; Yu, T.F.; Widanage, W.D.; Marco, J. Critical review of non-invasive diagnosis techniques for quantification of degradation modes in lithium-ion batteries, Renew. Sustain. Energy Rev. 109 (Jul. 2019) 138–159. [CrossRef]
- Waag, W.; Fleischer, C.; Sauer, D. Critical review of the methods for monitoring of lithium-ion batteries in electric and hybrid vehicles, J. Power Sources 258 (Jul. 2014) 321–339. [CrossRef]
- Lasia, A. Electrochemical Impedance Spectroscopy and its Applications, Springer, New York, NY, 2014. New York.
- Vetter, J.; et al. Ageing mechanisms in lithium-ion batteries, J. Power Sources 147 (1–2) (Sep. 2005) 269–281. [CrossRef]
- Pastor-Ferna, C.; Uddin, K.; Chouchelamane, G.H.; Widanage, W.D.; Marco, J. A comparison between electrochemical impedance spectroscopy and incremental capacity-differential voltage as Li-ion diagnostic techniques to identify and quantify the effects of degradation modes within battery management systems, J. Power Sources 360 (Aug. 2017) 301–318. [CrossRef]
- Choi, W.; Shin, H.-C.; Kim, J.M.; Choi, J.-Y.; Yoon, W.-S. Modeling and applications of electrochemical impedance spectroscopy (EIS) for lithium-ion batteries, J. Electrochem. Sci. Technol. 11 (1) (Feb. 2020) 1–13. [CrossRef]
- de Vries, H.; Nguyen, T.T.; Veld, B.O.H. Increasing the cycle life of lithium ion cells by partial state of charge cycling, Microelectron. Reliab. 55 (11) (Nov. 2015) 2247–2253. [CrossRef]
- Osaka, T.; Nakade, S.; Rajama, M.; Momma, T. Influence of capacity fading on commercial lithium-ion battery impedance, J. Power Sources 119 (121) (Jun. 2003) 929–933. [CrossRef]
- Tro, U.; Kanoun, O.; Tra, H.-R. Characterizing aging effects of lithium ion batteries by impedance spectroscopy, Electrochim. Acta 51 (8) (2005) 1664–1672. [CrossRef]
- Kato, K.; Negishi, A.; Nozaki, K.; Tsuda, I.; Takano, K. PSOC cycle testing method for lithium-ion secondary batteries, J. Power Sources 117 (1) (May 2003) 118–123. [CrossRef]
- Mukoyama, D.; Momma, T.; Nara, H.; Osaka, T. ‘Electrochemical impedance analysis on degradation of commercially available lithium ion battery during charge–discharge cycling’, Chem. Lett. 41 (4) (Apr. 2012) 444–446. [CrossRef]
- Lyu, C.; Zhang, T.; Luo, W.; Wei, G.; Ma, B.; Wang, L. SOH estimation of lithium-ion batteries based on fast time domain impedance spectroscopy, in: 2019 14th IEEE Conference on Industrial Electronics and Applications (ICIEA), Jun. 2019, pp. 2142–2147. [CrossRef]
- Schindler, S.; Danzer, M.A. A novel mechanistic modeling framework for analysis of electrode balancing and degradation modes in commercial lithium-ion cells, J. Power Sources 343 (Mar. 2017) 226–236. [CrossRef]
- Petzl, M.; Kasper, M.; Danzer, M.A. ‘Lithium plating in a commercial lithium-ion battery – a low-temperature aging study’, J. Power Sources 275 (Feb. 2015) 799–807. [CrossRef]
- Zhang, Y.; Wang, C.-Y.; Tang, X. Cycling degradation of an automotive LiFePO4 lithium-ion battery, J. Power Sources 196 (3) (Feb. 2011) 1513–1520. [CrossRef]
- Monem, M.A.; et al. Lithium-ion batteries: evaluation study of different charging methodologies based on aging process, Appl. Energy 152 (Aug. 2015) 143–155. [CrossRef]
- Stroe, D.-I.; Swierczynski, M.; Stroe, A.-I.; Kaer, S.K.; Teodorescu, R. Lithium-ion battery power degradation modelling by electrochemical impedance spectroscopy, IET Renew. Power Gener. 11 (9) (Jul. 2017) 1136–1141. [CrossRef]
- Zavalis, T.G.; Klett, M.; Kjell, M.H.; Behm, M.; Lindstro, R.W.; Lindbergh, G. Aging in lithium-ion batteries: model and experimental investigation of harvested LiFePO4 and mesocarbon microbead graphite electrodes, Electrochim. Acta 110 (Nov. 2013) 335–348. [CrossRef]
- Wang, X.; Wei, X.; Dai, H. Estimation of state of health of lithium-ion batteries based on charge transfer resistance considering different temperature and state of charge, J. Energy Storage 21 (Feb. 2019) 618–631. [CrossRef]
- Leng, Y.; et al. Electrochemical cycle-life characterization of high energy lithium-ion cells with thick Li(Ni0.6Mn0.2Co0.2)O2 and graphite electrodes, J. Electrochem. Soc. 164 (6) (Mar. 2017) A1037. [CrossRef]
- Schuster, S.F. Nonlinear aging characteristics of lithium-ion cells under different operational conditions, J. Energy Storage 1 (Jun. 2015) 44–53. [CrossRef]
- Zhou, X.; Huang, J.; Pan, Z.; Ouyang, M. Impedance characterization of lithium-ion batteries aging under high-temperature cycling: importance of electrolyte-phase diffusion, J. Power Sources 426 (Jun. 2019) 216–222. [CrossRef]
- Westerhoff, U.; Kurbach, K.; Lienesch, F.; Kurrat, M. Analysis of lithium-ion battery models based on electrochemical impedance spectroscopy, Energy Technol. 4 (12) (Dec. 2016) 1620–1630. [CrossRef]
- Yang, Q.; Xu, J.; Li, X.; Xu, D.; Cao, B. State-of-health estimation of lithium-ion battery based on fractional impedance model and interval capacity, Int. J. Electr. Power Energy Syst. 119 (Jul. 2020) 105883. [CrossRef]
- Aurora, P.; Ramaswamy, N.; Han, T.; Adjemian, K. Electrochemical impedance spectroscopic analysis of lithium-ion battery aging mechanisms, ECS Meet. Abstr. (2013). [CrossRef]
- Klett, M.; et al. Electrode behavior RE-visited: monitoring potential windows, capacity loss, and impedance changes in Li1.03(Ni0.5Co0.2Mn0.3)0.97O2/silicon- graphite full cells, J. Electrochem. Soc. 163 (6) (Mar. 2016) A875. [CrossRef]
- Heins, T.P.; Schlüter, N.; Ernst, S.T.; Schro, U. On the interpretation of impedance spectra of large-format lithium-ion batteries and its application in aging studies, Energy Technol. 8 (2) (2020) 1900279. [CrossRef]
- Heins, T.P.; Leithoff, R.; Schlüter, N.; Schro, U.; Dro, K. Impedance spectroscopic investigation of the impact of erroneous cell assembly on the aging of lithium-ion batteries, Energy Technol. 8 (2) (2020) 1900288. [CrossRef]
- Xiong, R.; Tian, J.; Mu, H.; Wang, C. A systematic model-based degradation behavior recognition and health monitoring method for lithium-ion batteries, Appl. Energy 207 (Dec. 2017) 372–383. [CrossRef]
- Stiaszny, B.; Ziegler, J.C.; Krauß, E.E.; Zhang, M.; Schmidt, J.P.; Ivers-Tiffe, E. ‘Electrochemical characterization and post-mortem analysis of aged LiMn2O4–NMC/graphite lithium ion batteries part II: calendar aging’, J. Power Sources 258 (Jul. 2014) 61–75. [CrossRef]
- Schmitt, J.; Maheshwari, A.; Heck, M.; Lux, S.; Vetter, M. Impedance change and capacity fade of lithium nickel manganese cobalt oxide-based batteries during calendar aging, J. Power Sources 353 (Jun. 2017) 183–194. [CrossRef]
- Sabet, P.S.; Warnecke, A.J.; Meier, F.; Witzenhausen, H.; Martinez-Laserna, E.; Sauer, D.U. ‘Non-invasive yet separate investigation of anode/cathode degradation of lithium-ion batteries (nickel–cobalt–manganese vs. graphite) due to accelerated aging’, J. Power Sources 449 (Feb. 2020) 227369. [CrossRef]
- Ecker, M.; et al. Development of a lifetime prediction model for lithium-ion batteries based on extended accelerated aging test data, J. Power Sources 215 (Oct. 2012) 248–257. [CrossRef]
- Waag, W.; Ka, S.; Sauer, D.U. Experimental investigation of the lithium-ion battery impedance characteristic at various conditions and aging states and its influence on the application, Appl. Energy 102 (Feb. 2013) 885–897. [CrossRef]
- Sabet, P.S.; Stahl, G.; Sauer, D.U. Non-invasive investigation of predominant processes in the impedance spectra of high energy lithium-ion batteries with Nickel-Cobalt-Aluminum cathodes, J. Power Sources 406 (Dec. 2018) 185–193. [CrossRef]
- Wong, D.; Shrestha, B.; Wetz, D.A.; Heinzel, J.M. Impact of high rate discharge on the aging of lithium nickel cobalt aluminum oxide batteries, J. Power Sources 280 (Apr. 2015) 363–372. [CrossRef]
- Jungst, R.G.; et al. Accelerated calendar and pulse life analysis of lithium-ion cells, J. Power Sources 119–121 (Jun. 2003) 870–873. [CrossRef]
- Sun, H. Quantitative analysis of degradation modes of lithium-ion battery under different operating conditions, Energies 14 (2) (Jan. 2021), 2. [CrossRef]
- Galeotti, M.; Cina, L.; Giammanco, C.; Cordiner, S.; Di Carlo, A. Performance analysis and SOH (state of health) evaluation of lithium polymer batteries through electrochemical impedance spectroscopy, Energy 89 (Sep. 2015) 678–686. [CrossRef]
- Popp, H.; Einhorn, M.; Conte, F.V. ‘Capacity Decrease vs. Impedance Increase of Lithium Batteries. A comparative study.’, p. 6.
- Li, M.; Lu, J.; Chen, Z.; Amine, K. 30 Years of lithium-ion batteries, Adv. Mater. 30 (33) (2018) 1800561. [CrossRef]
- Illig, J. ‘Physically Based Impedance Modelling of Lithium-Ion Cells’, p. 231.
- Eddahech, A.; Briat, O.; Henry, H.; Dele, J.-Y.; Woirgard, E.; Vinassa, J.-M. Ageing monitoring of lithium-ion cell during power cycling tests, Microelectron. Reliab. 51 (9) (Sep. 2011) 1968–1971. [CrossRef]
- Skoog, S.; David, S. Parameterization of linear equivalent circuit models over wide temperature and SOC spans for automotive lithium-ion cells using electrochemical impedance spectroscopy, J. Energy Storage 14 (Dec. 2017) 39–48. [CrossRef]
- Verma, P.; Maire, P.; Nova, P. A review of the features and analyses of the solid electrolyte interphase in Li-ion batteries, Electrochim. Acta 55 (22) (Sep. 2010) 6332–6341. [CrossRef]
- Agubra, V.; Fergus, J. Lithium ion battery anode aging mechanisms, Materials 6 (4) (Mar. 2013) 1310–1325. [CrossRef]
- Pop, V.; Bergveld, H.J.; Regtien, P.P.L.; Veld, J.H.G.O.H.; Danilov, D.; Notten, P.H.L. Battery aging and its influence on the electromotive force, J. Electrochem. Soc. 154 (8) (May 2007) A744. [CrossRef]
- Dubarry, M.; Truchot, C.; Liaw, B.Y. Synthesize battery degradation modes via a diagnostic and prognostic model, J. Power Sources 219 (Dec. 2012) 204–216. [CrossRef]
- Birkl, C.R.; Roberts, M.R.; McTurk, E.; Bruce, P.G.; Howey, D.A. Degradation diagnostics for lithium ion cells, J. Power Sources 341 (Feb. 2017) 373–386. [CrossRef]
- Ivers-Tiffee, E.; Weber, A. Evaluation of electrochemical impedance spectra by the distribution of relaxation times, J. Ceram. Soc. Jpn. 125 (4) (2017) 193–201. [CrossRef]
- Nagasubramanian, G. Two- and three-electrode impedance studies on 18650 Li-ion cells, J. Power Sources 87 (1) (Apr. 2000) 226–229. [CrossRef]
- Macdonald, J.R. Note on the parameterization of the constant-phase admittance element, Solid State Ion. 13 (2) (May 1984) 147–149. [CrossRef]
- Abouzari, M.R.S.; Berkemeier, F.; Schmitz, G.; Wilmer, D. On the physical interpretation of constant phase elements, Solid State Ion. 180 (14) (Jun. 2009) 922–927. [CrossRef]
- Macdonald, J.R. New aspects of some small-signal ac frequency response functions, Solid State Ion. 15 (2) (Mar. 1985) 159–161. [CrossRef]
- Karan, N.K.; Pradhan, D.K.; Thomas, R.; Natesan, B.; Katiyar, R.S. ‘Solid polymer electrolytes based on polyethylene oxide and lithium trifluoro- methane sulfonate (PEO–LiCF3SO3): ionic conductivity and dielectric relaxation’, Solid State Ion. 179 (19–20) (2008) 689–696. [CrossRef]
- Barsoukov, E.; Macdonald, J.R. Impedance Spectroscopy: Theory, Experiment, and Applications, second ed., Wiley, 2005.
- Jacobsen, T.; West, K. Diffusion impedance in planar, cylindrical and spherical symmetry, Electrochim. Acta 40 (2) (Feb. 1995) 255–262. [CrossRef]
- Bisquert, J. Theory of the impedance of electron diffusion and recombination in a thin layer, J. Phys. Chem. B 106 (2) (Jan. 2002) 325–333. [CrossRef]
- Nobili, F.; Tossici, R.; Marassi, R.; Croce, F.; Scrosati, B. An AC impedance spectroscopic study of LixCoO2 at different temperatures, J. Phys. Chem. B 106 (15) (Apr. 2002) 3909–3915. [CrossRef]
- Bartoszek, J.; Liu, Y.-X.; Karczewski, J.; Wang, S.-F.; Mrozinski, A.; Jasinski, P. Distribution of relaxation times as a method of separation and identification of complex processes measured by impedance spectroscopy, in: 2017 21st European Microelectronics and Packaging Conference (EMPC) & Exhibition, Warsaw, Sep. 2017, pp. 1–5. [CrossRef]
- He, H.; Xiong, R.; Fan, J. Evaluation of lithium-ion battery equivalent circuit models for state of charge estimation by an experimental approach, Energies 4 (4) (Mar. 2011) 582–598. [CrossRef]
- Witzenhausen, D.-W.H. ‘Elektrische Batteriespeichermodelle: Modellbildung, Parameteridentifikation und Modellreduktion’, p. 276.
- Andre, D.; Meiler, M.; Steiner, K.; Walz, H.; Soczka-Guth, T.; Sauer, D.U. Characterization of high-power lithium-ion batteries by electrochemical impedance spectroscopy. II: Modelling, J. Power Sources 196 (12) (Jun. 2011) 5349–5356. [CrossRef]
- Gomez, J.; Nelson, R.; Kalu, E.E.; Weatherspoon, M.H.; Zheng, J.P. Equivalent circuit model parameters of a high-power Li-ion battery: thermal and state of charge effects, J. Power Sources 196 (10) (May 2011) 4826–4831. [CrossRef]
- Gao, Y.; Jiang, J.; Zhang, C.; Zhang, W.; Ma, Z.; Jiang, Y. Lithium-ion battery aging mechanisms and life model under different charging stresses, J. Power Sources 356 (Jul. 2017) 103–114. [CrossRef]
Figure 1.
Graphical representation of the structure of the review. Section 3 (Sec. 3): link between cell application and EIS spectra; Sec. 4: link between EIS spectra and cell degradation; Sec. 5: link between EIS spectra and ECMs solutions; Sec. 6: link between the degradation mechanisms and the circuital elements.
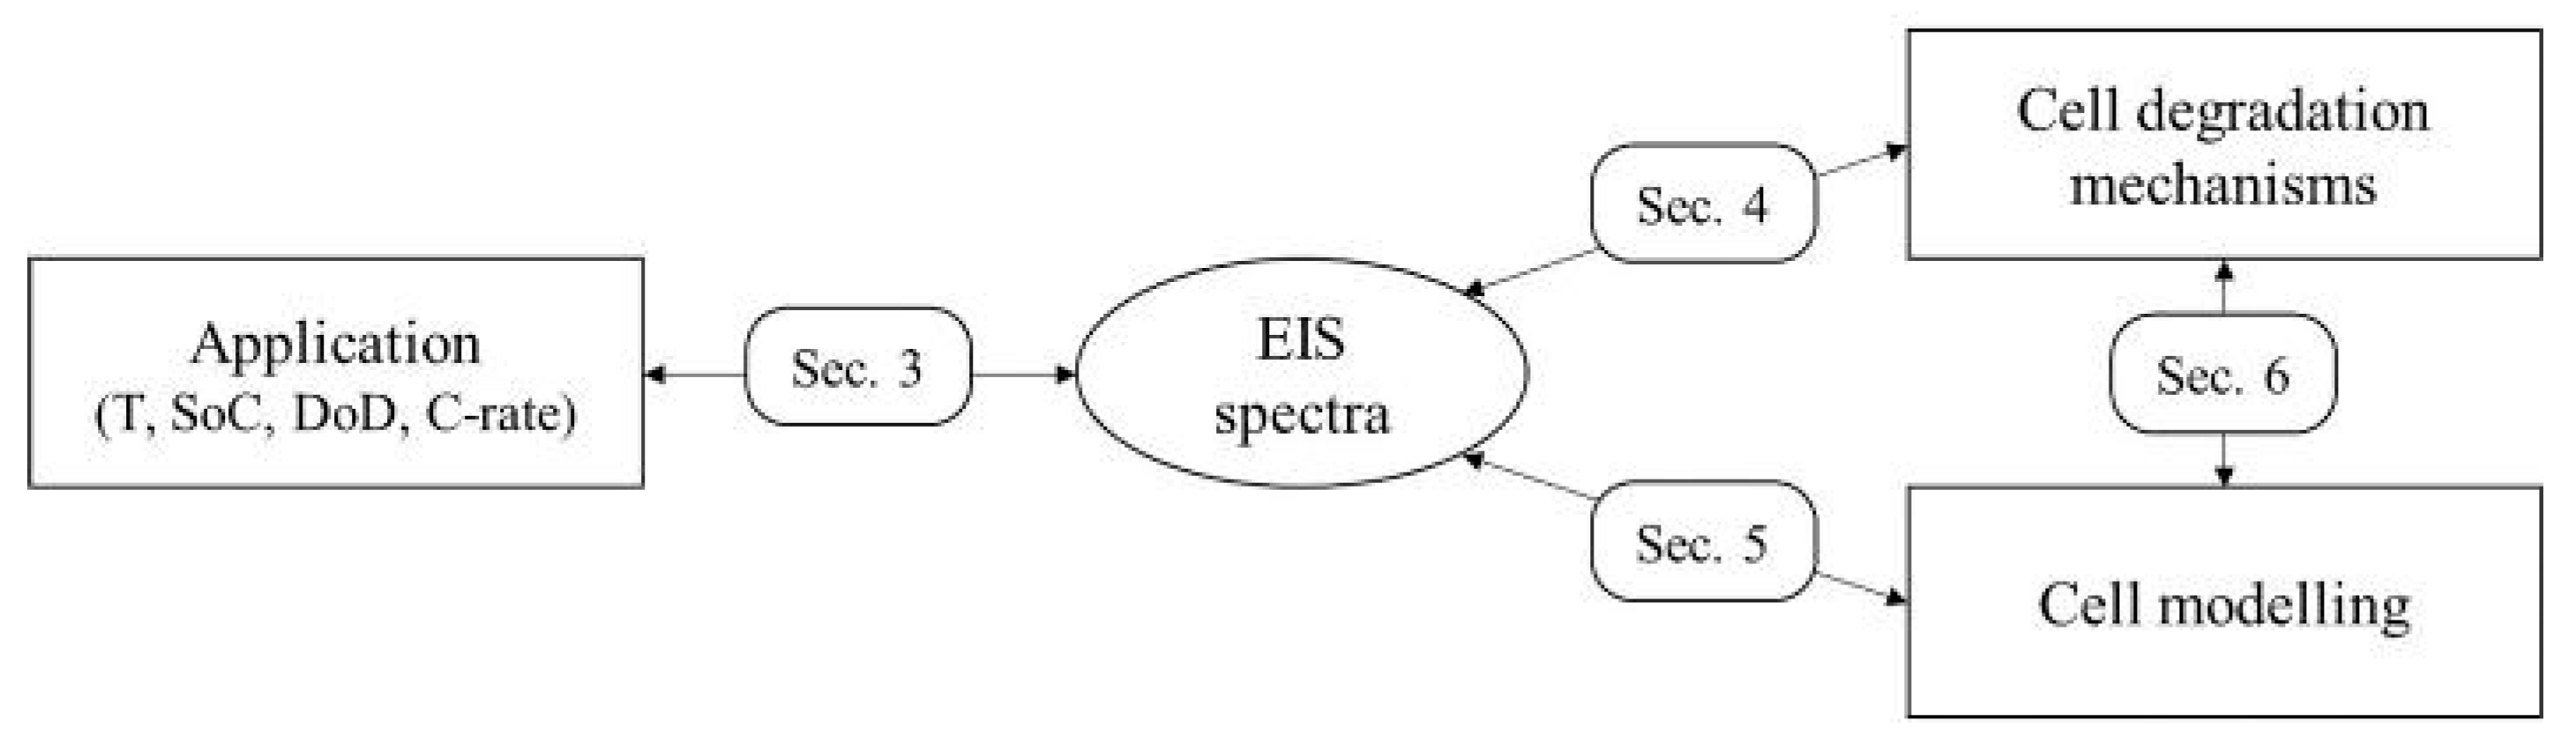
Figure 2.
Representation of the frequency regions on a Nyquist plot. The typical EIS spectrum of a Li-ion cell could be composed of a unique semiarch or two semiarches in the Mid-frequency region.
Figure 2.
Representation of the frequency regions on a Nyquist plot. The typical EIS spectrum of a Li-ion cell could be composed of a unique semiarch or two semiarches in the Mid-frequency region.
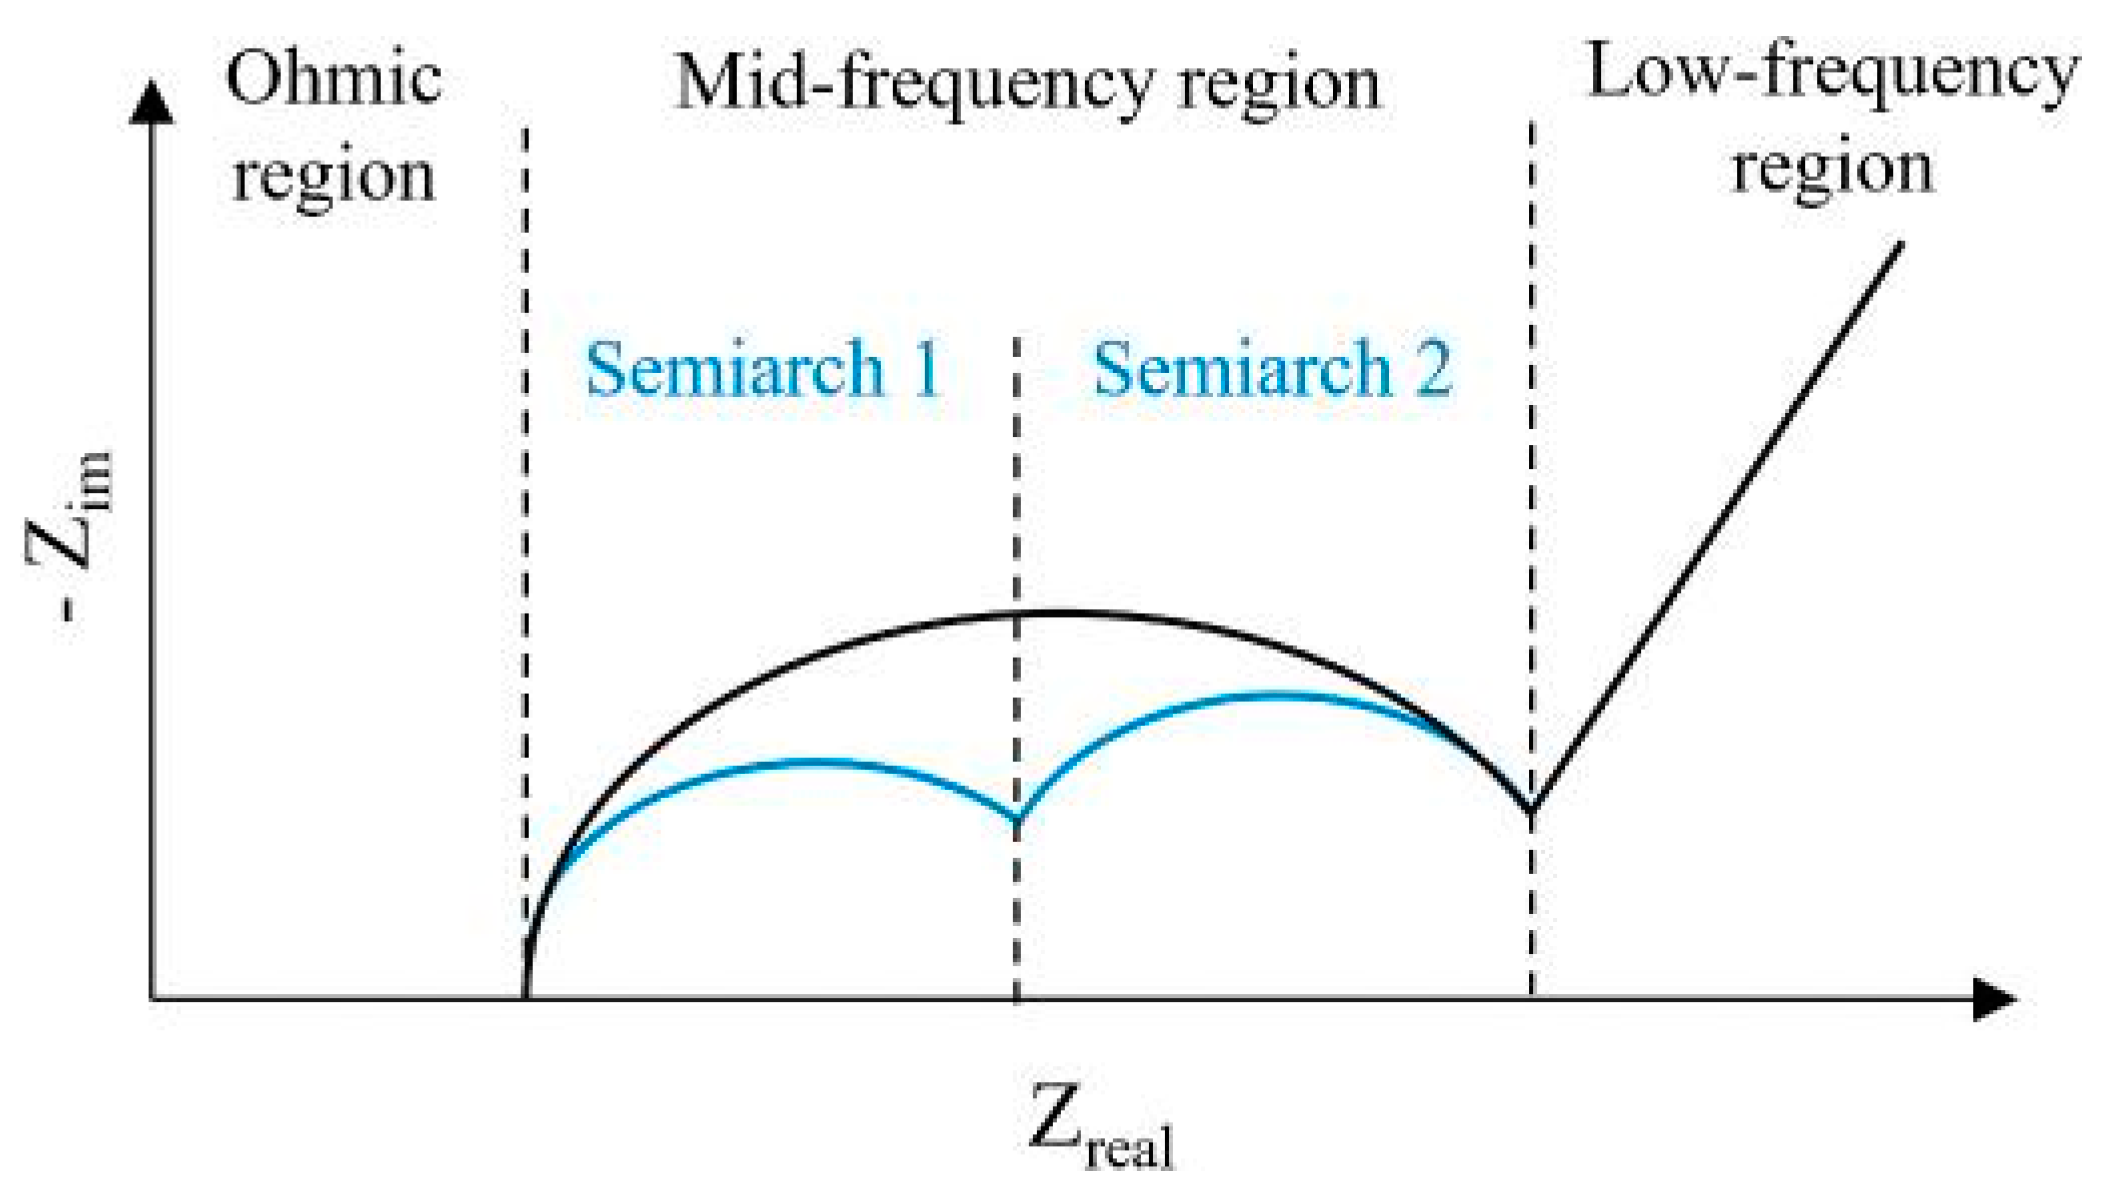
Figure 3.
(a) Representation of the EIS spectrum evolution of a cell subjected to calendar aging experiments. Depending on the cell application, the impedance rise could be smaller (black arrows) or larger (dotted arrows). Large impedance rise is mainly due to high temperature and low or high SoC at which the cell is stored. (b) Representation of the EIS spectrum evolution of a cell subjected to cycling aging experiments. Depending on the cell application, the impedance rise could be smaller (black arrows) or larger (dotted arrows). Large impedance rise is mainly due to low temperature (in the Ohmic region), high temperature (in the Mid-frequency region) and high C-rate.
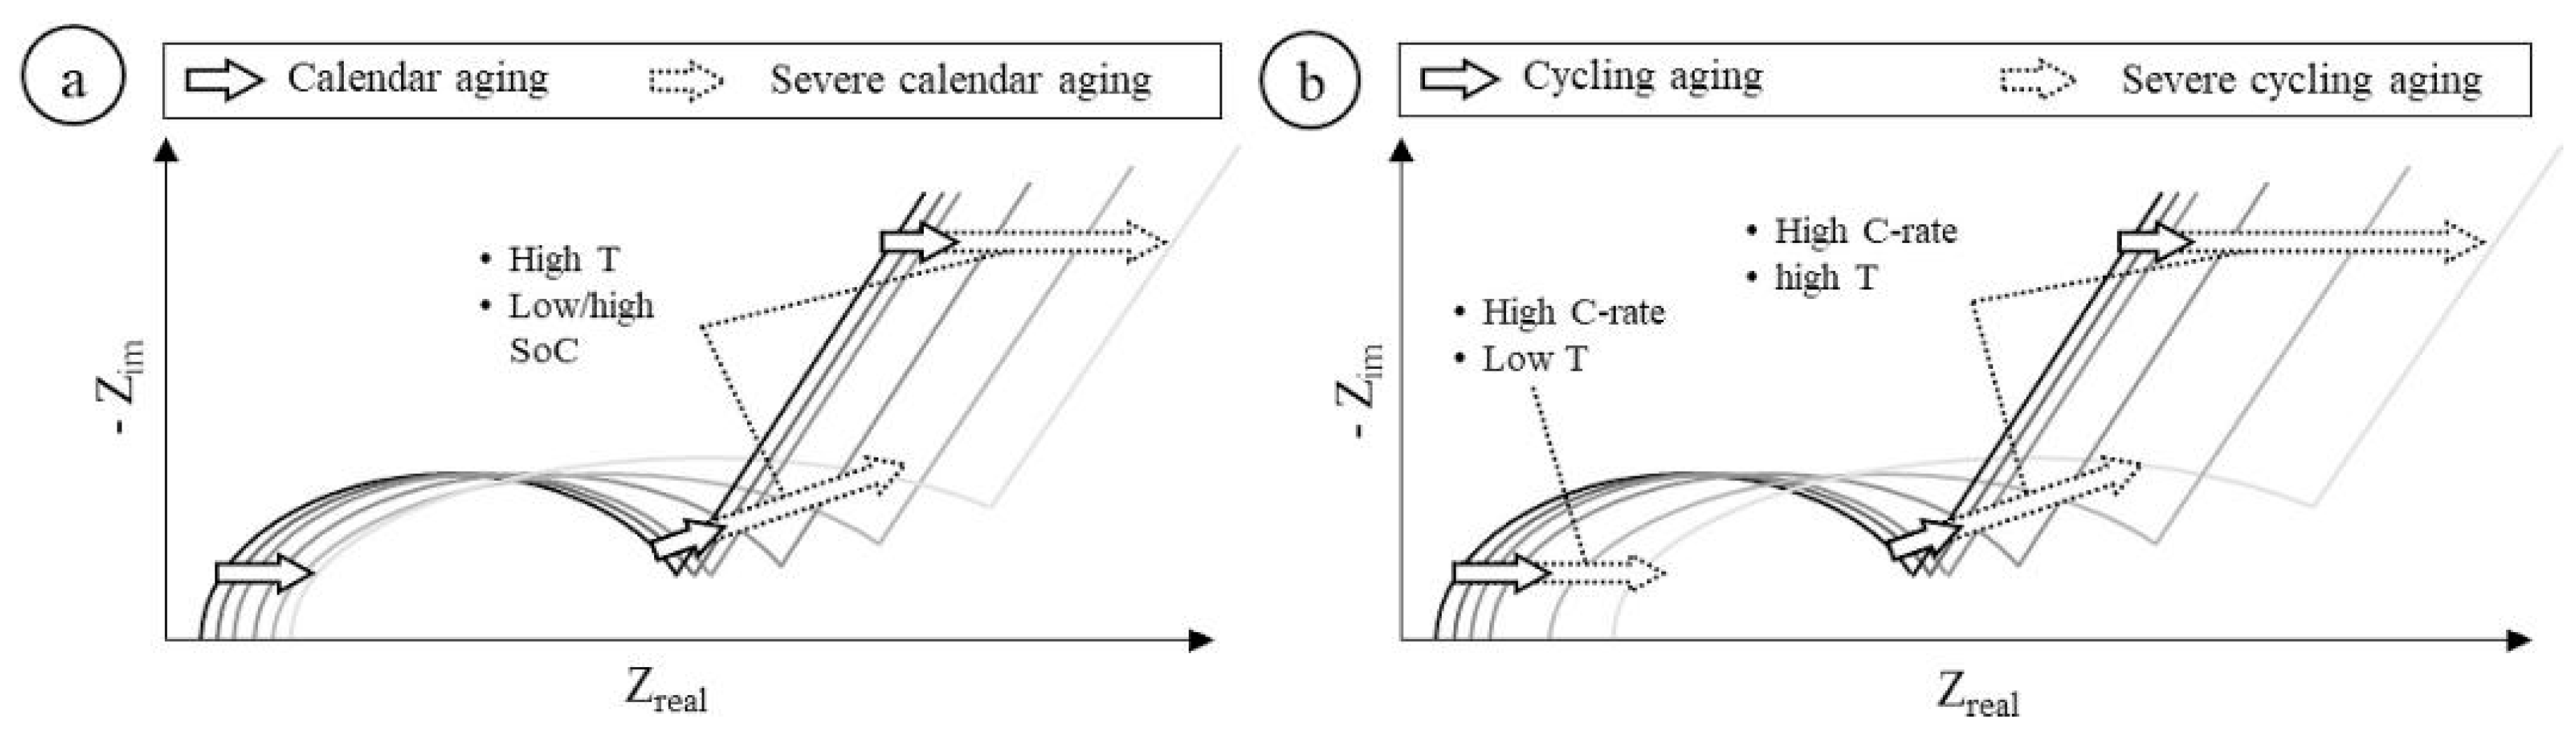
Figure 4.
List of the commonly reported degradation mechanisms in Li-ion cells, associated degradation modes and related fade caused on the cell. Adapted from [76].
Figure 4.
List of the commonly reported degradation mechanisms in Li-ion cells, associated degradation modes and related fade caused on the cell. Adapted from [76].
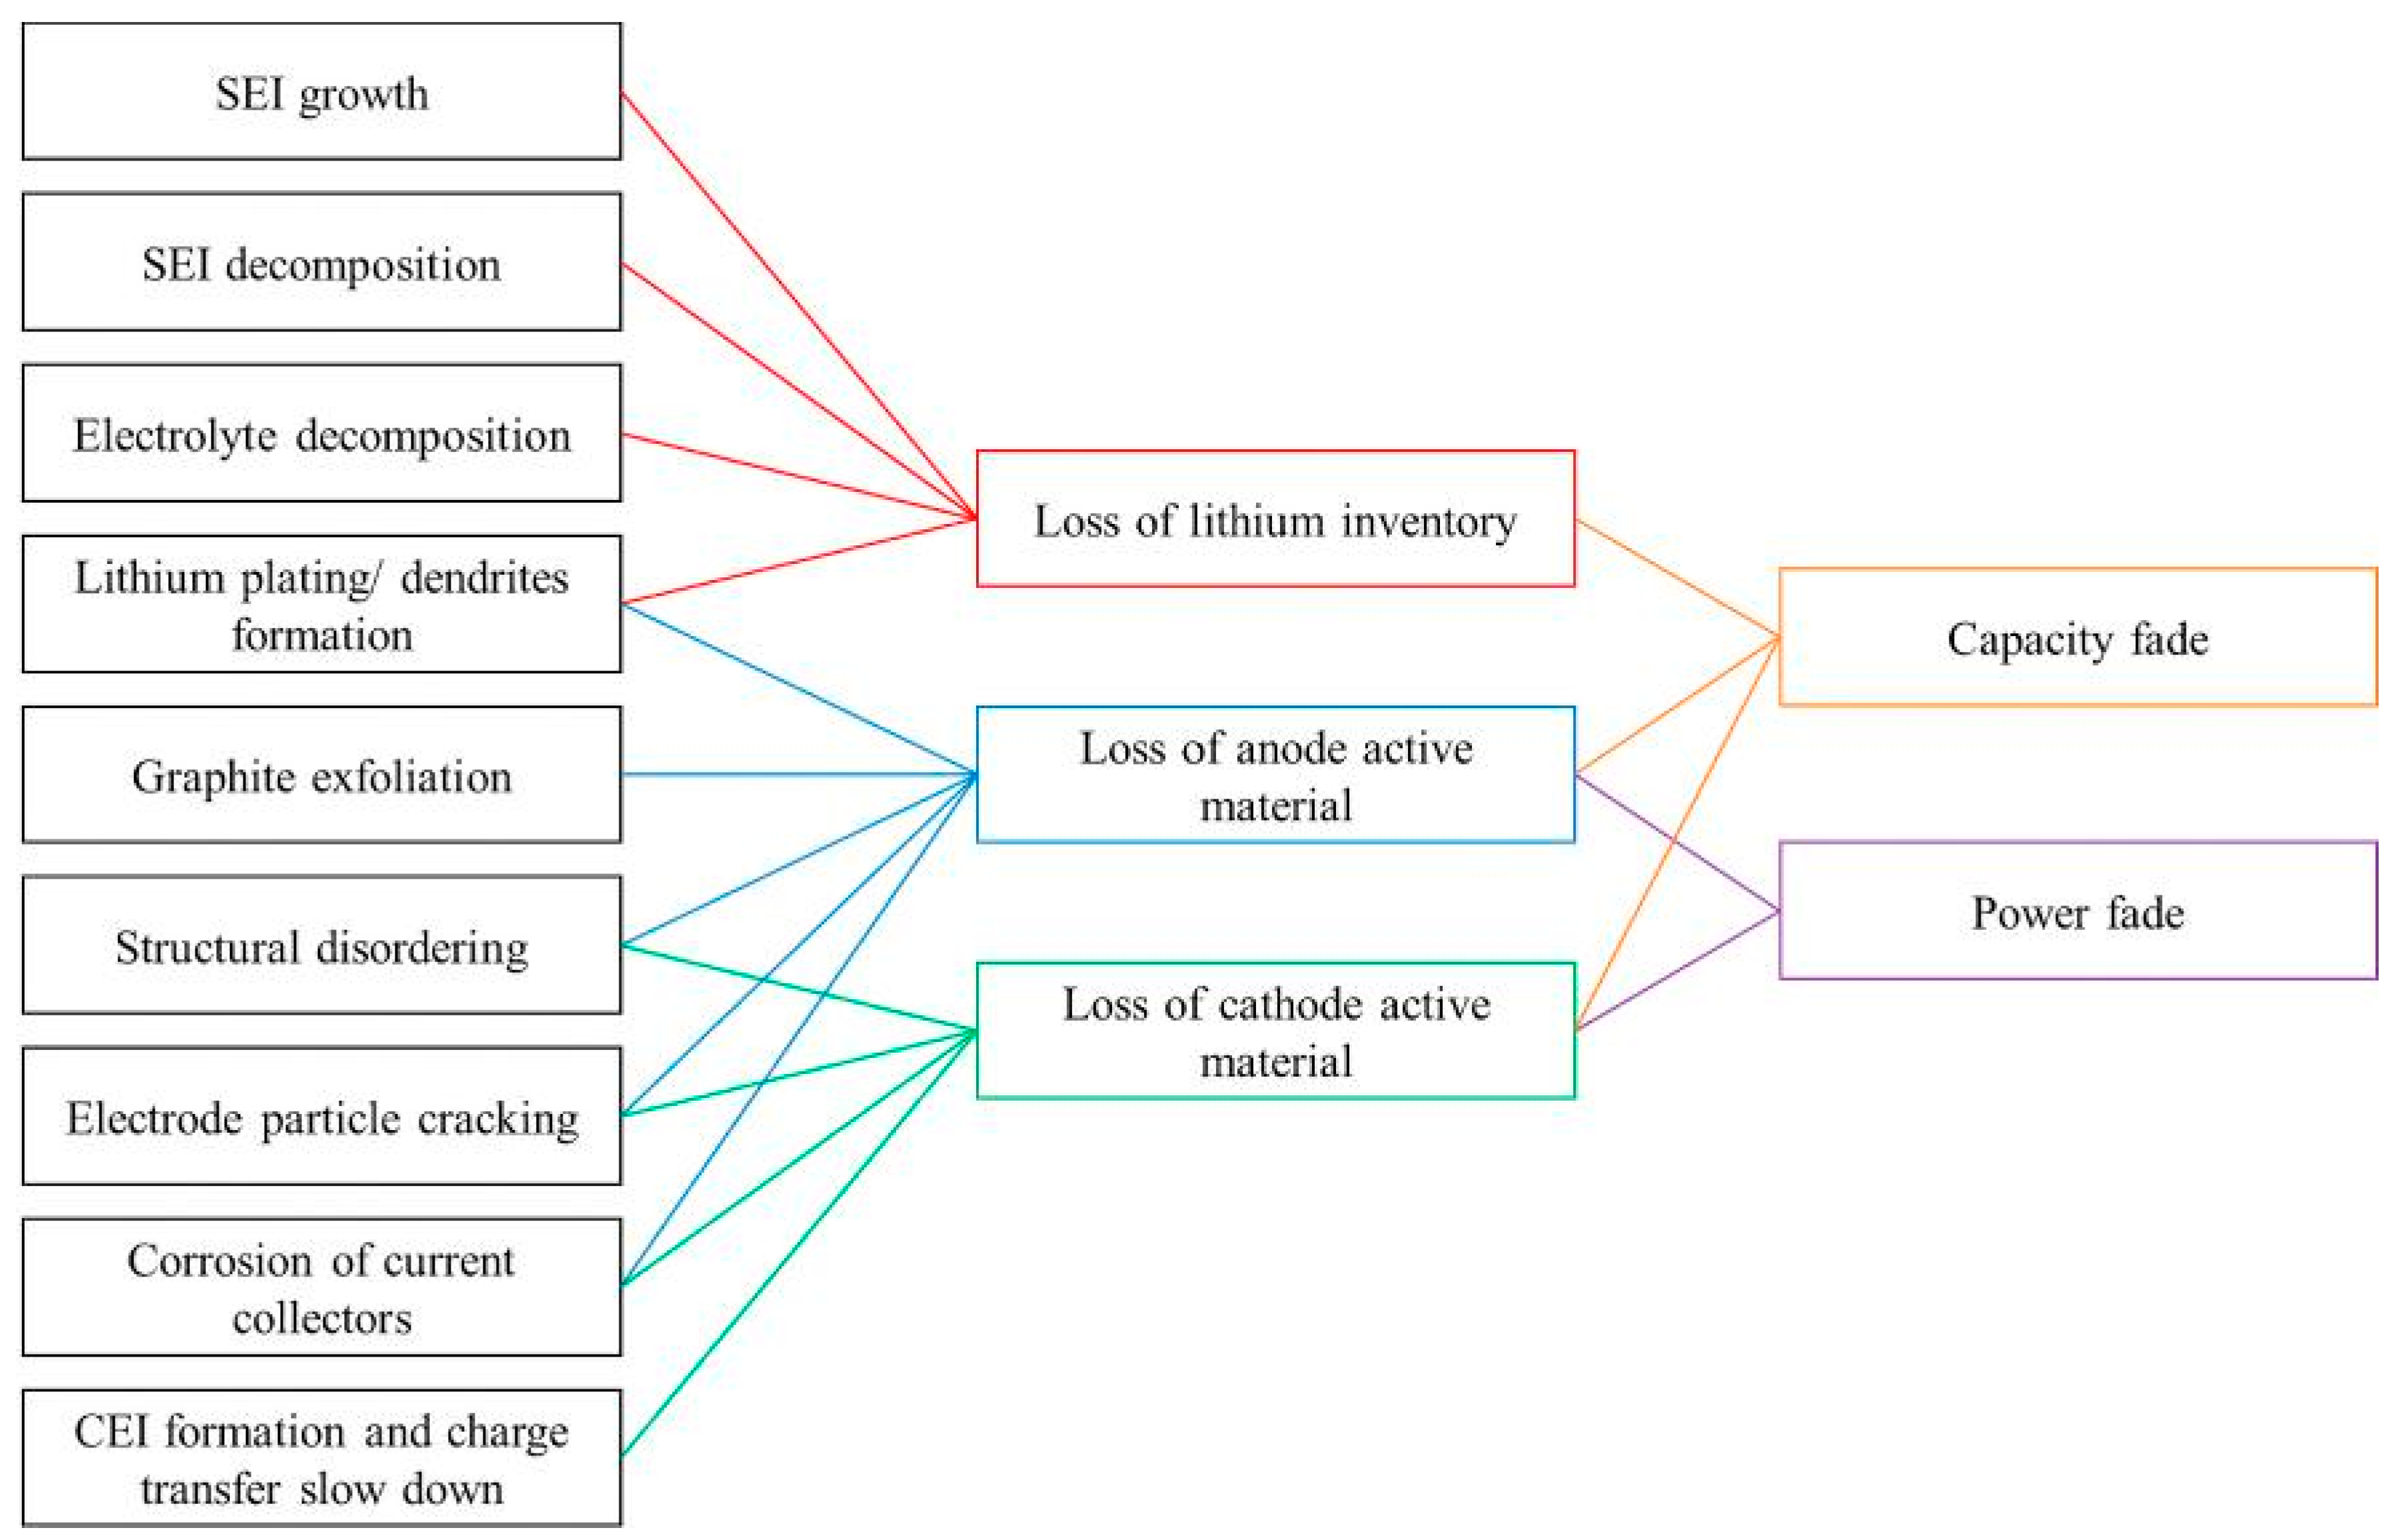
Figure 5.
Representation of ECM model of a Li-ion cell. Inductance and resistance are used to model the high frequency region (inductive and Ohmic regions). The specifications about Mid- and Low-frequency regions are given in Table 5.
Figure 5.
Representation of ECM model of a Li-ion cell. Inductance and resistance are used to model the high frequency region (inductive and Ohmic regions). The specifications about Mid- and Low-frequency regions are given in Table 5.
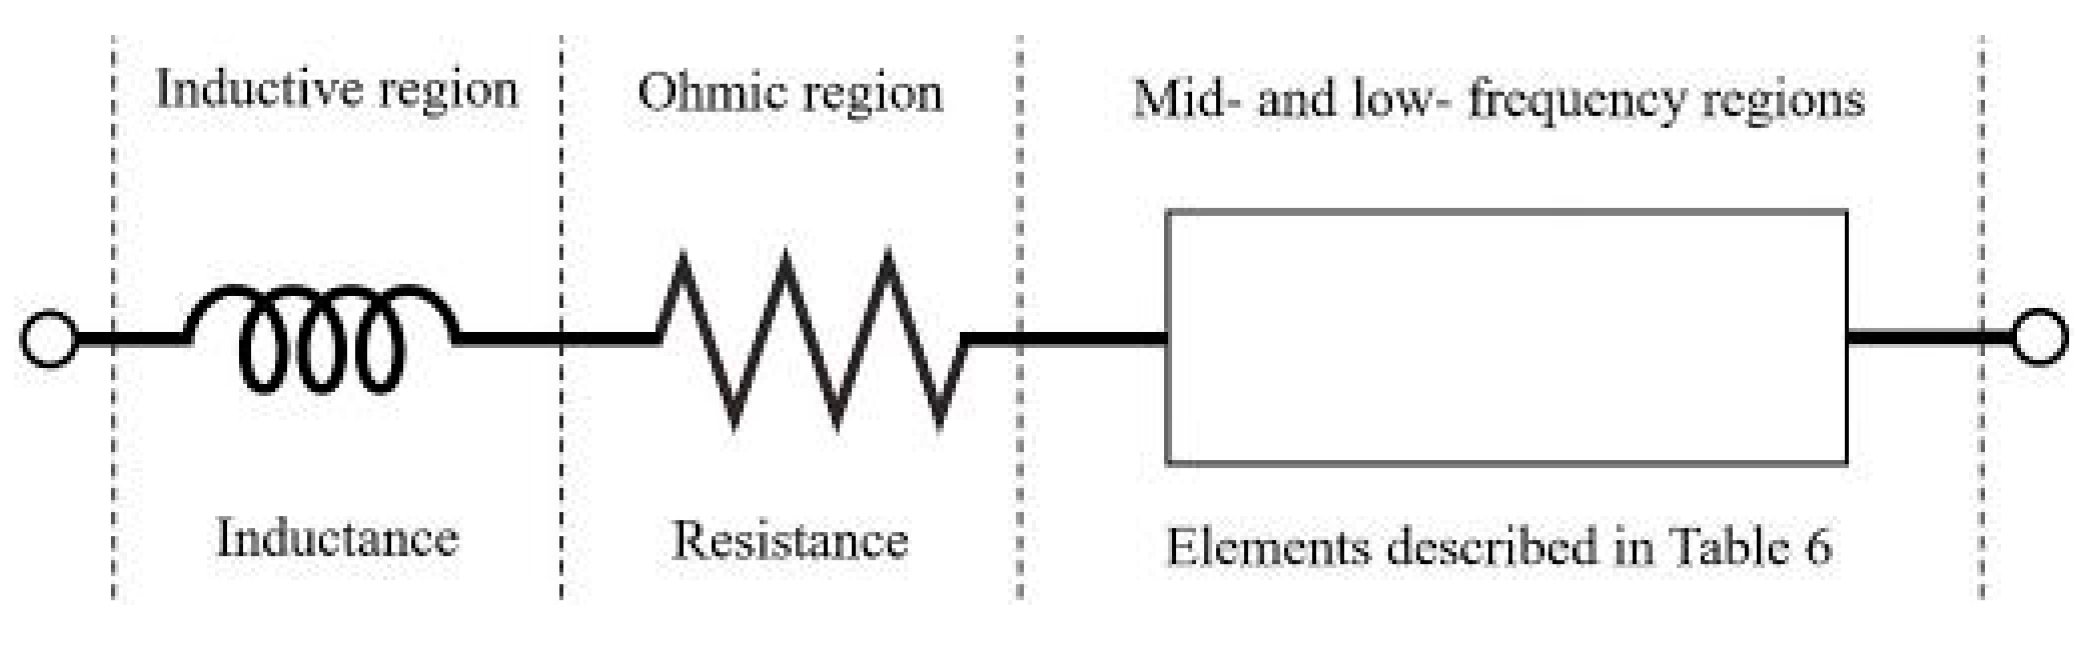
Figure 6.
ECMs developed by the review of the articles listed in Table 5. (a) Model developed for LCO cells with Warburg element in series to RC elements; (b) model developed for LCO cells with Warburg element on the resistive branch of the 2nd RC element; (c) model developed for NMC and NCA cells with two Zarc elements and a Warburg element in series. The Ohmic region is always modelled with a resistor.
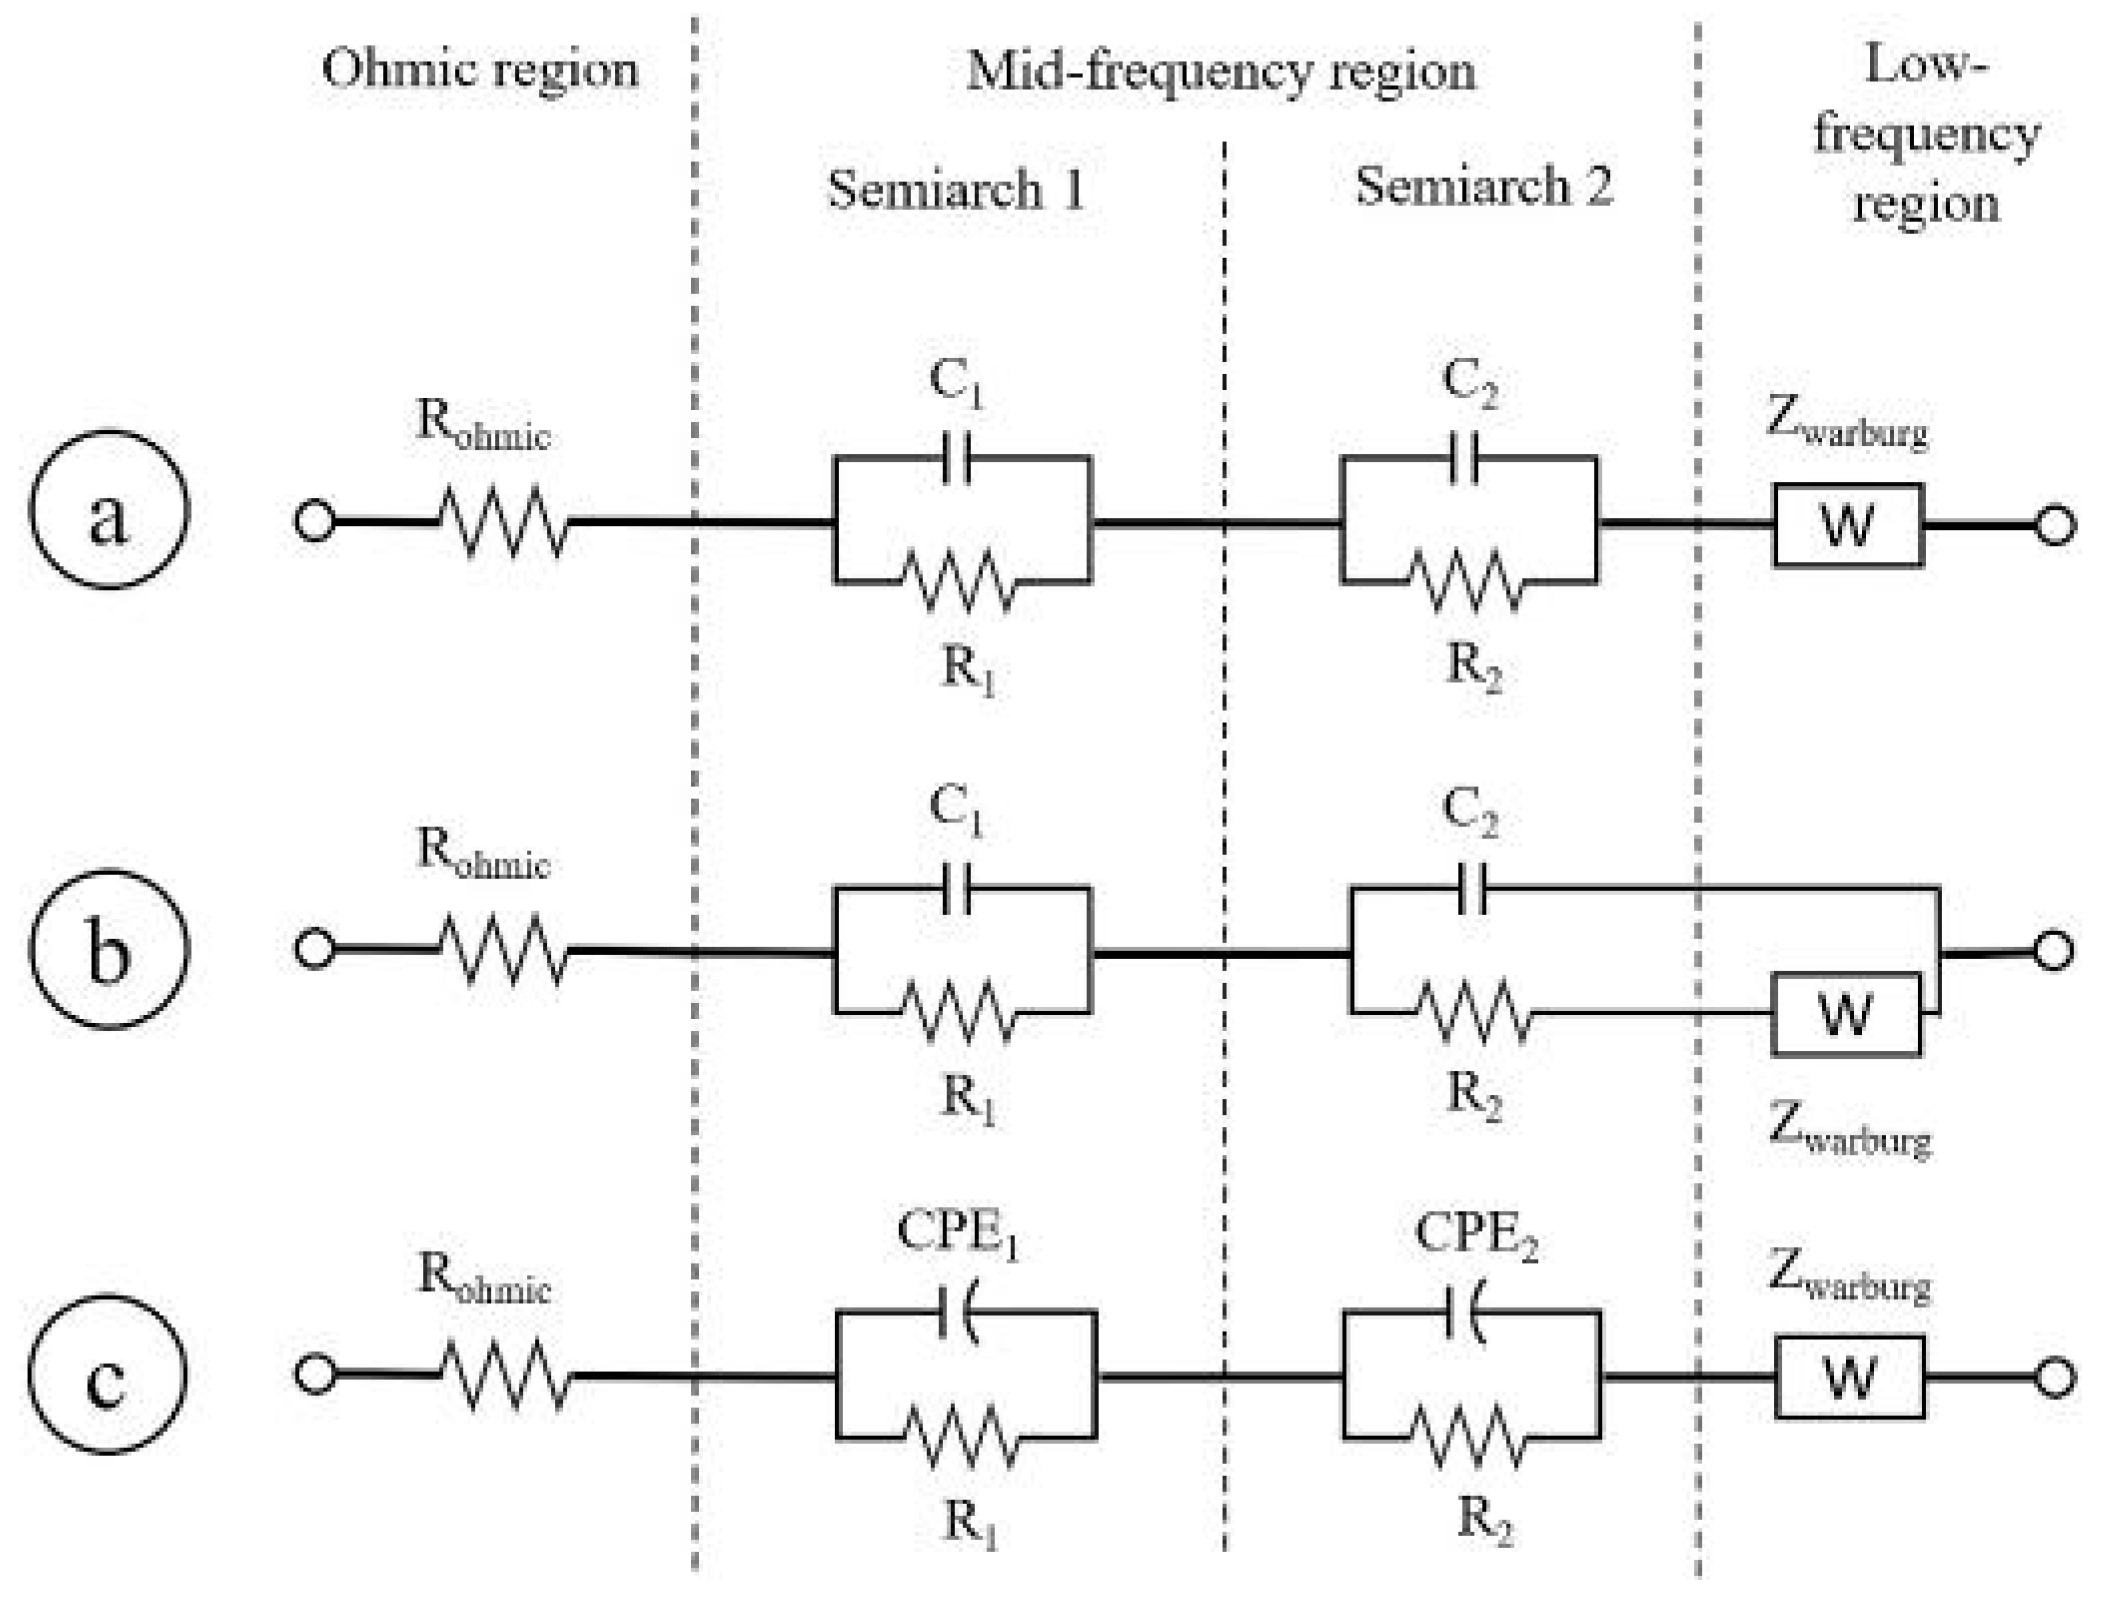
Figure 7.
(A) Critical assessment of the impact of aging tests procedures on EIS spectra given in Section 3. The analysis has been done by clustering the publications with similar testing conditions and counting the cases in which a specific EIS region was impacted; the results are normalized on the total number of publications per each different set of parameters. (a) Impact of calendar aging tests at temperature higher than 30 ◦C and at different SoC levels on the EIS curve; (b) impact of cycling aging tests at 100% DoD, different temperature levels and current rate on the EIS curve. (B) Critical assessment of the connections among EIS spectra and degradation mechanisms given in Section 4. (a) Distribution of the degradation mechanisms in the three regions of the impedance curve; the Mid-frequency region includes the details on the different contributions of the two semiarches. (b) Distribution of the degradation mechanisms in the Mid-frequency region for LCO, NMC and NCA cathode cells. The results are normalized on the total number of cases per each region given in Table 4. (C) Critical assessment of the connections among EIS spectra and circuital elements given in Section 5. (a) Use of ECM elements to model the different regions of the impedance curve. The ohmic region is neglected because it is always modelled with a simple resistance; the Mid-frequency region includes the details on the different contributions of the two semiarches. (b) Use of specific ECM elements to model the impedance curve in the Mid-frequency region for LCO, NMC and NCA cathode chemistry cells. The results are normalized on the total number of cases recorded for each region given in Table 5.
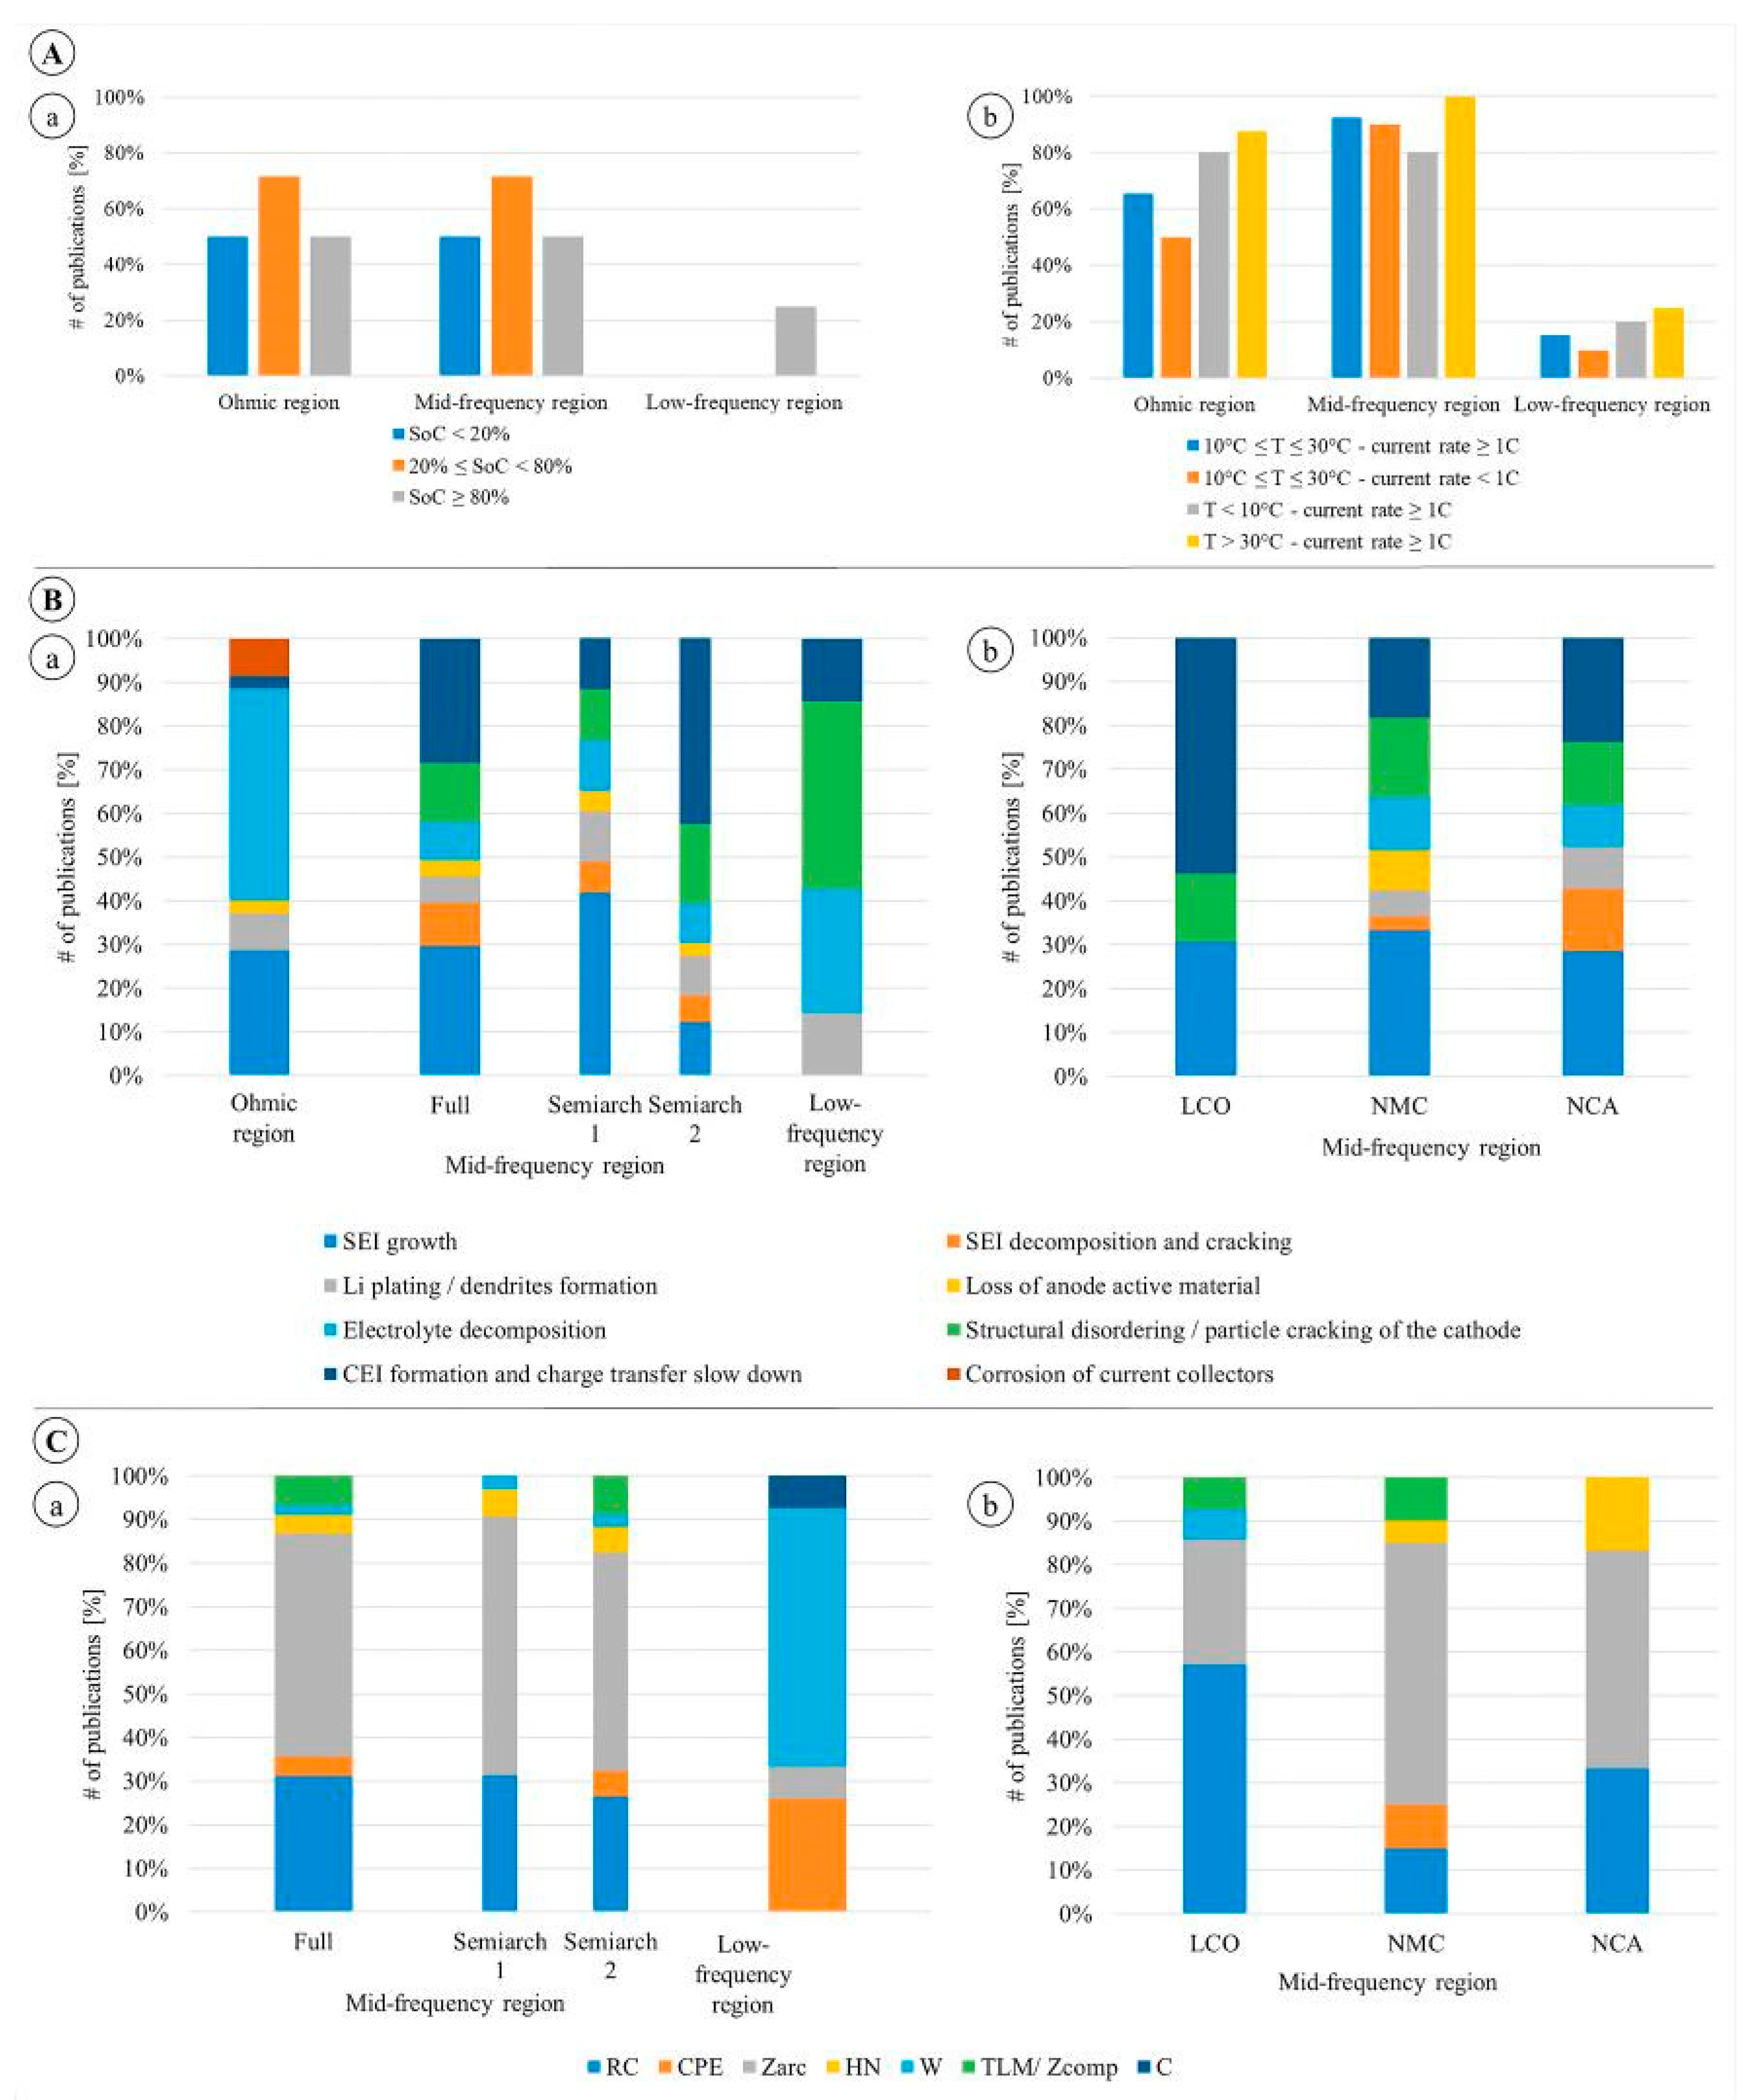
Figure 8.
Representation of the typical EIS spectrum of a Li-ion cell specifying the most occurring degradation mechanisms and the related circuital element used to describe and model each region of the curve.
Figure 8.
Representation of the typical EIS spectrum of a Li-ion cell specifying the most occurring degradation mechanisms and the related circuital element used to describe and model each region of the curve.
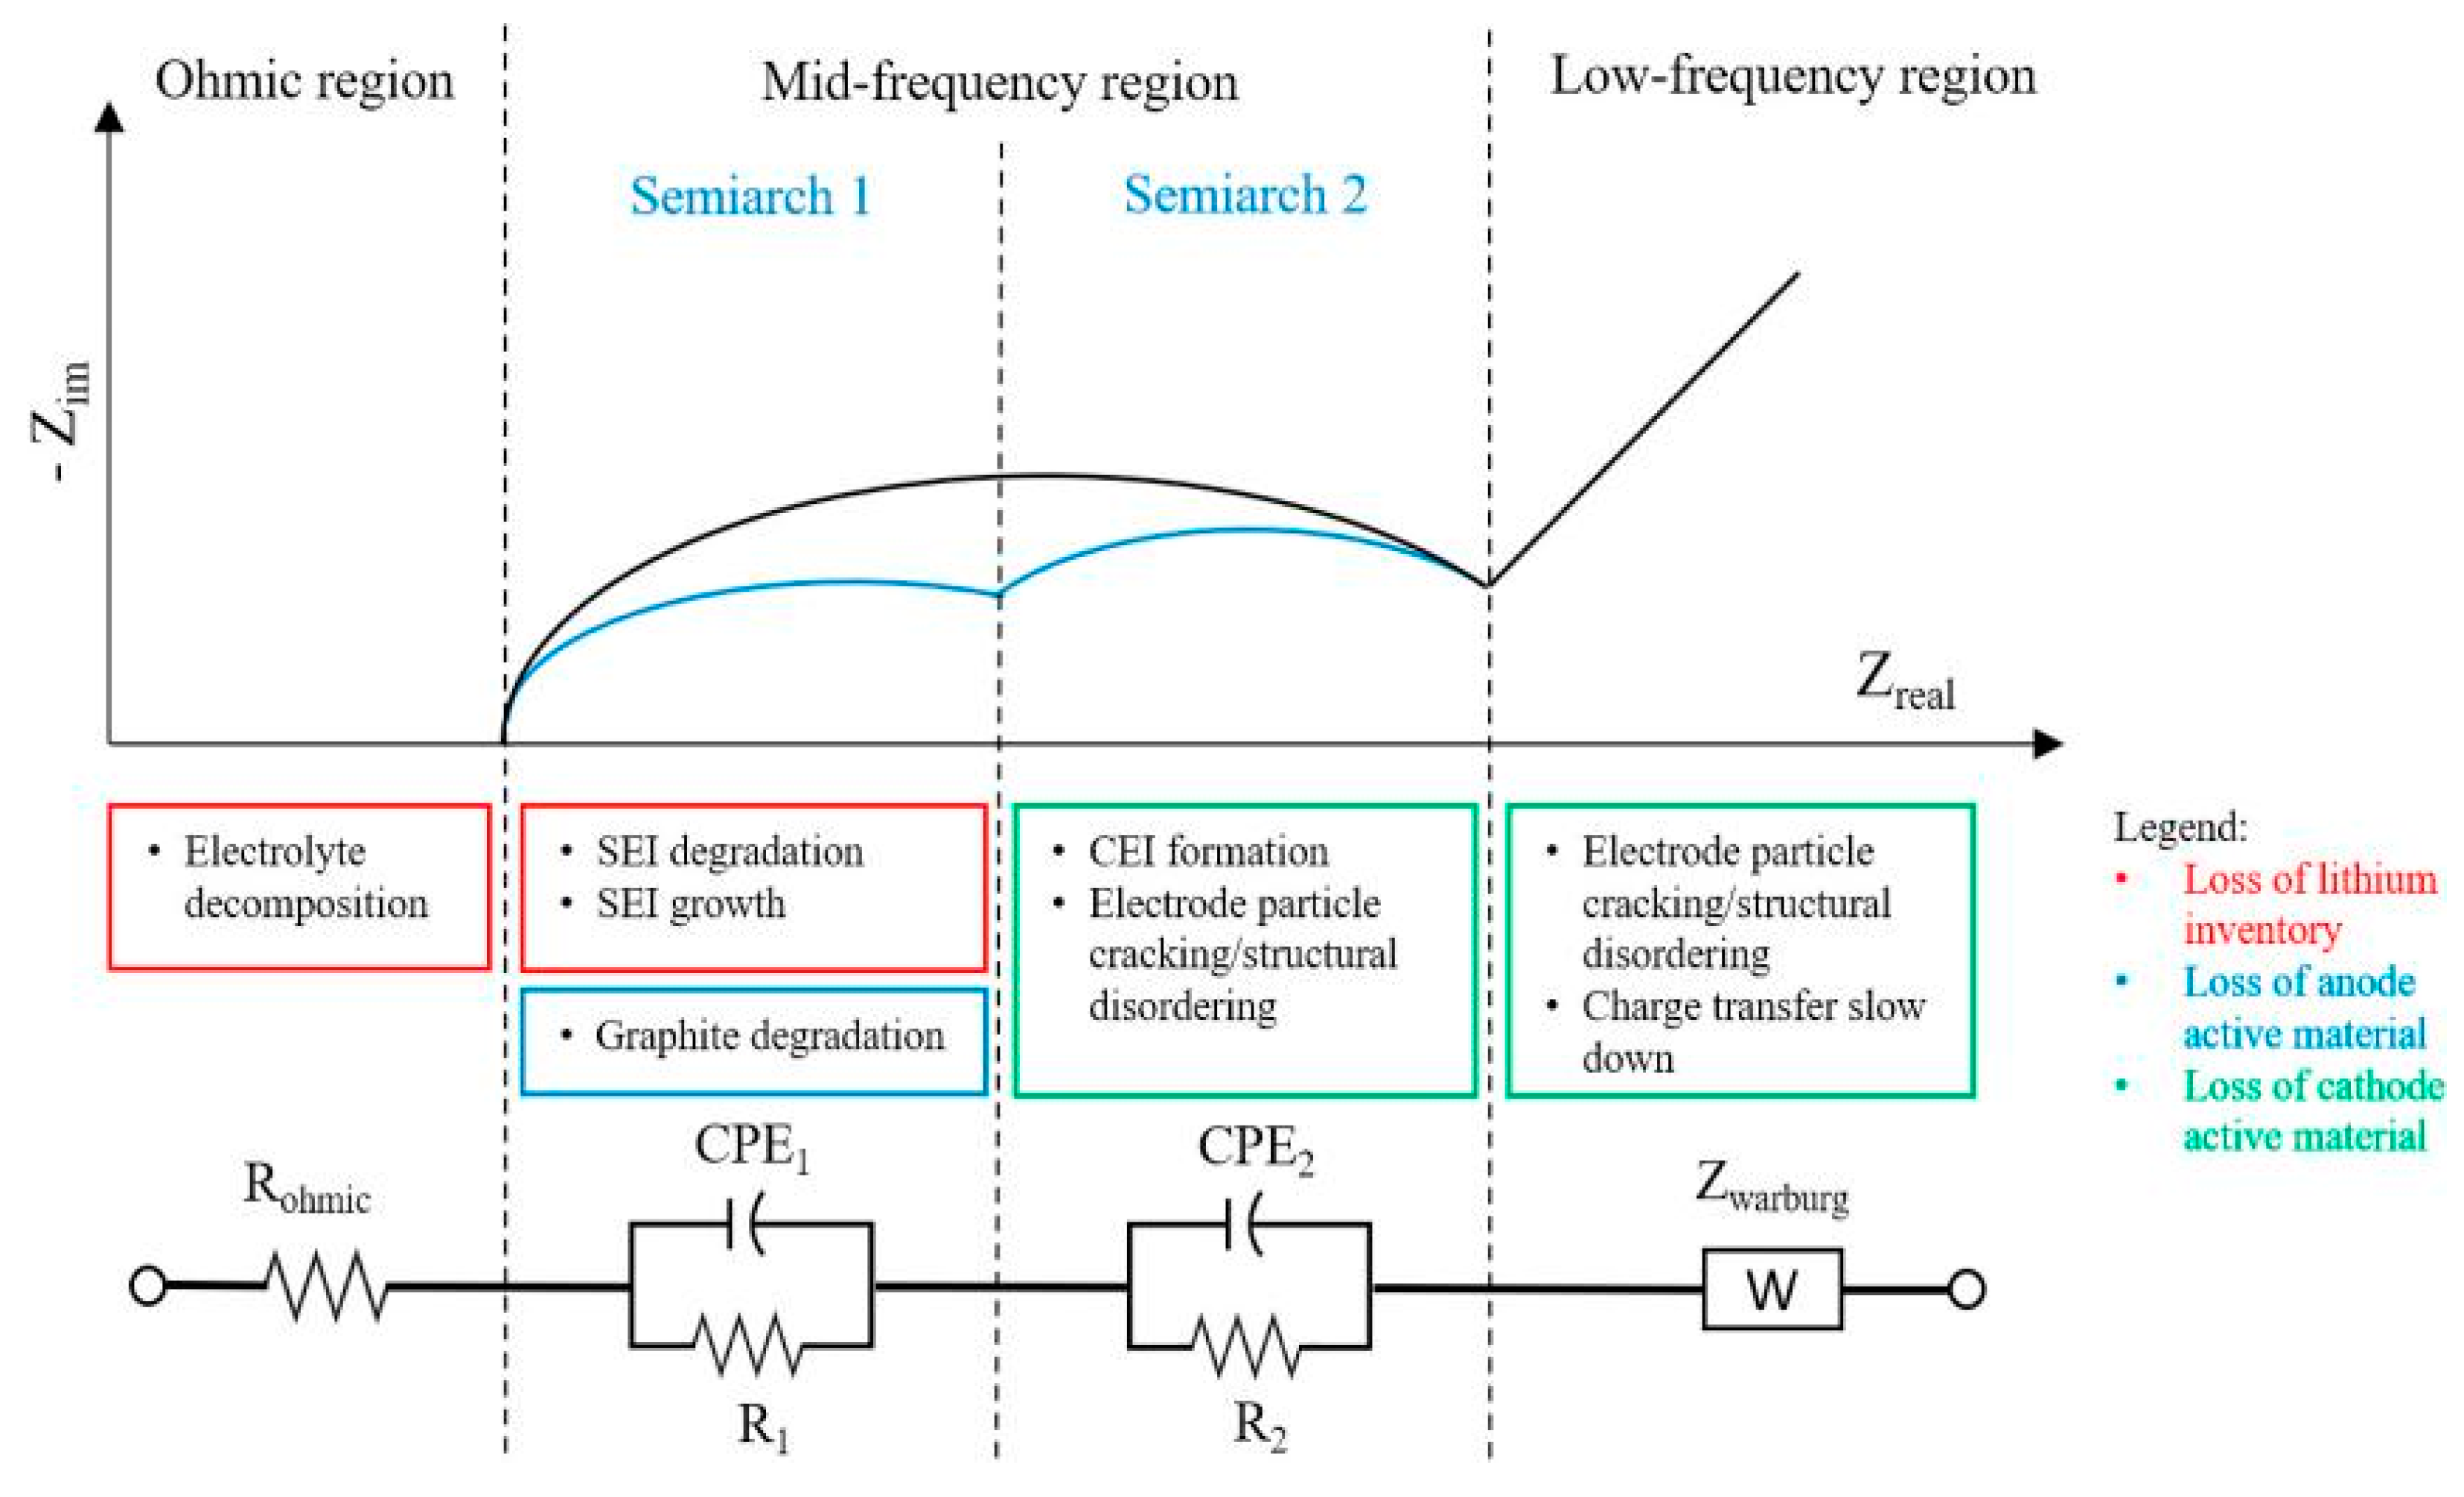

Table 1.
Overview of the articles analysed in the work with additional information: author, year of publication, cathode chemistry type, type of experimental test (cycling or calendar test) and specifications on invasive techniques (if any). The reference numbers (Ref) correspond to the ones given at the end of the work, in the References section.
| Ref | Author | Available | Cathode | Testing | Invasive |
|---|---|---|---|---|---|
| online | chemistry type | type (calendar/ cycling) | Techniques | ||
| [34] | H. De Vries | 2015 | LCO | cycling | Not used |
| [10] | J. Li | 2010 | LCO | calendar | XRD, SEM, |
| half cells | |||||
| [35] | T. Osaka | 2003 | LCO | calendar, | Not used |
| cycling | |||||
| [36] | U. Tro¨ltzsch | 2005 | LCO | cycling | Not used |
| [37] | K. Kato | 2003 | LCO | cycling | Not used |
| [13] | M. -S. Wu | 2004 | LCO | cycling | Three |
| electrodes | |||||
| [38] | D. | 2012 | LCO | cycling | Not used |
| Mukoyama | |||||
| [15] | J. Li | 2001 | LCO | cycling | SEM, TEM, |
| XRD | |||||
| [27] | D. Zhang | 2000 | LCO | cycling | Half cells, |
| EPMA | |||||
| [8] | J. Zhou | 2007 | LCO | cycling | EDS, XRD, half cells, TEM |
| [26] | G. Ning | 2003 | LCO | cycling | Half cells, SEM |
| [39] | C. Lyu | 2019 | LCO | cycling | Not used |
| [67] | H. Popp | 2012 | LMO | cycling | Not used |
| [22] | T. Yoshida | 2006 | LMO | calendar | FIB, SEM, XPS |
| [66] | M. Galeotti | 2016 | LiPO | cycling | Not used |
| [40] | S. Schindler | 2017 | LFP | cycling | Not used |
| [41] | M. Petzl | 2014 | LFP | cycling | Half cells |
| [16] | E. | 2014 | LFP | cycling | SEM, EDS, |
| Sarasketa-Zabala | XRD | ||||
| [42] | Y. Zhang | 2010 | LFP | cycling | Not used |
| [17] | D. Wong | 2015 | LFP | cycling | XRD, SEM, |
| XAS | |||||
| [43] | M. A. | 2015 | LFP | cycling | Not used |
| Monem | |||||
| [44] | D.-I. Stroe | 2017 | LFP | calendar | Not used |
| [18] | M. Kassem | 2013 | LFP | calendar | FTIR, XRD, |
| SEM, half cells | |||||
| [45] | T. G. Zavalis | 2013 | LFP | calendar, | Three |
| cycling | electrodes, | ||||
| SEM | |||||
| [46] | X. Wang | 2019 | LFP | cycling | Not used |
| [11] | B. Stiaszny | 2013 | NMC | cycling | Half cells, |
| SEM, light | |||||
| microscopy | |||||
| [47] | Y. Leng | 2017 | NMC | cycling | Three |
| electrodes | |||||
| [21] | A. | 2018 | NMC | cycling | SEM, EDS |
| Maheshwari | |||||
| [48] | S. F. | 2015 | NMC | cycling | SEM |
| Schuster | |||||
| [49] | X. Zhou | 2019 | NMC | cycling | Not used |
| [50] | U. | 2016 | NMC | cycling | Not used |
| Westerhoff | |||||
| [12] | X. Li | 2019 | NMC | cycling | Half cells, |
| SEM, EDS | |||||
| [19] | K. Jalkanen | 2015 | NMC | cycling | XRD, SEM, |
| EDS | |||||
| [51] | Q. Yang | 2020 | NMC | cycling | Not used |
| [52] | P. Aurora | 2013 | NMC | cycling | Not used |
| [53] | M. Klett | 2016 | NMC | cycling | Three |
| electrodes | |||||
| [54] | T. P. Heins | 2019 | NMC | cycling | Three |
| electrodes | |||||
| [55] | T. P. Heins | 2020 | NMC | cycling | Not used |
| [56] | R. Xiong | 2017 | NMC | cycling | Not used |
| [14] | I. | 2015 | NMC | cycling | XRD, PGAA, |
| [9] | Buchberger | 2013 | NMC | cycling | Three- |
| Y. Li | electrodes | ||||
| Three electrodes, SEM, XRD, XAS, Raman Spectroscopy | |||||
| [23] | T. Joshi | 2014 | NMC | cycling | SEM, XPS |
| [57] | B. Stiaszny | 2014 | NMC | calendar | Half cells, |
| SEM, light | |||||
| microscopy | |||||
| [58] | J. Schmitt | 2017 | NMC | calendar | Not used |
| [59] | P. S. Sabet | 2020 | NMC | calendar, | Not used |
| cycling | |||||
| [60] | M. Ecker | 2012 | NMC | calendar, | Not used |
| cycling | |||||
| [61] | W. Waag | 2013 | NMC | calendar, | Not used |
| cycling | |||||
| [20] | Y. Zhang | 2009 | NCA | cycling | Three |
| electrodes | |||||
| [32] | C. P. | 2017 | NCA | cycling | Not used |
| Ferna`ndez | |||||
| [62] | P. S. Sabet | 2018 | NCA | cycling | Half cells |
| [24] | X. Zhang | 2020 | NCA | cycling | XRD, XPS, |
| SEM | |||||
| [63] | D. Wong | 2015 | NCA | cycling | Not used |
| [64] | R. G. Jungst | 2003 | NCA | calendar | Not used |
| [25] | D. P. | 2005 | NCA | calendar | Half-cells, XPS |
| Abraham | |||||
| [65] | H. Sun | 2021 | NCA | cycling | Not used |
| [70] | A. Eddahech | 2011 | n.d. | cycling | Not used |
Table 2.
Calendar aging tests characteristics and correspondent effect on the impedance curve of the Li-ion cell. The impedance rise is marked with symbol X and its intensity is given by: (+) increase; (++) increase higher compared to the others.
Table 2.
Calendar aging tests characteristics and correspondent effect on the impedance curve of the Li-ion cell. The impedance rise is marked with symbol X and its intensity is given by: (+) increase; (++) increase higher compared to the others.
| Ref | Cathode chemistry type | Time of storage | Temperature | SoC | Ohmic region | Mid-frequency region | Low-frequency region | ||
|---|---|---|---|---|---|---|---|---|---|
| Semiarch 1 Semiarch 2 | |||||||||
| [10] | LCO | 100 days | 55 ◦C | 0%, 50% | – | X (+) | X (+) | – | |
| [10] | LCO | 100 days | 55 ◦C | 100% | – | X (+) | X (+) | X (+) | |
| [35] | LCO | 20 days | 50 ◦C | – | – | – | X (+) | – | |
| [22] | LMO | 400 days | 40 ◦C | 50% | X (+) | X (+) | – | ||
| [44] | LFP | 12–24 months | 40 ◦C–55 ◦C | 10%, 50%, | 90% | X (+) | – | – | – |
| [18] | LFP | 240 days | 60 ◦C | 100% | – | X (+) | – | ||
| [45] | LFP | Up to EOL of cycling test | 22 ◦C | 60% | X (- ) | – | – | – | |
| [57] | NMC | 300 days | 60 ◦C | 100% | X (+) | X (+) | X (++) | – | |
| [58] | NMC | 375 days | 45 ◦C | 100% | X (+) | X (+) | – | ||
| [59] | NMC | 700 days | 35 ◦C | 100% | X (+) | X (+) | X (+) | – | |
| [60] | NMC | 420 days | 35 ◦C, 50 ◦C, 65 ◦C | 50% | X (+) | X (++) | – | ||
| [61] | NMC | 18 months | 50 ◦C–25 ◦C | – | X (+) | X (++) | – | ||
| [64] | NCA | 140 days | 55 ◦C | 100% | – | X (+) | – | ||
| [25] | NCA | 142 days | 55 ◦C | >50% | – | X (+) | X (+) | ||
Table 3.
Cycling aging tests characteristics and correspondent effect on the impedance curve of the Li-ion cell. When not available in the article, the SoH has been calculated with the given measurements of initial and EoL capacity. The impedance rise is marked with letter X and its intensity is given by: (+) increase; (++) increase higher compared to the others.
| Ref | Cathode chemistry type | Number of cycles | SoH [%] | Temperature | DoD [%] | C-rate | Ohmic region |
Mid-frequency region | Low-frequency region | |
|---|---|---|---|---|---|---|---|---|---|---|
| Semiarch 1 | Semiarch 2 | |||||||||
| [34] | LCO | 890 | 80% | Tamb | 100% | C/2 d; 1C c | – | X (++) | X (+) | – |
| [35] | LCO | 20 | 78% | Tamb | 100% | 2C | – | X (-) | X (+) | – |
| [36] | LCO | 230 | 86% | 19 ◦C | 100% | C/2 d; 1C c | X (+) | – | X (+) | X (+) |
| [37] | LCO | 19,800 | 68% | 25 ◦C | 10% | 0.1/0.3C | X (+) | – | X (++) | |
| [13] | LCO | 200 | 94% | – | 100% | 0.2C | X (+) | X (+) | X (+) | |
| [38] | LCO | 550 | <23% | Tamb | 100% | 1C | X (+) | X (+) | X (+) | |
| [15] | LCO | 286 | 70% | Tamb | 100% | 1C | X (-) | X (+) | X (+) | |
| [27] | LCO | 800 | 68% | – | 100% | 0.8C | – | X (+) | X (+) | |
| [8] | LCO | 500 | 87% | – | 100% | 0.5C | – | X (+) | X (++) | |
| [26] | LCO | 300 | 83% | Tamb | 100% | 3C | – | X (+) | X (+) | |
| [39] | LCO | 400 | – | 25 ◦C | 100% | 1C | X (+) | X (+) | appears X | |
| [39] | LCO | 360 | – | 25 ◦C | 100% | 2C | X (+) | X (+) | appears and X | – |
| (++) | ||||||||||
| [67] [66] |
LMO LiPO | 1400 315 |
67% 60% |
23 ◦C 25 ◦C | 100%100% | 2C 1C | X (+) X (+) | X (+) X (+) | appears X X (+) | X (+) – |
| [70] | n.d. | 3.8 × 10⁵ | 81% | 25 ◦C | 100% | Pulses 1C up to | X (+) | – | appears and X | – |
| 7C | (++) | |||||||||
| [40] | LFP | 100 | 80% | -22 ◦C | 100% | 2C | X (+) | X (+) | X (+) | |
| [41] | LFP | 300 | 74% | -22 ◦C | 100% | 1C | X (+) | – | – | – |
| [16] [42] |
LFP LFP | 3200 600 |
80% 86% |
30 ◦C 45 ◦C | 100%50% | 1C US EPA UDDS |
X (+) X (+) | – | – X (++) |
– X (+) |
| [17] | LFP | 40 | 0% | – | 100% | Pulses ≤ 15C | X (+) | – | appears and X | – |
| (+) | ||||||||||
| [43] | LFP | 500 | 95% | Tamb | 100% | Pulses ≤ 1C c; | X (+) | – | X (+) | X (+) |
| 5C d | ||||||||||
| [45] | LFP | n.d. | 80% | 22 ◦C | 100% | HDC | X (+) | – | – | – |
| [46] | LFP | 800 | 80% | 45 ◦C | 100% | 2C | X (+) | X (+) | X (+) | – |
| [11] | NMC | 800 | 5% | Tamb | 100% | 1C | X (++) | X (-) | X (+) | – |
| [47] | NMC | 1500 | 75% | 25 ◦C | 100% | 1C c; 2C d | – | X (+) | X (+) | – |
| [21] | NMC | 500 | 55% | 20 ◦C | 50% | 1C c; 2C d | X (++) | X (+) | – | – |
| [48] | NMC | 977 | 50% | 35 ◦C | 100% | 1C | X (+) | X (+) | – | |
| [49] | NMC | n.d. | 71% | 45 ◦C | 100% | ≥1C | X (+) | X (+) | X (+) | X (+) |
| [50] | NMC | n.d. | 86% | Range 50 to | 100% | 1C | X (+) | X (+) | X (++) | |
| -20 ◦C | ||||||||||
| [12] | NMC | 250 | 84% | Tamb | 100% | 0.5C | – | X (+) | X (-) | – |
| [19] | NMC | 2500 | 80% | Tamb | 100% | 1C | X (+) | X (+) | X (+) | – |
| [19] | NMC | 1500 | 80% | 45 ◦C c; 65 ◦C d | 100% | 1C | X (++) | X (+) | X (++) | – |
| [51] | NMC | 550 | 82% | Tamb | 100% | C/3 | X (+) | X (+) | X (++) | – |
| [52] | NMC | 50 | 97% | – | 100% | 1C | X (+) | – | X (+) | – |
| [53] | NMC | 50 | 95% | 30 ◦C | 100% | C/3 | X (+) | X (+) | – | X (+) |
| [54] | NMC | 1000 | 95% | – | 100% | 1.5C | – | X (+) | – | |
| [55] | NMC | 450 | 85% | 20 ◦C | 100% | 1C | – | X (+) | – | – |
| [56] | NMC | 650 | 70% | 10 ◦C | 100% | 1C c; 1C, 2C, 3C d | X (+) | |||
| [14] | NMC | 300 | 60% | 25 ◦C, 60 ◦C | 100% | 1C | – | X (+) | X (+) | |
| [9] | NMC | 1500 | 43% | 30 ◦C | 100% | 0.5C | – | X (++) | X (+) | |
| [23] | NMC | 50 | 96% | Tamb | 100% | 0.5C | – | X (+) | – | |
| [59] | NMC | 3000 | 92%, 85% | 25 ◦C | 80%, | C/3 c; 1C d | X (+) | X (+) | X (+) | |
| 100% | ||||||||||
| [61] | NMC | 200, 1900 | 94%, 90% | 40 ◦C to -10 ◦C | 100% | EV profile | X (+) | X (++) | ||
| [20] | NCA | 5250 | 82% | 40 ◦C | 100% | 5C | X (+) | X (+) | X (++) | |
| [32] | NCA | 500 | 84% | 25 ◦C | 100% | C/2 c; 1C d | X (+) | X (+) | X (+) | |
| [62] | NCA | 120 | 70% | ≥ -10 ◦C | 100% | ≤3C | X (+) | X (+) | X (+) | |
| [24] | NCA | 400 | 75%, 72%, | 25 ◦C | 100% | 1C, | X (++) | X (+) | ||
| 64% | 2C, 3C | |||||||||
| [63] | NCA | 400 | 80% | Tamb | 100% | Pulses ≤ 83C | X (+) | X (+) | X (++) | – |
| [65] | NCA | 250 | – | 25 ◦C | 100% | 1C | X(++) | X(+) | X(+) | X(+) |
| [65] | NCA | 250 | – | 45 ◦C | 100% | 1C | X(+) | X(+) | X (+) | X(+) |
Table 4.
Correlation between impedance curve variations and degradation mechanisms. The cathode chemistry types are specified per each different EIS region. The region interested by a specific degradation mechanism is marked with the reference number of the related article. Specific notation is given for: * = the Mid-frequency region is described only with a singular semiarch; for half-cells or three-electrodes configuration:C measurement related to the cathode side; A measurement related to the anode side.
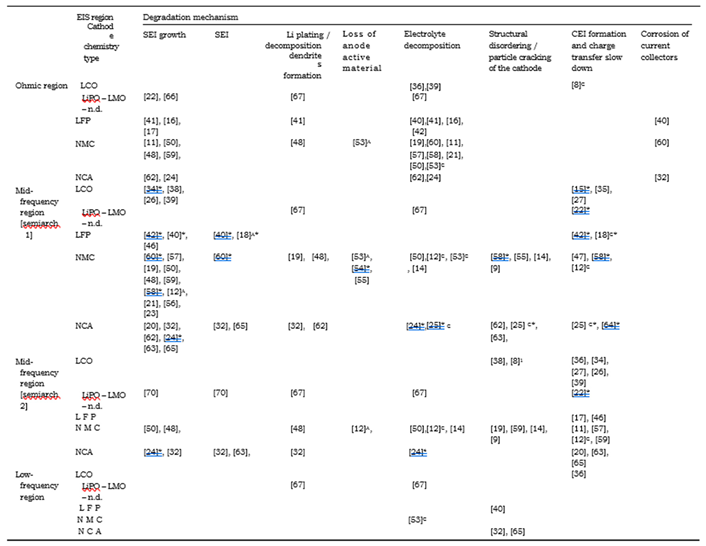 |
Table 5.
List of the ECMs used in the works under review. When half cells have been used, the label is added to the reference of the article with the name of the electrode used vs lithium. The model structure is given by using symbols and abbreviations: - = series connection; // = parallel connection; R = resistance; C = capacitance; CPE = constant phase element; W = Warburg element; Zarc = parallel circuit of resistance and constant phase element; RC = parallel circuit of resistance and capacitance; TLM = Transmission Line Model; HN = Havriliak and Negami element (generalized Zarc).
| Reference | Cathode chemistry | Mid-frequency region [0.1 Hz < f < 1000 Hz] | Low frequency region [f < 0.1 Hz] | Voltage source | |
|---|---|---|---|---|---|
| Semiarch 1 | Semiarch 2 | ||||
| [34] | LCO | RC | C//(R – CPE) | N | |
| [10] anode half cell | LCO | Zarc | Zarc | CPE | N |
| [10] cathode half cell | LCO | Zarc | C//(R – W) | N | |
| [35] | LCO | C//(R – W) | C//(R – W)//(R – W) | N | |
| [36] | LCO | RC | Z_composite_electrode | N | |
| [37] | LCO | RC-RC-RC | C//(R – W) | [Not measured] | N |
| [38] | LCO | Zarc | CPE//(R – W) – CPE//(R – W)//(R – W) | N | |
| [15] | LCO | Zarc | Zarc | N | |
| [8] cathode half cell | LCO | RC | RC | C//W | N |
| [26] | LCO | RC – RC – RC | W – C | N | |
| [39] | LCO | C//(RC-R) | RC | [Not in the model] | N |
| [66] | LiPO | Zarc | Zarc | CPE | N |
| [70] | n.d. | Zarc | Zarc | CPE | Y |
| [43] | LFP | (R – W)//C | Y | ||
| [44] | LFP | Zarc | Zarc | N | |
| [46] | LFP | Zarc | Zarc | W | N |
| [11] anode half cell | NMC | Zarc | Zarc – Zarc | [Not in the model] | N |
| [11] cathode half cell | NMC | Zarc | TLM | [Not in the model] | N |
| [47] | NMC | Zarc | Zarc | [Not in the model] | N |
| [21] | NMC | Zarc | Zarc | CPE | N |
| [12] anode half cell | NMC | Zarc | Zarc | W | N |
| [12] cathode half cell | NMC | Zarc | Zarc – CPE//(R – CPE) | N | |
| [51] | NMC | Zarc | Zarc | N | |
| [52] | NMC | Zarc | CPE//(R – W) – CPE//(R – W) | N | |
| [54,55] | NMC | RC – RC | RC – RC | W | N |
| [56] | NMC | Zarc | Zarc | W | Y |
| [56] | NMC | RC | RC | [Not in the model] | N |
| [57] | NMC | Zarc – Zarc | TLM | [Not in the model] | N |
| [58] | NMC | Zarc | CPE | [Not in the model] | N |
| [59] | NMC | HN | HN | W | N |
| [60] | NMC | Zarc | Zarc | [Not in the model] | N |
| [61] | NMC | RC | [Not in the model] | Y | |
| [20] positive electrode | NCA | RC | C//(R – W) | N | |
| [32] | NCA | Zarc | CPE//(R – W) | Y | |
| [62] | NCA | HN | HN | W | N |
| [63] | NCA | RC | Zarc | CPE | N |
| [65] | NCA | Zarc | CPE//(R – W) | N | |
Table 6.
Outcomes of the assessment of Section 4 and Section 5 by cross-referencing the information collected in Figure 7B and in Figure 7C. The table shows the most occurring degradation modes and the most used circuital elements for each re-gion of the EIS spectrum.
| EIS region | Ohmic region |
Mid-frequency region | Low-frequency region | |
|---|---|---|---|---|
| Degradation | Loss of | Loss of lithium inventory: 54% | Loss of | |
| mode | lithium | Loss of cathode active material: | cathode | |
| inventory: 78% | 42% | active material: | ||
| 57% | ||||
| Semiarch 1 | Semiarch 2 | |||
| Loss of Lithium | Loss of | |||
| inventory + | cathode | |||
| loss of anode | active | |||
| active material: | material: | |||
| 78% | 61% | |||
| Circuital | Resistor | Zarc element: 50% | Warburg | |
| element for | 100% | element: | ||
| ECM | 59% | |||
| Semiarch 1 | Semiarch 2 | |||
| Zarc element: | Zarc | |||
| 59% | element: | |||
| 50% | ||||
Disclaimer/Publisher’s Note: The statements, opinions and data contained in all publications are solely those of the individual author(s) and contributor(s) and not of MDPI and/or the editor(s). MDPI and/or the editor(s) disclaim responsibility for any injury to people or property resulting from any ideas, methods, instructions or products referred to in the content. |
© 2024 by the authors. Licensee MDPI, Basel, Switzerland. This article is an open access article distributed under the terms and conditions of the Creative Commons Attribution (CC BY) license (http://creativecommons.org/licenses/by/4.0/).
Copyright: This open access article is published under a Creative Commons CC BY 4.0 license, which permit the free download, distribution, and reuse, provided that the author and preprint are cited in any reuse.


