

Submitted:
10 April 2024
Posted:
15 April 2024
You are already at the latest version
Abstract
This paper explores the application of Random Matrix Theory (RMT) as a methodological enhancement for portfolio selection within financial markets. Traditional approaches to portfolio optimization often rely on historical estimates of correlation matrices, particularly susceptible to instability.
To address this challenge, we combine a data preprocessing technique based on the Hilbert transformation of returns with RMT to refine the accuracy and robustness of correlation matrix estimation. By contrasting empirical correlations with those derived from random matrices, we uncover non-random properties and underlying relationships within financial data. We then utilize this methodology to construct the correlation network dependence structure used in portfolio optimization. The empirical analysis presented in this paper validates the effectiveness of RMT in enhancing portfolio diversification and risk management strategies. This research contributes by offering investors and portfolio managers with methodological insights to construct portfolios that are more stable, robust, and diversified. At the same time, it advances our comprehension of the intricate statistical principles underlying multivariate financial data.
Keywords:
portfolio selection
; networks
; dependence structure
; Random Matrix Theory
; Hilbert Transformation
MSC: 91G10; 90C35; 90C05; 62P05
1. Introduction
Markowitz’s seminal paper [1] remains a cornerstone in practical portfolio management, despite facing challenges in out-of-sample analysis due to estimation errors in expected returns and the covariance matrix, as noted in [2,3,4,5,6]. To address these limitations, researchers have investigated the use of robust estimators aimed at providing more accurate and reliable measures of moments and co-moments. Robust estimators, designed to handle outliers and errors, enhance the robustness of portfolio optimization, leading to improved stability and performance, see [7,8,9].
In recent years, there has been a notable shift towards a novel approach known as the market graph for understanding the relationship between asset returns, departing from traditional covariance-based methods. This methodology represents assets as nodes and their relationships as edges in a graph, capturing the broader structure of the finacial market. Pioneering work by Mantegna [10] led to the construction of asset graphs using stock price correlations, revealing hierarchical organization within stock markets. Subsequent research conducted by [11] investigates stock network topology by examining return relationships, with the objective of revealing significant patterns inherent in the correlation matrix. Additionally, [12] introduced constraints based on asset connections in the correlation graph to encourage the inclusion of less correlated assets for diversification, employing assortativity from complex network analysis to guide the optimization process. Recent research explores innovative portfolio optimization techniques using clustering information from asset networks [13,14,15]. These approaches replace the classical Markowitz model’s correlation matrix with a correlation-based clustering matrix. In particular, in [15], a network-based approach is employed to model the financial market’s structure and interdependencies among asset returns. The authors construct a market graph capturing asset connections using various edge weights and introduce an objective function considering both individual security volatility and network connections. [13] proposed a unified Mixed-Integer Linear Programming (MILP) framework integrating clustering and portfolio optimization. Empirical results demonstrate the promising performance of the network-based portfolio selection approach, outperforming classical approaches relying solely on pairwise correlation between assets’ returns. Building upon the research outlined in [14,15], we introduce a novel framework that integrates Random Matrix Theory (RMT) into portfolio allocation procedures. Specifically, we employ a combination of the Hilbert transformation and RMT to estimate the correlation matrix. This approach enables us to effectively separate noise from significant correlations, enhancing the accuracy and robustness of the portfolio allocation process. On one hand, the Hilbert transformation technique is a data pre-processing method which we use to complexify the time series of returns, thus improving the effectiveness in detecting lead/lag correlations in time series data, as shown in [16,17,18]. On the other hand, RMT offers a robust denoising technique on the basis of the Marčenko-Pastur theorem, which describes the eigenvalue distribution of the covariance matrices [19,20,21]. As a result, we obtain a denoised version of the covariance matrix that captures the true underlying correlation structure more accurately and facilitating the computation of clustering coefficients to assess the interconnectedness of assets.
The method proposed is then tested on four equity portfolios, employing a Buy and Hold Rolling Window strategy with various in-sample and out-of-sample periods. The out-of-sample performances are then compared across different methods of estimating the dependence structure between assets, including sample estimates, shrinkage estimates, clustering coefficient, and RMT. Notably, employing the RMT method consistently results in superior out-of-sample performance compared to traditional methods across all portfolios and rolling window strategies. Furthermore, the analysis on transaction costs, measured by turnover, reveals that the RMT approach consistently led to lower portfolio turnover compared to other methods. This reduction in turnover translates to lower transaction costs and underscores the practical applicability of the RMT approach in portfolio management.
The paper is organized as follows: Section 2 introduces the basic notions of Hilbert transformation and RMT-based techniques. Section 3 offers a brief overview of existing portfolio selection models. Section 4 details the in-sample and out-of-sample protocols and analyzes the empirical outcomes. Finally, Section 5 discusses the paper’s key findings.
2. Random Matrix Theory
In the context of financial mathematics it has been established that extensive empirical correlation matrices exhibit significant noise, to the point where, with the exception of their principal eigenvalues and associated eigenvectors, they can be essentially treated as stochastic or random entities. Therefore, it is customary to denoise an empirical correlation matrix before its utilization. In this section, we will elucidate a denoising technique rooted in the principles of RMT where the fundamental result is the Marčenko-Pastur theorem, which describes the eigenvalue distribution of large random covariance matrices.
In the following we denote by the space of complex-valued matrices with dimensions . Let be an observation matrix where columns are the single observations for different n time series. Let be the empirical covariance matrix associated to X, i.e. 1. If is Hermitian (that is, the eigenvalues are real) we can define the empirical spectral distribution function as , where , for are the eigenvalues of . The distribution of the eigenvalues of a large random covariance matrix is actually universal, meaning that it follows a distribution independent of the underlying observation matrix as stated in the following Marčenko-Pastur theorem [19,20,21]:
Theorem 1
(Marčenko-Pastur, 1967). Suppose are i.i.d. random variables with mean 0 and variance . Suppose that as . Then, as , the empirical spectral distribution of the sample covariance converges almost surely in distribution to a nonrandom distribution, known as the Marčenko–Pastur law and denoted by whose probability distribution is:
where the first term represents a point mass with weight at the origin if and coincide with the lower and the upper edges of the eigenvalue spectrum.
Let us note that, under proper assumptions, the Marčenko-Pastur theorem remains valid for observations drawn from more general distributions, like fat-tailed distributions [22,23].
Utilizing the boundaries of the Marčenko-Pastur distribution within the eigenvalue spectrum facilitates distinguishing between information and noise, enabling the filtration of the sample correlation matrix. Consequently, it is expected that this filtered correlation matrix will provide more stable correlations compared to the standard sample correlation matrix.
2.1. Filtering Covariance by RMT
One can compare the theoretical density of the eigenvalues generated the by the Marčenko-Pastur theorem (in the following indicated as benchmark or null model) with the corresponding empirical one. Thus we can identify the number of empirical eigenvalues, possessing some known and easily interpretable characteristics, that significantly deviate from the null model. There are many methods for filtering the correlation matrix based on the RMT as proposed previously. Essentially, the approaches primarily involve suitable modification of the eigenvalues within the spectrum of the sample correlation matrix while simultaneously preserving its trace, as explained below.
The upper boundary of the Marčenko-Pastur density serves as a threshold for distinguishing the noisy component of . Eigenvalues of within the interval adhere to the random correlation matrix hypothesis and represent noise-associated eigenvalues, as well as those below . The rationale behind excluding the smallest deviating eigenvalues from these filters lies in the fact that, unlike large eigenvalues – which are separated from the Marčenko-Pastur (MP) upper bound – the same rationale does not always hold true for the smallest deviating eigenvalues. Typically, small eigenvalues can be situated beyond the lower edge of the spectrum, a pattern consistent with the finite dimension of the observed matrix . Furthermore, as emphasized in reference, there exists clear evidence about non-randomness and temporal stability of the eigenvectors corresponding to eigenvalues larger than . Such characteristics have not been consistently confirmed for the eigenvectors associated with the eigenvalues smaller than . Therefore, eigenvalues higher than can be regarded as “meaningful”. This leads to the following denoising method for the estimated covariance matrix : all the eigenvalues of lower than or equal to are replaced by a constant value either equal to the average value of the “noisy” eigenvalues (as in [24]) or equal to zero (as in [25])2. All the eigenvalues of strictly greater than are left unchanged.
In this paper, the eigenvalues of that fall in the range predicted by the Marčenko-Pastur distribution are set to zero. Then, to build the filtered covariance matrix , the following steps are undertaken: suppose there exist k relevant eigenvalues (i.e., higher than ); let us denote them by , and also consider the diagonal matrix of filtered eigenvalues . At this point, we use back in the eigendecomposition with the original eigenvectors, here denoted by V, so obtaining:
Finally, in order to preserve the trace of the original matrix and prevent system distortion, we adjust the main diagonal elements of the filtered matrix by replacing them with the sample variances of the portfolio components .
Remark 1.
When applying this method to portfolio selection, we will work with the correlation matrix. However, the Marčenko-Pastur law remains unchanged with the only difference that .
2.2. Hilbert Transformation
In this paper we use a data pre-processing technique based on Hilbert transformation of time series mainly applied in climatology, signal processing, fi–ce, and economics [16,17,18]. This technique is especially well-suited for detecting correlations with lead/lags, making it highly effective for time series exhibiting shifts in their co-movements.
Let us consider the panel of asset returns (i.e. portfolio) over time as and let us indicate with the complex series derived by Hilbert transforming the original time series as so that the real part of each component coincides with the original time series. The Hilbert transformation is a linear transformation defined [26] as the following integral:
where P indicates the Cauchy principal value; then the complexified sequence can then be written as:
As an example of the effect of the Hilbert transformation on the correlation matrix, let us consider two periodic signals defined as:
The correlation matrix between the two time series is:
from which it is clear how negligible is the correlation between the two time series. Meanwhile, after Hilbert transformations of the time-series the two complexified sequences have the following complex correlation matrix:
We note from (7) that the magnitude of the correlation is pretty high, as expected if one considers the lags to be just a lack of synchronicity and not a lack of co-movements. The behavior of the two correlation matrices is also evident if one plots the two time series in a real plane and in a Gauss plane, see Figure 1.
If we use the complexified data sequence then the Marčenko-Pastur law has to be modified replacing p with since the imaginary part of a complexified data sequence is not independent of its real part, being related by the Hilbert transformation [18].
Utilizing the Hilbert transformation, the covariance (cross-correlation) matrix is represented in a space where the eigenvectors’ components are spread across the complex plane. This facilitates identifying lead-lag relationships between components through angular disparities. The components of the complex covariance matrix can be denoted as follows:
where the absolute value of each element of the complex covariance matrix gives the strength of the correlation; meanwhile indicates the correlation in phase space. The leading or lagging behavior of each component is determined by , measuring to what extent the time series k leads the time series j.
We can break down the covariance (correlation) matrix as:
where is the diagonal matrix of insignificant eigenvalues, and denote the principal and noisy components of the correlation matrix, respectively.
In the context of portfolio allocation, the Hilbert transformation technique proves valuable for identifying lead/lag correlations in the performance of different assets over time. This allows investors to uncover temporal patterns and optimize portfolio strategies by understanding the timing of movements in asset values. Essentially, it helps to discern how changes in one asset’s value relate to shifts in another asset, leading to more informed and dynamic portfolio decision-making.
3. Portfolio Selection Models
In this section, we explore the nuances of asset allocation problems. We begin by outlining the classical portfolio model, inspired by Markowitz’s foundational work, which employs the variance/covariance matrix to analyze the interdependencies among asset returns, typically estimated through a sample approach. Following this, we describe the approach rooted in network theory (see [15]), offering a novel perspective on portfolio optimization. As also observed in recent studies [18,27] across various fields of economic literature, this methodological approach presents a modern and sophisticated way to addressing challenges in traditional portfolio selection processes. It aims to unveil an optimal solution by using the interconnected relationships among different assets. Finally, we explore the application of RMT in the portfolio selection model, focusing particularly on the minimum variance portfolio.
3.1. Traditional Global Minimum Variance Portfolio
The classical Global Minimum Variance (GMV) approach is designed to optimize portfolio allocation by determining the fractions of a given capital to be invested in each asset i from a predetermined basket of assets. The objective is to minimize the portfolio risk, identified through its variance. In this context, n represents the number of available assets, symbolizes the random variable of daily returns of the i-th asset and is the sample covariance matrix. The GMV strategy is formulated as follows:
where is a vector of ones of length n and is the vector of the fractions invested in each asset. The first equation is the budget constraint and requires that the whole capital should be invested. Conditions , preclude the possibility of short selling3. It is evident that the dependence structure between assets, in [1], is assessed through the Pearson correlation coefficient between each pair of asset.
The process of estimating covariance matrices from samples is widely recognized for its susceptibility to noise and high estimation error. This introduces uncertainty and instability when attempting to estimate the true covariance structure, which frequently results in suboptimal performance of portfolios when applied out-of-sample. Portfolios based on unreliable covariance structures may exhibit increased volatility, high risk, and compromised returns. Therefore, ensuring precise and stable covariance estimates is crucial for enhancing the robustness and effectiveness of portfolio optimization models in real-world applications.
3.2. Asset Allocations through Network-Based Clustering Coefficients
To address the challenges of estimating the dependence structure and improve the reliability of covariance matrix estimation, network theory has recently been applied in portfolio allocation models. Here we employ network theory to enhance the reliability of covariance matrix estimation in portfolio allocation. This approach involves representing financial assets through an undirected graph , where V is the set of nodes representing assets, and E is the set of edges denoting dependencies or connections between assets. The weights of the edges are represented by the Pearson correlation matrix , .
At this point, problem (9) is transformed in the following:
where H is a matrix obtained as described below. First, we create a binary undirected adjacency matrix A, associated to the filtered (complex) correlation matrix obtained through the techniques explained in Section 2. The binarization process4 is assessed with the following threshold criteria: for every
where are the elements of the filtered correlation matrix.
Second, we calculate for each node i the clustering coefficient as proposed in [28] for binary and weighted graphs.
4. Empirical Protocol and Performance Analysis
In this section, we delineate the empirical protocol employed in this paper and subsequently apply it to assess the effectiveness of the proposed approach through empirical applications. To test the robustness and mitigate data mining bias we analyze four energy portfolios, as will be explained in Subsection 4.3.
In portfolio allocation models, in-sample and out-of-sample analyses are crucial components for assessing the performance and robustness of the strategies. The analysis of portfolio strategies centers around key criteria, including portfolio diversification, transaction costs, and risk-return performance measures. This examination is conducted using a rolling window methodology characterized by an in-sample period of length l and an out-of-sample period of length m.
This methodology begins by computing optimal weights during the initial in-sample window spanning from time to . These optimal weights remain unchanged during the subsequent out-of-sample period, extending from to . Then the returns and performance metrics for this out-of-sample period are calculated. This process iterates by advancing both the in-sample and out-of-sample periods by m-steps. With each iteration, the weights are recalculated and portfolio performance is evaluated until the end of the dataset.
4.1. Diversification and Transaction Costs: In-Sample Analysis
We assess the performance of the obtained portfolios by analysing diversification and transaction costs, both of which play a crucial role in effective portfolio management. Diversification represents a fundamental risk management tool that seeks to optimize returns while minimizing exposure to undue risks associated with concentrated holdings. This is essential to mitigate risk and enhance the stability of an investment portfolio. By holding a diversified set of assets with potentially uncorrelated returns, investors aim to achieve a balance between risk and return. In this paper as a measure of diversification we use the modified Herfindahl index, defined as:
where represents the vector of optimal weights. The index ranges from 0 to 1, where the value 0 is reached in case of the EW portfolio (deemed as the most diversified one) and the value of 1 indicates a portfolio concentrated in only one asset.
The second index used in this analysis is related to transaction costs which have a direct impact on portfolio performances: higher transaction costs lead to lower returns. Understanding and minimizing transaction costs is an integral component of effective portfolio management, ensuring that investment decisions are cost-efficient and align with the investor’s goals. By addressing these aspects, investors can enhance the overall competitiveness and sustainability of their investment strategies. In this paper as a proxy for transaction costs we use portfolio turnover, denoted as and computed as:
here, and are the optimal portfolio weights of the asset, respectively, before and after rebalancing (based on the optimization strategy). Higher turnover often comes with increased transaction costs. Monitoring turnover is crucial for understanding the level of trading activity and its impact on the portfolio’s performance. In particular, a lower turnover percentage indicates that the portfolio has experienced relatively minimal changes in asset weights. This might be indicative of a more stable managed portfolio.
4.2. Performance Measurements: Out-of-Sample Analysis
Analyzing risk-adjusted performance measures for different allocation methods is essential as it evaluates the portfolio’s success in generating returns relative to the level of risk assumed. By examining metrics like the Sharpe Ratio and Omega Ratio, investors gain valuable insights into how effectively a portfolio balances risk and return. This analysis assists investors to select the best approach that delivers favorable returns while aligning with their risk tolerance.
Here, we briefly recap the definitions of the risk-adjusted performance measures used in the empirical part of this paper to compare the different models under analysis. The Sharpe Ratio () is defined as:
where indicates the out-of-sample portfolio returns (obtained using the rolling window methodology) and denotes the risk-free rate5. This ratio indicates the mean excess return per unit of overall risk. The portfolio with the highest is typically considered the best, especially in cases of positive portfolio excess returns concerning the risk-free rate.
The Omega Ratio , introduced in [29], is defined as:
where is a specified threshold. Returns above the threshold are considered gains by investors, while those below are considered as losses. An greater than 1 suggests that the portfolio provides more expected gains than expected losses. The choice of threshold can vary, and in our empirical analysis, it is set to 0.
4.3. Data Description and Empirical Results
In this empirical analysis, we examine four equity indexes, sourcing our data from Bloomberg. The selected indexes are as follows: (i) the Nasdaq 100 index; (ii) the energy sector of the S&P500 index, which focuses only on the energy companies; (iii) the Dow Jones Industrial Average index; (iv) the benchmark stock market index of the Bolsa de Madrid.
We construct each portfolio by including only those components listed in the specified index from January 2, 2014 to January 19, 2024. Detailed information regarding the Bloomberg tickers of the selected assets in each portfolio can be found in Appendix A. The dataset for each portfolio is composed of 2622 daily observations spanning from January 2, 2014, to January 19, 2024.
As detailed in Section 3, we address optimization problems (9) and (10), both of which account for the dependence structure in constructing the optimal portfolio. In problem (9), this structure is captured by the covariance matrix , which is estimated using both the sample and the shrinkage approaches. Conversely, in (10) the dependence structure is represented by the matrix H, leveraging the clustering coefficient method as outlined in [15] and along with the approach proposed in Section 2 (utilizing Hilbert transformation and RMT).
To evaluate the performances of the approaches considered in this paper, we employ four distinct buy-and-hold rolling window methodologies: the first three are 6, 12 or 24 months in-sample and 1 month out-of-sample; the last one is 24 months in-sample and 2 months out-of-sample.
After obtaining the out-of-sample returns for each approach under analysis, we then proceed to compute their respective out-of-sample performances. Figure 2 illustrates the out-of-sample performances of the four portfolios under analysis, specifically for the rolling window methodology of 6 months in-sample and 1 month out-of-sample6.
Observing Figure 2, it becomes clear that across all portfolios under analysis and in case of rolling window methodology with 6 months in-sample and 1 month out-of-sample the CC-RMT strategy exhibits superior out-of-sample performance compared to the “Sample”, “Shrink”, and “CC” strategies. This finding holds true for the other rolling window methodologies as well. However, relying solely on the out-of-sample performance as a singular index may not provide a comprehensive evaluation of the various investment strategies under analysis. This limitation arises because out-of-sample performance prioritizes returns overlooking the aspect of evaluating risk.
Therefore, a more comprehensive assessment requires the consideration of both return and risk metrics to understand the inherent risk-return trade-off in each strategy. Table 1 displays key out-of-sample statistics, including the first four moments, , and , for the portfolios under analysis across the four rolling window methodologies considered. While the first four moments may not clearly indicate which strategy performs better due to potential inconsistencies in mean, skewness, standard deviation, and kurtosis, a different picture emerges when examining risk-adjusted performance measures like the and . In particular, the CC-RMT strategy consistently exhibits superior risk-adjusted performance across all portfolios and rolling windows considered.
In contrast to more traditional methods, the CC-RMT strategy seems to effectively capture the complex interdependencies and structural patterns within the financial markets, providing a more accurate representation of the market dynamics. Moreover, the two network approaches (CC and CC-RMT) yield differing outcomes. Although both employ the clustering coefficient to measure the dependence structure, they differentiate for the threshold criteria used in the binarization process of the correlation adjacency matrix. Unlike our approach, the authors in [15] do not employ the Hilbert transformation of time series or the RMT filtering method to identify significant correlations exclusively. Instead, they consider different thresholds on correlation levels to generate multiple binary adjacencies matrices and compute the corresponding clustering coefficient of nodes. Finally, they compute the average clustering coefficient for each node to derive the interconnectedness matrix as outlined in Equation (12).
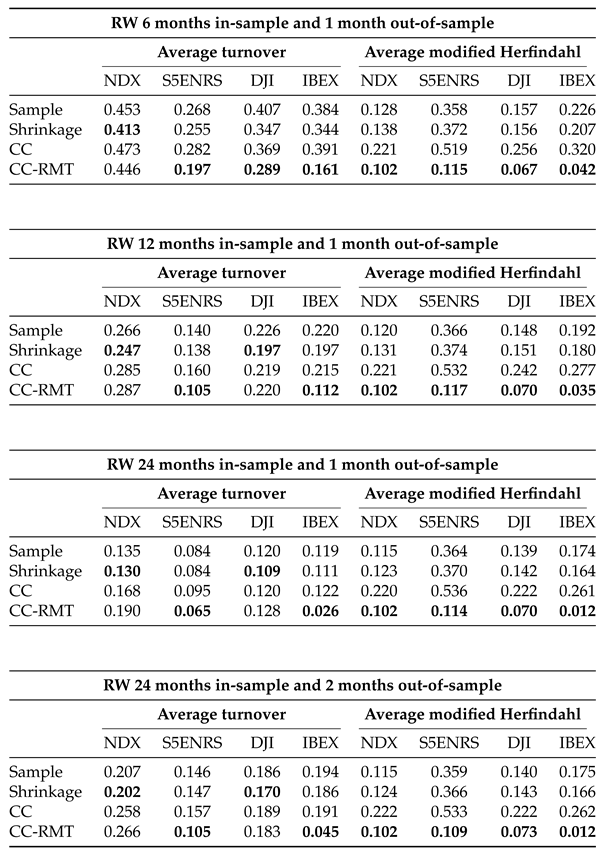
Considering transaction costs is crucial in practical portfolio management, as excessive turnover can erode returns. As mentioned earlier, this study evaluates transaction costs by using turnover as a proxy. Figure 3 illustrates the turnover values in each rebalancing period for the four portfolios under examination, employing a rolling window of 6 months in-sample and 1 month out-of-sample. The figure clearly indicates that CC-RMT consistently yield lower portfolio turnover. To provide a comprehensive overview of portfolio turnover, Table 2 presents the average turnover for the four portfolios across all considered rolling windows. These results consistently highlight that CC-RMT tends to produce portfolios with lower turnover, leading to reduced transaction costs.
We have additionally computed the modified Herfindahl index as a proxy for assessing portfolio diversification. Due to space limitations, the average modified Herfindahl index for the analyzed portfolios and rolling window methodologies is presented on the right-hand side of Table 2. Notably, the findings reveal that the CC-RMT approach consistently produces a lower modified Herfindahl index, indicating a more diversified portfolio. This observation highlights the contribution of the CC-RMT model to enhancing diversification within the portfolio, a crucial aspect of effective risk management.
5. Discussions
This study introduces a novel method for estimating the dependence structure, a critical aspect in portfolio selection. It leverages the Hilbert transformation technique for data preprocessing to improve the identification of lead/lag correlations in return time series. Following this, it applies principles from Random Matrix Theory (RMT) to differentiate between noise and meaningful information in the covariance matrix. By integrating these two techniques, the study enables a more accurate and resilient estimation of the portfolio allocation process. The proposed approach aims to obtain a denoised version of the dependence structure, capturing the genuine connections between assets more precisely. The empirical analysis demonstrates that the resulting CC-RMT model not only reduces transaction costs, as evidenced by lower turnover, and enhances portfolio diversification by decreasing the modified Herfindahl index, but also excels in risk-adjusted performance measures. Across different portfolios and rolling windows, the CC-RMT strategy consistently exhibits superior risk-adjusted performance compared to other approaches, including the sample, shrinkage, and clustering coefficient strategies (as discussed in [15]). The CC-RMT model provides investors with a clearer understanding of market dynamics, offering a well-informed framework for making investment decisions. This research significantly contributes to portfolio management by providing insights into the underlying structures and dynamics of investments. It assists investors in making smarter and more effective investment decisions by providing valuable insights and guiding them towards strategies that are better adjusted for risk.
Author Contributions
Conceptualization, F.V., A.H., E.M.; methodology, F.V., A.H., E.M.; software, F.V., A.H., E.M.; validation, F.V., A.H., E.M.; formal analysis, F.V.,A.H., E.M.; investigation, F.V., A.H., E.M.; resources, F.V., A.H., E.M.; data curation, F.V., A.H., E.M.; writing—original draft preparation, F.V., A.H., E.M. ; writing—review and editing, F.V., A.H., E.M.; visualization, F.V., A.H., E.M.; supervision, F.V.,A.H., E.M.; project administration, F.V., A.H., E.M.. All authors have read and agreed to the published version of the manuscript.
Data Availability Statement
The mobility datasets presented in this article are not readily available. Requests to access the datasets should be directed to Bloomberg Professional Services at https://www.bloomberg.com/professional.
Acknowledgments
F.V., A.H., E.M. want to acknowledge to be a member of GNAMPA-INdAM.
Conflicts of Interest
The authors declare no conflicts of interest.
Abbreviations
The following abbreviations are used in this manuscript:
| RMT | Random Matrix Theory |
| GMV | Global Minimum Variance |
| HI | Herfindahl index |
| OR | Omega Ratio |
| SR | Sharp Ratio |
| CC | Clustering Coefficient approach |
| CC-RMT | Clustering Coefficient via Random Matrix Theory approach |
Appendix A

Table A1.
This table reports the selected components of the four portfolios under analysis.
| IBEX-P | DJI-P | SP5ENRS-P | NDX-P |
|---|---|---|---|
| IBE SM Equity | UNH UN Equity | OXY UN Equity | AMZN UW Equity |
| SAN SM Equity | MSFT UQ Equity | OKE UN Equity | CPRT UW Equity |
| BBVA SM Equity | GS UN Equity | CVX UN Equity | IDXX UW Equity |
| TEF SM Equity | HD UN Equity | COP UN Equity | CSGP UW Equity |
| REP SM Equity | AMGN UQ Equity | XOM UN Equity | CSCO UW Equity |
| ACS SM Equity | MCD UN Equity | PXD UN Equity | INTC UW Equity |
| RED SM Equity | CAT UN Equity | VLO UN Equity | MSFT UW Equity |
| ELE SM Equity | BA UN Equity | SLB UN Equity | NVDA UW Equity |
| BKT SM Equity | TRV UN Equity | HES UN Equity | CTSH UW Equity |
| ANA SM Equity | AAPL UQ Equity | MRO UN Equity | BKNG UW Equity |
| NTGY SM Equity | AXP UN Equity | WMB UN Equity | ADBE UW Equity |
| MAP SM Equity | JPM UN Equity | CTRA UN Equity | ODFL UW Equity |
| IDR SM Equity | IBM UN Equity | EOG UN Equity | AMGN UW Equity |
| ACX SM Equity | WMT UN Equity | EQT UN Equity | AAPL UW Equity |
| SCYR SM Equity | JNJ UN Equity | HAL UN Equity | ADSK UW Equity |
| COL SM Equity | PG UN Equity | CTAS UW Equity | |
| MEL SM Equity | MRK UN Equity | CMCSA UW Equity | |
| MMM UN Equity | KLAC UW Equity | ||
| NKE UN Equity | PCAR UW Equity | ||
| DIS UN Equity | COST UW Equity | ||
| KO UN Equity | REGN UW Equity | ||
| CSCO UQ Equity | AMAT UW Equity | ||
| INTC UQ Equity | SNPS UW Equity | ||
| VZ UN Equity | EA UW Equity | ||
| FAST UW Equity | |||
| ANSS UW Equity | |||
| GILD UW Equity | |||
| BIIB UW Equity | |||
| LRCX UW Equity | |||
| TTWO UW Equity | |||
| VRTX UW Equity | |||
| PAYX UW Equity | |||
| QCOM UW Equity | |||
| ROST UW Equity | |||
| SBUX UW Equity | |||
| INTU UW Equity | |||
| MCHP UW Equity | |||
| MNST UW Equity | |||
| ORLY UW Equity | |||
| ASML UW Equity | |||
| SIRI UW Equity | |||
| DLTR UW Equity |
References
- Markowitz, H. Portfolio selection. The journal of finance 1952, 7, 77–91. [Google Scholar]
- Chopra, V.K.; Ziemba, W.T. The effect of errors in means, variances, and covariances on optimal portfolio choice. In Handbook of the fundamentals of financial decision making: Part I; World Scientific, 2013; pp. 365–373.
- Jobson, J.D.; Korkie, B. Estimation for Markowitz efficient portfolios. Journal of the American Statistical Association 1980, 75, 544–554. [Google Scholar] [CrossRef]
- Merton, R.C. On estimating the expected return on the market: An exploratory investigation. Journal of financial economics 1980, 8, 323–361. [Google Scholar] [CrossRef]
- Chung, M.; Lee, Y.; Kim, J.H.; Kim, W.C.; Fabozzi, F.J. The effects of errors in means, variances, and correlations on the mean-variance framework. Quantitative Finance 2022, 22, 1893–1903. [Google Scholar] [CrossRef]
- Kolm, P.N.; Tütüncü, R.; Fabozzi, F.J. 60 years of portfolio optimization: Practical challenges and current trends. European Journal of Operational Research 2014, 234, 356–371. [Google Scholar] [CrossRef]
- Ledoit, O.; Wolf, M. Robust performance hypothesis testing with the Sharpe ratio. Journal of Empirical Finance 2008, 15, 850–859. [Google Scholar] [CrossRef]
- Martellini, L.; Ziemann, V. Improved estimates of higher-order comoments and implications for portfolio selection. The Review of Financial Studies 2009, 23, 1467–1502. [Google Scholar] [CrossRef]
- Hitaj, A.; Zambruno, G. Are Smart Beta strategies suitable for hedge fund portfolios? Review of Financial Economics 2016, 29, 37–51. [Google Scholar] [CrossRef]
- Mantegna, R.N. Hierarchical structure in financial markets. The European Physical Journal B-Condensed Matter and Complex Systems 1999, 11, 193–197. [Google Scholar] [CrossRef]
- Onnela, J.P.; Kaski, K.; Kertész, J. Clustering and information in correlation based financial networks. The European Physical Journal B 2004, 38, 353–362. [Google Scholar] [CrossRef]
- Ricca, F.; Scozzari, A. Portfolio optimization through a network approach: Network assortative mixing and portfolio diversification. European Journal of Operational Research 2024, 312, 700–717. [Google Scholar] [CrossRef]
- Puerto, J.; Rodríguez-Madrena, M.; Scozzari, A. Clustering and portfolio selection problems: A unified framework. Computers & Operations Research 2020, 117, 104891. [Google Scholar]
- Clemente, G.P.; Grassi, R.; Hitaj, A. Smart network based portfolios. Annals of Operations Research 2022, 316, 1519–1541. [Google Scholar] [CrossRef]
- Clemente, G.P.; Grassi, R.; Hitaj, A. Asset allocation: new evidence through network approaches. Annals of Operations Research 2021, 299, 61–80. [Google Scholar] [CrossRef]
- Granger, C.W.J.; Hatanaka, M. Spectral Analysis of Economic Time Series.(PSME-1); Princeton university press, 2015.
- Rasmusson, E.M.; Arkin, P.A.; Chen, W.Y.; Jalickee, J.B. Biennial variations in surface temperature over the United States as revealed by singular decomposition. Monthly Weather Review 1981, 109, 587–598. [Google Scholar] [CrossRef]
- Aoyama, H. Macro-econophysics : new studies on economic networks and synchronization; Cambridge University Press: Cambridge, UK New York, NY, 2017. [Google Scholar]
- Pastur, L.; Martchenko, V. The distribution of eigenvalues in certain sets of random matrices. Math. USSR-Sbornik 1967, 1, 457–483. [Google Scholar]
- Paul, D.; Aue, A. Random matrix theory in statistics: A review. Journal of Statistical Planning and Inference 2014, 150, 1–29. [Google Scholar] [CrossRef]
- Bai, Z.; Silverstein, J.W. Spectral analysis of large dimensional random matrices; Vol. 20, Springer, 2010.
- Biroli, G.; Bouchaud, J.P.; Potters, M. On the top eigenvalue of heavy-tailed random matrices. Europhysics Letters (EPL) 2007, 78, 10001. [Google Scholar] [CrossRef]
- Bouchaud, J.P.; Potters, M. Financial applications of random matrix theory: a short review. The Oxford Handbook of Random Matrix Theory 2015, pp.823–850. [CrossRef]
- Laloux, L.; Cizeau, P.; Potters, M.; Bouchaud, J.P. Random Matrix Theory and Financial Correlations. International Journal of Theoretical and Applied Finance 2000, 03, 391–397. [Google Scholar] [CrossRef]
- Plerou, V.; Gopikrishnan, P.; Rosenow, B.; Amaral, L.A.N.; Guhr, T.; Stanley, H.E. Random matrix approach to cross correlations in financial data. Physical Review E 2002, 65. [Google Scholar] [CrossRef]
- Poularikas, A.D.; Grigoryan, A.M. Transforms and applications handbook; CRC press, 2018.
- Guerini, M.; Vanni, F.; Napoletano, M. E pluribus, quaedam. Gross domestic product out of a dashboard of indicators. Italian Economic Journal 2024, 1–16. [Google Scholar]
- Watts, D.J.; Strogatz, S.H. Collective dynamics of ‘small-world’networks. Nature 1998, 393, 440. [Google Scholar] [CrossRef]
- Keating, C.; Shadwick, W.F. A Universal Performance Measure. Technical report, The Finance development center, London, 2002.
| 1 |
is the adjoint matrix of X. |
| 2 | Both methods have the advantage to preserve the trace of while eliminating the non meaningful eigenvalues. |
| 3 | As well-known, a closed-form solution of the GMV problem exists if short selling is allowed. |
| 4 | Binarization is often used to simplify the analysis of networks by reducing them to binary representations. After applying the binarization process to the entire adjacency matrix is transformed into a binary adjacency matrix where each entry is either 0 or 1, representing the absence or presence of an edge, respectively, based on the chosen threshold. |
| 5 | In our empirical analysis, we adopt a constant risk-free rate, set to zero, following the approach used in [9]. |
| 6 | Please note that, due to space limitations, we have omitted the out-of-sample performances for the other rolling window methodologies. Nevertheless, this information is readily available upon request to the corresponding author. |
Figure 1.
Example of two periodic time series shifted by . (a) original time series and (b) the two complexified time series by Hilbert transformation in a complex plane.
Figure 1.
Example of two periodic time series shifted by . (a) original time series and (b) the two complexified time series by Hilbert transformation in a complex plane.
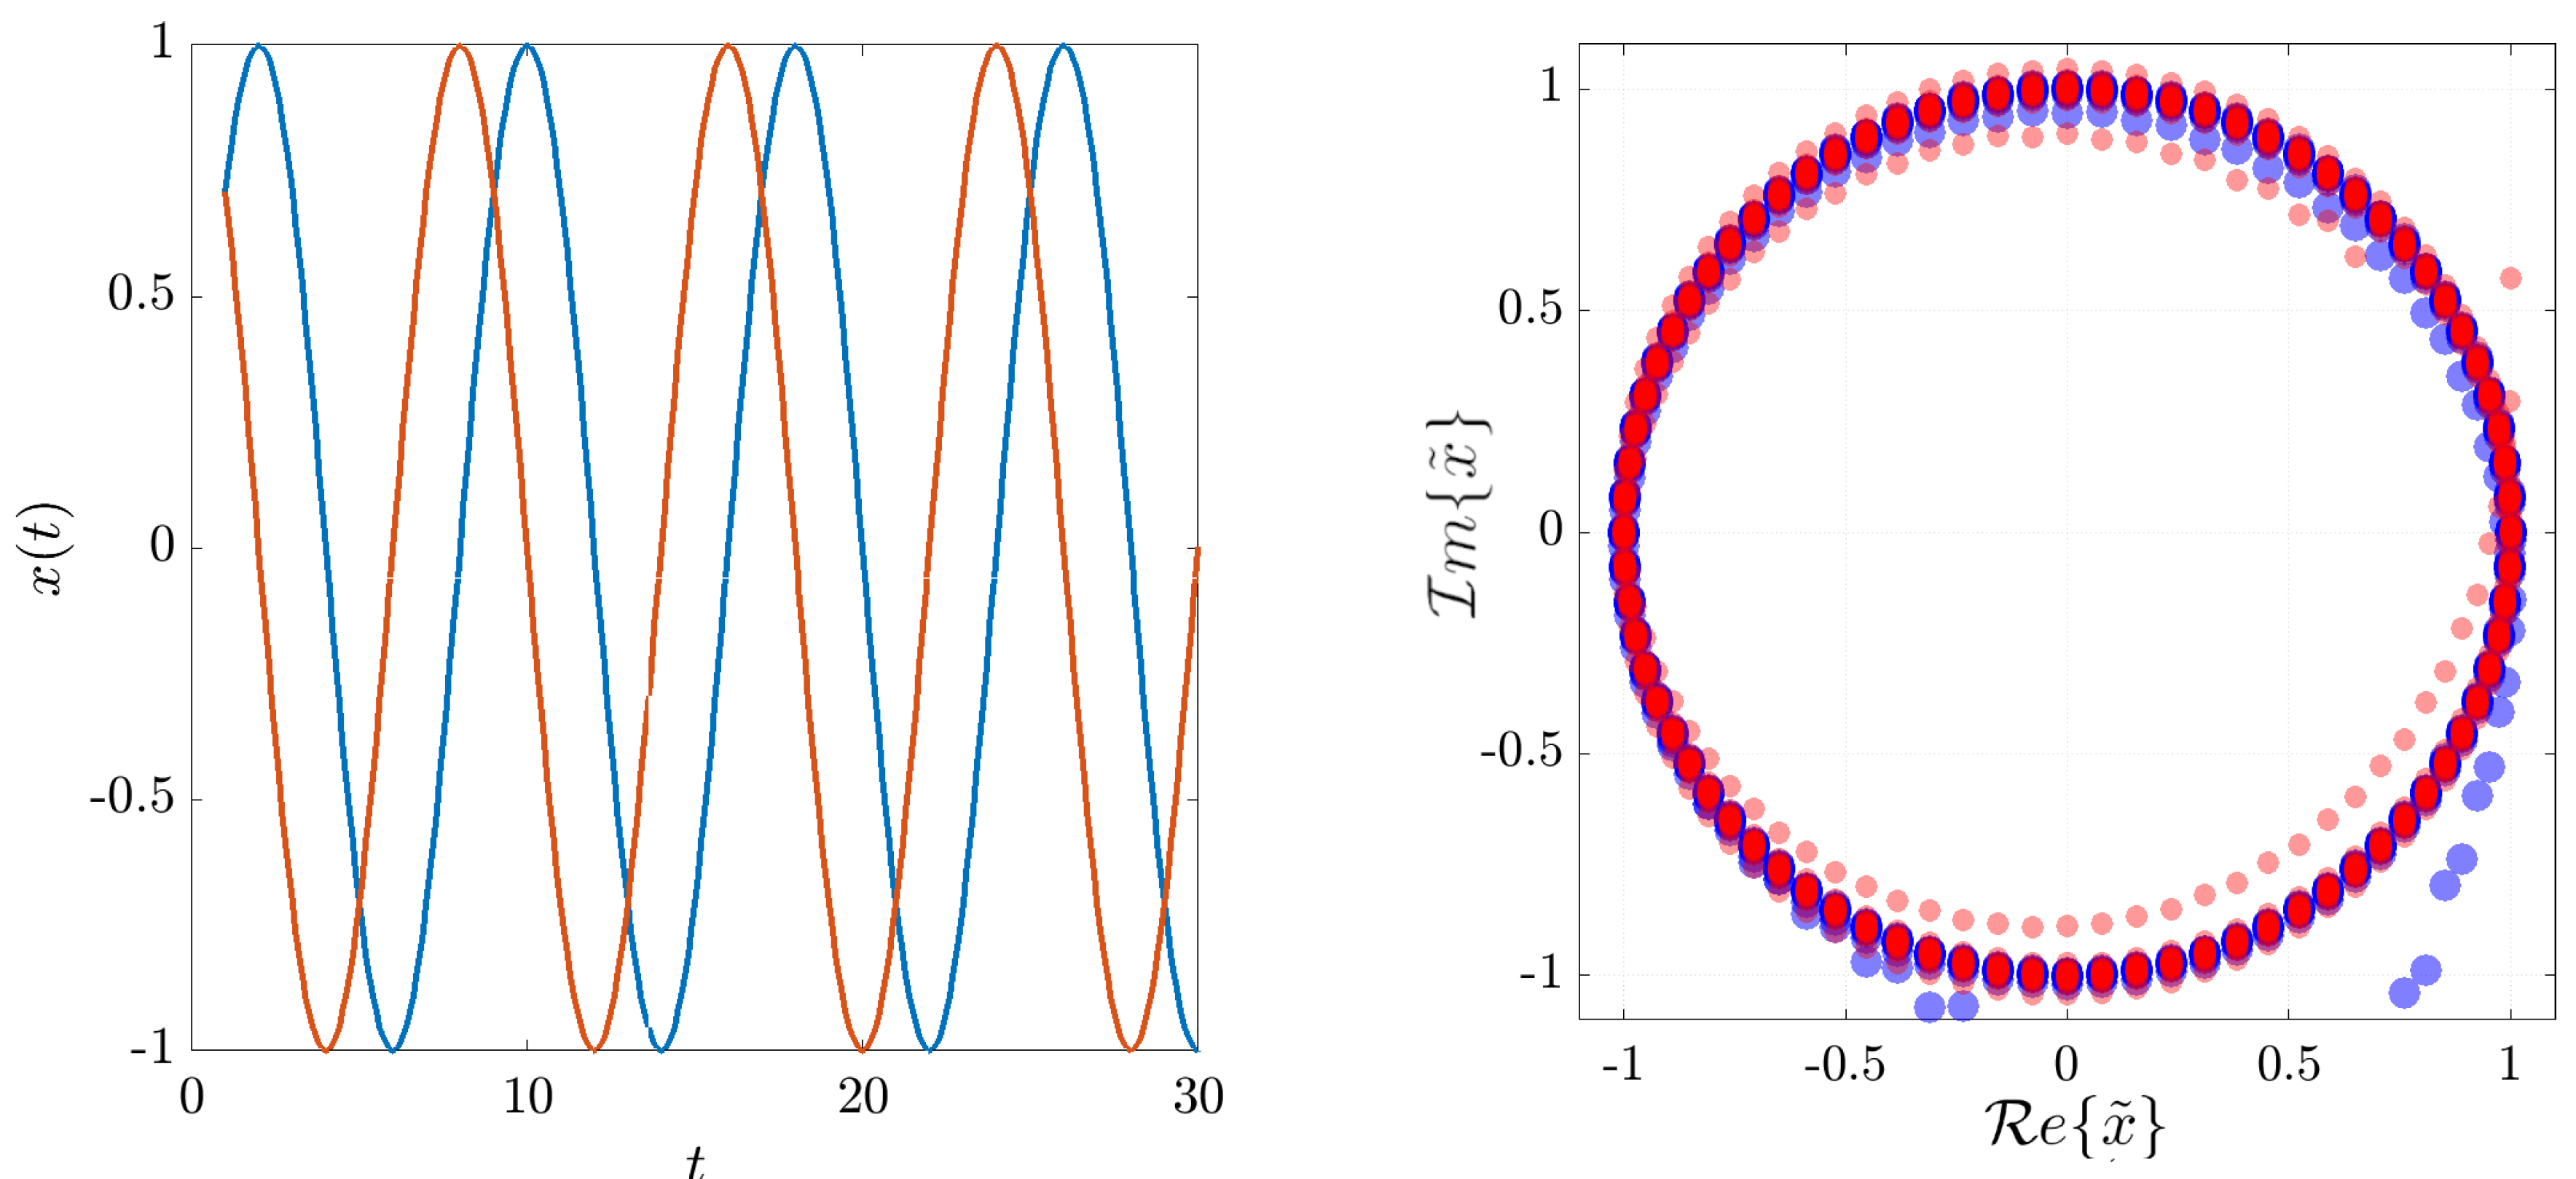
Figure 2.
Out-of-sample performance using the rolling window methodology with 6 months in-sample and 1 month out-of-sample.
Figure 2.
Out-of-sample performance using the rolling window methodology with 6 months in-sample and 1 month out-of-sample.
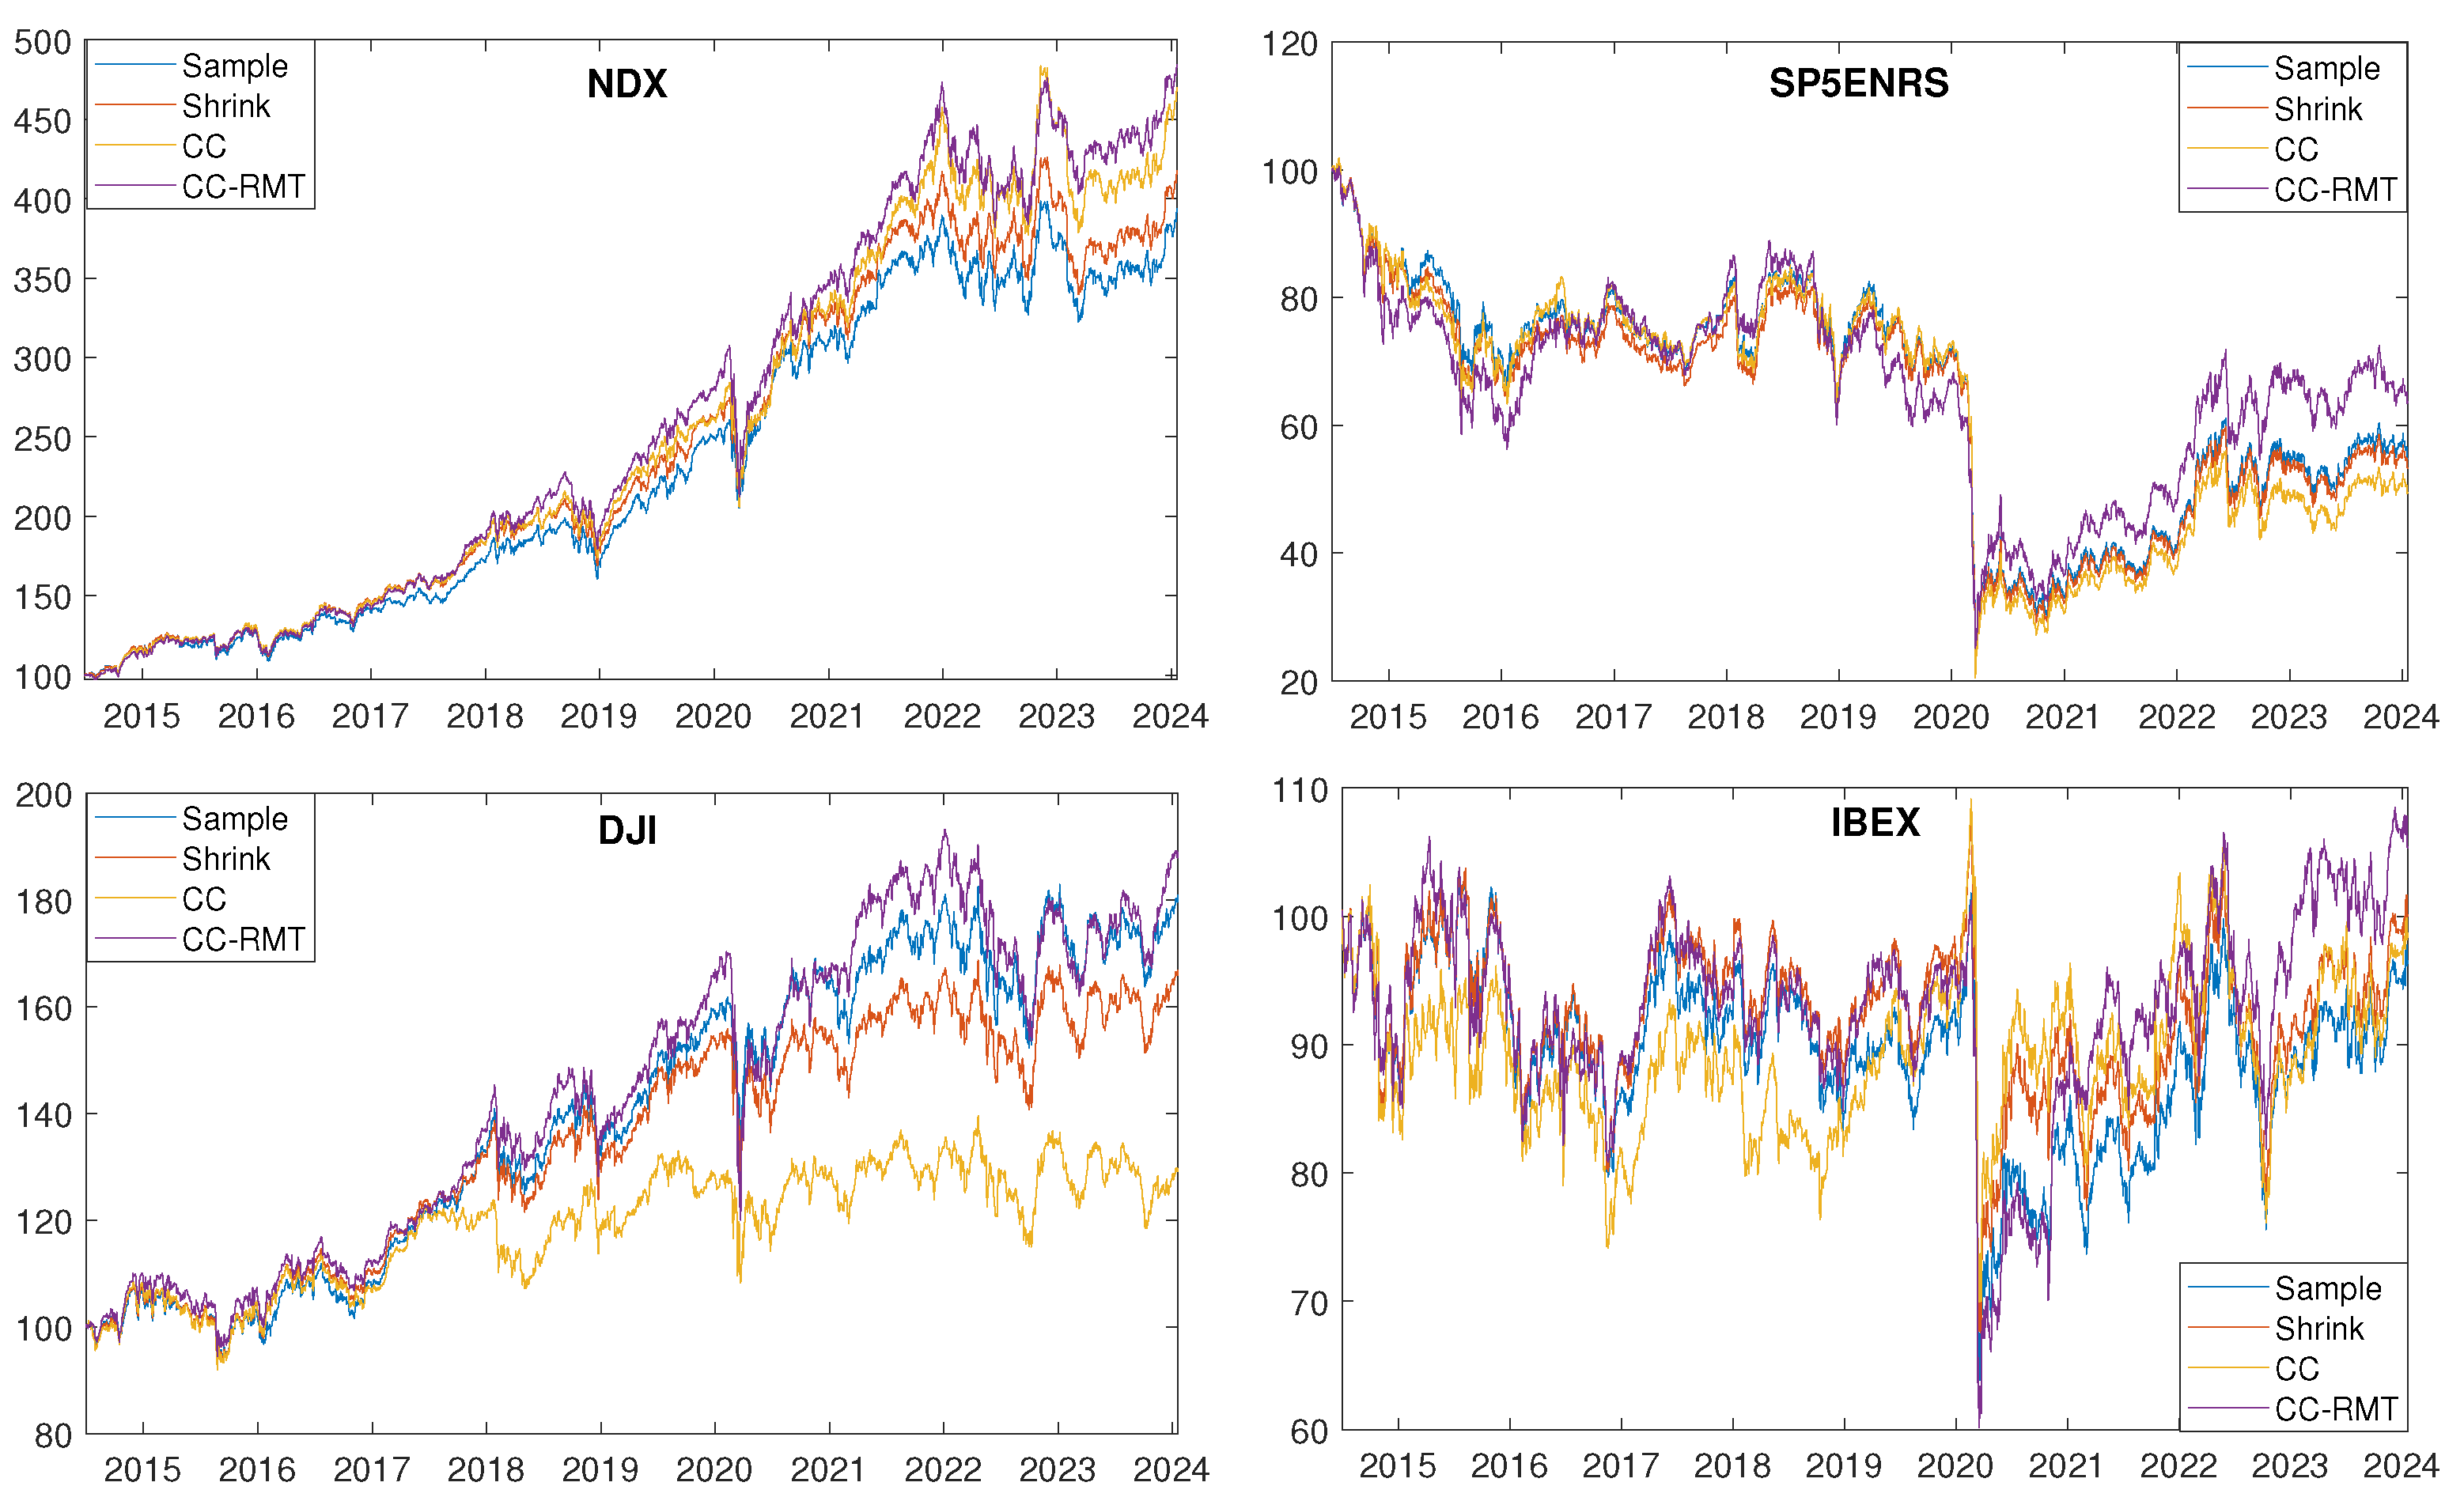
Figure 3.
Portfolio turnovers using the rolling window methodology with 6 months in-sample and 1 month out-of-sample.
Figure 3.
Portfolio turnovers using the rolling window methodology with 6 months in-sample and 1 month out-of-sample.
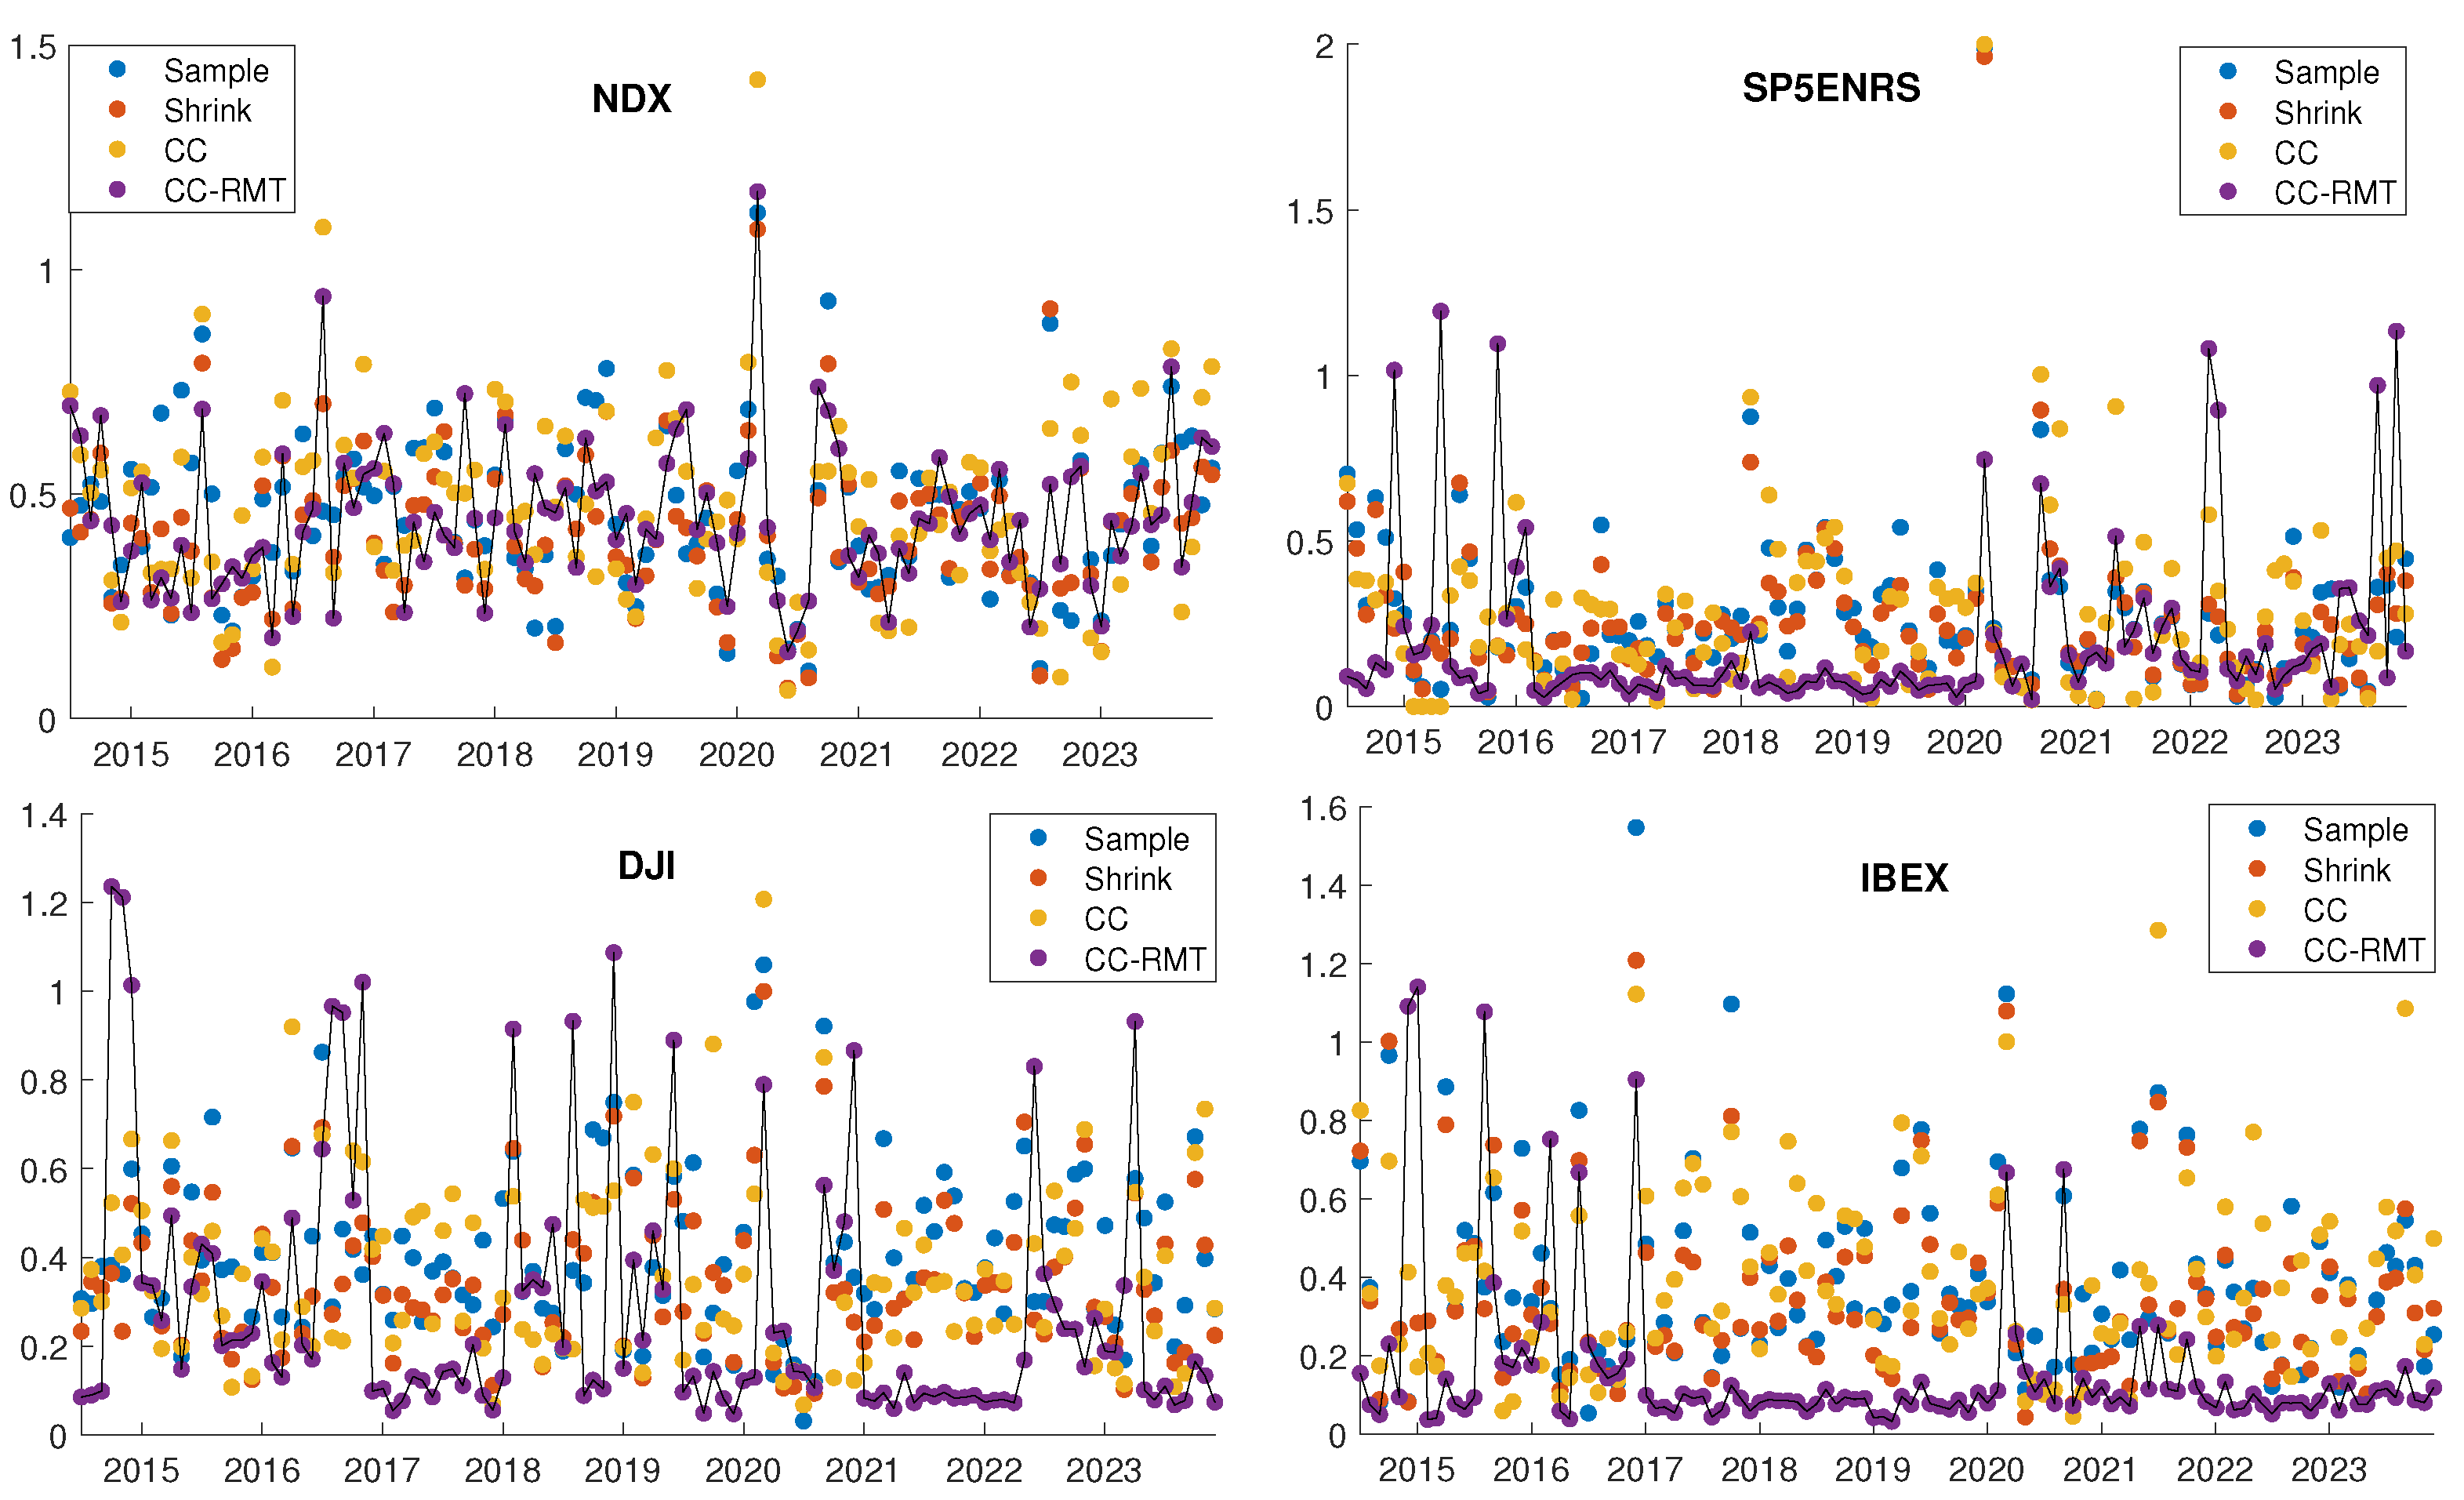
Table 1.
Out-of-sample statistics for the various portfolios and the four strategies under analysis are reported for each rolling window methodology. Mean, standard deviation, and Sharpe ratio are provided on an annual basis. The best strategy for each computed statistic is emphasized in bold. The cells corresponding to negative Sharpe ratios are left blank.
Table 1.
Out-of-sample statistics for the various portfolios and the four strategies under analysis are reported for each rolling window methodology. Mean, standard deviation, and Sharpe ratio are provided on an annual basis. The best strategy for each computed statistic is emphasized in bold. The cells corresponding to negative Sharpe ratios are left blank.
| RW 6 months in-sample, 1 month out-of-sample | ||||||||||||
|---|---|---|---|---|---|---|---|---|---|---|---|---|
| NDX | S5ENRS | |||||||||||
| skewness | kurtosis | skewness | kurtosis | |||||||||
| Sample | 0.150 | 0.158 | -0.388 | 12.404 | 0.953 | 1.193 | -0.020 | 0.278 | -2.044 | 54.406 | – | 0.985 |
| Shrinkage | 0.156 | 0.158 | -0.421 | 13.869 | 0.989 | 1.203 | -0.023 | 0.278 | -2.027 | 53.787 | – | 0.983 |
| CC | 0.170 | 0.168 | -0.432 | 15.126 | 1.014 | 1.212 | -0.028 | 0.286 | -2.182 | 58.677 | – | 0.980 |
| CC-RMT | 0.173 | 0.169 | -0.549 | 19.508 | 1.027 | 1.217 | -0.006 | 0.278 | -1.004 | 26.446 | – | 0.996 |
| DJI | IBEX | |||||||||||
| Sample | 0.069 | 0.135 | -0.097 | 14.955 | 0.511 | 1.103 | 0.011 | 0.171 | -2.202 | 30.704 | 0.065 | 1.012 |
| Shrinkage | 0.061 | 0.135 | -0.109 | 15.777 | 0.452 | 1.090 | 0.014 | 0.170 | -2.233 | 30.384 | 0.085 | 1.016 |
| CC | 0.036 | 0.140 | -0.010 | 15.197 | 0.260 | 1.051 | 0.015 | 0.178 | -2.176 | 30.847 | 0.082 | 1.016 |
| CC-RMT | 0.075 | 0.146 | -0.435 | 25.338 | 0.514 | 1.108 | 0.021 | 0.174 | -1.697 | 24.944 | 0.118 | 1.022 |
| RW 12 months in-sample, 1 month out-of-sample | ||||||||||||
| NDX | S5ENRS | |||||||||||
| skewness | kurtosis | skewness | kurtosis | |||||||||
| Sample | 0.138 | 0.162 | -0.462 | 15.083 | 0.852 | 1.173 | 0.003 | 0.273 | -1.605 | 40.578 | 0.009 | 1.002 |
| Shrinkage | 0.137 | 0.162 | -0.443 | 15.292 | 0.846 | 1.173 | 0.000 | 0.274 | -1.623 | 40.714 | 0.001 | 1.000 |
| CC | 0.138 | 0.174 | -0.435 | 18.384 | 0.798 | 1.165 | 0.000 | 0.277 | -1.562 | 38.124 | 0.001 | 1.000 |
| CC-RMT | 0.149 | 0.175 | -0.550 | 21.857 | 0.854 | 1.179 | 0.031 | 0.284 | -0.853 | 24.782 | 0.110 | 1.021 |
| DJI | IBEX | |||||||||||
| Sample | 0.056 | 0.140 | -0.348 | 17.637 | 0.403 | 1.081 | 0.009 | 0.168 | -1.926 | 27.381 | 0.056 | 1.010 |
| Shrinkage | 0.055 | 0.139 | -0.249 | 16.768 | 0.393 | 1.079 | 0.010 | 0.167 | -1.966 | 26.984 | 0.059 | 1.011 |
| CM | 0.036 | 0.142 | -0.234 | 14.925 | 0.256 | 1.050 | 0.011 | 0.176 | -1.703 | 24.097 | 0.060 | 1.011 |
| CM RMT | 0.052 | 0.150 | -0.467 | 26.307 | 0.349 | 1.073 | 0.017 | 0.179 | -1.499 | 24.244 | 0.097 | 1.018 |
| NDX | S5ENRS | |||||||||||
| skewness | kurtosis | skewness | kurtosis | |||||||||
| Sample | 0.144 | 0.168 | -0.515 | 18.621 | 0.857 | 1.178 | 0.038 | 0.274 | -0.903 | 24.810 | 0.139 | 1.028 |
| Shrinkage | 0.143 | 0.168 | -0.544 | 19.674 | 0.851 | 1.178 | 0.037 | 0.275 | -0.926 | 25.209 | 0.134 | 1.027 |
| CC | 0.152 | 0.181 | -0.428 | 22.929 | 0.840 | 1.179 | 0.032 | 0.284 | -1.059 | 26.698 | 0.111 | 1.022 |
| CC-RMT | 0.156 | 0.179 | -0.557 | 21.381 | 0.868 | 1.184 | 0.071 | 0.294 | -0.814 | 24.310 | 0.241 | 1.048 |
| DJI | IBEX | |||||||||||
| Sample | 0.061 | 0.142 | -0.465 | 20.465 | 0.429 | 1.089 | -0.013 | 0.167 | -1.924 | 27.775 | – | 0.986 |
| Shrinkage | 0.056 | 0.142 | -0.463 | 20.226 | 0.392 | 1.081 | -0.014 | 0.166 | -1.982 | 27.653 | – | 0.985 |
| CC | 0.031 | 0.145 | -0.487 | 17.511 | 0.216 | 1.043 | 0.006 | 0.175 | -1.676 | 23.275 | 0.032 | 1.006 |
| CC-RMT | 0.071 | 0.153 | -0.457 | 28.351 | 0.467 | 1.101 | 0.037 | 0.182 | -1.552 | 25.414 | 0.203 | 1.039 |
| RW 24 months in-sample, 2 months out-of-sample | ||||||||||||
| NDX | S5ENRS | |||||||||||
| skewness | kurtosis | skewness | kurtosis | |||||||||
| Sample | 0.148 | 0.170 | -0.425 | 18.565 | 0.871 | 1.183 | 0.055 | 0.278 | -0.844 | 23.960 | 0.198 | 1.040 |
| Shrinkage | 0.148 | 0.171 | -0.448 | 19.505 | 0.862 | 1.181 | 0.054 | 0.279 | -0.868 | 24.361 | 0.194 | 1.039 |
| CM | 0.159 | 0.183 | -0.327 | 22.713 | 0.867 | 1.187 | 0.048 | 0.289 | -0.994 | 25.798 | 0.166 | 1.034 |
| CM RMT | 0.153 | 0.175 | -0.465 | 21.145 | 0.873 | 1.177 | 0.080 | 0.299 | -0.780 | 23.468 | 0.267 | 1.053 |
| DJI | IBEX | |||||||||||
| Sample | 0.057 | 0.144 | -0.453 | 20.131 | 0.392 | 1.082 | -0.016 | 0.168 | -1.882 | 27.501 | – | 0.982 |
| Shrinkage | 0.051 | 0.144 | -0.436 | 19.930 | 0.356 | 1.074 | -0.015 | 0.169 | -1.876 | 26.742 | – | 0.983 |
| CM | 0.026 | 0.147 | -0.470 | 17.269 | 0.176 | 1.035 | 0.005 | 0.177 | -1.624 | 22.751 | 0.026 | 1.005 |
| CM RMT | 0.076 | 0.155 | -0.394 | 27.803 | 0.489 | 1.107 | 0.038 | 0.182 | -1.548 | 25.313 | 0.211 | 1.041 |
Table 2.
Average portfolio turnover and average modified Herfindahl index for the four portfolios under analysis across different rolling window methodologies. The strategies with lower average turnover and lower average modified Herfindahl index are highlighted in bold.
Table 2.
Average portfolio turnover and average modified Herfindahl index for the four portfolios under analysis across different rolling window methodologies. The strategies with lower average turnover and lower average modified Herfindahl index are highlighted in bold.
Disclaimer/Publisher’s Note: The statements, opinions and data contained in all publications are solely those of the individual author(s) and contributor(s) and not of MDPI and/or the editor(s). MDPI and/or the editor(s) disclaim responsibility for any injury to people or property resulting from any ideas, methods, instructions or products referred to in the content. |
© 2024 by the authors. Licensee MDPI, Basel, Switzerland. This article is an open access article distributed under the terms and conditions of the Creative Commons Attribution (CC BY) license (http://creativecommons.org/licenses/by/4.0/).
Copyright: This open access article is published under a Creative Commons CC BY 4.0 license, which permit the free download, distribution, and reuse, provided that the author and preprint are cited in any reuse.


