Submitted:
12 April 2024
Posted:
12 April 2024
You are already at the latest version
Abstract
Background
Homologous recombination deficiency (HRD) evolved into a major diagnostic marker in high grade ovarian cancer (HGOC) predicting the response to poly (Adenosine diphosphate-ribose) polymerase inhibitors (PARPi) and also platinum-based therapy. In addition to HRD, the type of peritoneal tumor spread influences treatment response and patient survival; miliary type tumor spread has poorer predicted outcome than non-miliary type tumor spread.
Methods
Known methods for HRD assessment were adapted for our technical requirements and the Predictive-value Integrated Genomic Instability Score (PIGIS) for HRD assessment evolved as an outcome. PIGIS was validated in HGOC samples from 122 patients. We used PIGIS to analyze whether the type of tumor spread correlated with HRD status and whether this had an impact on survival.
Results
We demonstrated that PIGIS can discriminate HRD positive from HRD negative samples. Tumors with miliary tumor spread are HRD negative and have a very bad prognosis with a progression free survival (PFS) of 15.6 months and an overall survival (OS) of 3.9 years. However, HRD negative non-miliary spreading tumors in our cohort had a much better prognosis (PFS 35.4 months, OS 8.9 years), similar to HRD positive tumors (PFS 34.7 months, OS 8.9 years).
Conclusions
Our results indicate that in a predominantly PARPi naïve cohort the type of tumor spread might be a better predictor of response to platinum sensitivity than HRD. It remains to be determined, whether this also applies for sensitivity to PARPi.
Keywords:
Personalized medicine
; genomic instability
; Miliary disease
; epithelial ovarian cancer
; PARP inhibitor
; staging
Introduction
Ovarian cancer is the eighth most common cancer in women [1], in whom it accounts for 2.2% of all cancer deaths [2]. Epithelial ovarian cancer (EOC) is the most common cause of death in gynecologic cancers [3]. The 5-year survival rate of ovarian cancer is 50.8% [2,4]. Unfortunately, most EOC are diagnosed at an already advanced stage (FIGO stage III-IV), and more than 85% are high grade ovarian cancer (HGOC).
Two distinct modes of peritoneal spread of HGOC, miliary and non-miliary with bulky implants [5,6], can be distinguished during surgery and are highly predictive of clinical outcome [5,7,8,9]. Miliary carcinomatosis, for example on the small bowel, is associated with poor surgical outcomes [7,10], and it has been hypothesized that patients with miliary disease are less likely to respond to platinum therapy [7].
Approximately 50% of HGOC cases show genomic instability (GI) due to homologous recombination deficiency (HRD) [11]. HRD is caused by genetic and epigenetic alterations in the genes that encode key players of the homologous recombination repair (HRR) pathway. Among these germline and/or somatic inactivating mutations in the BRCA1 and BRCA2 genes (13%-15% of all HGOC) [12] are the most frequent. Other HRR genes affected include RAD51C, RAD51D, PALB2, and ATM [13,14] or different undetermined genomic alterations [15].
HRR is required for the accurate repair of DNA double strand breaks. HRR-deficient cells utilize alternative more error-prone DNA double strand repair mechanisms such as non-homologous end joining or mitotic homologous recombination [16]. Consequently, HRR-deficient cells display GI with accumulation of copy number alterations (CNAs) and/or an increased number of regions with loss of heterozygosity (LOH), resulting in characteristic genomic scars [15,17].
HRD plays an important role in HGOC oncogenesis, progression and metastasis and thus represents a fundamental vulnerability that can be exploited in therapy [13,18]. Tumors exhibiting HRD are highly sensitive to DNA damaging agents such as platinum-based antitumor drugs, and to selective inhibitors of the poly (ADP-ribose) polymerase (PARPi) which induce synthetic lethality. Both favourably affect overall-survival (OS) and progression free survival (PFS) in HGOC [19,20]. HRD testing for the prediction of therapy response can focus on pathogenic variants in genes of the HRR pathway and/or the presence of characteristic genomic scar patterns [13]. Such scar patterns independently predict response to the drugs mentioned above and to prognosis in ovarian cancer patients [13,21,22,23].
Different scores/algorithms are available to quantify the characteristic genomic scar patterns resulting from HRD. Amongst others, the LOH score according to Abkevich [24] and the Telomeric Allelic Imbalance (TAI) score [16] are well-established markers for the determination of HRD.
To our knowledge, a possible link or correlation of peritoneal type of tumor spread and HRD status has not been investigated so far. With the aim to close this gap we assessed if such a link or correlation between the peritoneal type of tumor spread and HRD status exists and whether this has an influence on the PFS and OS in a cohort of patients with HGOC. For the HRD assessment we established a novel HRD score based on an equally weighted combination of the well-established loss of heterozygosity (LOH) score [24] and a modified Telomeric Allelic Imbalance (TAI) score [16].
Methods
Patients
The study was performed on samples collected by the Department of Obstetrics and Gynecology, at the Medical University Innsbruck, Austria, between the 28th of August 1990 and 01st of September 2021.
Patient samples for the cohort were very stringently selected according to the criteria in Table 1.
One hundred and twenty-two samples from patients with HGOC were included in the study.
The ECOG (Eastern Co-operative Oncology Group) performance status for most patients (70.5%) was ‘0’ (n=86); indicating that the majority of patients were “fully active, able to carry on all pre-disease performance without restriction”. The predominant histology sub-type was high grade serous (HGS) (89.3%; n=109); with approximately one third (34.4%; n=42) graded ‘grade 2’ (moderate or intermediate grade), and two thirds (65.6%, n=80) grade 3 (high-grade or poorly differentiated). The HGOC samples included were staged according to the International Federation of Gynecology and Obstetrics (FIGO) classification from 2017. Most patients were classified as stage III (72%; n=88) or stage IV (a/b) (19.7%; n=24). A complete summary of the patients’ clinicopathologic parameters are shown in Table 2.
The mean age at diagnosis was 61.32 (38.65-86.07) years. The majority, 77.9% of patients (n=95), received primary debulking surgery (PDS); whereas 22.1% of patients (n=27) received neoadjuvant chemotherapy followed by interval debulking surgery (IDS). Adjuvant treatment consisted of six cycles of paclitaxel (175 mg/m²) and carboplatin (AUC5). Neoadjuvant treatment consisted of three cycles of paclitaxel (175 mg/m²) and carboplatin (AUC5) before and after interval debulking. The overall complete macroscopic tumor resection rate was 76.2% (n= 93). Adjuvant platinum-based therapy was performed in all patients within the collective; whereby, 81.0% (n=99) of individuals received a paclitaxel-carboplatin combination. In addition, 54.1% (n=66) of patients were subjected to maintenance therapy, mostly bevacizumab 15 mg/kg body weight for 15 months or until prior progression. A summary of the patient treatment characteristics is shown in Table 3; including, the patients’ recurrence rate, mutational status, and peritoneal spread.
During a median follow-up of 2.92 (1.45 – 5.42) years recurrence was observed in 68.9% of patients (n=84), and 40.2% of patients died (n=49), resulting in a mean PFS of 32 (0.4 – 187.0) months, and a mean OS of 3.88 (0.03 – 15.59) years.
Mutation status of cancer specimens was assessed in previous research projects at the Department of Obstetrics and Gynecology, Medical University Innsbruck, Austria or during tumor profiling at the Institute of Human Genetics, Innsbruck Medical University, Austria. In our cohort 27.9% (n=34) of the tumors harbored pathogenic variants (PV) in BRCA1, 8.2% (n=10) in BRCA2, and 4.1% (n=4) in RAD51C. The cohort was initially designed to setup HRD-testing and therefore enriched in samples containing BRCA1/2 mutations (36%).
Ethical Approval
Clinical, pathological, and follow-up data were stored in a database according to the hospital’s data privacy regulations. Patients gave written informed consent for the collection of their data for research purposes. The study was approved by the Ethics Committee of the Innsbruck Medical University (Reference numbers: AN2015-0038 346/4.17; 1054/2019) and conducted in accordance with the principles of the Declaration of Helsinki.
Type of Peritoneal Spread
The type of peritoneal spread was determined independently by two surgeons during primary surgery according to the criteria as described by Auer et al. [6]. Briefly, peritoneal spread was designated miliary if more than 20 (frequently uncountable) implants with a diameter smaller than two centimeters in the majority of the deposits were observed. Cases with easy numerable large noduled implants with exophytical growing pattern, mostly larger than two centimeters in diameter, were allocated to the group of non-miliary spreading cancers. 74.6% of patients were classified as non-miliary (n=91) and 25.4% were classified as miliary (n=31).
SNP-Array and Data Analysis
The DNA from the 122 tumor samples was extracted from fresh frozen tissue (>20% tumor cell content), or from formalin-fixed, paraffin-embedded (FFPE) tissue (>50% tumor cell content). The DNA was analyzed using the Global Screening Array (Illumina) according to the manufacturer’s protocol. To determine HRD status (see “Scoring”), data was analyzed with Illumina GenomeStudio 2.0 and NxClinical (Bionano, SNP-FASST2-Segmentation Algorithms).
Scoring (Integrated HRD Score)
To quantify HRD, a LOH score and an Aneuploidy Normalized Telomeric Imbalance (ANTI) Score were used based on the LOH score published by Abkevichet al. [24], and using a modification of the TAI score of Birkbak et al. [16].
In brief, the LOH score was calculated as the percent of genomic regions spanning less than 90% of a chromosome arm, with a total allele copy number higher than zero and a minor allele copy number of zero.
The ANTI score was calculated based on the number of chromosomal regions meeting all of the following criteria: 1) Starting at the end of the telomere, but not reaching the centromere (breakpoint within chromosome arm); 2) major copy proportion (MCP (copy number (CN) of the major allele/(CN major allele+CN minor allele)) > 0.7; and, 3) minimal fragment size of 12 Megabases.
The optimal predictive cut-off value of both scores (LOH and ANTI) were determined as follows: For both scores, the patients were separated into two groups, LOH-high or LOH-low, and ANTI-high or ANTI-low, using 20 different cut-off points corresponding to every 5th percentile of the maximum score value. Kaplan-Meier estimations and hazard ratios (HR) for PFS were calculated for each of these two groups. In the range with the lowest p-values (percentiles 40 – 50), Kaplan-Meier estimations and HR for PFS were calculated for the two groups separately at each percentile. The score value of the percentile with the lowest p-values (Log-rank test) were selected as the optimal cut off points (Figure 1a,b).
Statistical Analysis
Statistical analysis was performed using the Statistical Product and Service Solutions (SPSS, version 28.0.0, IBM) program or with Prism (Version 10.1.1, Graphpad). A p-value of ≤0.05 was considered statistically significant.
Results
Setup of the Integrated HRD Score
The optimal cut-off point for the LOH score with the highest predictive significance of PFS was the 45th percentile (p<0.001), corresponding to an LOH score of 17.31% (Figure 1a). For the ANTI score the optimal threshold value for PFS prediction was the 46th percentile (p<0.001) corresponding to an ANTI score of 7.0 (Figure 1b).
To integrate the LOH and the ANTI score in one single HRD score termed the “Predictive-value Integrated Genomic Instability Score” (PIGIS) the two relative scores (individual score of the patient divided by the optimal predictive cut-off values) were added.
Determination of a Diagnostic Threshold of PIGIS
Samples with BRCA1/2- or RAD51C-mutations (mut) had a significantly higher median PIGIS (p<0.0001, Wilcoxon signed rank test) than the other samples in the cohort (wt) (Figure 1c). In previous studies 22, the cut-off for HRD positivity was set at the HRD value corresponding to the 5th percentile of samples harboring BRCA1/2-mutations. The 5th percentile was selected to compensate for outliers, e.g., samples with BRCA1/2-mutations without chromosomal instability. However, since our cohort contained no outliers, the PIGIS threshold for HRD positivity was defined as the lowest PIGIS value in a sample harboring a PV in BRCA1/2 or RAD51C (Figure 1c). Using this PIGIS cut-off value (1.77), 25 samples without BRCA1/2- or RAD51C-mutations were HRD positive (Figure 1c). Testing of a proportion of the cohort (n=20) with Myriad MyChoice DX (Myriad Genetics) showed a good correlation, with a Pearson score of 0.86; the classification of samples into HRD positive and HRD negative was the same for all samples (Figure 1d).
Patients with PIGIS (HRD) Positive Tumors have Better Prognosis
Patients with HRD positive tumors (PIGIS value ≥ 1.77), had significantly better survival than patients with HRD negative tumors (PIGIS value < 1.77) with a median PFS of 32.0 vs. 16.4 months (HR 0.44, p<0.0001) (Figure 2a). Excluding patients having tumors with BRCA1/2- or RAD51C-mutations from the analysis, patients with HRD positive tumors still had significantly better survival than patients with HRD negative tumors, with a median PFS of 24.4 vs. 16.4 months (HR 0.49., p=0.018) (Figure 2b).
Similarly, OS was better in patients with PIGIS HRD positive tumors, with an OS of 8.9 vs. 4.2 years (HR 0.35, p=0.0001; Figure 2c). Also, excluding the patients with BRCA1/2 or RAD51C PV positive tumors in this analysis, the OS in the subgroup of HRD positive tumors was significantly better than in patients with HRD negative tumors (8.2 years vs. 4.2 years, HR 0.37, p=0.02; Figure 2d).
Tumors with Miliary Spread are Exclusively PIGIS Negative and Have a Poorer Prognosis
Separating the cohort in tumors without (n=91) and with (n=31) miliary spread revealed that tumors with miliary spread were exclusively HRD negative (PIGIS value <1.77; Figure 3a). This observation led us to compare whether patients with HRD negative non-miliary tumors had a different clinical outcome to patients with HRD negative miliary tumors. For this analysis, we only analyzed samples from patients that underwent primary debulking surgery, to avoid a bias in classification of the peritoneal carcinogenesis due to potential differences in the response to neoadjuvant treatment. The analysis of PFS and OS showed that patients with HRD negative non-miliary tumors (n=16) had a similar clinical outcome to patients with HRD positive tumors with a non-miliary spread (n=66, median PFS 35.4 vs. 34.7 months, p=0.6; median OS 7.8 vs. 8.9 years, p=0.3; Figure 3b,c).
Patients with miliary spreading tumors (n=15) had a significantly poorer prognosis than patients with HRD positive tumors (median PFS 15.6 vs. 34.7 months, p=<0.0001; median OS 3.9 vs. 8.9 years, p=<0.0001), and HRD negative non-miliary spreading tumors (median PFS 15.6 vs. 35.42 months, p=0.001; median OS 3.9 vs. 8.9 years, p=0.009; Figure 3b, c).
Discussion
Using a newly developed and validated HRD score, denoted PIGIS, we show that all miliary spreading tumors in our cohort were HRD negative and patients with such tumors had a significantly worse PFS and OS than patients with HRD negative non-miliary spreading tumors. Patients with HRD negative non-miliary spreading tumors in our cohort had a similar PFS and OS as HRD positive tumors.
The identification of the HRD status of HGOC patients as being a reliable predictor of high response to neoadjuvant platinum-based therapy and PARPi has led to large scale development of HRD testing. This was implemented either on a commercial basis (e.g. Myriad MyChoice, Foundation Medicine), as integrated kits for in house testing (e.g. Illumina TruSight Oncology 500 DNA Kit, SOPHiA DDM™ Homologous Recombination Deficiency (HRD) Solution), or as local multi-factorial analysis for research and diagnostic purposes (e.g. the Leuven HRD test [25], or the Scarface Score [21]). The tests differ in cost, accessibility, and time of return; nonetheless, they are an integral part of tumor profiling for gynecological tumors. To improve accessibility, cost efficiency and time of return for our own in house use, we established the novel PIGIS score, an equally weighted combination of the well-established loss of heterozygosity (LOH) score [24] and a modification of the TAI score 16 for HRD assessment. The goal of the integration of the two scores into one single parameter was to balance potential weaknesses and strengths of both individual scores.
Samples harbouring BRCA1/2 mutations and RAD51C mutations had a significantly higher PIGIS than samples with no known PV in one of these genes, even though in the later cohort several samples with high scores have been identified. These high-score samples without known BRCA1/2 mutations or RAD51C mutations were expected and can most probably be explained by mutations in HRR genes other than BRCA1/2 or RAD51C or epigenetic silencing of HRR genes. Based on that data we concluded that PIGIS is a valid score for the determination of HRD in HGOC samples.
Patients with HRD positive tumors are known to have a better prognosis in comparison to patients with HRD-negative tumors [19,23]. Indeed, survival analysis in our cohort confirmed a better survival for patients with HRD positive HGOC underlining the validity of our testing approach.
The miliary spread pattern is a known negative predictor for OS in HGOC patients [5,6,7,10], which was confirmed in our cohort. Interestingly, we could also show, that miliary spreading tumors were consistently HRD negative. We hypothesized, that if a miliary tumor spread pattern is a negative predictor for survival, and all of these cancers are HRD negative, the miliary pattern of intraperitoneal dissemination as such might be responsible for the generally worse survival (PFS and OS) of the HRD negative tumor group. To test this hypothesis, we formed a miliary and non-miliary cohort out of the HRD negative group and performed survival analysis. We found that indeed patients with HRD negative non-miliary tumors had a similar PFS and OS as patients with HRD positive tumors. Whilst patients with miliary spreading tumors, which were all HRD negative, exhibited a much worse prognosis.
Previous studies suggest that patients with miliary tumor spread have a worse response to initial treatment, in surgery as well as with platinum-based chemotherapy [7,10]. Molecular characterization of miliary vs. non-miliary tumors supports the hypothesis that more mesenchymal-like characteristics in miliary spreading tumor cells are responsible for potential platinum resistance 5. However, studies explaining the exact mechanism of resistance or whether the worse prognosis of patients with miliary tumor spread is depending on platinum resistance or impaired surgical efficiency are yet lacking.
Since the majority of our patients did not receive PARP inhibitors, PFS and OS in the investigated cohort presumably represents the response to surgery and/or platinum-based chemotherapy, which apparently is predominantly depending on the type of tumor spread rather than HRD status.
As it was shown that platinum sensitivity is an intrinsic predictor of PARPi response [26], we speculate that the type of tumor spread could also be a valuable parameter to predict responsiveness to PARPi in HGOC. To elucidate this hypothesis, further studies in a larger cohort of patients treated with PARPi are needed.
Limitations exist within the study given that the outcomes have not been validated in an independent dataset. The cohort consists of only a small number of patients/samples, and the allocation to miliary and non-miliary type with larger bulky implants remains a subjective assessment made by surgeons. This bears the risk of an intra- and inter-surgeon bias, which could lead to discrepancies in the interpretation of the type of tumor spreading, even if, as in our cohort, the assessment was made independently by two surgeons.
Thus, future research requires a larger number of patients to confirm our findings that the clinical outcome in patients with HRD negative non-miliary HGOC may be similar to patients with HRD positive HGOC. While initial efforts showed promising results [8,10], the future perspective should also focus on the introduction of biomarkers able to distinguish objectively between the miliary and non-miliary phenotype.
Despite some limitations our results indicate, that in a predominantly PARPi naïve cohort the type of tumor spread might be a better predictor of response to platinum sensitivity than HRD. It remains to be determined, whether this also applies for sensitivity to PARPi.
Author Contributions
| Author | Contribution | |||
| Concept or design of the study | Acquisition of data | Analysis of data | Data interpretation | |
| Simon Schnaiter | x | x | x | x |
| Esther Schamschula | x | x | ||
| Juliane Laschtowiczka | x | x | ||
| Heidelinde Fiegl | x | x | ||
| Johannes Zschocke | x | x | ||
| Alain Zeimet | x | x | ||
| Katharina Wimmer | x | x | ||
| Daniel Reimer | x | x | x | |
Funding
The development and validation of the PIGIS score receives financial supported from AstraZeneca.
Institutional Review Board Statement
The study was approved by the Ethics Committee of the Innsbruck Medical University (Reference numbers: AN2015-0038 346/4.17; 1054/2019) and conducted in accordance with the principles of the Declaration of Helsinki.
Informed Consent Statement
Informed consent was obtained from all individual participants included in the study.
Data Availability Statement
Any requests for data by qualified scientific and medical researchers for legitimate research purposes is to subject to the Medical University of Innsbruck’s data sharing policy. All requests should be submitted in writing to Simon Schnaiter.
Acknowledgments
Medical writing assistance on a version of this manuscript was provided by Una Doyle, UnAscribe Medical Communications, Innsbruck, Austria.
Conflicts of Interest
The authors are paid employees of the Medical University of Innsbruck as disclosed in their affiliations, SS receives financial project support by AstraZeneca for the project “Global-screening array for the assessment of homologous recombination deficiency (HRD) in epithelial ovarian cancer”, and honoraria for presentations in HRD-workshops organized by AstraZeneca.
References
- International, W. C. R. F. Ovarian Cancer Statistics. 2020. Available online: https://www.wcrf.org/cancer-trends/ovarian-cancer-statistics/ (accessed on 25 May 2023).
- Institute, U. N. C. Cancer Stat Facts: Ovarian Cancer. https://seer.cancer.gov/statfacts/html/ovary.html (accessed.
- Jayson, G. C.; Kohn, E. C.; Kitchener, H. C.; Ledermann, J. A. Ovarian cancer. Lancet 2014, 384, 1376–1388. [Google Scholar] [CrossRef]
- Ceccaldi, R.; Rondinelli, B.; D'Andrea, A. D. Repair Pathway Choices and Consequences at the Double-Strand Break. Trends Cell Biol 2016, 26, 52–64. [Google Scholar] [CrossRef] [PubMed]
- Auer, K.; Bachmayr-Heyda, A.; Aust, S.; Grunt, T. W.; Pils, D. Comparative transcriptome analysis links distinct peritoneal tumor spread types, miliary and non-miliary, with putative origin, tubes and ovaries, in high grade serous ovarian cancer. Cancer Lett 2017, 388, 158–166. [Google Scholar] [CrossRef] [PubMed]
- Auer, K.; Bachmayr-Heyda, A.; Aust, S.; Sukhbaatar, N.; Reiner, A. T.; Grimm, C.; Horvat, R.; Zeillinger, R.; Pils, D. Peritoneal tumor spread in serous ovarian cancer-epithelial mesenchymal status and outcome. Oncotarget 2015, 6, 17261–17275. [Google Scholar] [CrossRef] [PubMed]
- Eng, K. H.; Morrell, K.; Starbuck, K.; Spring-Robinson, C.; Khan, A.; Cleason, D.; Akman, L.; Zsiros, E.; Odunsi, K.; Szender, J. B. Prognostic value of miliary versus non-miliary sub-staging in advanced ovarian cancer. Gynecologic Oncology 2017, 146, 52–57. [Google Scholar] [CrossRef] [PubMed]
- Bachmayr-Heyda, A.; Auer, K.; Sukhbaatar, N.; Aust, S.; Deycmar, S.; Reiner, A. T.; Polterauer, S.; Dekan, S.; Pils, D. Small RNAs and the competing endogenous RNA network in high grade serous ovarian cancer tumor spread. Oncotarget 2016, 7, 39640–39653. [Google Scholar] [CrossRef] [PubMed]
- Egger, E. K.; Buchen, M. A.; Recker, F.; Stope, M. B.; Strunk, H.; Mustea, A.; Marinova, M. Predicting incomplete cytoreduction in patients with advanced ovarian cancer. Front Oncol 2022, 12, 1060006. [Google Scholar] [CrossRef] [PubMed]
- Fagotti, A.; Ferrandina, G.; Vizzielli, G.; Fanfani, F.; Gallotta, V.; Chiantera, V.; Costantini, B.; Margariti, P. A.; Gueli Alletti, S.; Cosentino, F.; et al. Phase III randomised clinical trial comparing primary surgery versus neoadjuvant chemotherapy in advanced epithelial ovarian cancer with high tumour load (SCORPION trial): Final analysis of peri-operative outcome. Eur J Cancer 2016, 59, 22–33. [Google Scholar] [CrossRef]
- Bell, D.; Berchuck, A.; Birrer, M.; Chien, J.; Cramer, D. W.; Dao, F.; Dhir, R.; DiSaia, P.; Gabra, H.; Glenn, P.; et al. Integrated genomic analyses of ovarian carcinoma. Nature 2011, 474, 609–615. [Google Scholar] [CrossRef]
- Pal, T.; Permuth-Wey, J.; Betts, J. A.; Krischer, J. P.; Fiorica, J.; Arango, H.; LaPolla, J.; Hoffman, M.; Martino, M. A.; Wakeley, K. BRCA1 and BRCA2 mutations account for a large proportion of ovarian carcinoma cases. Cancer, Risch, H. A.; McLaughlin, J. R.; Cole, D. E.; Rosen, B.; Bradley, L.; Fan, I.; Tang, J.; Li, S.; Zhang, S.; Shaw, P. A.; et al. Population BRCA1 and BRCA2 mutation frequencies and cancer penetrances: a kin-cohort study in Ontario, Canada. J Natl Cancer Inst 2006, 98 (23), 1694-1706. DOI: 10.1093/jnci/djj465 From NLM. Lin, K. K.; Harrell, M. I.; Oza, A. M.; Oaknin, A.; Ray-Coquard, I.; Tinker, A. V.; Helman, E.; Radke, M. R.; Say, C.; Vo, L. T.; et al. BRCA Reversion Mutations in Circulating Tumor DNA Predict Primary and Acquired Resistance to the PARP Inhibitor Rucaparib in High-Grade Ovarian Carcinoma. Cancer Discov 2019, 9 (2), 210-219. DOI: 10.1158/2159-8290.Cd-18-0715 From NLM. Integrated genomic analyses of ovarian carcinoma. Nature 2011, 474 (7353), 609-615. DOI: 10.1038/nature10166 From NLM. Bast, R. C., Jr.; Hennessy, B.; Mills, G. B. The biology of ovarian cancer: new opportunities for translation. Nat Rev Cancer 2009, 9 (6), 415-428. DOI: 10.1038/nrc2644; 2005, 104, 2807–2816. [Google Scholar] [CrossRef]
- Ngoi, N. Y. L.; Tan, D. S. P. The role of homologous recombination deficiency testing in ovarian cancer and its clinical implications: do we need it? ESMO Open 2021, 6. [Google Scholar] [CrossRef] [PubMed]
- Konstantinopoulos, P. A.; Ceccaldi, R.; Shapiro, G. I.; D'Andrea, A. D. Homologous Recombination Deficiency: Exploiting the Fundamental Vulnerability of Ovarian Cancer. Cancer Discov 2015, 5, 1137–1154. [Google Scholar] [CrossRef] [PubMed]
- Watkins, J. A.; Irshad, S.; Grigoriadis, A.; Tutt, A. N. J. Genomic scars as biomarkers of homologous recombination deficiency and drug response in breast and ovarian cancers. Breast Cancer Research 2014, 16. [Google Scholar] [CrossRef] [PubMed]
- Birkbak, N. J.; Wang, Z. C.; Kim, J. Y.; Eklund, A. C.; Li, Q.; Tian, R.; Bowman-Colin, C.; Li, Y.; Greene-Colozzi, A.; Iglehart, J. D.; et al. Telomeric allelic imbalance indicates defective DNA repair and sensitivity to DNA-damaging agents. Cancer Discov 2012, 2, 366–375. [Google Scholar] [CrossRef] [PubMed]
- Uzilov, A. V.; Ding, W.; Fink, M. Y.; Antipin, Y.; Brohl, A. S.; Davis, C.; Lau, C. Y.; Pandya, C.; Shah, H.; Kasai, Y.; et al. Development and clinical application of an integrative genomic approach to personalized cancer therapy. Genome Med 2016, 8. [Google Scholar] [CrossRef] [PubMed]
- Stecklein, S. R.; Jensen, R. A. Identifying and exploiting defects in the Fanconi anemia/BRCA pathway in oncology. Translational Research 2012, 160, 178–197. [Google Scholar] [CrossRef]
- Ray-Coquard, I.; Pautier, P.; Pignata, S.; Pérol, D.; González-Martín, A.; Berger, R.; Fujiwara, K.; Vergote, I.; Colombo, N.; Mäenpää, J.; et al. Olaparib plus Bevacizumab as First-Line Maintenance in Ovarian Cancer. N Engl J Med 2019, 381, 2416–2428. [Google Scholar] [CrossRef] [PubMed]
- Lord, C. J.; Ashworth, A. PARP inhibitors: Synthetic lethality in the clinic. Science 2017, 355, 1152–1158. [Google Scholar] [CrossRef] [PubMed]
- Fernández-Serra, A.; López-Reig, R.; Márquez, R.; Gallego, A.; de Sande, L. M.; Yubero, A.; Pérez-Segura, C.; Ramchandani-Vaswani, A.; Barretina-Ginesta, M. P.; Mendizábal, E.; et al. The Scarface Score: Deciphering Response to DNA Damage Agents in High-Grade Serous Ovarian Cancer-A GEICO Study. Cancers (Basel) 2023, 15. [Google Scholar] [CrossRef]
- Telli, M. L.; Timms, K. M.; Reid, J.; Hennessy, B.; Mills, G. B.; Jensen, K. C.; Szallasi, Z.; Barry, W. T.; Winer, E. P.; Tung, N. M.; et al. Homologous Recombination Deficiency (HRD) Score Predicts Response to Platinum-Containing Neoadjuvant Chemotherapy in Patients with Triple-Negative Breast Cancer. Clin Cancer Res 2016, 22, 3764–3773. [Google Scholar] [CrossRef]
- Ledermann, J. A.; Drew, Y.; Kristeleit, R. S. Homologous recombination deficiency and ovarian cancer. Eur J Cancer 2016, 60, 49–58. [Google Scholar] [CrossRef] [PubMed]
- Abkevich, V.; Timms, K. M.; Hennessy, B. T.; Potter, J.; Carey, M. S.; Meyer, L. A.; Smith-McCune, K.; Broaddus, R.; Lu, K. H.; Chen, J.; et al. Patterns of genomic loss of heterozygosity predict homologous recombination repair defects in epithelial ovarian cancer. Br J Cancer 2012, 107, 1776–1782. [Google Scholar] [CrossRef] [PubMed]
- Loverix, L.; Vergote, I.; Busschaert, P.; Vanderstichele, A.; Venken, T.; Boeckx, B.; Harter, P.; Brems, H.; Van Nieuwenhuysen, E.; Pignata, S.; et al. PARP inhibitor predictive value of the Leuven HRD test compared with Myriad MyChoice CDx PLUS HRD on 468 ovarian cancer patients from the PAOLA-1/ENGOT-ov25 trial. Eur J Cancer 2023, 188, 131–139. [Google Scholar] [CrossRef] [PubMed]
- Murthy, P.; Muggia, F. PARP inhibitors: clinical development, emerging differences, and the current therapeutic issues. Cancer Drug Resist 2019, 2, 665–679. [Google Scholar] [CrossRef] [PubMed]
Figure 1.
Setup of the Predictive-value Integrated Genomic Instability Score (PIGIS): For determination of an optimal predictive cut-off point for (a) the loss of heterzygosity (LOH) score, and (b) the aneuploidy normalized telomeric imbalance (ANTI) score, the patients were separated into two groups for each score with cut-off points corresponding to every 5th percentile of the value of each score (x axis). Kaplan-Meier estimations for PFS were calculated for the two groups at every 5th percentile (in the ranges p5-p40 and p50-p90) or every percentile (in the range of p41-p49). Logarithmic p-values (Log rank test) for calculated groups are displayed in the y-axis. A vertical line indicates the optimal cut-off point for each score. The optimal cut-off point was at percentile 45 (P45) for the LOH-score (score: 17.312) (a) and at percentile 46 (P46) for the ANTI-score (score: 7) (b). Panel (c) shows the PIGIS-scores for wild type (wt) and mutant (mut) samples. The diagnostic cut-off is indicated as dashed black line. Correlation of PIGIS and Myriad MyChoiceDX (d). The grey rectangle indicates samples classified HRD positive by both scores.
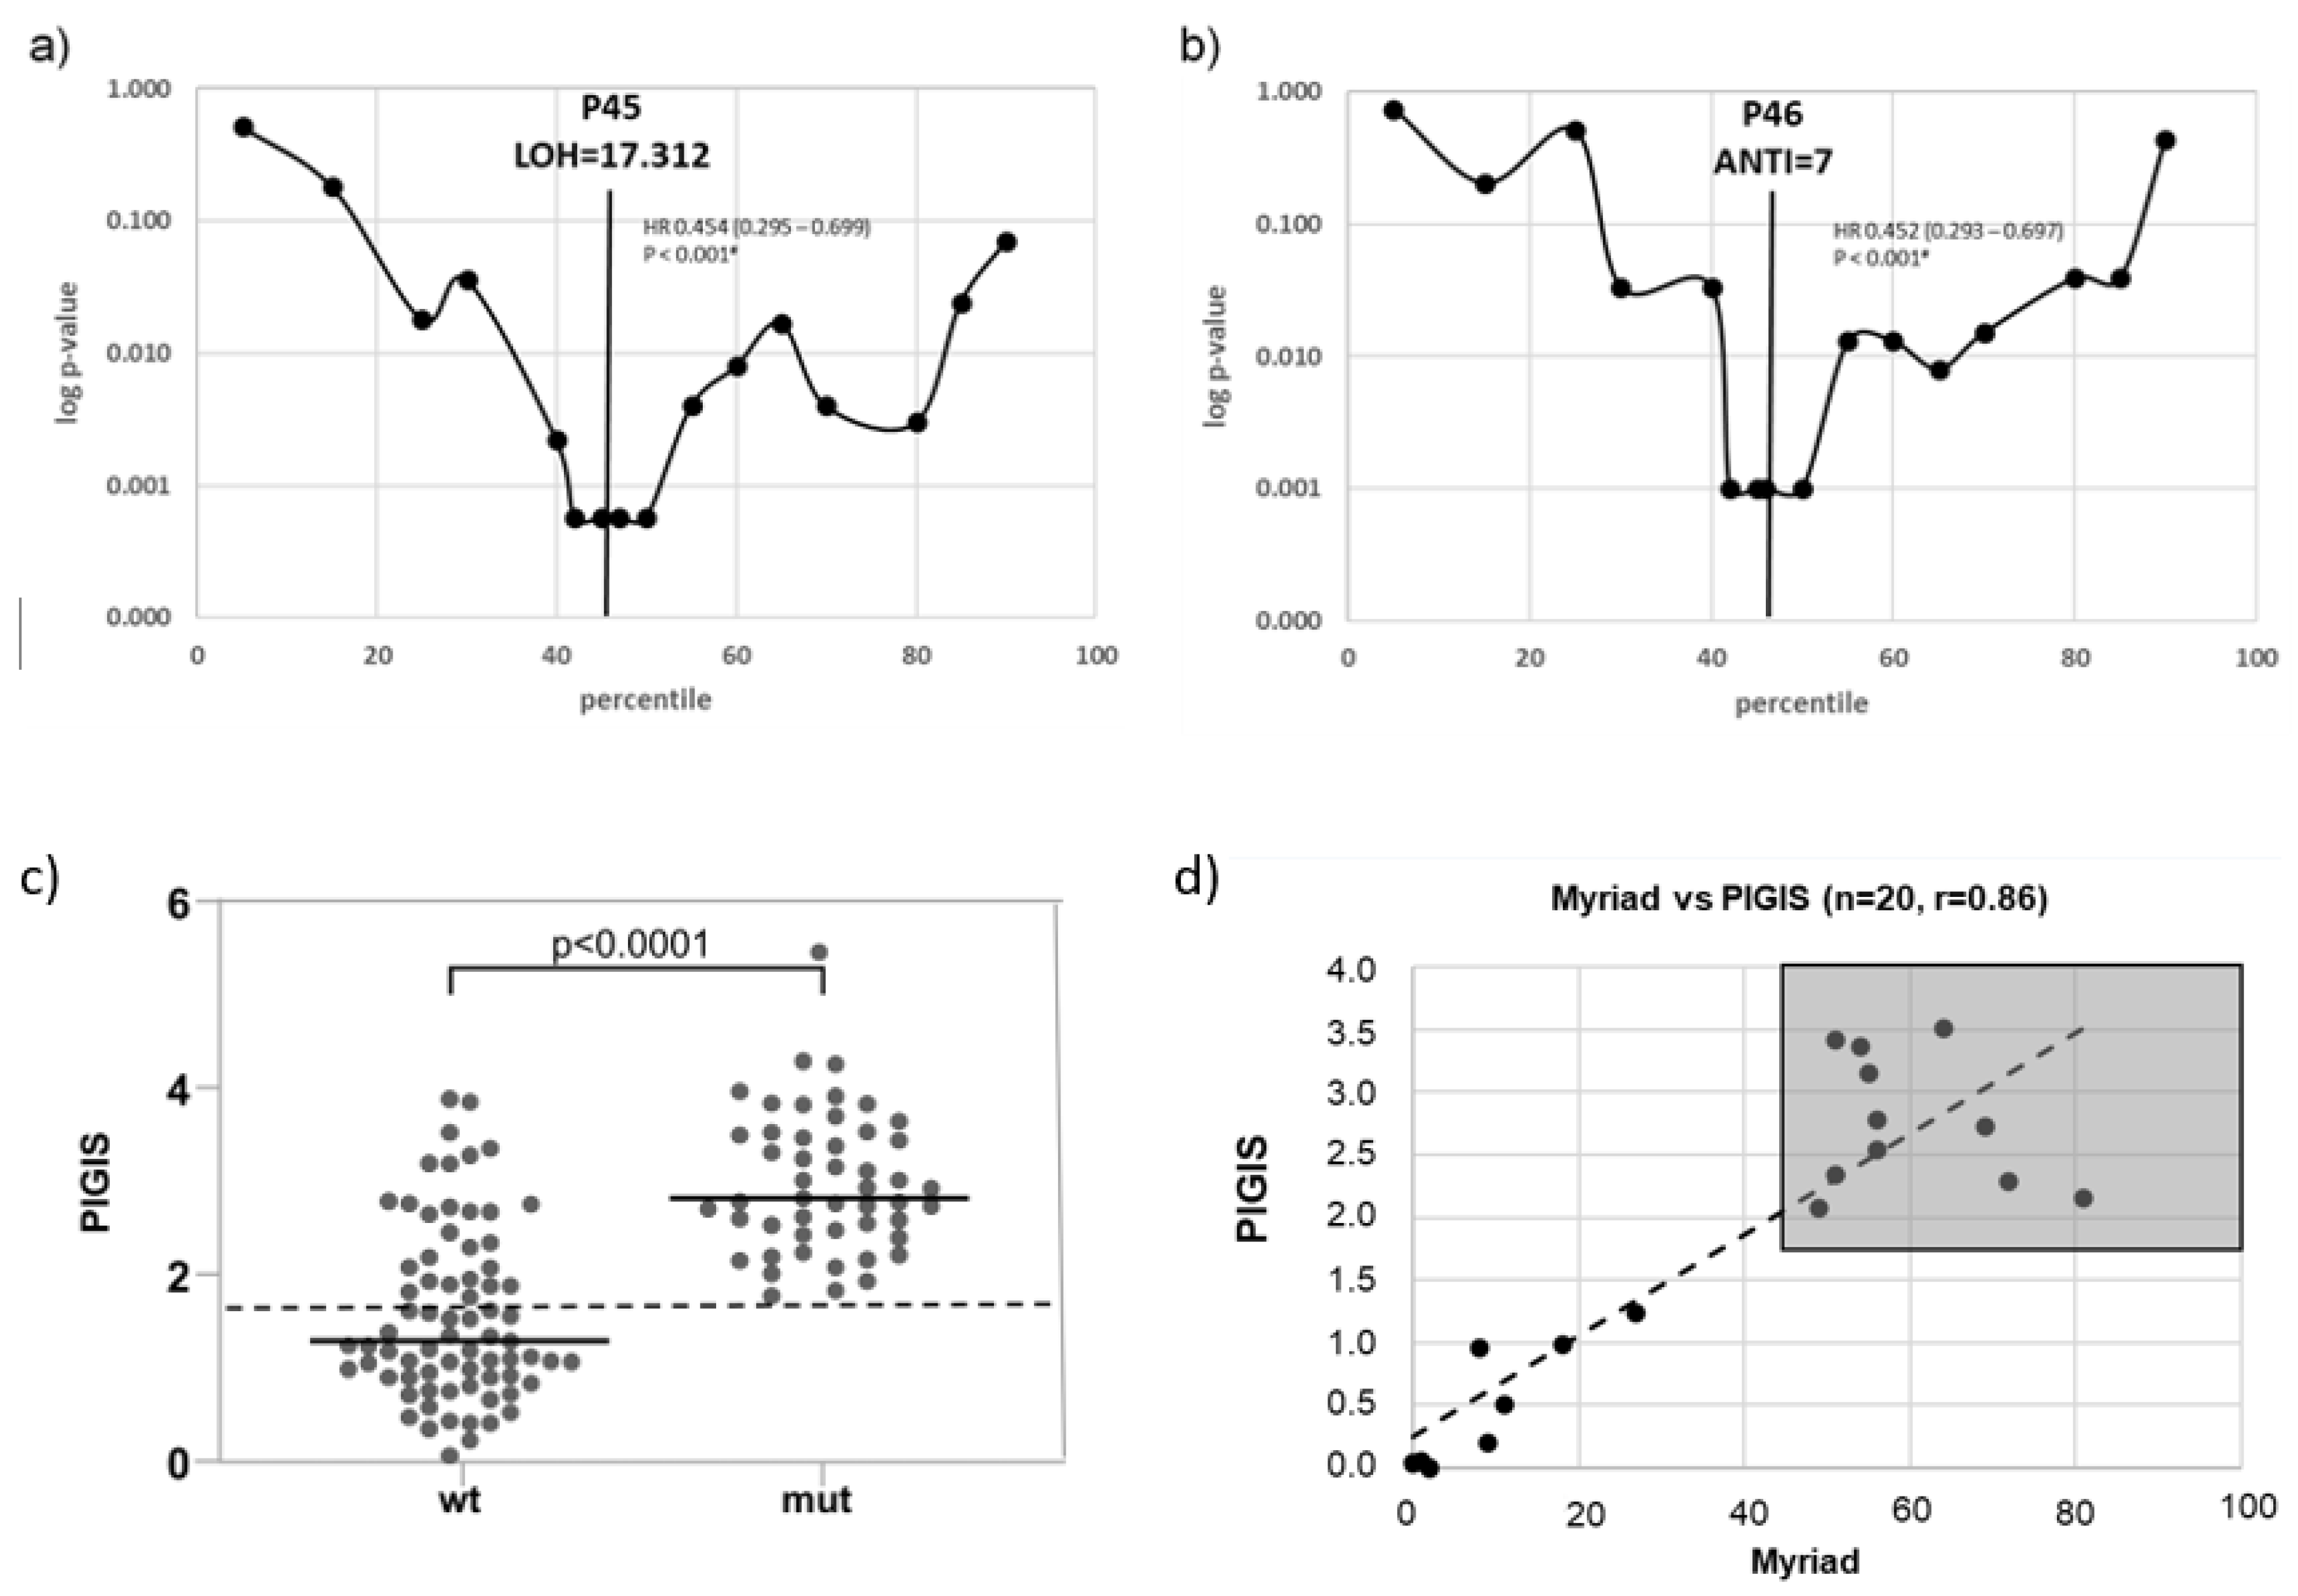
Figure 2.
The survival prediction by Predictive value Integrated Genomic Instability Score (PIGIS) in (a) progression free survival (PFS) of patients with PIGIS positive tumors vs. PIGIS negative tumors, and (b) PFS of patients with PIGIS positive tumors with no BRCA1/2 or RAD51C mutations vs. PIGIS negative tumors; and, the overall survival (OS) of patients with PIGIS-positive tumors vs. PIGIS negative tumors, and (d) OS of patients with PIGIS positive tumors with no BRCA1/2 or RAD51C mutations vs. PIGIS negative tumors.
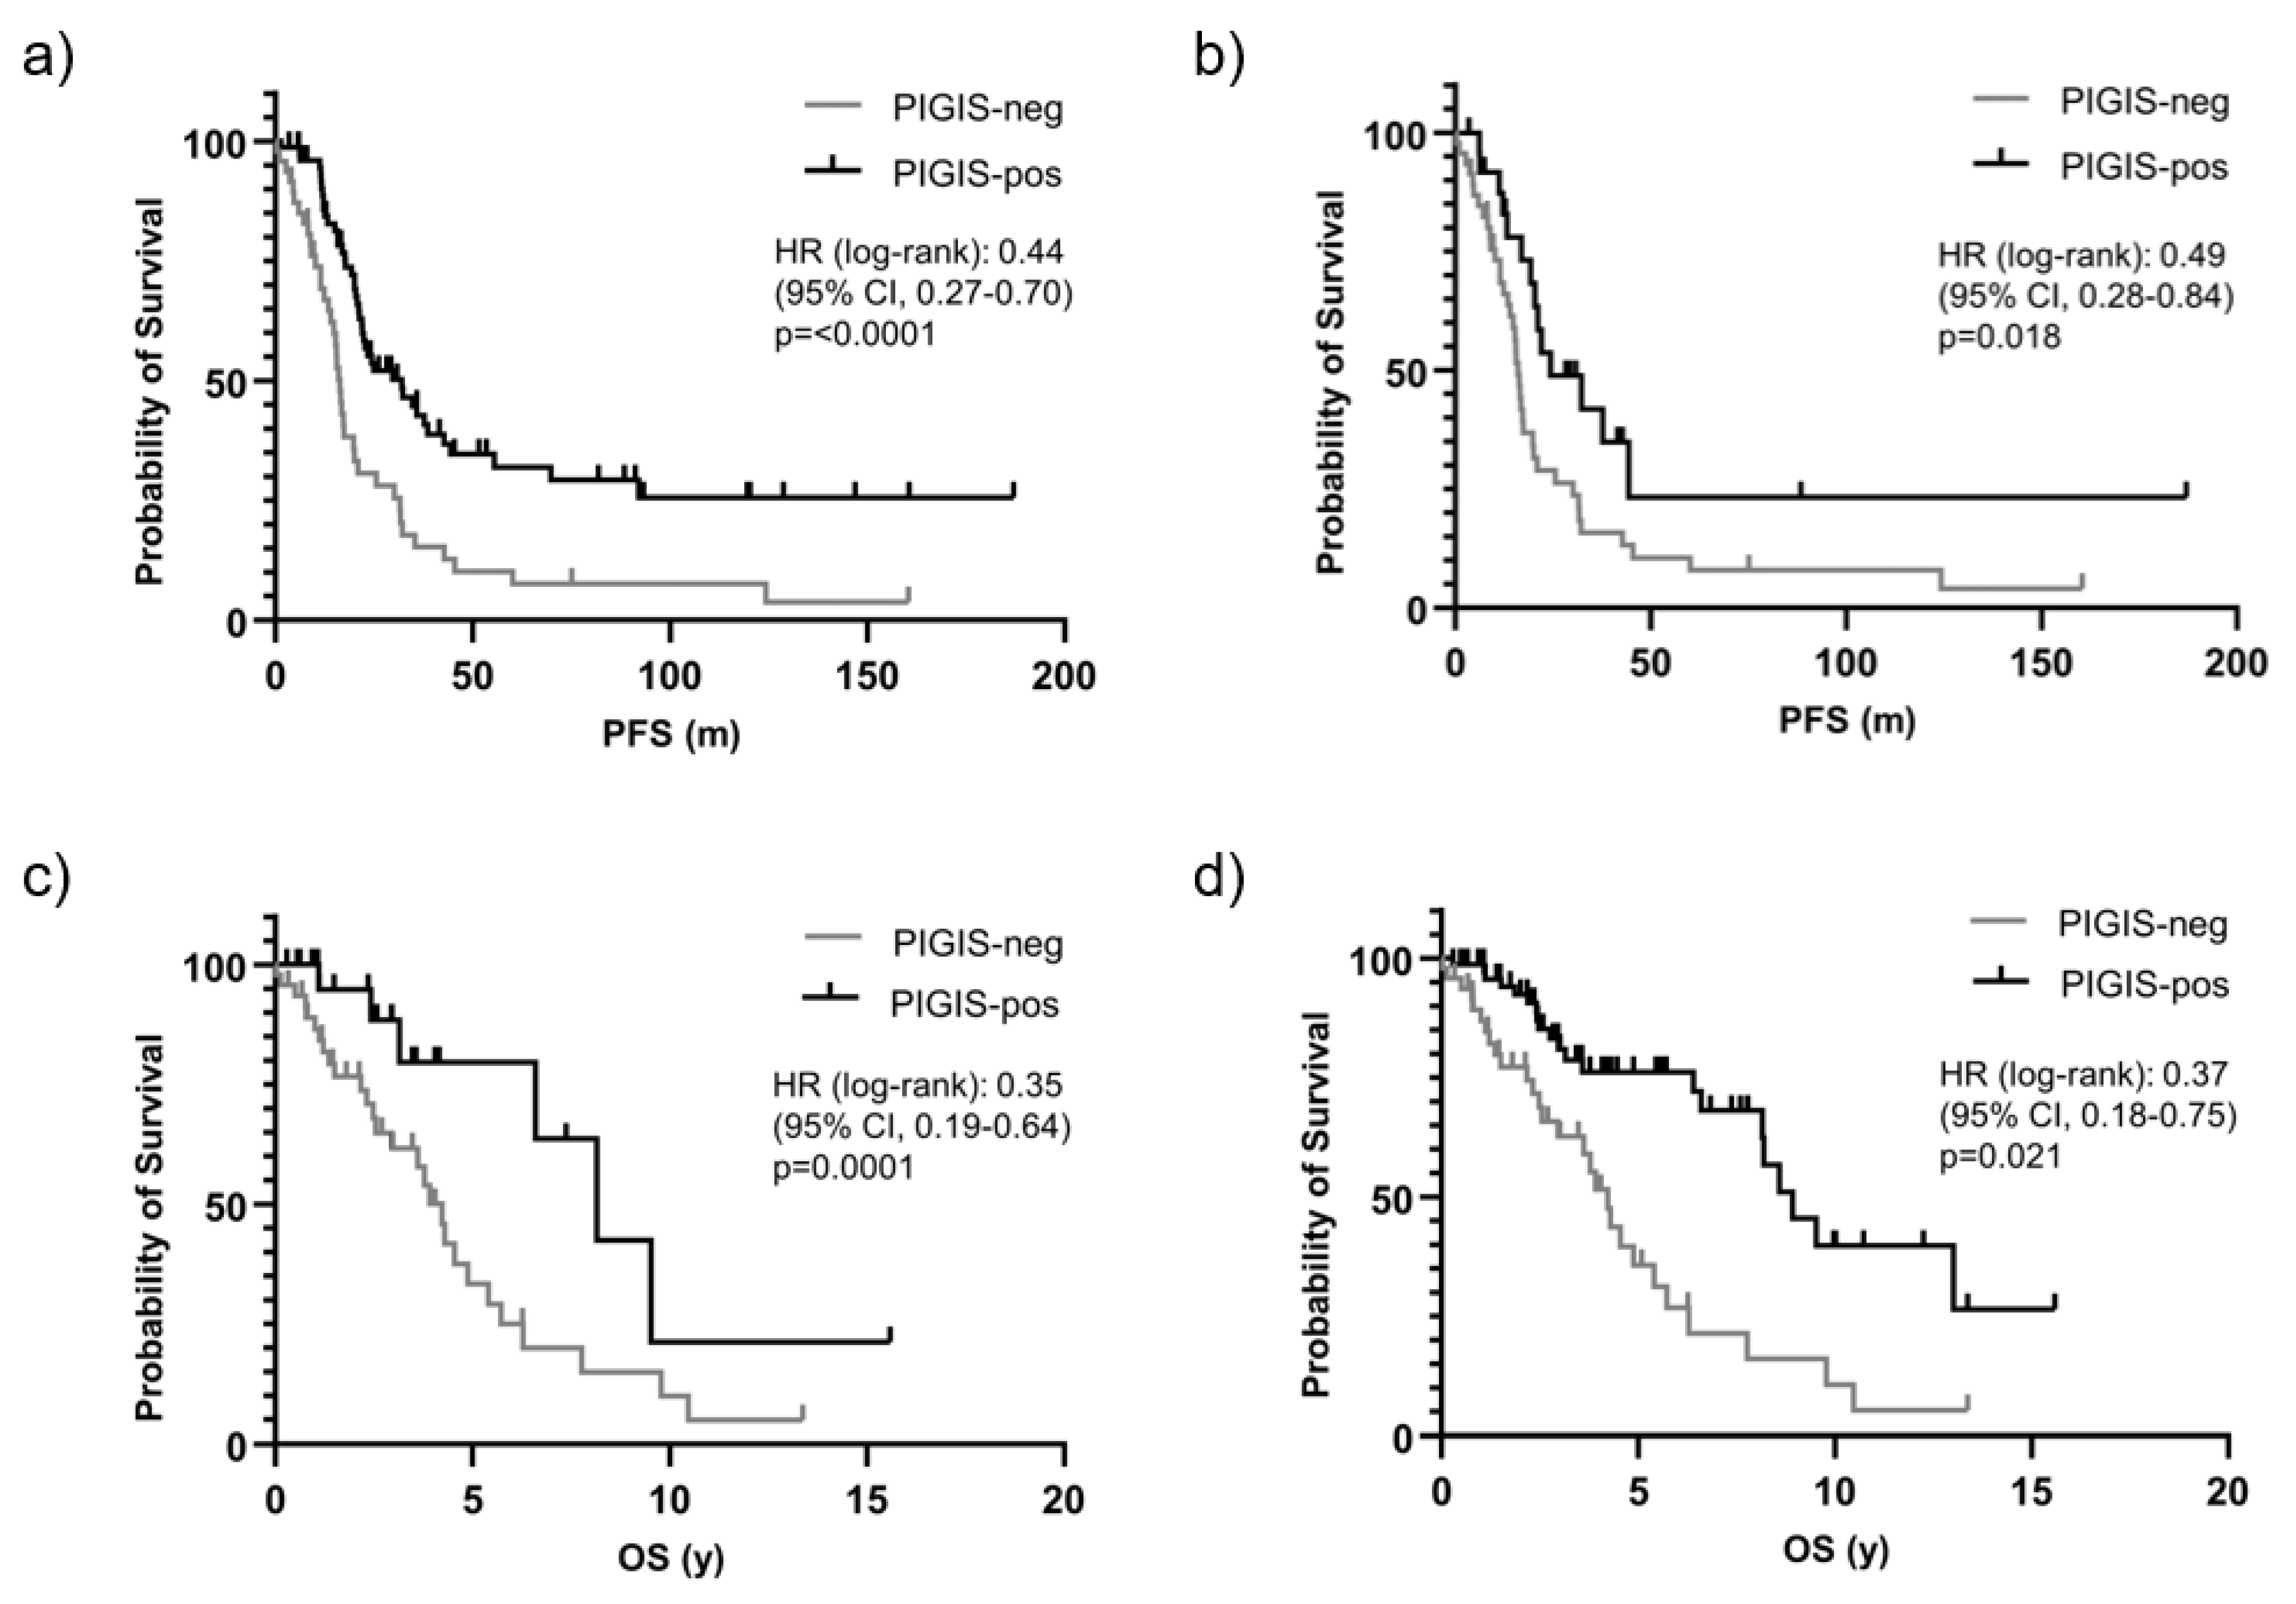
Figure 3.
Analysis of miliary vs. non-miliary tumors showing (a) the distribution of individual Predictive value Integrated Genomic Instability Score (PIGIS) for miliary, non-miliary PIGIS negative and non-miliary PIGIS positive tumors, (b) the progression free survival (PFS) of patients with miliary, non-miliary PIGIS negative and non-miliary PIGIS positive tumors, and (c) the overall survival (OS) of patients with miliary, non-miliary PIGIS negative and non-miliary PIGIS positive tumors.
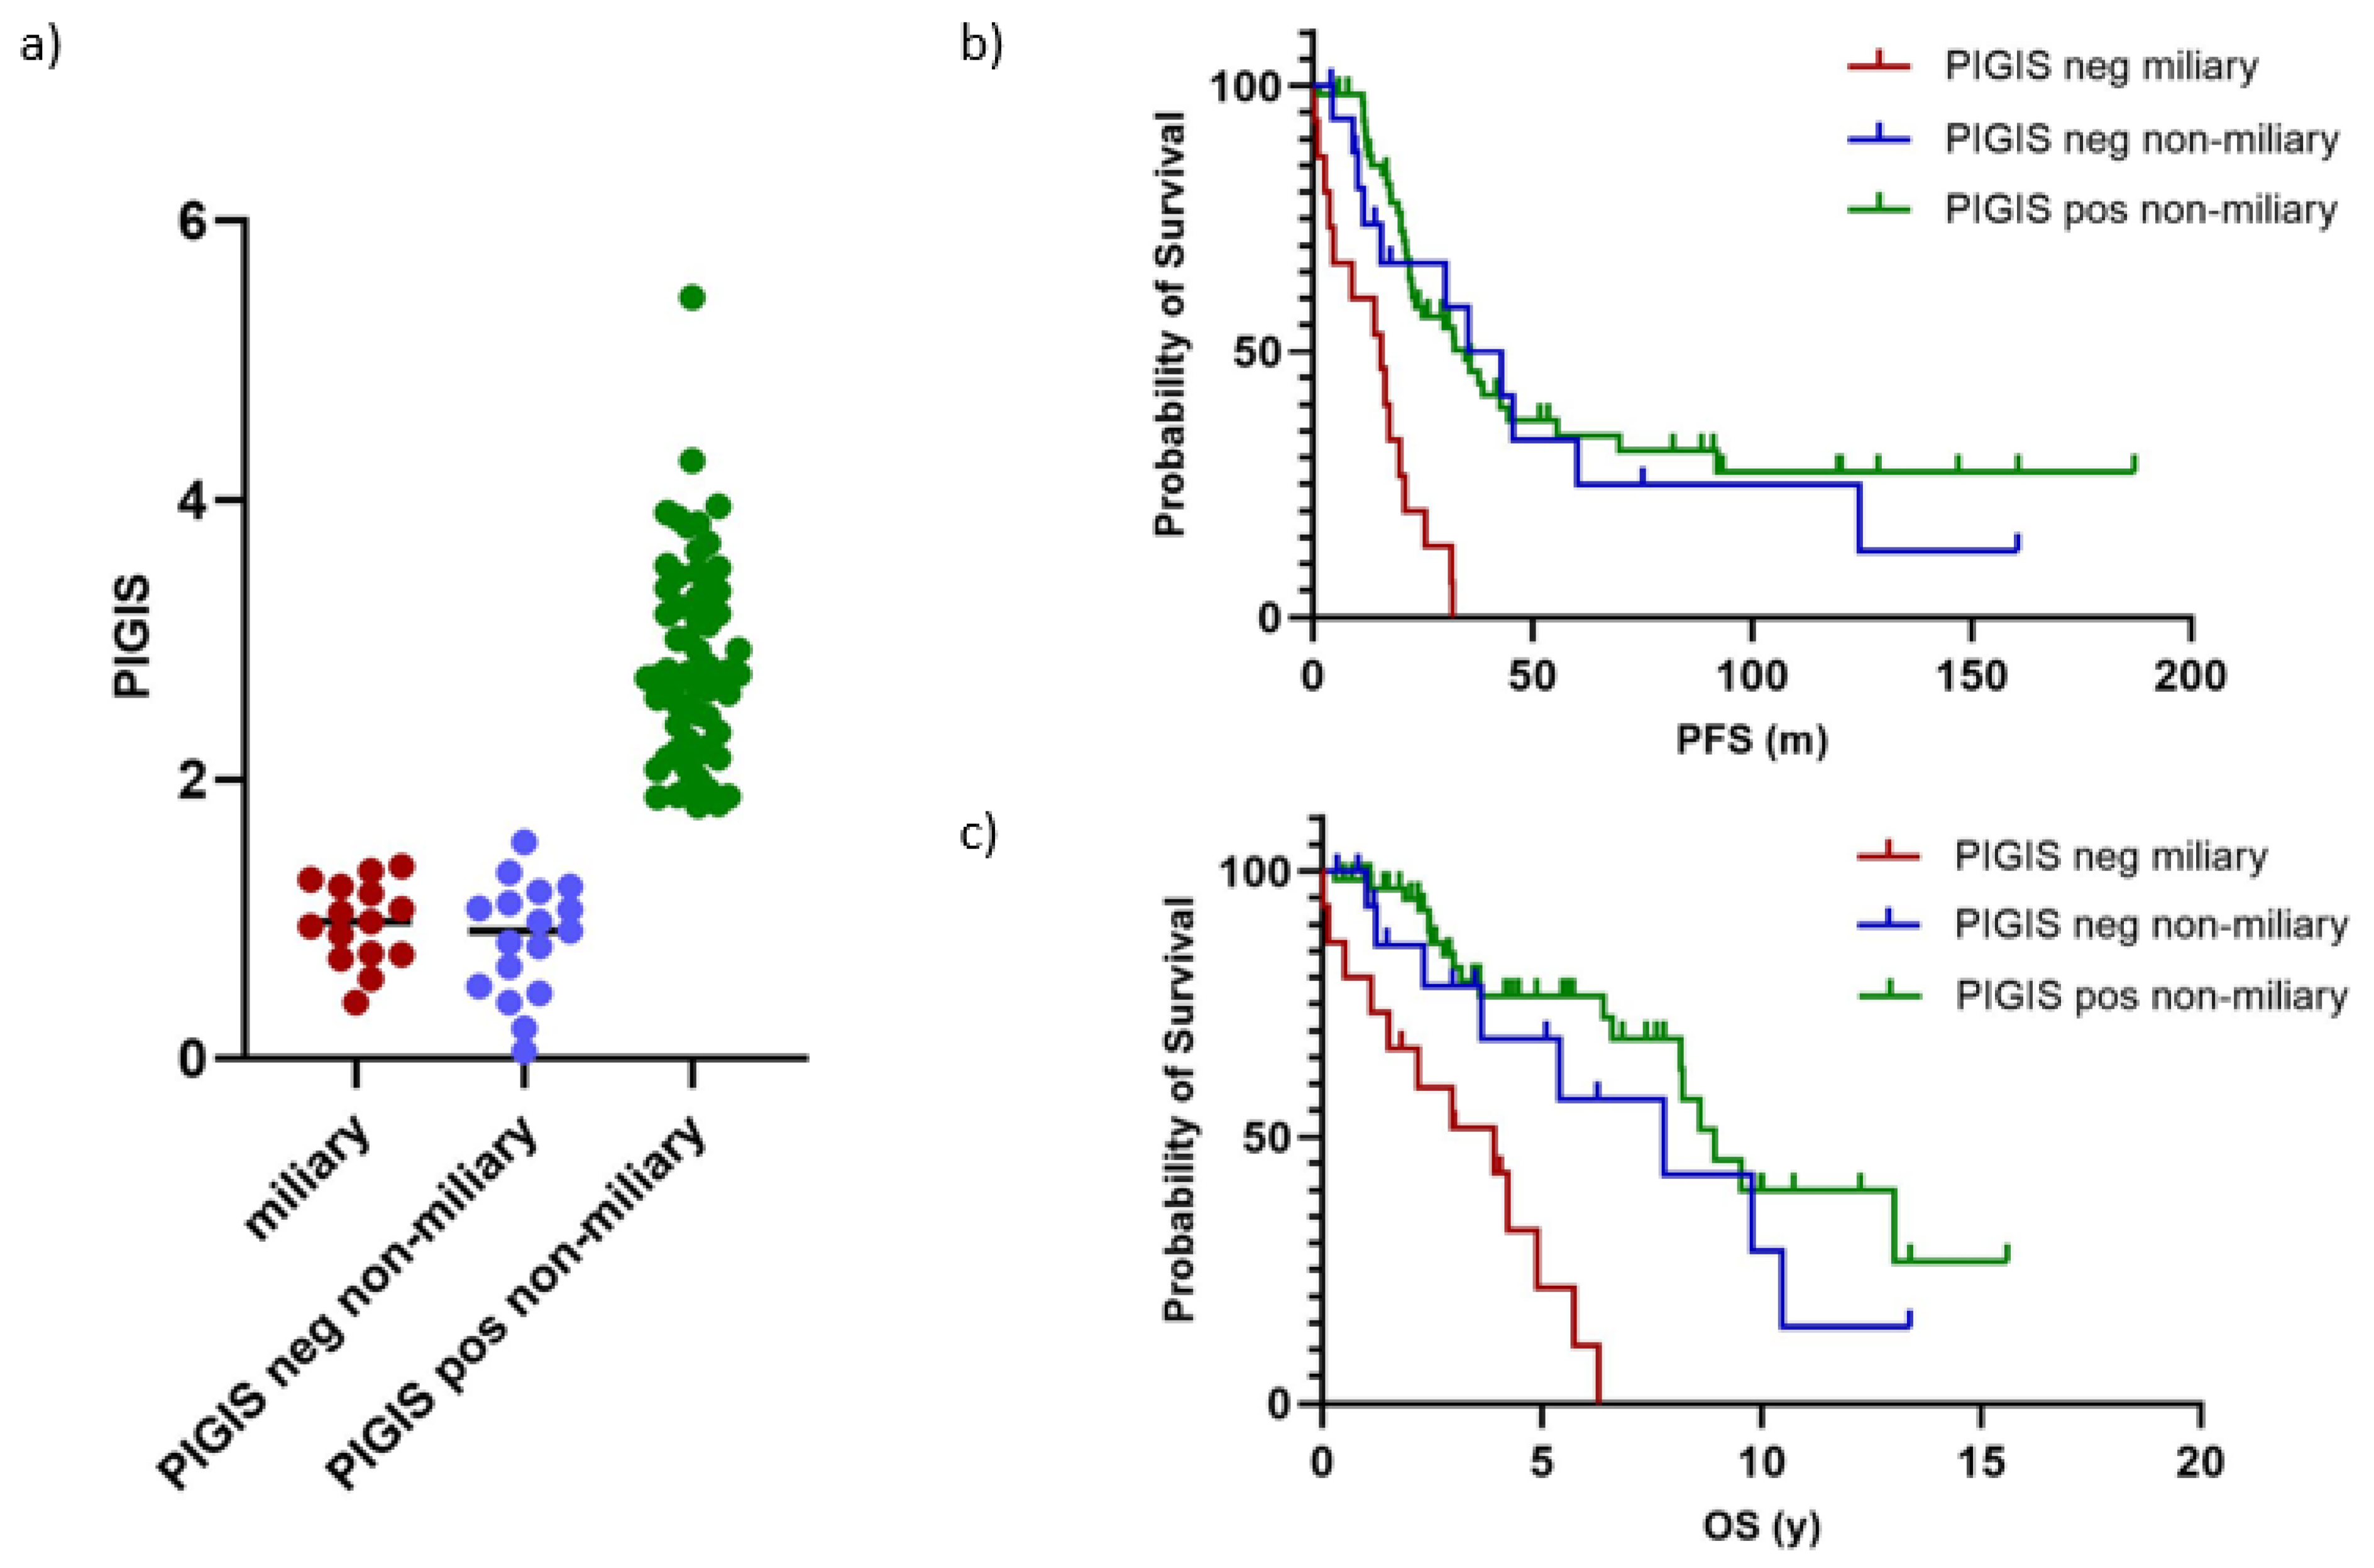

Table 1.
Inclusion and Exclusion Criteria for the Cohort.
| Inclusion criteria | BRCA1/2 mutational status |
| HGOC histology | |
| Exclusion criteria | FIGO stage 1a |
| Variant of uncertain significance in BRCA1/2 | |
| Unclear or to low tumor cell content in the sample | |
| Patients lost in follow up | |
| Death unrelated to Ovarian Cancer diagnosis (2nd malignancy, accident etc.) | |
| Complete documentation of treatment not available. | |
| Peritoneal spread type characterized |
Table 2.
Clinicopathologic Parameters.
| Variable | Patients (N=122) | |
| n | % | |
| ECOG performance status | ||
| 0 | 86 | 70.5 |
| 1-2 | 33 | 27.2 |
| ≥ 3 | 3 | 2.3 |
| Histologic Subtype | ||
| HGS | 109 | 89.3 |
| Endometrioid | 13 | 10.7 |
| Grading | ||
| Grade 2 | 42 | 34.4 |
| Grade 3 | 80 | 65.6 |
| FIGO Classification | ||
| Ic | 5 | 4.1 |
| IIa-IIb | 5 | 4.1 |
| IIIa-IIIc | 88 | 72.1 |
| IVa | 10 | 8.2 |
| IVb | 14 | 11.5 |
HGS=High grade serous, ECOG= Eastern Cooperative Oncology Group, FIGO= International Federation of Gynaecology and Obstetrics.
Table 3.
Patient Treatment Characteristics.
| Variable | Patients N=122 | |
| n | % | |
| Surgery | ||
| PDS | 95 | 77.9 |
| IDS | 27 | 22.1 |
| Residual Disease | ||
| No residual disease | 93 | 76.2 |
| Residual < 1cm | 24 | 19.7 |
| Any residual | 5 | 4.1 |
| Adjuvant CTx | ||
| Carbo + Pacli | 99 | 81.1 |
| Carbo Mono | 6 | 4.9 |
| Carbo * PLD | 3 | 2.5 |
| Cis + Pacli ip | 8 | 6.6 |
| Carbo + Pacli + IO | 6 | 4.9 |
| Maintenance | ||
| No therapy | 56 | 45.9 |
| Bev | 48 | 39.3 |
| PARPi | 4 | 3.3 |
| Bev +PARPi | 8 | 6.6 |
| Bev + IO | 4 | 3.3 |
| Bev + PARPi + IO | 2 | 1.6 |
| Recurrence | ||
| No | 38 | 31.1 |
| Yes | 84 | 68.9 |
| Platinum Option* | ||
| No (PFI < 6 Mo) | 15 | 17.9 |
| Yes (PFI ≥ 6 Mo) | 69 | 82.1 |
| Death | ||
| No | 73 | 59.8 |
| Yes | 49 | 40.2 |
| Mutational Status | ||
| WT | 73 | 59.8 |
| BRCA1 | 34 | 27.9 |
| BRCA2 | 10 | 8.2 |
| RAD51C | 5 | 4.1 |
| Peritoneal spread | ||
| Non-miliary | 91 | 74.6 |
| Miliary | 31 | 25.4 |
PDS=Primary debulking surgery, IDS=Interval debulking surgery, WT= Wild type, BRCA = Breast cancer gene, RAD51C= Radiation sensitive protein 51 paralog C gene, PFI = Progression-free interval, Carbo =Carboplatin, Pacli= Paclitaxel, Bev=Bevacizumab, * in recurrent disease (n = 84).
Disclaimer/Publisher’s Note: The statements, opinions and data contained in all publications are solely those of the individual author(s) and contributor(s) and not of MDPI and/or the editor(s). MDPI and/or the editor(s) disclaim responsibility for any injury to people or property resulting from any ideas, methods, instructions or products referred to in the content. |
© 2024 by the authors. Licensee MDPI, Basel, Switzerland. This article is an open access article distributed under the terms and conditions of the Creative Commons Attribution (CC BY) license (http://creativecommons.org/licenses/by/4.0/).
Copyright: This open access article is published under a Creative Commons CC BY 4.0 license, which permit the free download, distribution, and reuse, provided that the author and preprint are cited in any reuse.


