Submitted:
11 April 2024
Posted:
15 April 2024
You are already at the latest version
Abstract
This paper presents the results of a study on the nature, pace and directions of socio-economic and spatial changes in the Warsaw Metropolitan Area (WMA) related to the suburbanization processes taking place there. In the course of research, data on municipalities from the Local Data Bank were used, and that made it possible to trace the changes occurring in 2002-2021. The selection of ana-lytical characteristics took into account a wide range of socio-economic diversities of the area related to changes in population, construction activity and housing stock, land use and spatial policy, economic and associated with investment attractiveness. The components of diversification were used to develop the typological classes of municipalities. The final result of the study is the identification of the specificity of suburbanization in the OMW which is reflected in the social, economic and spatial aspects of the functioning of municipalities.
Keywords:
suburbanization
; metropolitan area
; Warsaw Metropolitan Area
; Poland
1. Introduction
The forms and nature of suburbanization are determined by the course of urbanization processes. These, in turn, vary from country to country and are subject to change over time. What suburbanization of different latitudes has in common is the complexity of its causes and the multidimensionality of its effects. Suburbanisation is particularly evident in the functional areas of cities, including metropolitan areas as their particularly complex form. Suburbanisation causes many problems associated with its negative impact on the natural environment, on the functioning of urbanized areas and on the formation of socio-spatial structures [6,10,18].
One of the factors determining the entry of cities into the suburbanization phase is mobility. In the case of the population, this is motivated in different ways and requires the right conditions. The affluence of the population, the emergence of the possibility to choose where to live, their needs and preferences in terms of living conditions and lifestyle lead to residential suburbanization. Deterioration of the conditions under which businesses operate in the cities or new requirements regarding the location of commercial activities are the reasons for their relocation to the urban edges. Spatial forms of the city and urban life are emerging in the areas surrounding the urban core. The number, variety, scale and strength of the links between the suburban zone and the urban core are increasing. A process of their functional integration is taking place [5].
The example of suburbanization in the Warsaw Metropolitan Area (WMA) is a special case in Poland. This area has formed around Warsaw, a city with exceptionally strong development potential. As the country’s capital, Warsaw is the central political and administrative hub. Its modern economic development base, which is dominated by specialized services and its cultural and scientific potential, gives the city a special role and importance in the context of the development of the metropolitan area.
Warsaw attracts foreign investment, which fosters further development of the service, financial and high-tech sectors. As a business center with headquarters of corporations, banks and financial institutions as well as representative offices of international companies, Warsaw draws professionals and employees from various industries, strengthening its position as well as that of the entire metropolitan area. Warsaw is also a magnet as a hub of university education and concentrates institutions from the research sector all in one place. This makes Warsaw and its metropolitan area a destination for domestic and foreign migration. A so-called “metropolitan class” has already emerged in the city several years ago, and the expectations, aspirations, opportunities and preferences of those working in Poland’s capital city are reflected in their search for suitable places to live, including in the suburban zone.
Permanent migrations to the suburbs and further located settlements stimulate suburbanization. However, this suburbanization occurs at different rates and has different consequences in the municipalities that make up the metropolitan area. The course of suburbanization processes in the WMA is important from a cognitive and application point of view. This is because the metropolitan area is differentiated in terms of settlement and investment attractiveness on many planes, i.e. costs, access to services, quality of the natural environment and transport accessibility. From the point of view of the sustainable development of the area, the absence of a mechanism designed for programming and managing its development is crucial. The effects of suburbanization are dealt with individually by the municipalities located in the area. Although they are affected by urbanization pressure to varying degrees, many are in danger of losing their values in economic (decline in investment attractiveness, lack of investment areas, outflow of workers), social (breakdown of well-established, traditional social structures, emergence of social conflicts) and spatial (loss of naturally attractive areas, deterioration of the quality of the natural environment) contexts.
Suburbanisation in the Warsaw metropolitan area varies spatially and temporally. It did not appear in all municipalities at the same time, its effects were varied and the prospects of its development also vary from case to case. The main objective of the present study, the results of which are included in this paper, was to identify the dimensions of socio-economic and spatial differentiation of municipalities in the WMA in the context of suburbanization. Additional objectives included the identification of the spheres affected by suburbanization over the last 20 years and an indication of the changes in the characteristics of suburbanization processes in the WMA and the potential directions of its expansion.
2. Materials and Methods
2.1. Study Area
The Warsaw Metropolitan Area (WMA), which is also known as the Capital Region of Warsaw (CRW), is located in the central part of the Mazowieckie Voivodeship. It consists of 70 municipalities, including nine counties: Grodziski, Legionowski, Miński, Nowodworski, Otwocki, Piaseczyński, Pruszkowski, Warszawski Zachodni, Wołominski and the capital city of Warsaw, which has the status of a city with county rights (Figure 1 and Figure 2).
The Warsaw Metropolitan Area covers an area of 6,100 km², which accounts for 17.2% of the area of the Mazowieckie Voivodeship and is treated as a coherent system in which dynamic social and economic changes are taking place, resulting from functional links between its component units. In 2022, the area covered by the present study was inhabited by more than 3.3 million people, which is a significant increase from 2.9 million over the past ten years. During the same period, Poland’s population decreased from 38.5 million to 37.8 million, making the metropolitan area’s share of the country’s total population increase from nearly 7.6% to nearly 8.6%. Currently, the inhabitants of the WMA comprise 59.1% of the population of the Mazowieckie Voivodeship. Despite a nationwide decrease in population between 2003 and 2022, the Warsaw Metropolitan Area has recorded the largest population growth.
Between 2003 and 2020 the Warsaw Metropolitan Area experienced significant demographic changes, characterized by varying patterns of population growth and decline across its municipalities (Figure 3). In accordance with the typology by Webb (1963), the most common municipalities types between 2003 and 2022 were type C, in which positive natural increase is lower than positive net migration and type D, in which positive net migration with surplus compensates negative natural increase [23]. Types C and D included almost 70 of all municipalities in the analyzed period.
In 2003, within the Warsaw Metropolitan Area, 54 municipalities (76%) experienced population growth, while 15 municipalities (21%) faced depopulation. In 16 municipalities, both natural increase and positive migration balance were observed (types B and C). These were primarily municipalities neighbouring Warsaw or well-connected to the capital (e.g., Jabłonna, Lesznowola, Piaseczno, Marki). There were as many as 8 municipalities where depopulation occurred due to both natural decrease and negative migration balance, mainly rural municipalities located in the peripheral parts of the area, mostly in the eastern part.
In 2005 there were 56 populated municipalities (79%), with a clear increase in the share of municipalities in the most favourable demographic situation classified as type C and located along the communication routes leading from Warsaw. Notable were the southern strip (Raszyn, Nadarzyn, Piaseczno, Tarczyn, Prażmów), the northern strip (Łomianki, Jabłonna, Legionowo, Nowy Dwór Mazowiecki, Wieliszew, Serock), and several municipalities to the east of the capital belonging to the Wołomin county (Ząbki, Marki, Wołomin, Kobyłka, Zielonka) and Otwock county (Karczew, Józefów, Wiązowna, Celestynów). That year, 15 municipalities experienced depopulation, mainly rural municipalities on the outskirts of the metropolitan area (e.g., Jadów, Stachówka, Kołbiel).
The most favourable demographic situation occurred in the WMA in 2010 – as many as 61 municipalities saw population growth, of which 50 could be classified as types B and C. The most favourable demographic situation was characterized mainly by rural municipalities well-connected to Warsaw such as Lesznowola, Jabłonna, Żabia Wola, Nieporęt, Wieliszew, Wiązowna. Depopulation occurred in 9 municipalities, with the worst demographic situation during this period occurring in 4 municipalities located in the eastern part of the region (Dobre, Kałuszyn, Latowicz, and Strachówka).
In 2016, the demographic situation in the WMA slightly deteriorated - 59 municipalities experienced population growth, and 12 municipalities faced depopulation. Municipalities to the west of Warsaw began to ageing, with an increasing share of units belonging to type D. The highest migration balance continued to be recorded in municipalities located near Warsaw (Wieliszew, Lesznowola, Ząbki, Kobyłka, and Marki). Among the depopulating municipalities, apart from the peripheral municipalities (Jadów, Stachówka), there were also cities located closer to the capital (Otwock, Piastów).
In 2020, within the Warsaw Metropolitan Area, 49 municipalities (69% of the municipalities studied) experienced population growth, 22 municipalities were depopulating (31%), indicating that the situation was worse than in 2003. 20 municipalities represented type C. It can be observed that this time, the municipalities are also located in the southern strip (Piaseczno, Lesznowola), northern strip (Jabłonna, Wieliszew), northeastern strip (Ząbki, Marki, Kobyłka), and eastern strip (Dębe Wielkie, Mińsk Mazowiecki), however, the share of rural municipalities and those located further from Warsaw than in 2003 has increased. In 2020, there was also a marked increase in the number of municipalities classified as types F and G in close proximity to the capital (Otwock, Legionowo, Piastów).
Demographic projections for the Mazovian Voivodeship for 2022-2040 indicate a further increase in population in the municipalities of the Warsaw Metropolitan Area, which is in contrast to the expected population decline in most municipalities of the rest of the voivodeship.
The choice of the Warsaw Metropolitan Area as the research area was caused by its unique functions, the nature of its internal and external links as well as the complex dynamics of urbanization processes. As the largest agglomeration settlement system and an area with a degree of urbanization ranked among the highest in Poland, the Warsaw Metropolitan Area is characterized by intensive links between Warsaw - its core - and the smaller towns surrounding it, especially those in its immediate vicinity. Compared to other Polish metropolises, it stands out in terms of the level of economic development, the presence of leading enterprises, the availability of advanced services and the quality of life, while also performing important symbolic functions.
While Polish municipalities gained considerable autonomy and authority over the spatial planning, the resultant suburbanization, urban sprawl, and the formation of functional areas around cities have not, however, gained traction in debates over the city-regional planning. The issue of management of metropolitan areas development was resolved by a special act by the central government. On March 9, 2017, the Act on the metropolitan union in the Silesian Voivodeship entered into force, limiting the application of metropolitan structures to the region of cities of the Upper Silesian conurbation. Pursuant to the regulation of the Council of Ministers of June 26, 2017 on the establishment of a metropolitan association in the Silesian Voivodeship under the name "Upper Silesian-Zagłębiowska Metropolia", as of July 1, 2017, the first in Poland multi-purpose metropolitan union. The association began its operations in 2018. The Warsaw metropolitan area is not formally recognized and there is no administrative, institutional or organizational structure responsible for managing the area. However, municipalities from the WMA cooperate with each other. This cooperation is largely bound to public transport, municipal services (waste management and education), environmental protection, and Integrated Territorial Investments (ITI) - a mechanism enabling municipalities to prepare development strategies at a supra-local level.
2.2. Research Design
The study used data and information from the Local Data Base (LDB), the RWDZ database - Register of Applications, Decisions and Notifications in Construction Matters and the Demography database. The data covered the years 2002-2021. A principal component analysis was carried out to determine the nature, pace and direction of socio-economic change in the WMA. Factor analysis, a multivariate technique, uncovers clusters of variables that exhibit comparable patterns of fluctuation. This approach is designed to simplify the intricacy inherent in any given data set. It operates under the premise that a limited number of core dimensions are responsible for the variability observed in individual variables [9]. These underlying dimensions are represented through the creation of new, composite variables known as factors [7].The main goal of factor analysis is to simplify and interpret data by reducing a large number of variables into a smaller set of factors.
The process begins with the examination of correlations among the observed variables. High correlations suggest that variables share a common underlying factor. Factor analysis then quantifies how much of the variance in the observed variables can be attributed to these underlying factors, which are not directly observable but are inferred from the data.
The factors are constructed as linear combinations of the original variables, and each factor represents a specific dimension of the data. These factors are designed to be independent of one another, capturing different aspects of the data. The analysis provides factor loadings, which indicate the strength and direction of the relationship between the variables and the factors, helping to interpret the factors. Factor scores represent the extracted dimension in the spatial units that the analysis is based on. The higher (positive) or lower (negative) the factor scores calculated for a single unit, the more the unit is characterized by the respective dimension [3,7].
Factor analysis is frequently employed by researchers from various scientific disciplines to analyze diversifications occurring in metropolitan areas [1,2,16,21]. This technique has also been used to identify transformations in the socio-spatial structure of Warsaw [20]. However, there is a lack of studies demonstrating the direction of socio-economic and spatial changes occurring in the Warsaw Metropolitan Area, related to the suburbanization processes taking place within its region.
The analysis reduced the number of variables studied and enabled the identification of the most important areas of WMA’s diversification. The selection of characteristics for the analysis took into account a wide range of the area’s socio-economic variations associated with changes in:
- population (change in natural birthrate; change in migration balance; change in old-age dependency ratios; change in feminization rate; change in population density; change in the number of marriages),
- construction activity and housing stock (change in the number of building permits; change in the number of dwellings, including commissioned dwellings; change in the average floor area of dwellings; change in the number of persons per dwelling; change in the proportion using gas infrastructure, sewerage and water supply networks),
- land use and spatial policy (change in the share of the area covered by the existing local spatial development plans; change in the share of the area of agricultural land subject to alteration in terms of designation for non-agricultural purposes in the plans; change in the share of the area of forest land subject to alteration in designation for non-forest purposes in the plans; change in the proportion of areas designated in the study requiring switching from agricultural land use to use for non-agricultural purposes; change in the proportion of areas designated in the study requiring moving from forest land use to use for non-forest purposes; change in the proportion of parks, green spaces and residential green areas; change in the share of green areas),
- economic and investment attractiveness (change in the number of businesses - including micro-enterprises; change in the number of natural persons engaged in business activities; change in the share of PIT and CIT taxes in municipalities’ own revenues; change in the number of businesses in sections J-N, the creative sector, and the agri-food sector; change in the number of accommodation facilities and beds).
The reduction of variables was carried out using the correlation-factor method - unimportant variables with a low coefficient of variation and high correlation were eliminated. As a result, out of a set of 49 preselected variables, 27 were ultimately used for analysis.
The results of the principal component analysis were used to classify the municipalities, which was carried out using hierarchical cluster analysis. A classification tree was obtained, which presents several clusters of elements with a similar structure of the examined components. On this basis, four basic typological classes of municipalities were distinguished, and within them several subclasses.
3. Results
3.1. Dimensions of Socio-Spatial Diversity of the WMA and Spheres Affected by Suburbanisation
Principal component analysis made it possible to distinguish 5 latent dimensions in which the analyzed variables are grouped (Table 1, Figure 4). The resulting components together explained 50.8% of the variation in the baseline variables, and their significance varied quite considerably.
The first component was defined as economic urbanization. The following components correlated most strongly with it: the change in the number of business entities in sections J-N per 1,000 population, the change in the number of entities employing up to 9 persons per 10,000 inhabitants of working age, the change in the number of business entities per 1,000 inhabitants of working age, the change in the share of PIT in the municipality’s own income and the change in the number of individuals running a business per 100,000 inhabitants of working age.
This component differentiated the municipalities most strongly in terms of changes in the number of businesses operating there, especially micro-enterprises engaged in professional activities. This allowed it to identify the municipalities that have become attractive places for business in the last two decades - this group included Warsaw, Izabelin, Lesznowola, Konstancin-Jeziorna, Stare Babice, Michałowice and Nadarzyn as well as municipalities where the dynamics of economic development was the lowest - rural municipalities prevailed among them, i.e. Mrozy, Latowicz, Jakubów, Strachówka, Siennica, Stanisławów and Poświętne. The spatial distribution of the value of the first principal component clearly divided the Warsaw Metropolitan Area into east and west. Municipalities located to the west of Warsaw, especially those in close proximity, stood out in terms of high values of this component, while most of the municipalities with the lowest values were located in the eastern, peripheral part of the WMA.
The second component was referred to as demographic urbanization because three components correlated most strongly with it, i.e. the change in the old-age dependency ratio (negative correlation), the change in the birth rate and the change in population density.
This variable clearly differentiated between municipalities located at two poles: demographically young and attractive from the point of view of settlement, characterized by a high natural increase exceeding the negative migration balance, e.g. Ząbki, Marki, Jabłonna, Lesznowola and clearly ageing municipalities with a high old-age dependency ratio, e.g. Podkowa Leśna, Izabelin, Pomiechówek, Karczew and Poświętne. The spatial distribution of the values of the second principal component was rather mosaic in character - in the vicinity of Warsaw you can find both demographically young and clearly ageing municipalities, similarly in the outlying areas of the WMA, although here municipalities with low values of this component prevail.
Another component was defined as functional-spatial urbanization and correlated most strongly with two variables, i.e. the change in the average floor area per dwelling and the change in the number of building permits per 1,000 population.
This component attained high values in municipalities characterized by a large and increasing number of building permits issued in recent years and a fairly substantial usable area of dwellings per capita, which indicates a growing share of single-family houses in the development structure. This component strongly polarizes the area of Warsaw’s suburban municipalities, as it goes considerably high in rural or urban-rural municipalities, i.e. Serock, Wiązowna, Nieporęt, Michałowice, Raszyn or Stare Babice, and low in towns, i.e. Ząbki, Pruszków, Marki, Błonie, Nowy Dwór Mazowiecki, Legionowo, Piaseczno and Sulejówek, where the number of newly constructed multi-family buildings is increasing.
The fourth component, identified as tourist urbanization, correlated most strongly with four variables, i.e. change in the average number of inhabitants per dwelling (negatively), change in the number of tourist entities per 1,000 population, change in the number of beds in tourist facilities per 1,000 population and change in the number of dwellings per 1,000 population.
This component makes it possible to identify municipalities where the tourist function is developing and where second homes are being built. It reaches high values in municipalities, such as Serock, Wieliszew, Nowy Dwór Mazowiecki, Nieporęt or Pomiechówek, i.e. in areas of high natural value which also offer tourist or historical attractions.
At the opposite end of the spectrum are municipalities whose tourism potential has been clearly declining in recent years - Podkowa Leśna, Celestynów, Kampinos, Jabłonna, Brwinów, Stanisławów, Halinów or Cegłów, which may be linked to a reduction in the tourism function of these municipalities or to the state of sufficient saturation in tourist facilities.
The last component was defined as infrastructural urbanization. Three variables demonstrated the strongest correlation with it, i.e. change in the share of sewerage users, change in the share of water supply users and change in the share of new dwellings in the total number of dwellings.
This component differentiates municipalities in terms of the provision of mains installations and the increase in new dwellings. It identified municipalities where there has been a dynamic increase in the number of new dwellings and dwellings connected to the water supply and sewerage network, e.g. Pruszków, Izabelin, Ożarów Mazowiecki, Nowy Dwór Mazowiecki and Kampinos, and municipalities where these changes are slow or do not keep up with the development of residential development, e.g. Żyrardów, Warsaw, Jabłonna and Klembów.
3.2. Typology of WMA Municipalities According to the Course of Suburbanisation
The differentiation components in the WMA discussed hereinabove were used to classify the municipalities. Four basic typological classes of municipalities were distinguished, and within them several subclasses (Figure 5).
The first type distinguished includes municipalities in the slowdown phase of the suburbanization process (type 1). Within them, two subtypes can be distinguished: The first is dominated by municipalities where there has been a marked economic slowdown, while the second is dominated by a slowdown in demographic processes.
The first sub-type (type 1a) is represented by municipalities such as Cegłów, Góra Kalwarii, Legionowo, Otwock and Sulejówek. The economic attractiveness of these municipalities declined in the period under study, as demonstrated by economic indicators which were significantly lower than the average for the WMA as a whole. They are also municipalities with low settlement attractiveness, as evidenced by very meagre real growth and a small increase in new housing.
Subtype two (type 1b) is distinguished by a slightly higher increase in population as a result of a positive migration balance. However, natural attrition is higher than in the first sub-type. Municipalities in this group are mainly distinguished by a progressive ageing of the population with some migration stagnation. Examples of this are Błonie, Kampinos, Podkowa Leśna, Pruszków and Tarczyn.
The second type of municipalities was characterized by an improvement in economic indicators and an increase in construction activity in their area (type 2). Municipalities belonging to this category are in the continuation phase of moderate suburbanisation processes.
Within it, two sub-types can be identified. The first sub-type (type 2a) is characterized by strong economic development, these are municipalities in which the largest number of businesses have been established, including micro-enterprises and professional businesses, and in which revenues to local budgets from PIT and CIT taxes have increased the most. It is noteworthy that an outflow of residents can also be seen in these municipalities. This group includes Celestynów, Józefów, Konstancin - Jeziorna, Raszyn, Wiązowna, Zielonka, Stare Babice and Michałowice.
The second sub-type (type 2b) is mainly distinguished by the dynamic development of housing construction. In municipalities belonging to this category, the number of new dwellings is increasing, the average floor area per dwelling is rising and the percentage of those using the water supply system is also increasing. At the same time, these are also municipalities with a small natural attrition rate and a still small but negative migration balance. Examples include Łomianki, Mrozy, Radzymin and Baranów.
The third sub-type is formed by municipalities in the continuation phase of intensive suburbanization (type 3). These are units where there has been a marked improvement in the demographic and economic situation and housing development. Two sub-types can also be distinguished for this type. The first one (type 3a) is represented by the most attractive municipalities in terms of settlement, where there has been a strong, real increase in the population as a result of the natural birth rate increase and positive migration balance as well as a clear development of housing. These are also the units in which there has been a significant increase in the share of PIT in the municipality’s own income, which testifies to the increasing affluence of its residents that is higher than elsewhere. It has also been noted that with the influx of new residents, businesses, especially sole proprietorships, are also relocating to these municipalities. Only two municipalities belong to this type, i.e. Wieliszew and Lesznowola.
Many more municipalities are represented by the second sub-type (type 3b). It is also distinguished by an increase in population, but in this case, there is a negative migration balance. These municipalities are demographically quite young. They show lower construction activity but stand out for having the strongest growth in the number of building permits issued, which may precisely indicate a stronger development of housing in the coming years. This sub-type is represented mainly by rural and urban-rural municipalities, i.e. Brwinów, Dębe Wielkie, Grodzisk Mazowiecki, Kobyłka, Nadarzyn, Prażmów, Żabia Wola and Halinów.
The last type is represented by municipalities in the evolutionary phase of conditionality, where the most internally diverse suburbanization processes are taking place (type 4). Within this type, three sub-types can be distinguished. The first sub-type (type 4a) is represented by two cities: Warsaw and Żyrardów. It is characterised by an ageing population, a decline in construction activity in the period under study, stagnation in investment in technical infrastructure but at the same time clear economic development. These are the municipalities where the strongest growth in revenues to local budgets from PIT and CIT taxes is observed as well as an increase in the number of entities engaged in professional activities.
The second sub-type (type 4b), in turn, is characterized by a decline in construction activity, a significant outflow of population with a fairly high birth rate. This group includes the municipalities of Jabłonna, Marki, Piaseczno and Ząbki. These are municipalities which a number of years ago showed considerable settlement attractiveness and recorded a positive migration balance. However, in recent years, the suburbanization processes in them have weakened, but the effect of this “migration boom” and the influx of young families is a high birth rate.
The last sub-type (type 4c) is represented by one municipality - Serock. It is distinguished by a marked development of the tourist function and an increase in construction activity that has not been matched by the development of technical infrastructure. It is a municipality with a record increase in the number of tourist facilities and accommodation places as well as a clear increase in the number of new dwellings and their floor space. It is also the only municipality to record a decrease in CIT revenues received by the local budget.
As the results of the analyses show, the main spheres affected by/associated with suburbanization are the rate of economic development, the number, changes and demographic characteristics of the population of the municipalities, construction activity and investment in technical infrastructure.
3.3. Changes in the Characteristics of Suburbanization Processes in the WMA and Directions of Its Potential Expansion
The results of the study show that suburbanization in the WMA is diverse in terms of directions and trends. It can be said that the municipalities went through (or are still going through) the first “suburbanization cycle” experiencing an influx of migrants, which has changed their socio-demographic structure, influenced the economy and spatial development. The rate of suburbanization varied, which was connected with, among other things, land rent and transport accessibility - these factors had the greatest impact on the popularity of individual municipalities.
The contemporary characteristics of the municipalities in the WMA (following 20 years of suburbanization) are the result of the historically found development conditions, the time when the “suburbanization of the municipality” started and the course of this process. It is mainly about the degree of planning or its spontaneity. Municipalities which entered a phase of slower development (including a weakening of the suburbanization process) have usually exhausted their resources or lost their attractiveness for other reasons. In the long term, this may translate into their further development. It can also be assumed that a change in external conditions such as the development of transport infrastructure will modify the suburbanization paths in the WMA. It should also be remembered that for several years now there has been a return trend of “returners”, i.e. those coming back to cities, and they are not uncommon in the WMA. It is also noteworthy that next to municipalities that have fundamentally changed their image in the last twenty years, there are municipalities that we called “transparent” in our analyses - despite the changes in the neighborhood in the profile of these municipalities, we do not find any signs of transformation of socio-demographic structures or functions or forms of development. The “transparent” municipalities are mainly found in the eastern part of the WMA. How long will they remain “transparent”? Data on property prices suggest that suburbanization will also make an appearance in the eastern part of the WMA in the near future.
4. Discussion
The results of the study show that the WMA is an example of a complex functional and spatial structure. Urbanization in metropolitan areas leads to the development of urban-rural regions, which have the character of polycentric systems. This is the case of OMW. In urban-rural regions with polycentric arrangements of settlement network elements, we are not only dealing with the issue of the relationship between the central city and its surroundings, but also with the complex relationships between the spatial components of the region [10,17]. The different characteristics of suburbanization in different parts of the OMW influence the specificity of these relationships.
The picture of the WMA municipalities in the context of their suburbanization does not give grounds to conclude that we are dealing with the emergence of entirely new quality of suburbanization and thus with new relations in the urban-rural region [14]. The problems experienced convince us that the path of suburbanization that is being pursued is the path that could have been found in recent years in many countries with a high level of urbanization. In other words, in the case of the WMA, the mistakes in managing development at the regional, metropolitan and local levels known from these countries are being repeated [4,15,19]. For this reason, it is difficult to judge if and when we can expect to witness a functional and spatial evolution of the WMA enabling us to speak of decentralized, sustainable development. Sustainable development in the context of metropolises and metropolitan areas sounds somewhat provocative, of course. However, new suburbs defined by terms such as edge cities, metroburbia, boomburgia, ex-burbia, technoburbia or expolis make us take a critical look at the traditional model of suburbanization and revise previously held beliefs. New suburbs are located not in suburban zones but rather away from the central city. They are not dominated by the residential function. Jobs are located in them and development trends indicate that new suburbs can become attractive labor markets. The larger-scale emergence of residential functions and accompanying services in new suburbs may change their face and influence the shape and functioning of regional settlement systems. Suburbs will become new, autonomous multifunctional components of that system.
When discussing suburbanization in the WMA, it is necessary to refer to the general trends in the traditional model of this urban process. This model assumes that one of the main reasons why people migrate to suburban areas is the search for better living conditions. Moreover, suburbanization is stereotypically associated with the migration of families seeking convenient conditions for raising children. Typically, it is also the middle class who migrate to the suburbs because of the opportunity to purchase larger houses or flats at a lower price compared to the real estate market in the central city. In addition to the middle class, corporate employees are also migrants - many companies choose to locate their headquarters outside the city center, leading those employees who are looking for housing choose nearby suburban areas. Suburbanization affects most areas with a well-developed transport infrastructure. It is also possible that an ageing population and changes in the structure of families and households are leading to the migration of older people looking for a quiet place to live.
The results of the study show that all - except one - of the components constituting the traditional suburbanization model are present in the case of the processes taking place in the WMA. The missing component is the migration of corporate employees to the suburban zone due to the location of the workplace. Corporate headquarters are still located in Warsaw.
All other components of the traditional suburbanization model are present in the WMA, but - as the typological classification shows - to varying degrees depending on the municipality.
It seems that the differences in the suburbanization of municipalities in the OMW are particularly important from the point of view of development programming in accordance with the principle of sustainable development. A regional urban policy component and a multi-level management approach should be introduced into the discussion about the future of the OMW [8,12,13,22].
5. Conclusions
Suburbanization does not happen by chance. Its course, forms and multidimensional effects are the effects of policies and the ways in which they are implemented. In functional terms and in terms of how politics is understood, suburbanization is a political issue: an appropriately organized socio-political system (the state, its institutions, regulations and actions taken) should ensure socio-economic development by, among other things, addressing problems and conflicts arising from the failure of public authorities to respond adequately and in a timely manner. The current system of planning and management of urban functional areas in Poland does not counteract the emergence of problems and does not mitigate their consequences. For example, the uncritical adaptation several years ago of the competitiveness paradigm was reflected in the space by allocating large areas for housing development in many municipalities without rational justification.
In general, suburbanization had the most dynamic character and visible effects in municipalities with transport accessibility. The historically developed sectoral pattern and the infilling of areas between transport lines with development is evident. Economic development took place in suburbs with mixed functions. However, transport accessibility was also important here.
Most of the WMA municipalities are in the slowing down or moderate continuation phase of development and suburbanization processes. Type 3 municipalities are much less numerous. This type comprises municipalities in the continuation phase of intensive suburbanization. Generalizing, we can say that these are units where there has been a clear improvement in the demographic and economic situation and housing development. In part, these are demographically young municipalities. They are attractive in terms of settlements, show a strong real growth as a result of their high birth rate and positive migration balance and have seen a clear increase in housing development. In some of them, the number of building permits has increased significantly, which promises stronger housing development in the coming years. In these municipalities, there has also been a clear increase in the share of PIT in the municipality’s own revenues. With the influx of new residents, companies, especially sole proprietorships, are also relocating to these municipalities.
As is clear from the previous discussion on the types and sub-types of municipalities, the main spheres affected by suburbanization are the rate of economic development, the number, changes and demographic characteristics of the population of the municipalities, construction activity and investments in technical infrastructure.
Author Contributions
Conceptualization: Dudek-Mańkowska, S., Grochowski M., Methodology Dudek-Mańkowska, S., Formal analysis Dudek-Mańkowska, S., Writing Dudek-Mańkowska, S., Grochowski M., Visualization Sitnik, K.
Funding
No.
Institutional Review Board Statement
Not applicable
Informed Consent Statement
Not applicable
Data Availability Statement
Not applicable
Acknowledgments
In this section, you can acknowledge any support given which is not covered by the author contribution or funding sections. This may include administrative and technical support, or donations in kind (e.g., materials used for experiments).
Conflicts of Interest
“The authors declare no conflicts of interest.”
References
- Asikhia, M. O. , Nkeki, N. F. Polycentric employment growth and the commuting behaviour in Benin Metropolitan Region, Nigeria. Journal of Geography and Geology 2013, 5(2), 1-17.
- Brusch, I. , Brusch, M., Kozlowski, T. Factors influencing employer branding: Investigations of student perceptions outside metropolitan regions. International Journal of Quality and Service Sciences 2018, 10(2), 149-162.
- Davies, W. Factorial Ecology. 1984. Gower: Aldershot.
- Grochowski, M. (ed.) Suburbanizacja. Człowiek – zmiana – przestrzeń, (Suburbanization. Man – change – space), Rządowa Rada Ludnościowa, 2023, Warszawa.
- Grochowski, M. Samorząd terytorialny a rozwój zrównoważony obszarów metropolitalnych (Local government and sustainable development of metropolitan areas). Mazowsze Studia Regionalne, 2009, 2, pp. 73–88. [Google Scholar]
- Grochowski, M. Samorządność lokalna a terytorialny wymiar rozwoju. Zarządzanie obszarami funkcjonalnymi (Local self-government and the territorial dimension of development. Management of functional areas development). Mazowsze Studia Regionalne, 2014, 15, pp. 119–136. [Google Scholar]
- Hatz, G. Features and dynamics of socio-spatial differentiation in Vienna and the Vienna Metropolitan region. Tijdschrift voor economische en sociale geografie 2009, 100(4), 485–501. [Google Scholar] [CrossRef]
- Karakayaci, Z The concept of urban sprawl and its causes, The Journal of International Social Research, 2016, vol. 9, issue 45, pp. 815-818.
- Knox, P. , Pinch S. Urban Social Geography. An Introduction. 5th edition. 2000, Harlow: Pearson.
- Korcelli, P. , Grochowski, M. , Kozubek, E., Korcelli-Olejniczak, E., Werner, P. Development of urban-rural regions: from European to local perspective. Monografie IGiPZ PAN, 2012, 4, IGiPZ PAN, Warszawa. [Google Scholar]
- Metropolia Warszawska, Available online: https://omw.um.warszawa.pl/ (accessed on 10.09.2023).
- Moisio, S. and Jonas, A.E.G. City-regions and city-regionalism. In: Handbook on the Geographies of Regions and Territories Eds. Paasi, A., Harrison, J. and M. Jones, Cheltenham: Edward Elgar Publishing, 2018, pp. 285-297.
- Podawca, K. , Karsznia, K., Pawłat-Zawrzykraj, A. The assessment of the suburbanisation degree of Warsaw Functional Area using changes of the land development structure, Miscellanea Geographica, 2019, Vol. 23, No. 4, pp. 215-224.
- Podawca, K. , Mrozik, K Dywersyfikacja stopnia realizacji procesów planistyczno-inwestycyjnych w gminach Warszawskiego Obszaru Funkcjonalnego (Diversification of planning and investment processes in the municipalities of Warsaw Functional Area), Scientific Review Engineering and Environmental Sciences, 2019, vol. 28(1), pp. 105-117.
- Porczek, M., Typology of Localities in the Warsaw Metropolitan Area Resulting from the Spatial Development Structure, Sustainability, 2023, 15, 15879. [CrossRef]
- Prasongthan, S. Factors affecting intention to travel of people with disabilities in Bangkok Metropolitan Region: A preliminary study. Asian Administration & Management Review 2018, 1(2).
- Ravetz, J. , Fertner, C., Nielsen, T.S. (2013). The dynamics of peri-urbanization, In: Peri-Urban Futures: Scenarios and Models for Land Use Change in Europe, Nilsson, K., Pauleit, S., Bell, S., Aalbers, C., Nielsen T.S. (Eds.),. 2013, Springer, Heidelberg, New York, Dordrecht, London, pp. 13–44.
- Śleszyński, P (ed.) 2012, Warszawa i obszar metropolitalny Warszawy a rozwój Mazowsza (Warsaw and its metropolitan area versus the development of Masovia), Trendy Rozwojowe Mazowsza, 2012, no. 8, pp. 1-160.
- Śleszyński, P. , Nowak, M., Legutko-Kobus, P., Hołuj, A., Lityński, P., Jadach-Sepioło, A., Blaszke, M. Suburbanizacja w Polsce jako wyzwanie dla polityki rozwoju (Suburbanization in Poland. Challenges for development policies), Cykl Monografii, 2021, 11/203, Komitet Przestrzennego Zagospodarowania Kraju PAN, Warszawa.
- Smętkowski, M. Socio-spatial differentiation in Warsaw: inertia or metamorphosis of the city structure? Geographia Polonica 2011, 84(2), 115–133. [Google Scholar] [CrossRef]
- Sun, A. , Huang, Y., Yang, L., Huang, C., Xiang, H. Assessment of the Impact of Basic Public Service Facility Configuration on Social–Spatial Differentiation: Taking the Zhaomushan District of Chongqing, China. Sustainability 2023, 16(1), 196.
- Wachsmuth, D. Competitive multi-city regionalism: Growth politics beyond the growth machine. Regional Studies, 2017, 51(4), 643–653.
- Webb, J.W. The natural and migrational components of population changes in England and Wales, 1921–1931. Economic Geography 1963, 392, 130–148. [Google Scholar] [CrossRef]
Figure 1.
Study area: Municipal division of the Warsaw Metropolitan Area. Source: https://omw.um.warszawa.pl/ [12].
Figure 1.
Study area: Municipal division of the Warsaw Metropolitan Area. Source: https://omw.um.warszawa.pl/ [12].
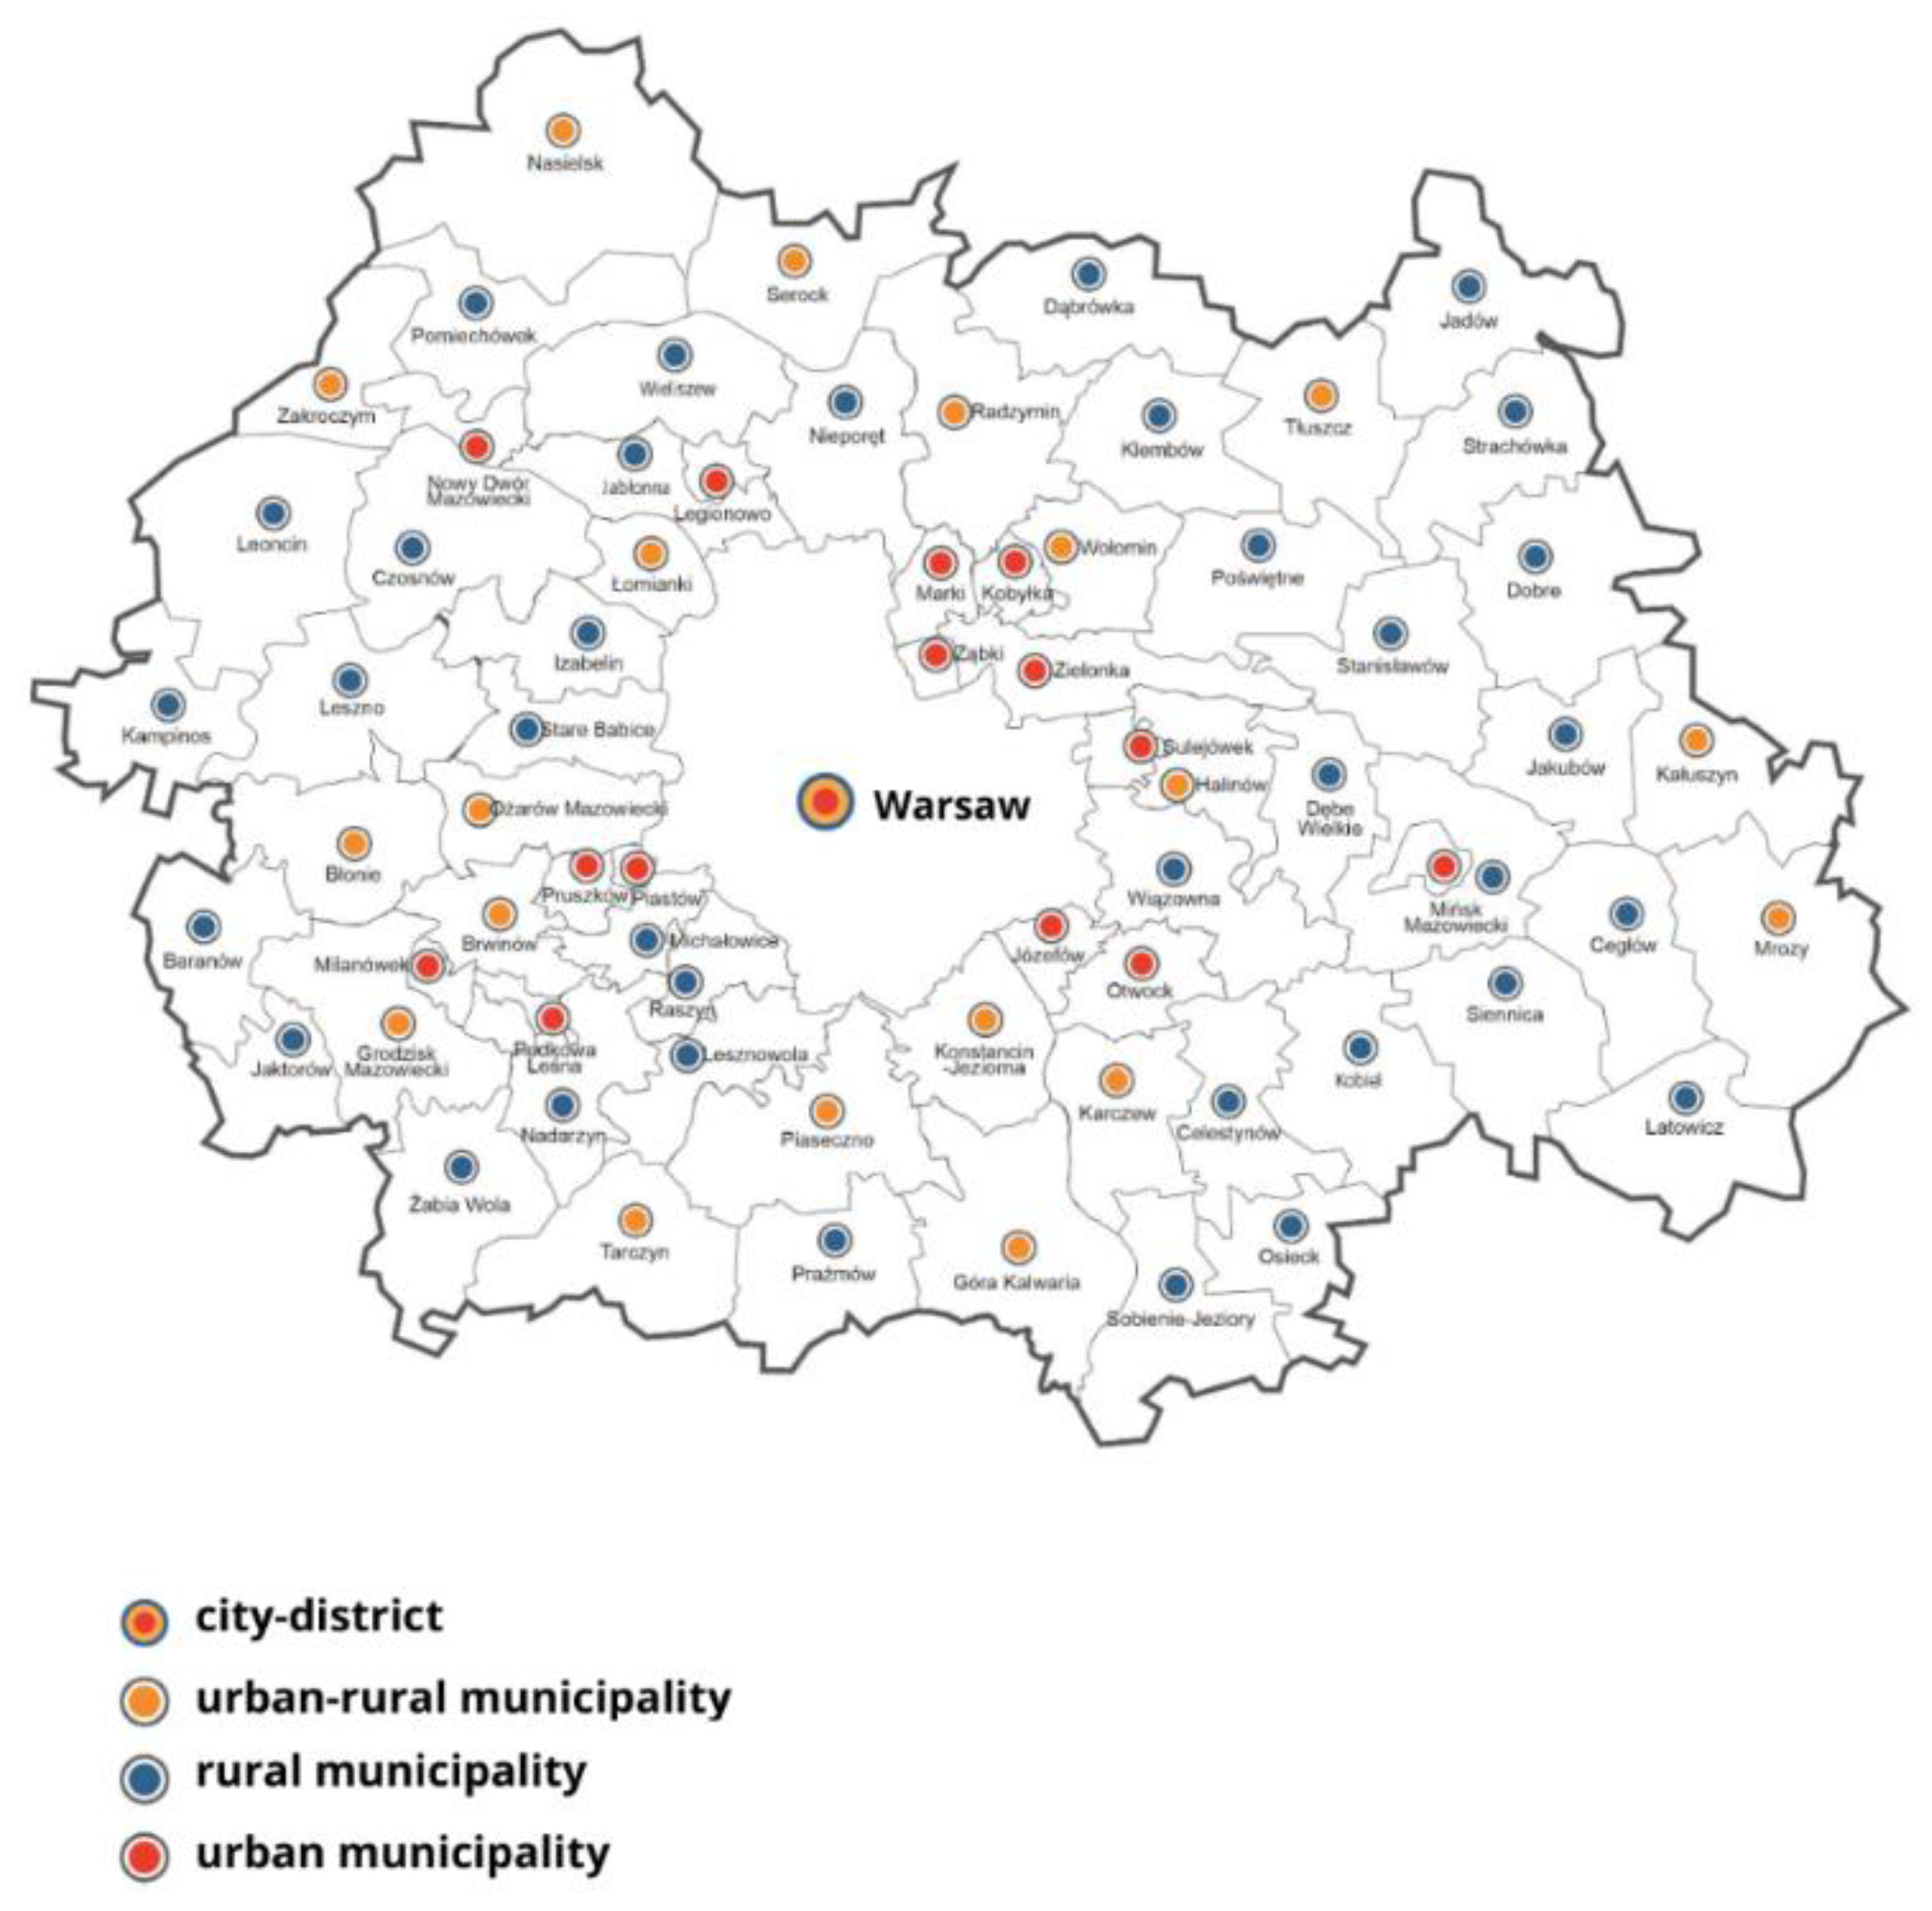
Figure 2.
Transport system in the Warsaw Metropolitan Area.
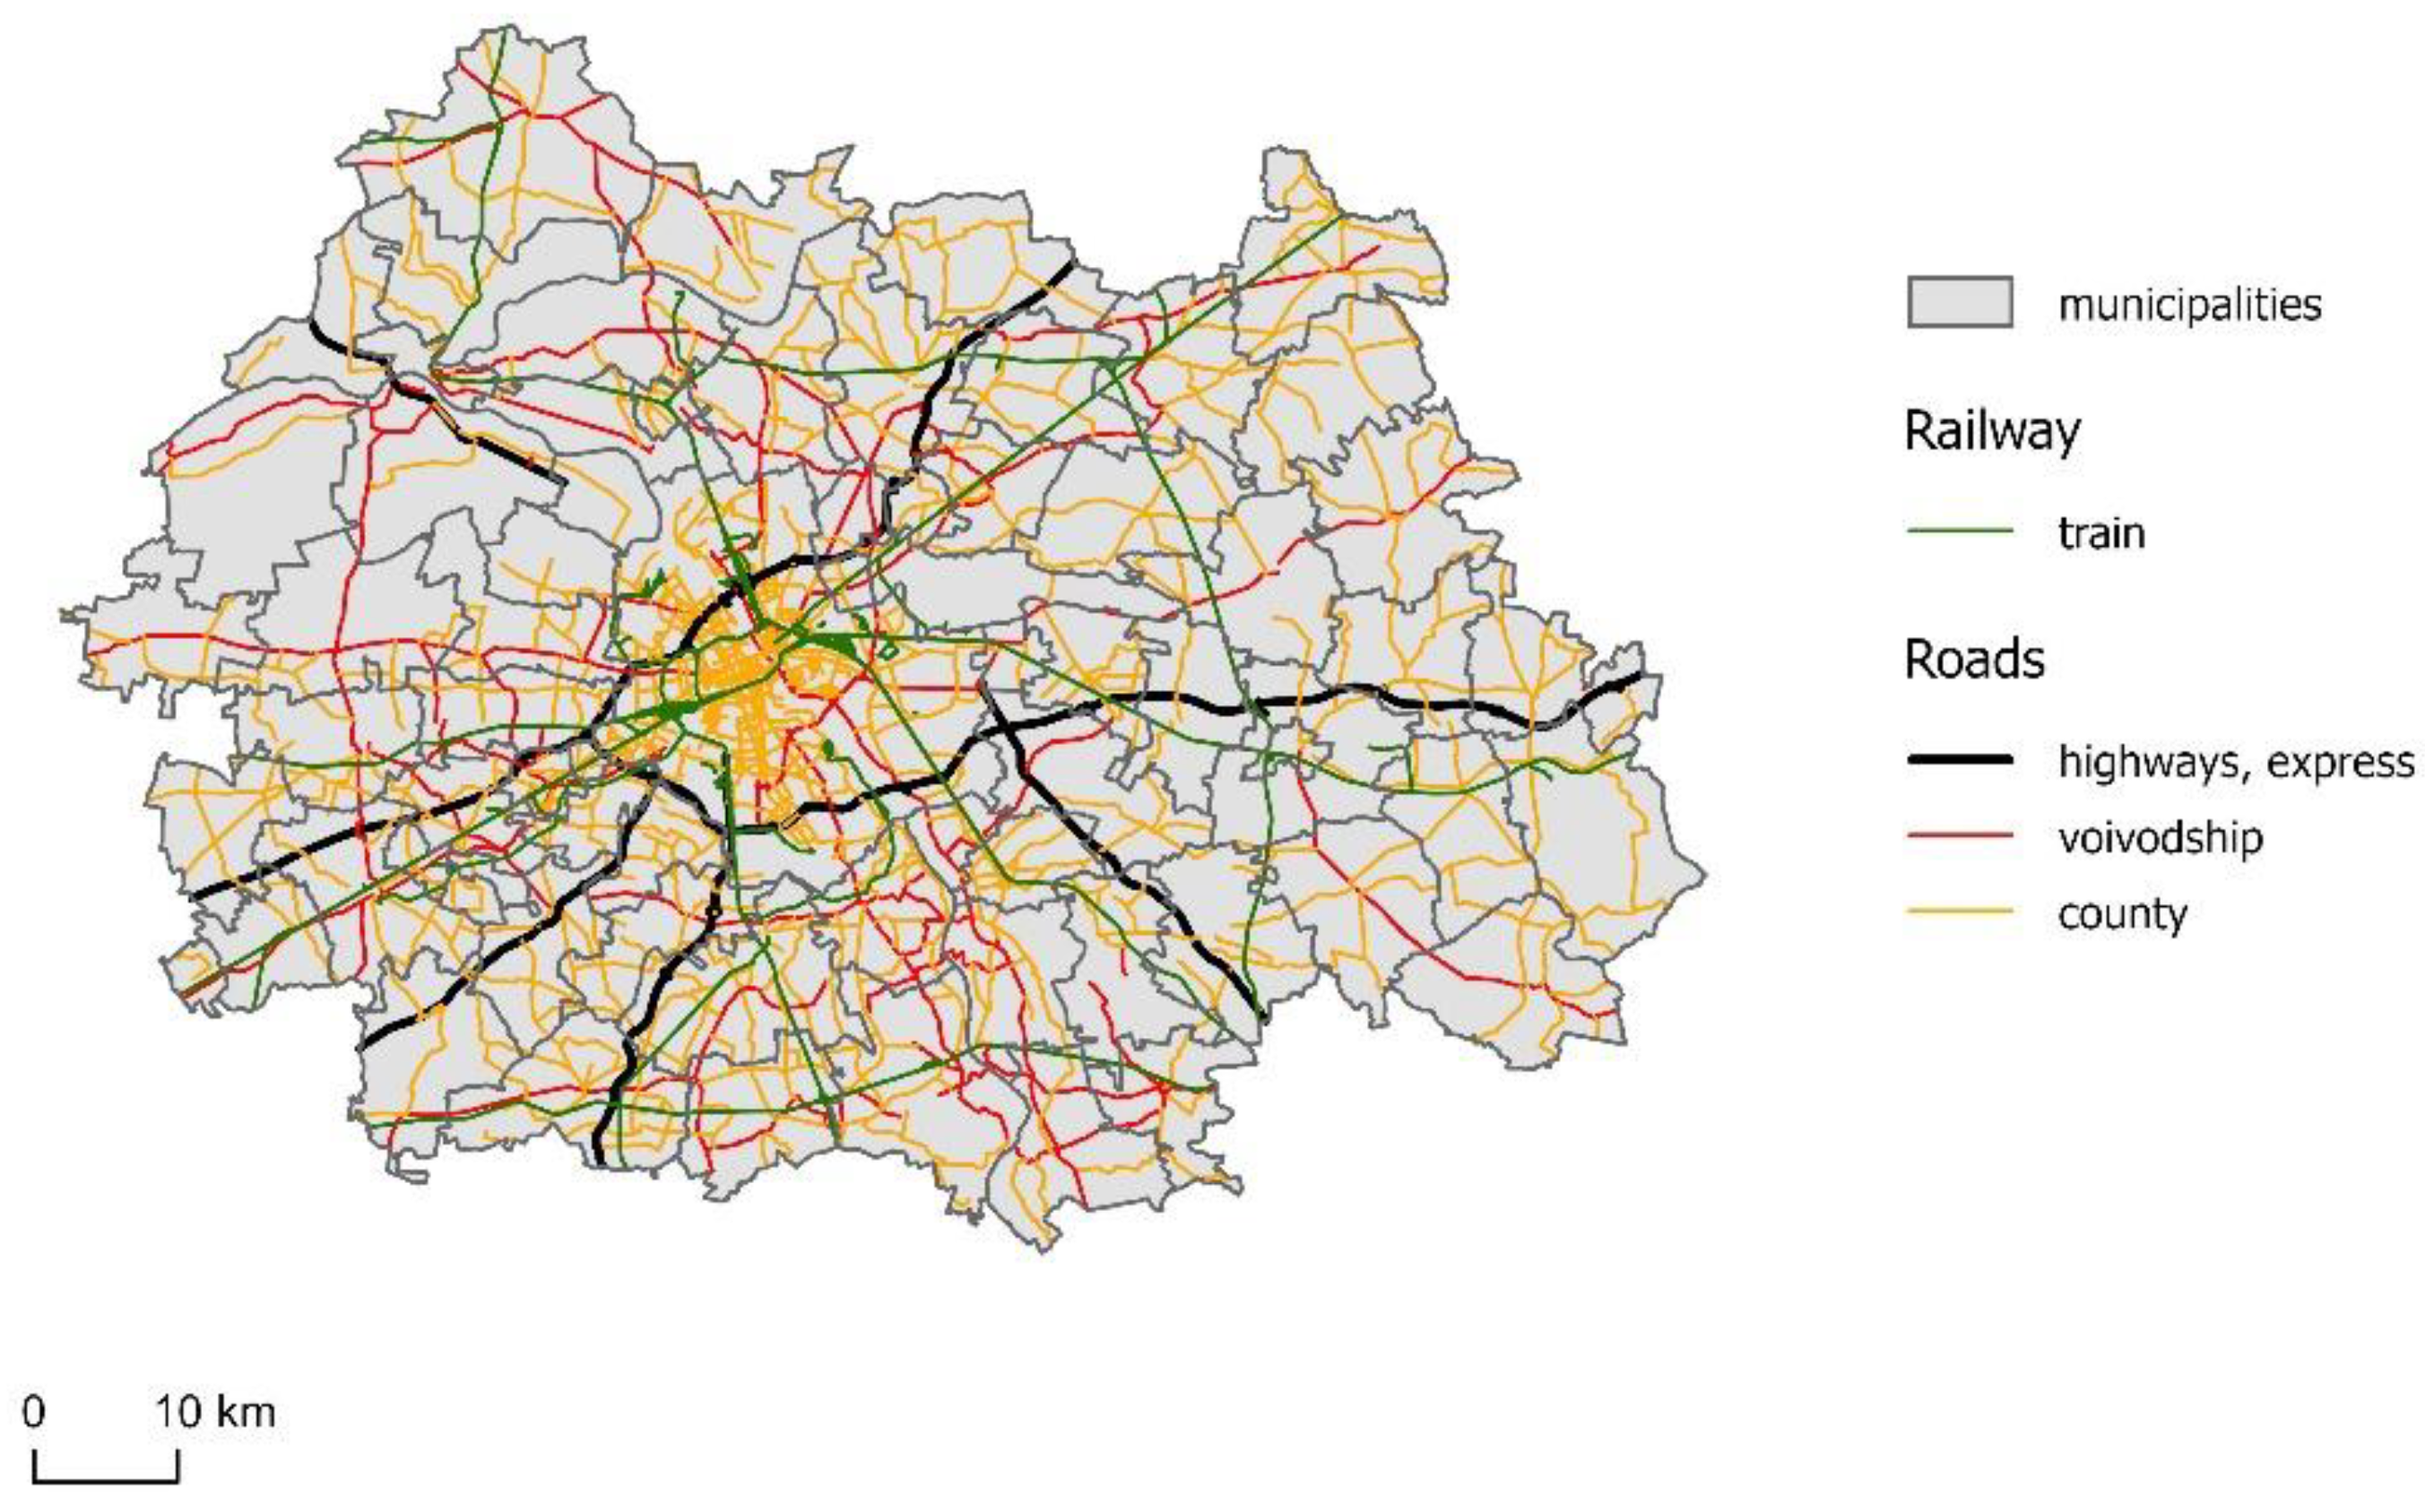
Figure 3.
Demographic types of population according to Webb in The Warsaw Metropolitan Area between 2003 and 2020.
Figure 3.
Demographic types of population according to Webb in The Warsaw Metropolitan Area between 2003 and 2020.
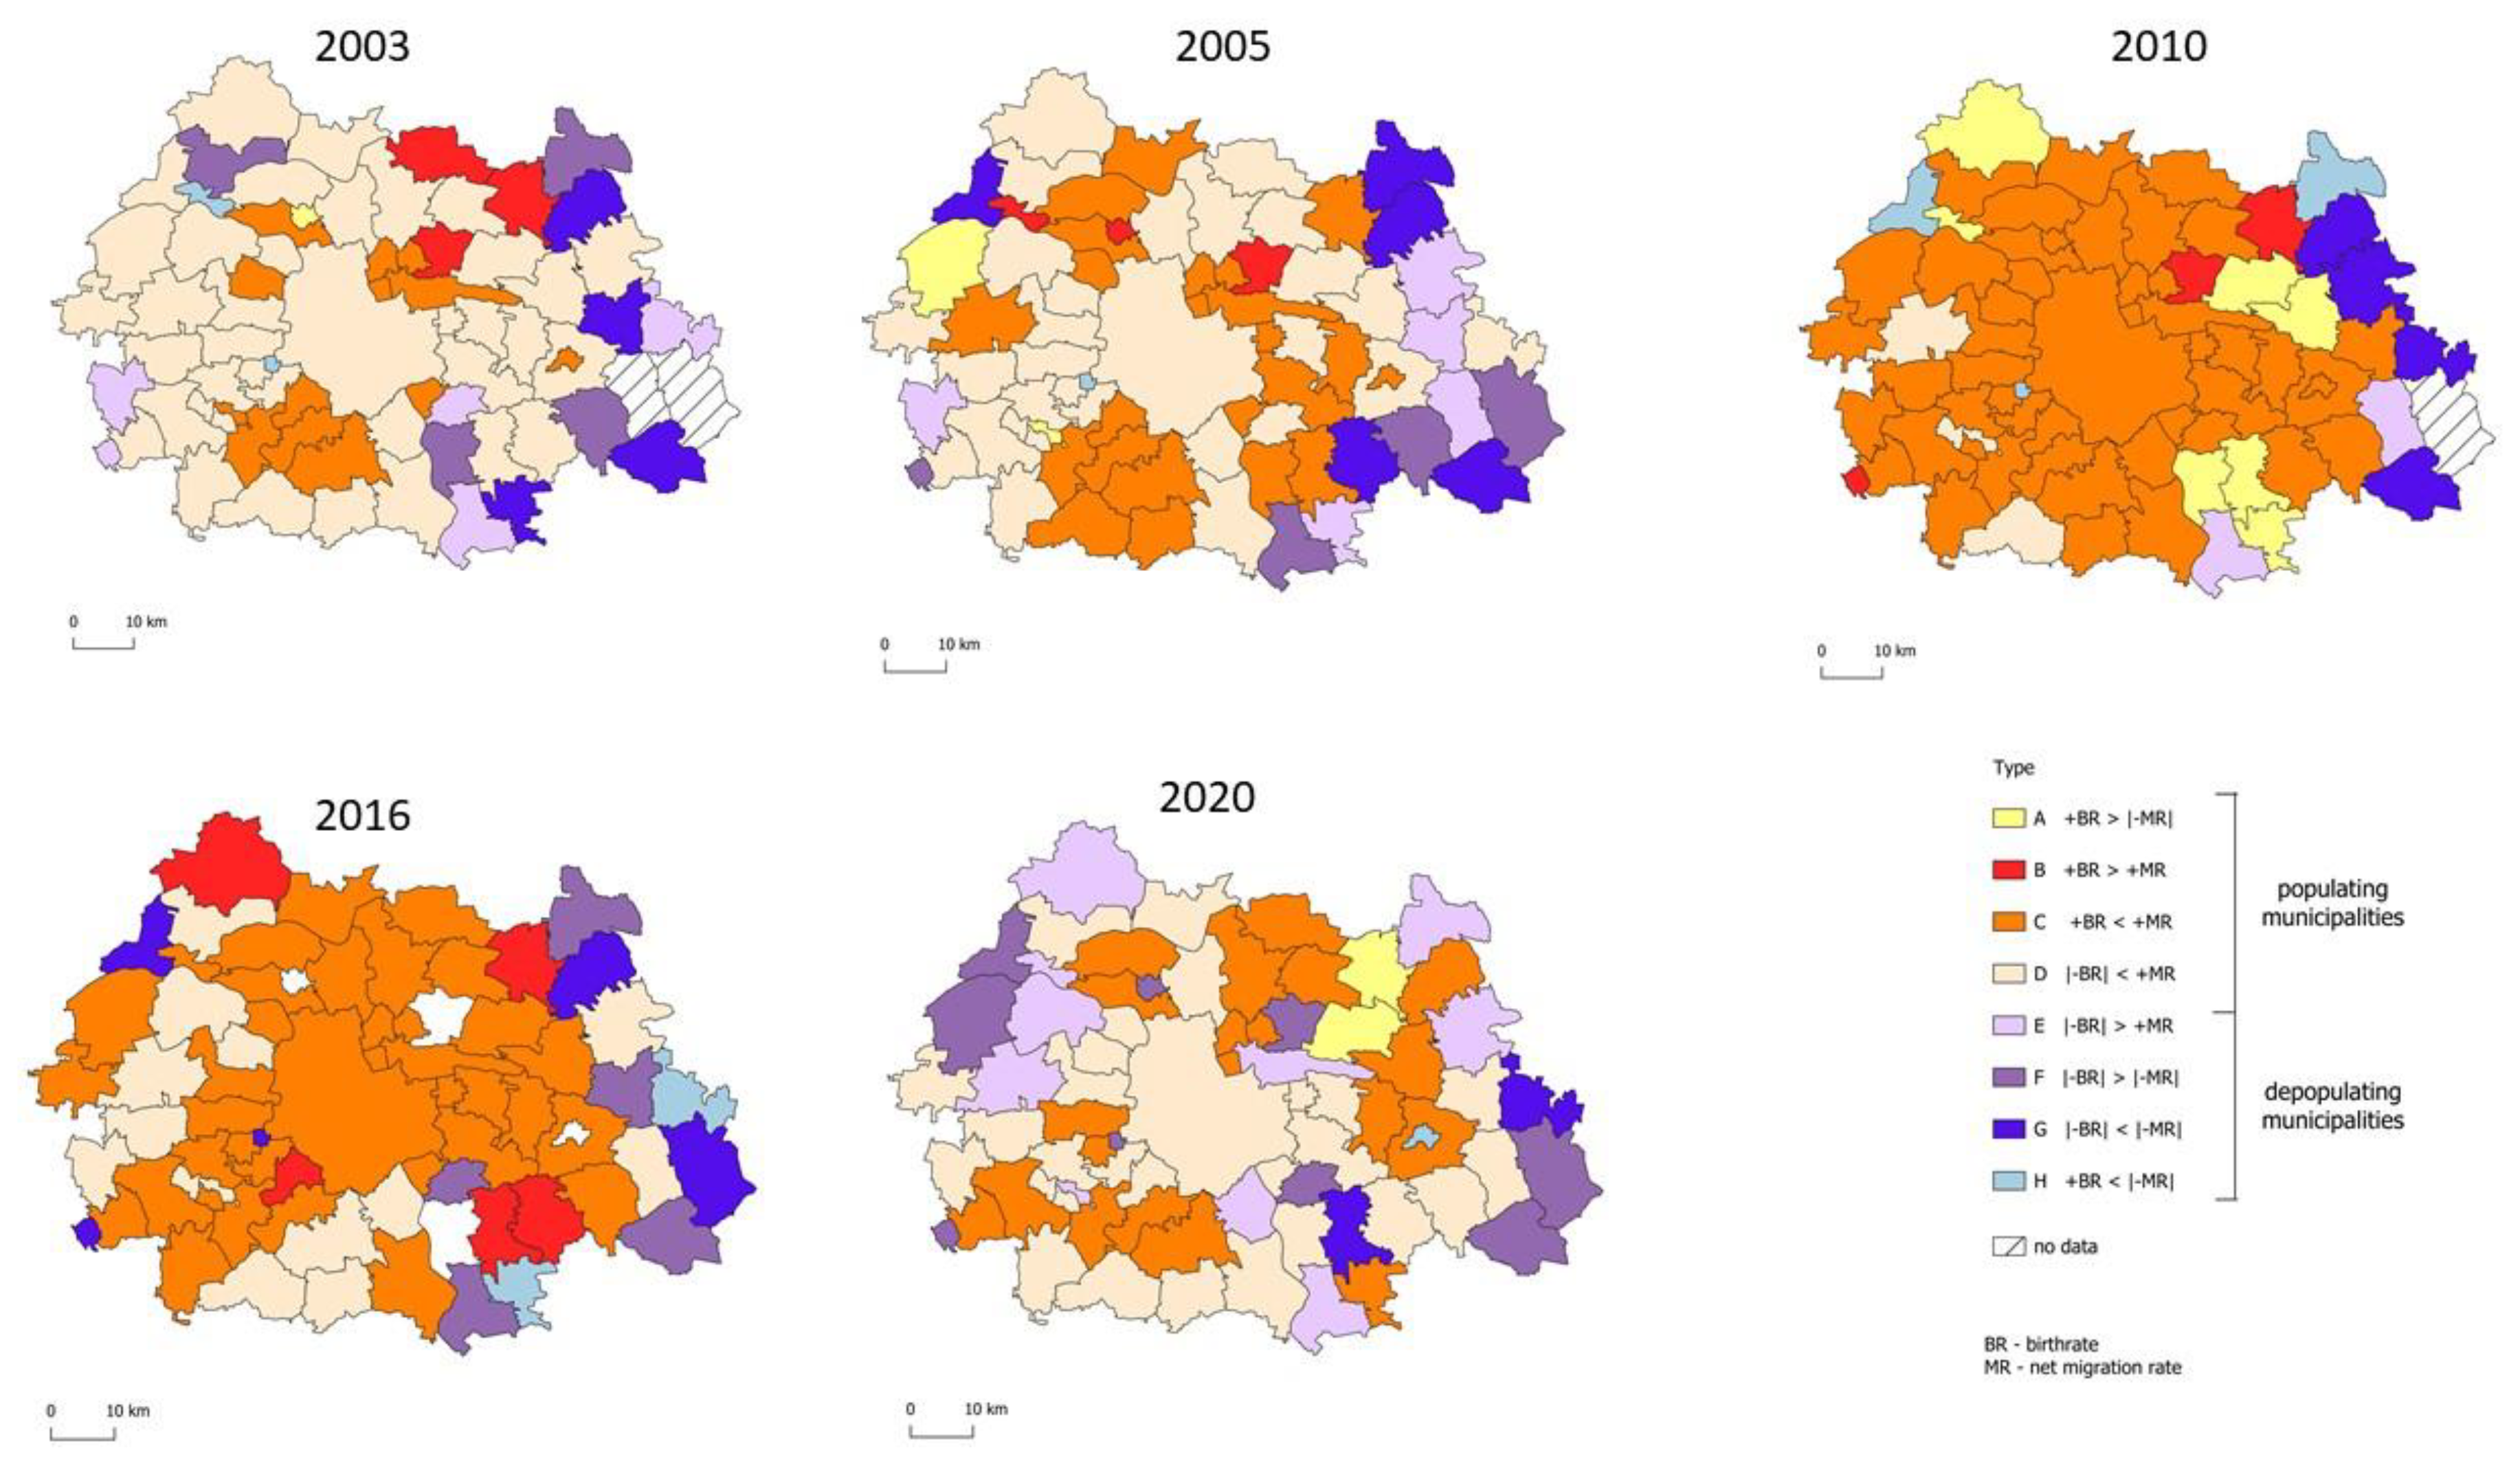
Figure 4.
Spatial distribution of the values of the main components of socio-spatial differentiation of the Warsaw Metropolitan Area.
Figure 4.
Spatial distribution of the values of the main components of socio-spatial differentiation of the Warsaw Metropolitan Area.
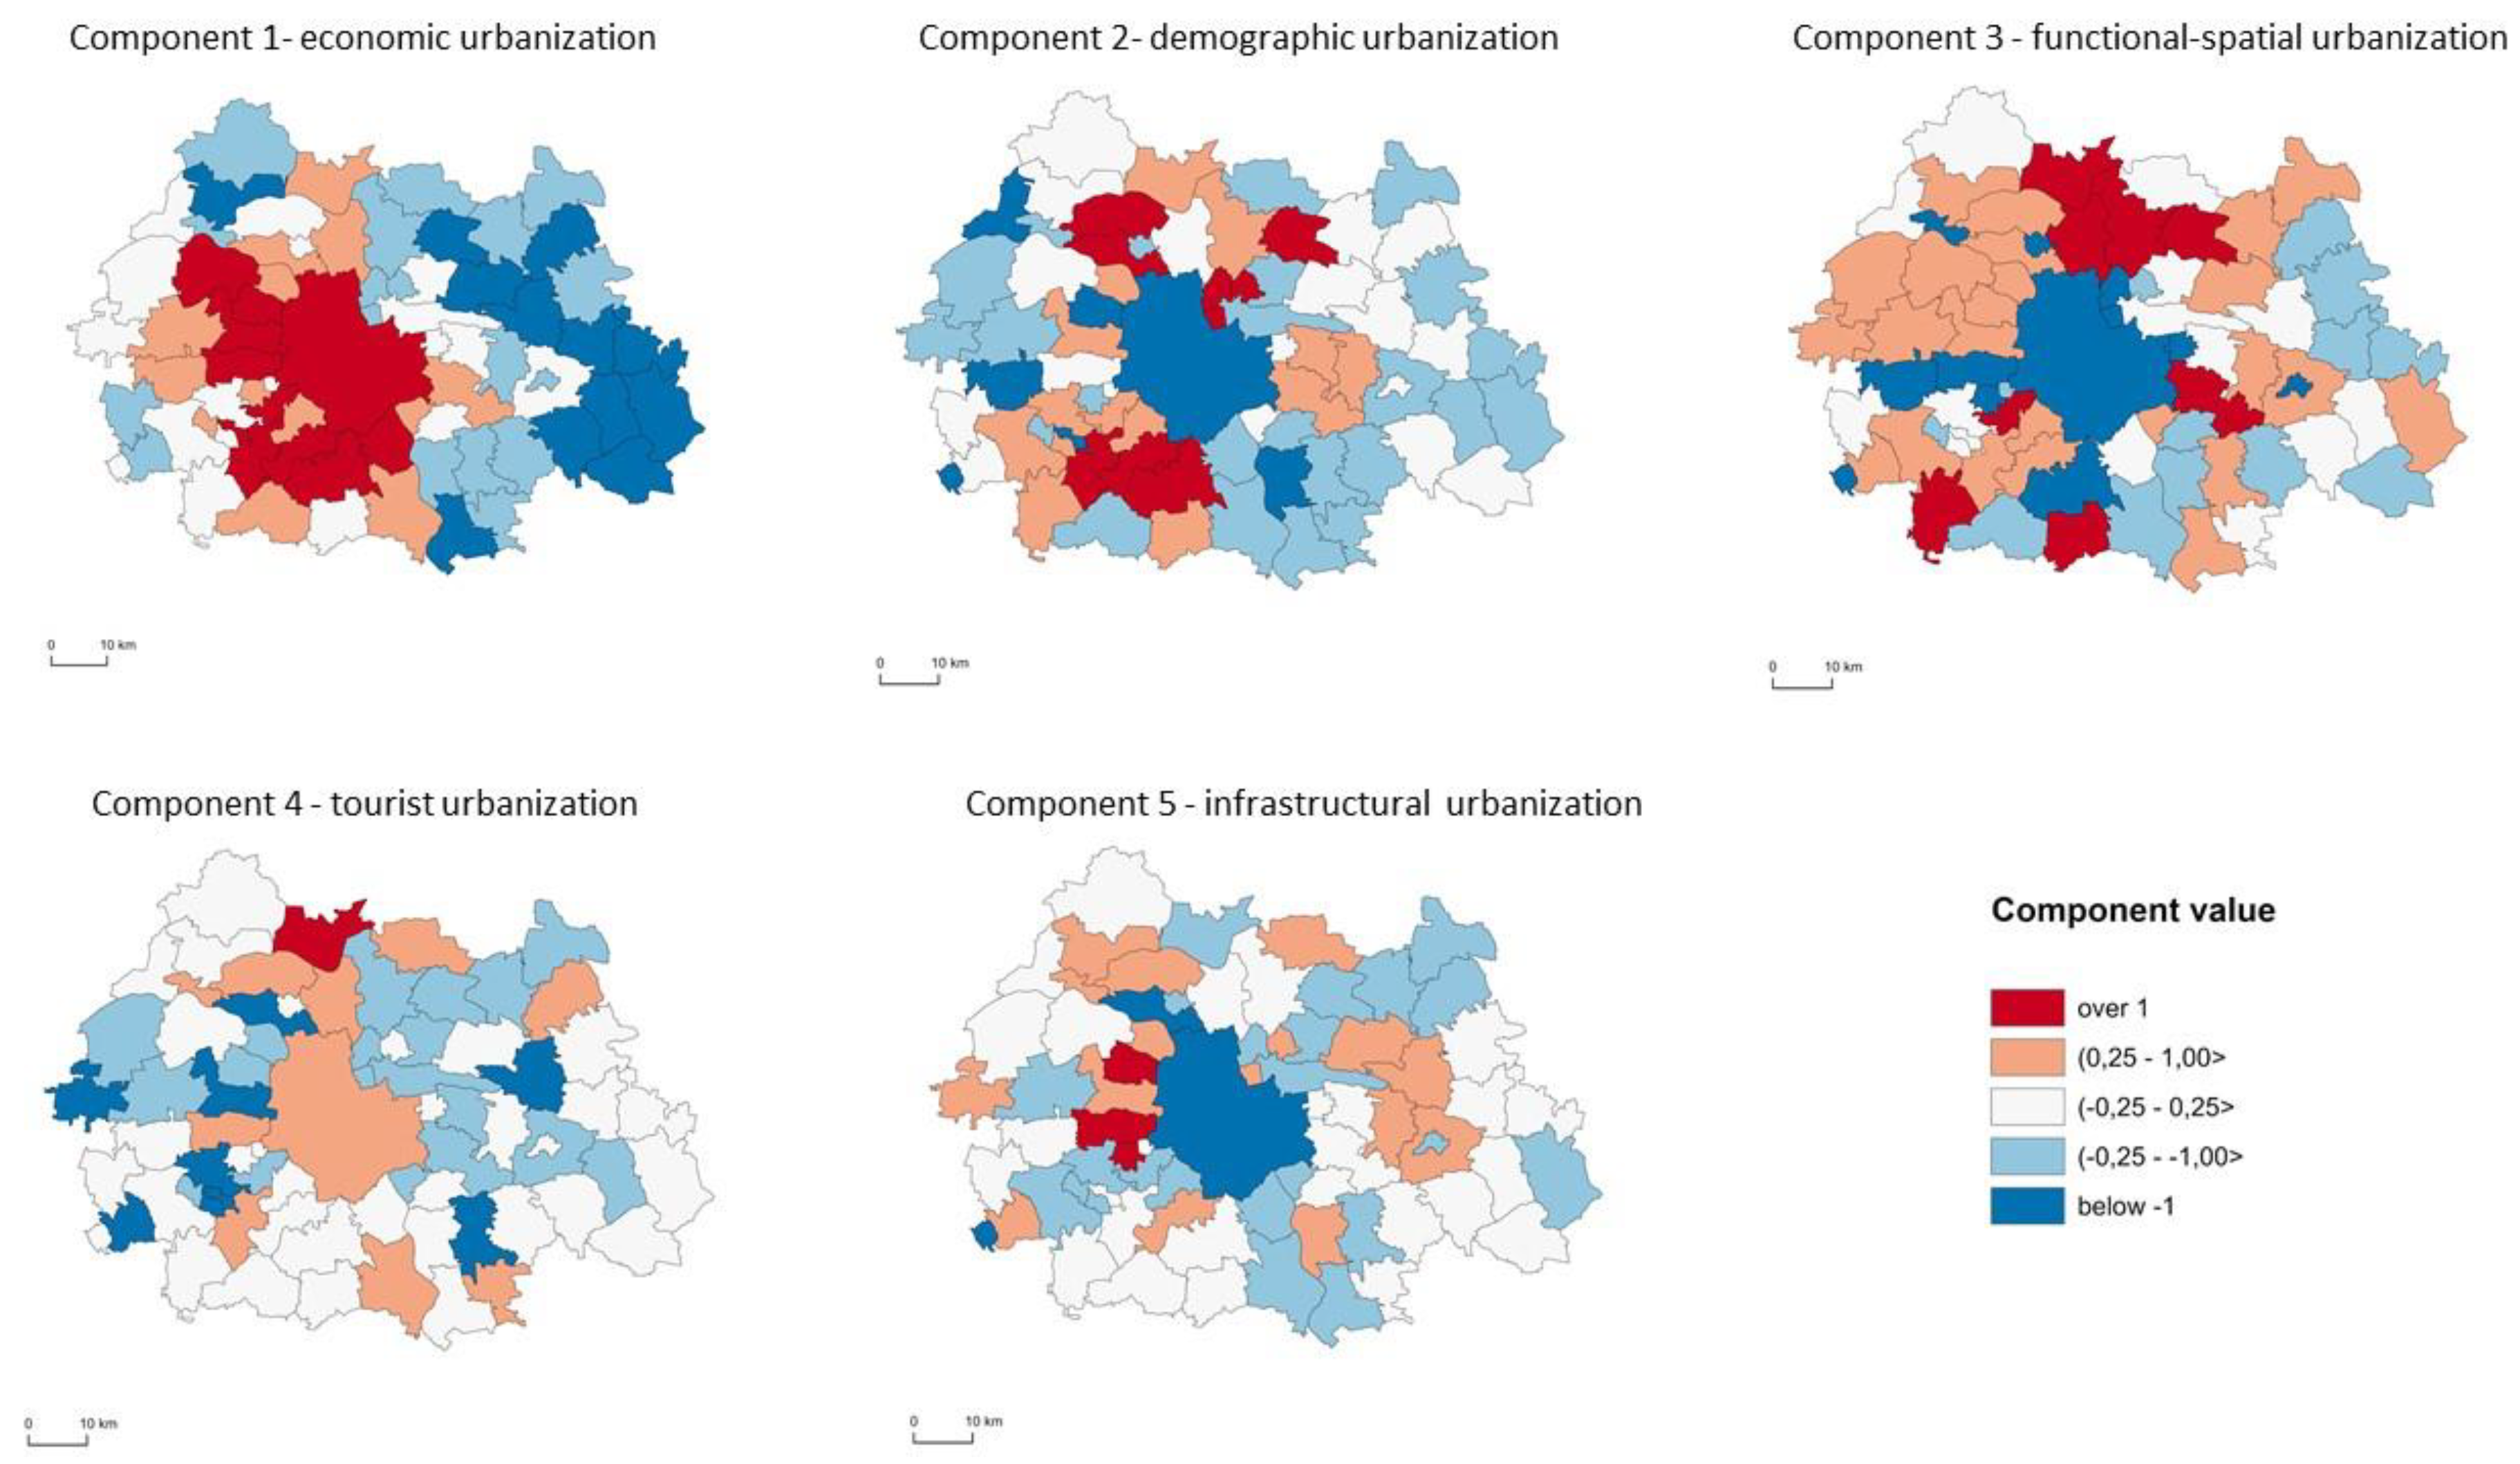
Figure 5.
Typological classes of the Warsaw Metropolitan Area municipalities.
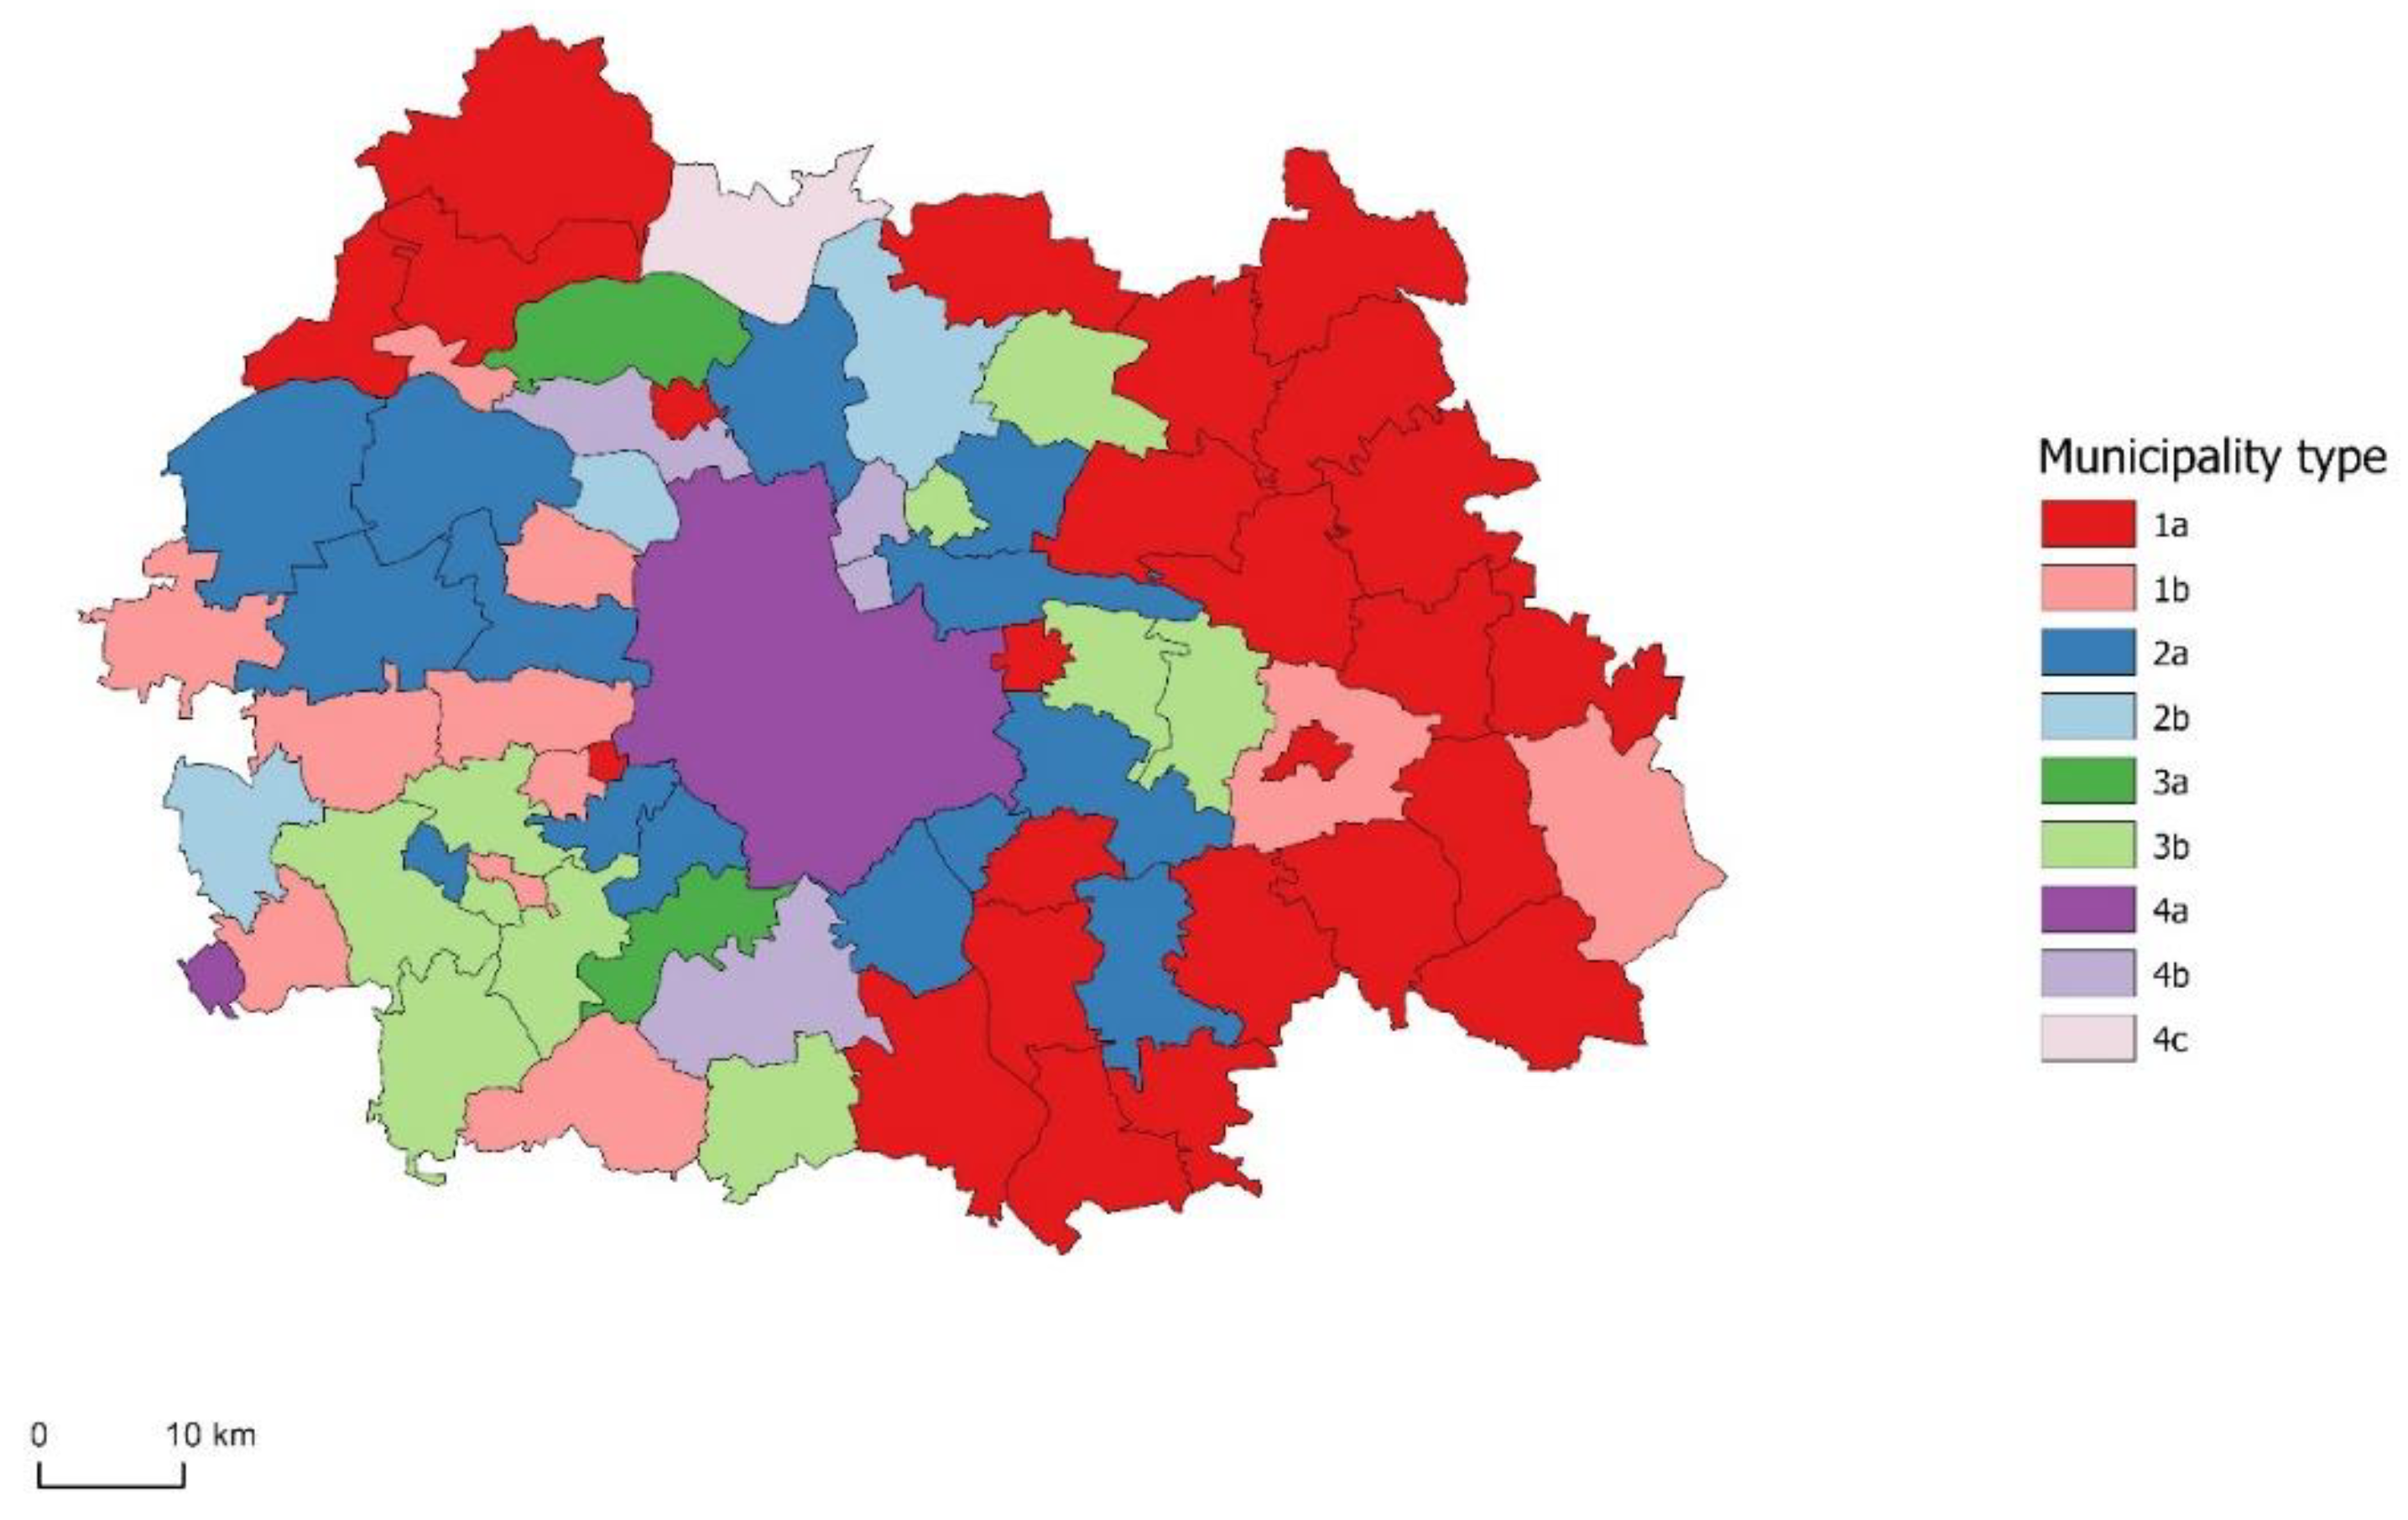

Table 1.
Main components of the transformation of socio-spatial diversity in the Warsaw Metropolitan Area*.
Table 1.
Main components of the transformation of socio-spatial diversity in the Warsaw Metropolitan Area*.
| Components | |||||
| 1 | 2 | 3 | 4 | 5 | |
| Change in the number of businesses in sections J-N per 1,000 inhabitants | 0.905 | 0.156 | -0.075 | 0.055 | -0.061 |
| Change in the number of entities employing up to 9 persons per 10,000 inhabitants of working age | 0.866 | 0.121 | 0.185 | 0.08 | 0.042 |
| Change in the number of businesses per 1,000 working-age population | 0.857 | 0.109 | 0.192 | 0.068 | 0.036 |
| Change in the share of PIT in the municipality’s own income | 0.796 | -0.204 | 0.102 | -0.189 | -0.047 |
| Change in the number of sole traders per 100,000 people of working age | 0.781 | 0.064 | 0.416 | 0.027 | 0.070 |
| Change in the proportion of parks, green spaces and residential green spaces in the area of the municipality | 0.465 | 0.179 | -0.246 | -0.344 | -0.290 |
| Change in the share of CIT in the municipality’s own income | 0.416 | -0.129 | -0.19 | 0.131 | -0.089 |
| Change in old-age dependency ratio | 0.094 | -0.759 | 0.044 | 0.088 | 0.030 |
| Change in the birth rate | -0.058 | 0.721 | -0.104 | 0.087 | 0.051 |
| Change in population density | 0.095 | 0.635 | -0.546 | -0.081 | 0.126 |
| Change in the proportion using gas infrastructure | 0.013 | 0.389 | 0.192 | 0.175 | 0.334 |
| Change in average floor area of commissioned dwellings per 1,000 population | 0.177 | 0.374 | 0.34 | 0.304 | 0.257 |
| Change in average floor area of 1 dwelling | 0.456 | 0.063 | 0.663 | -0.118 | 0.135 |
| Change in the number of building permits per 1,000 population | 0.131 | 0.391 | 0.524 | 0.08 | -0.232 |
| Change in the average number of persons per dwelling | 0.072 | 0.151 | 0.383 | -0.682 | -0.118 |
| Change in the number of tourism entities per 1,000 population | 0.15 | 0.024 | 0.295 | 0.669 | -0.104 |
| Change in the number of tourist accommodation establishments per 1,000 population | 0.202 | 0.043 | 0.341 | 0.663 | -0.097 |
| Change in the number of dwellings per 1,000 population | 0.269 | 0.058 | -0.53 | 0.572 | -0.085 |
| Change in the share of newly registered creative sector entities in the total number of newly registered entities | 0.203 | -0.050 | 0.060 | -0.427 | 0.070 |
| Change in migration balance | -0.336 | -0.097 | -0.126 | 0.413 | 0.258 |
| Change in the share of newly registered entities of the agri-food processing sector in the total number of newly registered entities | 0.057 | 0.107 | -0.095 | 0.281 | -0.082 |
| Change in the number of marriages per 1,000 population | 0.177 | 0.109 | -0.071 | -0.251 | 0.007 |
| Change in share of sewerage users | 0.155 | -0.063 | -0.108 | -0.180 | 0.723 |
| Change in the proportion using the water supply system | -0.095 | 0.090 | -0.046 | -0.160 | 0.673 |
| Change in share of new dwellings in total number of dwellings | -0.310 | 0.314 | 0.242 | 0.104 | 0.599 |
| Change in the proportion of agricultural land for which the plans foresee change to non-agricultural use | 0.000 | 0.027 | 0.229 | -0.07 | -0.404 |
| Change in the proportion of forest land for which the plans foresee change to non-forest use | 0.114 | 0.102 | 0.156 | -0.051 | 0.397 |
* The principal component method with varimax rotation was used.
Disclaimer/Publisher’s Note: The statements, opinions and data contained in all publications are solely those of the individual author(s) and contributor(s) and not of MDPI and/or the editor(s). MDPI and/or the editor(s) disclaim responsibility for any injury to people or property resulting from any ideas, methods, instructions or products referred to in the content. |
© 2024 by the authors. Licensee MDPI, Basel, Switzerland. This article is an open access article distributed under the terms and conditions of the Creative Commons Attribution (CC BY) license (http://creativecommons.org/licenses/by/4.0/).
Copyright: This open access article is published under a Creative Commons CC BY 4.0 license, which permit the free download, distribution, and reuse, provided that the author and preprint are cited in any reuse.


