Submitted:
05 April 2024
Posted:
08 April 2024
You are already at the latest version
Abstract
The rates of obesity and obesity-related diseases continue to increase worldwide, classifying obesity as a global epidemic. Endogenous opioids have been implicated in influencing feeding behavior; however, the role of each opioid peptide is still only partially characterized. Therefore, we assessed the role of the proopiomelanocortin (POMC)-derived peptide beta-endorphin (β-END) in long-term high-fat diet (HFD) feeding and glucose homeostasis and assessed if sex-related differences exist in these processes. Male and female mice lacking the ability to produce β-END and their respective controls were subjected to a 12-week HFD consumption to determine the role of the opioid peptide in food intake and glucose homeostasis. Body weight and food intake were measured weekly for twelve weeks. At weeks 6 and 12, plasma glucose levels were measured using an oral glucose tolerance test. Here, we report that male β-END deficient mice gained more weight and consumed more calories than their wildtype controls; however, this difference was not observed in the female mice. Regardless of genotype, female mice consumed more calories per body weight when compared to male mice despite their smaller body weights. Moreover, our findings suggest differences in glucose homeostasis between the wildtype and knockout mice and that these were only observed at week six but not at week 12. Overall, our study suggests that endogenous β-END may play a role in controlling body weight, feeding behavior, and glucose homeostasis and that sex-related differences may exist in this regard.
Keywords:
beta-endorphin
; high-fat diet (HFD)
; oral glucose tolerance test
; sex differences
; food intake
; obesity
1. Introduction
Despite the growing recognition of the problem, the rates of obesity and obesity-related diseases had nearly tripled since 1975. Obesity is a known complex disease with multifaceted etiology stemming from interactions between genetic, behavioral, physiological, socioeconomic, and environmental factors [1,2,3]. While many factors have been recognized, the consumption of the Western (American) diet or energy-dense foods high in fat, sodium, and sugar, is considered as one of the major contributing factors to the global epidemic [4,5,6,7].
The endogenous opioid system has been linked to regulate feeding behavior, however, the role of each opioid peptide has not been fully characterized. More specifically, previous studies have shown that the expression of β-END increases after consumption of a highly palatable food, suggesting its role in the natural reward pathway [8,9,10]. Furthermore, Triscari and colleagues have initially shown that an acute intraperitoneal or intracerebroventricular (icv) administration of β-END stimulated food intake while a continuous infusion was ineffective [11]. Another study has shown that a ventricular administration of β-END produced a dose-dependent and time-dependent increase in food intake and this effect was significantly reduced by naltrexone [12]. In addition, a single icv injection of β-END significantly increased food intake over a six-hour period while a chronic (4 d) icv infusion did not simulate food consumption or weight gain in mice [13]. These studies illustrate that administration of β-END stimulates food intake in animal models, however, its long-term implications in feeding behavior are quite different.
For instance, male mice lacking the ability to produce β-END were hyperphagic and obese when compared to their wildtype littermates [14,15]. In the same study, the authors observed a sexually dimorphic obesity phenotype, in which differences were only seen in male, but not female, β-END knockout mice. Furthermore, Low and colleagues have suggested that β-END release increases the incentive value of food during appetitive phase; on the other hand, endogenous β-END inhibits food consumption along with other melanocortin peptides [15]. Furthermore, another study has shown that mice lacking the gene encoding for mu opioid receptor (MOP), β-END’s preferred receptor, displayed decreased motivation but unaltered hedonic processing of food intake [16] while MOP agonists including [D-Ala2, N-MePhe4, Gly-ol]-enkephalin (DAMGO) have generally shown to stimulate food consumption [17,18].
Based on the above findings, it is evident that β-END is involved in food consumption, more specifically exogenous β-END can stimulate and regulate food intake, however, the role of endogenous β-END has not been fully characterized. Therefore, our present study aimed to further investigate the role of endogenous β-END in regulation of body weight and food intake by utilizing β-END deficient mice [91] and their wildtype littermates/controls. In addition, we also examined if there are sex-related differences in this regard given that sexual dimorphism has been observed in body weight [15] and feeding behaviors [95].
2. Materials and Methods
2.1. Subjects
Male and female mice lacking the ability to produce β-END [19] and their wildtype littermates/age-matched controls, fully backcrossed for at least 12 generations on a C57BL/6J mouse background bred in house, were used for all the experiments. Polymerase chain reaction (PCR) was utilized to confirm the genotype of these mice, as reported previously (Marquez et al. 2008). Before the experiments, all the animals were acclimatized to the surroundings for a week provided with ad libitum access to water and standard chow diet (Envigo Teklad Global Diets 2018; 3.1 kcal/g with 18% fat, 24% kcal protein, 58% kcal carbohydrates). Mice were housed 1-4 per cage in recyclable plastic cages with corncob bedding with same-sex littermates. Animals were maintained in a temperature-controlled (22 ± 1°C) room under a 12:12-hr light-dark cycle (6AM-6PM). All experimental procedures involving animals were carried out with the approval from the Western University’s Institutional Animal Care and Use Committee (Pomona, California, USA) and were in accordance with the NIH guidelines for the care and use of animals in research.
2.2. The Role of Beta-Endorphin in Body Weight and Food Intake in Mice Fed a High Fat Diet for 12 Weeks
After one week of habituation, male (n = 20 per genotype) and female (n = 12-13 per genotype) mice were switched to ad libitum access to HFD (Research Diet, D124292; 5.24 kcal/g with 60% fat, 20% kcal carbohydrates, and 20% kcal protein with blue dye) for 12 weeks. Weekly measurements including body weight and food intake in grams (g) were measured and recorded. We used the average food intake for animals in group-housed cages. To calculate the percent body weight, the weekly body weight measurements were divided by the initial body weight, then multiplied by 100%. Caloric intake was calculated by converting grams (g) into kilocalories (kcal) using the following conversions: RD: 3.1 kcal/g and HFD: 5.24 kcal/g. In addition, we determined the calories consumed per body weight (kcal/g body weight) by dividing the calories (kcal) consumed by raw body weight (g).
2.3. The Role of Beta-Endorphin in Glucose Homeostasis in Mice Fed a High Fed Diet for 12 Weeks
To determine the role of β-END in glucose homeostasis, an oral glucose tolerance test (OGTT) was performed in male and female β-END knockout mice and their wildtype littermates/controls at weeks 6 and 12 of HFD feeding. Mice were fasted overnight (10 h) with only access to water. Following the fast, baseline glucose levels (t = 0) were measured from the tail vein using a glucometer (Embrace Omnis Blood Glucose Monitoring System/Omnis Health Embrace Blood Glucose Test Strip). Each mouse was then given 2 g/kg D-glucose (20%) solution orally via oral gavage. Blood glucose levels were measured at 30-, 60-, 90-, and 120- minutes following glucose administration. Food was immediately restored after the experiment. A schematic diagram of the experimental procedure Is provided in Figure 1.
2.4. Statistical Analysis
All data are expressed as the mean ± S.E.M with P < 0.05 considered statistically significant. Body weight, food and caloric intake, and glucose tolerance test were analyzed using a two-way analysis of variance (ANOVA) with time as the repeated measure, followed by Fisher’s Least Significant Difference (LSD) post hoc analysis for paired group comparisons. The area under the curve (AUC) for glucose tolerance test was also determined and analyzed using an unpaired t-test. A three-way ANOVA was used to analyze interaction between time, sex, and genotype with regard to AUC for glucose tolerance test. All figures and statistical analyses were performed using GraphPad Prism (San Diego, CA, USA).
3. Results
3.1. β-END Deficient Male Mice Had Higher Body Weights Than Their Wildtype Controls, However, This Difference Was Not Observed in Female Mice
Body Weight
Previous studies have shown that male β-END knockout mice became obese given ad libitum access to standard chow diet [14,15]. To examine if long-term access to HFD can exacerbate this effect, we exposed β-END wildtype and knockout male mice to HFD for twelve weeks after a week of habituation. We recorded a total of 20 male and 12-13 female mice per genotype for this experiment. We measured and recorded the body weights of each male mouse weekly as shown in Figure 2A. A two-way ANOVA revealed significant effects of genotype [F (1, 38) = 5.208; P = 0.0282], time [F (3.348, 127.2) = 198.4; P < 0.0001], and a significant interaction between time and genotype [F (12, 456) = 3.588; P < 0.0001]. Post hoc analysis using the Fisher’s LSD test showed a significant difference in raw body weights at weeks 0, 5, 8, 9, 10, 11, and 12 (P = 0.0451, P = 0.0491, P = 0.0192, P = 0.0174, P = 0.0063, P = 0.0064, P = 0.0077; Figure 2A). Given that the initial raw body weights of β-END deficient mice were significantly higher than wildtype mice (P = 0.0451; Figure 2A), we normalized the data as shown in Figure 2B. There were no differences between the percent body weight gain between the mice of the two genotypes [F (1, 38) = 0.6473; P = 0.4261]. Meanwhile, a two-way ANOVA showed significant effects of time [F (2.549, 96.87) = 194.2; P < 0.0001] and a significant interaction between time and genotype [F (12, 456) = 2.516; P = 0.0033].
Unlike male β-END knockout mice, previous studies have shown that female β-END deficient mice were only transiently heavier compared to their wildtype controls [15]. We also did not observe any body weight changes between female wildtype and knockout mice given ad libitum access to HFD at the start of the experiment (Figure 2C). Two-way ANOVA revealed a significant effect of time [F (3.311, 76.16) = 61.19; P < 0.0001] but no interaction between time and genotype [F (12, 276) = 1.658; P = 0.0760] nor effects of genotype [F (1, 23) = 0.5003; P = 0.4875]. In addition, the post hoc test did not reveal any significant differences in raw body weight between mice of the two groups at any time points.
Figure 2D depicts the body weight gain as percent of their original weight in female mice. Two-way ANOVA revealed a significant effect of time [F (12, 276) = 51.68; P < 0.0001] and a significant interaction between time and genotype [F (12, 276) = 2.031; P = 0.0218], but no genotype effects [F (1, 23) = 0.8600; P = 0.3634]. Furthermore, post hoc analysis using Fisher’s LSD test revealed a significant difference at week 12, in which female knockout mice gained more weight than wildtype mice when fed an HFD (P = 0.0383; Figure 2D). Overall, our data shows that male mice lacking the ability to produce β-END had increased body weights when compared to their wildtype controls. On the other hand, we did not see this difference in female mice. Furthermore, the percent body weight change was not significant between the mice of the two genotypes at the first 8 weeks. On weeks 8-12, however, it appears that mice lacking β-END gained more weight than their wildtype controls (Figs. 2B and 2D, compare the body weight of mice of the two genotypes on weeks 8-12). Although the normalized that did not show a significant difference between male mice of the two genotypes, the change was significant in female mice on week 12.
3.2. Comparison of HFD Consumption and Caloric Intake in Male and Female Mice
Food and Caloric Intake
To determine if there was a difference in food and caloric intake between male or female β-END wildtype and knockout mice, we recorded weekly food intake. We also determined the caloric intake by using the following conversions: RD = 3.1 kcal/g, HFD = 5.24 kcal/g. The average daily food intake (g) and caloric intake (kcal) of the male and female β-END wildtype and knockout male mice are shown in Figure 3. Analysis of food intake in male mice showed significant effects of genotype [F (1, 38) = 5.809; P = 0.0209] and time [F (4.702, 178.7) = 39.44; P < 0.0001] but no time and genotype interaction [F (12, 456) = 0.8134; P = 0.6368] in food intake (Figure 3A). We also observed significant effects of time [F (4.694, 173.7) = 51.83; P < 0.0001] and genotype [F (1, 37) = 4.492; P = 0.0408] but no interaction between time and genotype [F (12, 444) = 0.5397; P = 0.8887], when analyzing the caloric intake in male mice (Figure 3B).
Similar to male mice, we also measured the weekly food and caloric intake of female mice lacking β-END and their wildtype controls (Figure 3C and D). A two-way ANOVA showed significant effects of time [F (4.751, 114.0) = 45.63; P < 0.0001] and genotype [F (1, 24) = 5.751; P = 0.0246] but no interaction between time and genotype [F (12, 288) = 0.7276; P = 0.7242]. Meanwhile, significant effects of time [F (5.447, 125.3) = 18.83; P < 0.0001] and genotype [F (1, 23) = 6.970; P = 0.0146] on daily caloric intake were also observed. While our data did not show significant differences, we observed a trend toward increased food and caloric intake in the knockout male and female mice when compared to their wildtype controls.
3.3. Female Mice Exhibited Overall Increased Daily Caloric Intake per Body Weight When Compared to Male Mice Regardless of Genotype
We also determined the calories consumed per body weight (kcal/g body weight) for both wildtype and knockout mice and determined if sex-related differences existed in this regard (Figure 4).
Interestingly, female mice of both genotypes showed a higher caloric intake per body weight than their respective male. A three-way ANOVA revealed significant effects of time [F (12, 744) = 63.77; P < 0. 0001] and sex [F (1, 62) = 38.75; P < 0.0001], but no effects of genotype [F (1, 62) = 0.06499; P = 0.7996]. In addition, there was a significant interaction between time and sex [F (12, 744) = 1.826; P = 0.0406] but no other interactions were observed. The post-hoc Fisher’s LSD test showed that female wildtype mice had significantly higher caloric intake per body weights than male wildtype mice (left panel) at weeks 2-12 (P<0.05). Similarly, the β-END knockout female demonstrated higher caloric intake per body weights compared to male knockout mice (right panel). The post-hoc test revealed significant differences at weeks 2-12 (P<0.05). As shown in Figure 4, there were no differences in caloric intake per body weight at week 0, when female and male mice were maintained on RD (week 0). While we did not observe differences in calories consumed per body weight when comparing the two genotypes (P>0.05), our data suggests that there were differences between male and female mice. Our data suggests that despite smaller body weights observed in female mice, the female mice consumed more food than the male mice, regardless of genotype.
3.4. Differences in Glucose Tolerance in Male and Female β-END Mice Following Six and Twelve Weeks of HFD
Glucose Homeostasis
To determine if chronic HFD consumption affected glucose homeostasis, we performed OGTT at weeks 6 (Figure 5) and 12 (Figure 6) for male and female mice of the two genotypes. The mice were fasted overnight (10 h) and were given 20% glucose solution orally. Blood glucose levels were measured from tail bleeds at baseline (0), and at 30-, 60-, 90-, and 120-mins following sugar administration. After six weeks of HFD consumption in male mice, a two-way ANOVA revealed no significant effect of genotype [F (1, 14) = 3.411; P = 0.0860] and no interaction between time and genotype [F (4, 56) = 2.229; P = 0.0774]. However, we found a significant effect of time [F (2.851, 39.92) = 23.97; P < 0.0001]. Furthermore, we determined the areas under the curve (AUC) using GraphPad Prism (Figure 5B). Male wildtype and knockout mice had average total AUCs of 42706.9 mg/dL * mins and 50015.6 mg/dL * mins, respectively. Additionally, an unpaired t-test showed a robust trend toward a significant difference (P = 0.0524) between male mice of the two genotypes. On the other hand, female mice exhibited different response to glucose after six weeks of HFD (Figure 5C). A two-way ANOVA revealed a significant interaction between time and genotype [F (4, 48) = 2.793; P = 0.0365] and a significant effect of time [F (2.319, 27.83) = 41.07; P < 0.0001], but there were no genotype effects [F (1, 12) = 4.253; P = 0.0615]. Furthermore, Fisher’s LSD test showed that female knockout mice had better glucose tolerance than wildtype mice at 30 mins (P = 0.0445; Figure 5C). Unlike male mice, female wildtype mice had an AUC of 40240.7 mg/dL * mins and knockout mice had 30662.1 mg/dL * mins. An unpaired t-test also revealed a robust trend toward a significant difference between the two genotypes (P = 0.0591).
We also performed oral glucose tolerance test after twelve weeks on HFD to determine if chronic access to HFD affects glucose homeostasis. We followed the same protocol as above. As shown on Figure 6A and 6B, we observed no differences between male mice of the two genotypes. A two-way ANOVA revealed no significant interaction between time and genotype [F (4, 112) = 0.1934; P = 0.9414]. However, there were significant effects of time [F (3.037, 85.04) = 53.86; P < 0.0001] but not in genotype F (1, 28) = 0.5846; P = 0.4509]. Interestingly, the blood glucose levels remained elevated throughout the entire 2-h test period in male mice of the two genotypes, which is typically observed in naïve mice during this test. Furthermore, male wildtype and knockout mice had average total areas of 49781 and 48184.7 mg/dL * mins, respectively. There was no significant difference (P>0.05) between mice of the two genotypes. Furthermore, we observed no differences in glucose tolerance between female mice of the two genotypes. A two-way ANOVA showed no significant interaction between time and genotype [F (4, 56) = 2.459; P = 0.0559] an no genotype effects [F (1, 14) = 0.3118; P = 0.5854]. On the other hand, there was a significant effect of time [F (2.967, 41.53) = 45.12; P < 0.0001]. In addition, an unpaired t-test revealed no difference (P = 0.6372) between the areas of the curve between mice of the two genotypes (wildtype: 34965 mg/dL * mins and knockout: 33972 mg/dL* mins) of glucose tolerance in female mice (Figure 6D).
3.5. Differences in Glucose Tolerance in Male and Female β-END Mice after Six and Twelve Weeks of HFD
We also determined if the timepoint (week 6 vs. 12) in which OGTT is performed affected the glucose levels in the β-END deficient mice and their wildtype controls. Using the AUCs as the unit, we compared the OGTT results and determined if there were sex-related differences in this regard (Figure 7).
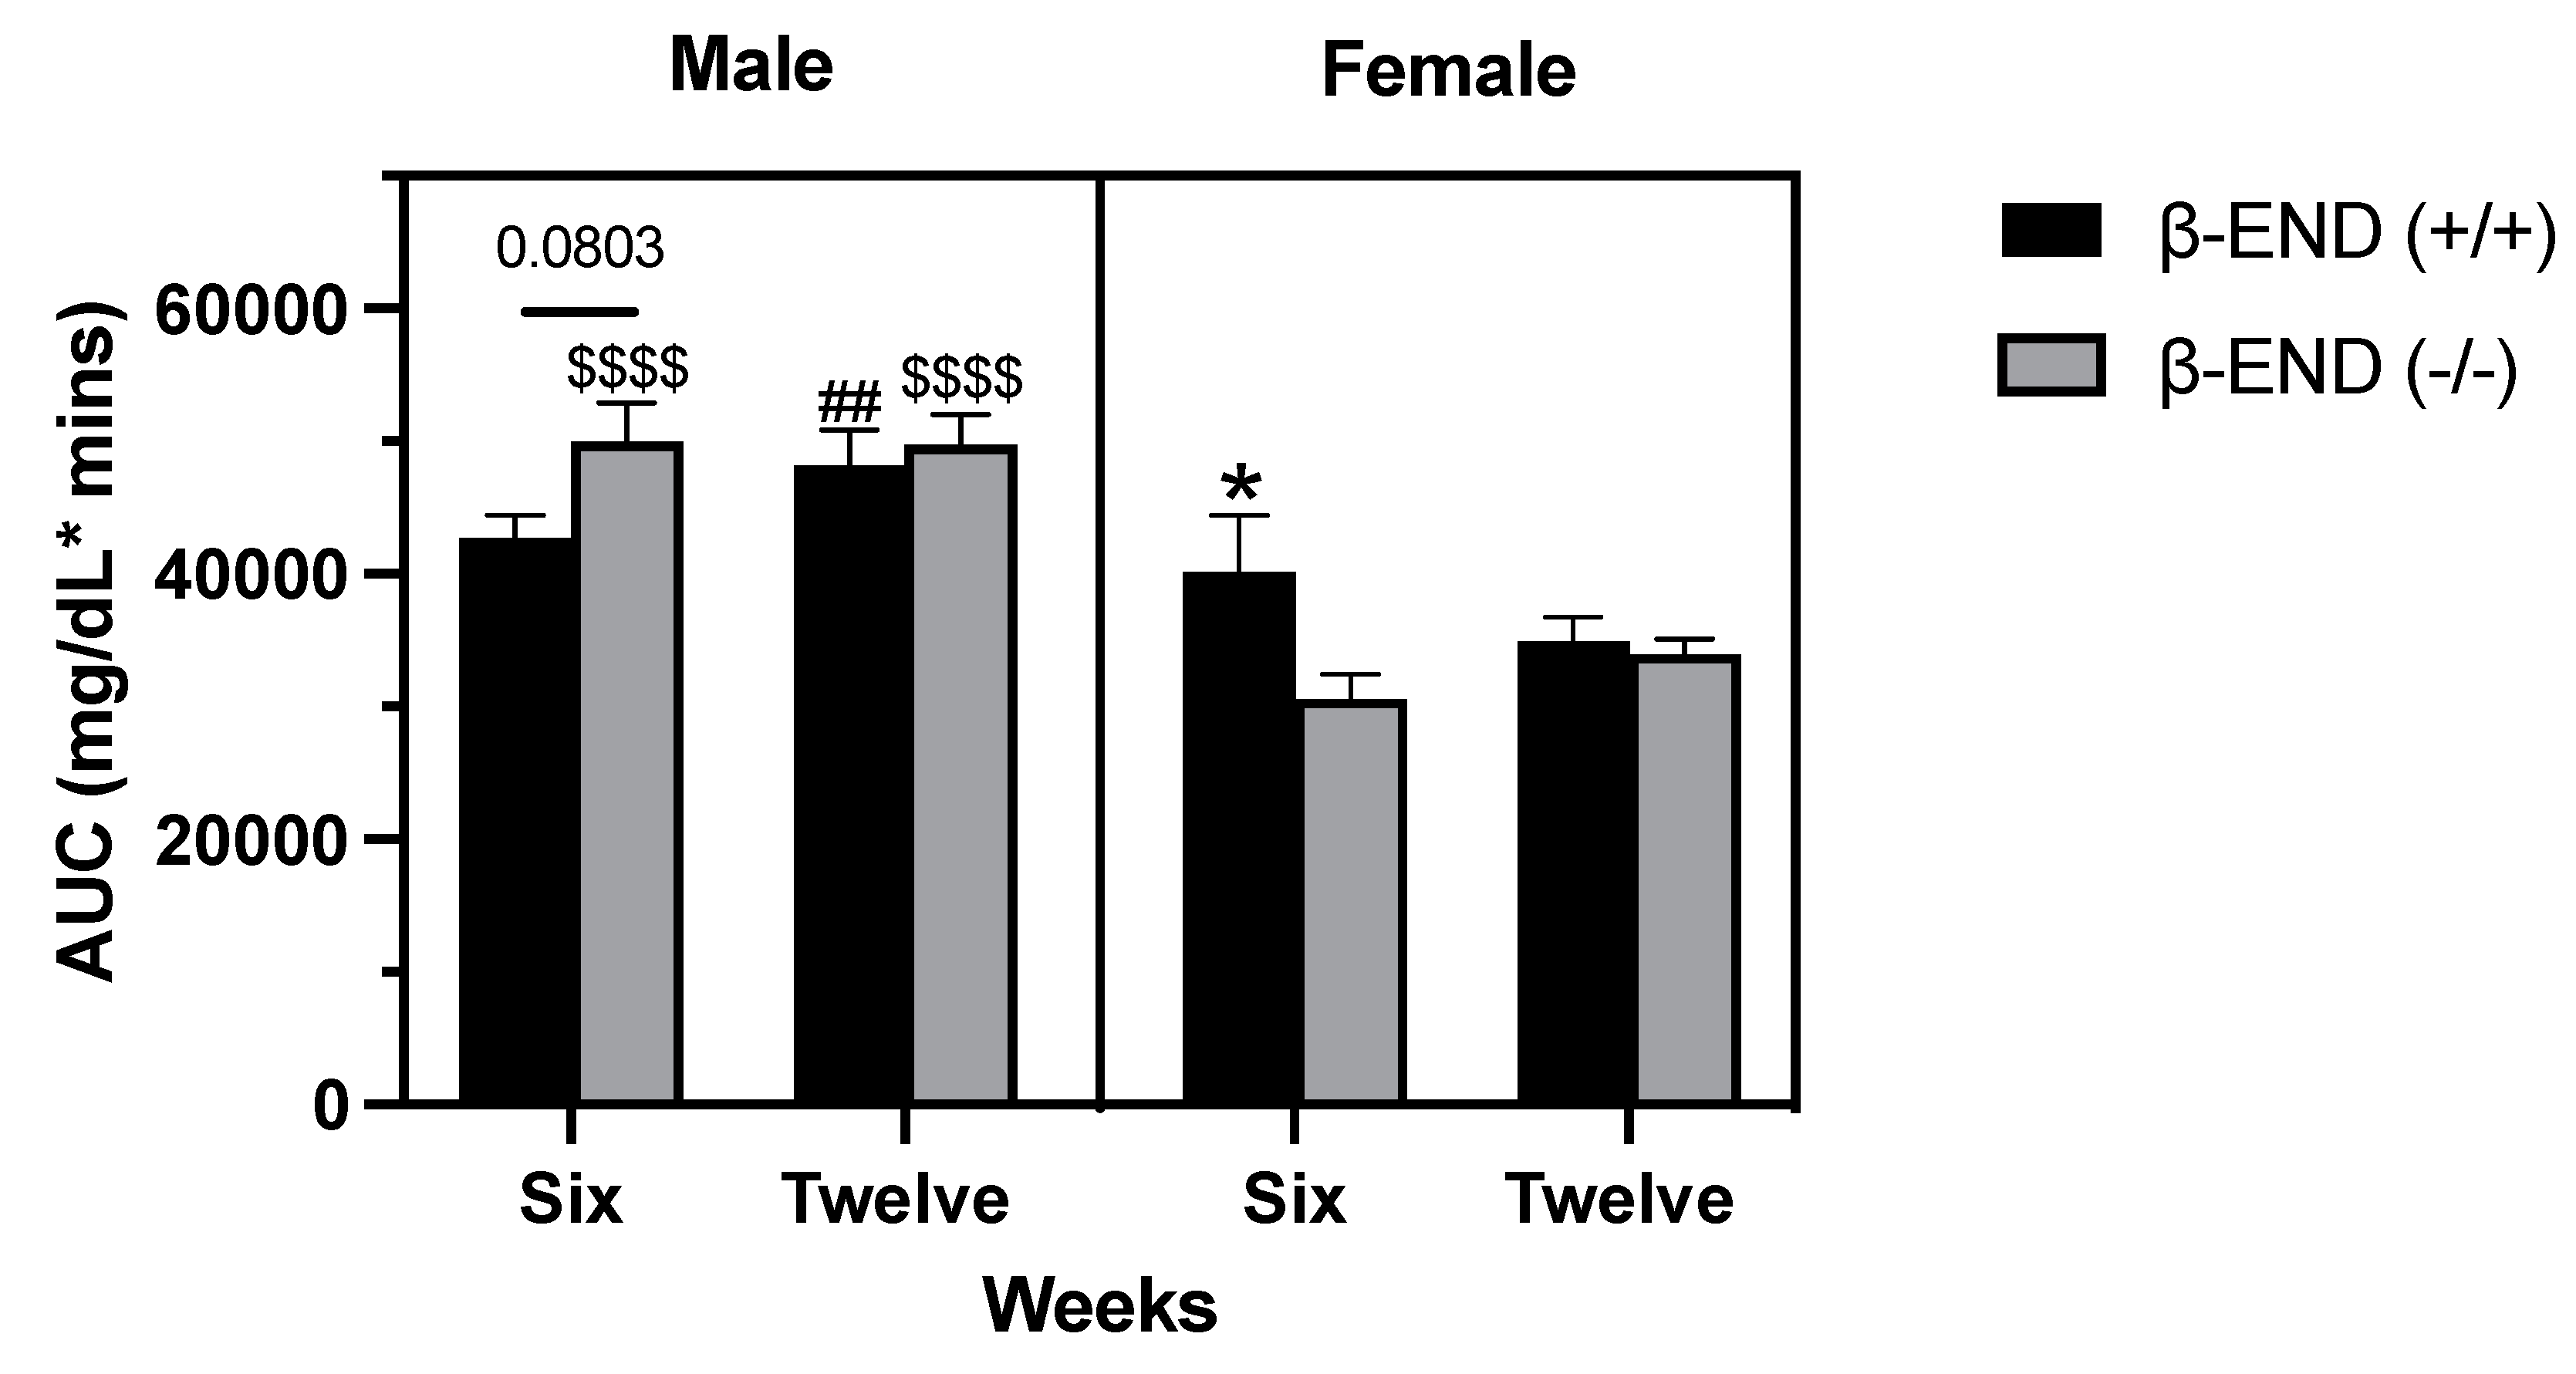
Using a mixed-effects analysis, we observed a significant interaction between time and genotype [F (1, 26) = 7.369; P= 0.0116) and significant effect of genotype [F (1, 26) = 47.65; P < 0.0001]; however, no other significant interactions or effects were observed. Our data suggests that the AUC was not different between male or female mice of the two genotypes. However, female wildtype mice exhibited higher AUC at week 6 when compared to the female mice lacking β-END (right panel; P = 0.04). Moreover, we also observed a similar trend in the male mice at six weeks, although not significant (P < 0.08; left panel). Our data also demonstrate sex-specific differences in terms of OGTT-AUCs that may be time-dependent. The current findings show that the OGTT-AUCs for the male knockout mice were significantly higher at both weeks 6 (P < 0.0001) and 12 (P < 0.0001) when compared to the female knockout mice. On the other hand, we only observed a significant difference between the male and female wildtype mice at week 12 (P < 0.0013).
4. Discussion
Several studies have shown that the POMC-derived peptide β-END could modulate feeding behavior, but the role of endogenous β-END in glucose and energy homeostasis following a long-term access to HFD is still unknown. Therefore, in the present study, using genetically engineered knockout mice, we determined the role of β-END in food intake and plasma glucose levels when fed chronically an HFD (12 weeks) and assessed if sex-related differences existed in these processes. The main findings of the present study are that deletion of β-END results in increased body weights in male mice, but not in female mice; however, female mice consumed more calories than the male mice despite their smaller body weights. In addition, male and female mice lacking the ability to produce β-END demonstrated different glucose tolerance when compared to their respective wildtype controls, but this was only seen at week 6. Male mice of both genotypes exhibited significantly greater impairment in glucose tolerance test than their female counterparts but only male mice lacking β-END had greater impairment in OGTT on week 6 than their female controls. Together, our results suggest an involvement of β-END in regulating body weight, food consumption, and glucose homeostasis and highlight the potential sex-specific differences involved in these processes.
As previously stated, β-END has been implicated to influence feeding behavior, but its role has not been fully elucidated. While several studies suggest that administration of exogenous β-END increases food intake [11,12], other studies show that genetic deletion of the peptide demonstrated opposing effects [14,20]. Given that pharmacological studies have only shown acute effects on food intake, there is no prior study assessing the role of endogenous β-END as a regulator of food intake, body weight and glucose homeostasis following long-term access to an HFD. Therefore, we focused on the effects of chronic access to an HFD on energy and glucose homeostasis in male and female mice lacking β-END and their wildtype controls. As expected, we observed an increased in caloric intake when male and female mice were switched to HFD, however, the effects on body weights were sexually dimorphic. Our results show that male β-END deficient mice exhibited increased body when compared to their wildtype controls. Interestingly, β-END knockout male mice displayed higher body weights, especially at later time points, without alteration in feeding when compared to their wildtype controls, at least for specific weeks. These findings were consistent with previous studies demonstrating that male mice were obese given unlimited access to standard chow [14,15]. These results suggest that endogenous β-END might have an anorectic effect, in contrast to increased food intake observed in mice given exogenous β-END. However, in this study, we did not include animals exposed to regular diet to determine whether this effect is due to palatability of food or other factors in these mice. Our previous work showed no difference in regular chow intake between mice of the two genotypes [21].
We included female mice in our study since previous works have mainly focused on male mice. Our present study illustrated that female mice lacking β-END, unlike their male counterparts, did not exhibit higher body weights when compared to their wildtype controls despite the increased caloric intake observed. Interestingly, irrespective of genotype, female mice demonstrated increased caloric intake per body weight. While the role of β-END in food intake in female mice remains unclear, this finding suggests that there might be a sex-specific difference in compensatory energy expenditure in male and female mice. A possible explanation why female mice exhibited smaller body weights when compared to male mice was due to an increased locomotor activity (Stojakovic et al. 2019), but this was not measured in our study. However, there is previous evidence demonstrating that female rodents maintained a higher energy expenditure following short-term HFD-feeding [22,23]. Thus, further studies are needed to fully characterize the role of β-END in energy homeostasis, especially its role in energy expenditure and its interaction with sex hormones.
Despite the known affinity of β-END for mu-, kappa-, and delta- opioid receptors, it has been suggested that β-END exerts its effects on feeding behavior by preferentially binding to mu opioid receptors [12]. Several studies have supported this claim; demonstrating that opioid receptor antagonists, such as naloxone or naltrexone, could reverse the effects of exogenous β-END on feeding behavior [12,13,14,24]. Although pharmacological studies involving opioid antagonists have suggested that MOPs are involved in modulating the effects of β-END, genetic deletion of this opioid receptor had yielded different outcomes. Consistent with our studies, Wen and colleagues have demonstrated that both male and female mice lacking the MOP-1 on C57BL/6J background had higher body weight and a preferential increase in fat deposition [25]. On the other hand, MOP-deficient mice were resistant to diet-induced obesity despite a comparable food intake to that of wildtype mice [26]. In another study, MOP-deficient mice had decreased motivation to eat when compared to wildtype controls [16]. Thus, it is possible that β-END may act on its own receptor to regulate food intake and body weight. Consistent with this hypothesis, we have previously shown that the rewarding action of acute cocaine is blunted in mice lacking β-END but not in MOP knockout mice [27].
Opioid peptides have also been linked to regulate glucose homeostasis; however, their role is poorly characterized. In this study, we wanted to determine if β-END played any functional role in regulating plasma glucose levels. While we set out to perform oral glucose tolerance tests after long-term access to HFD, we also included an earlier time point (week 6) to see if we can detect any differences at this time and do not miss any opportunity to observe a difference between mice of the two genotypes. Interestingly, our findings demonstrated that deletion of β-END in female mice improved glucose tolerance compared to their wildtype controls at week 6, despite no differences in body weights; while male mice showed opposite results. This demonstrates that female β-END wildtype mice could not clear glucose as efficiently as the knockouts, despite having similar baseline levels. On the other hand, male mice lacking β-END show signs of impaired glucose tolerance at week 6 compared to male wildtype mice at 30 min as well as against their female mice lacking β-END, as their glucose levels did not return to baseline after a 2-hour period as seen in female mice. Moreover, while we did not observe differences between the knockout and wildtype mice at week 12, our results demonstrate a sexually dimorphic response in glucose tolerance test showing that male mice, regardless of genotype, displayed impaired glucose tolerance. After 12 weeks of exposure to HFD, the differences between the wildtype and knockout mice, regardless of genotype, have diminished. However, male mice showed a more pronounced impaired glucose tolerance test compared to their female counterparts. These findings suggest that β-END may play a transient role in regulating homeostasis—that can only be observed in short-term HFD feeding. These results also reveal male/female differences in glucose tolerance following chronic (12 weeks) access to an HFD but this impairment was observed in the absence of β-END at even earlier time point (6 weeks). Thus, further studies are needed to assess the role of sex hormones and its interaction with β-END in this impairment in future studies.
Although our current study did not measure blood glucose levels of mice fed a regular diet only, a previous work had already shown no differences between the female genotypes under this condition [14]. We have also conducted OGTT in male and female mice fed a regular diet and found no difference between mice of the two genotypes (Espinosa and Lutfy, data not shown). A study has previously shown that genetic deletion of MOP resulted in an improved glucose tolerance by modulating insulin secretion [25], consistent with our results in female mice lacking β-END and their wildtype controls. Based on our findings, genetic deletion of β-END might be beneficial as it offers short-term protection from an impaired glucose tolerance, at least in the female mice. On the other hand, pharmacological studies have demonstrated that infusion of β-END could improve insulin resistance in rats [28]. In addition, the Lai Lab has previously suggested that MOP activation by β-END can increase glucose utilization in peripheral tissues in diabetic rats [29]. Furthermore, a more recent study has shown that infusion of DAMGO, a MOP agonist, in the nucleus accumbens can enhance glycemic response in rats [30]. Thus, these findings need to be explored further, either by increasing the sample size or including an insulin tolerance test to observe the correlation between glucose and insulin levels. The enhanced glucose clearance observed in the female β-END knockout mice after six weeks of HFD exposure may suggest an increased insulin release, resulting in an increased glucose uptake and fat storage within these mice. Therefore, determining the underlying cause of increase in body weights of these mice would be of specific interest. For example, measuring fat pads, muscles, liver, and other organs could elucidate the reasons for these changes.
5. Conclusions
In conclusion, our results presented here suggest that endogenous β-END maybe involved in food intake and glucose homeostasis in both male and female mice, but only in short-term feeding. In addition, we observed sex-specific differences in this regard and the lack of β-END may cause impairment of glucose tolerance at a faster rate (6 weeks) in male mice.
Author Contributions
Conceptualization, K.L. and A.B.M.; methodology, L.T., and A.H.; software, L.T., V.E., and K.L.; validation, L.T.; formal analysis, L.T., V.E. and K.L.; investigation, L.T.; resources, K.L.; data curation, L.T.; writing—original draft preparation, L.T.; writing—review and editing, L.T, V.E., K.L. and A.B.M.; supervision, K.L. and A.B.M.; project administration, K.L.; funding acquisition, K.L. All authors have read and agreed to the published version of the manuscript.
Funding
This research received no external funding.
Institutional Review Board Statement
The animal study protocol was approved by the Institutional Animal Care and Use Committee (R23/IACUC/035), Western University of Health Sciences (Pomona, California, USA).
Informed Consent Statement
Not Applicable.
Data Availability Statement
Data will be provided by the corresponding author upon a reasonable request.
Acknowledgments
The authors thank the Department of Biotechnology and Pharmaceutical Sciences, College of Pharmacy and College of Biomedical Sciences, Western University of Health Sciences for the resources needed for this project.
Conflict of Interest
The authors declare no conflict of interest.
References
- Apovian, C.M. Obesity: Definition, comorbidities, causes, and burden. Am J Manag Care 2016, 22 (Suppl. 7), s176–185. [Google Scholar] [PubMed]
- Spiegelman, B.M.; Flier, J.S. Obesity and the regulation of energy balance. Cell 2001, 104, 531–543. [Google Scholar] [CrossRef] [PubMed]
- Wyatt, S.B.; Winters, K.P.; Dubbert, P.M. Overweight and obesity: Prevalence, consequences, and causes of a growing public health problem. Am J Med Sci 2006, 331, 166–174. [Google Scholar] [CrossRef] [PubMed]
- Bhurosy, T.; Jeewon, R. Overweight and obesity epidemic in developing countries: A problem with diet, physical activity, or socioeconomic status? ScientificWorldJournal 2014, 2014, 964236. [Google Scholar] [CrossRef] [PubMed]
- Caballero, B. The global epidemic of obesity: An overview. Epidemiol Rev 2007, 29, 1–5. [Google Scholar] [CrossRef]
- Rakhra, V.; et al. Obesity and the Western Diet: How We Got Here. Mo Med 2020, 117, 536–538. [Google Scholar]
- Romieu, I.; et al. Energy balance and obesity: What are the main drivers? Cancer Causes Control 2017, 28, 247–258. [Google Scholar] [CrossRef]
- Dum, J.; Gramsch, C.; Herz, A. Activation of hypothalamic beta-endorphin pools by reward induced by highly palatable food. Pharmacol Biochem Behav 1983, 18, 443–447. [Google Scholar] [CrossRef]
- Mizushige, T.; et al. Preference for dietary fat induced by release of beta-endorphin in rats. Life Sci 2009, 84, 760–765. [Google Scholar] [CrossRef] [PubMed]
- Matsumura, S.; et al. Dietary fat ingestion activates beta-endorphin neurons in the hypothalamus. FEBS Lett 2012, 586, 1231–1235. [Google Scholar] [CrossRef]
- Triscari, J.; et al. Effect of centrally and peripherally administered beta-endorphin on food intake in rats. Int J Pept Protein Res 1989, 34, 358–362. [Google Scholar] [CrossRef]
- Silva, R.M.; et al. Beta-endorphin-induced feeding: Pharmacological characterization using selective opioid antagonists and antisense probes in rats. J Pharmacol Exp Ther 2001, 297, 590–596. [Google Scholar]
- Dutia, R.; et al. beta-Endorphin antagonizes the effects of alpha-MSH on food intake and body weight. Endocrinology 2012, 153, 4246–4255. [Google Scholar] [CrossRef] [PubMed]
- Appleyard, S.M.; et al. A role for the endogenous opioid beta-endorphin in energy homeostasis. Endocrinology 2003, 144, 1753–1760. [Google Scholar] [CrossRef]
- Low, M.J.; et al. State-dependent modulation of feeding behavior by proopiomelanocortin-derived beta-endorphin. Ann N Y Acad Sci 2003, 994, 192–201. [Google Scholar] [CrossRef]
- Papaleo, F.; et al. Decreased motivation to eat in mu-opioid receptor-deficient mice. Eur J Neurosci 2007, 25, 3398–3405. [Google Scholar] [CrossRef]
- Giraudo, S.Q.; Billington, C.J.; Levine, A.S. Effects of the opioid antagonist naltrexone on feeding induced by DAMGO in the central nucleus of the amygdala and in the paraventricular nucleus in the rat. Brain Res 1998, 782, 18–23. [Google Scholar] [CrossRef] [PubMed]
- Slugg, R.M.; et al. Effect of the mu-opioid agonist DAMGO on medial basal hypothalamic neurons in beta-endorphin knockout mice. Neuroendocrinology 2000, 72, 208–217. [Google Scholar] [CrossRef]
- Rubinstein, M.; et al. Absence of opioid stress-induced analgesia in mice lacking beta-endorphin by site-directed mutagenesis. Proc Natl Acad Sci U S A 1996, 93, 3995–4000. [Google Scholar] [CrossRef]
- Valverde, O.; et al. Reduction of stress-induced analgesia but not of exogenous opioid effects in mice lacking CB1 receptors. Eur J Neurosci 2000, 12, 533–539. [Google Scholar] [CrossRef]
- Tolentino, L.; et al. The Role of Beta-Endorphin in Food Deprivation-Mediated Increases in Food Intake and Binge-Eating. Brain Sci 2023, 13. [Google Scholar] [CrossRef]
- Krishna, S.; et al. Time-dependent behavioral, neurochemical, and metabolic dysregulation in female C57BL/6 mice caused by chronic high-fat diet intake. Physiol Behav 2016, 157, 196–208. [Google Scholar] [CrossRef]
- Huang, K.P.; et al. Sex differences in response to short-term high fat diet in mice. Physiol Behav 2020, 221, 112894. [Google Scholar] [CrossRef]
- Panigrahi, S.K.; Meece, K.; Wardlaw, S.L. Effects of Naltrexone on Energy Balance and Hypothalamic Melanocortin Peptides in Male Mice Fed a High-Fat Diet. J Endocr Soc 2019, 3, 590–601. [Google Scholar] [CrossRef]
- Wen, T.; Peng, B.; Pintar, J.E. The MOR-1 opioid receptor regulates glucose homeostasis by modulating insulin secretion. Mol Endocrinol 2009, 23, 671–678. [Google Scholar] [CrossRef]
- Tabarin, A.; et al. Resistance to diet-induced obesity in mu-opioid receptor-deficient mice: Evidence for a “thrifty gene”. Diabetes 2005, 54, 3510–3516. [Google Scholar] [CrossRef]
- Nguyen, A.T.; et al. The rewarding action of acute cocaine is reduced in beta-endorphin deficient but not in mu opioid receptor knockout mice. Eur J Pharmacol 2012, 686, 50–54. [Google Scholar] [CrossRef]
- Su, C.F.; et al. Infusion of beta-endorphin improves insulin resistance in fructose-fed rats. Horm Metab Res 2004, 36, 571–577. [Google Scholar] [CrossRef]
- Cheng, J.T.; et al. Plasma glucose-lowering effect of beta-endorphin in streptozotocin-induced diabetic rats. Horm Metab Res 2002, 34, 570–576. [Google Scholar] [CrossRef]
- Koekkoek, L.L.; et al. Activation of nucleus accumbens mu-opioid receptors enhances the response to a glycaemic challenge. J Neuroendocrinol 2021, 33, e13036. [Google Scholar] [CrossRef]
Figure 1.
Schematic Diagram of The Experimental Procedure.
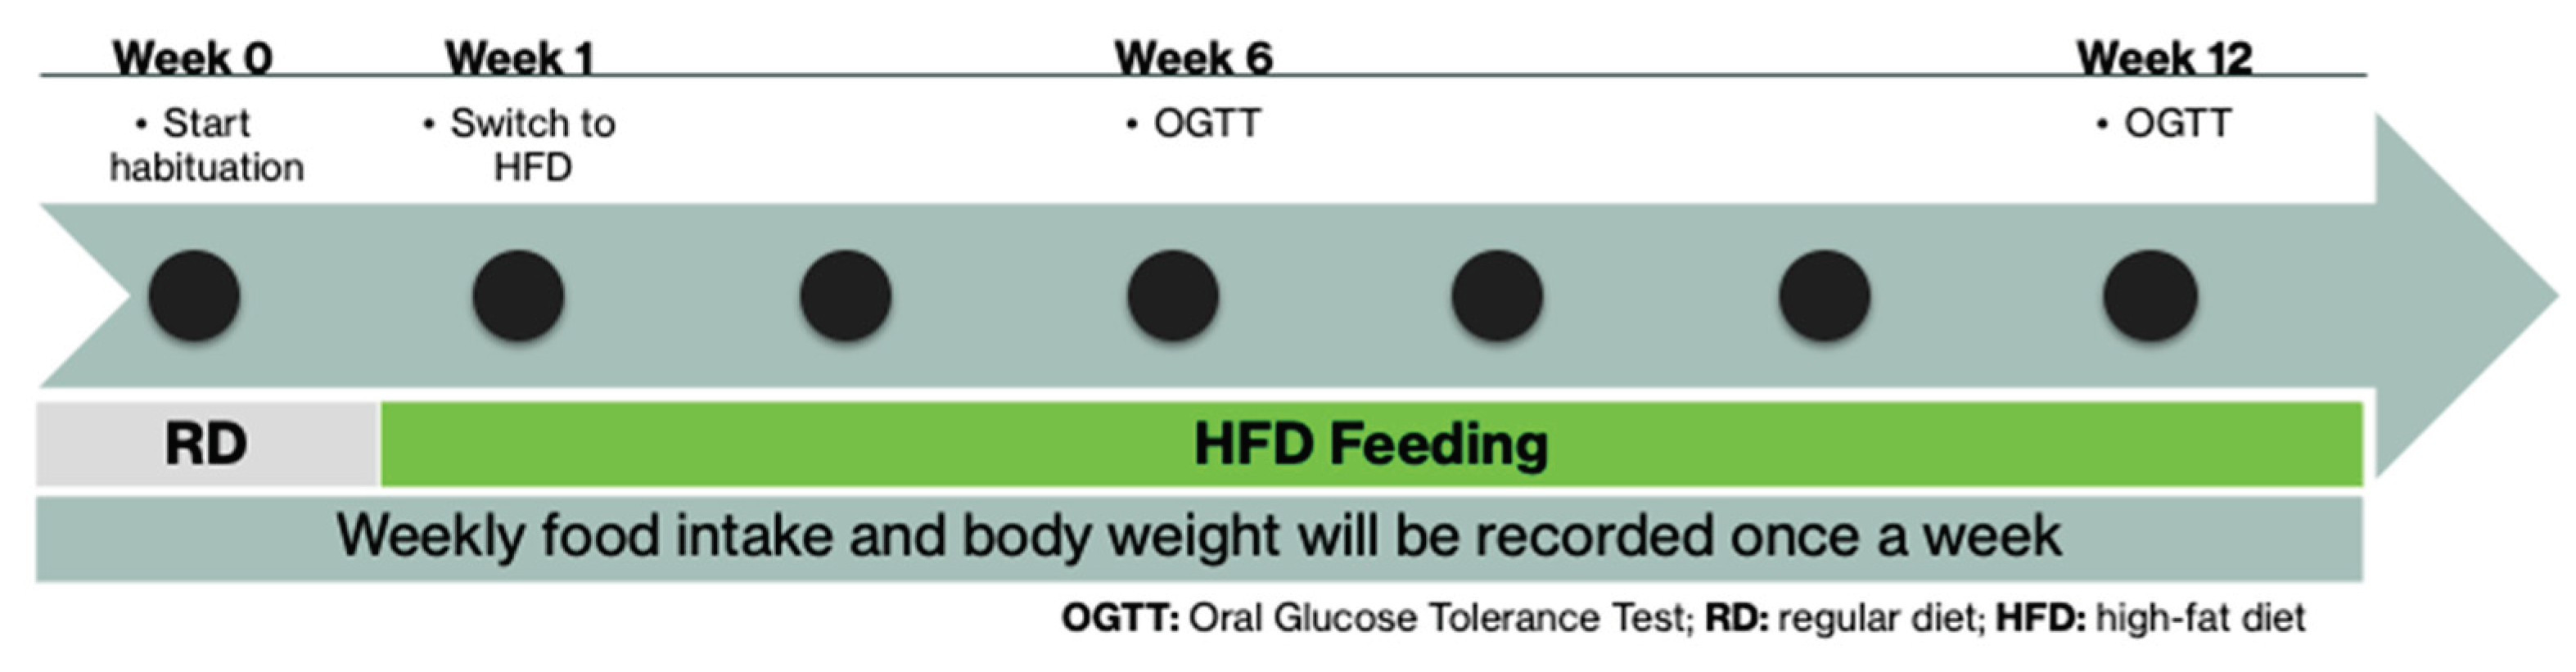
Figure 2.
Weekly body weight measurements of male (2A) and female (2C) β-END deficient mice and their wildtype littermates and age-matched controls fed an HFD for 12 weeks. Normalized (as percent of the original weight of mice) body weight in male (Figure B) and female (Figure 2D) are also shown. Mice were maintained on RD during habituation (week 0) and fed only an HFD (weeks 1-12). Data are represented as means ± SEM for each group with n=12-20 per time point. Data were analyzed using two-way ANOVA with Fisher’s LSD correction (*P < 0.05).
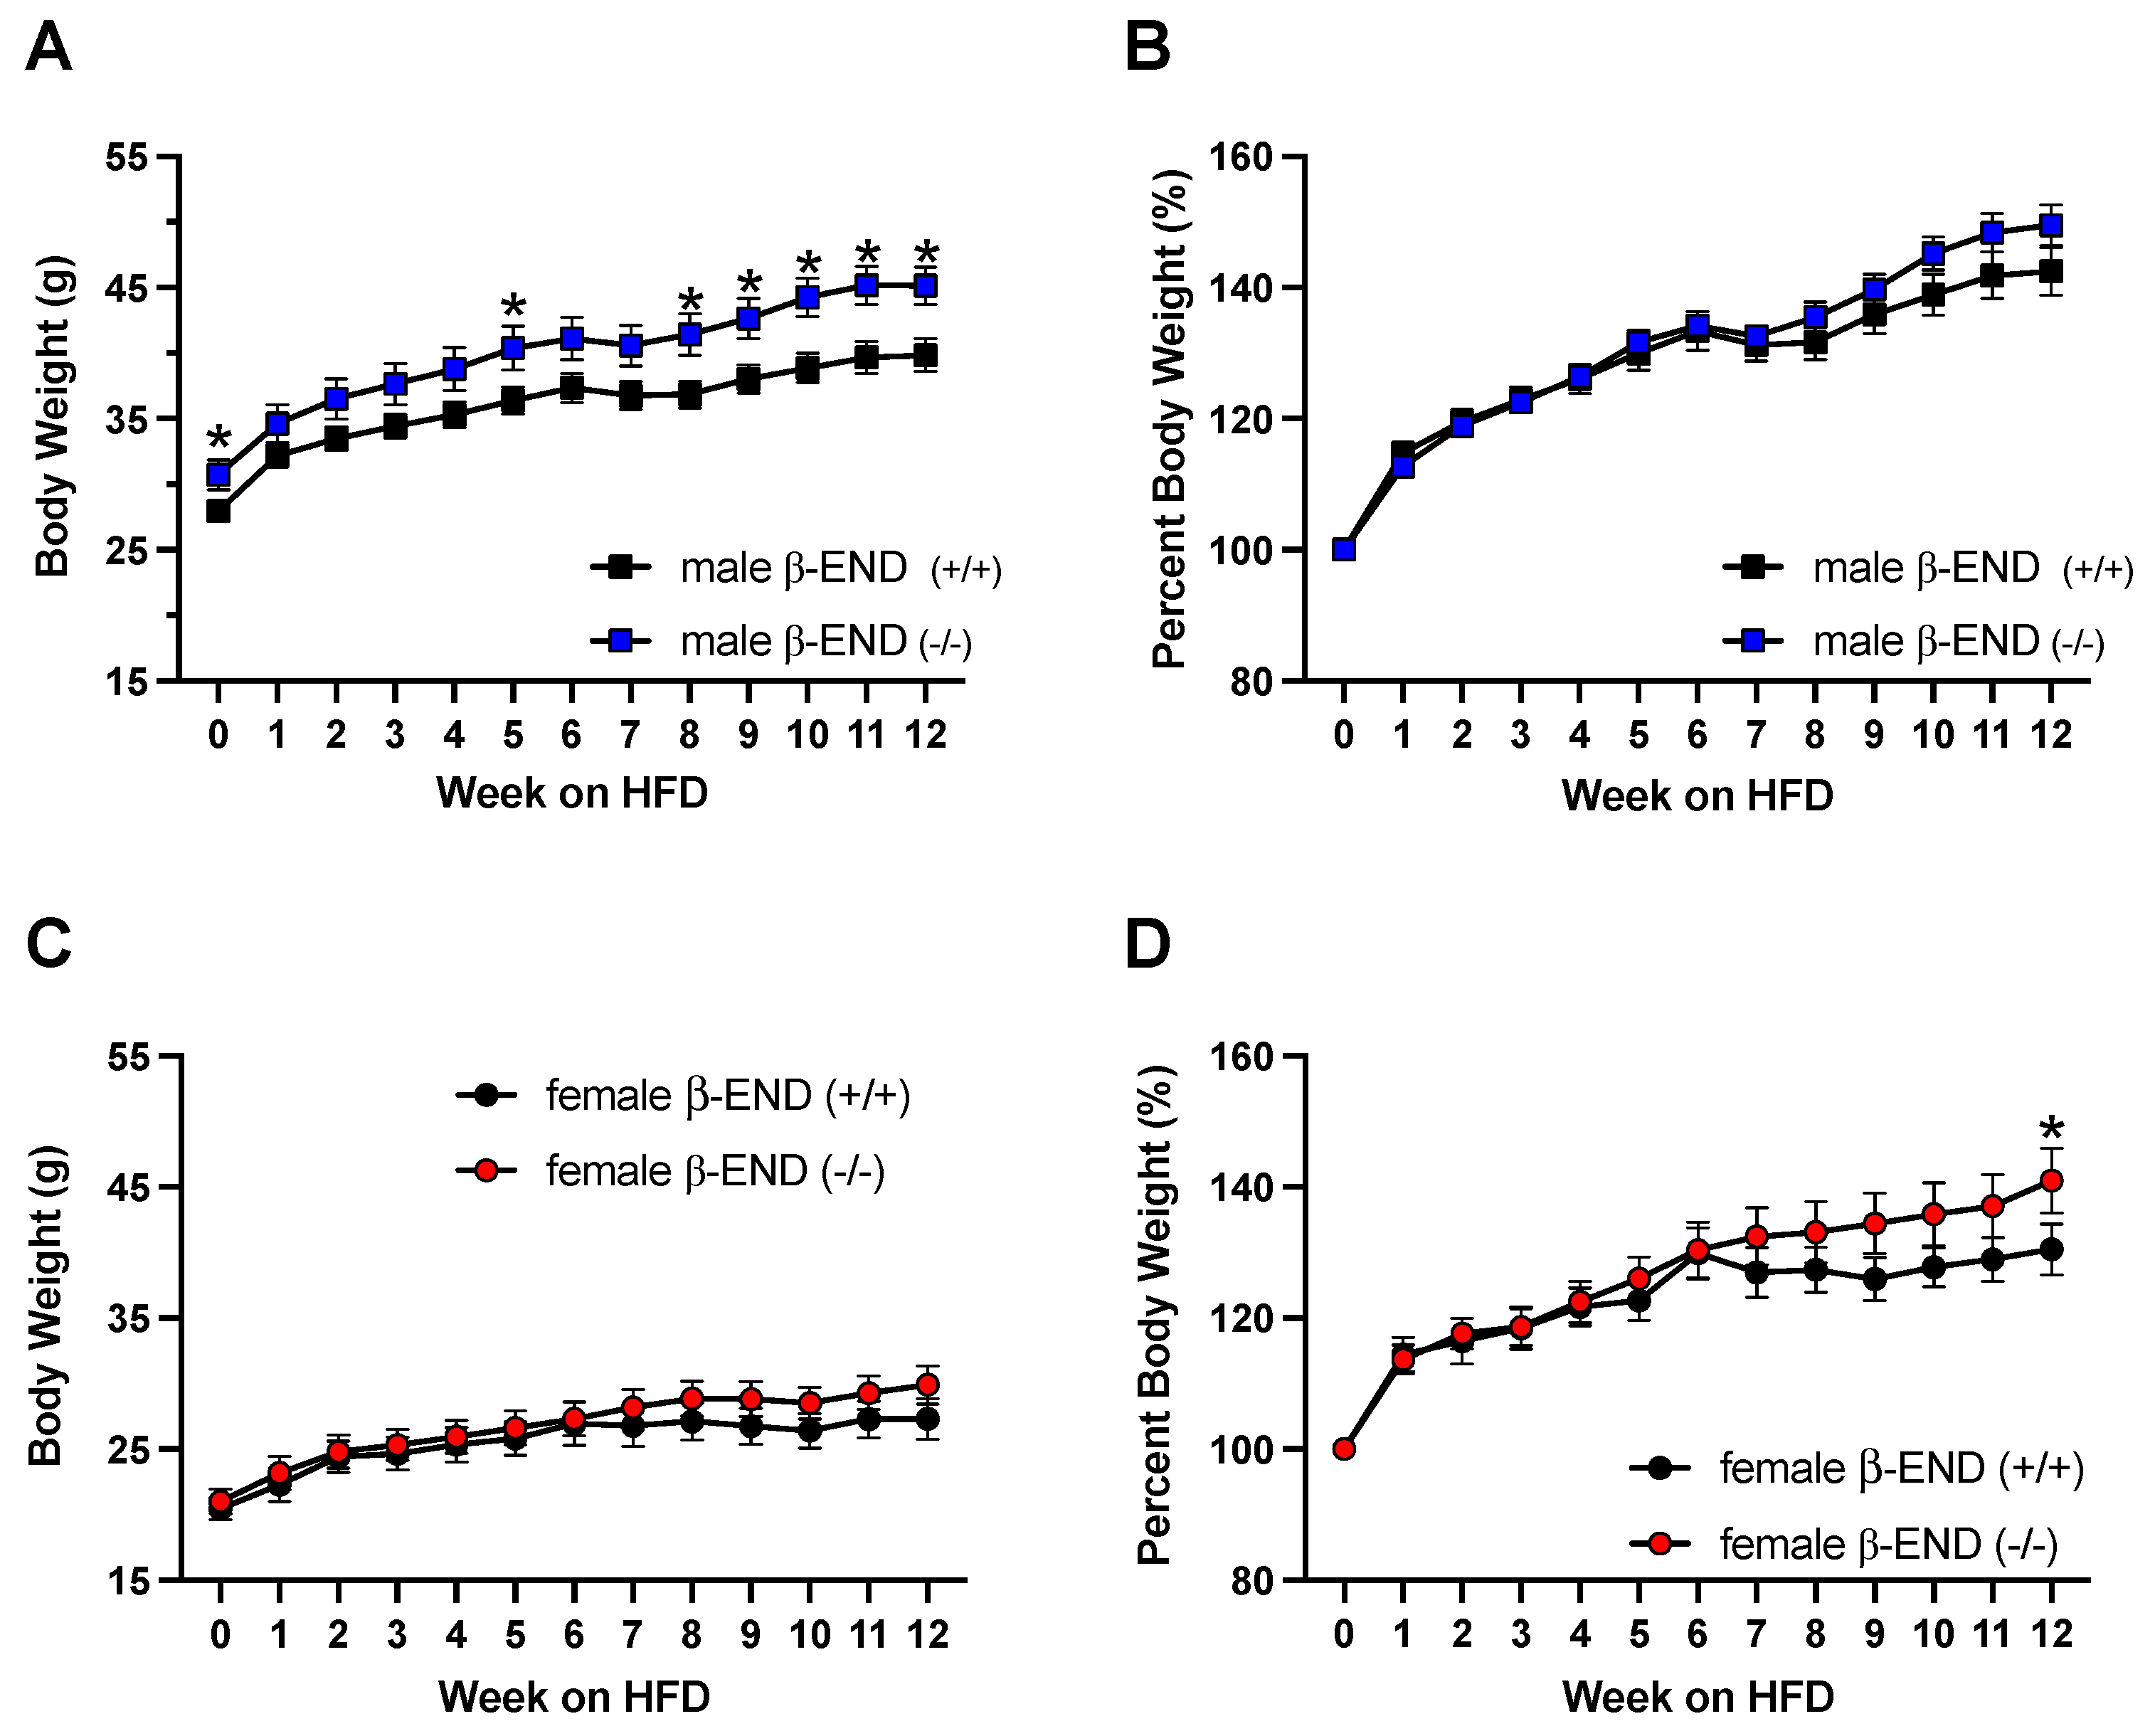
Figure 3.
Average daily food and caloric intake of male and female β-END knockout mice and their wildtype littermates and age-matched controls. Food intake in grams and caloric intake were measured for twelve weeks in male (A and B) and female (C and D). Mice were maintained on RD (week 0) and switched to HFD (weeks 1-12). Data are represented as means ± SEM for each group with n=12-20 per time point. Data were analyzed using two-way ANOVA with Fisher’s LSD correction. No significant difference was observed in food or caloric intake between the mice of the two genotypes.
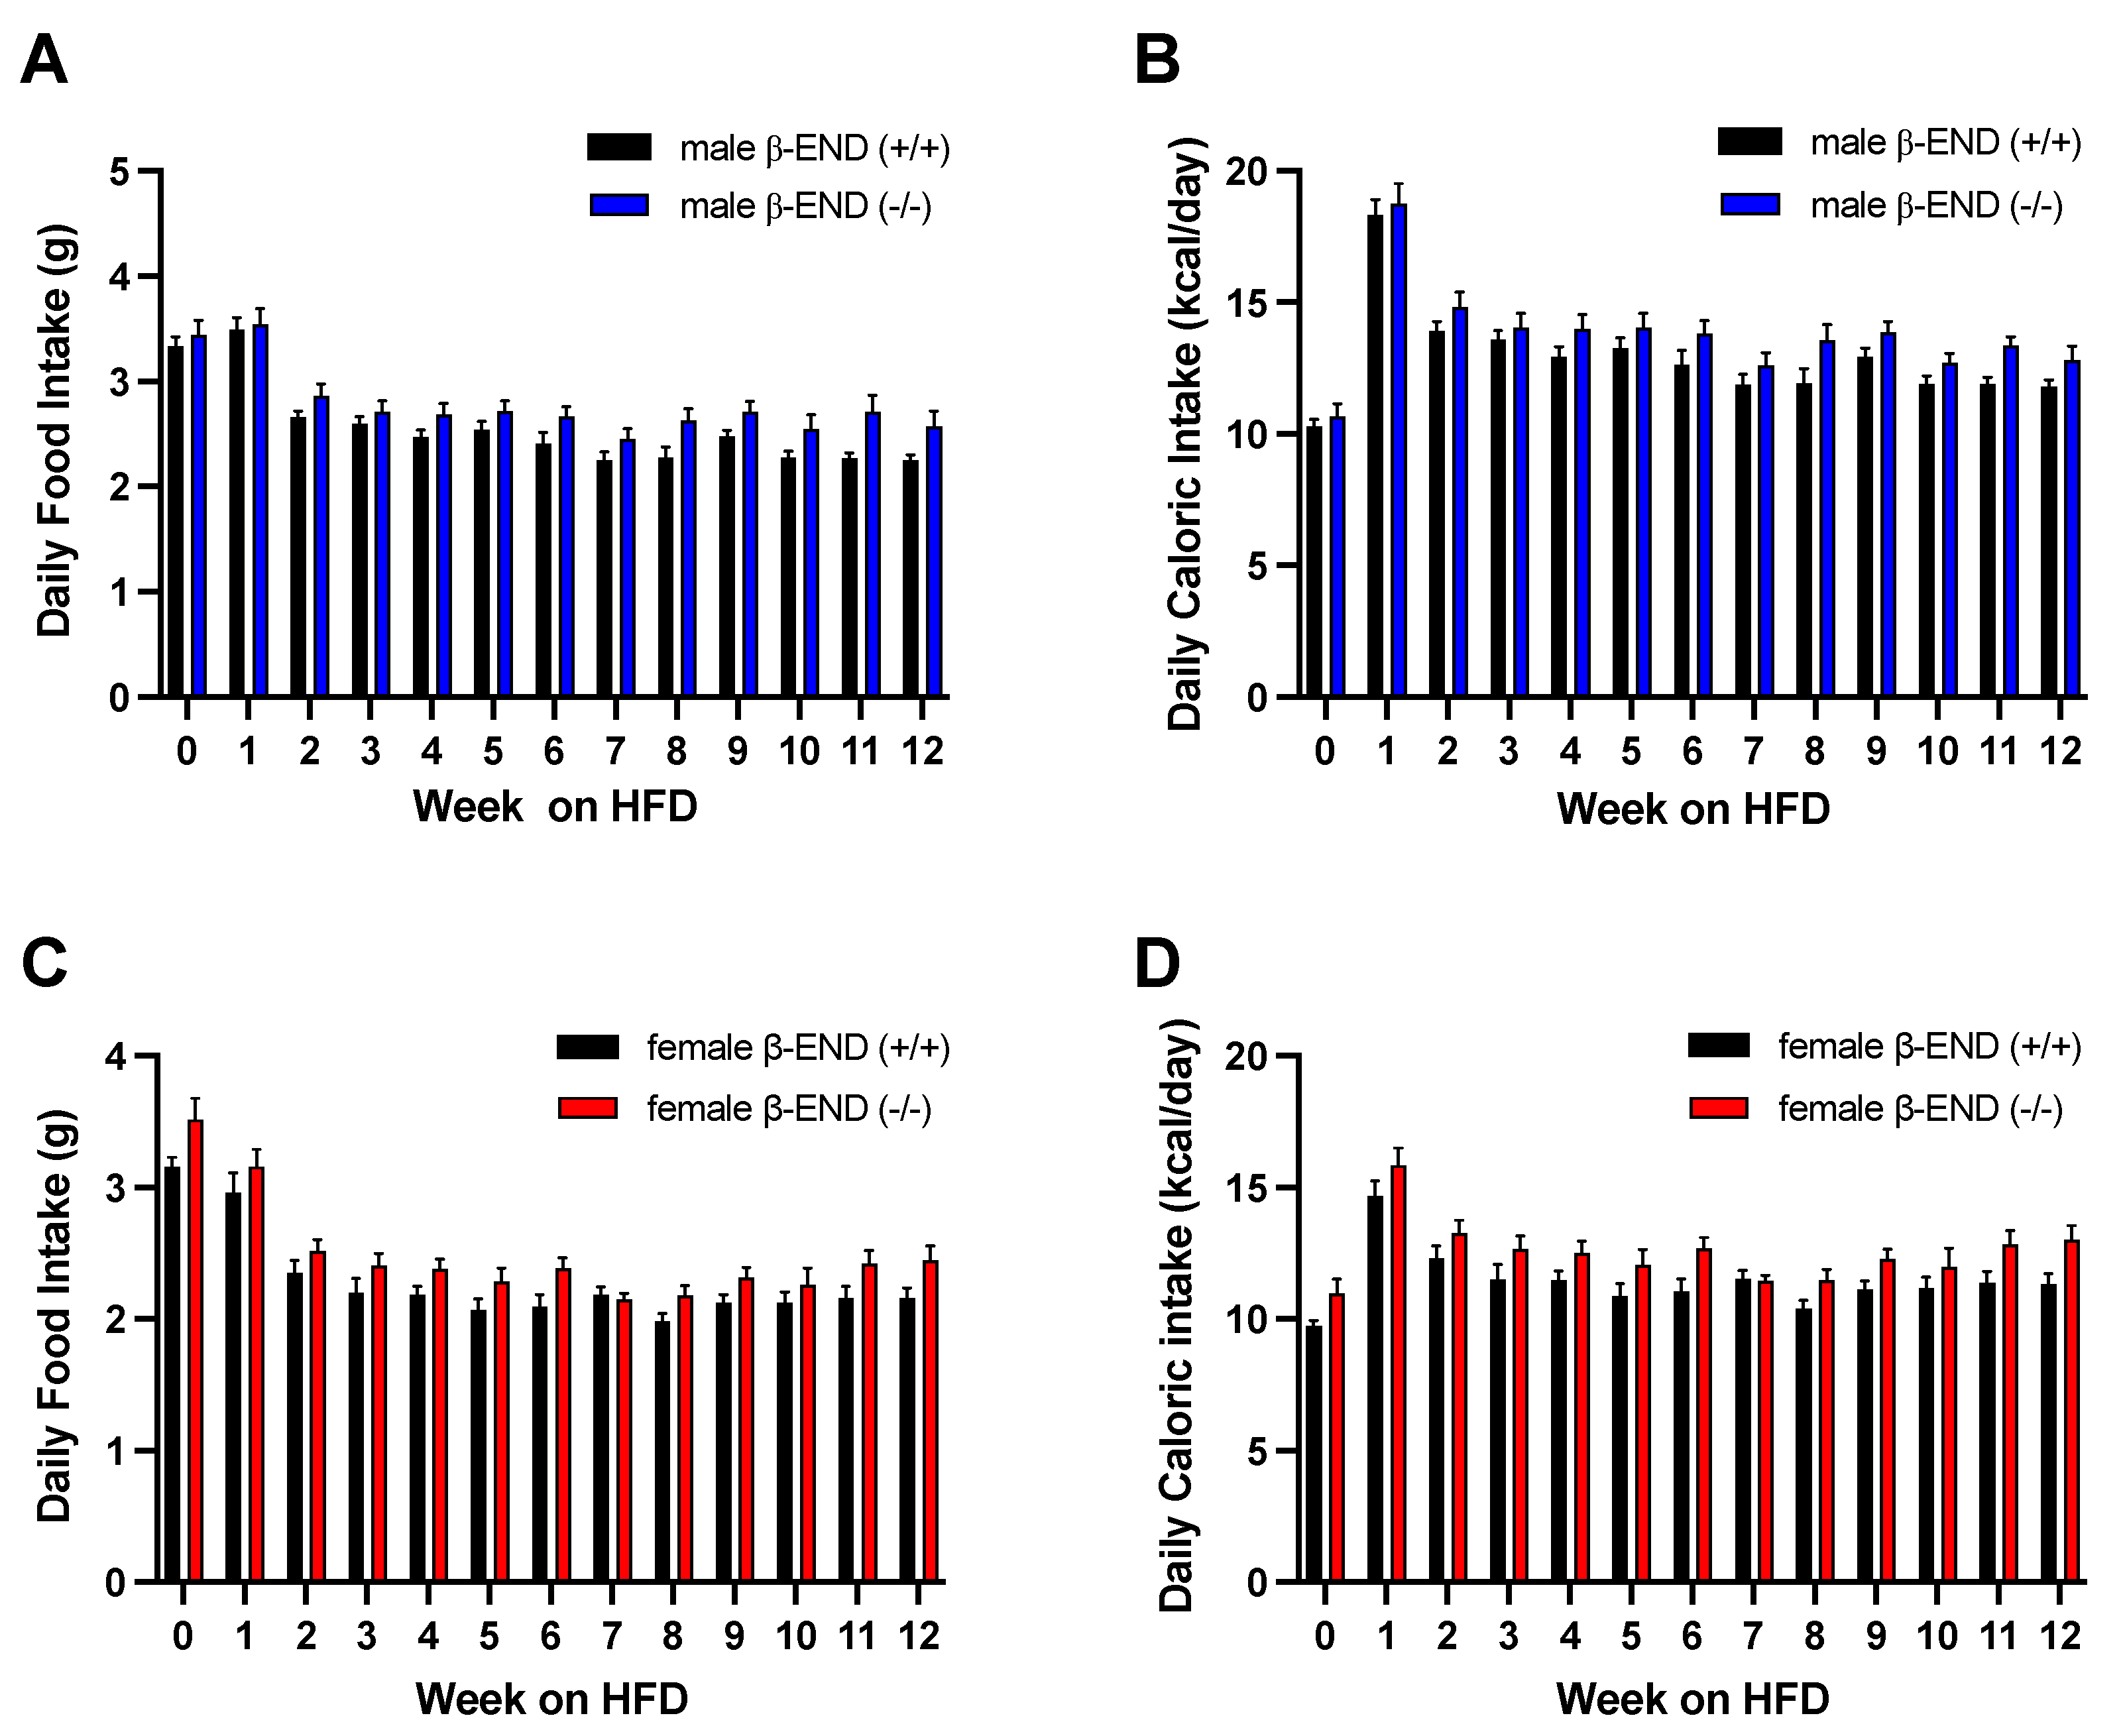
Figure 4.
Comparison of daily caloric intake per body weight of male and female β-END wildtype and knockout mice. Female mice consumed more calories regardless of genotype when compared to male mice fed an HFD. All data are represented as means ± SEM and were analyzed using a three-way ANOVA followed by Fisher’s LSD as post hoc test (*P < 0.05; **P <0.01; ***P < 0.001; ****P < 0.0001 vs. male mice of each genotype).

Figure 5.
Oral Glucose Tolerance Test (OGTT) and area under the curves (AUCs) in male and female mice lacking β-END and their wildtype controls after six weeks on HFD. Mice were tested for baseline plasma blood glucose (0 min). A 20% oral glucose solution (2g/kg) was given to the mice after a 10 h overnight fast and blood glucose levels of male (A, B) and female (C, D were measured at 30, 60, 90, and 120 mins. A robust trend toward a significant difference in blood glucose levels was observed between the male (P = 0.0524) and female mice (P = 0.0591) between mice of the two genotypes. All data are represented as mean ± SEM.
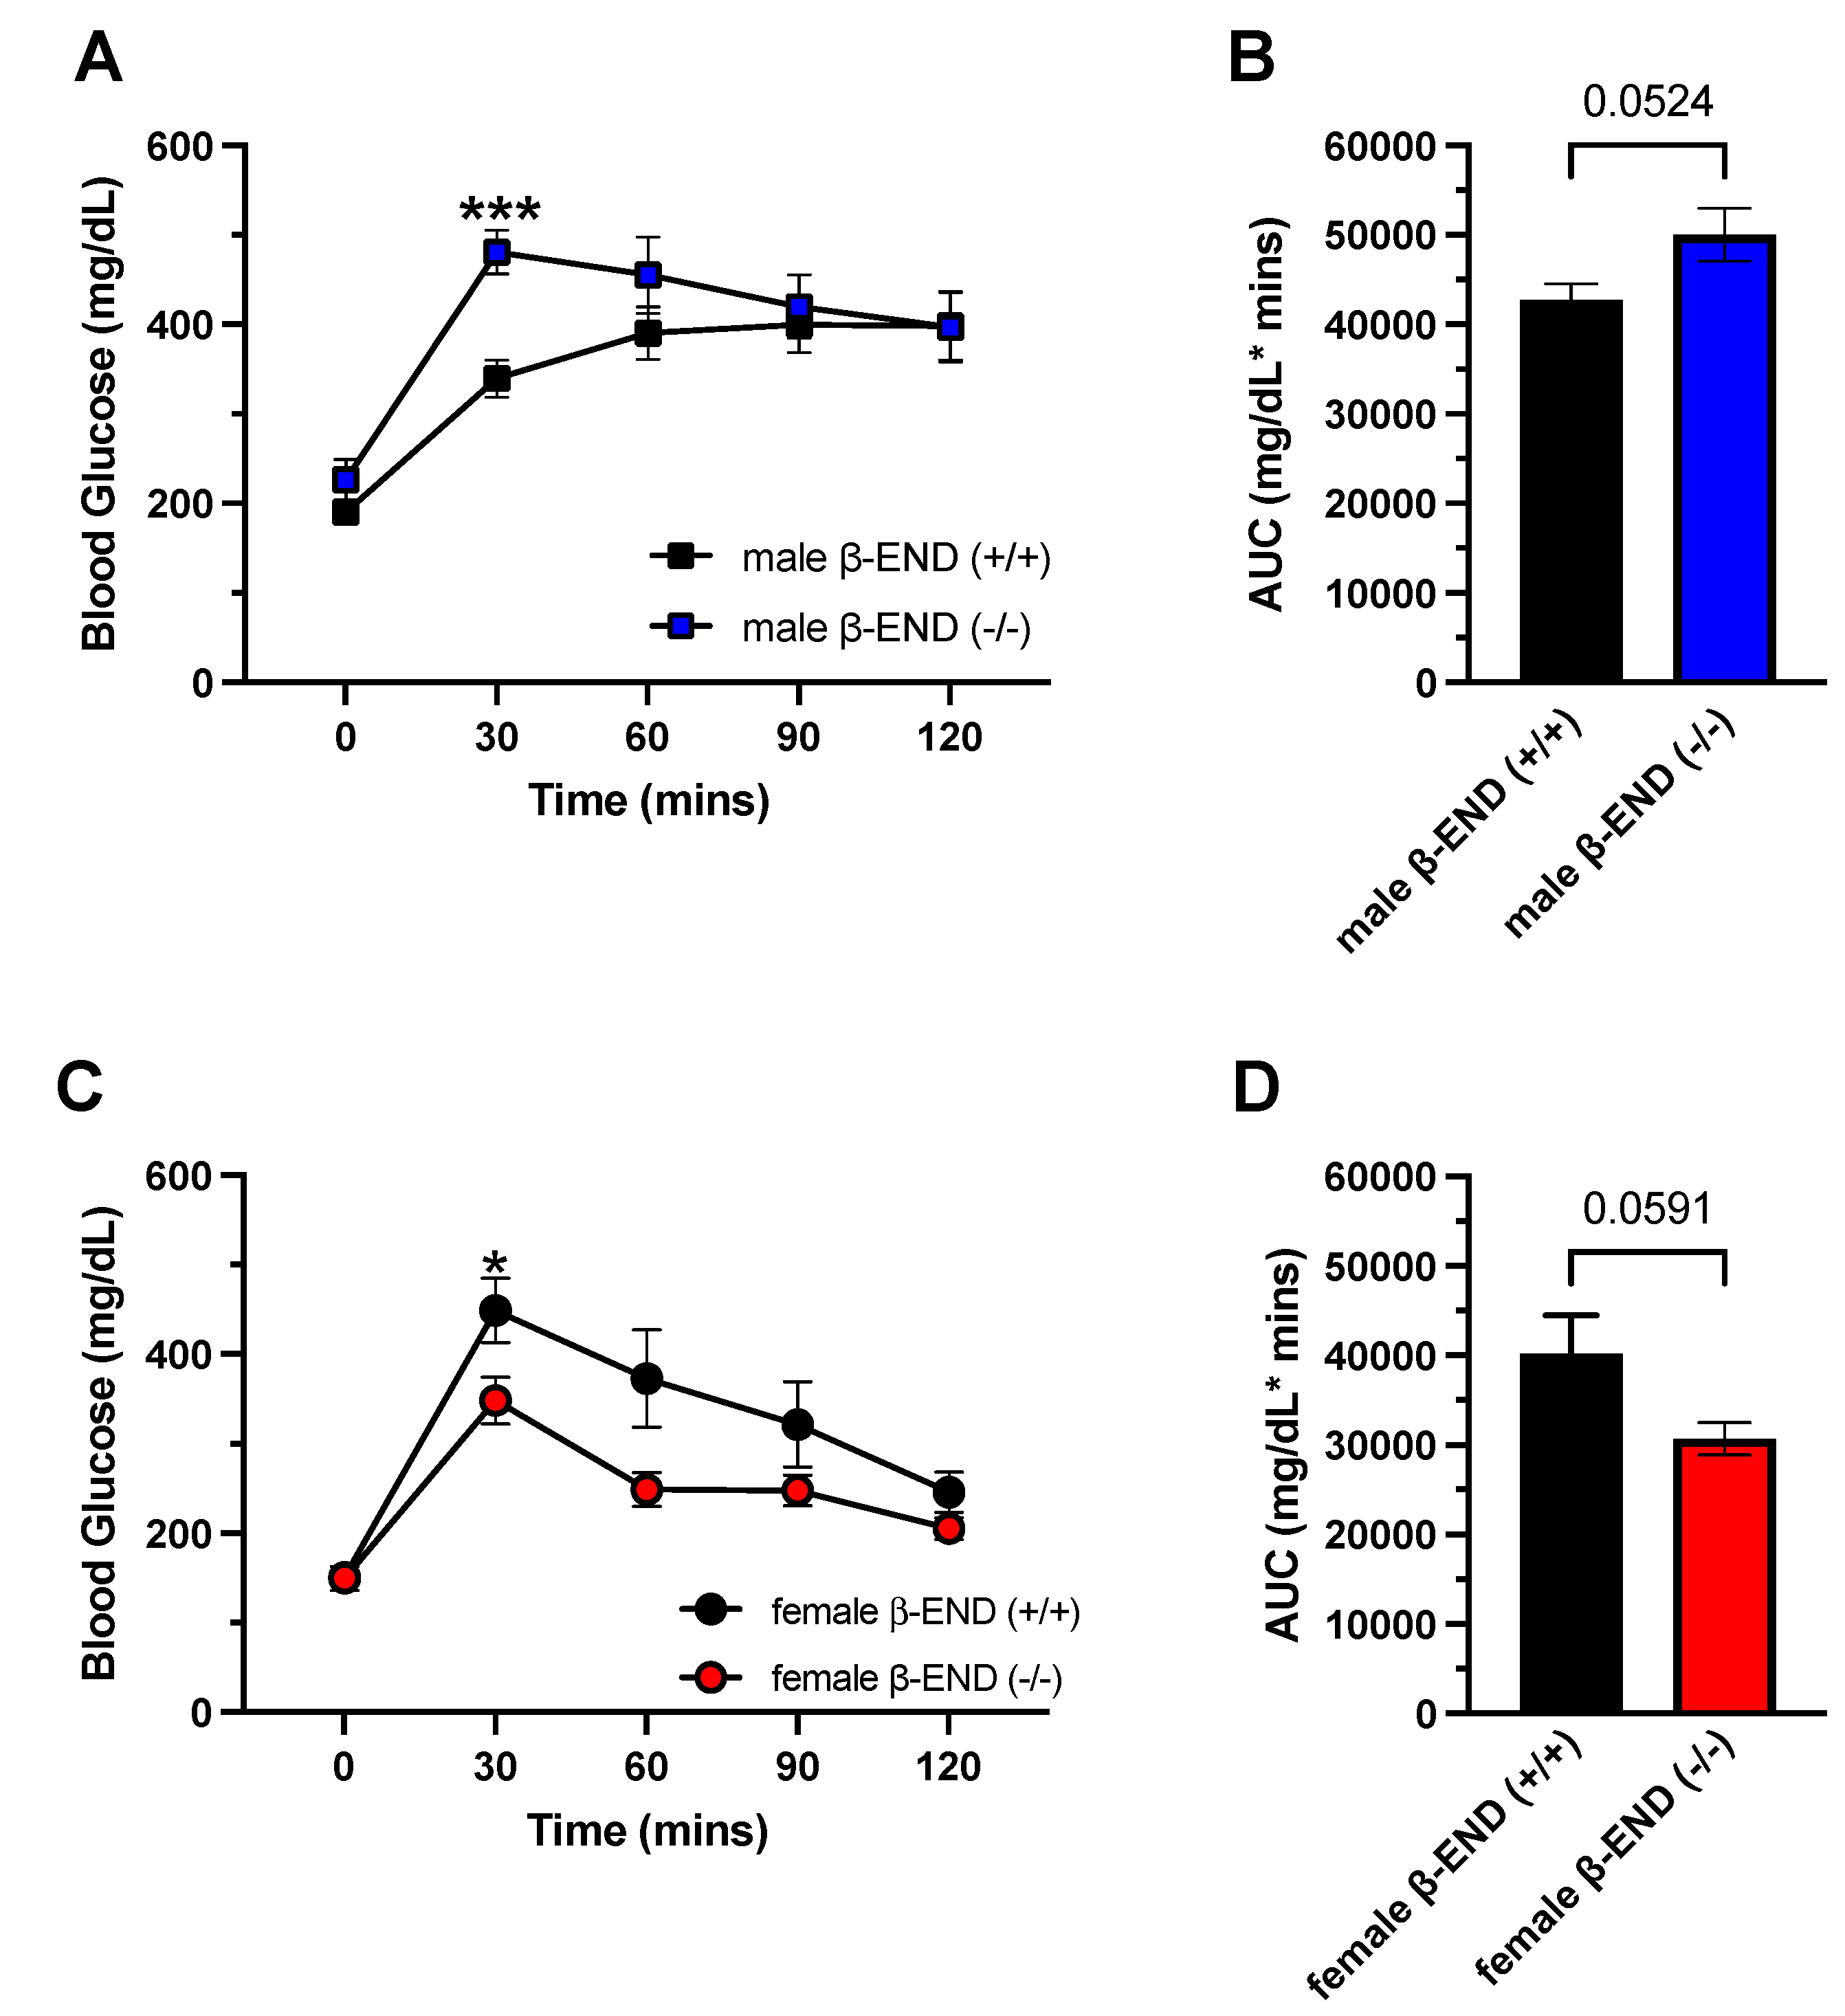
Figure 6.
Oral glucose tolerance test and AUC results in male and female mice lacking β-END and their wildtype controls. (A) Blood glucose levels were measured before (0 min) and at 30, 60, 90, and 120 mins after administration of 20% oral glucose solution (2 g/kg) following a 10-h overnight fasting period. (B) Area under the curves were determined using GraphPad Prism. A trend toward a statistical significance difference was found between mice of the two genotypes. All data are represented as mean ± SEM.
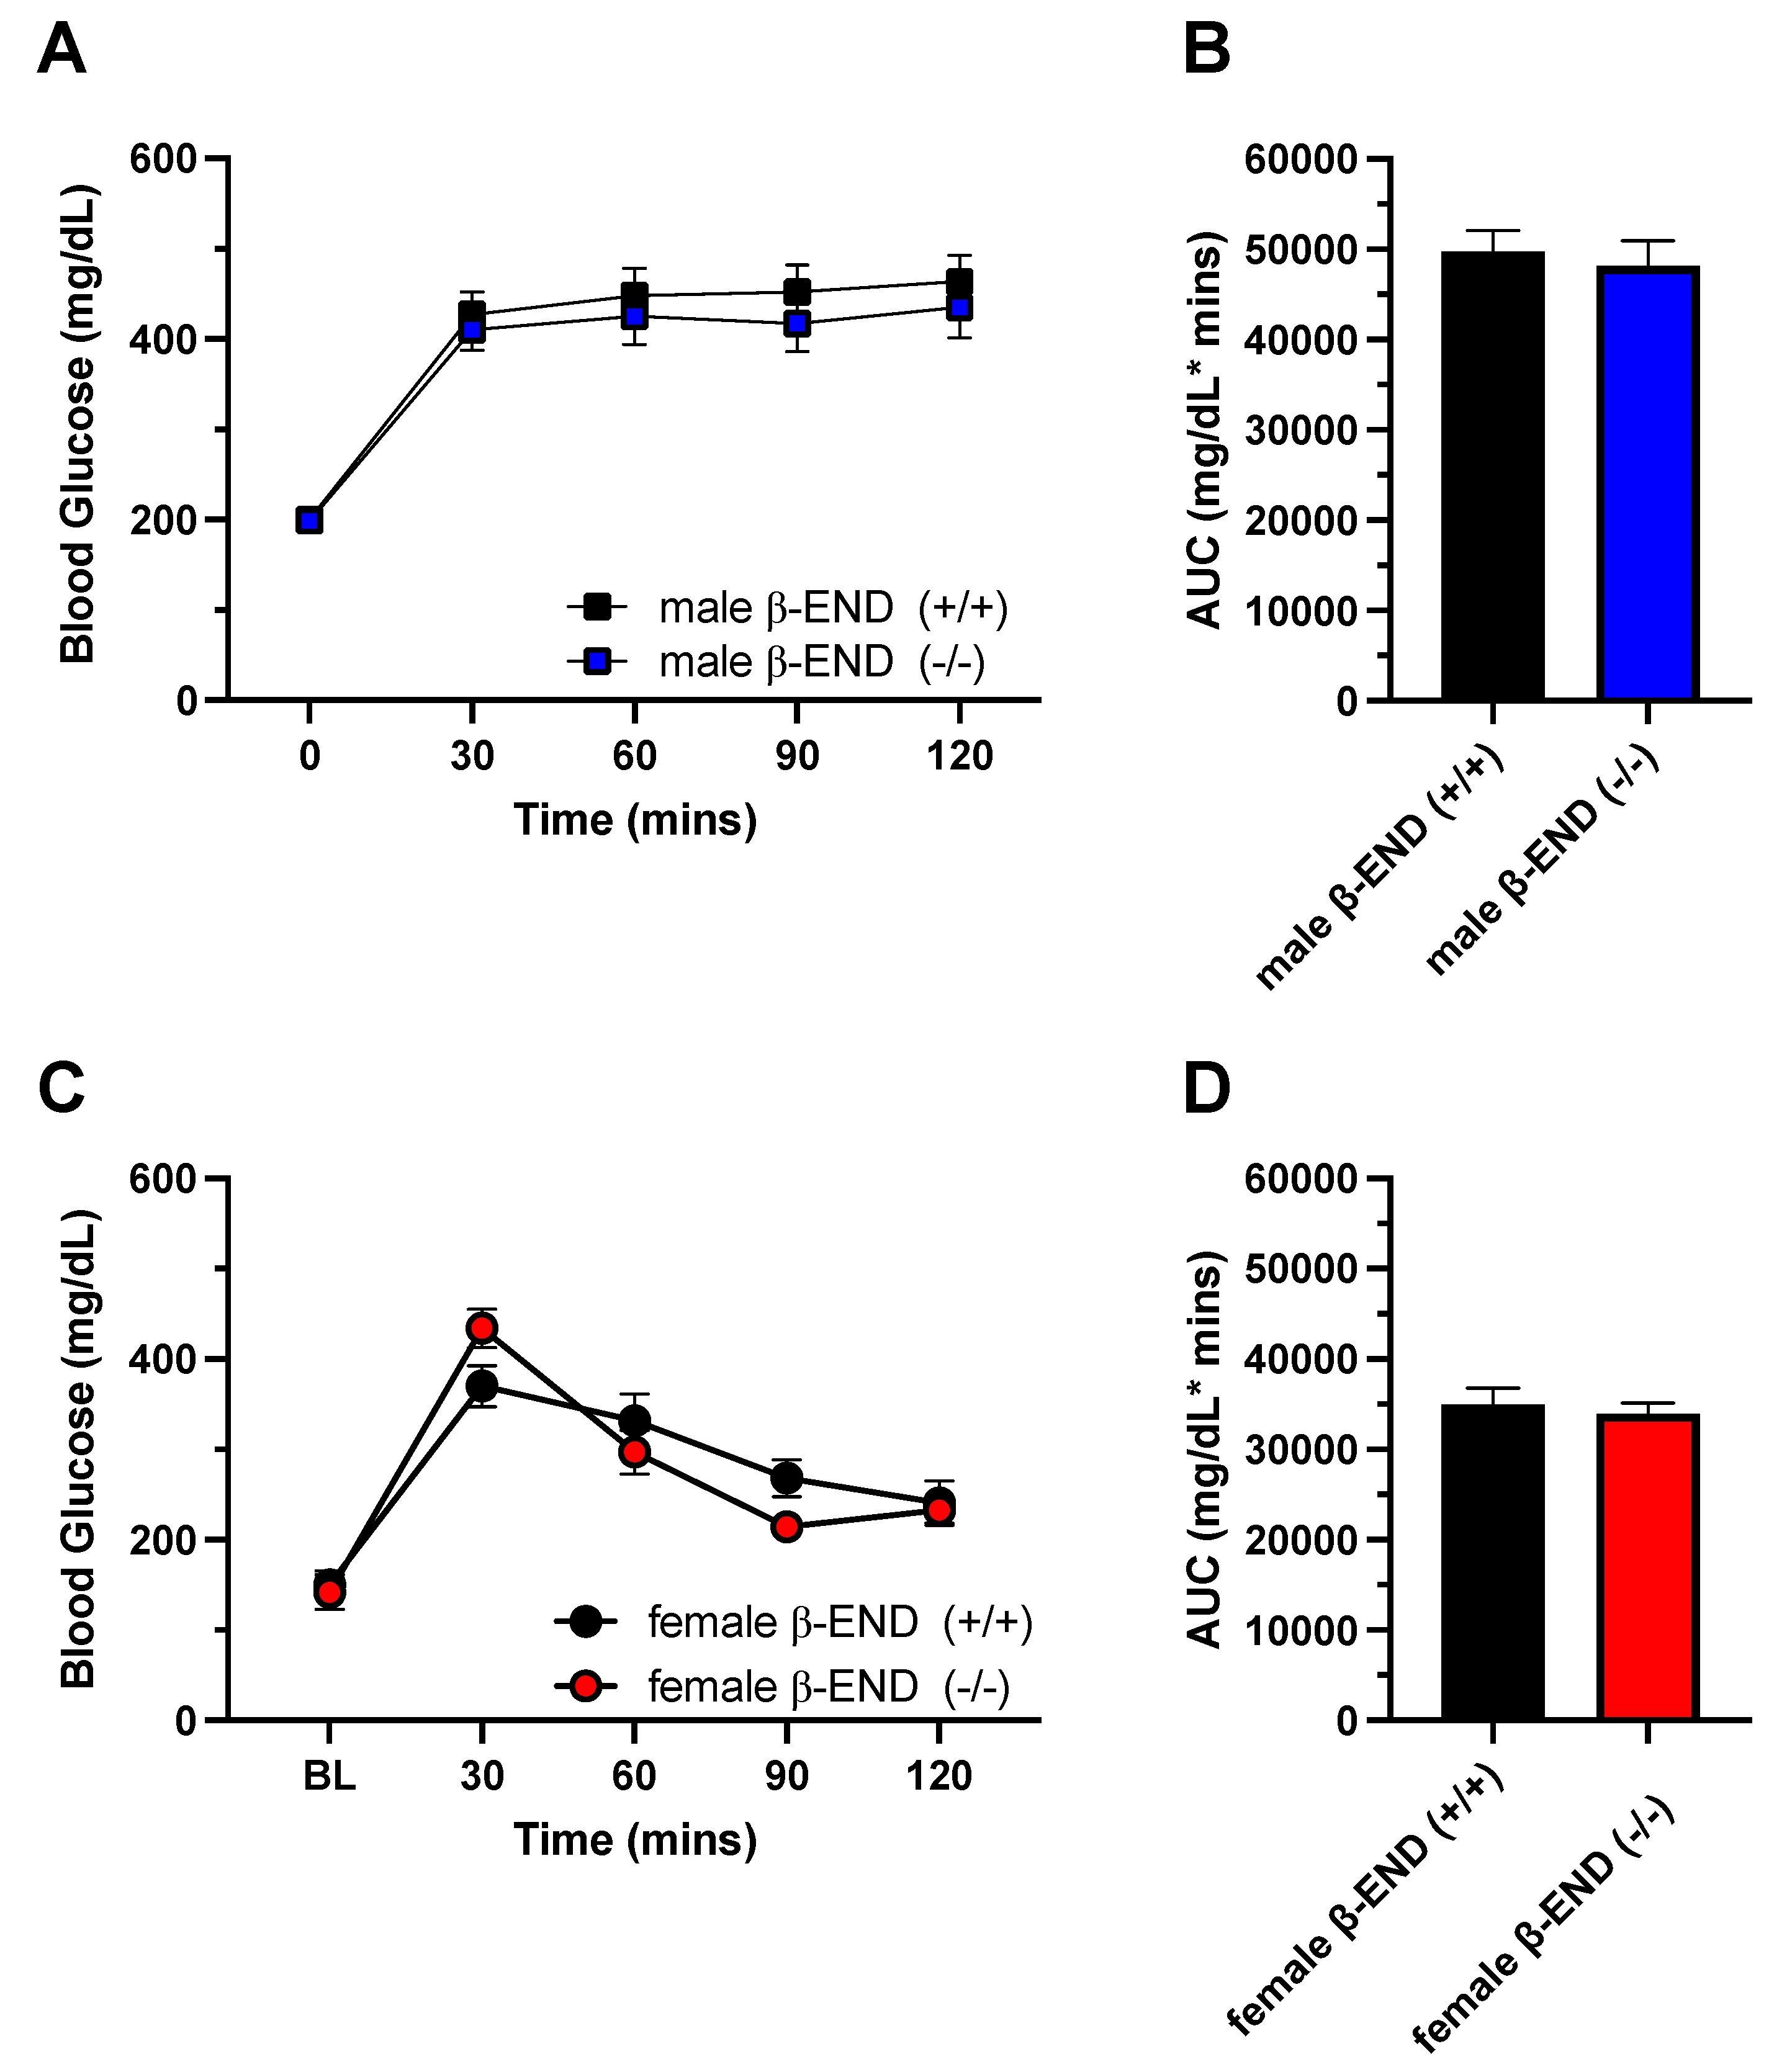
Figure 7.
Comparison of glucose AUCs at weeks 6 and 12 in male and female β-END mice fed an HFD. All data represent mean ± SEM. No significant differences were found between weeks 6 and weeks 12 using mixed-effects analysis (P > 0.05) between wildtype or knockout of each sex. * P < 0.05 indicate a significant difference between female wildtype and knockout mice. $$$$ P < 0.0001 indicate a significant difference between male and female knockout mice at weeks 6 and 12; ## P < 0.01 indicate a significant difference between male and female wildtype mice at week 12.
Disclaimer/Publisher’s Note: The statements, opinions and data contained in all publications are solely those of the individual author(s) and contributor(s) and not of MDPI and/or the editor(s). MDPI and/or the editor(s) disclaim responsibility for any injury to people or property resulting from any ideas, methods, instructions or products referred to in the content. |
© 2024 by the authors. Licensee MDPI, Basel, Switzerland. This article is an open access article distributed under the terms and conditions of the Creative Commons Attribution (CC BY) license (http://creativecommons.org/licenses/by/4.0/).
Copyright: This open access article is published under a Creative Commons CC BY 4.0 license, which permit the free download, distribution, and reuse, provided that the author and preprint are cited in any reuse.


