
Submitted:
05 April 2024
Posted:
08 April 2024
You are already at the latest version
Abstract
Transition from basic to higher education is regarded as a ‘juggle of many balls’ because students ought to balance between theoretical and clinical requirements, including social life. As a result, a significant number of undergraduate first-year nursing students succumb to these challenges due to lack of coping mechanisms emanating from poor resilience. As a result, the aim of this study was to determine the factors that influence resilience among undergraduate first-year nursing students at a South African university. A quantitative cross-sectional descriptive research design was followed. Data was collected using an adapted self-administered online questionnaire. Principal component analysis extraction method and Varimax rotation were used to analyse data. A total of 123 participants completed the questionnaire. The eigenvalues showed that the first factor explained 23.9% of the variance, the second factor 11.2%, a third factor 7.5% while the fourth factor explained 5.9% of the variance. The fifth until the eight factor had eigenvalues greater than 1 but less than 2. This study showed that resilience can be dependent on various factors such as lecture support, parental support, academic achievement, peer and mentor support, optimism about the future and being self-determined.
Keywords:
first year nursing students
; nursing
; nursing students
; resilience
; undergraduate
; undergraduate nursing students
1. Introduction
Beginning studies at a university is a dream for many students. However, transitioning period from basic to higher education can be a hustle due to the obvious variance between these two levels of education [1]. For undergraduate first-year nursing students in particular, this period is regarded as a ‘juggle of many balls’ because students ought to balance between theoretical and clinical requirements, including maintaining social life to mention a few [1,2,3]. As a result, a significant number of undergraduate first-year nursing students succumb to these challenges by means of dropping out of the academic program, abusing drugs and so forth, due to poor coping mechanisms. A study conducted by Park and Hong [4] suggests that the demanding expectations of undergraduate first-year nursing students often lead to lack of academic confidence which has an indirect influence on the adjustment and resilience among these students. Thus, it is important to understand factors influencing resilience among undergraduate first year nursing students [1].
The concept resilience is a derivative from a Latin word resilia which means the action of rebounding [5]. Within the empirical referents of many spheres of livelihood, the concept of resilience is better understood as the ability to bounce back when faced with an adversity of any sort [2]. In nursing education, this can be equated to the ability to navigate through all factors which negatively influence resilience amid the course of the training until completion of the nursing program. However, there is an ongoing debate on whether resilience within undergraduate first-year nursing students is a psychological trait, an ability of some sort, or a process acquired through time [6]. However, whether it’s a psychological trait or an act of maturity, its importance among undergraduate first year nursing students cannot be over-emphasised.
According to Aryuwat et al. [6] as well as Pryjmachuk et al. [7], resilience is determined by several factors of demographic background of nursing students. Several factors of a student’s background can either amplify or condense their resilience at the university. In addition to demographic background, literature has shown that factors such as voice behaviour, social support, creativity, immersion in senior students and creative problem-solving skills has a positive influence on the adjustment to the university for first year nursing students [4,8]. The similar findings were echoed by Haktanir et al. [1] wherein their study highlighted a positive correlation between resilience and attributes such as nursing students’ high self-confidence, high self-compassion, high self-efficacy and being positive. In a study conducted in an urban university in South Africa, undergraduate first year nursing highlighted spirituality, exercise, and positive framing as buffers to their poor resilience [9]. However, the gap identified in the available literature is that an overwhelming majority of these studies were conducted either during, or pre-COVID-19 which doesn’t necessarily incorporate post-COVID-19 era.
While an acknowledgement is made to the universities’ attempt to smoothen the transitioning process through orientation programs which provides an overall framework for success at the university [7,8], there is still a gap regarding the contextuality of these programs to nursing students. Furthermore, there is also lack of attendance of university programs aimed at smoothening the transitioning period such as orientation [8]. As a result, the students who do not attend these kinds of programs often feel left out and isolated at the commencement of their university life [8]. Thus, leading to academic stress [3]. According to Haktanir et al. [1], the factors that negatively influence resilience among undergraduate first-year nursing students often manifest in a form of academic dropouts, academic and social issues, and mental health problems. Hence the need for this current study which is a part of a doctoral study which seeks to develop and validate a context-specific conceptual framework to improve resilience among undergraduate first year nursing students. To the knowledge of the researchers, there is no conceptual framework for resilience that is content specific to the undergraduate first-year nursing students despite their difficult transitioning process to the university. Thus, further reinforcing the need of the current study. Therefore, the aim of this study was to determine factors that influence resilience among undergraduate first year nursing students at a South African university.
2. Materials and Methods
A cross-sectional descriptive research design was followed in this study. According to Brink et al. [10], a cross-sectional descriptive design is a type of research design wherein data is collected from the respondents in one specific point time on a phenomenon of interest to the researcher. A cross-sectional descriptive research design is widely used in health sciences research, like is the case with the current study. As a result, data was collected only once from the respondents regarding factors that influence resilience among undergraduate first year nursing students at the selected South African university.
Population and Sampling
The target population were bona-fide undergraduate first-year nursing students (N=156) at a tri-campus South African university, comprising of 80 and 76 undergraduate nursing students from campus A and B respectively. Campus C was not accredited to offer undergraduate nursing programme at the time of conducting this study. Stratified convenient sampling technique was used to segment and mutually group first-year undergraduate nursing students according to the campuses where they come from. This was done to achieve homogeneity of the groups in their heterogenic state due to their campuses of origin [11,12], even though they fall within one school in one university. In each segmentation called strata, a sample was then selected by means of convenient sampling technique. To obtain the sample size, a Raosoft sample size calculator was used to compute the sample size for the two campuses (n=112). However, given the fact that the two campuses did not admit same number of undergraduate first-year nursing students at the time of conducting this study, a proportional allocation of the sample size was then applied to ensure a fair and just representativeness of the population [12]. Therefore, the sample size at each campus is computed as follows:
Although the sample size given in Table 1 represented the least sample size needed per campus to attain sample power in this study, greater number of respondents were also welcomed (see Demographic section on results).

Table 1.
Sample sizes from the two campuses where study was conducted.
| Description | Campus A | Campus B |
|---|---|---|
| Population in numbers | 80 undergraduate 1st years | 76 undergraduate 1st years |
| Proportional allocation in % | (80÷156) *100 = 51% | (76÷156) *100 = 49% |
| Proportional Sample size | 80÷156 = 0.51282051 | 76÷156 = 0.48717949 |
| Sample size in numbers | 0.51282051*112 = 57 | 0.48717949*112 = 55 |
Data Collection
Data was collected using an online adapted self-administered questionnaire from Mampane in a study titled “Psychometric Properties of a Measure of Resilience Among Middle-Adolescents in a South African Setting [13]. The link (https://forms.gle/zgUi8u6Gn736TVHM9) to the data collection tool, created using Google forms on Google drive, was shared through an institutional online teaching-and-learning platform called eFundi. The data collection tool had four sections namely the informed consent, demographic data, adapted questionnaire, and declined to participate sections respectively. Of the most importance was the first section, informed consent, which determined access to section two and three of questionnaire. That is, respondents who clicked “no” on the question “do you grant consent to participate in this study” in the informed consent section, were redirected to the “declined to participate” section without filling in the questionnaire whereas those who granted consent were able to access section two and three and fill in the questionnaire. The type of data that was collected was information relating to the factors that influence resilience among undergraduate first-year nursing students at a selected university. No identifying information was collected in order to protect the anonymity and confidentiality of the respondents.
Data Analyses
Data analyses were done using SPSS version 28. Data were analysed with the aid of a qualified statistician at the institution of affiliation of the researcher. The statistician completed a standard institution confidentiality agreement form to ensure that confidentiality was maintained in this study. Kaiser-Meyer-Olkin Measure (KMO) of sampling adequacy and Bartlett’s Test of Sphericity were done to ascertain that the sample was suitable for exploratory factor analysis (see the results section). Following which, the exploratory factor analysis of the questionnaire items was conducted using the principal component analysis (PCA) extraction method and Varimax rotation. Varimax rotation was applied to achieve a simpler structure and enhance interpretability by maximizing the variance of squared loadings within each factor while minimizing cross-loadings. Tables, pie charts and bar graphs are used to present the results (see Results section).
Validity and Reliability of the Data Collection Tool
In this section, validity and reliability of the data collection tool are discussed respectively.
Validity of the data collection tool
According to Maree [12], validity of the data collection tool is concerned with the extent to which a data collection tool measures what is supposed to measure. Therefore, to ensure validity of the data collection tool in this study, both face validity and content validity were employed. As the two measures are explained by Maree [12], face validity refers to the extend at which the tool looks valid from the eyes of the experts, whereas content validity refers to an extent to which the data collection tool measures what is expected to measure following a thorough scrutiny by experts. To illustrate, the tool was subjected to a team of experts, including a statistician for scrutiny to ensure its face and content validity.
Reliability of the Data Collection Tool
Reliability of the data collection tool refers to an extend at which the instrument can yield same results if it was to be used either at different times or administered to different respondents from the same population [12]. Therefore, to ensure that the tool is repeatable and consistent, internal consistency of the tool was ensured by running an inter-item Cronbach’s alpha coefficient on SPSS-v28. To indicate internal consistency, the Cronbach’s alpha coefficient had to be above 0.6, with higher values closer to 1 indicating a higher reliability [11,12,14]. Therefore, the data collection tool proved to be reliable as it had a Cronbach’s alpha coefficient of 0.884. As a result, the data collection tool in this study was deemed reliable (see Figure 1).
The Cronbach’s alpha coefficient was run despite the original data collection tool having a reliability score of 0.82, because the data collection tool was adapted to the context of this study. Following the establishment of internal consistency, the researcher conducted a pilot study with 10 percent of the population. Since there were no amendments to the tool post pilot study, the results of the pilot study were also included for analysis.
Ethical Consideration
The study was approved by the institution of affiliation of the researcher’s Health Research Ethics Committee (HREC) and allocated a unique ethics number (NWU-00053-23-A1). Following the ethical approval, goodwill permission was sought from the Research Data Gatekeeper Committee (RDGC) of the same institution before interacting with respondents. Upon receipt of goodwill permission (NWU-GK-23-140), permission was sourced from the deputy directors at each campus as the custodians of the students. This is because, the school director who is the rightful mediator, was the co-promoter and could not provide approval. In addition, participation to the study was entirely voluntary and undergraduate first-year nursing students were recruited in a just and fair manner, by an independent research assistant, without any coercion. Respondents who showed interest, signed the consent form which was linked to the data collection tool by means of clicking on “Agree to participate” to indicate their consent to participate. Those who clicked on “Does not agree to participate” were redirected to the last aspect of the data collection tool which prompted them to either submit without responses or simply exit the browser. Undergraduate first-year nursing students were assured that there will be no consequence should they opt not to participate in the study.
3. Results
A total of 123 participants responded to the survey. Sixty-five (52.8%) of the respondents and 58(47.2%) were from the campus B and campus A respectively (see Figure 2).
Gender distribution
Figure 2 shows the distribution by gender. An overwhelming majority (88%) of the respondents were female while the remainder (12%) were male. This might be due the fact that nursing is a female dominated profession.
Age Distribution
As shown in Figure 3, the majority (89.4%) of the respondents were aged between 18 and 20 years. Ten (8.1%) and 3 (2.4%) respondents were in the 21 – 23 and 24 – 26 age groups respectively
KMO Measure and Bartlett’s Test
Results shown in Table 2, the KMO measure of sampling adequacy was 0.778, suggesting that the data was satisfactorily appropriate for factor analysis. In addition, a highly significant result (χ2 (406) = 1504.521, p < 0.001) from Bartlett’s test of sphericity supported the applicability of factor analysis on the dataset by showing that the correlation matrix was not an identity matrix.
The eigenvalues showed that the first factor explained 23.9% of the variance, the second factor 11.2% of the variance, a third factor 7.5% while the fourth factor explained 5.9% of the variance. The fifth until the eight factor had eigenvalues greater than 1 but less than 2. Overall, the eight extracted factors accounted for a cumulative variance of 65.5%. Table 3 below lists the factors and factor loadings as well as the item communalities.
Note: Factor loadings are in boldface. Extraction Method: Principal Component Analysis. Rotation Method: Varimax Rotation.
Communalities ranged from .458 to .810 (see Table 3). For easy of interpretation, factor loadings displayed in Table 3 are from the rotated pattern matrix. Eigenvalues of ≥1 were used to interpret the number of factors in the data set.
Factor 1 comprises of 8 items as shown in Table 4. A follow-up reliability analysis found factor 1 to have good internal consistency (α = .868). The frequency and percentage (in brackets) distribution of responses to eight item statements is shown in Table 4. Table 3 shows that just above 65% of the respondents agreed with the statement “My lecturers make me see that I am good at my work” most or all of the time. On the other hand, approximately 58% indicated that they did not have a lecturer they could talk to. Slightly over 75% of the respondents indicated that the lecturer explained concepts most or all of the time. Almost 90% of the respondents stated that the lecturer worked hard to make them to understand concepts. Furthermore, 78% of the respondents stated that the lecturer gave extra examples in class. Approximately 70% and 75% of the respondents indicated that lecturers supported them to aim high as well as think of their bright future respectively while almost 65% stated that they had at least one lecturer who encouraged them to do their best. There was association between the campus and whether respondent had a lecturer they could talk to (= 18.501, p < 0.001). There was also an association between campus and whether respondent had at least one lecturer who encourages them to do their best (= 11.343, p < 0.05).
Factor 2 consists of 6 items as shown in Table 5 above, which appeared to measure what does it mean to students to achieve in class. A follow-up reliability analysis found factor 2 to have acceptable internal consistency (α = .712).
Table 5 shows that most (97.6%) of the respondents were of the view that the future and success depended on their hard work. Approximately 96% believed they could do better while 94% stated that they did all assignments most or all the time. Just below 98% of the respondents indicated that doing well at school was important to them. With respect to being in control of what happened to them, 78% of the respondents indicated that they were in control most or all the time. Almost all (98.4%) of the respondents stated that their future was in their hands. There was association between “future and success depend on my hard work” and campus (= 7.998, p < 0.05), age group (= 25.052, p < 0.001) and gender (= 9.204, p < 0.05). There was also an association between the respondents’ belief to do better and campus (= 8.070, p < 0.05). The importance of doing well at school was associated with the campus (= 8.671, p < 0.05) and age group (= 16.808, p < 0.01). Whether a respondent was in control of what happens to them was associated with the campus (= 16.283, p < 0.001).
Factor 3 consists of 3 items as shown in Table 6 above, which appeared to measure the influence of support from peers or mentors in relation to students’ resilience. A follow-up reliability analysis found factor 3 to have acceptable internal consistency (α = .742).
For the statement, "I know someone at the university who cares about me," in Table 5, most respondents (44.7%) said it was true most of the time, with almost 27% believing it was true all of the time. Similarly, for the statement "I know someone at the university I can talk to," the majority (40.7%) said it was true most of the time, with approximately 28% saying it was true all of the time. These findings indicate that a sizeable proportion of respondents believe they have helpful ties that are approachable within the campus community. Furthermore, when it came to the statement, "I have good talents," a sizeable majority (52%) said it was true most of the time, with 30% believing it was true all of the time. There was an association between the respondents’ assertion to having good talents and age group (= 13.030, p < 0.05). This demonstrates that respondents are confident in their abilities or strengths, reflecting a favourable self-perception in the academic setting. Overall, the findings show that students in the university setting have a generally favourable attitude on interpersonal connections, support networks, and self-esteem.
Factor 4 comprises of 4 items as shown in Table 7 above, which appeared to measure students’ determination to achieve their goals. A follow-up reliability analysis found factor 4 to have acceptable internal consistency (α = .736).
The information in the Table 7 provides a convincing peek into people's attitudes and beliefs about resilience, problem-solving, and optimism. Notably, most responders indicated strong positive feelings about perseverance and optimism. For example, when it comes to believing in a brighter future, an overwhelming 75.6% said they feel things would eventually improve for them, with another 22.8% saying they thought this most of the time. This largely positive view shows that the individuals had a resilient mindset. There was an association between the respondents’ belief in a brighter future one day and campus (= 8.654, p < 0.05). Similarly, when it comes to problem-solving tactics, 61.8% reported adopting a variety of methods to solve difficult problems most of the time, emphasizing adaptation and flexibility in handling challenges. Furthermore, nearly half of the respondents (48.8%) stated that they do not allow people to obstruct their efforts, while 44.7% stated that they do so most of the time. There was also an association between the respondents’ assertion that they do not allow people to stop them from trying to do their best and gender (= 7.948, p < 0.05). In terms of perseverance, an encouraging 49.6% said they never give up, with a further 42.3% saying they persevere most of the time. Overall, these findings indicate a prevalent attitude of resilience, determination, and a constructive view among those surveyed, emphasizing their tendency to persevere in the face of adversity while maintaining an optimistic outlook on their future possibilities.
Factor 5 comprises of 3 items as shown in Table 8 above, which appeared to measure the support students receives from an adult Figure. A follow-up reliability analysis found factor 5 to have acceptable internal consistency (α = .778).
Table 8 shows that 83% of respondents had an adult to talk to most of the time or all of the time, compared to 17% who said they did not have an adult to talk to. Having an adult to talk to, had no association to campus, gender, nor age group. Furthermore, the majority (86%) of respondents answered that they have an adult who listens most or all of the time. In comparison, 3% and about 11% did not have such an adult all of the time or most of the time, respectively. There was no association found between having an adult who listens and being on a certain campus, age group nor gender. In terms of feeling safe and loved at home, nearly 95% of respondents said they felt so most or all of the time. Less than 1% and 4%, respectively, did not feel safe or loved at home all or most of the time. Gender was associated with feelings of safety and being loved at home (= 8.973, p < 0.05).
Factor 6 consists of 3 items as shown in Table 9 above, which appeared to measure students’ level of self-determination to achieve and inspiration from others. A follow-up reliability analysis found factor 6 to have poor internal consistency (α = .596).
Table 9 shows that a considerable proportion of participants showed a favourable inclination for emulation and inspiration, with 46.3% stating that they know a good person whose behaviour serves as an example to them, and a further 38.2% stating that they do so most of the time. Furthermore, when it comes to class attendance and dedication, a substantial majority (54.5%) expressed a strong preference for not being absent from class, with 38.2% indicating this preference most of the time. This reflects a general sense of dedication and importance placed on regular attendance among respondents. Furthermore, the data reveals a strong feeling of determination and persistence, with 47.2% of people saying they never give up trying, and another 42.3% saying they do so most of the time. Overall, the data indicate a favourable trend toward role model recognition, attendance commitment, and a resilient attitude among those surveyed, indicating a proactive and motivated approach to personal improvement and goal attainment.
Two questions items, namely right answer to a question and the believe whether students regard themselves as tough persons, were not grouped with any other following factor loadings. However, their response distribution is described next.
Right Answer to a Problem
Figure 4 shows that the majority of participants (55%) stated that they frequently had the right answer to a problem, with an additional 40% stating this is always the case. Surprisingly, none of the respondents chose the option claiming that they never have the correct answer to a problem. This data reveals that the majority of those surveyed are confident in their problem-solving ability, with many of them frequently believing they have the right answers. The lack of replies in the "Untrue all the time" category suggests that the surveyed group has a high tendency toward confidence or assurance in their problem-solving abilities. This tendency toward self-assurance in offering right solutions reflects a sense of competence and conviction in the respondents' intellectual capacity.
I am a Tough Person
Figure 5 shows that a significant proportion of respondents (44.7%) affirmed that they are tough all of the time, with another 33.3% believing they are tough most of the time. In contrast, 17.1% of respondents stated that they are not tough most of the time, while 4.9% claimed they are never tough. This data reveals that the majority of those surveyed believe they have a resilient and durable temperament, either consistently or in most situations. The notable low proportions in the "Untrue all the time" category indicates a predominance of toughness self-identification among the respondents. Within the participants' self-assessment, this tendency toward toughness implies a widespread belief in their ability to endure challenges, cope with adversity, and persevere through challenging situations.
4. Discussion
The purpose of this study was to determine the factors that influence resilience among undergraduate first-year nursing students. Question items were grouped together through data analysis to bring about six factors were highlighted as influencing resilience among the undergraduate first-year nursing students. The identified factors were lecture support, parental support, academic achievement, peer and mentor support, optimism about the future, and a feeling of determination. These factors are discussed further in this section.
Communality factor loading 1 was termed lecture support which was measured using eight data sets. The respondents were in general agreement with the item statements that described lecture support. Thus, implying that, lecture support can be considered as a factor that positively influence resilience among undergraduate first-year nursing students. This is because, transition to university for undergraduate first-year nursing students is demanding and stressful in nature. Therefore, a considerate amount of support from lectures goes a long way in ensuring that students acclimatise well to the university. The result of this study concurs with a study conducted by Warshawski [15] which cites that support from lectures through individualised or intimate group sessions can improve students’ resilience. The same authors add that, in instances wherein lecture support is lacking, students usually lack motivation and end up demoralised. Furthermore, a study conducted by Lekan et al. [2] cited that one role of a nurse educator is to assist students to become more resilient. Thus, further affirming the pivotal role played by lecture support in influencing resilience among undergraduate first-year nursing students.
Question items in communality factor loading 2 were grouped together to bring about second factor that influence resilience among undergraduate first year nursing students. According to the results of this study, academic achievement was seen as one of the motivating factors that can improve resilience among undergraduate first-year nursing students. The results of this study proved that, with academic success, comes motivation and thus resilience. This is evidenced by majority of students who agreed with question items that described the academic achievement factor. Similarly, a study conducted by Lekan et al. [2] reported a directly proportional relationship between resilience and academic success. Unlike the results of the current study, Lekan et al. [2] associated being more resilient to the likelihood of academic success. Furthermore, a study conducted by Warshawski [15] also cited that resilience have been found to significantly influence academic success. Therefore, whether resilience influence academic success or vice versa, it doesn’t negate the fact that academic success is also a factor that can motivate students and ultimately improve their resilience.
Three question items (factor loading 3) were grouped to describe the fourth factor which is the value of support received from peers and mentors. The results showed that, undergraduate first-year nursing students value peer and mentor support as it plays a critical role in improving their resilience. The results are consistent with a study conducted by Lanz [16] which reported undergraduate nursing students proposed less lecture times and increased group interaction as a strategy to improve their resilience. Furthermore, a study conducted by Warshawski [15] during the COVID-19 pandemic elucidated that undergraduate nursing students found it hard to cope with transition to university. Thus, further ascertaining that peer and mentor support, as part of social support is critical to ensure resilience among undergraduate first year nursing students as purported in this study. In addition, Warshawski [15] further alluded that, the undergraduate nursing students in their study explained the need for an academic adviser to improve their studies. Similar to the results in the current study, majority (68.3%) and (71.5%) of the responded agreed with the statements, “I know someone to talk to at the university” and “I know someone who care about me at the university” respectively. As Taarega et al. [17] and Hughes et al. [18] explain, having someone near an undergraduate first year nursing student to support and advice when needed is vital to improve their resilience especially when faced with academic challenges
Second from last, two sets of question items were grouped to bring about two factors namely optimism about the future and a feeling of self-determination. The two factors are discussed together because they are closely related. The results showed that respondents agreed with question items describing these two factors respectively. Thus, implying that with optimism and self-determination, resilience is somewhat guaranteed. Similar results were echoed in a study conducted by Porter [19]. According to the same author, optimism empowers students with problem solving skills which allows them to defeat potential adversities. In addition, Smith and Gregg [20] attributes optimism as a critical factor in the process of growing. In this study, optimism about the future was seen to be a factor influencing resilience among undergraduate first year nursing students. The results further showed that resilience among undergraduate first-year nursing students can be improved if the students have an increased feeling of self-determination. Previous studies have reported similar results [18]. According to Hughes et al. [18], one of the key aspects that smoothen transition to the university for undergraduate first-year nursing students is facing the demands of postsecondary schooling. This can only be possible when students start to portray a feeling of self-determination.
Question items in communality factor loading 5 were combined to assess the support students gets from parents or parental figure and how that influences their resilience. The results shows that parental support plays a crucial role in influencing the resilience of undergraduate first year nursing students at the university. However, contrary to what parental support is known to be, parental support referred to in this study does not necessarily have to be physical nurturing, being dependent on, or residing within the same household with parents. Parental support was measured through having an adult to talk to or someone who cares about a student as depicted in question items in table 7. This is because, the entire period of being at the university can be attributed to transition to independence [21]. The results of this study are supported by Lee and Fletcher [22] who reported that parental support is vital and beneficial for adjustment of undergraduate first-year nursing students in institutions of higher learning. Similarly, McCulloh [23] reported that parental support is perceived by undergraduate first year nursing students as an effective method to foster students’ retention at the university. The same authors cite that parental support for undergraduate first-year nursing students can be associated with memorable and encouraging messages received from parents.
Limitations
The study used a cross-sectional descriptive design to collect data. A longitudinal study would have been more comprehensive as it would show the improvements in resilience among undergraduate nursing students tracing it from first year to higher levels. In addition, few participants were limited to participate due to technical challenges with the online link since the entire method of data collection was online. Therefore, for future studies, the researcher might consider longitudinal study in a postdoctoral level.
Recommendations
The authors recommend further research on the similar phenomenon using other designs such as intervention studies, appreciative inquiry, and/or longitudinal studies. In addition, the authors recommends that nursing education institutions consider the factors presented in this study during orientation of undergraduate first-year nursing students.
5. Conclusions
Resilience is a vital trait needed to ensure academic success of the undergraduate first-year nursing students. Thus, ensuring retention to the programme and ultimately course completion. This study showed that resilience can be dependent on factors such as lecture support, parental support, academic achievement, peer and mentor support, optimism about the future and being self-determined.
Author Contributions
Conceptualization, Gopolang Gause, Leepile Sehularo and Molekodi Matsipane; Methodology, Gopolang Gause, Leepile Sehularo and Molekodi Matsipane; Supervision, Leepile Sehularo and Molekodi Matsipane; Writing – original draft, Gopolang Gause
Funding
This research was funded by Health and Welfare Sector Education and Training Authority, and North-West University post graduate bursary. The APC was funded by the University Capacity Development Grand.
Institutional Review Board Statement
The study was conducted in accordance with the Declaration of Helsinki and approved by the North-West University Health Research Ethics committee (Ref number: NWU-00053-23-A1). The study also received an approval from the institutional research data gatekeeper committee (NWU-GK-23-140) since participants were undergraduate students affiliated in the university.
Informed Consent Statement
Electronic Informed consent was obtained voluntarily from all respondents involved in the study. In addition, the electronic informed consent included a clause that required permission to publish this study. Of which my granting informed consent, respondents agreed that this study can be published.
Data Availability Statement
Data that was used to support the reported results can be obtained from the corresponding author of this study upon a reasonable request.
Acknowledgments
The authors acknowledge the respondents in this study who took their time to fill in the questionnaire. The authors further acknowledge the statistician who greatly assisted with data analysis. Lastly, the authors acknowledge Mr. I.O Mokgaola and Prof N.V Sepeng for peer review of this study before submission to the journal.
Conflicts of Interest
The authors declare no conflicts of interest.
References
- Haktanir, A.; Watson, J.C.; Ermis-Demirtas, H.; Karaman, M.A.; Freeman, P.D.; Kumaran, A.; Streeter, A. Resilience, academic self-concept, and college adjustment among first-year students. Journal of College Student Retention: Research, Theory & Practice 2021, 23, 161–178. [Google Scholar] [CrossRef]
- Lekan, D.A.; Ward, T.D.; Elliott, A.A. Resilience in baccalaureate nursing students: An exploration. Journal of psychosocial nursing and mental health services 2018, 56, 217–230. [Google Scholar] [CrossRef]
- Ozsaban, A.; Turan, N.; Hatice, K.A.Y.A. Resilience in nursing students: the effect of academic stress and social support. Clinical and Experimental Health Sciences 2019, 9, 69–76. [Google Scholar] [CrossRef]
- Park, J.Y.; Hong, O. Factors affecting adjustment of first-year nursing students to college life: A descriptive correlational study. Nurse Education Today 2021, 102, 104911. [Google Scholar] [CrossRef] [PubMed]
- 5. Soanes C, Hawker S. Compact Oxford English Dictionary for University and College Students, 2006.
- Aryuwat, P.; Asp, M.; Lovenmark, A.; Radabutr, M.; Holmgren, J. An integrative review of resilience among nursing students in the context of nursing education. Nursing Open 2023, 10, 2793–2818. [Google Scholar] [CrossRef] [PubMed]
- Pryjmachuk, S.; McWilliams, C.; Hannity, B.; Ellis, J.; Griffiths, J. Transitioning to university as a nursing student: Thematic analysis of written reflections. Nurse Education Today 2019, 74, 54–60. [Google Scholar] [CrossRef] [PubMed]
- Zimmerman, P.A.; Eaton, R.; Brown, L.; Frommolt, V.; Mitchell, C.; Elder, E.; Lin, F. The “five senses of success” in nursing students: Assessing first-year support engagement. International Journal of Nursing Sciences. [CrossRef]
- Mason, H.D. The experience of resilience among nursing students: a qualitative study. Journal for New Generation Sciences 2018, 16, 62–78. [Google Scholar]
- Brink, H.; Van der Walt, C.; Van Rensburg, G.H. Fundamentals of research methodology for health care professionals, 4TH ed.; Juta and company (Pty) Ltd: Cape Town, South Africa, 2018. [Google Scholar]
- Polit, D.F.; Beck, C.T. Essentials of nursing research: appraising evidence for nursing practice, 10TH ed.; Wolters Kluwer: Philadelphia, Pennsylvania, 2022. [Google Scholar]
- Maree, K. First steps in research, 3rd ed.; Journal for new generation sciences: Pretoria, South Africa, 2018. [Google Scholar]
- Mampane, R. Resilience in baccalaureate nursing students: An exploration. Journal of psychosocial nursing and mental health services 2012, 22, 405–408. [Google Scholar] [CrossRef]
- Adrian, N.; Afshani, S.A.; Morowatisharifabad, M.A.; Mahmoodabad, S.S.M.; Vaezi, A.A.; Refahi, S.A.A.; Askarshahi, M.; Hadjizadehmeimandi, M.; Mahmoodabadi, H.Z. Evaluating reliability of theory of planned behaviour questionnaire for withdrawal of divorce petition. Open Access Macedonian Journal of Medical Sciences 2018, 6, 1512. [Google Scholar]
- Warshawski, S. Academic self-efficacy, resilience and social support among first-year Israeli nursing students learning in online environments during COVID-19 pandemic. Nurse Education Today 2022, 110, 105267. [Google Scholar] [CrossRef] [PubMed]
- Lanz, J.J. Evidence-based resilience intervention for nursing students: a randomized controlled pilot trial. International Journal of Applied Positive Psychology 2020, 5, 217–230. [Google Scholar] [CrossRef]
- Taarega, M; Sihombing, R.M.; Sampepadang, M. Resilience and stress among first year nursing students. 20 January.
- Hughes, M.; Kenmir, A.; Innis, J.; O’Connell, J.; Henry, K. Exploring the transitional experience of first-year undergraduate nursing students. Journal of Nursing Education 2020, 59, 263–268. [Google Scholar] [CrossRef] [PubMed]
- Porter, S.L. First year nursing students’ perceptions of stress and resilience during their initial clinical placement and the introduction of a stress management app: a mixed methods approach. Doctoral dissertation, Edinburgh Napier University, Scotland, 19. 20 March.
- Smith, A.R.; Gregg, T.R. Effects of Strength-Based Development on Resilience in Undergraduate Nursing Students. 26 March.
- Gause, G.; Sehularo, L.A.; Matsipane, M.J. Coping strategies used by undergraduate first-year nursing students during transition from basic to higher education: A qualitative study. BMC Nursing Journal 2024, Submitted. [Google Scholar]
- Lee, G.Y.; Fletcher, A.C. Emotional detachment moderates associations between students’ perceptions of parental support and first-year college adjustment: Generational status differences. Journal of College Student Retention: Research, Theory & Practice 2023, 24, 1002–1027. [Google Scholar]
- McCulloh, E. An exploration of parental support in the retention of rural first-generation college students. Journal of College Student Retention: Research, Theory & Practice 2022, 24, 144–168. [Google Scholar]
Figure 1.
Internal consistency of the data collection tool.
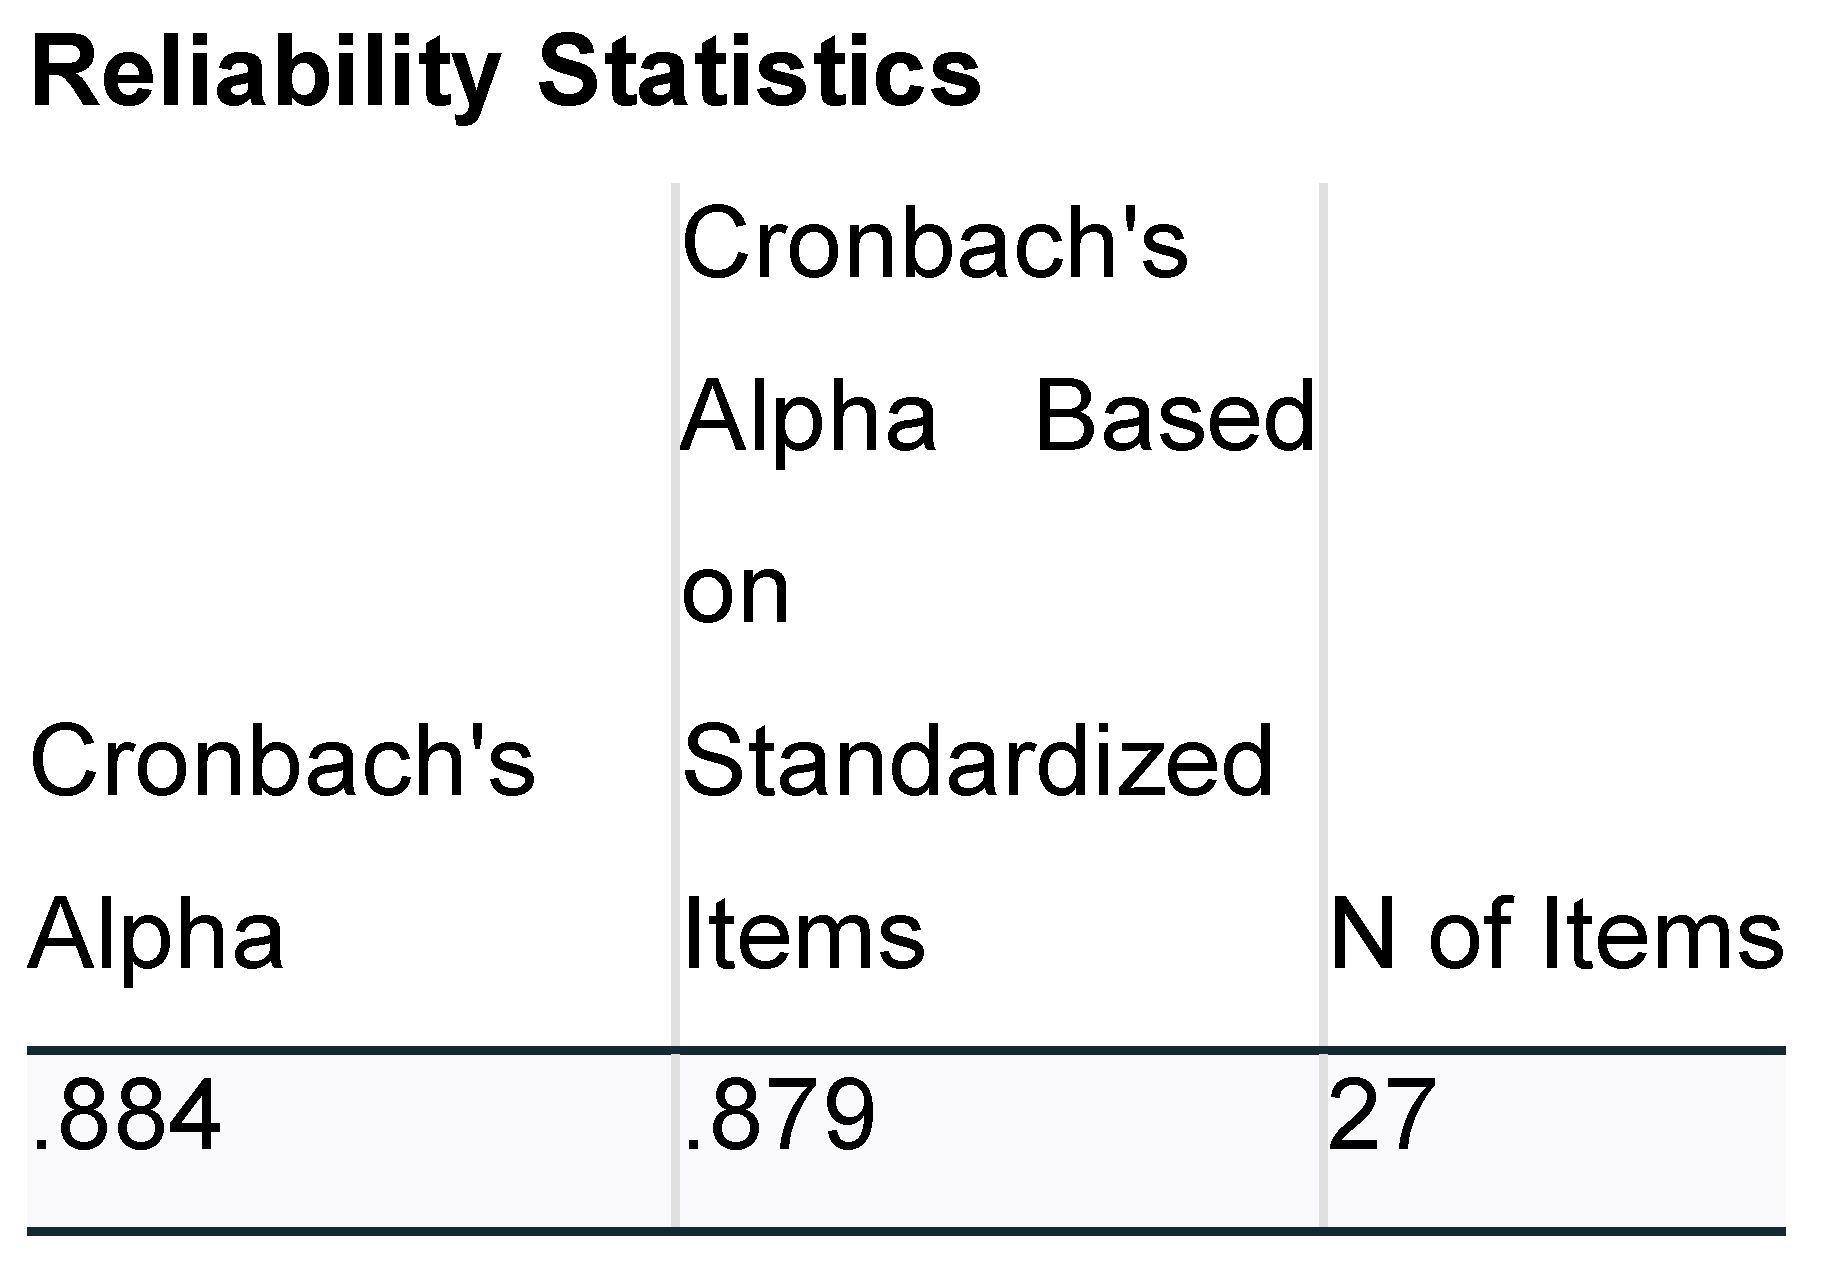
Figure 2.
Gender distribution.
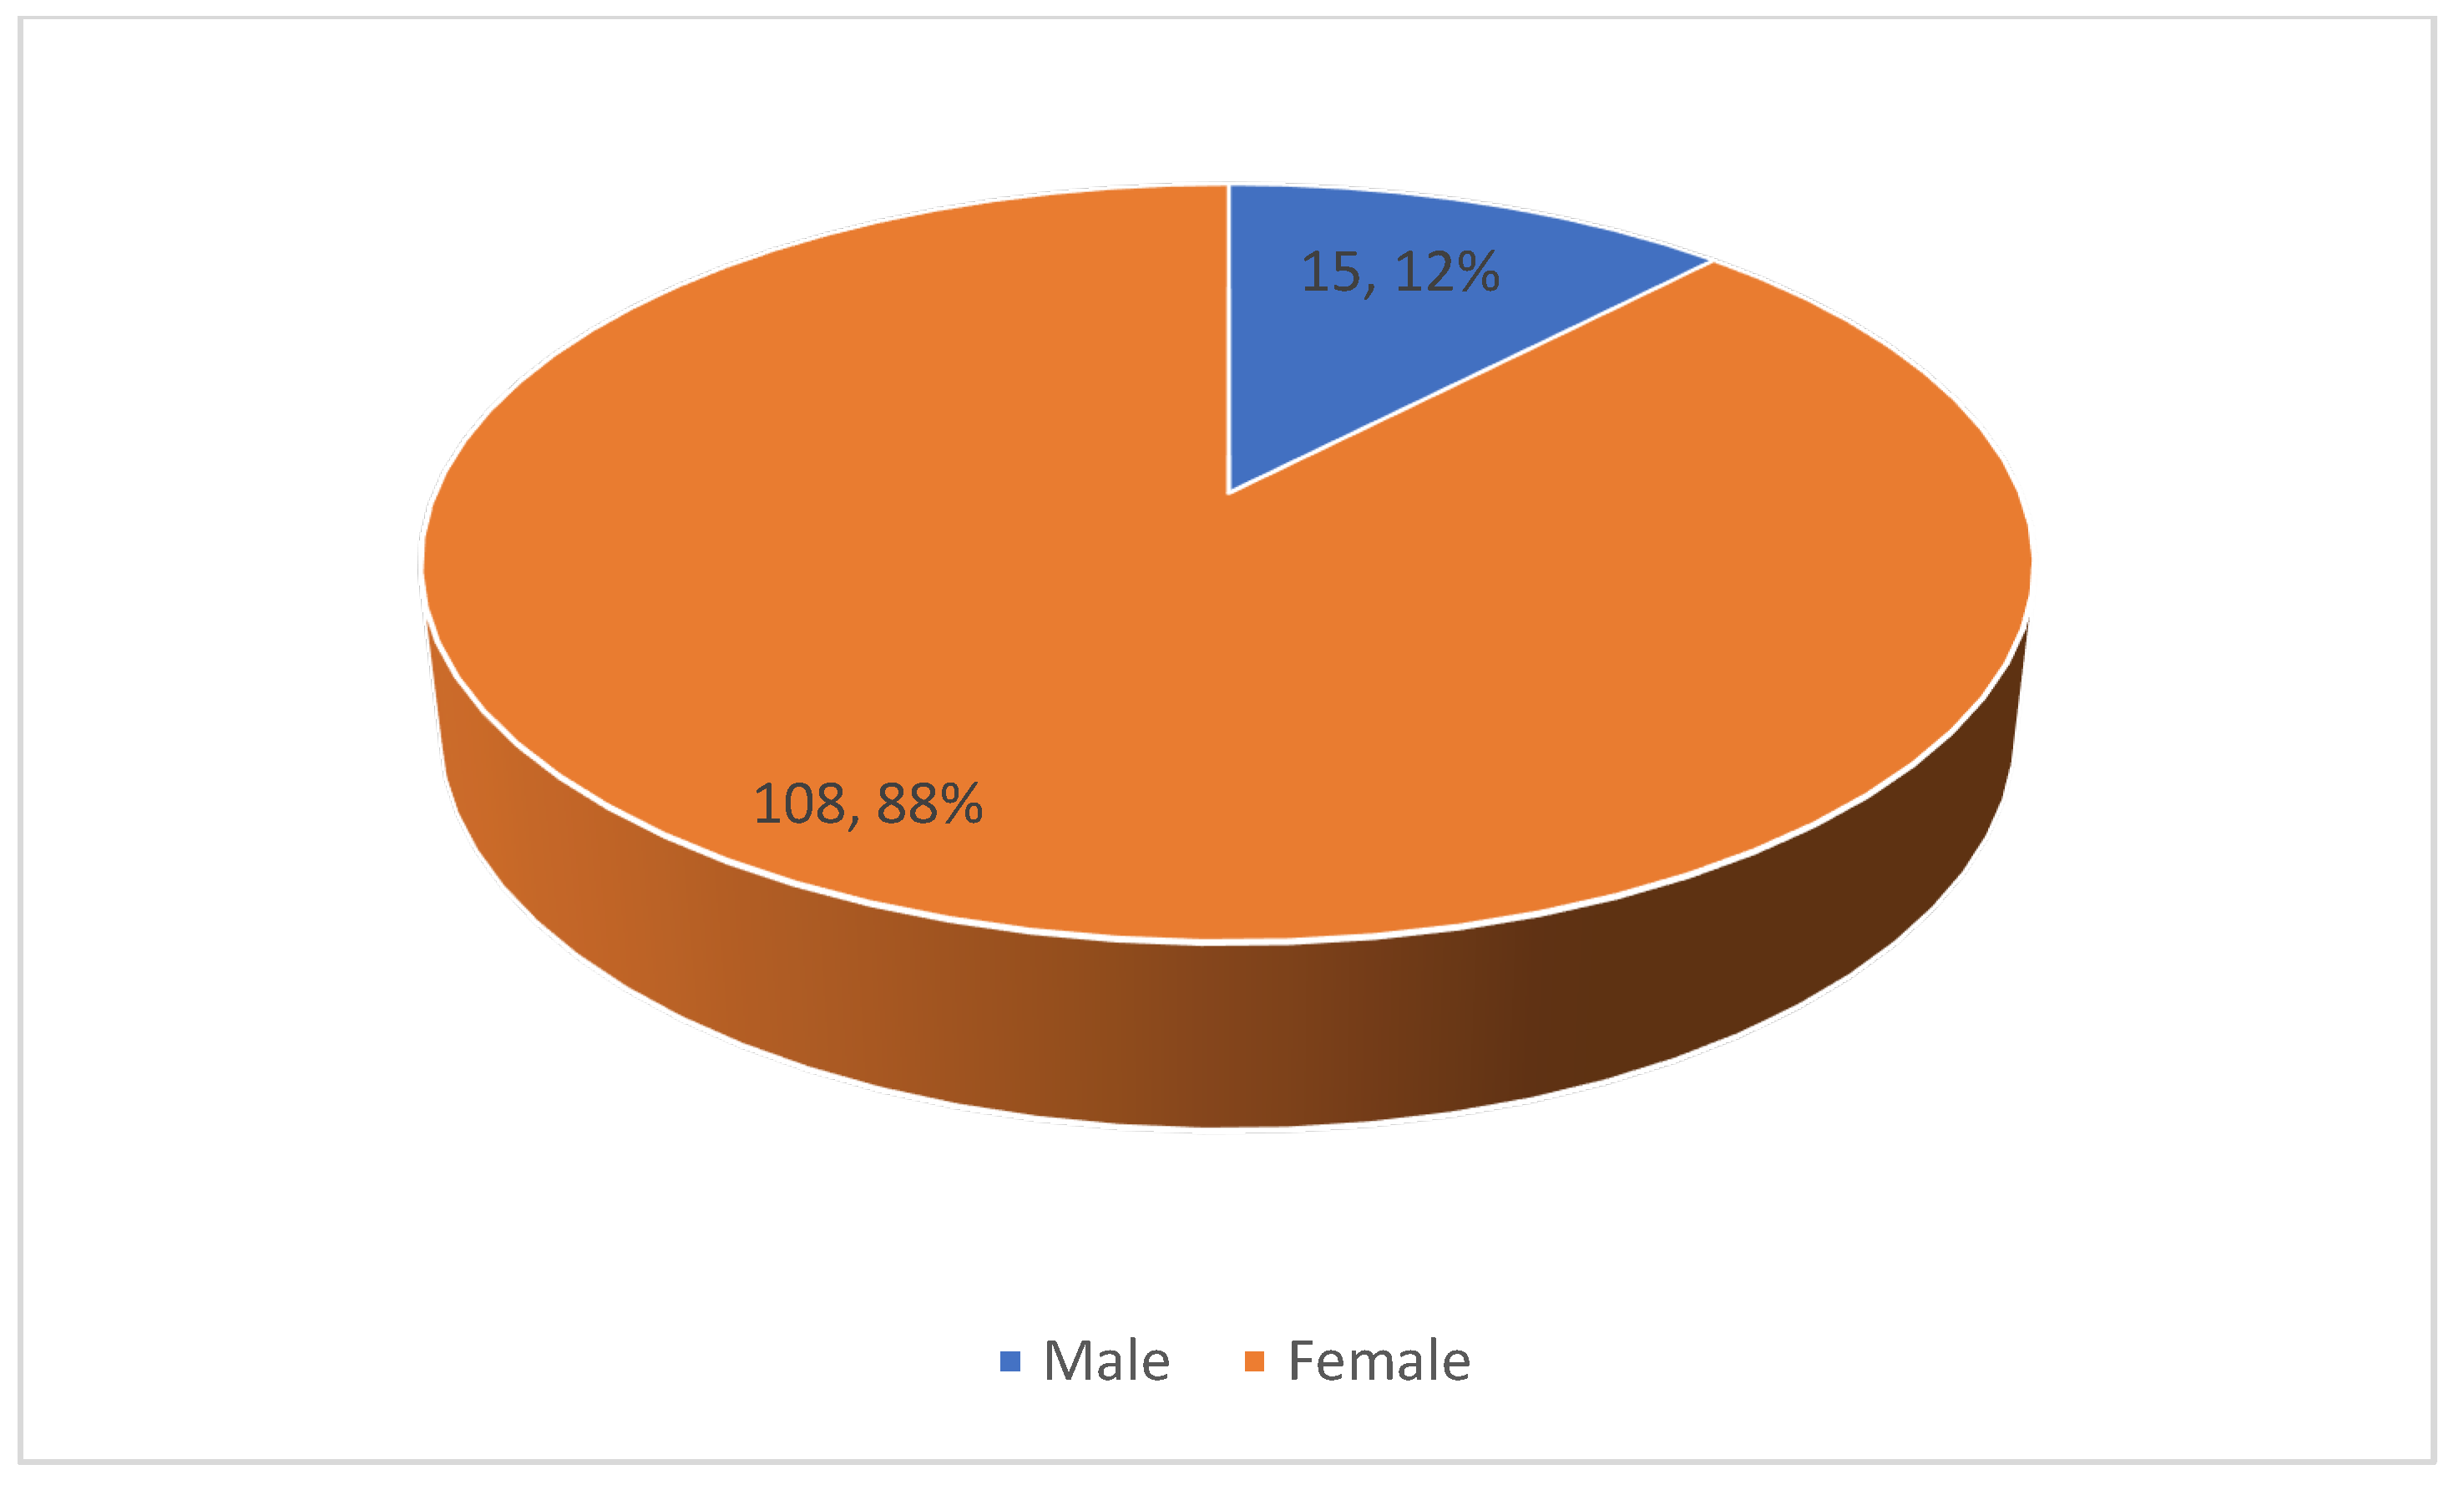
Figure 3.
Age distribution.
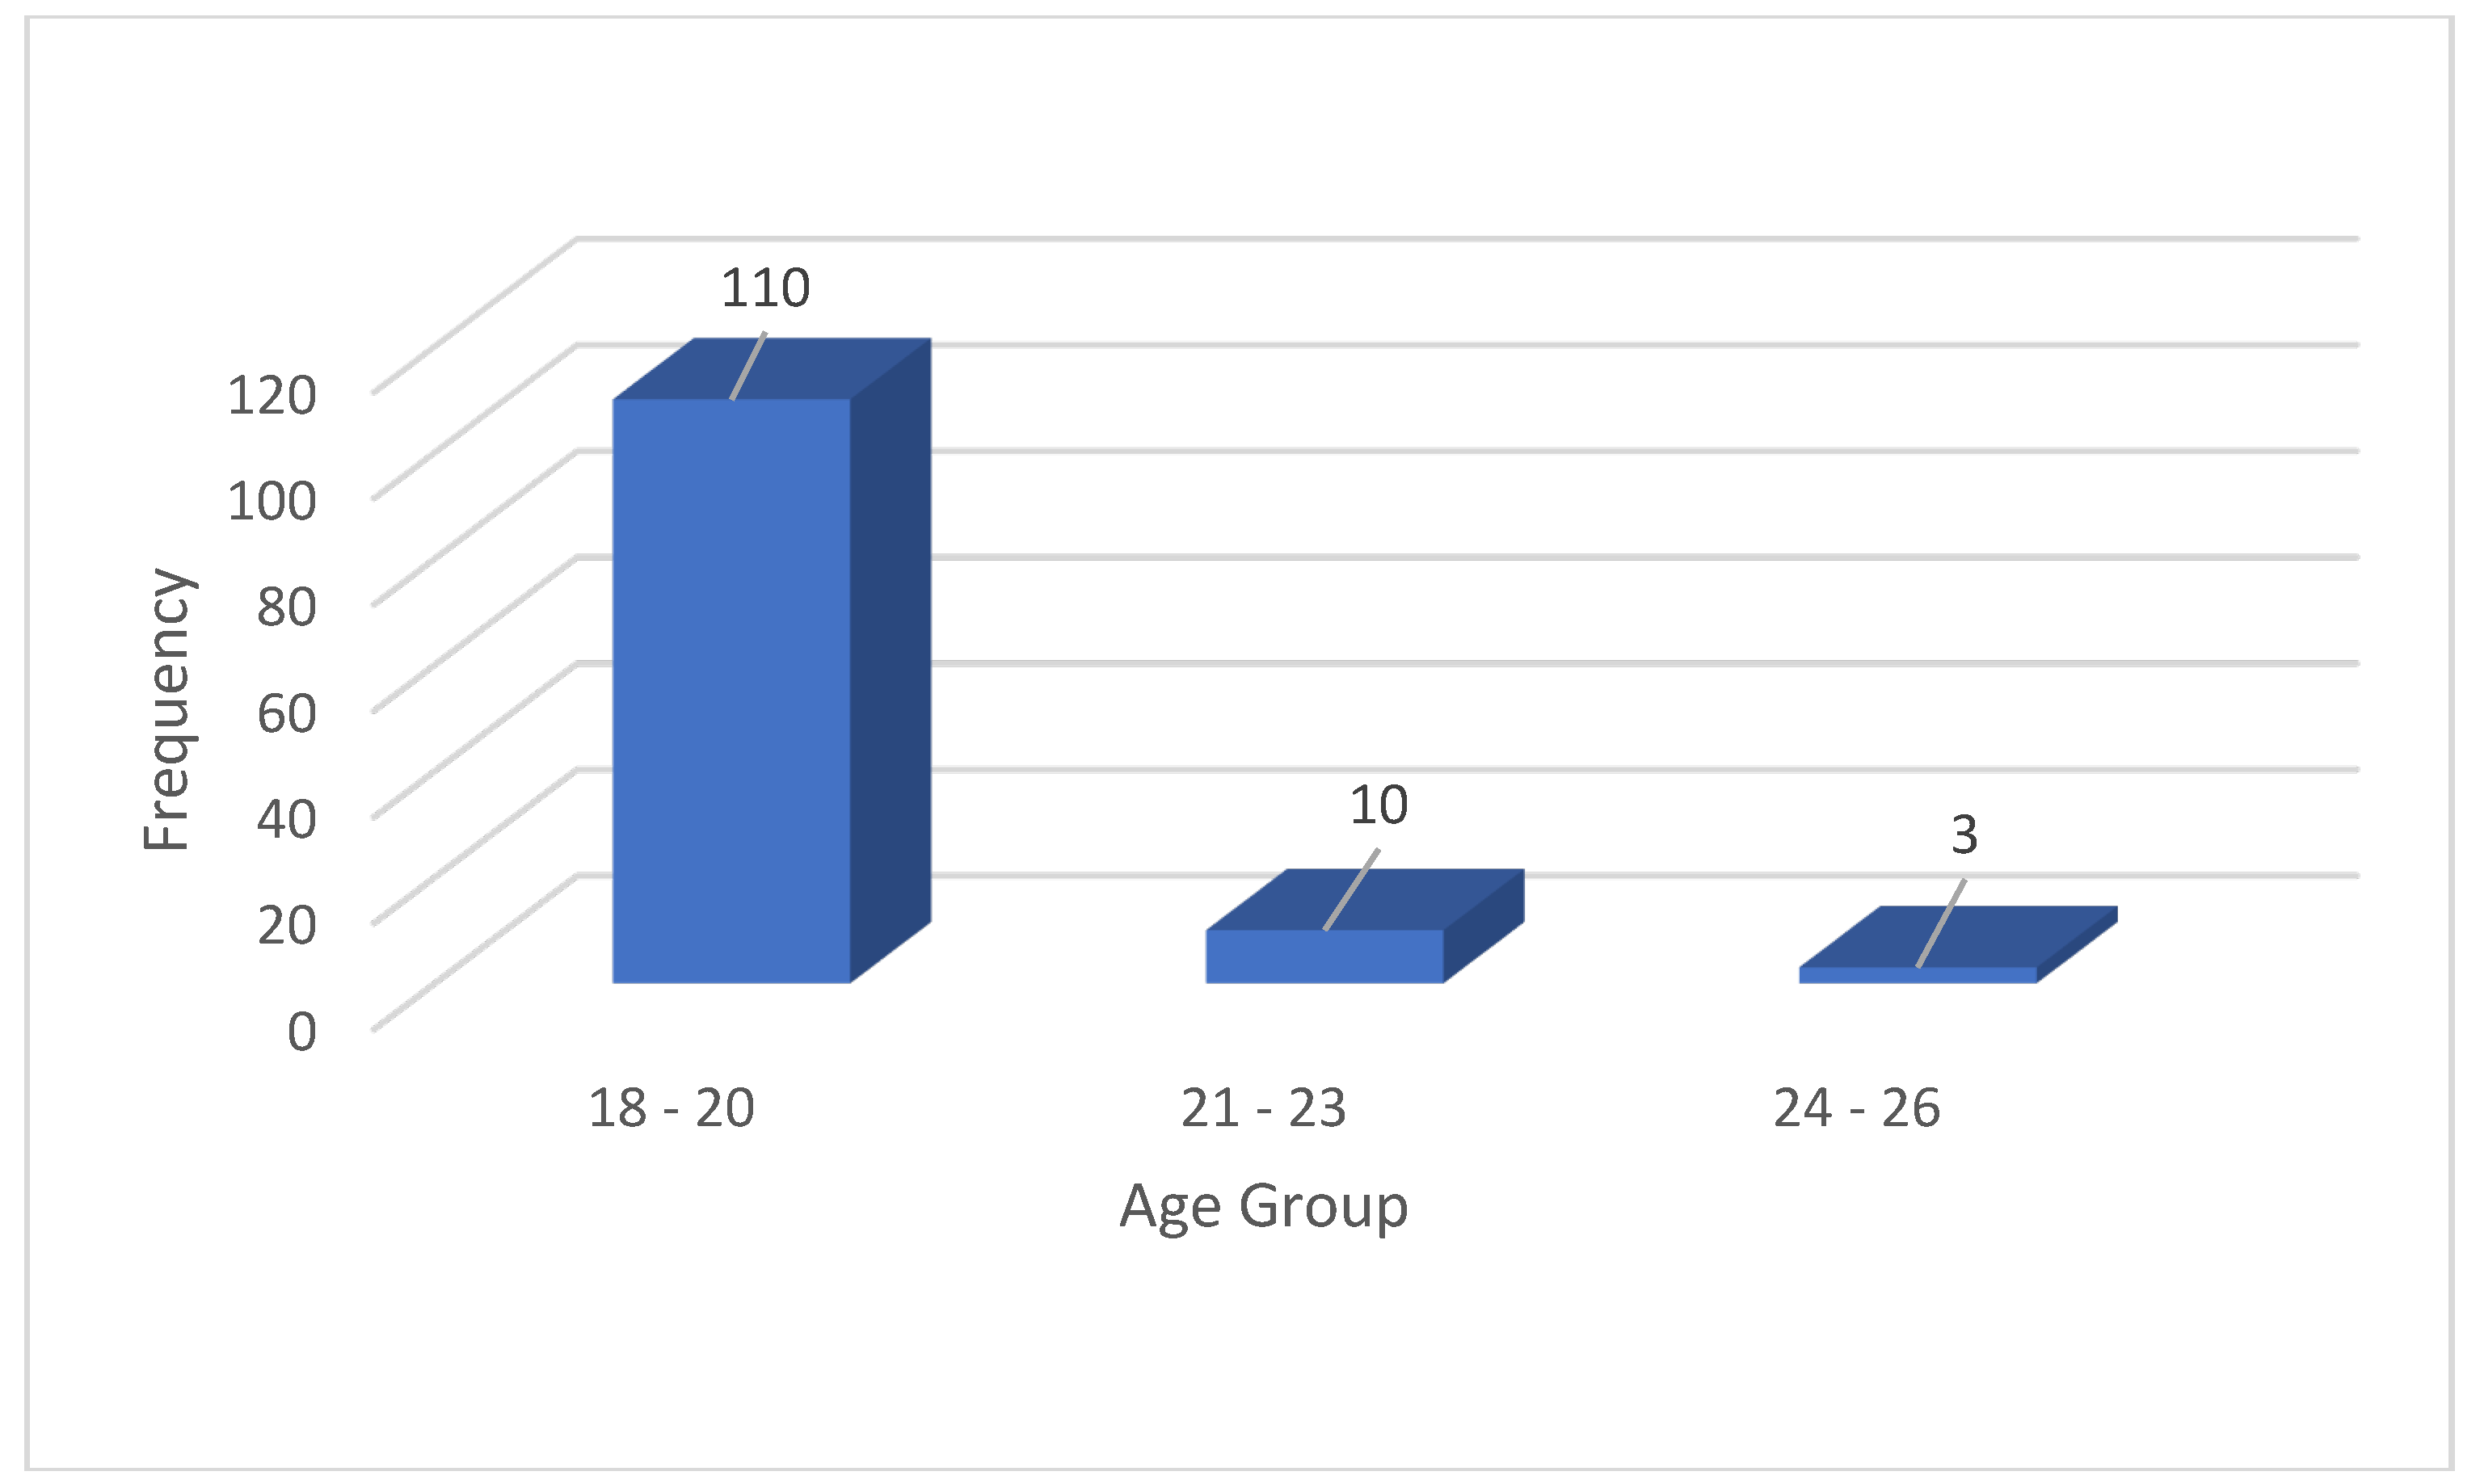
Figure 4.
Response distribution to right answer to a problem.
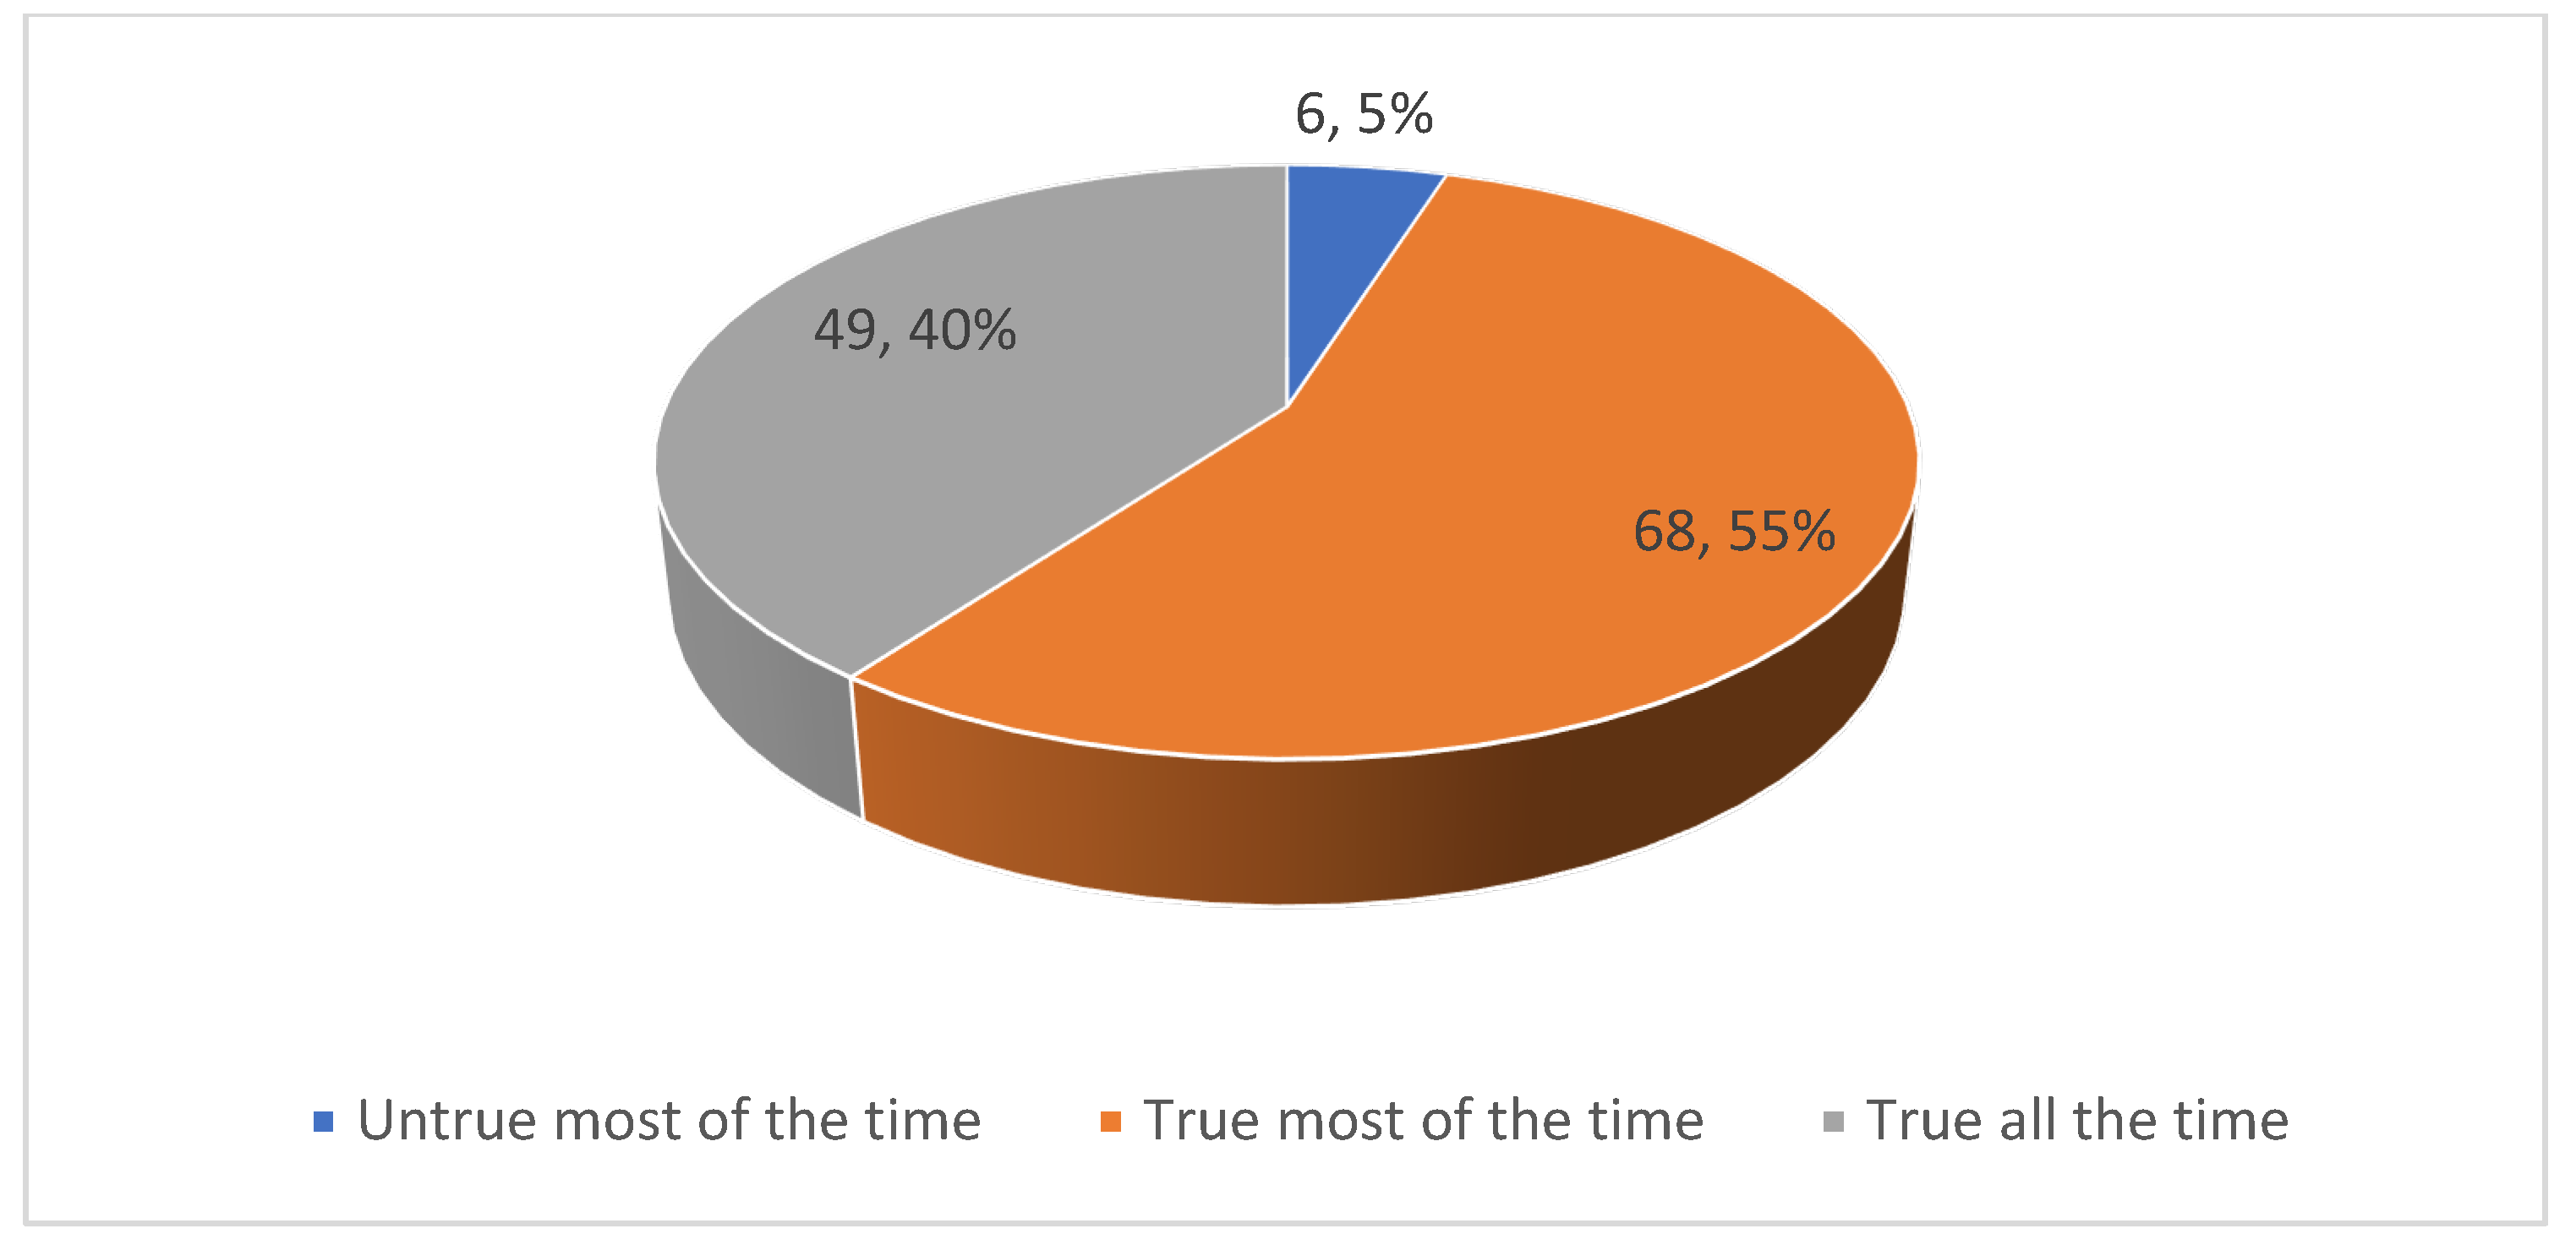
Figure 5.
Tough person response distribution.
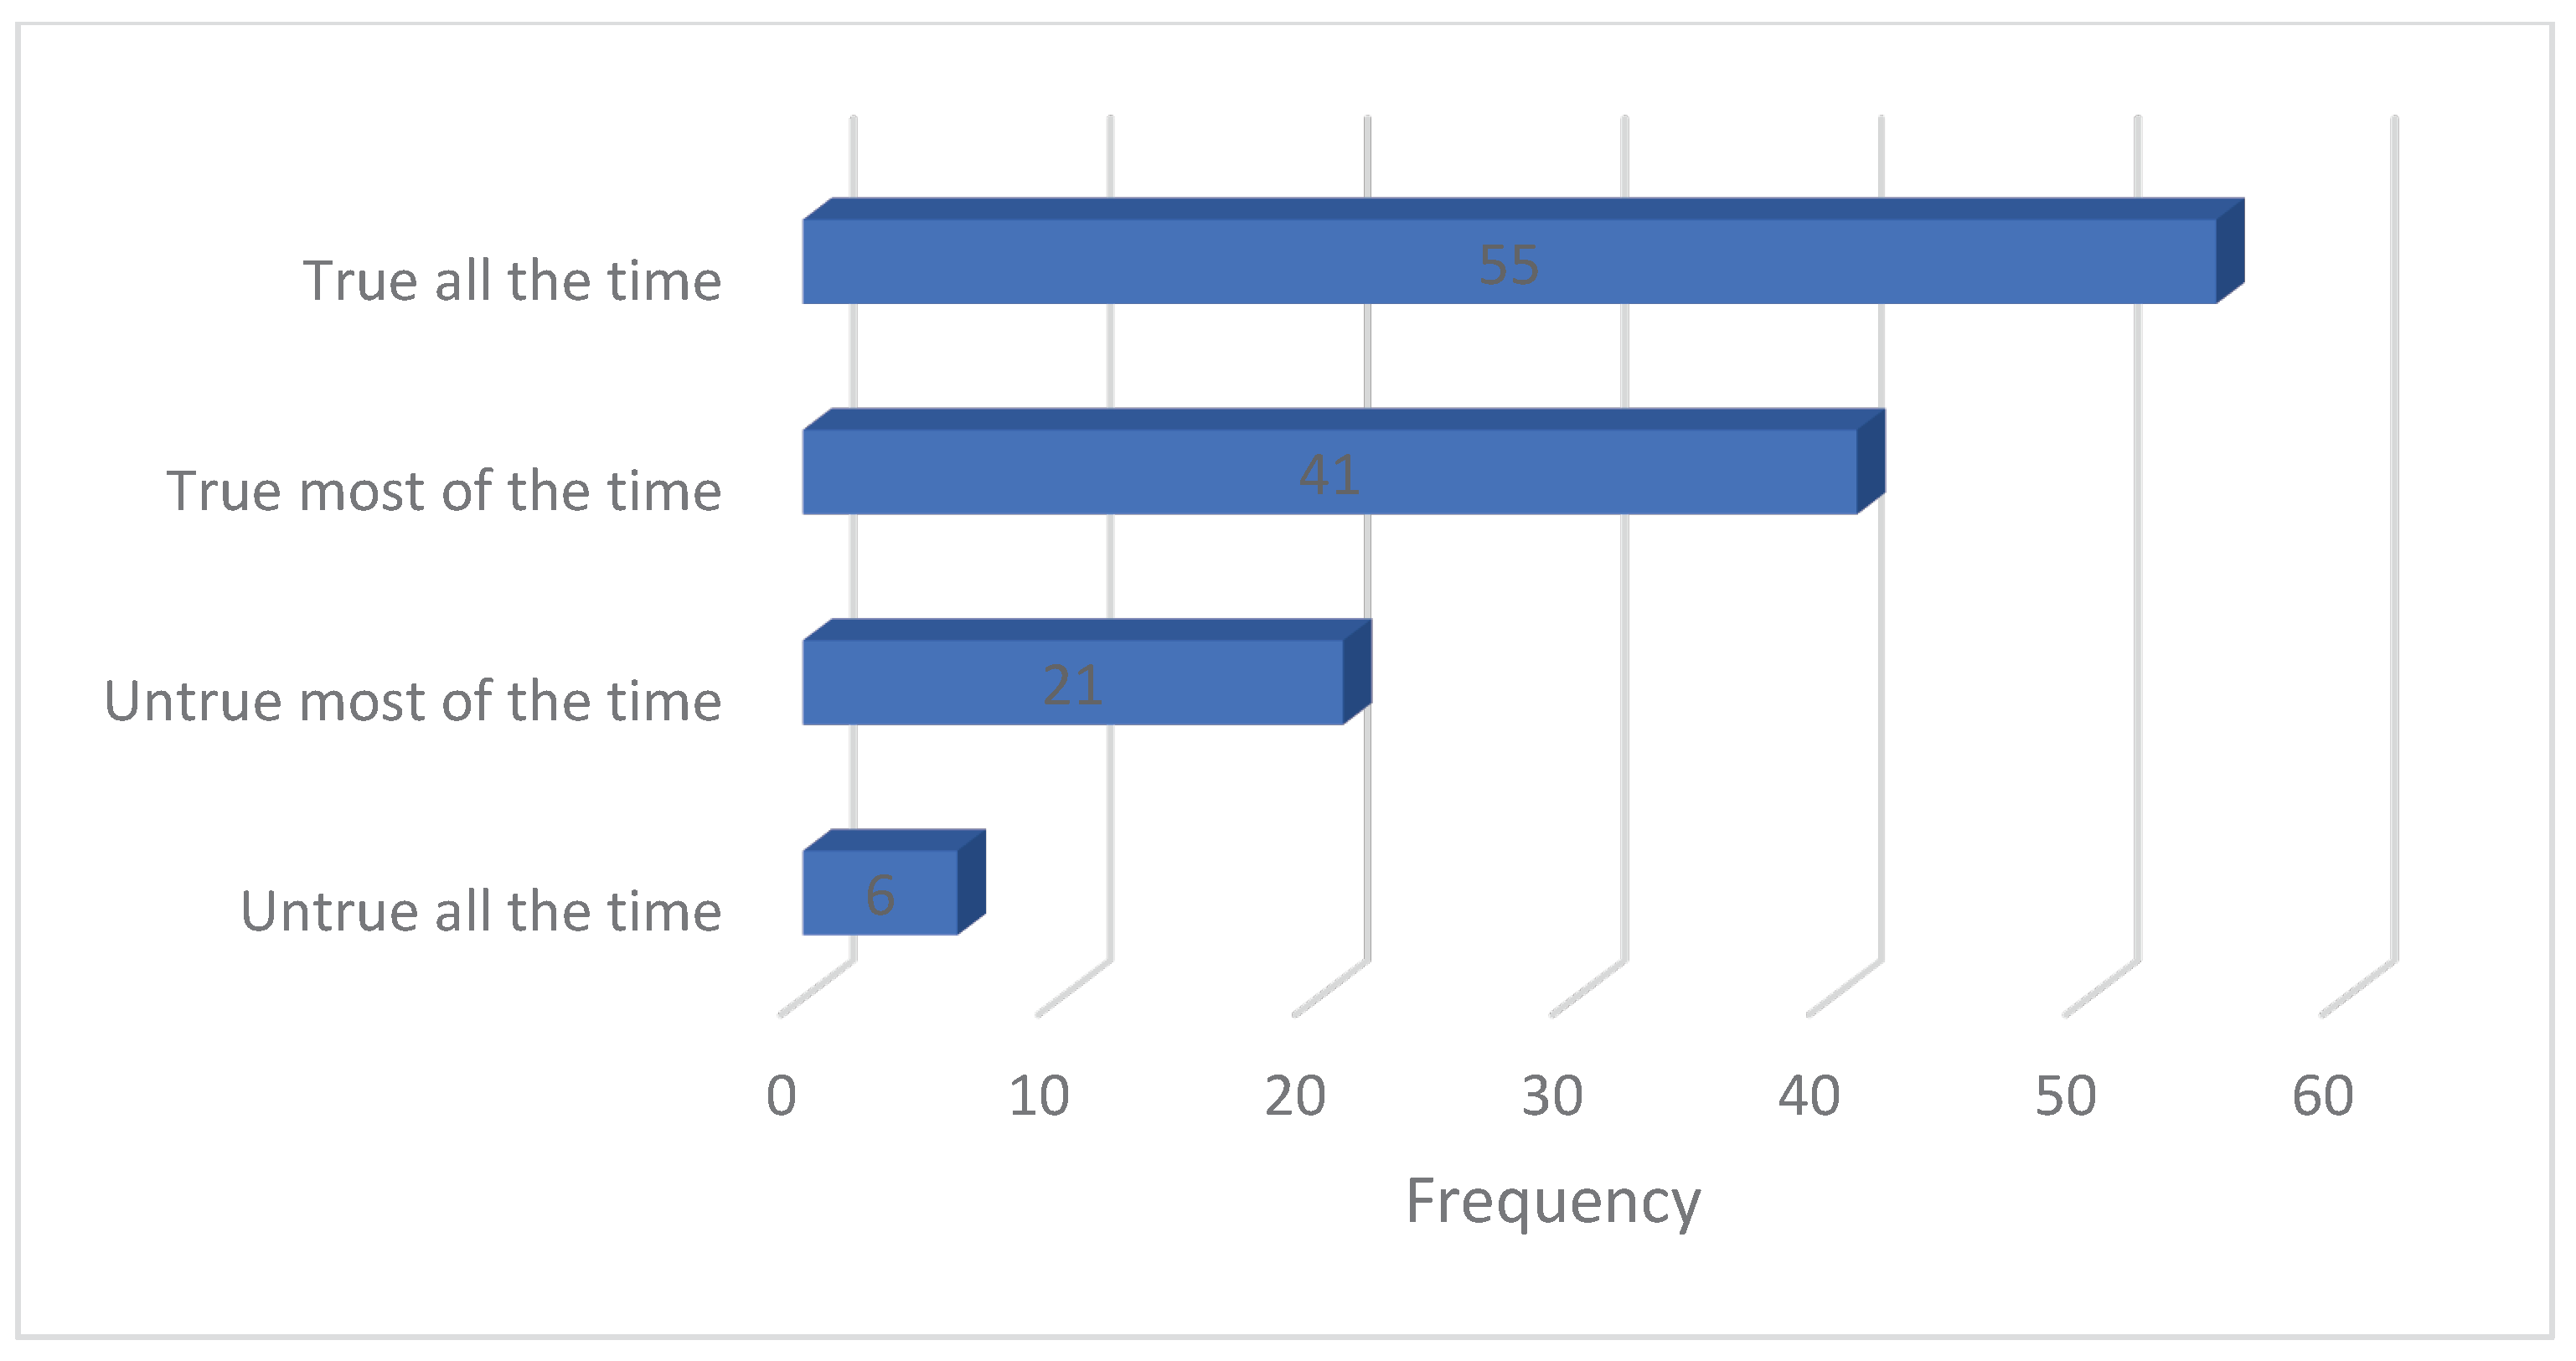
Table 2.
Sampling adequacy table.
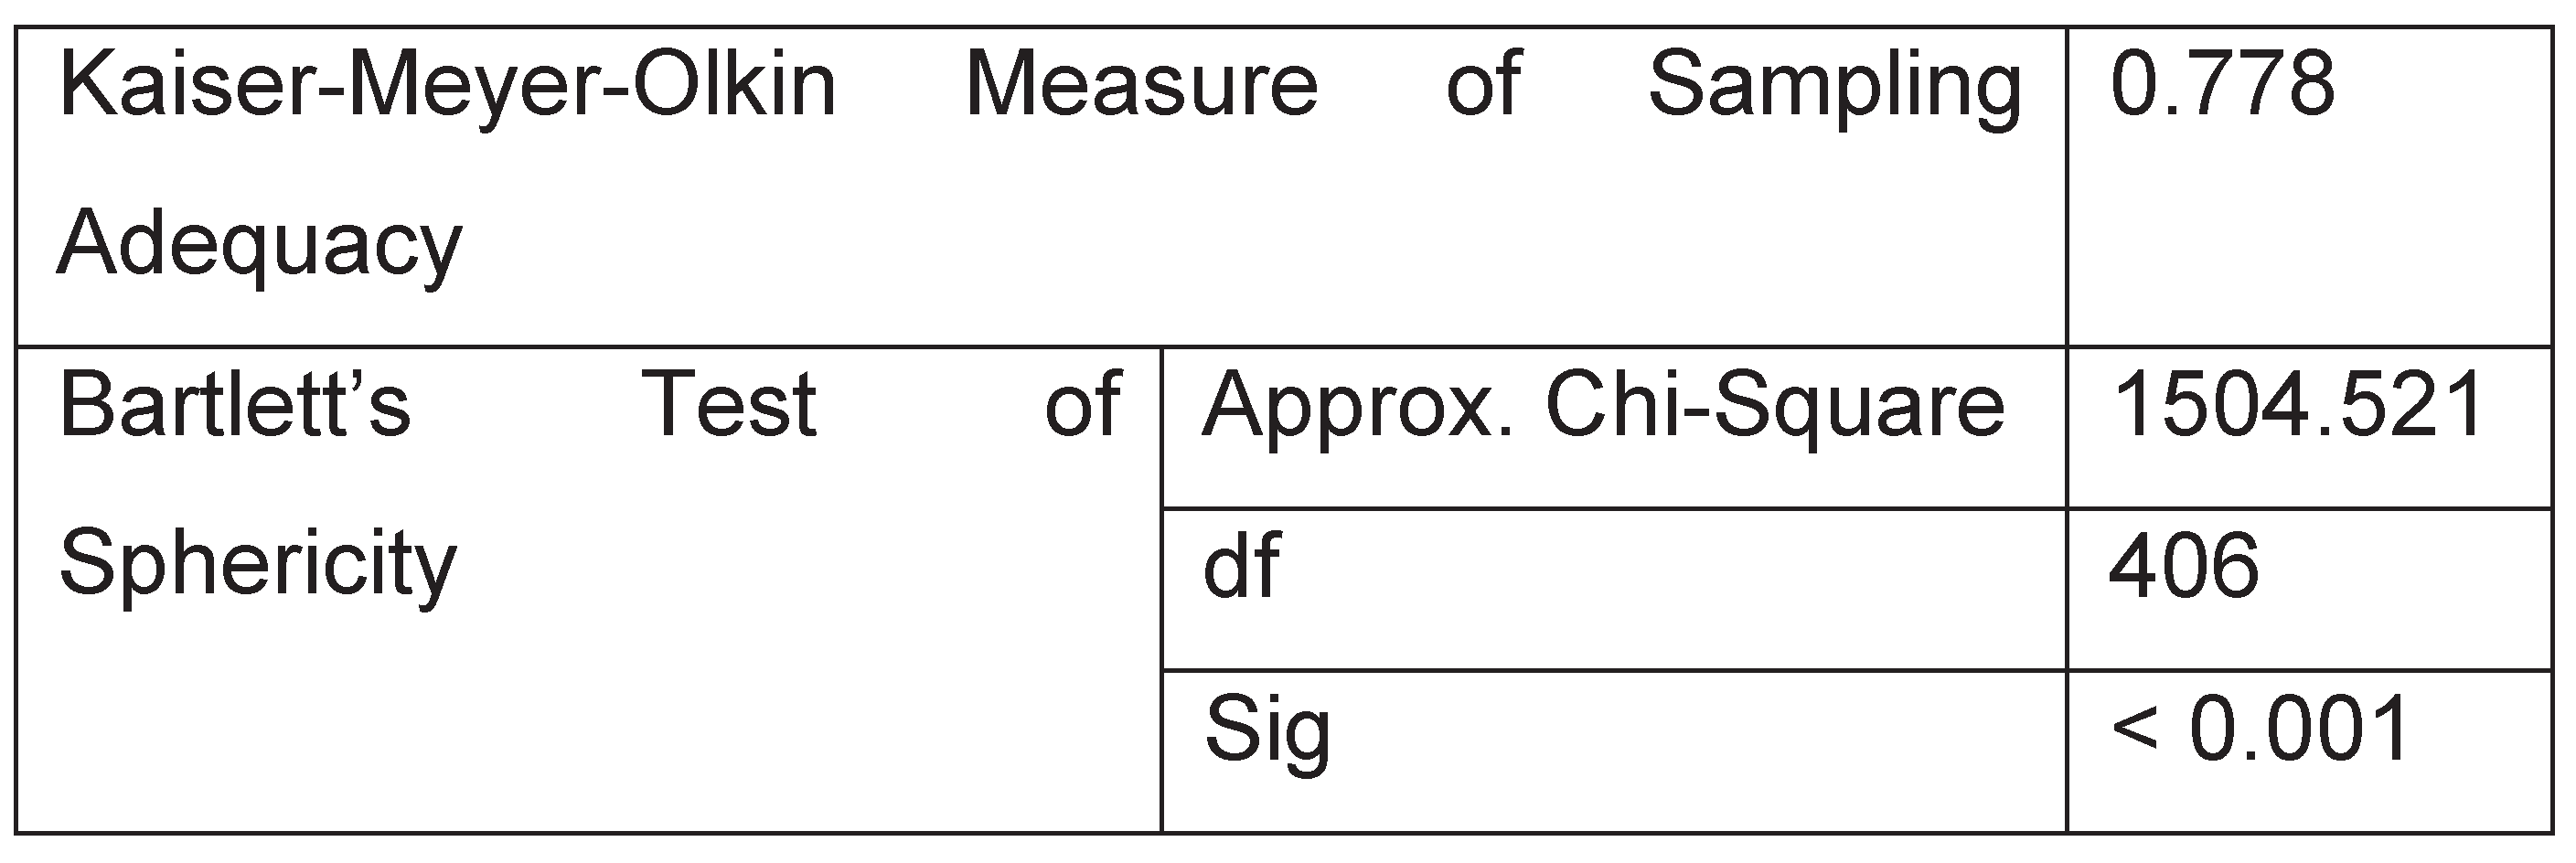
Table 3.
Factor loadings and communalities.
| Factors | 1 | 2 | 3 | 4 | 5 | 6 | 7 | 8 | Communalities |
|---|---|---|---|---|---|---|---|---|---|
| My lecturers support me to think of my bright future. | .814 | .711 | |||||||
| My lecturers support me to aim high. | .809 | .781 | |||||||
| There is at least one lecturer who encourages me to do my best | .766 | .691 | |||||||
| My lectures make me see that am good with my work | .675 | .606 | |||||||
| There is at least one lecturer that I can talk to who listens to me and encourages me to do my best | .671 | .603 | |||||||
| Lecturers explain a lot in class | .647 | .593 | |||||||
| My lecturer works hard to help me understand my work better | .588 | .545 | |||||||
| Lecturer gives extra examples in class | .586 | .645 | |||||||
| My future and success depend on my hard work | .718 | .698 | |||||||
| I believe that I can do better | .678 | .588 | |||||||
| I make sure that I do all my assessments | .675 | .577 | |||||||
| Doing well at school is very important to me | .673 | .537 | |||||||
| I am in control of what happens to me | .536 | .547 | |||||||
| My future is in my hands | .404 | .458 | |||||||
| I know someone at the university who cares about me | .856 | .803 | |||||||
| I know someone at the university that I can talk to | .825 | .763 | |||||||
| I believe I have good talents | .402 | .601 | |||||||
| I believe that one day things will be better for me | .794 | .716 | |||||||
| Even when my problems are just too much, I do not give up trying to make it work. | .707 | .668 | |||||||
| I use different ways to work out a difficult problem | .551 | .566 | |||||||
| I do not allow people to stop me from trying to do my best in my work | .452 | .499 | |||||||
| I have an adult to talk to at home | .875 | .810 | |||||||
| I have an adult who listens to me | .869 | .805 | |||||||
| I feel safe and loved at home | .577 | .740 | |||||||
| I know a good person whose behaviour is an example to me | .764 | .710 | |||||||
| Even when I don’t understand in class, I don’t give up trying | .698 | .623 | |||||||
| I do not like to be absent from classes | .487 | .606 | |||||||
| I am a tough person | .740 | .727 | |||||||
| I do my best to find the right answer to a problem | .818 | .768 |
Table 4.
Communalities of factor loading 1.
| Item | Untrue all the time | Untrue most of the time | True most of the time | True all the time |
| My lecturers make me see that I am good with my work | 12 (9.8) | 29 (23.6) | 57 (46.3) | 25 (20.3) |
| There is at least one lecture that I can talk to who listens to me and encourages me to do my best | 36 (29.3) | 35 (28.5) | 37 (30.1) | 15 (12.2) |
| Lecture explains a lot in class | 4 (3.3) | 26 (21.1) | 56 (45.5) | 37 (30.1) |
| Lecturer works hard to make me understand | 1 (0.8) | 13 (10.6) | 65 (52.8) | 44 (35.8) |
| Lecturers give extra examples in class | 4 (3.3) | 23 (18.7) | 57 (46.3) | 39 (31.7) |
| My lecturers support me to aim high | 10 (8.1) | 27 (22.0) | 60 (48.8) | 26 (21.1) |
| My lecturers support me to think of my bright future | 8 (6.5) | 23 (18.7) | 55 (44.7) | 37 (30.1) |
| There is at least one lecturer who encourages me to do my best | 13 (10.6) | 31 (25.2) | 51 (41.4) | 28 (22.8) |
Table 5.
Communalities of factor loading 2.
| Item | Untrue all the time | Untrue most of the time | True most of the time | True all the time |
| My future and success depend on my hard work | 1 (0.8) | 2 (1.6) | 12 (9.8) | 108 (87.8) |
| I believe I can do better | 0 (0.0) | 5 (4.1) | 30 (24.4) | 88 (71.5) |
| I make sure that I do all my assessments | 7 (5.7) | 0 (0.0) | 48 (39.0) | 68 (55.3) |
| Doing well at school is important to me | 0 (0.0) | 3 (2.5) | 24 (19.5) | 96 (78.0) |
| I am in control of what happens to me | 5 (4.1) | 22 (17.9) | 48 (39.0) | 48 (39.0) |
| My future is in my hands | 2 (1.6) | 0 (0.0) | 18 (14.6) | 103 (83.7) |
Table 6.
Communalities of factor loading 3.
| Item | Untrue all the time | Untrue most of the time | True most of the time | True all the time |
| I know someone at the university who cares about me | 17 (13.8) | 18 (14.6) | 55 (44.7) | 33 (26.8) |
| I know someone at the university that I can talk to | 15 (12.2) | 24 (19.5) | 50 (40.7) | 34 (27.6) |
| I believe I have good talents | 4 (3.3) | 18 (14.6) | 64 (52.0) | 37 (30.1) |
Table 7.
Communalities of factor loading 4.
| Item | Untrue all the time | Untrue most of the time | True most of the time | True all the time |
| I believe that one day things will be better for me | 2 (1.6) | 0 (0.0) | 28 (22.8) | 93 (75.6) |
| I use different ways to work out a difficult problem | 4 (3.3) | 7 (5.7) | 76 (61.8) | 36 (29.3) |
| Even when my problems are just too much, I do not give up trying to make it work. | 2 (1.6) | 8 (6.5) | 52 (42.3) | 61 (49.6) |
| I do not allow people to stop me from trying to do my best | 2 (1.6) | 6 (4.9) | 55 (44.7) | 60 (48.8) |
Table 8.
Communalities of factor loading 5.
| Item | Untrue all the time | Untrue most of the time | True most of the time | True all the time |
| I have an adult to talk to at home | 4 (3.3) | 17 (13.8) | 51 (41.5) | 51 (41.5) |
| I have an adult who listens to me | 4 (3.3) | 13 (10.6) | 52 (42.3) | 54 (43.9) |
| I feel safe and loved at home | 1 (0.8) | 5 (4.1) | 24 (19.5) | 93 (75.6) |
Table 9.
Communalities of factor loading 6.
| Item | Untrue all the time | Untrue most of the time | True most of the time | True all the time |
| I know a good person whose behaviour is an example to me | 8 (6.5) | 11 (8.9) | 47 (38.2) | 57 (46.3) |
| Even when I do not understand in class, I do not give up trying | 2 (1.6) | 11 (8.9) | 52 (42.3) | 58 (47.2) |
| I do not like to be absent from class | 0 (0.0) | 9 (7.3) | 47 (38.2) | 67 (54.5) |
Disclaimer/Publisher’s Note: The statements, opinions and data contained in all publications are solely those of the individual author(s) and contributor(s) and not of MDPI and/or the editor(s). MDPI and/or the editor(s) disclaim responsibility for any injury to people or property resulting from any ideas, methods, instructions or products referred to in the content. |
© 2024 by the authors. Licensee MDPI, Basel, Switzerland. This article is an open access article distributed under the terms and conditions of the Creative Commons Attribution (CC BY) license (http://creativecommons.org/licenses/by/4.0/).
Copyright: This open access article is published under a Creative Commons CC BY 4.0 license, which permit the free download, distribution, and reuse, provided that the author and preprint are cited in any reuse.


