
Submitted:
05 April 2024
Posted:
05 April 2024
You are already at the latest version
Abstract
Hybrid Renewable Energy Systems (HRES) integrate renewable sources, storage, and optionally conventional energies, offering an eco-friendly solution to fossil fuels. Microgrids (MGs) bolster HRES integration, enhancing energy management, resilience, and reliability at various levels. This study, emphasizing the need for refined optimization methods, investigates three themes: renewable energy, microgrid, and multiobjective optimization (MOO), through a bibliometric analysis of 470 Scopus documents from 2010-2023, analyzed with SciMAT software. It segments the research into two periods, 2010-2019 and 2020-2023, revealing a surge in MOO focus, especially in the latter period, with a 35% increase in MOO-related research. This indicates a shift towards com-prehensive energy ecosystem management that balances environmental, technical, and economic elements. The initial focus on MOO, genetic algorithms, and energy management systems has expanded to include smart grids and electric power systems, with MOO remaining a primary theme in the second period. The increased application of Artificial Intelligence (AI) in optimizing HMGS within the MOO framework signals a move towards more sustainable, intelligent energy solutions. Despite progress, challenges remain, including high battery costs, the need for reliable MOO data, the intermittency of renewable energy sources, and HMGS network scalability issues, highlighting directions for future research.
Keywords:
Renewable energy sources
; Hybrid energy system
; Microgrid
; Multiobjective optimization
; Bibliometric Analysis
; SciMAT
1. Introduction
The global energy transition, aimed at significant reductions in carbon emissions across the energy industry and end-use sectors, necessitates the adoption of renewable energy sources (RESs) such as low-cost solar photovoltaic (SPV), onshore, and offshore wind. To meet the targets set in the 1.5°C scenario by the International Renewable Energy Agency (IRENA), a substantial increase in global renewable energy (RE) capacity is essential, including the expansion of the installed renewable electricity generation capacity to more than 11,000 GW [1]. Notably, this transition occurs amidst fluctuations in the energy market, as electricity prices exhibited heightened volatility, especially during the 2020-2021 pandemic period, compared to the preceding years [2]. This highlights the challenges and complexities of achieving renewable energy targets in a volatile energy price environment. According to a report by the International Energy Agency (IEA), RESs will contribute to 80% of the energy produced worldwide by 2030, with solar energy representing more than half of this percentage. This indicates feasible directions to address the global climate crisis as well as the fuel crisis in 2022 [3], as seen in Figure 1.
RESs are vital due to their role as environmentally friendly alternatives, yet significant challenges impede total reliance on them. A primary challenge is the variability of energy production, largely dependent on weather conditions. To counteract this, integrating batteries and/or conventional sources like diesel generators is crucial, especially when used as off-grid installations, forming what is known as a Hybrid Energy System (HRES) [4]. To shed more light on these two systems, Table 1 provides a comparison between HRESs and RESs from different aspects.
Economically and technically, HRESs emerge as an optimal solution, ensuring energy supply stability when RESs are insufficient [5,6,7]. The integration of HRESs into the utility grid has led to the utilization of microgrids (MGs). An MG is a self-sufficient system composed of distributed energy resources, capable of operating independently from the main grid during outages. These systems include various components like distributed generators, storage devices, and controllable loads. They can operate in two modes: connected to the main grid or in an islanded (independent) mode, ensuring coordinated and controlled energy distribution [8,9]. This integration, known as Hybrid Microgrid Systems (HMGSs), reduces costs, decreases grid dependence, and has a lower environmental impact [10]. The effective use of HMGSs depends heavily on having proper sizing, simulation, and optimization software tools to prevent exorbitant installation costs and ensure the reliability of the power source. These tools are instrumental in studying, evaluating, and optimizing the use of these resources, playing a critical role in addressing these challenges. Their application enhances the efficiency of these systems and contributes to a more balanced and sustainable energy sector.
The optimization of HMGSs has attracted significant attention from researchers, as evidenced by a bibliometric study conducted for the period from 2005 to 2021, which revealed a notable increase in the number of publications. Over this period, the study monitored more than 2300 scientific papers published on this subject. Various artificial intelligence (AI) techniques, tools, and software have been utilized to address problems related to HMGS usage. These approaches have evaluated HMGSs from multiple perspectives, including technical, economic, environmental, control and operation, and size aspects. Among these techniques, the study identified the use of multi-objective optimization (MOO) as the most significant development in the last five years [11]. To comprehensively understand the application of MOO to HMGSs, this study is structured into three phases. The first phase focuses on reviewing mathematical models for prevalent HMGS configurations, thereby laying the theoretical groundwork. The subsequent phase delves into critical economic and reliability metrics to evaluate HMGSs. The study culminates with the third phase, which conducts a bibliometric analysis and comparative case studies to identify research trends and gaps, as illustrated in Figure 2.
2. Methodological Framework
As outlined in Figure 2, the study commences with the first phase, focusing on the mathematical modeling of HMGSs. This phase is crucial for establishing a solid theoretical foundation, providing the necessary groundwork for subsequent analysis.
2.1. First phase: Mathematical model of HMGSs
As mentioned earlier, HMGSs are financially beneficial for both current and future electricity supply needs. The most common form of these systems integrates SPV, wind, batteries, and diesel generators [12,13]. MGs, capable of operating independently or in conjunction with the main grid, enhance resilience and flexibility in energy distribution [14]. To demonstrate the diversity and scalability of MG configurations, Figure 3 classifies them by function, demand, and capacity [15]. This classification sheds light on the various possible setups of MGs and their scalability.
The mathematical models of each component will be detailed in the subsequent subsections, providing a comprehensive understanding of their operational dynamics within HMGSs.
2.1.1. SPV system
The SPV system within HMGSs includes key elements: SPV panels, an inverter, a charge controller, and a battery storage unit. Detailed discussions of each component will follow.
- SPV: A solar cell, or photovoltaic (PV) cell, is a device that transforms light into electricity through the photovoltaic effect. The behavior of both an ideal SPV cell and a practical SPV device are typically represented in diagrams, such as those depicted in Figure 4.
The current-voltage relationship of an ideal solar cell is described by a fundamental equation from semiconductor theory, shown as equation 1:
Here, is the PV current generated by the cell due to incident light,is the reverse saturation current of the diode, q is the charge of an electron (1.60217646 × Coulomb), K is the Boltzmann constant (1.38064852× Joules/Kelvin), T is the absolute temperature (in Kelvin) of the diode junction and is the diode ideality factor. Since a practical SPV array has series resistance and parallel resistance, equation 1 does not describe its I–V characteristic. Practical arrays consist of many interconnected SPV cells; require the addition of new parameters to the basic equation for accurate monitoring of characteristics in SPV array stations, as demonstrated in equation 2.
SPV array datasheets typically provide essential information, including the nominal open-circuit voltage (), the nominal short-circuit current (), the voltage at the maximum power point (MPP) (), the current at the MPP (), the open-circuit voltage/temperature coefficient (), the short circuit current/temperature coefficient (), and the maximum experimental peak output power (). It's commonly assumed in SPV device modeling that the short-circuit current () is approximately equal to the photovoltaic current (). This assumption holds because, in practical devices, the series resistance is typically low, and the parallel resistance is high, affecting the overall performance. The diode saturation current is described by equation 3.
The maximum output power is calculated to the maximum experimental power when solving the resulting equation for, as detailed in equation 4.
SPV systems are classified into various configurations based on the application's requirements and the coupling of various power sources. Figure 5 depicts various SPV system configurations [16].
- Charge controller: A charge controller, also known as a charge regulator or battery regulator, moderates the flow of electric current to and from the batteries. This control prevents excessive charging and voltage spikes, which can damage the battery, reduce its efficiency, or pose safety concerns. In SPV systems, solar charge controllers adjust the power or DC voltage coming from the solar panels before it is directed to the batteries.
- Inverter: Various inverter models exist, each tailored to the specific requirements of the load. The selection depends on the load's waveform needs and the inverter's efficiency. The choice is also influenced by whether the inverter is standalone or grid-connected. Inverter failure is a leading cause of malfunctions in SPV systems, presenting opportunities for engineers to improve inverter designs. The efficiency of an inverter is typically represented by the ratio of the output power to the input power, mathematically expressed as:
indicating that the output power is always less that due to inherent system losses. These losses can originate from various sources, such as component resistance, inefficiencies during semiconductor switching, and other imperfections.
-
Battery: A battery bank within HMGSs serves dual purposes: as a power source and for energy storage, balancing power needs over time. Surplus energy from RESs is stored in the batteries, which then provide energy during low RESs output due to adverse weather. Battery size, determined by the autonomy days () and the difference between load demand () and power from RESs (), is calculated using:Where denotes the battery's efficiency and signifies the efficiency of the inverter, with referring to the depth of discharge [17].
2.1.2. Wind energy
It's crucial to recognize that the power output from a wind turbine (p) varies continuously due to changes in wind speed (V) and differing operational scenarios. To accurately calculate the average power output over a specific period, it's necessary to account for these fluctuations by integrating the power equation over that duration. Additionally, a wind turbine's power generation is limited by its maximum rated capacity and the particular wind conditions for which it is designed. The power output from a wind turbine, taking into account the rated wind speed (), the cut-in speed (, and the cut-out speed (, is determined using the following equation:
This formula becomes particularly relevant in calculating the power generation potential under varying wind speeds, from the point where the turbine starts operating ( to the speed beyond which it must stop to avoid damage (, including its optimal performance at the rated speed () [18].
2.1.3. Diesel generator
To accommodate power supply variability from RESs, systems operating off standalone setups or connected to unreliable grids often incorporate batteries for storing surplus energy generated during peak times, available for use during low production periods. However, due to battery constraints like limited capacity and discharge rates, diesel generators present an alternative or supplemental solution, ensuring consistent power supply. The diesel generator's hourly fuel consumption (Gt)
) is calculated using this formula:
where represents hourly fuel consumption, are coefficients for converting fuel to electrical energy, is the generator's rated power, and denotes the electrical energy produced during the hour. This equation helps in optimizing fuel usage in response to fluctuating RESs outputs, enhancing the system's efficiency [17,19].
2.2. Second phase: Decision-making Tools and Investment Metrics for HMGSs
This section outlines the essential metrics for evaluating the economic viability, reliability, sustainability, and investment return of HMGSs. These metrics are pivotal for stakeholders to make informed decisions regarding the implementation and operation of HMGSs.
2.2.1. Decision-making Tools (LCOE, LCC, NPC, LPSP ,RF)
This section focuses on key decision-making tools that offer stakeholders a comprehensive understanding of the cost, reliability, and sustainability of HMGSs:
- Levelized Cost of Energy (LCOE): LCOE represents the average cost per unit of energy produced by a system throughout its lifecycle, incorporating all lifecycle costs. It can be calculated as follows [20]:
- 2.
- Life Cycle Cost (LCC): LCC encompasses the total cost of ownership of the HMGS during its lifespan, including installation, operation, maintenance, and decommissioning costs but excluding system depreciation [21]. The LCC is calculated using the equation:
Where is the initial cost, the annual operation and maintenance costs, are the replacement costs, salvage values, the system's lifetime, and the interest rate per annum.
- 3.
- Net Present Cost (NPC): NPC calculates the present value of all costs and profits associated with the HMGS, offering a net-cost perspective over the system's lifecycle [22].
Where represents annual revenues or savings from operation, distinct from the salvage value.
- 4.
- Loss of Power Supply Pprobability (LPSP): LPSP, defined as the ratio of the total time the system cannot meet the demanded load to the total observation period (often a year), indicates the likelihood of power outages. It may be computed using the generic formula:
- 5.
- Renewable Fraction (RF): RF quantifies the fraction of total energy provided by RESs in the HMGS, a key metric for assessing system sustainability [23].
Here the represents the overall energy production of the HMGS, including both renewable and non-renewable sources.
2.2.2. Investment Metrics (NPV, EPBT, PBP, ROI)
Understanding the financial and environmental impacts is crucial for HMGS and RE system projects.
- Net present value (NPV): calculates the profitability of a project by discounting future cash flows to the present.
Where is net cash inflow-outflows during a single period , is discount rate or the cost of capital, is time in years, and is total number of periods.
- 2.
- Energy Payback Time (EPBT): determines how long a RE system takes to generate energy equal to its energy input over its lifespan. The EPBT formula is as follows:
refers to the overall quantity of energy used in the system's development, installation, and operation, while is the amount of energy generated annually.
- 3.
- Payback Period (PBP) assesses the time it takes for an investment to recoup its value through savings.
- 4.
- Return on Investment (ROI) measures profitability from an investor's perspective.
Here the is the overall financial benefit from the HMGS after subtracting the initial and is operational costs and is the total initial cost of setting up the HMGS [24,25,26]. This comprehensive exploration provides insights into both the environmental and financial viability of HMGS. The complexity of designing HMGS necessitates the use of MOO to balance cost, reliability, and sustainability effectively. The subsequent section will explore MOO approaches in HMGS through a bibliometric analysis, shedding light on key trends and influential research in this multidisciplinary area.
2.3. Third phase: Bibliometric Analysis and Comparative Case Studies
This phase begins by delineating MOO from Single-Objective Optimization (SOO). After establishing this fundamental knowledge, the research further explores the intricacies of bibliometric analysis.
Optimization Overview: Optimization tasks can be broadly classified into two categories: those with a single objective and those with multiple objectives. Let's delve into these concepts:
SOO: In basic terms, SOO focuses on optimizing one specific function. Formally, the objective is to either minimize or maximize , subject to constraints ≤ 0 for and for , where is an , and belongs to the domain Ω.
MOO: MOO involves solving problems with multiple objectives, which often leads to scenarios where enhancing one objective detrimentally influences another, creating a complex situation of trade-offs. Unlike SOO, where the optimal position is clear, MOO requires a relative definition of 'optimal'. A common approach in MOO is to seek the Pareto optimal solution, which, roughly speaking, is a point such that any improvement in one of the objective functions produces a worsening of the others. Thus, MOO is mathematically represented as a problem with multiple objectives, not all of which may be maximized or minimized simultaneously due to inter-objective constraints. The general form of MOO is to 'optimize' , subject to ≤ 0 for and for , where is an element of Ω.
Here, the term 'optimize' is as previously defined; each function represents a unique objective function, where 'n' denotes the total number of objectives, and Ω signifies the feasible region or solution space, as noted in [27]. Figure 6 illustrates the differences between SOO and MOO processes, with a particular emphasis on the selection of a Pareto optimum solution.
The goal of MOO is to optimize solutions across multiple, sometimes conflicting, criteria simultaneously. This approach introduces the concept of Pareto optimality, where a solution is considered Pareto optimum if any further improvement in one objective would necessarily worsen at least one other objective [28]. The collection of all such Pareto optimum solutions forms the Pareto front, also known as the Pareto border. Often, no single solution optimally satisfies all objectives, leading decision-makers to rely on this set of Pareto optimum solutions to make choices based on their preferences or other considerations [29]. MOO is particularly crucial in HMGSs, balancing complex and varied objectives like cost, efficiency, and environmental impact [30,31,32]. As such, MOO strategies are instrumental in navigating the trade-offs inherent in decision-making processes, enabling the integration of cost-effectiveness with sustainability.
2.3.1. Bibliometric analysis
Bibliometric analysis is a popular and effective method for identifying and examining large volumes of scientific data. It enables the exploration of the nuanced evolutionary dynamics of a specific topic and highlights its emerging areas [33]. Figure 8 illustrates the steps of the bibliometric analysis utilized in this study to achieve its objectives through a combined dual analysis approach.
This analysis comprised the following steps: (i) a systematic literature review (SLR) on MOO as applied to MGs integrated with RESs; and (ii) a bibliometric analysis focusing on performance analysis and scientific mapping. The subsequent sections briefly describe each of these phases.
First phase: Systematic literature review (SLR): The literature review structure follows best practices detailed in [33] (see Figure 8) and was conducted through the following steps:
- Problem planning and formulation: This initial step establishes the foundation for the study, involving the framing of research questions, deciding on relevant literature criteria, methods for filtering unrelated findings, and outlining possible conclusions.
- Database(s), keywords, and search string determination: A range of databases was chosen, and a set of important terms identified for searching. Selecting appropriate terms is crucial to encompass varied research while remaining focused on relevant articles.
- Literature selection: At this stage, adherence to the PRISMA guidelines, which pertain to systematic reviews and meta-analyses, ensures the selected articles align with the study's direction [34]. Insights from these articles were systematically extracted.
- Period identification: This step involves considering elements like the topic's depth, existing literature, and its evolution over time.
Second phase: Bibliometric analysis:
Following the SLR, a bibliometric analysis is conducted in the second phase. This combines scientific mapping, describing the conceptual structure and development of the research, with a performance analysis that assesses the impact of citations. The goal is to demonstrate the relationships among authors, documents, and disciplines. The analysis was performed using SciMAT v1.1.049, a tool that involves:
-
Theme identification and strategic diagram: Initially, the software sets up the equivalency index. It then employs a specific methodology to identify the most relevant topics. Subsequently, using the concepts of centrality and density, it strategizes for every theme, illustrating how the core research and related subjects are interconnected. Centrality refers to the degree of influence a theme has over others in the network. Themes with high centrality are vital and positioned on the right side of the diagram. Density analyzes the relationships between terms within a theme to determine its development level. Themes with high density are considered well-developed and placed toward the top of the diagram [35,36,37]. The diagrams, divided into four sections as shown in Figure 9, illustrate the various research topic categories:
- Driving themes: Important and well-understood subjects in the top right, essential for research growth.
- Highly developed and isolated themes: Topics that stand alone and are well-understood, found in the top left, specialized but separate from the main research.
- Evolving or receding themes: Topics in the bottom left that are not fully developed or currently significant. Their importance may increase or decrease in the future.
- Cross-cutting basic themes: Fundamental subjects important to the research but not yet fully developed, occupying the lower right section of the quadrant.
- Thematic Network Creation: This explores relationships between keywords and subjects to refine strategic diagrams. Each network depicted in Figure 9 is named after its principal keyword. The size of the circles indicates the number of associated papers, while the thickness of the links is determined by the equivalence index.
-
Conceptual Connections: The inclusion index [38] illustrates how themes are interconnected over time:
- Overlay Graph: Shows prevalent terms alongside keywords that have been added or removed over time.
- Thematic Evolution Map: Dotted lines represent sub-elements, and solid lines indicate connections to the primary theme. The size of circles and the thickness of lines signify the number of documents and the inclusion index, respectively.
- Evaluation of Performance: Evaluates research contributions using various metrics. It identifies leading subfields based on indicators such as the number of articles, citation counts, and variations in the h-index.
3. Findings and Analysis
The results from the prior sections are detailed and can be viewed in Figure 8, Figure 9, Figure 10, Figure 11, Figure 12, Figure 13 and Figure 14 as well as Table 2, Table 3, Table 4 and Table 5.
3.1. SLR on the application of MOO for HMGSs
This study aims to explore the current landscape of knowledge concerning the MOO of MGs integrated with RESs, herein referred to as HMGSs. To guide this exploration, the investigation was formulated around the following research questions (RQs):
RQ1: How is current research evolving in the selected field?
RQ2: Which core ideas shape this area of study?
RQ3: Which challenges currently persist in this research domain?
RQ4: What are the pivotal moments or crucial issues related to the topic?
RQ5: What topics attract significant focus and discussion?
RQ6: What gaps or shortcomings can be identified in current studies?
RQ7: Which publications or studies are considered seminal in this field?
RQ8: Who are the leading contributors or prolific writers in this sector of research?
This study utilized the SCOPUS database, which houses numerous significant global scientific publications across various fields. The review focused on Microgrids, Renewable Energy Systems, and Multi-Objective Optimization. Keywords were applied to these topics in an advanced SCOPUS search structured as follows: TITLE-ABS-KEY ( "microgrid" OR "micro grid" OR "micro-grid" OR "microgrids" ) AND ( "renewable energy" OR "renewable energy sources" OR "renewable energy systems" OR "hybrid energy" OR "distributed energy resources" OR "hybrid energy systems" OR "hybrid energy sources" OR “hybrid renewable energy system” OR "hybrid power system" ) AND ( "multiobjective optimization" OR "multiobjective optimisation" OR "multi objective optimization" OR "multi objective optimisation" OR "multi-objective optimization" OR "multi-objective optimisation" OR "multi-objective programming" OR "multiobjective programming" OR "vector optimization" OR "multicriteria optimization" OR "multiattribute optimization" OR "Pareto optimization" ). A SLR was conducted following the PRISMA flowchart guidelines depicted in Figure 10.
Initially, 557 bibliographic records were retrieved from the Scopus database. The selection was refined by applying specific exclusion criteria, which led to the removal of 77 records. These criteria included relevance to the research topic, language (with a focus on articles in English), publication date (considering articles published up until 2023), and publication status (excluding articles in press). In the subsequent eligibility phase, book series were excluded due to their format, which resulted in the elimination of an additional 10 sources. This refinement process ensured that the final selection comprised articles directly relevant to the research topic. After the final round of eliminations, 470 pertinent papers remained for analysis.
To study publication trends from 2010–2023, the timeframe was divided into two periods based on the number of selected papers and relevant milestones:
First period (2010–2019): 200 articles. Around this time, the US Department of Energy (DOE) held its first workshop on MG research areas. SPV module prices saw a significant drop, falling below $1 per watt in 2011. The year 2015 was pivotal for RESs, marked by the approval of the United Nations Development Goals (SDGs), specifically target 7.2 of goal 7, and the Paris Climate Conference [39]. The main objective of the Paris Conference was to limit global temperature rises to below 2°C this century, with RE playing a key role.
Second period (2020–2023): 270 articles. During this period, research surged, driven by the urgency to address climate change and reduce reliance on fossil fuels. A notable outcome from the DOE Smart Grid R&D Program workshop was the creation of an MG-focused MOO framework using quantitative metrics and dynamic programming, along with the development of specific design tools and a solutions library by 2020 [8]. Figure 11 shows the distribution over time of 470 publications, revealing consistent growth in this field.
3.2. Bibliometric Analysis: Insights from Science Mapping and Performance Metrics
This section examines various graphical analyses, including strategic diagrams for each period, critical thematic networks, an overlay graph, and a thematic evolution map. Additionally, it assesses the timeline progression of documents, citation counts, top-cited authors, and the overall quality and quantity of the publications.
3.2.1. Strategic diagrams
Figure 12 depicts strategic diagrams for the periods 2010-2019 and 2020-2023 respectively, illustrating the popularity of research subjects based on publication volume.
The size of each circle in the diagram indicates the relative volume of publications for each research theme. Table 2 summarizes the performance measures for each theme and period, including the number of documents, h-index, centrality, density, and publication count. This table provides a quantitative overview of the impact and relevance of each theme within the specified periods.
Now we present a brief overview of these results per time period. First period (2010-2019): The analysis of 200 selected articles yielded 10 research topics, as shown in Figure 12a’s strategic diagram. Three themes—multi-objective optimization, energy management systems, and genetic algorithms—were identified as driving themes, indicating their significance in shaping the field's direction. AC generator-motors and expectancy emerged as well-developed yet isolated themes, highlighting areas of focused but separate research. Monte Carlo techniques and MILP were classified as evolving or receding themes, suggesting areas of diminishing focus or emerging interest, while fuzzy logic and economic optimization were identified as foundational yet underdeveloped areas. A comprehensive performance study, as summarized in Table 2, alongside the strategic diagram's insights, revealed that MOO and energy management systems exhibited superior performance metrics, notably achieving the highest h-index values with over 16,000 citations.
Second period (2020-2023): Analyzing 270 papers from this more recent period yielded 13 research themes, as depicted in Figure 12b’s strategic diagram. This period saw three driving themes—multi-objective optimization, electric power systems, and MILP—indicating continued or emerging importance. Four themes—fuzzy logic, compromise programming, waste heat utilization, and CCHP—were recognized as developed but isolated, reflecting specialized areas of research with limited cross-theme integration. Sustainable development goals and electric vehicles emerged as evolving or receding themes, pointing to shifting research priorities, while wind turbines, reliability, operation optimization, and smart grids were identified as basic yet foundational themes. Notably, MOO and electric power systems stood out in performance measurements, exhibiting superior h-index and citation impact, as detailed in Table 2.
It is worth noting that, over the examined periods, the Mixed Integer Linear Programming (MILP) theme shifted from 'evolving or receding' to a 'driving' theme, suggesting an increase in its significance and centrality. Concurrently, Fuzzy Logic progressed from a 'basic' to a 'developed but isolated' theme, indicating its specialized growth despite limited connection with broader research themes. These transitions illustrate the dynamic nature of research landscapes, emphasizing the importance of tracking topic evolutions to guide future studies. In the context of evolving research approaches, studies such as [40] have MILP to optimize energy management and sizing in HMGS, resulting in significant cost savings and improved resource allocation efficiency. Reference [41] applied MILP to simplify the complexity of energy system scenario analysis, thereby enhancing the manageability and strategic planning of MGs. Reference [42] describes an energy management system for MGs that leverages fuzzy logic for efficient energy dispatch and forecasting. This system adapts to variations in RESs and incorporates expert rules, thereby improving reliability and economic returns.
During the first period, MOO and Genetic Algorithms were prominent; Ref. [43] showed a multi-objective genetic algorithm (MOGA) optimizing system design for size, cost, and availability using high-resolution insolation data, demonstrating a complete techno-economic analysis. Energy management systems were central in the first period, indicating an increasing emphasis on energy efficiency, with ref. [44] developing an optimal management approach for smart-grid sustainability, cost reduction, and carbon emission minimization while incorporating uncertainties and dynamic conditions over a 24-hour cycle. Economic optimization appeared as a basic theme; with ref. [45] identifies optimal HMGS capacities for reduced costs and environmental impact, alongside a strategy cutting diesel use by 12%, emphasizing the economic aspect. MILP and Fuzzy Logic emerged as emerging themes, signaling the start of their path to becoming important methodological tools. Furthermore, the use of Monte Carlo techniques, as noted in [46], indicated the use of probabilistic approaches in system analysis and design, which is critical for dealing with uncertainties in [47].
Moving into the second period, there was a notable shift. MOO remained a significant topic, whereas MILP gained prominence and relevance, becoming a key theme in the research environment. The expanding relevance of Electric Power Systems and Smart Grids, as shown by an emphasis on renewable-rich HMGSs [48], demonstrates the trend toward integrating intelligent technologies for optimal energy distribution while balancing cost, availability, and area limits. Emerging areas like Sustainable Development Goals, Electric Vehicles, and Wind Turbines gained focus, signaling a shift towards sustainable and renewable energy solutions. Since 2022, the movement toward clean energy has increased, as seen by a 55% rise in electric vehicle sales, which have surpassed 10 million [49]. Notably, this includes considering the total cost of ownership for electrifying heavy-duty trucks, a critical aspect of the transportation sector's low-carbon transition [50]. Meanwhile, topics like combined cooling heating and power (CCHP), and Waste-Heat Utilization exhibited a continuous yet concentrated focus on specific energy optimization and recovery techniques, demonstrating a sophisticated approach to RE integration, as evidenced in research sources [35,36,37]. This illustrates a substantial push toward different sources of clean energy, where heat pumps have registered an 11% rise in sales, reaching the 15% growth rate required to fully align with the Net Zero Scenario [53].
Finally, the movement in research subjects from basic methodology to advanced technological applications reflects the field's growing emphasis on sustainability and intelligent energy solutions. The study underscores the significance of flexibility and innovation in solving complex optimization problems, paving the way for future research to enhance the efficiency and resilience of energy systems. This synthesis not only illustrates the field's dynamic nature but also highlights the importance of MOO collaboration in advancing the energy transition.
3.2.2. Thematic networks
To investigate the thematic networks, a key topic was chosen for each period to examine its relationships with other subjects, revealing the underlying themes associated with the main theme. Consequently, ‘MOO’ (see Figure 13a) and 'Electric Power Systems' (see Figure 13b) were selected as the driving themes from the first and second periods, respectively.
The analysis of Figure 13a highlights MOO's essential function within MGs, emphasizing its strong linkages to 'Microgrid,' 'Renewable Energy Resources,' and 'Electric Load,' which underscores MOO's crucial role in balancing objectives such as matching energy supply with user demand, smoothly integrating RE into the grid, and enhancing MG operations' efficiency and effectiveness. Conversely, Figure 13b highlights the 'Electric Power Systems' theme and its intricate connections with pivotal algorithms in MOO, such as the 'Genetic Algorithm' and 'Multi-Objective Particle Swarm Optimization'. These connections emphasize the critical role of advanced algorithms in elevating the efficiency of electric power networks, especially concerning RE integration and demand management. It delves into 'control systems,' 'energy management systems,' and 'demand response programs,' underscoring the importance of these areas in the broader context of electric power systems optimization. The significant preference for meta-heuristic methods, particularly Genetic Algorithms (57.8%) in optimization, not only highlights their broad applicability but also showcases the power of meta-heuristic methods in addressing complex challenges within the energy sector, notably in optimizing energy consumption in trains [54].
This dual analysis allows us to compare the evolving focus from MOO's application within MGs to the broader challenges of integrating advanced algorithms for optimizing electric power systems. The visualizations also underscore key operational, financial, and efficiency concerns in both periods, from 'Levelized Cost' and 'Sizing' to 'Emission' and 'Environmental Impact,' reflecting the sector's shift towards not only technical and operational efficiency but also environmental and economic sustainability.
3.2.3. Graphical overlay and the evolution of theme mapping
Figure 14 shows two critical aspects of our analysis: part (a) presents an overlay graph depicting the evolution of keywords over the study periods, while part (b) illustrates a thematic evolution map that outlines the shifts and relationships within the research themes.
Figure 14a depicts the changing quantity and content of keywords over the years. The number of keywords increased from 726 to 890 during the first and second periods, demonstrating a growth rate. Out of 726 keywords found in the first period, 27% (196 keywords) were maintained in the second period. In addition, 694 additional keywords were added, bringing the total to 890 keywords during the later period. The results show that there has been a significant introduction of new and transitional keywords, as well as an overall growth in the keyword count over time. These patterns show that the area of study is becoming more thematically diverse. The recurrence of certain phrases in subsequent periods indicates that this emerging study subject is increasingly being normalized.
The thematic evolution map (Figure 14b) emphasizes the evolving nature of the research landscape. The MOO node's prominent placement and size reflect a large concentration of investigations and an extensive range of publications in this field, highlighting its ongoing significance and progress within the HMGS domain. Thematic shifts from 'Energy Management Systems,' 'Genetic Algorithm,' and 'Economic Optimization' in the first period to 'Electric Power Systems' in the second period indicate a move toward integrating these fundamental concepts into a larger framework of power systems. This demonstrates a growing area in which theoretical models are increasingly being applied to real-world energy systems. The map also shows 'Economic Optimization' branching into themes like 'MILP,' 'Operation Optimization,' and 'Reliability' in the second period, showing the sector's emphasis on operational efficiency, advanced modeling, and reliability of systems. 'MILP' additionally evolves to 'CCHP,' 'Wind Turbine,' and 'Smart Grid,' indicating its analytical importance in optimizing complex energy systems and incorporating renewable technology.
Notably, in the first period, 'Fuzzy Logic' connects with itself and progresses to 'Wind Turbine,' 'Reliability,' and 'Sustainable Development Goals' in the second period, demonstrating its use in mitigating uncertainty in RESs [55], enhancing system dependability, and contributing to sustainability goals. This relevance extends to addressing the complexity of power system outages through innovative strategies like the N-K events scale reduction technique and fuzzy zero-violation clustering for optimizing directional overcurrent relays (DOCRs) [56]. It is worth noting that four topics from the first period migrate to 'Reliability' and three others to 'Electric Power Systems' in the second phase. This trend reflects a research environment in which power system dependability is becoming more important, driven by the integration of varied energy sources and the need for strong power system infrastructures [57].
Overall, the map depicts a field undergoing significant transformation, with MOO and other modeling techniques being employed to tackle novel challenges in power systems. The clearly strong thematic connections and the increasing focus of research underscore a sector on the cusp of innovation. This sector is increasingly driven by concerns for sustainability and economic efficiency, spurred by the need to integrate a variety of RESs into reliable and efficient power systems.
3.2.4. Evaluation of Performance
This study analyzed 245 journals. Table 3 displays the top 10 journals, which contributed 151 papers and accounted for 32.13% of the total documents evaluated.
Additionally, the table displays the most cited document from each journal. These top-cited publications predominantly discuss the development of MGs optimization and management methods, with a focus on the proper integration of RESs. Key concerns highlighted include increasing energy efficiency, ensuring reliability amidst uncertainties (such as fluctuations in wind and SPV), and balancing environmental and economic objectives within MGs operations.
The SLR conducted for this investigation identified 1,369 authors who have contributed to the examined topic, as shown in Table 4.
The above table lists authors who have published more than five articles, along with their total number of citations and h-index, an indicator assessing an author's influence and quality based on the frequency with which their research is cited. The articles primarily discuss energy storage management, control techniques, and the optimization of MG operations under uncertainty, with an emphasis on MOO approaches that balance technical, economic, and environmental considerations.
The SLR concluded by finding the most cited papers within the area of the review. Out of the 470 documents analyzed, a total of 12,989 citations were recorded. The top ten most-cited papers, which are detailed in Table 5 and account for 3,384 citations, or 26% of the total citations observed, largely address the optimization and efficient energy management of MGs employing MOO methods, with an emphasis on the integration of RESs and HRESs. Critical topics explored include optimal size, economic dispatch, and the creation of powerful algorithms for boosting the sustainability and reliability of MG operations.
4. Comparative Analysis of MOO in HMGs: Evaluating Techniques and Algorithms for Enhanced Performance and Sustainability
Table 6 presents a comprehensive review of the evolution in MOO techniques applied to HMGSs spanning from 2010 to 2023. The table is divided into two distinct periods, each characterized by different sets of challenges and technological advancements.
The research in MG and HMGs optimization has evolved significantly from 2010 to 2023. In the earlier period (2010-2019), the focus was predominantly on managing uncertainties inherent in RESs and load demands. Studies, such as Ref. [80], utilized algorithms like MOCE, which proved effective in MOO problems. This period was characterized by a variety of optimization techniques including GA, MOPSO, MBFO, PSO, and DE, each aiming to balance economic and environmental objectives. A common theme was the integration of RESs SPV and WT to minimize operational costs and emissions. Additionally, the initial adoption of advanced computational algorithms was observed, reflecting an early stage of complexity in MG optimization.
Contrastingly, the period from 2020 to 2023 witnessed the introduction of more sophisticated computational techniques such as MOPSO, TOPSIS, MOSSA, and BAS-ABC. These methods were employed for more comprehensive analyses, encompassing economic, environmental, and sustainability aspects. A notable shift towards sustainability and alignment with Sustainable Development Goals (SDGs) was evident, with studies like Ref. [89] using TOPSIS alongside SDG goals for a 100% renewable configuration. This period also expanded the scope of MG applications to various geographical regions and included novel technologies like Power-to-Gas (P2G), Solid Oxide Fuel Cell/Gas Turbine (SOFC/GT) hybrids, and Hydrogen Storage. The ongoing focus on balancing economic efficiency with environmental friendliness continued, utilizing algorithms like MOGA and MOCS. Overall, the progression from 2010 to 2023 in MG optimization research reflects a significant transition. Early research laid the groundwork with foundational methods and objectives, while later studies embraced com`plexity, sustainability, and broader scope, mirroring the global trend towards sustainable and efficient energy solutions. This evolution showcases the growing sophistication and diversity in approaches to optimizing microgrid systems, reflecting both technological advancements and a heightened emphasis on sustainability.
5. Conclusion
Diversifying energy sources has become essential in addressing global challenges, making the integration of renewable energy into hybrid microgrids (HMGSs) a crucial and efficient alternative. This study reviews the economic and reliability metrics of HMGSs and further investigates developments in microgrids (MGs), renewable energy (RE), and their multi-objective optimization (MOO). Utilizing SciMAT bibliometric analysis of literature from 2010 to 2023, sourced from Scopus, the study identifies trends through an overview and a detailed analysis of two distinct periods: 2010-2019 and 2020-2023.
From 2010 to 2019, 200 research articles were published, which increased by 35% to 270 papers between 2020 and 2023. This surge in publication output underscores the critical role of initiatives like the Department of Energy's Microgrid Initiative in steering research towards the development of more sophisticated and efficient microgrid technologies that align with global renewable energy and climate change mitigation goals. Strategic diagrams were employed to assess the evolution of this research topic, indicating a significant shift from the first period's focus on MOO and energy management systems towards a rising emphasis on advanced, eco-friendly, and intelligent energy management solutions. The second stage highlighted MOO's strategic importance in balancing competing objectives such as cost, efficiency, and environmental impact, with predominant themes being MOO and electric power systems. This shift mirrors the global movement towards sustainable and efficient energy solutions and broader efforts to integrate renewable energy sources and combat climate change. Analysis of keyword overlap and thematic evolution maps by period demonstrated remarkable progress in developing new and transitional keywords, showcasing the continual evolution of research in this field. Thematic networks and strategic diagrams revealed a marked increase in research activity, particularly in employing Artificial Intelligence (AI) for optimization, with methods like genetic algorithms, particle swarm optimization, and fuzzy logic gaining prominence. The study also underscored significant challenges addressed by researchers, such as economic sizing, environmental concerns, energy management systems, and investment issues, indicating a shift towards more complex, sustainable, and intelligent energy management systems.
Despite recent progress, challenges such as high battery storage costs, data reliability requirements, and managing the intermittency of renewable sources persist. Future research should focus on scalable HMGS designs, cost-effective storage solutions, and improved data analytics for MOO. Leveraging AI to optimize HMGSs will be paramount in addressing energy management challenges. Building on this study's findings, researchers are encouraged to foster adaptation, collaboration, and innovation, which will significantly contribute to the development of robust, resilient, and sustainable energy systems.
Funding
This work is supported by Grant C-ING-288-UGR23 funded by Consejería de Universidad, Investigación e Innovación and by ERDF Andalusia Program 2021-2027.
References
- I. Renewable Energy Agency and G. Renewables Alliance, “Global Renewables Alliance TRIPLING RENEWABLE POWER AND DOUBLING ENERGY EFFICIENCY BY 2030 CRUCIAL STEPS TOWARDS 1.5°C 3 2 0 0,” Accessed: Nov. 14, 2023. [Online]. Available: www.globalrenewablesalliance.org/.
- Z. Z. Stanković et al., “The Volatility Dynamics of Prices in the European Power Markets during the COVID-19 Pandemic Period,” Sustain. 2024, Vol. 16, Page 2426, vol. 16, no. 6, p. 2426, Mar. 2024. [CrossRef]
- I. - International Energy Agency, “World Energy Outlook 2023,” 2023, Accessed: Nov. 14, 2023. [Online]. Available: www.iea.org/terms.
- P. Paliwal, N. P. Patidar, and R. K. Nema, “Planning of grid integrated distributed generators: A review of technology, objectives and techniques,” Renew. Sustain. Energy Rev., vol. 40, pp. 557–570, Dec. 2014. [CrossRef]
- M. K. Deshmukh and S. S. Deshmukh, “Modeling of hybrid renewable energy systems,” Renew. Sustain. Energy Rev., vol. 12, pp. 235–249, 2008. [CrossRef]
- K. Shivarama Krishna and K. Sathish Kumar, “A review on hybrid renewable energy systems,” Renew. Sustain. Energy Rev., vol. 52, pp. 907–916, Dec. 2015. [CrossRef]
- R. Hemmati and H. Saboori, “Emergence of hybrid energy storage systems in renewable energy and transport applications – A review,” Renew. Sustain. Energy Rev., vol. 65, pp. 11–23, Nov. 2016. [CrossRef]
- D. T. Ton and M. A. Smith, “The U.S. Department of Energy’s Microgrid Initiative,” Electr. J., vol. 25, no. 8, pp. 84–94, 2012. [CrossRef]
- M. F. Zia, E. Elbouchikhi, and M. Benbouzid, “Microgrids energy management systems: A critical review on methods, solutions, and prospects,” Appl. Energy, vol. 222, pp. 1033–1055, Jul. 2018. [CrossRef]
- P. Jha, N. Sharma, V. K. Jadoun, A. Agarwal, and A. Tomar, “Optimal scheduling of a microgrid using AI techniques,” Control Standalone Microgrid, pp. 297–336, Jan. 2021. [CrossRef]
- K. Arar Tahir, M. Zamorano, and J. Ordóñez García, “Scientific mapping of optimisation applied to microgrids integrated with renewable energy systems,” Int. J. Electr. Power Energy Syst., vol. 145, Feb. 2023. [CrossRef]
- A. Kaabeche, M. Belhamel, and R. Ibtiouen, “Sizing optimization of grid-independent hybrid photovoltaic/wind power generation system,” Energy, vol. 36, no. 2, pp. 1214–1222, Feb. 2011. [CrossRef]
- Y. J. Li, D. W. Yue, H. X. Liu, and Y. F. Liu, “Wind-solar complementary power inverter based on intelligent control,” 2009 4th IEEE Conf. Ind. Electron. Appl. ICIEA 2009, pp. 3635–3638, 2009. [CrossRef]
- A. Cagnano, E. De Tuglie, and P. Mancarella, “Microgrids: Overview and guidelines for practical implementations and operation,” Appl. Energy, vol. 258, p. 114039, Jan. 2020. [CrossRef]
- L. Fusheng, L. Ruisheng, and Z. Fengquan, “Microgrid technology and engineering application,” Microgrid Technol. Eng. Appl., pp. 1–198, Jan. 2015. [CrossRef]
- S. Sumathi, L. Ashok Kumar, P.Surekha, “Solar Photovoltaic & Wind Energy Conversion Systems.” p. 807, 2015, [Online]. Available: internal-pdf://0380800788/Solar PV & Wind E Conversion Systems 2015.pdf.
- M. Azaza and F. Wallin, “Multi objective particle swarm optimization of hybrid micro-grid system: A case study in Sweden,” Energy, vol. 123, pp. 108–118, Mar. 2017. [CrossRef]
- L. Wang and C. Singh, “PSO-based multi-criteria optimum design of a grid-connected hybrid power system with multiple renewable sources of energy,” Proc. 2007 IEEE Swarm Intell. Symp. SIS 2007, pp. 250–257, 2007. [CrossRef]
- M. Ashari and C. V Nayar, “AN OPTIMUM DISPATCH STRATEGY USING SET POINTS FOR A PHOTOVOLTAIC (PV)-DIESEL-BATTERY HYBRID POWER SYSTEM †,” vol. 66, no. 1, pp. 1–9, 1999, Accessed: Mar. 10, 2024. [Online]. Available: www.elsevier.com/locate/solener.
- M. Bruck and P. Sandborn, “Pricing bundled renewable energy credits using a modified LCOE for power purchase agreements,” Renew. Energy, vol. 170, pp. 224–235, Jun. 2021. [CrossRef]
- T. Ma, H. Yang, and L. Lu, “Study on stand-alone power supply options for an isolated community,” Int. J. Electr. Power Energy Syst., vol. 65, pp. 1–11, Feb. 2015. [CrossRef]
- C. T. Tsai, T. M. Beza, E. M. Molla, and C. C. Kuo, “Analysis and Sizing of Mini-Grid Hybrid Renewable Energy System for Islands,” IEEE Access, vol. 8, pp. 70013–70029, 2020. [CrossRef]
- A. Hiendro, I. Yusuf, F. Trias, P. Wigyarianto, H. Kho, and J. Khwee, “Optimum Renewable Fraction for Grid-connected Photovoltaic in Office Building Energy Systems in Indonesia,” Int. J. Power Electron. Drive Syst., vol. 9, no. 4, pp. 1866–1874, Dec. 2018. [CrossRef]
- D. J. Murphy and C. A. S. Hall, “Year in review-EROI or energy return on (energy) invested,” Ann. N. Y. Acad. Sci., vol. 1185, pp. 102–118, 2010. [CrossRef]
- C. A. S. Hall, J. G. Lambert, and S. B. Balogh, “EROI of different fuels and the implications for society,” Energy Policy, vol. 64, pp. 141–152, Jan. 2014. [CrossRef]
- “Payback - Energy Education.” https://energyeducation.ca/encyclopedia/Payback (accessed Feb. 19, 2024).
- K. Deb, “Multi-Objective Optimization Using Evolutionary Algorithms: An Introduction,” 2011, Accessed: Oct. 29, 2023. [Online]. Available: http://www.iitk.ac.in/kangal/deb.htm.
- H. Y. Alhammadi and J. A. Romagnoli, “Process design and operation: Incorporating environmental, profitability, heat integration and controllability considerations,” Comput. Aided Chem. Eng., vol. 17, no. C, pp. 264–305, Jan. 2004. [CrossRef]
- Z. N. Pintarič and Z. Kravanja, “Suitable Process Modelling for Proper Multi-Objective Optimization of Process Flow Sheets,” Comput. Aided Chem. Eng., vol. 33, pp. 1387–1392, Jan. 2014. [CrossRef]
- M. A. M. Ramli, H. R. E. H. Bouchekara, and A. S. Alghamdi, “Optimal sizing of PV/wind/diesel hybrid microgrid system using multi-objective self-adaptive differential evolution algorithm,” Renew. Energy, vol. 121, pp. 400–411, Jun. 2018. [CrossRef]
- T. Niknam, R. Azizipanah-Abarghooee, and M. R. Narimani, “An efficient scenario-based stochastic programming framework for multi-objective optimal micro-grid operation,” Appl. Energy, vol. 99, pp. 455–470, Nov. 2012. [CrossRef]
- A. Chaouachi, R. M. Kamel, R. Andoulsi, and K. Nagasaka, “Multiobjective Intelligent Energy Management for a Microgrid,” IEEE Trans. Ind. Electron., vol. 60, no. 4, 2013. [CrossRef]
- N. Donthu, S. Kumar, D. Mukherjee, N. Pandey, and W. M. Lim, “How to conduct a bibliometric analysis: An overview and guidelines,” J. Bus. Res., vol. 133, pp. 285–296, Sep. 2021. [CrossRef]
- A. Liberati et al., “The PRISMA statement for reporting systematic reviews and meta-analyses of studies that evaluate healthcare interventions: explanation and elaboration,” BMJ, vol. 339, Jul. 2009. [CrossRef]
- M. A. Martínez, M. J. Cobo, M. Herrera, and E. Herrera-Viedma, “Analyzing the Scientific Evolution of Social Work Using Science Mapping:”. vol. 25, no. 2, pp. 257–277, Feb. 2014. [CrossRef]
- M. J. Cobo, A. G. López-Herrera, E. Herrera-Viedma, and F. Herrera, “An approach for detecting, quantifying, and visualizing the evolution of a research field: A practical application to the Fuzzy Sets Theory field,” J. Informetr., vol. 5, no. 1, pp. 146–166, Jan. 2011. [CrossRef]
- M. Callon, J. P. Courtial, and F. Laville, “Co-word analysis as a tool for describing the network of interactions between basic and technological research: The case of polymer chemsitry,” Sci. 1991 221, vol. 22, no. 1, pp. 155–205, Sep. 1991. [CrossRef]
- C. Díaz-López, M. Carpio, M. Martín-Morales, and M. Zamorano, “Analysis of the scientific evolution of sustainable building assessment methods,” Sustain. Cities Soc., vol. 49, p. 101610, Aug. 2019. [CrossRef]
- “SDG Indicators — SDG Indicators.” https://unstats.un.org/sdgs/metadata/ (accessed Mar. 14, 2024).
- E. Naderi, A. Dejamkhooy, S. J. Seyedshenava, and H. Shayeghi, “MILP based Optimal Design of Hybrid Microgrid by Considering Statistical Wind Estimation and Demand Response,” J. Oper. Autom. Power Eng., vol. 10, no. 1, pp. 54–65, Apr. 2022. [CrossRef]
- H. Karimi and S. Jadid, “Optimal energy management for multi-microgrid considering demand response programs: A stochastic multi-objective framework,” Energy, vol. 195, p. 116992, Mar. 2020. [CrossRef]
- F. J. Vivas et al., “Multi-Objective Fuzzy Logic-Based Energy Management System for Microgrids with Battery and Hydrogen Energy Storage System,” Electron. 2020, Vol. 9, Page 1074, vol. 9, no. 7, p. 1074, Jun. 2020. [CrossRef]
- M. B. Shadmand and R. S. Balog, “Multi-objective optimization and design of photovoltaic-wind hybrid system for community smart DC microgrid,” IEEE Trans. Smart Grid, vol. 5, no. 5, pp. 2635–2643, Sep. 2014. [CrossRef]
- E. R. Sanseverino, M. L. Di Silvestre, M. G. Ippolito, A. De Paola, and G. Lo Re, “An execution, monitoring and replanning approach for optimal energy management in microgrids,” Energy, vol. 36, no. 5, pp. 3429–3436, 11. 20 May. [CrossRef]
- R. Ghasemi, M. Wosnik, D. L. Foster, and W. Mo, “Multi-Objective Decision-Making for an Island Microgrid in the Gulf of Maine,” Sustain., vol. 15, no. 18, p. 13900, Sep. 2023. [CrossRef]
- B. Lokeshgupta and S. Sivasubramani, “Optimal operation of a residential microgrid with demand side management,” Proc. 2019 IEEE PES Innov. Smart Grid Technol. Eur. ISGT-Europe 2019, Sep. 2019. [CrossRef]
- H. Haddadian and R. Noroozian, “Multi-Microgrid-Based Operation of Active Distribution Networks Considering Demand Response Programs,” IEEE Trans. Sustain. Energy, vol. 10, no. 4, pp. 1804–1812, Oct. 2019. [CrossRef]
- P. V. N. M. Krishna and P. C. Sekhar, “Area Constrained Optimal Planning Model of Renewable-Rich Hybrid Microgrid,” IEEE Access, vol. 11, pp. 70873–70883, 2023. [CrossRef]
- “Tracking Clean Energy Progress 2023 – Analysis - IEA.” https://www.iea.org/reports/tracking-clean-energy-progress-2023 (accessed Feb. 15, 2024).
- Z. Mu, F. Zhao, F. Bai, Z. Liu, and H. Hao, “Evaluating Fuel Cell vs. Battery Electric Trucks: Economic Perspectives in Alignment with China’s Carbon Neutrality Target,” Sustain. 2024, Vol. 16, Page 2427, vol. 16, no. 6, p. 2427, Mar. 2024. [CrossRef]
- S. Momen, J. Nikoukar, and M. Gandomkar, “Multi-objective Optimization of Energy Consumption in Microgrids Considering CHPs and Renewables Using Improved Shuffled Frog Leaping Algorithm,” J. Electr. Eng. Technol., vol. 18, no. 3, pp. 1539–1555, May 2023. [CrossRef]
- Y. Li, J. Huang, Y. Liu, H. Wang, Y. Wang, and X. Ai, “A Multicriteria Optimal Operation Framework for a Data Center Microgrid Considering Renewable Energy and Waste Heat Recovery: Use of Balanced Decision Making,” IEEE Ind. Appl. Mag., vol. 29, no. 4, pp. 23–38, Jul. 2023. [CrossRef]
- “Heat Pumps - Energy System - IEA.” https://www.iea.org/energy-system/buildings/heat-pumps#tracking (accessed Feb. 15, 2024).
- P. Martínez Fernández, I. Villalba Sanchís, V. Yepes, and R. Insa Franco, “A review of modelling and optimisation methods applied to railways energy consumption,” J. Clean. Prod., vol. 222, pp. 153–162, Jun. 2019. [CrossRef]
- G. R. Aghajani, H. A. Shayanfar, and H. Shayeghi, “Presenting a multi-objective generation scheduling model for pricing demand response rate in micro-grid energy management,” Energy Convers. Manag., vol. 106, pp. 308–321, Dec. 2015. [CrossRef]
- H. K. Zand, K. Mazlumi, A. Bagheri, and H. Hashemi-Dezaki, “Optimal Protection Scheme for Enhancing AC Microgrids Stability against Cascading Outages by Utilizing Events Scale Reduction Technique and Fuzzy Zero-Violation Clustering Algorithm,” Sustain. 2023, Vol. 15, Page 15550, vol. 15, no. 21, p. 15550, Nov. 2023. [CrossRef]
- E. L. V. Eriksson and E. M. A. Gray, “Optimization and integration of hybrid renewable energy hydrogen fuel cell energy systems – A critical review,” Appl. Energy, vol. 202, pp. 348–364, Sep. 2017. [CrossRef]
- A. A. Moghaddam, A. Seifi, T. Niknam, and M. R. Alizadeh Pahlavani, “Multi-objective operation management of a renewable MG (micro-grid) with back-up micro-turbine/fuel cell/battery hybrid power source,” Energy, vol. 36, no. 11, pp. 6490–6507, Nov. 2011. [CrossRef]
- X. Wu, W. Cao, D. Wang, and M. Ding, “A Multi-Objective Optimization Dispatch Method for Microgrid Energy Management Considering the Power Loss of Converters,” Energies 2019, Vol. 12, Page 2160, vol. 12, no. 11, p. 2160, Jun. 2019. [CrossRef]
- N. Salehi, H. Martinez-Garcia, G. Velasco-Quesada, and J. M. Guerrero, “A Comprehensive Review of Control Strategies and Optimization Methods for Individual and Community Microgrids,” IEEE Access, vol. 10, pp. 15935–15955, 2022. [CrossRef]
- M. H. Moradi, M. Abedini, S. M. R. Tousi, and S. M. Hosseinian, “Optimal siting and sizing of renewable energy sources and charging stations simultaneously based on Differential Evolution algorithm,” Int. J. Electr. Power Energy Syst., vol. 73, pp. 1015–1024, Dec. 2015. [CrossRef]
- S. A. Mansouri, A. Ahmarinejad, E. Nematbakhsh, M. S. Javadi, A. R. Jordehi, and J. P. S. Catalão, “Energy management in microgrids including smart homes: A multi-objective approach,” Sustain. Cities Soc., vol. 69, p. 102852, Jun. 2021. [CrossRef]
- M. Motevasel and A. R. Seifi, “Expert energy management of a micro-grid considering wind energy uncertainty,” Energy Convers. Manag., vol. 83, pp. 58–72, Jul. 2014. [CrossRef]
- A. Rezvani, M. Gandomkar, M. Izadbakhsh, and A. Ahmadi, “Environmental/economic scheduling of a micro-grid with renewable energy resources,” J. Clean. Prod., vol. 87, no. 1, pp. 216–226, Jan. 2015. [CrossRef]
- F. S. Gazijahani and J. Salehi, “Stochastic multi-objective framework for optimal dynamic planning of interconnected microgrids,” IET Renew. Power Gener., vol. 11, no. 14, pp. 1749–1759, Dec. 2017. [CrossRef]
- R. Das et al., “Multi-objective techno-economic-environmental optimisation of electric vehicle for energy services,” Appl. Energy, vol. 257, p. 113965, Jan. 2020. [CrossRef]
- S. Fang, Y. Xu, Z. Li, T. Zhao, and H. Wang, “Two-Step Multi-Objective Management of Hybrid Energy Storage System in All-Electric Ship Microgrids,” IEEE Trans. Veh. Technol., vol. 68, no. 4, pp. 3361–3373, Apr. 2019. [CrossRef]
- A. M. Hemeida et al., “Multi-objective multi-verse optimization of renewable energy sources-based micro-grid system: Real case,” Ain Shams Eng. J., vol. 13, no. 1, p. 101543, Jan. 2022. [CrossRef]
- M. De, G. Das, and K. K. Mandal, “An effective energy flow management in grid-connected solar–wind-microgrid system incorporating economic and environmental generation scheduling using a meta-dynamic approach-based multiobjective flower pollination algorithm,” Energy Reports, vol. 7, pp. 2711–2726, Nov. 2021. [CrossRef]
- Y. Li et al., “Flexible Scheduling of Microgrid with Uncertainties Considering Expectation and Robustness,” IEEE Trans. Ind. Appl., vol. 54, no. 4, pp. 3009–3018, Jul. 2018. [CrossRef]
- P. Xie, Z. Cai, P. Liu, X. Li, Y. Zhang, and D. Xu, “Microgrid System Energy Storage Capacity Optimization Considering Multiple Time Scale Uncertainty Coupling,” IEEE Trans. Smart Grid, vol. 10, no. 5, pp. 5234–5245, Sep. 2018. [CrossRef]
- L. Xiong, P. Li, Z. Wang, and J. Wang, “Multi-agent based multi objective renewable energy management for diversified community power consumers,” Appl. Energy, vol. 259, p. 114140, Feb. 2020. [CrossRef]
- G. Graditi, M. L. Di Silvestre, R. Gallea, and E. R. Sanseverino, “Heuristic-based shiftable loads optimal management in smart micro-grids,” IEEE Trans. Ind. Informatics, vol. 11, no. 1, pp. 271–280, Feb. 2015. [CrossRef]
- B. Yan et al., “A Novel, Stable, and Economic Power Sharing Scheme for an Autonomous Microgrid in the Energy Internet,” Energies 2015, Vol. 8, Pages 12741-12764, vol. 8, no. 11, pp. 12741–12764, Nov. 2015. [CrossRef]
- A. Chaouachi, R. M. Kamel, R. Andoulsi, and K. Nagasaka, “Multiobjective intelligent energy management for a microgrid,” IEEE Trans. Ind. Electron., vol. 60, no. 4, pp. 1688–1699, 2013. [CrossRef]
- G. Aghajani and N. Ghadimi, “Multi-objective energy management in a micro-grid,” Energy Reports, vol. 4, pp. 218–225, Nov. 2018. [CrossRef]
- H. Borhanazad, S. Mekhilef, V. Gounder Ganapathy, M. Modiri-Delshad, and A. Mirtaheri, “Optimization of micro-grid system using MOPSO,” Renew. Energy, vol. 71, pp. 295–306, 2014. [CrossRef]
- A. K. Basu, A. Bhattacharya, S. Chowdhury, and S. P. Chowdhury, “Planned scheduling for economic power sharing in a CHP-based micro-grid,” IEEE Trans. Power Syst., vol. 27, no. 1, pp. 30–38, Feb. 2012. [CrossRef]
- M. Nazari-Heris, S. Abapour, and B. Mohammadi-Ivatloo, “Optimal economic dispatch of FC-CHP based heat and power micro-grids,” Appl. Therm. Eng., vol. 114, pp. 756–769, Mar. 2017. [CrossRef]
- L. Wang, Q. Li, R. Ding, M. Sun, and G. Wang, “Integrated scheduling of energy supply and demand in microgrids under uncertainty: A robust multi-objective optimization approach,” Energy, vol. 130, pp. 1–14, Jul. 2017. [CrossRef]
- H. Jahangir, A. Ahmadian, and M. A. Golkar, “Multi-objective sizing of grid-connected micro-grid using Pareto front solutions,” Proc. 2015 IEEE Innov. Smart Grid Technol. - Asia, ISGT ASIA 2015, pp. 1–6, 2016. [CrossRef]
- H. Borhanazad, S. Mekhilef, V. Gounder Ganapathy, M. Modiri-Delshad, and A. Mirtaheri, “Optimization of micro-grid system using MOPSO,” Renew. Energy, vol. 71, pp. 295–306, Nov. 2014. [CrossRef]
- M. Motevasel, A. R. Seifi, and T. Niknam, “Multi-objective energy management of CHP (combined heat and power)-based micro-grid,” Energy, vol. 51, pp. 123–136, Mar. 2013. [CrossRef]
- H. Kanchev, D. Lu, B. Francois, and V. Lazarov, “Smart monitoring of a microgrid including gas turbines and a dispatched PV-based active generator for energy management and emissions reduction,” IEEE PES Innov. Smart Grid Technol. Conf. Eur. ISGT Eur., 2010. [CrossRef]
- C. Roldán-Blay, G. Escrivá-Escrivá, C. Roldán-Porta, and D. Dasí-Crespo, “Optimal sizing and design of renewable power plants in rural microgrids using multi-objective particle swarm optimization and branch and bound methods,” Energy, vol. 284, p. 129318, Dec. 2023. [CrossRef]
- Z. Belboul et al., “Multiobjective Optimization of a Hybrid PV/Wind/Battery/Diesel Generator System Integrated in Microgrid: A Case Study in Djelfa, Algeria,” Energies 2022, Vol. 15, Page 3579, vol. 15, no. 10, p. 3579, May 2022. [CrossRef]
- J. N. Shan and R. X. Lu, “Multi-objective economic optimization scheduling of CCHP micro-grid based on improved bee colony algorithm considering the selection of hybrid energy storage system,” Energy Reports, vol. 7, pp. 326–341, Nov. 2021. [CrossRef]
- X. Ding, W. Sun, G. P. Harrison, X. Lv, and Y. Weng, “Multi-objective optimization for an integrated renewable, power-to-gas and solid oxide fuel cell/gas turbine hybrid system in microgrid,” Energy, vol. 213, p. 118804, 2020. [CrossRef]
- J. Wu, Z. Qi, F. Yang, and X. Li, “The Multi-Objective Optimal Configuration of Wind-PV-Battery Microgrid,” Proc. - 2020 Chinese Autom. Congr. CAC 2020, pp. 5585–5590, 2020. [CrossRef]
Figure 1.
Share of electricity production by source from 2000-2028 [3].
Figure 1.
Share of electricity production by source from 2000-2028 [3].
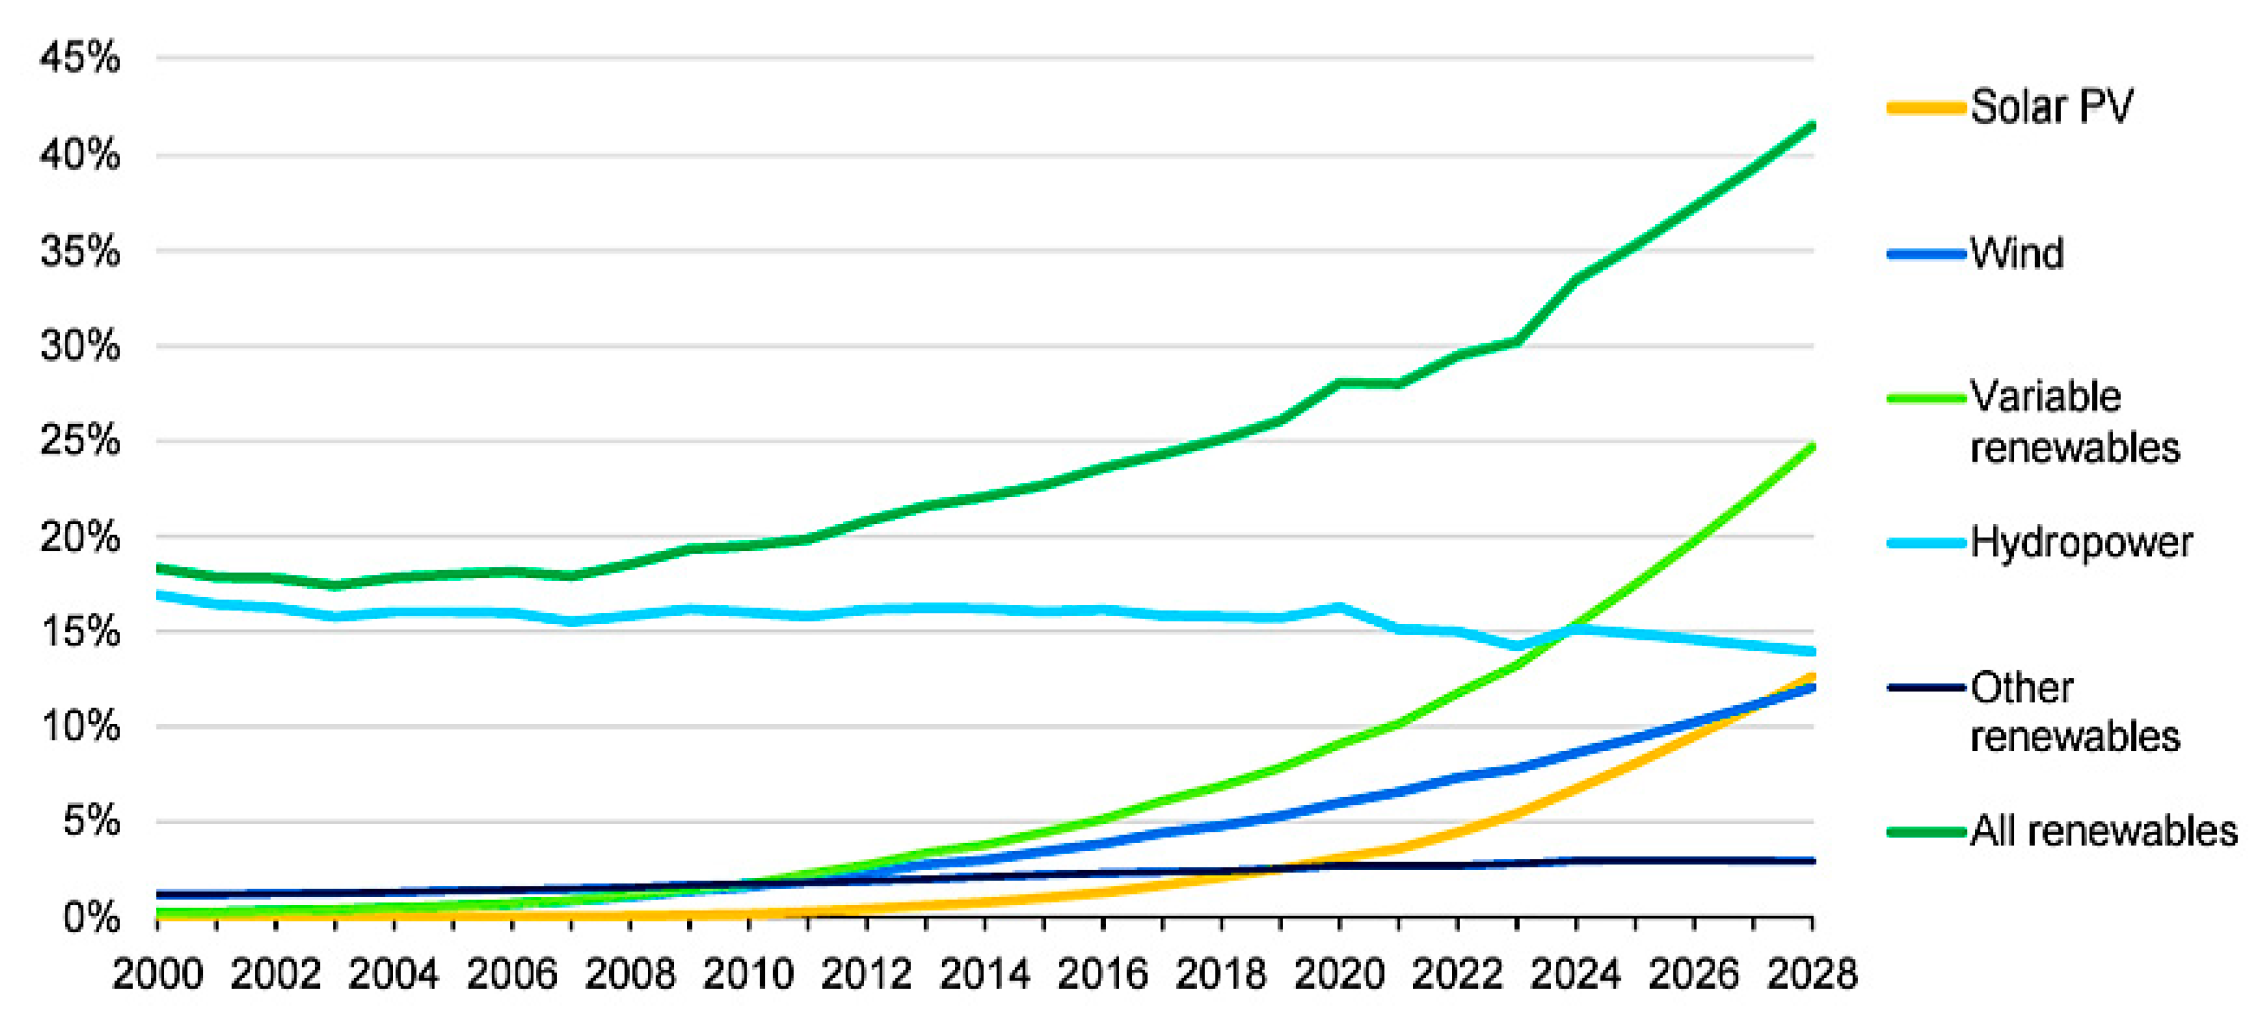
Figure 2.
The methodological framework of the research on HMGS optimization.
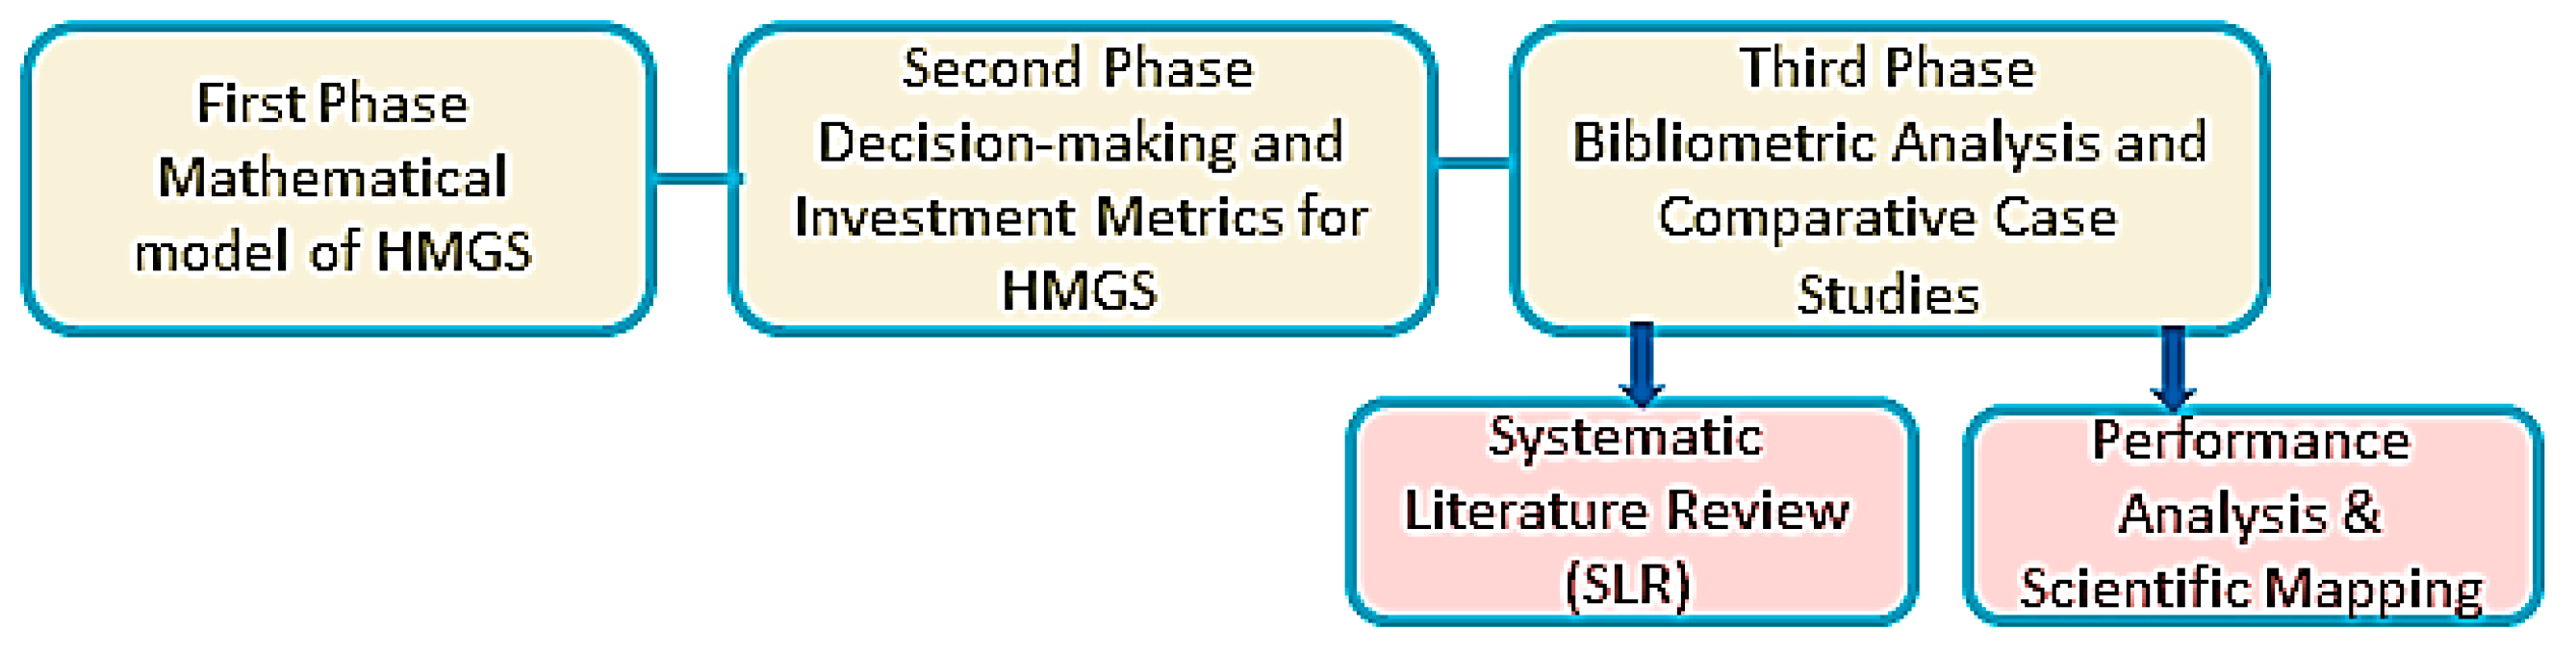
Figure 3.
Categorization of microgrids by demand, type, and capacity.
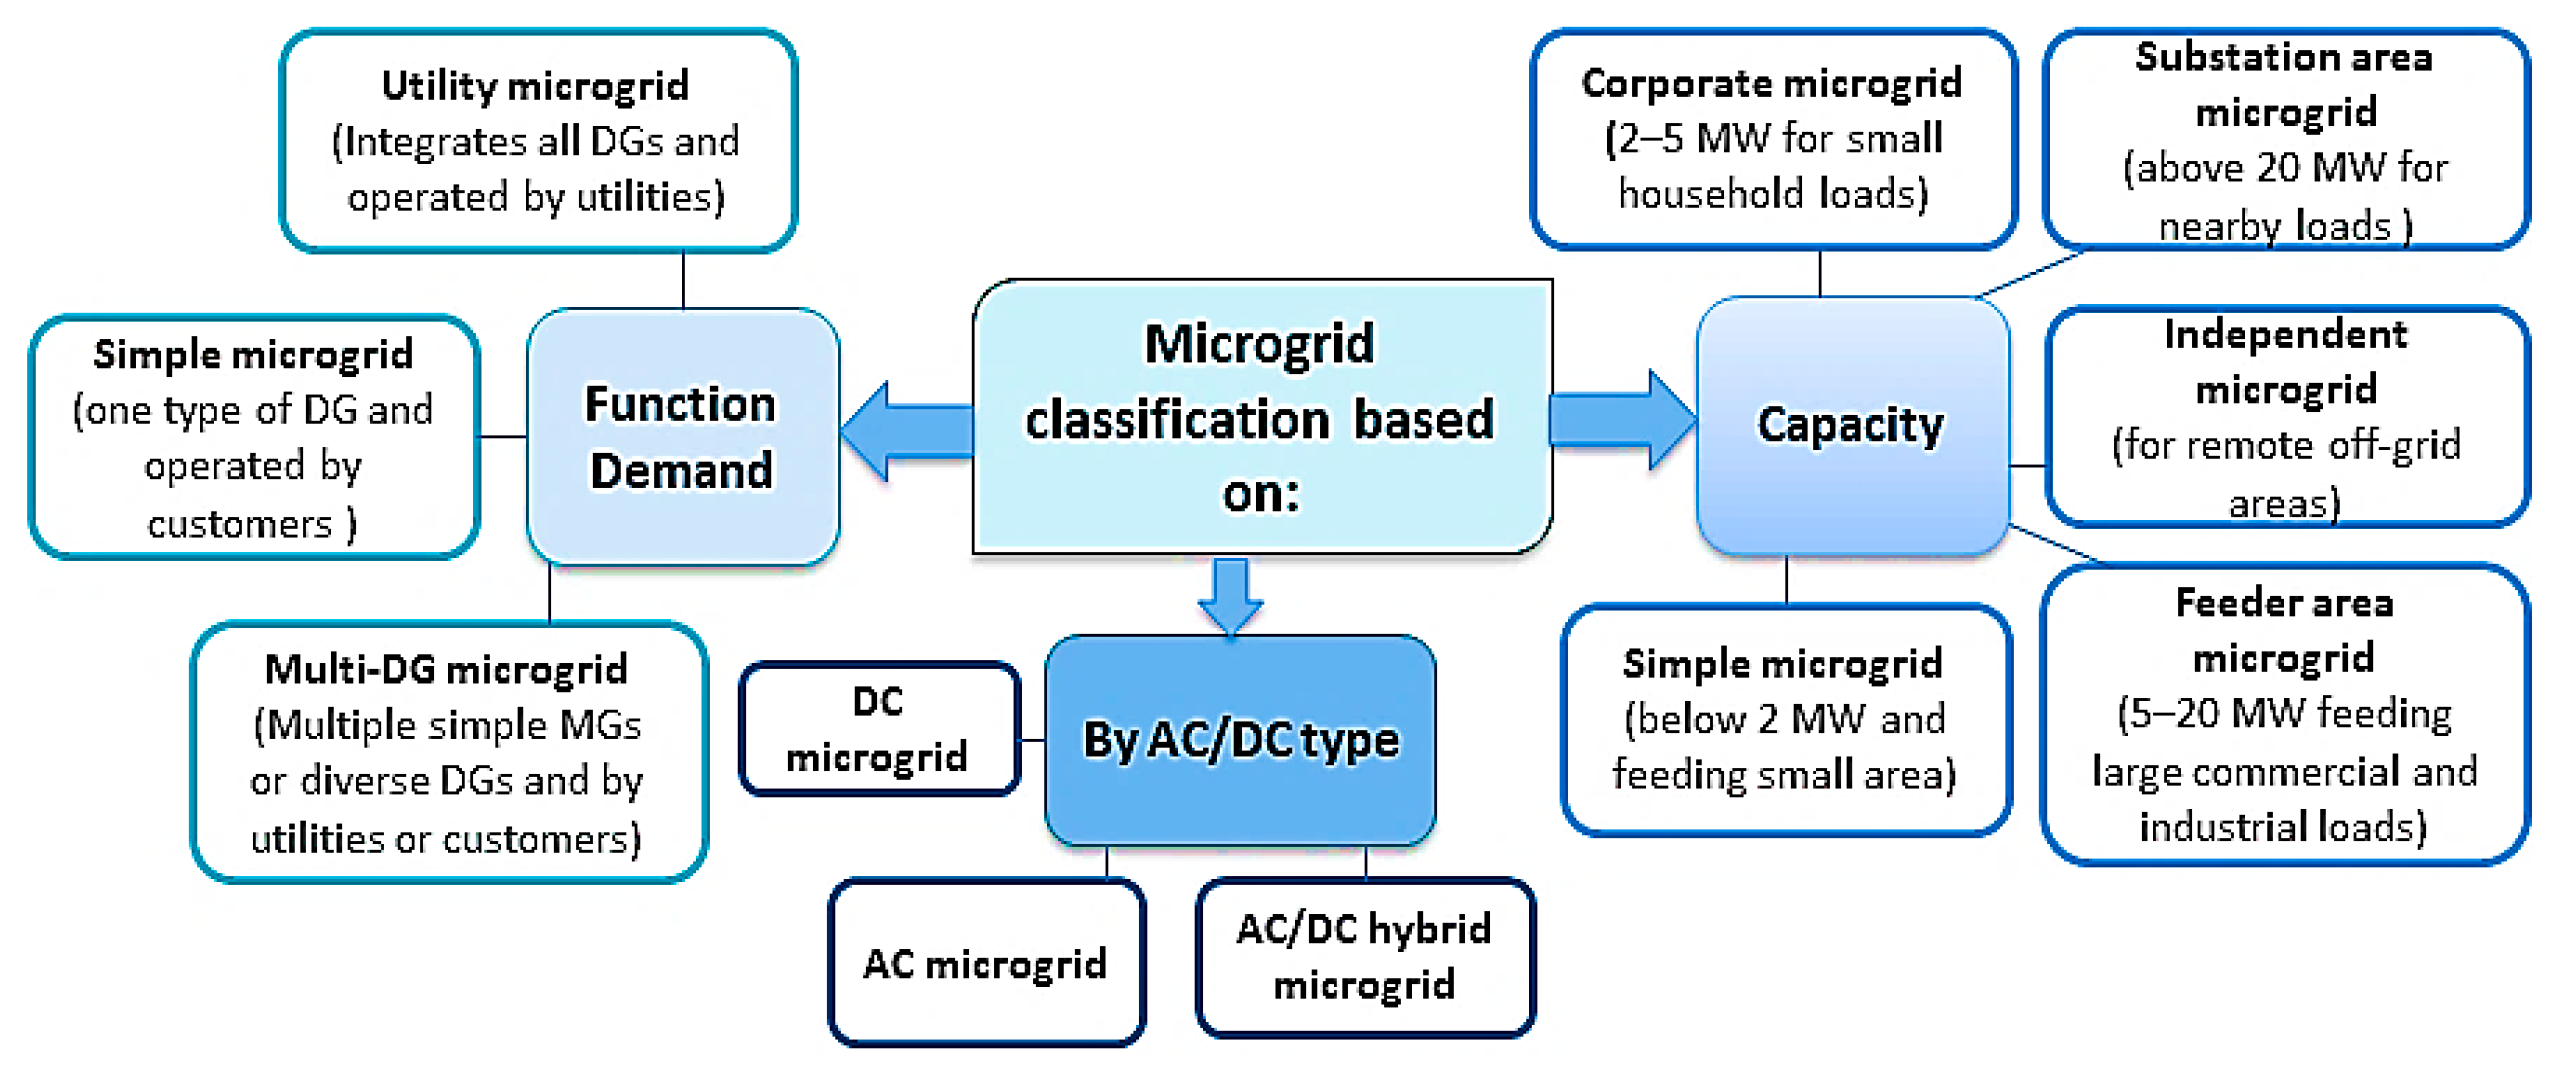
Figure 4.
Equivalent circuits of an ideal SPV cell and practical SPV device.
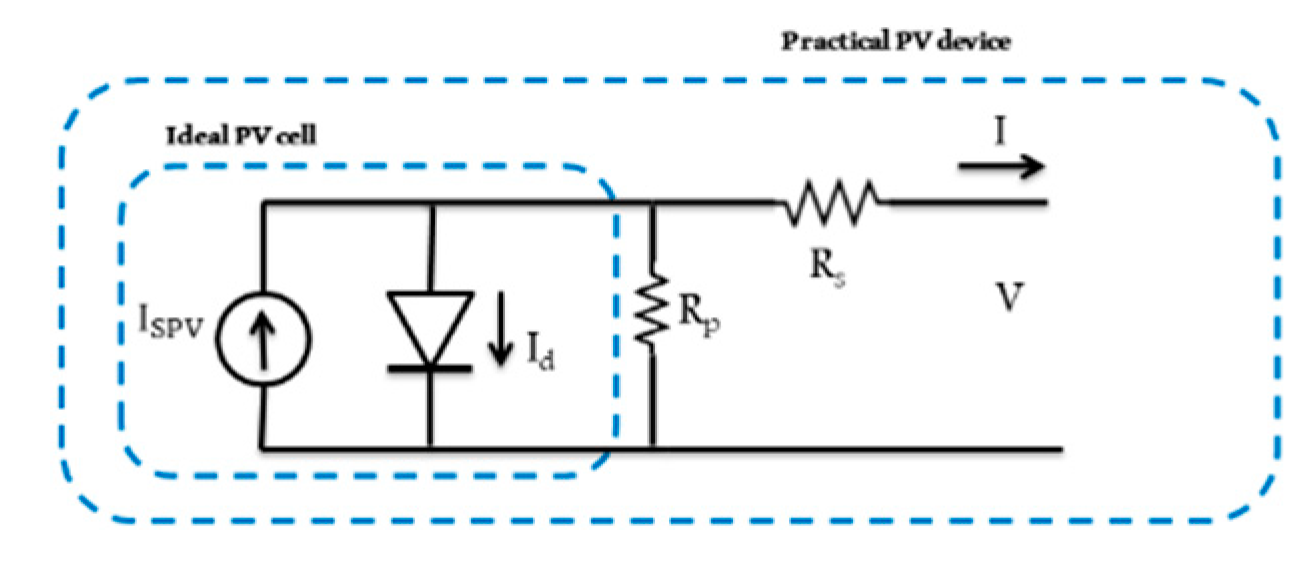
Figure 5.
Types of SPV Systems.

Figure 6.
Decision flowchart for SOO vs. MOO processes.
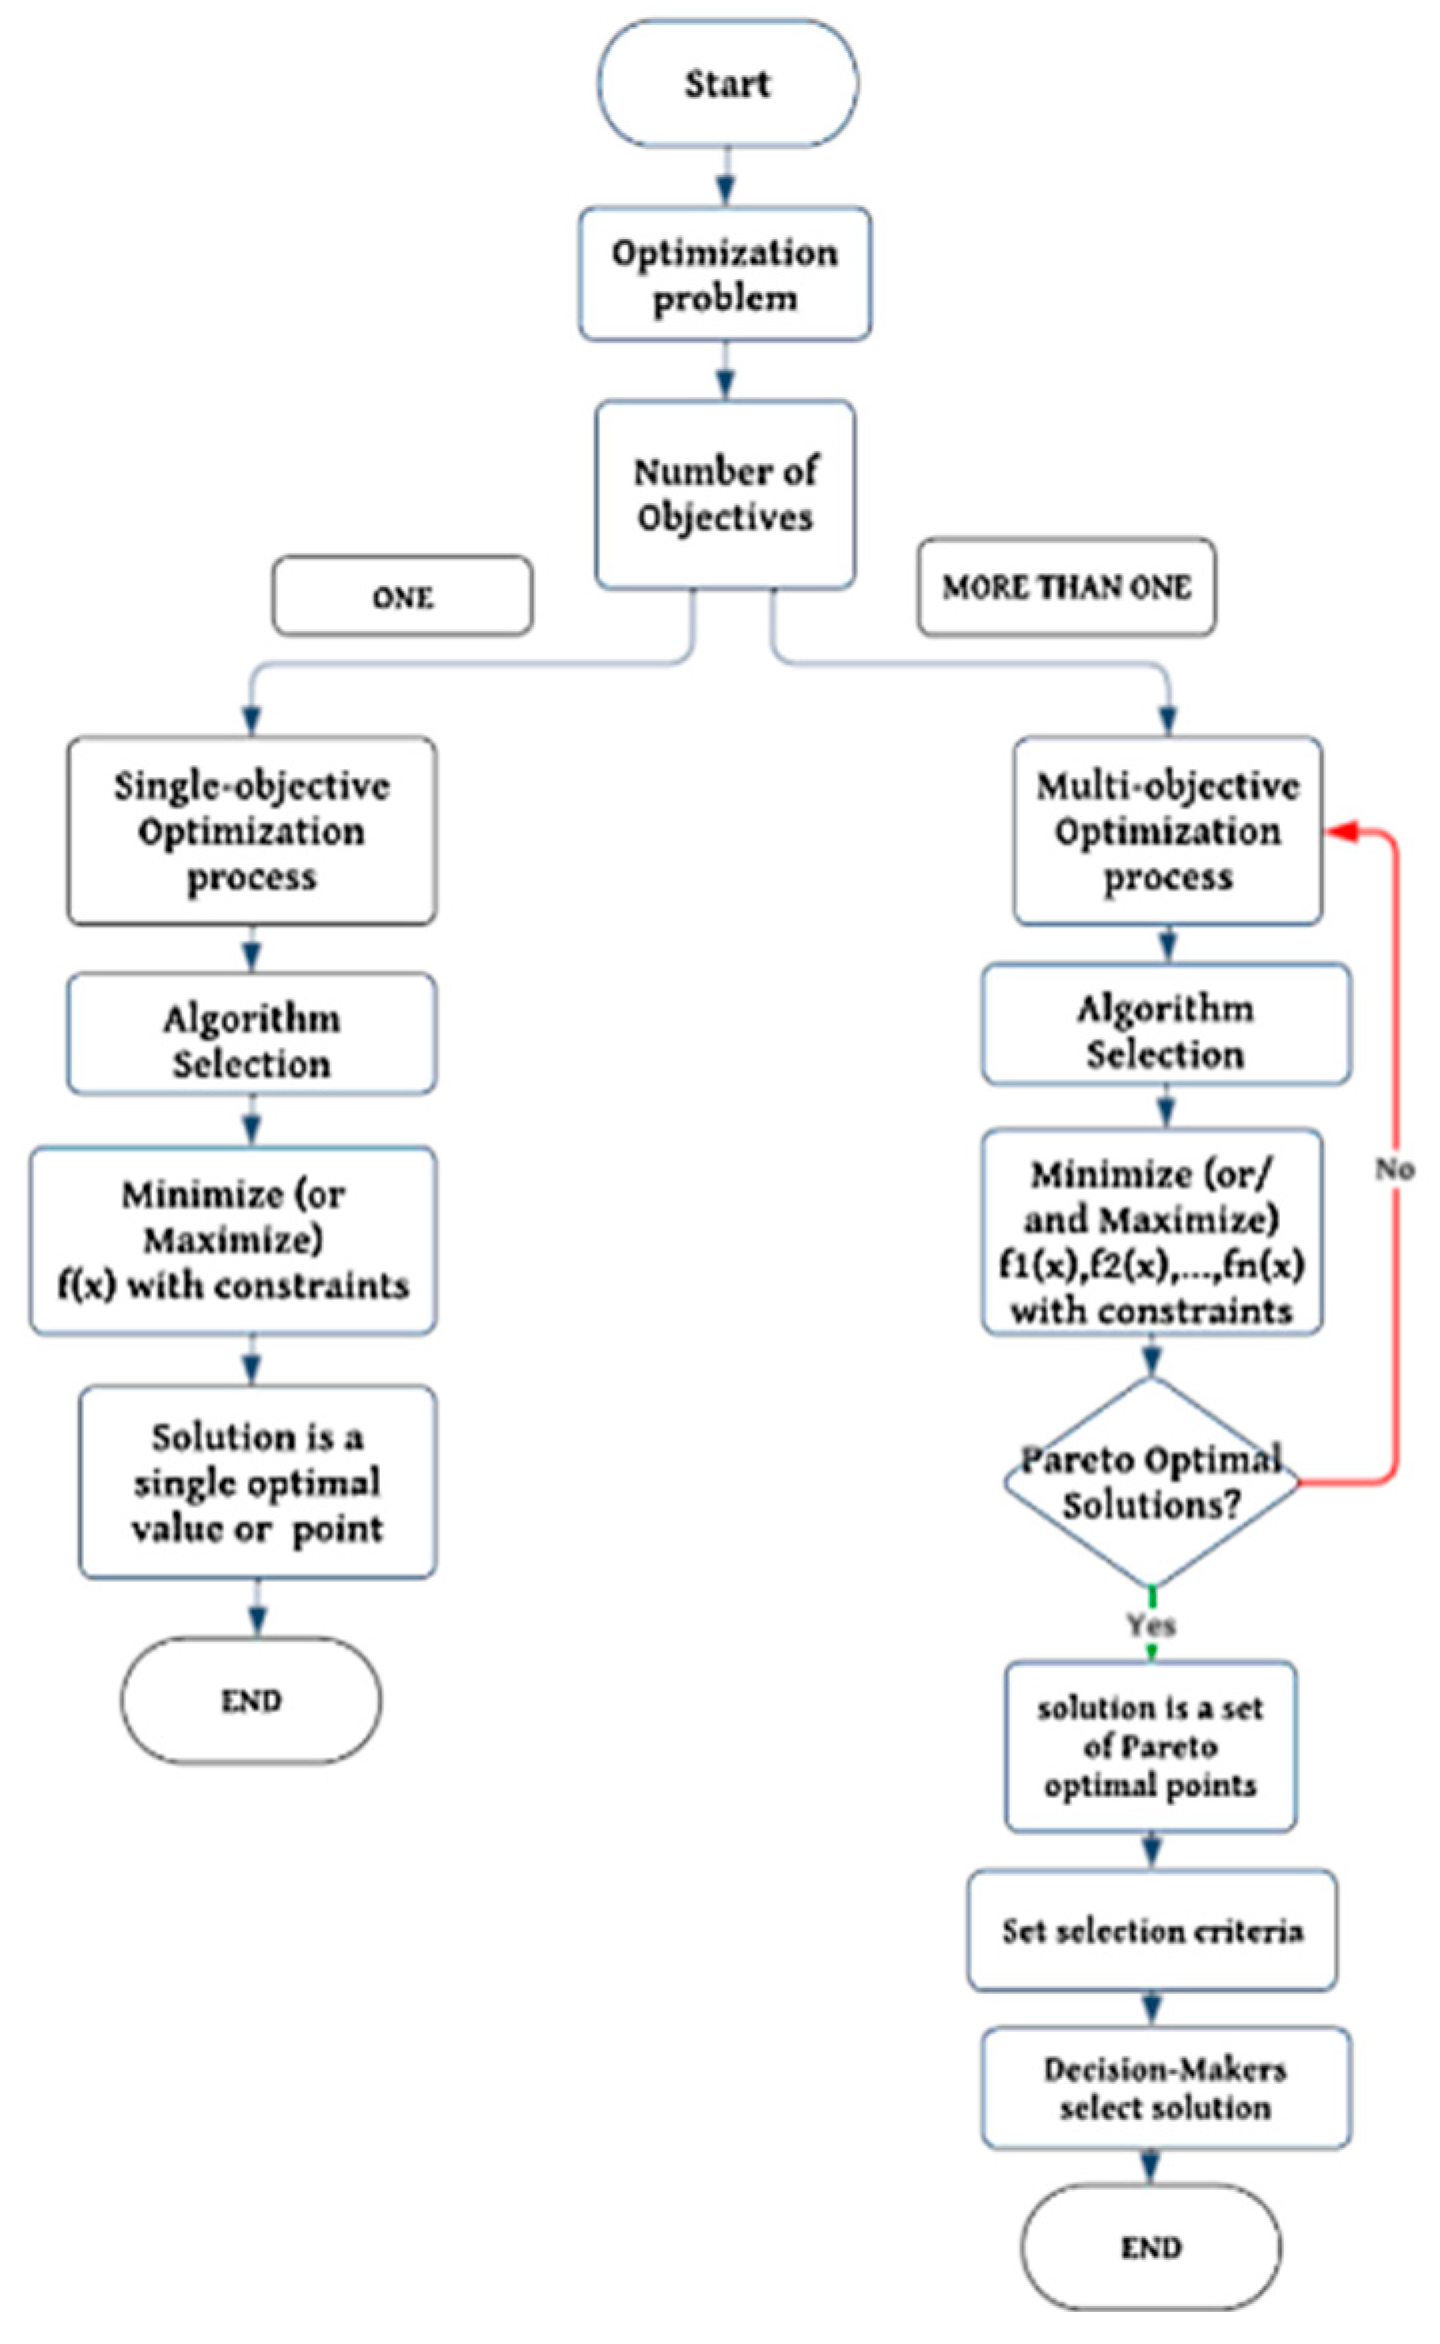
Figure 8.
Workflow of bibliometric analysis process.
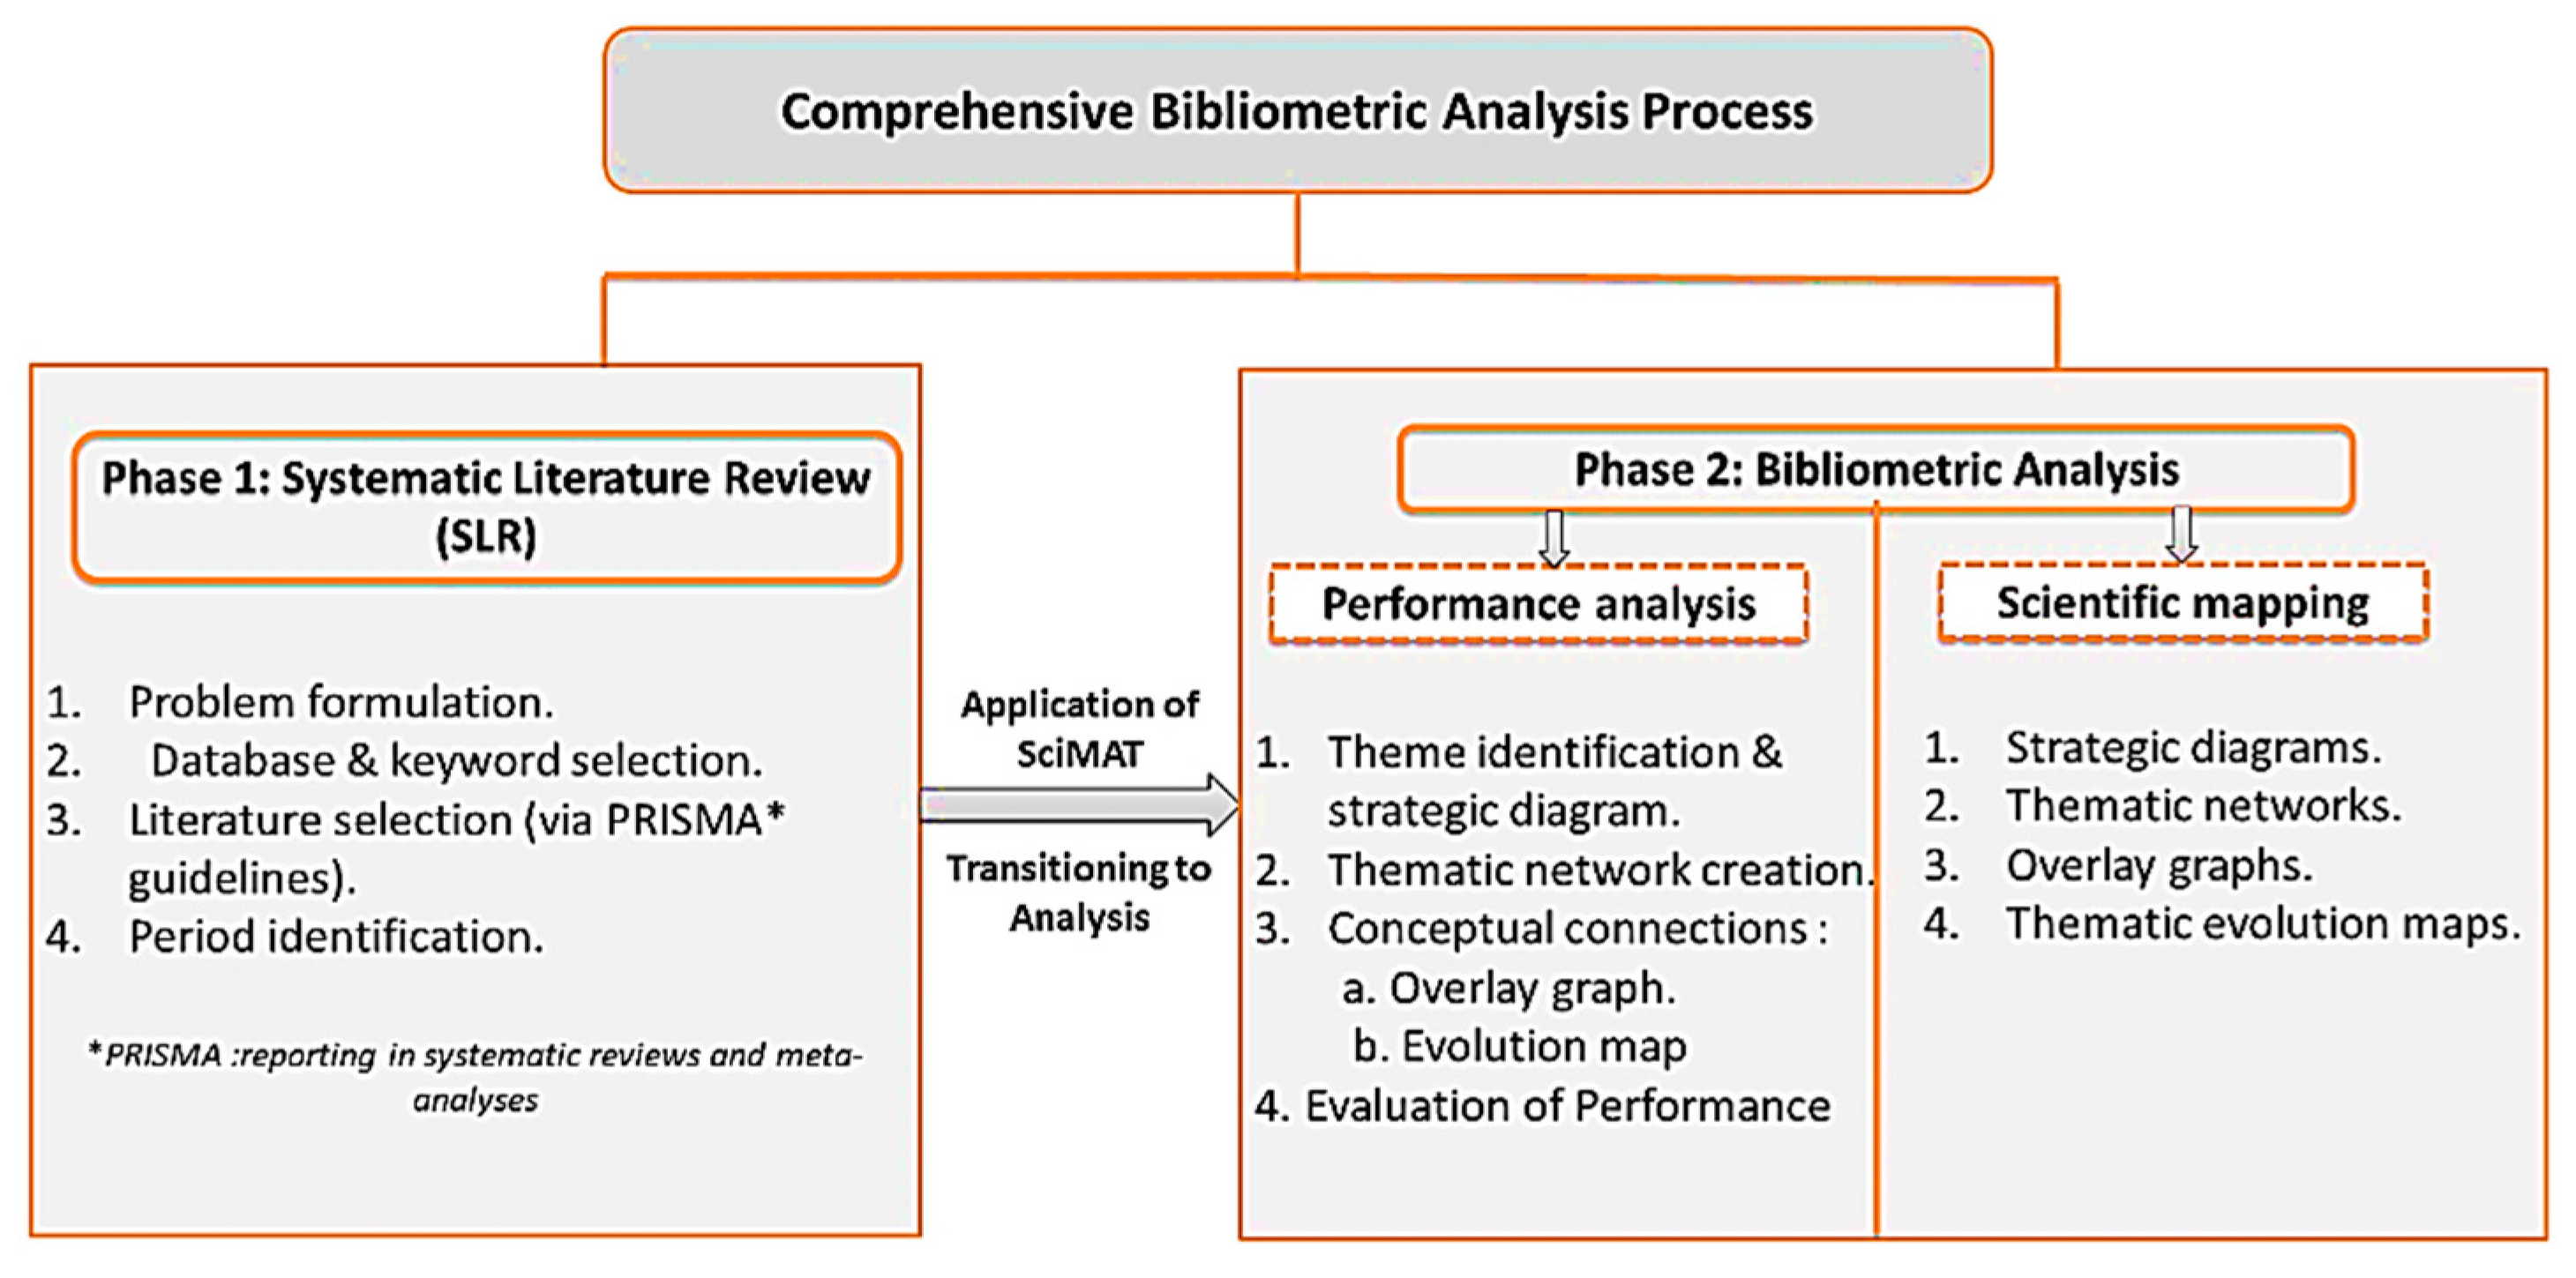
Figure 9.
Visual representation of research theme analysis and evolution.
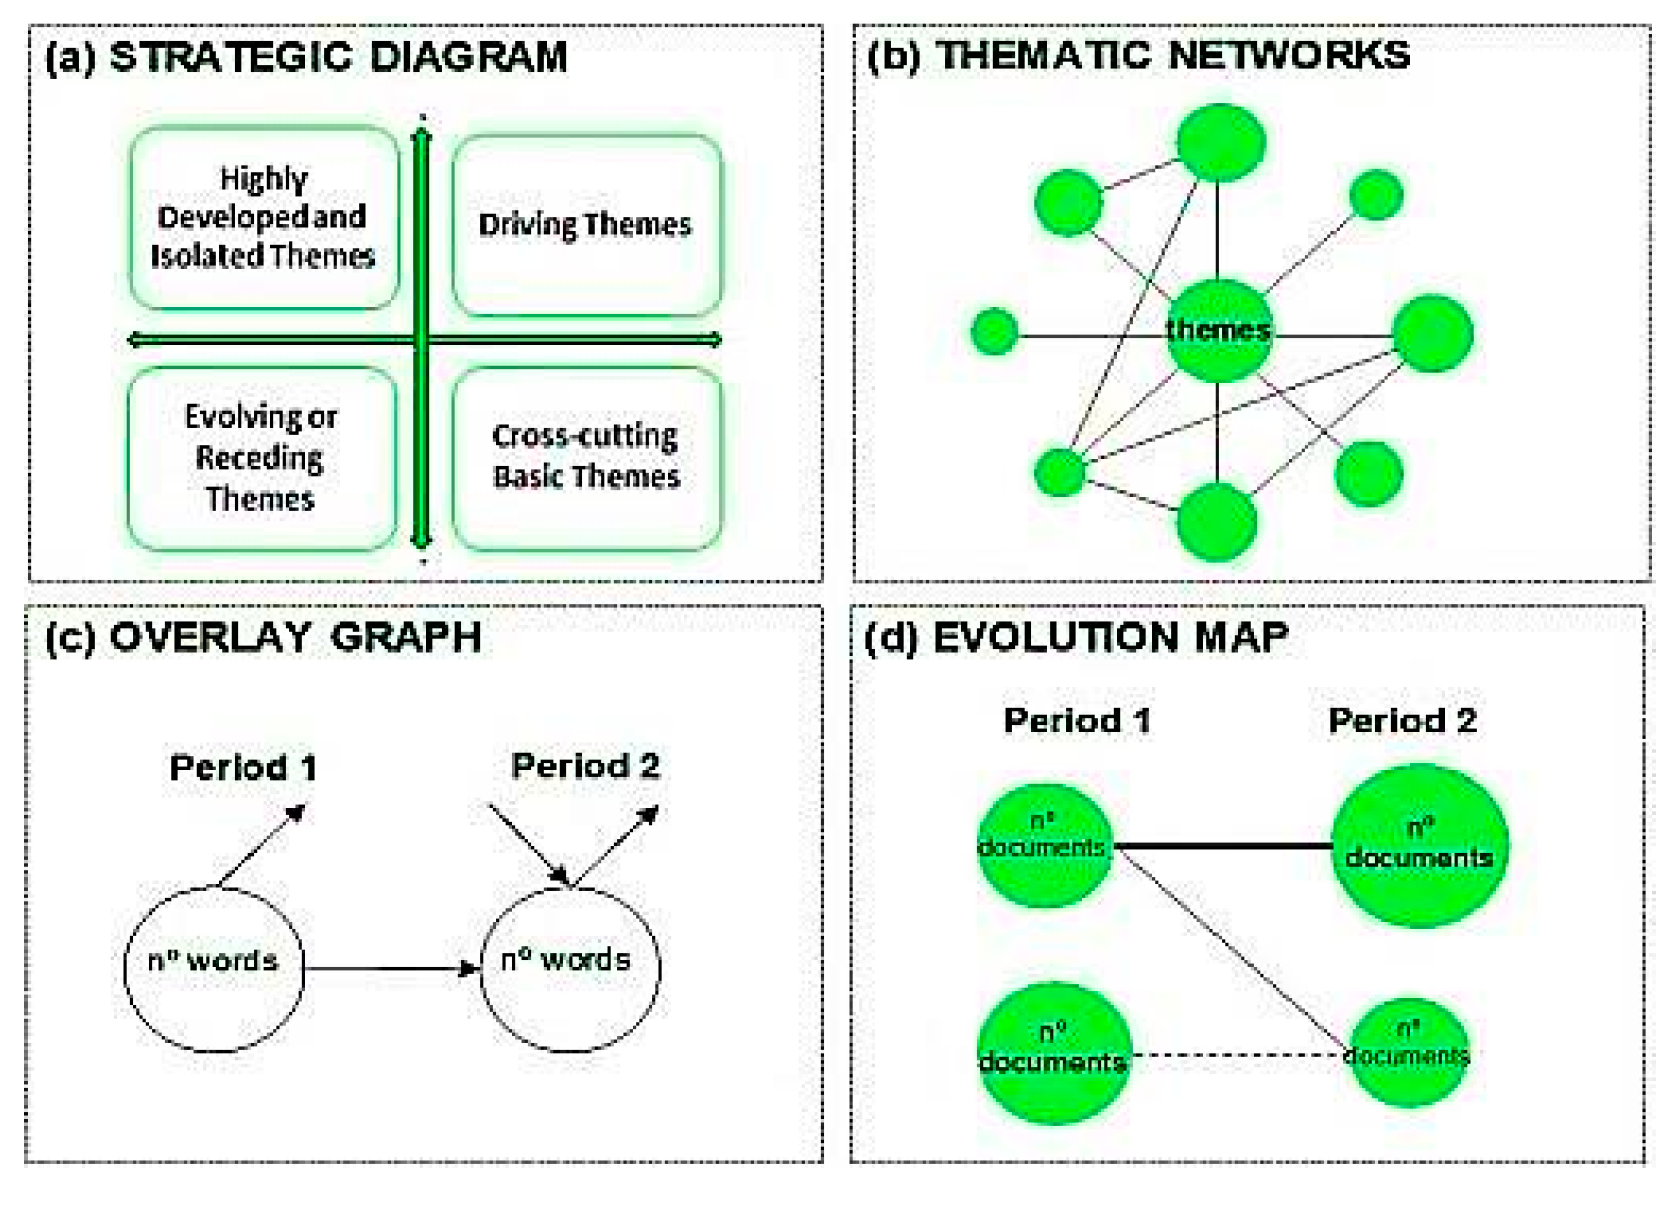
Figure 10.
PRISMA flow diagram of article selection from the Scopus database.
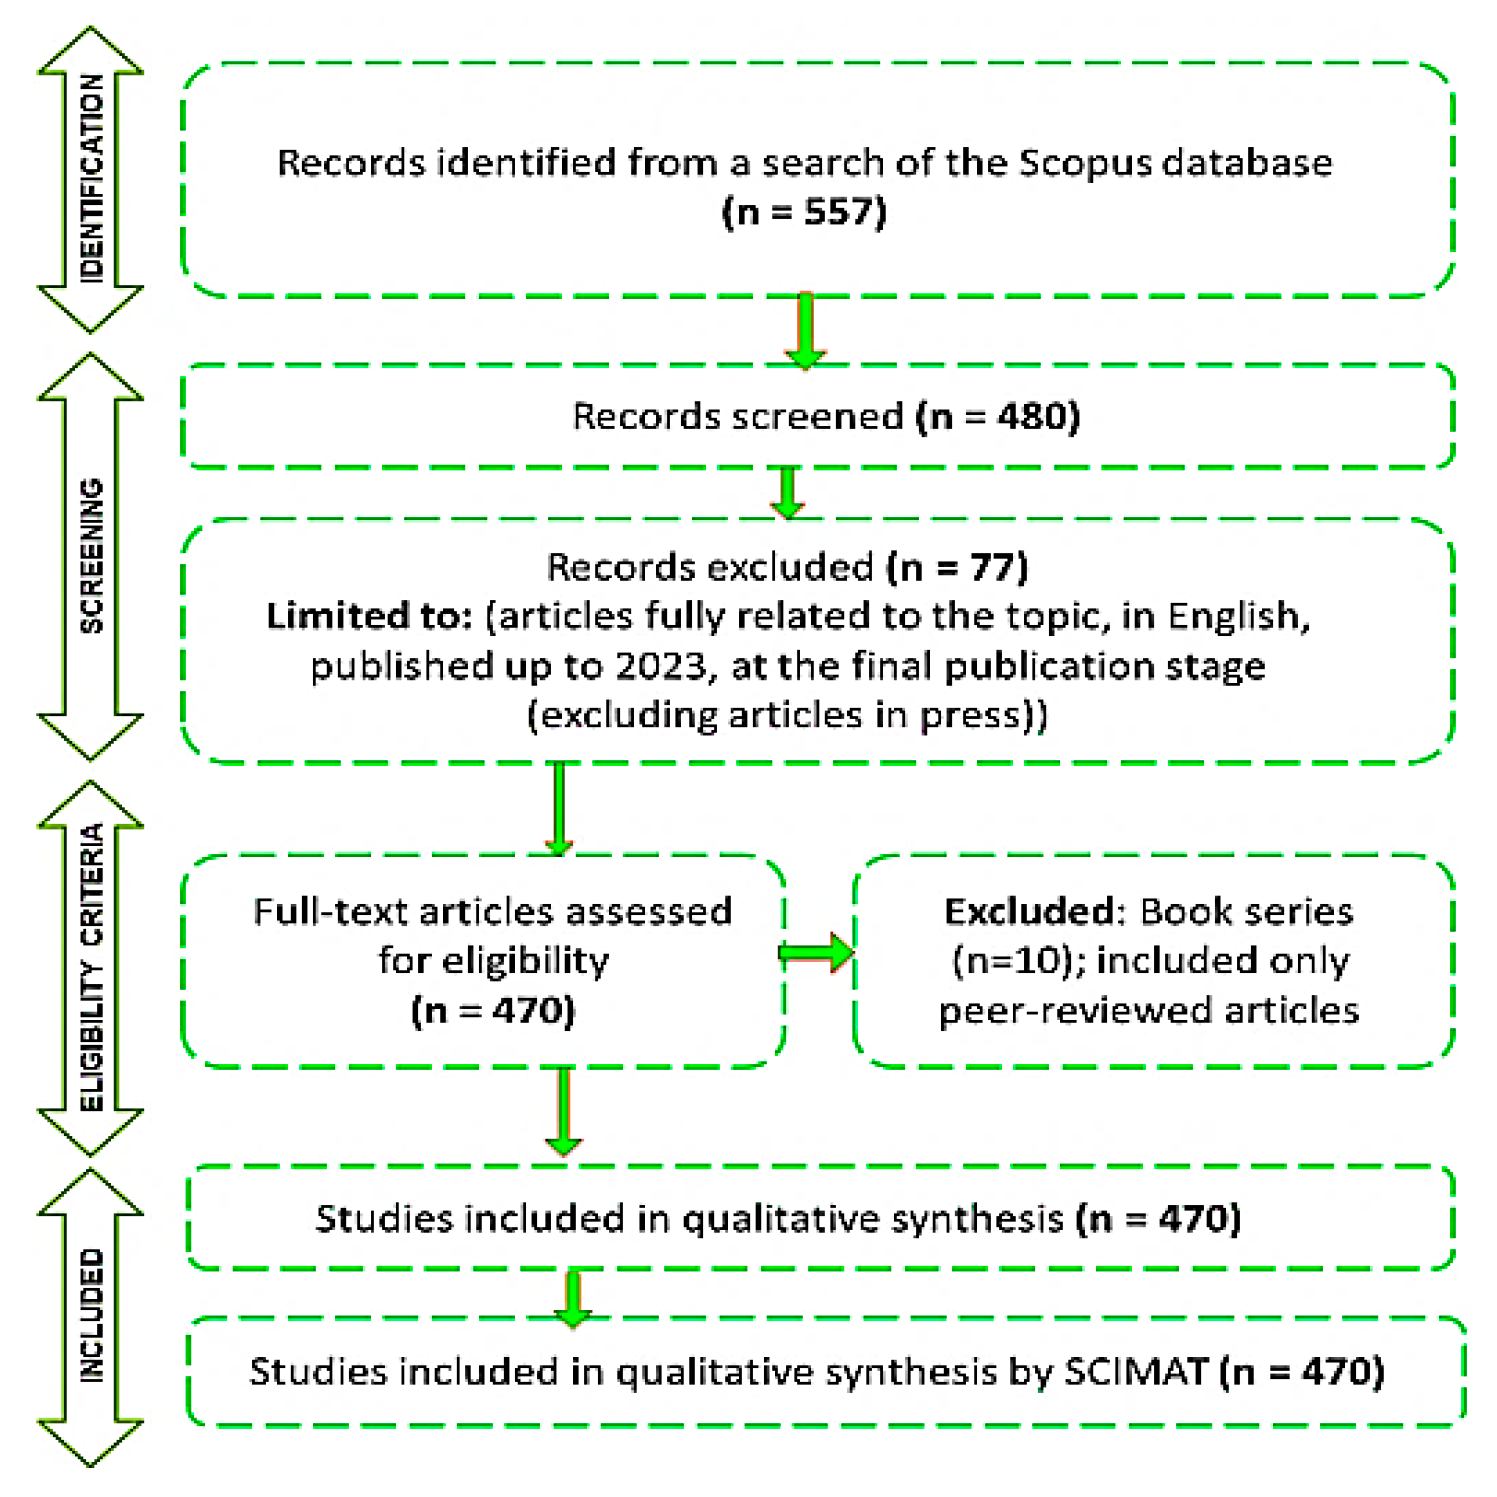
Figure 11.
Yearly distribution of documents.
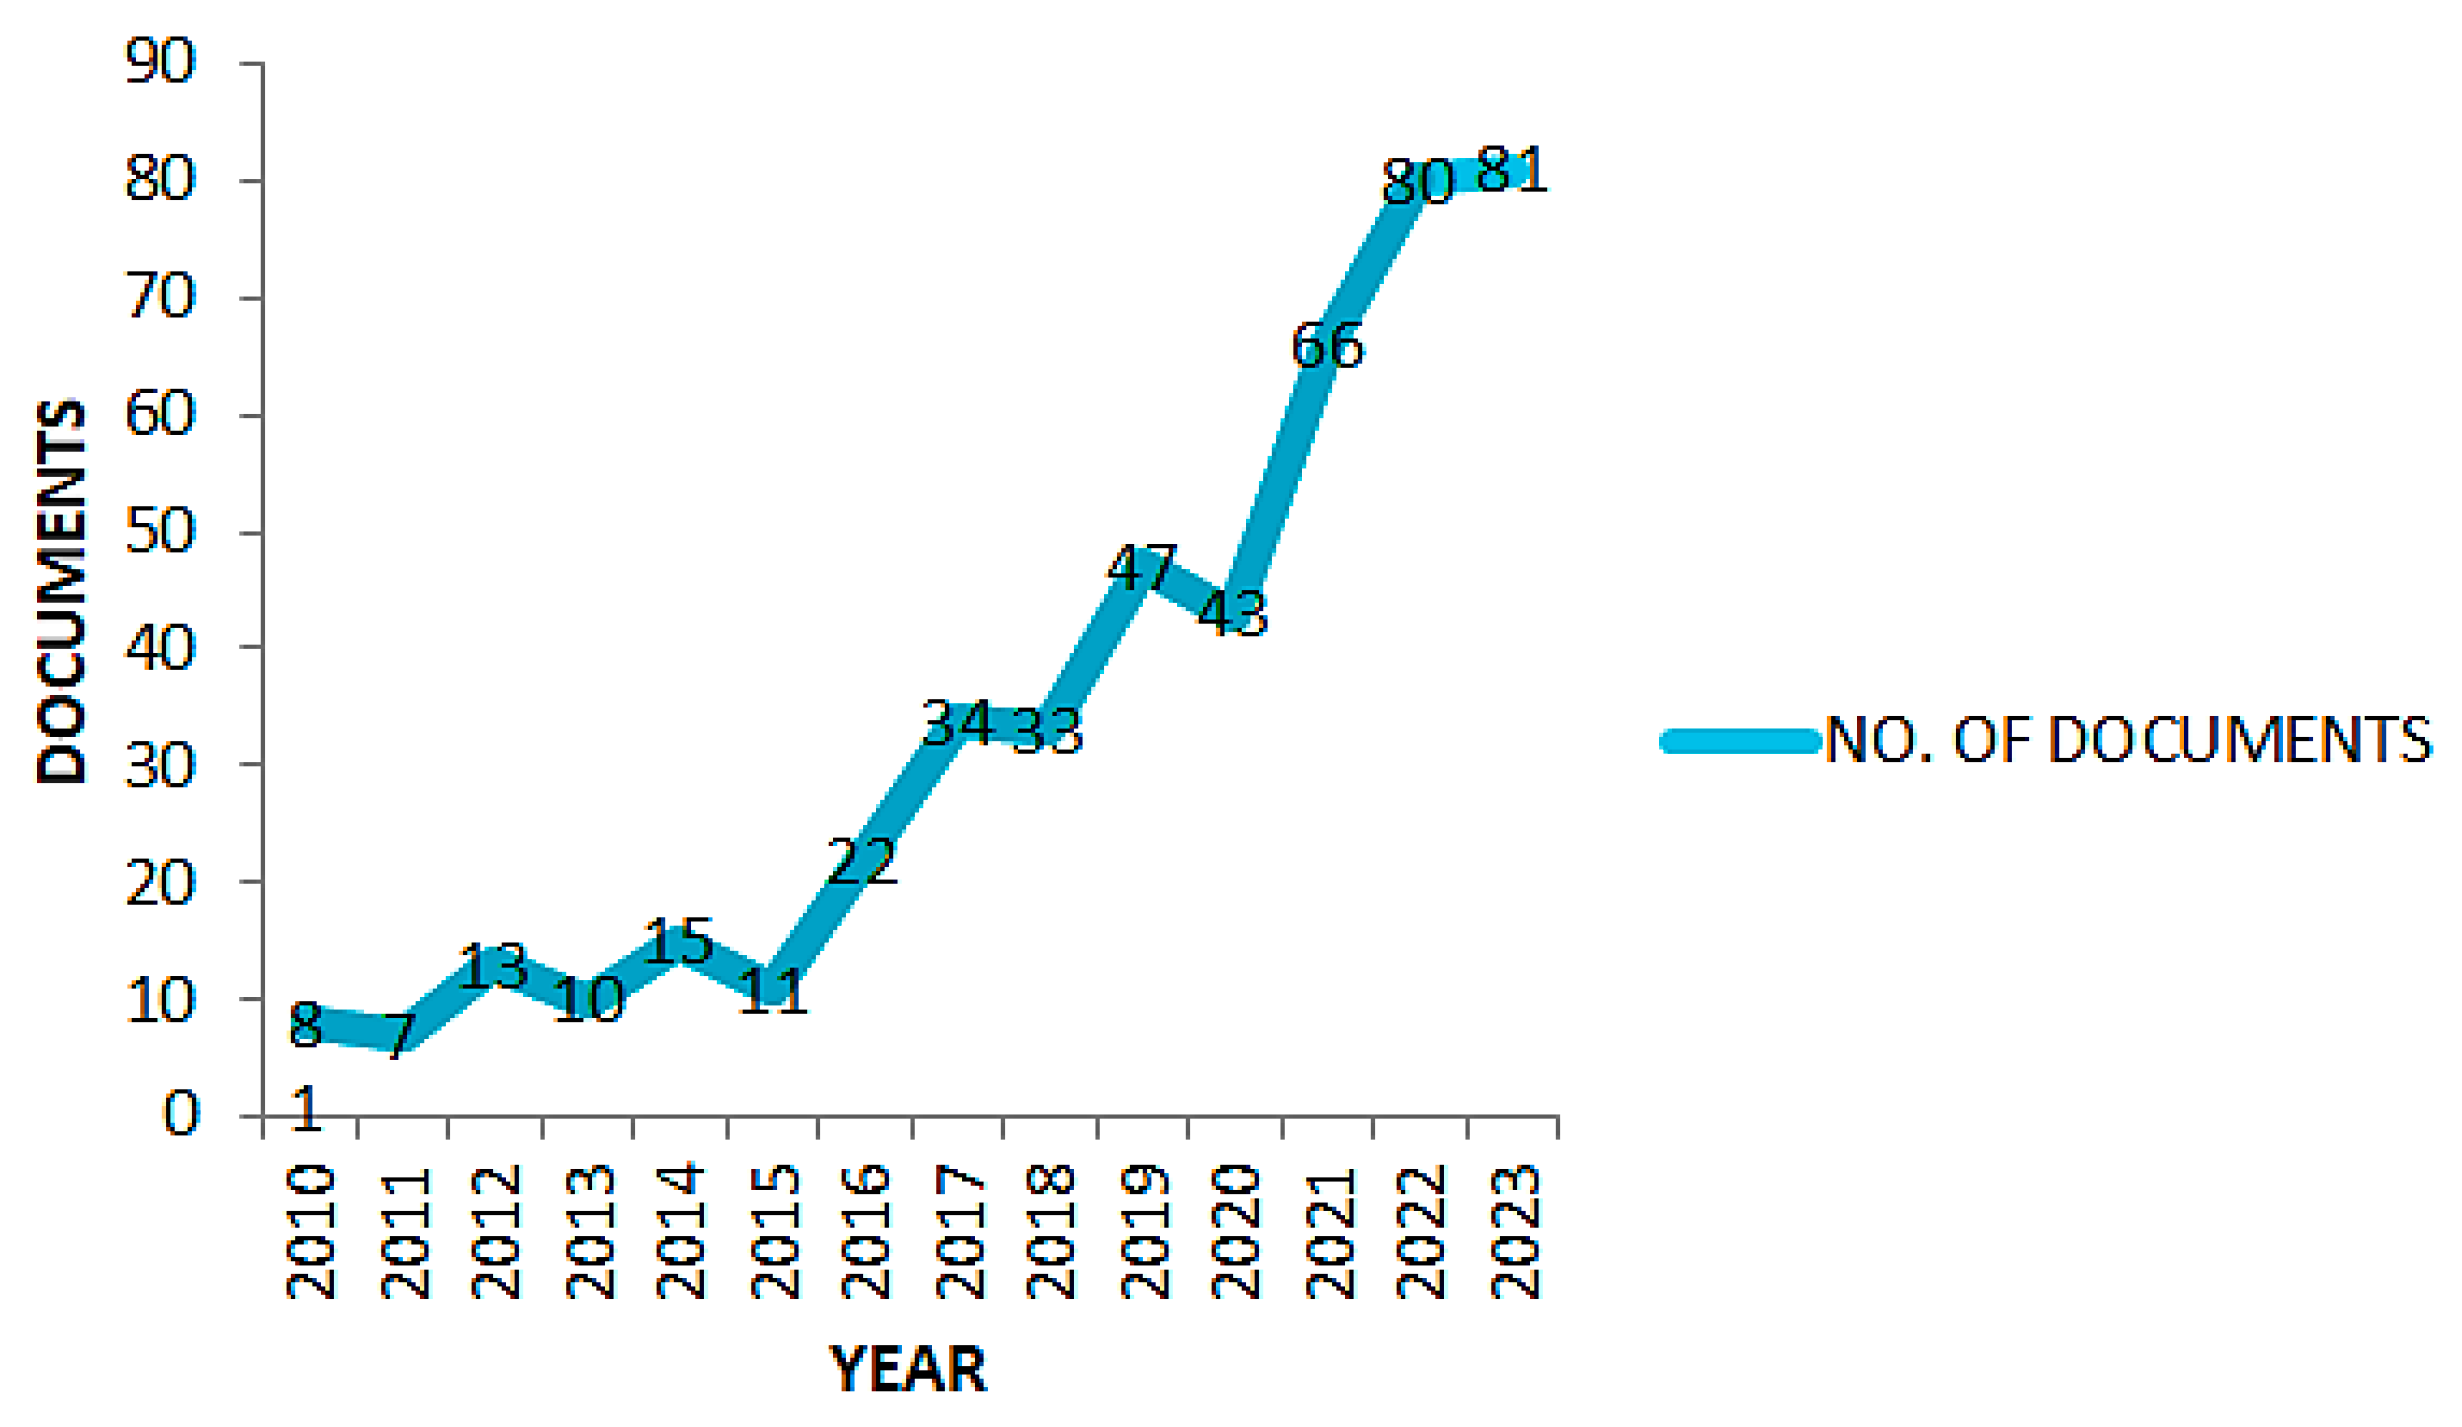
Figure 12.
Strategic diagrams for (a. period 1; b. period 2).
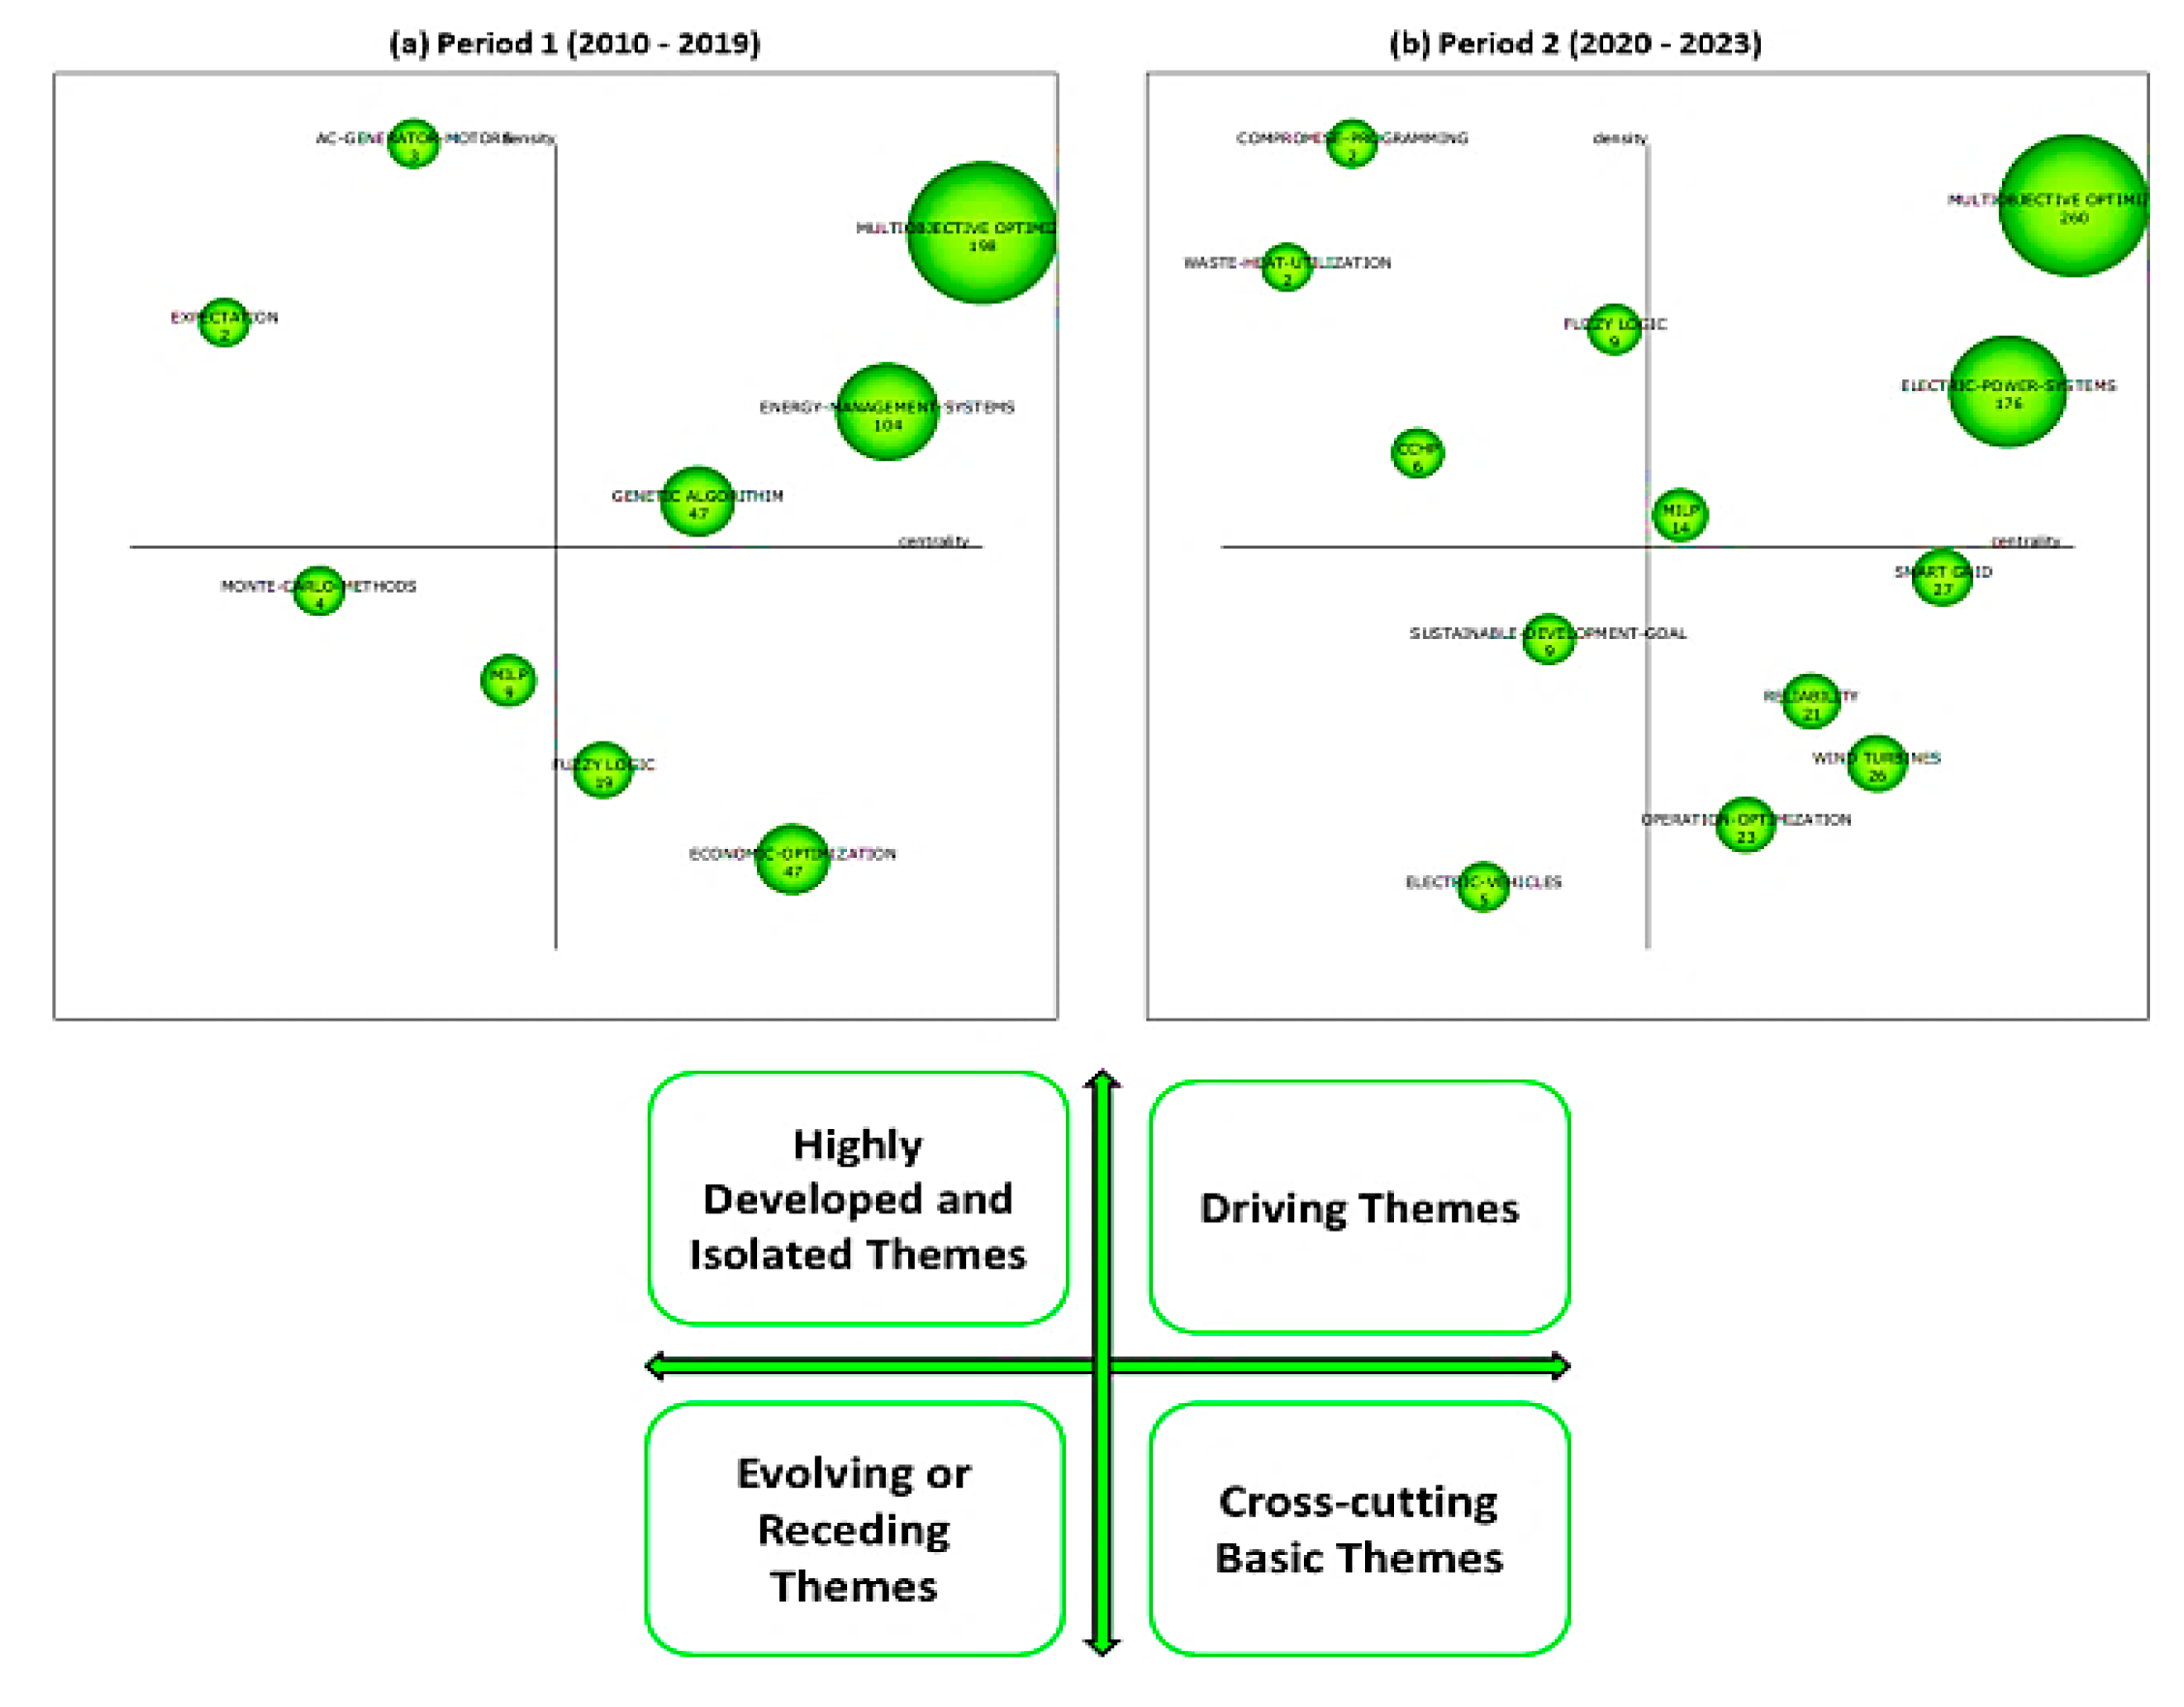
Figure 13.
Thematic networks for (a. period 1; b. period 2).
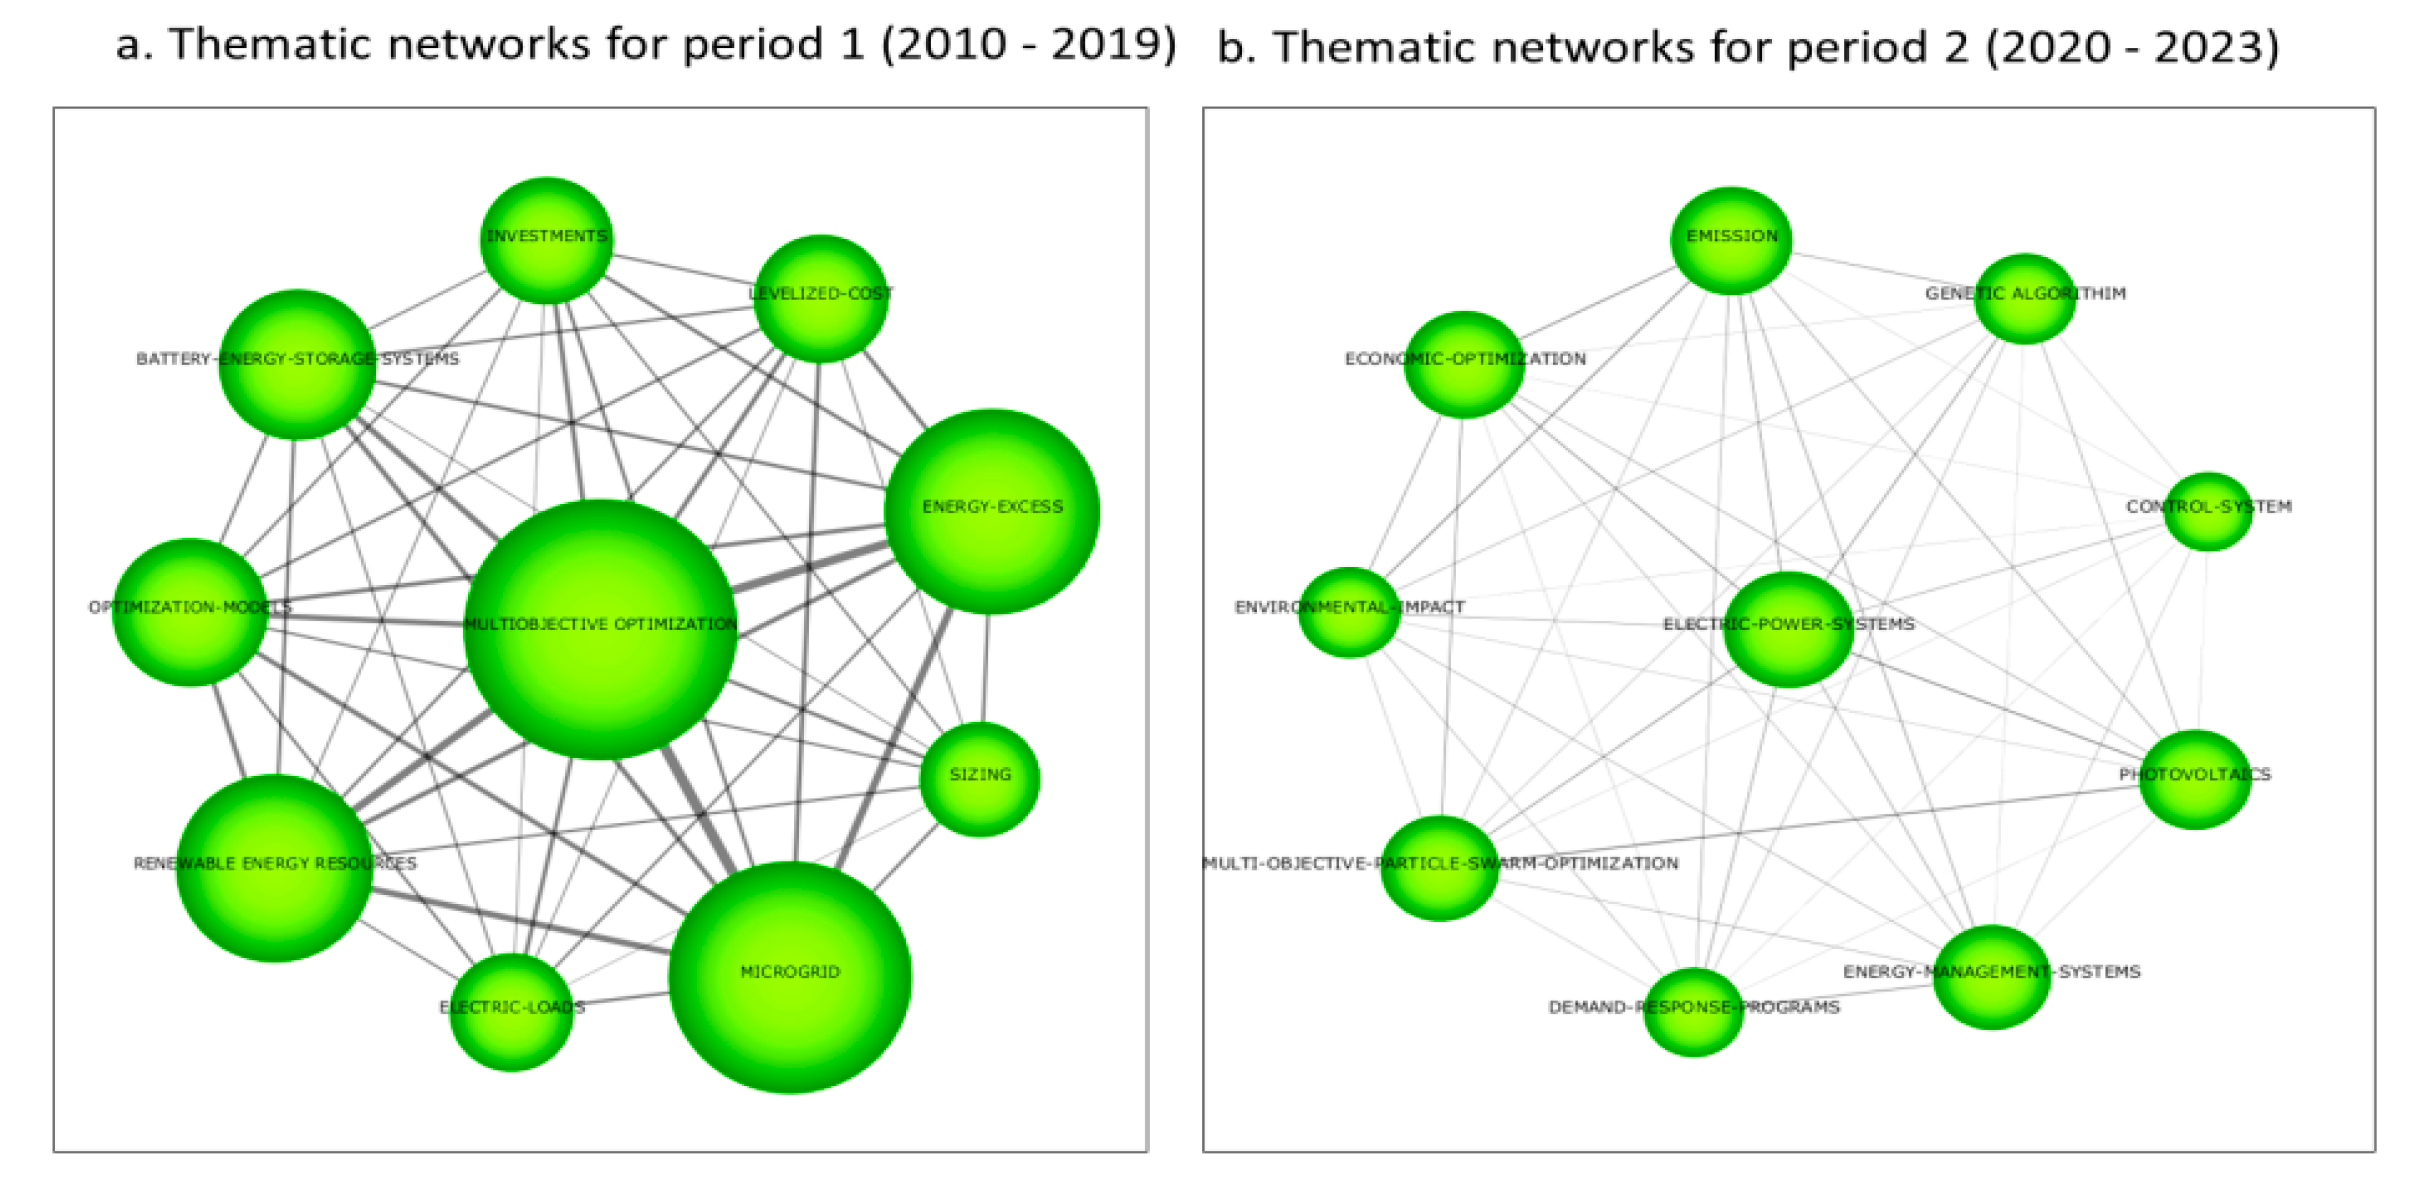
Figure 14.
a. Overly graph b. Thematic evolution map.
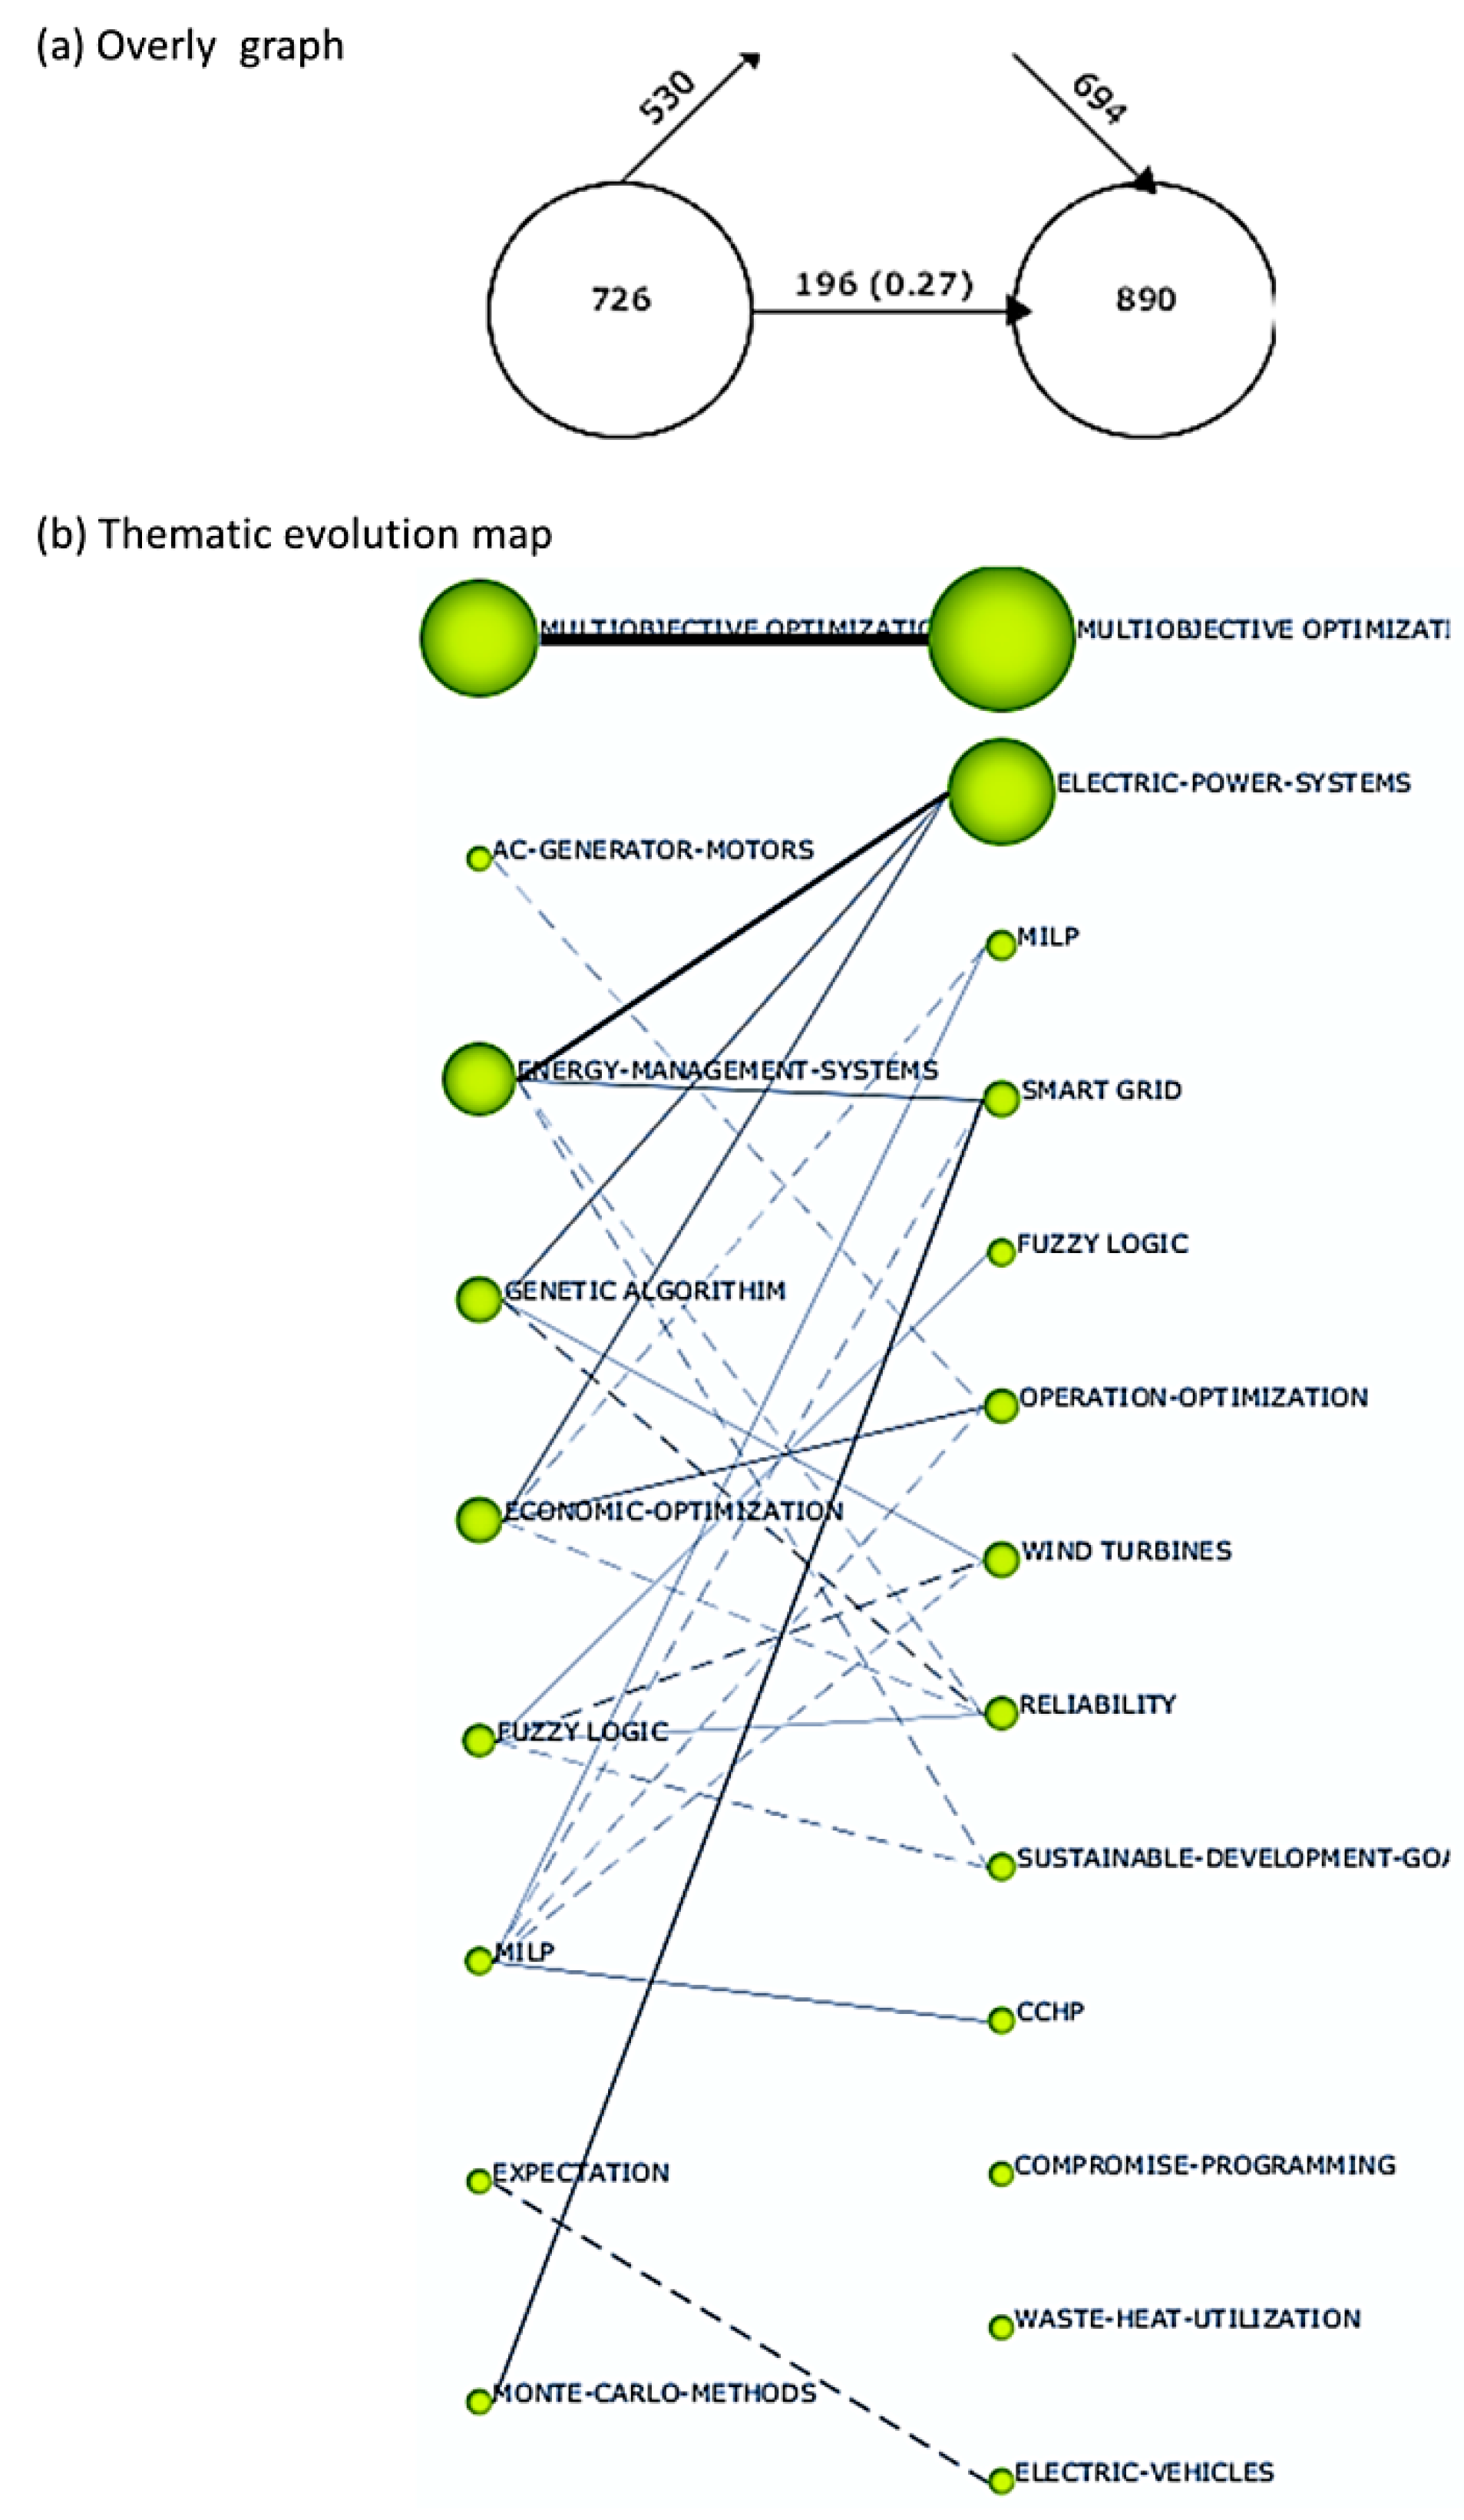

Table 1.
Comparative analysis of RESs vs. HRESs across multiple aspects.
| Aspect | Renewable energy systems (RESs) | Hybrid energy systems (HRESs) |
|---|---|---|
| Reliability | Weather dependent, it can be less reliable. | More consistent power supplies reduce reliance on a single source. |
| Economic | Higher initial cost, lower long-term operational costs. | More cost-effective long-term due to optimized resource use |
| Security | Reduces reliance on imported fuels, but sensitive to environmental changes. | Enhanced security through diversified energy sources. |
| Environment | Minimal emissions, low environmental impact. | Potentially lower impact through optimized energy mix. |
| Maintenance Requirements | Regular maintenance needed, varies by technology. | Potentially more complex maintenance due to multiple systems but can be optimized for efficiency. |
| Stability | Can be unstable due to reliance on single energy source. | Generally more stable due to diversified energy sources. |
| Technological Advancement | Dependent on specific technology advancements. | Benefits from advancements in multiple technologies. |
| Geographical Suitability | Depends on local resource availability. | Better adaptability to various geographical conditions. |
| Energy Storage and Distribution | Storage solutions required for inconsistent supply. | More efficient storage and distribution with steady supply. |
Table 2.
Theme-specific performance metrics.
| Period 1 (2010-2019) | |||||
| Name of Clusters | Documents count | h- index | Citations count | Centrality | Density |
| Multiobjective optimization | 198 | 51 | 9,630 | 373.74 | 131.48 |
| Ac-generator-motors | 3 | 3 | 16 | 59.44 | 242.5 |
| Energy-management-systems | 104 | 43 | 7,351 | 226.49 | 24.94 |
| Genetic algorithm | 47 | 19 | 2,956 | 126.1 | 19.49 |
| Economic-optimization | 47 | 20 | 2,630 | 134.23 | 8.16 |
| Fuzzy logic | 19 | 11 | 1,839 | 89.02 | 9.76 |
| MILP | 9 | 7 | 472 | 70.22 | 10.63 |
| Expectation | 2 | 1 | 13 | 6.49 | 44.44 |
| Monte-Carlo-methods | 4 | 4 | 177 | 8.82 | 16.67 |
| Period 2 (2020-2023) | |||||
| Name of Clusters | Documents count | h- index | Citations count | Centrality | Density |
| Multiobjective optimization | 260 | 30 | 3,347 | 363.59 | 135.68 |
| Electric-power-systems | 176 | 29 | 2,795 | 245.16 | 25.61 |
| MILP | 14 | 9 | 436 | 46.55 | 9.67 |
| Smart grid | 27 | 14 | 686 | 65.42 | 8.09 |
| Fuzzy logic | 9 | 5 | 193 | 39.26 | 47.41 |
| Operation-optimization | 23 | 9 | 324 | 48.7 | 4.23 |
| Wind turbines | 26 | 9 | 381 | 61.39 | 4.34 |
| Reliability | 21 | 12 | 365 | 54.4 | 4.84 |
| Sustainable-development-goal | 9 | 5 | 116 | 24.09 | 6.92 |
| CCHP | 6 | 4 | 101 | 16.65 | 19.67 |
| Compromise-programming | 2 | 1 | 6 | 5.73 | 150 |
| Waste-heat-utilization | 2 | 1 | 5 | 2.81 | 77.78 |
| Electric-vehicles | 5 | 3 | 121 | 17.9 | 3.45 |
Table 3.
Key journals contributing to the study area.
| Name of the journal | Documents count | Total citations | Most cited document | Citations count |
| Energy | 26 | 2391 | [58] | 490 |
| Energies | 24 | 264 | [59] | 29 |
| IEEE Access | 22 | 265 | [60] | 41 |
| Applied Energy | 17 | 1449 | [31] | 357 |
| International Journal Of Electrical Power And Energy Systems | 15 | 443 | [61] | 121 |
| Renewable Energy | 10 | 905 | [30] | 360 |
| Sustainable Cities And Society | 10 | 386 | [62] | 121 |
| Energy Conversion And Management | 10 | 609 | [63] | 200 |
| journal of cleaner production | 9 | 338 | [64] | 164 |
| IET Renewable Power Generation | 8 | 271 | [65] | 96 |
Note: Citation and document counts are accurate as of January 18, 2024.
Table 4.
Key authors in the research area.
| Authors’ names | Documents count | Total citations | h-index | Most cited document | Citations count |
| Yue Wang | 8 | 186 | 12 | [66] | 128 |
| Hongdong Wang | 8 | 130 | 12 | [67] | 102 |
| Josep M. Guerrero | 8 | 131 | 130 | [60] | 41 |
| Tomnobu Senjyu | 6 | 57 | 9 | [68] | 33 |
| Meenakshi De | 6 | 57 | 5 | [69] | 20 |
| Yuanzheng Li | 6 | 25 | 31 | [70] | 12 |
| Yongjun Zhang | 6 | 71 | 30 | [71] | 34 |
| Ziqiang Wang | 6 | 101 | 14 | [72] | 52 |
| Maria Luisa Di Silvestre | 6 | 445 | 22 | [73] | 147 |
| Hesen Liu | 6 | 53 | 9 | [74] | 27 |
Note: Citation and document counts are accurate as of January 18, 2024.
Table 5.
Top cited documents in the study.
| Authors’ names | Year | Citation counts | Most cited document |
| Chaouachi, A., Kamel, R.M. Andoulsi, R, Nagasaka, K. |
2013 | 545 | [75] |
| Niknam, T., Moghaddam, A.A., Seifi, A., Alizadeh Pahlavani, M.R. | 2011 | 490 | [58] |
| Ramli, M.A.M., Bouchekara, H.R.E.H., Alghamdi, A.S. | 2018 | 360 | [30] |
| Niknam, T., Azizipanah Abarghooee, R, Narimani, M.R. | 2012 | 357 | [31] |
| Aghajani, G., Ghadimi, N. | 2018 | 347 | [76] |
| Borhanazad, H., Gounder Ganapathy, V., Mekhilef, S., Mirtaheri, A., Modiri-Delshad, M. | 2014 | 342 | [77] |
| Eriksson, E.L.V., Gray, E. | 2017 | 264 | [57] |
| Basu, A.K., Bhattacharya, A. Chowdhury, S., Chowdhury, S.P. |
2012 | 250 | [78] |
| Balog, R.S., Shadmand, M.B. | 2014 | 217 | [43] |
| Abapour, S., Mohammadi-Ivatloo, B., Nazari-Heris, M. | 2017 | 212 | [79] |
Note: Citation counts are accurate as of January 18, 2024.
Table 6.
Comparative analysis of HMGS optimization techniques.
| First period (2010-2019) | |||||||
|---|---|---|---|---|---|---|---|
| Ref. | System components | Objective of optimization | Technique Used | Study findings | Comments on Algorithms | Year of study | |
| [30] | PV, WT, DG, BT. | Optimizing the size of HMGS components for cost and reliability | MOSaDE | Optimization of PV/WT/DG HMGS in Yanbu, Saudi Arabia, showing application in optimizing the system and practical implications. The study demonstrates the application of the MOSaDE algorithm in optimizing the sizing of hybrid microgrid system components. The results confirm its effectiveness in achieving optimal economic system operation. The paper discusses the impact of design variables on the COE and evaluates the performance of the HERS under different scenarios, indicating the practicality and adaptability of the proposed approach in real-world settings. | The research shows that the MOSaDE algorithm is very effective in improving the HMGS for Yanbu, Saudi Arabia. It demonstrates exceptional abilities in effectively dealing with multiple objectives including as cost, reliability, and integration of RESs. The algorithm's capacity to generate a Pareto front of solutions provides versatility in design options. The adaptability of this technology is shown via its use in improving many components of the HMS, including as PV, WT, and DGs. | 2018 | |
| [80] | PV, CCHP, GSHP, BT | LCOE, Reducing CO2 Emissions, Alleviate disturbances from uncertainties | MOCE | The integrated scheduling approach for MGs addresses uncertainties caused by intermittent RESs and random loads. Load shifting is introduced as an acceptable demand response program for industrial customers. A MOCE minimizes costs and emissions under worst-case scenarios of uncertainties. The robust sets with budgets of uncertainty capture these uncertainties. The strong duality based model transformation method deals with coupling and nonlinearity in the formulation. Comparative experiments confirm the approach's effectiveness in attenuating disturbances and achieving optimal economic and environmental benefits, outperforming single-objective robust optimization and deterministic multi-objective optimization approaches. | The MOCE algorithm is chosen for its high accuracy and directness in solving the proposed formulation. It treats the optimization problem as an estimation problem, using importance sampling techniques to estimate parameters of probability density functions. This approach is effective in multi-objective problems, optimizing all objectives simultaneously and providing a robust solution to the MG scheduling problem under uncertainty. | 2017 | |
| [81] | PV, WT, BT, DG | LCOE, Reducing CO2 Emissions, LPSP | GA | The author employs Pareto front solutions to address a MOO problem, focusing on three critical dimensions: investment costs, emission pollution, and power loss. The optimization process utilizes a GA, adeptly navigating both technical and economic constraints. This methodology proves effective in both grid-connected and standalone HMGs operation modes. Notably, the study excels in balancing the intricate interplay of cost, environmental, and efficiency objectives, presenting a comprehensive and balanced approach to MG planning and resource optimization. | The GA is used for its effectiveness in solving complex optimization problems. It is particularly suitable for problems like DERs planning where technical and economic constraints are involved. GA works well in finding optimal solutions in multi-dimensional objective spaces, as demonstrated by its application to the microgrid in various operation modes. | 2016 | |
| [55] | WT, PV, BT, MT, FC | Minimize cost and emissions with/without responsive loads | MOPSO, Fuzzy-based mechanism, Non-linear sorting system | The study utilized MOPSO, along with a fuzzy-based mechanism and a non-linear sorting system, to optimize microgrid operations, aiming to reduce operating costs and pollutant emissions. It was found that including responsive loads significantly decreased power generation by WT and PV during peak hours, and the implementation of DR programs led to a 24% reduction in operating costs and a 16% decrease in emissions. | MOPSO was effective in balancing the dual objectives of cost reduction and emission control, showing significant improvements in operational efficiency and environmental impact. | 2015 | |
| [82] | WT, PV, BT, DG | LCOE, LPSP, ensuring a system based mainly on RESs. | MOPSO | The study focused on selecting optimal components for a HMGS using MOPSO. It aimed at finding a reliable and cost-effective system configuration. The results indicated that MOPSO effectively provided optimal WT, PV, and BT ratings for the system. | MOPSO was successful in optimizing the system for cost-effectiveness and reliability, demonstrating its utility in managing complex energy systems with a focus on renewable resources. | 2014 | |
| [83] | WT, PV, MT, FC, CHP, electrical and thermal storage | Minimize total operation cost and net emission of a CHP-based MG | MBFO, Interactive Fuzzy Satisfying Method | The study proposed an IEMS for a CHP-based MG, using MBFO and an interactive fuzzy satisfying method to minimize operation cost and emissions. The system smartly covered total electrical and thermal load demands, effectively balancing economic and environmental criteria. | Based on the study outcomes, MBFO, complemented by the fuzzy satisfying method, effectively managed the trade-off between cost and emission, demonstrating its efficiency in optimizing the MG’s performance. | 2013 | |
| [78] | MT, DG, DERs | Optimal economic scheduling of DERs in a CHP-based micro-grid, focusing on multi-objective optimization between fuel cost and emission | PSO, DE | The study aimed at economically deploying DERs in a CHP-based MG, using PSO for optimal sizing and DE for bi-objective optimization between fuel cost and emission. It evaluated different DER mixes, including MTs and DGs, to economically share electrical demand and satisfy various heat demands. The results affirmed the effectiveness of using a mix of DERs for catering to different electrical and heat demands with a balanced compromise between fuel cost and emission. | The results showed that the combination of PSO and DE was effective for bi-objective optimization, demonstrating the ability to balance fuel costs and emissions while ensuring economic and efficient operation of the MG. | 2012 | |
| [58] | PV, WT, BT, FC, MT | Minimize total operating cost and net emission in a renewable MG | AMPSO, CLS, FSA | This study presented an AMPSO algorithm for optimal operation of an MG with RESs and a back-up system comprising a MT, FC, and BT. The goal was to minimize both the operating cost and emissions. It included PV and WT among various DG sources. The AMPSO, enhanced by CLS and FSA, was used to handle the nonlinear MOO problem, focusing on balancing power mismatches and energy storage needs. | Based on the given results, the integration of AMPSO with CLS and FSA provided an effective solution for MOO, showing the capability to balance economic and environmental objectives in the operation of a renewable energy-based MG. | 2011 | |
| [84] | Gas turbine, PV | Minimize emissions (CO2, CO, NOx) and fuel consumption in an MG | MOO (MATLAB function “fgoalattain” | The study focused on a microgrid comprising gas turbines and a PV-based active generator. It implemented multi-objective optimization to minimize emissions from gas turbines and prioritize the use of the non-polluting PV-based active generator. The optimization achieved a 9.17% reduction in equivalent CO2 emissions, with the active generator contributing 11% of the total energy to the system. | In this study, the MOO (MATLAB function “fgoalattain” was effectively balanced environmental goals with energy management, demonstrating efficiency in reducing emissions and fuel consumption while utilizing RESs. | 2010 | |
| Second period (2020-2023) | |||||||
| [85] | PV, WT, Hydraulic Plant, biogas plant | Minimize total annualized cost of electricity supply and minimize energy import from the network | MOPSO | The article presents a novel optimization technique for MG production in a Spanish town with inconsistent grid connections. Employing a MOPSO technique, the primary purpose is to minimize expenses and decrease the reliance onthe grid. The methodology yields a pragmatic and viable resolution, with a 20-year Internal Rate of Return of 8.33%. This is accomplished by using a combination of PV, WT, hydropower, biomass, and turbine-based power production. This approach not only improves the ability to produce enough energy for one's own needs but also establishes a model for the possibility of separating from Spain's national power network. | In this study, the MOPSO algorithm effectively minimized the objective function, balancing the cost and energy imported from the network. The results showed that higher installed power led to less energy imported from the network. | 2023 | |
| [86] | PV, WT, DG, BT, MT, FC | LCOE, LPSP, RF | MOSSA | This study proposes an optimization design for a stand-alone microgrid system in Djelfa, Algeria, aimed at serving a remote off-grid community. The system is powered by hybrid sources (PV, WT, BT, DG) and optimizes the minimum cost of electricity (COE) and minimum potential for electrical loss (LPSP) using the multiobjective salp swarm algorithm (MOSSA). The results show MOSSA’s superiority over algorithms like MODA, MOGOA, and MOALO, achieving better RF, COE, and LPSP. The study emphasizes the use of RESs and proposes future enhancements including diverse renewable sources and advanced AI algorithms. | The use of MOSSA in optimizing a stand-alone microgrid system highlights its efficiency in handling complex energy systems. The focus on renewable energy integration and cost-effective operation demonstrates the potential of advanced algorithms in future microgrid designs, balancing sustainability with practicality. | 2022 | |
| [87] | MT, WT, PV, Bromide Refrigerator, AC, FC, HESS | Minimizing Power Generation and Environmental Treatment Costs | (BAS-ABC) Improved ABC | This study presents an economically optimized multi-objective dispatching model for a CCHP micro-grid, using an improved Artificial Bee Colony (ABC) algorithm, enhanced with Beetle Antennae Search Algorithm (BAS-ABC). The model aims to minimize both the daily power generation dispatching cost and environmental pollutant treatment cost. Analysis of a grid-connected CCHP micro-grid in Shanghai during summer demonstrates that the BAS-ABC algorithm achieves faster convergence and lower minimum costs compared to traditional ABC. It also highlights the inherent conflict in optimizing for the lowest power generation cost and environmental cost simultaneously, suggesting a comprehensive balance between economic efficiency and environmental friendliness. | The integration of the BAS-ABC algorithm into the CCHP microgrid model signifies advancement over traditional ABC, especially in terms of convergence speed and cost-efficiency. However, the study also underscores the trade-offs between economic and environmental objectives, a crucial consideration for sustainable energy management. | 2021 | |
| [88] | WT, P2G, SOFC/GT, H2 Storage, Electrolyzer | Minimizing System Cost and Wind Curtailment Rate | MOGA | This research integrates a micro-energy system (MES) with wind power, P2G, H2 storage, and a SOFC/GT hybrid. Employing a MOO approach using a GA, it focuses on minimizing system costs and wind curtailment rate while addressing wind power and load variability. The results showcase a low wind curtailment rate of 0.63%, high renewable energy penetration at 90.1%, and an optimized life cycle cost of £2,468,093. The SOFC/GT system maintains maximum electrical efficiency at 67.1%, adhering to safety constraints, and a power management strategy is developed for efficient operation amidst fluctuating demands. | This study shows how MOGA can effectively balance competing goals such as cost-efficiency and renewable energy integration, ensuring an optimized and sustainable microgrid operation. | 2020 | |
| [89] | PV, WT, BT | Minimizing Annual Comprehensive Cost and Grid Dependency | MOCS, TOPSIS | This study establishes a MOO function for a grid-connected MG, focusing on minimizing the annual comprehensive cost and grid dependency. It utilizes the k-medoids method to handle uncertainties of RESs and load demand. The MOCS algorithm is used to solve the model, and the TOPSIS method is employed to find the optimal compromise solution | The combination of the MOCS algorithm and the TOPSIS method in this study indicates a robust approach to microgrid configuration under uncertain conditions. It highlights the importance of considering multiple objectives and uncertainties in renewable energy systems for achieving both economic and grid reliability targets. | 2020 | |
Abbreviation: PV: photovoltaic solar, WT: wind turbine, DG: diesel generator, BT: battery, GSHP: ground heat source pump, LCOE: lowering cost of energy, CO2: carbon dioxide, MOCE: multiobjective cross entropy, LPSP: loss of power supply probability, GA: genetic algorithm, MOGA: multiobjective genetic algorithm, DERs: Distributed Energy Resources, MOPSO: multiobjective particle swarm optimization algorithm, MT: micro turbine, FC: fuel cell, DR: demand response, CHP: combined heat and power, MBFO: Modified Bacterial Foraging Optimization, IEMS: intelligent energy management system, PSO: particle swarm optimization, DE: differential evolution, AMPSO: Adaptive Modified Particle Swarm Optimization, CLS: Chaotic Local Search, FSA: Fuzzy Self Adaptive, HOMER: Hybrid Optimization of Multiple Energy Resources, TOPSIS: technique for order of preference by similarity to ideal solution, , SDG: sustainable development goal, MT: micro gas turbine, AC: air conditioner, HESS: hybrid energy storage system, ABC: Artificial Bee Colony, BAS: Beetle Antennae Search Algorithm CCHP: Combined Cooling Heating and Power, MOSSA: multiobjective salp swarm algorithm, MODA: multiobjective dragonfly algorithm, MOALO: multiobjective ant lion optimizer, RF: renewable factor, P2G: Power-to-gas, SOFC/GT: solid oxide fuel cell/gas turbine, MOCS: Multi-Objective Cuckoo Search, MOSaDE: Multi-Objective Self-Adaptive Differential Evolution algorithm.
Disclaimer/Publisher’s Note: The statements, opinions and data contained in all publications are solely those of the individual author(s) and contributor(s) and not of MDPI and/or the editor(s). MDPI and/or the editor(s) disclaim responsibility for any injury to people or property resulting from any ideas, methods, instructions or products referred to in the content. |
© 2024 by the authors. Licensee MDPI, Basel, Switzerland. This article is an open access article distributed under the terms and conditions of the Creative Commons Attribution (CC BY) license (http://creativecommons.org/licenses/by/4.0/).
Copyright: This open access article is published under a Creative Commons CC BY 4.0 license, which permit the free download, distribution, and reuse, provided that the author and preprint are cited in any reuse.


