
Submitted:
04 April 2024
Posted:
05 April 2024
You are already at the latest version
Abstract
Despite significant advances in tumor biology and clinical therapeutics, metastasis remains the primary cause of cancer-related deaths. While RNA-seq technology has been used extensively to study metastatic cancer characteristics, challenges persist in acquiring adequate transcriptomic data. To overcome this challenge, we propose MetGen, a generative contrastive learning based on deep learning model. MetGen generates synthetic metastatic cancer expression profiles using primary cancer and normal tissue expression data. Our results demonstrate that MetGen generates comparable samples to actual metastatic cancer samples, and we discuss the learning mechanism of MetGen. Additionally, we demonstrate MetGen's interpretability using metastatic prostate cancer and metastatic breast cancer. MetGen has learned highly relevant signatures in cancer, tissue, and tumor microenvironment, such as immune response and the metastasis process, which potentially fosters a more comprehensive understanding of metastatic cancer biology. The development of MetGen represents a significant step toward the study of metastatic cancer biology by providing a generative model that identifies candidate therapeutic targets for the treatment of metastatic cancer.
Keywords:
metastatic cancer
; deep learning
; contrastive learning
; tumor microenvironment
1. Introduction
Tumor metastasis is the movement of tumor cells spreading from a primary site and progressively colonizing distant organs. When cancer cells disperse from a primary tumor, they travel to other parts of the body through the blood or lymph system. In over 90% of cases, the metastatic spread of tumor cells is the greatest contributor to deaths from cancer [1]. Treating metastatic cancer is an enormous challenge. For all types of cancer, metastatic tumor patients are often unresponsive to existing corresponding primary cancer treatment. It could be due to the basic biology of metastatic tumors and the lack of treatments targeting their biology. The genetic characteristics of metastatic tumors make them highly resistant to standard treatments for each tumor may have a unique tumor microenvironment (TME) and respond differently to the treatment [2]. It is necessary to characterize the complicated molecular mechanism in order to choose appropriate treatment strategies.
Recently, RNA-seq transcriptome data have been widely used to study the nature of cancer metastasis [3,4,5]. High-throughput technology frees the potential exploration of transcriptome changes at the whole-genome level which would be used for detecting biomarkers for diagnosis and treatment.
One critical challenge of metastatic cancer study is the difficulty of collecting data due to the complicated characteristics of metastatic cancer. Metastatic cancer is quite late-stage cancer, therefore, patients’ survival rate is significantly lower than primary cancer patients which makes the participants in any clinical trial much less [6]. The diagnosis of metastatic cancer is also relatively difficult since the primary site and biopsy site are separated which could be confusing at some points. Therefore, building an Atlas for metastatic cancer could be costly. Even some big projects such as The Cancer Genome Atlas (TCGA) or Integrative Clinical Genomics of Metastatic Cancer (MET500) only store a few hundred metastatic samples, including the tumor types for which the primary tumor is rarely diagnosed such as in melanoma [7,8]. It leaves great potential for metastatic cancer data augmentation.
Generative models, such as Generative Adversarial Networks (GANs), have achieved remarkable successes in various fields, including computer vision and natural language processing [9]. However, despite their potential, GANs suffer from several major challenges. 1) unstable training. their training can be unstable due to the simultaneous training of the generator and discriminator models in an adversarial game, where improvements to one model come at the expense of the other, resulting in difficulty in achieving convergence. 2) mode collapse. GANs are prone to mode collapse, where the generator model can learn to produce samples within a particular mode, resulting in a lack of diversity in the generated data. 3) Massive data requirement. GANs require large amounts of data to produce good results. 4) poor interpretability. The generator has no encouragement on giving interpretable and meaningful representation. In the context of metastatic data, GANs face additional challenges due to the limited availability of samples, especially for rare metastatic cancers where only a few samples are available, resulting in severe unstable training and mode collapse. Furthermore, biological data is complex and carries rich entangled information, requiring an interpretable model for downstream analysis.
To this end, we proposed a metastatic cancer expression generator (MetGen), a contrastive learning based generative model that can generate metastatic expression profiles from primary cancer and normal tissue expression samples. Generating metastatic samples from primary cancer and tissue samples is a challenging task, due mainly to limited metastatic cancer samples and corresponding primary cancer & tissue samples. For example, the MET500 dataset has in total of 868 samples from 22 different metastatic cancer types, where most of the cancer types have less than 30 samples[8]. If we further divide one metastatic cancer into subtypes based on tissue sites, the sample size of each subtype would be even smaller which causes mode collapse and poor generating performance. To resolve this issue, contrastive learning is adopted in our model. The goal of contrastive learning is to learn such an embedding space in which similar sample pairs stay close to each other while dissimilar ones are far apart [10]. Contrastive learning can be applied to both supervised and unsupervised settings. In the context of our study, our objective is to measure the similarity between a generated sample and an actual metastatic sample. Specifically, we aim to minimize the distance between samples that originate from the same type of metastatic cancer, while maximizing the distance between samples from different types of metastatic cancers.
MetGen avoids mode collapse. Mode collapse is caused by the model finding a trivial solution that only fits majority single mode samples but ignores the samples in other modes [11]. In our model, modes are regulated by not only MET500 target samples but also TCGA source samples. All the modes, and metastatic cancer types in our scenario, are predefined and learned evenly. Therefore, there is no way that model ignores any of them.
MetGen ensures stable training. In contrastive learning, samples are fed to the model in pairs[10]. By pairing cancer, tissue, and metastatic sample recursively, we could obtain a massive training dataset easily. For example, one breast cancer sample can pair with multiple different liver tissue samples which results in multiple sample pairs for training. In this way, even rare metastatic cancer types could be trained stable and sufficient.
MetGen has interpretable latent space. MetGen has many advantages in model interpretation. Firstly, MetGen model’s latent code is obtained by Variational autoencoder, and to a large degree, the learned code components are disentangled [12,13]. Each component or component cluster represents different functions. Secondly, the autoencoder gives a convenient connection between latent space and gene expression space. The changes in latent space could be reflected in gene expression space by reconstructing latent code. Therefore, the biological function of each code components could be learned in expression space easily by masking them out in code space.
In summary, our proposed model integrates primary cancer information into the context of metastasized tissue site during the generative process. This allows for differential analysis and interpretable visualization in a latent space. We anticipate that our model can facilitate the identification of functional pathways associated with cancer metastasis and contribute to the investigation of their roles in this process.
2. Results and Discussion
Overview of the MetGen framework for generating metastatic expression profiles. The MetGen framework consists of two model components, MetVAE and MetGen. Establishing the MetGen framework includes three stages, i.e., 1) Training MetVAE to obtain latent metastatic cancer codes for MET500 samples, 2) Training MetGen to generate metastatic cancer codes through contrastive mixing of cancer and tissue expressions, and 3) Reconstructing metastatic cancer expression from the generated metastatic cancer code (Figure 1).
In the first stage, MetVAE was trained using gene expression profiles from the Integrative Clinical Genomics of Metastatic Cancer (MET500). MetVAE is a variational autoencoder (VAE) that includes an encoder and a decoder (Figure 1a). MetVAE encoder converts a metastatic gene expression sample to a latent metastatic code distribution, which represents a low dimensional representation of the input expression. MetVAE decoder takes a sample from the latent code distribution and reconstructs the input gene expression. MetVAE was trained to minimize the VAE loss that enforces the reconstructed sample to be close to input while minimizing the KL divergence between the learned latent code distribution and standard Gaussian distribution. Therefore, MetVAE learns to produce good latent representations of input MET500 metastatic samples.
In the second stage, MetGen was trained using TCGA primary cancer and tissue expression samples to generate the latent metastatic code of a metastatic cancer type from the corresponding paired primary cancer and tissue expression data (Figure 1b). MetVAE includes two expression encoders with shared weights followed by a CNN mixer (Figure 1b). The two expression encoders convert TCGA primary cancer and tissue gene expression data to primary cancer and tissue latent codes, respectively. The two encoders, which are shared-weights convolutional neural networks (CNNs), extract cancer and tissue features and filter useless information for generating metastatic cancer samples. The CNN mixer integrates cancer and tissue codes to generate the corresponding metastatic cancer code, i.e., code for the corresponding input primary cancer spreading to the input tissue. At the input of the CNN mixer are stacked cancer and tissue codes (Figure 1b), which are compressed into a 1D code by multiple 2 × 1 kennels, each mixing them into different metastatic cancer related features. Two fully connected layers are followed to produce nonlinear combinations of these features and generate the metastatic cancer code. The expression encoder and CNN mixer are trained with a contrastive learning loss to make the generated codes follow the distribution of MetVAE codes of the corresponding metastatic cancer in MET500. The contrastive learning loss compares the generated code and a MET500 metastatic code and minimizes the distances between the codes of matching metastatic cancer types (e.g., when the MetGen output code is generated from TCGA breast cancer and live tissue and MetVAE code is from MET500 breast cancer in liver) but keeps the distance of codes from mismatched types at a preset margin. When the training converges, MetGen would generate metastatic cancer codes as close to MET500 codes of the matching metastatic cancer type as possible but not to be confused with other metastatic cancer types.
In the third stage, the MetGen generated metastatic code is fed into the MetVAE decoder to reconstruct the corresponding metastatic cancer gene expression profile (Figure 1c).
Training and testing data preparation. The dataset MET500 and TCGA used to train MetGen are downloaded from UCSC XenaHub. For the sake of discussion, we use the term ‘cancer type’ for TCGA primary cancer and metastatic cancer types; ‘tissue type’ for TCGA normal tissue and metastatic biopsy sites; ‘metastatic subtype’ for specific primary cancer migrated in specific tissue site.
TCGA and MET500 have 20 common cancer types. Our goal is to learn metastatic cancer samples, therefore we want to keep target information in training as much as possible. We picked the top 6 largest sample cancer types in MET500. Common tissue types shared by TCGA and MET500 are 16 in total, 6 of them are associated with selected cancer types. Thus, we have 6 cancer types, 6 tissue types and 21 metastatic subtypes left. We further removed two metastatic subtypes, breast cancer migrated from one to another and lung cancer migrated from one to another, from MET500 data, since it’s difficult to define such a metastasis in our model when there are no left and right labels for breasts and lungs in datasets. We filtered datasets based on selected cancer, tissue types and metastatic subtypes. 3052 TCGA cancer samples in 6 cancer types, 338 TCGA tissue samples in 6 tissue types and 219 MET500 samples in 19 metastatic subtypes are kept (Table 1).
We randomly take one sample from each TCGA primary cancer, TCGA normal tissue and MET500 metastatic cancer. Three samples together are called a pair. In each pair, if TCGA samples and MET500 samples matches in both cancer type and tissue type, we call it positive pair. Otherwise, it’s called negative pair. For instance, a pair including TCGA breast cancer, TCGA normal liver tissue and MET500 breast cancer in liver is a positive pair while a pair including TCGA breast cancer, TCGA lung tissue and MET500 breast cancer in bladder is negative pair, etc. We generated 1000 positive pairs for each metastatic subtype and three times negative pairs, in total 76,000 pairs for training and validating. We also generate another 3800 pairs sample, 200 pairs for each metastatic subtypes, as testing data which is held out during training.
Expressions in all samples were normalized and transformed into log2(FPKM +1) and then scaled between 0 and 1 by the min-max scaler. 7,312 genes were selected for this study. The data preparation is explained in greater detail in Method.
MetVAE codes capture the cancer and tissue features of metastatic samples. We first examined if MetVAE codes could represent metastatic samples in lower dimensions without compromising feature patterns. The expressions and MetVAE latent codes are visualized using t-SNE [14] (Figure 2). In the expression space, unlike primary tumors [15] (Supplementary Figure S3), metastatic samples do not form distinguish clusters, though most of the cancer types are loosely grouped such as BRCA and PRAD (Figure 2a). On the other hand, tissue types are not segregated based on biopsy sites, with the exception of liver [8] (Figure 2b). In code space, cancer types show similar pattern to data space sample (Figure 2c), however, more cancer groups are more clustered than in gene expressions. For example, BRCA, HNSC and PRAD are further separated from other cancer groups and formed clear clusters. For tissue types t-SNE (Figure 2d), no significant change discovered. We still observe liver tissues clustered together while other tissue types loosely distributed. In general, MET500 samples group in cancer types, and within cancer clusters we can observe multiple tissue sites. This is expected because metastatic cancer is the primary tumor cell metastasized to other tissue sites. They are still considered same cancer type as primary tumor, so the overall characteristics is similar. In summary, our MetVAE model learns faithful pattern of the cancer types, tissue types and metastatic subtypes in code space compared to gene expression space if not better.
To further quantify the extent to which the latent metastatic cancer codes captured both cancer and tissue features, we trained two classifiers on MET500 codes to predict cancer types and tissue types, respectively. The cancer classifier and tissue classifier achieved 98.3 ± 0.7% and 92.3 ± 0.6% ROC AUCs, indicating that MetVAE could capture both cancer and tissue information of MET500 samples correctly.
MetGen generates high-quality metastatic cancer samples that reveal the distinct patterns of metastatic cancer types. We generated 200 samples for every 19 metastatic subtypes, resulting in 3,800 samples, using testing data. To visualize the results, t-SNE was applied to reduce the feature dimensions. We observed 19 metastatic subtypes clusters while original MET500 data does not form such clear cancer and tissue clusters (Figure 3a). To test if the generated codes reserve the cancer and tissue information, we tested 3,800 generated codes on trained cancer classifier and tissue classifier. The performance yields to 99.9% and 96.6% for cancer type and tissue type respectively. Nearly perfect classification performance suggests the generated code has very similar cancer and tissue feature to true MET500 code, or classifiers would not be able to classify them correctly.
To better show how MetGen reveals metastatic cancer distribution, we projected true MET500 sample to generated metastatic samples’ t-SNE plot (Figure 3a). We found original data points and generated data points have significant overlaps. To be more specific, for each generated cluster, there are original metastatic samples enclosed. That is to say, MetGen generated new samples around the original metastatic target samples and impute space in between. The more data generated the better distribution pattern would show in t-SNE plot. To justify the results quantitatively, we trained a classifier on our testing dataset to predict metastatic subtypes. The idea is to see whether learned knowledge from generated metastatic data can apply on true metastatic samples. Unsurprisingly, the model shows good predicting power for trueMET500 samples with ROC AUC score 97.6%, which furtherly demonstrates MetGen’s power in generating high quality metastatic samples from primary cancer and normal tissues.
To investigate one metastatic subtype specifically, we used breast cancer in liver for example. We first retrieved all breast cancer in liver samples from MET500, breast cancer samples and normal liver tissue samples from TCGA, then compared them with 1000 generated breast cancer in liver sample in gene expression heatmaps (Figure 3b). Generated samples do not only have similar discriminative power but also look like true samples in gene expressions. Some genes are not active in primary breast cancer but found high expression level in metastatic breast cancer. Those genes are also upregulated in liver tissues. It implies MetGen learns metastatic cancer by merging primary cancer information into tissue environment.
MetGen model learns metastatic prostate cancer characteristics. The development of metastatic cancer requires cancer cells to leave their primary sites and eventually acclimate to new cellular surroundings in tissue sites. It is rather complicated than simply ‘put tumor to target location’. We used metastatic prostate cancer for example to illustrate how MetGen takes advantage of its architecture to capture metastatic cancer information.
We generated 4000 metastatic prostate samples in four different tissue sites (lung, liver, bladder, skin) using TCGA-PRAD and TCGA normal samples. Another 4000 samples were generated similarly except the MetGen cancer branch was muted, thus generated samples do not contain prostate cancer information, namely masked cancer samples (Figure 4A). To study the characteristics of the samples robustly, we use gene set variation analysis (GSVA) [16] to perform single sample gene set analysis on 186 KEGG and 50 HALLMARK gene sets downloaded from MSigDB collection [17,18]. GSVA transforms gene expression files into 236 gene set signatures. Eventually, we obtain a GSVA score matrix of 8000 by 236. Each number is a sample’s enrichment score for one specific gene set (Figure 4b). Metastatic prostate cancer and masked cancer metastatic sample shows clear different patterns. We anticipate the difference is mainly contributed by the cancer information in metastatic prostate cancer.
We performed differential analysis to identify the difference of two groups (Figure 4c). KEGG androgen response (AR), a key pathway in prostate cancer, ranked high in upregulation pathways. Multiple studies identified it in the development of the normal prostate and in the progression from primary to metastasis, low AR transcriptional activity resulted in upregulated AR expression [19,20,21]. Some other well-known metastatic prostate pathways such as purine metabolism [22,23,24], complement and coagulation cascades [25,26] were also successfully detected by our model. Cancer intrinsic pathways like P53 signaling along with WNT β catenin signaling were found more activate in masked cancer samples which also makes sense since prostate cancer are usually suppressive [27,28]. Furthermore, tumor microenvironment (TME) pathways ECM receptor interaction [29,30] and epithelial mesenchymal transition [31,32] found significantly differential expressed in our comparison. The metastatic cascade is dependent on the loss of adhesion between cells which results in the dissociation of the cell from the primary tumor, and subsequently the ability of the cell to attain a motile phenotype via changes in cell to matrix interaction (Figure 4c, Supplementary Table S1).
MetGen not only ranked prostate cancer related pathways highly but also detected multiple cancer intrinsic and metastatic TME pathways correctly (Figure 4c). Such results prove our model could leverage cancer information from primary tumor and then embed it to local tumor microenvironment.
MetGen latent components learns functional clusters in metastatic breast cancer in bladder. The latent code leaned from MetVAE reserves key metastatic cancer information, however due to a limited number of metastatic cancer samples, interpret the code statistically is often difficult. We use metastatic breast cancer in bladder to illustrate how our model helps in latent functional interpretation.
We generated 1000 metastatic breast cancer in bladder latent code using TCGA-BRCA and TCGA normal bladder tissues. Then, the hierarchical cluster was used to characterize 100 code components into clusters and high concordance was shown among 3 functional clusters (Figure 5a).
To discover the pathway enriched in these functional clusters, we use similar masking approach from previous section. For instance, to get cluster 1 pathways, we set the cluster 1code components to zero, keep the rest components value as they are, then fed the masked code to MetVAE decoder to obtain masked metastatic cancer samples. Later on, masked metastatic cancer samples will be compared to non-masked metastatic cancer samples, therefor the difference is mainly contributed by cluster 1 components (Figure 5b).
Similar to metastatic prostate cancer analysis, we first transform our samples into KEGG and HALLMARK gene set signatures using GSVA. Since we have three cluster masked samples and non-masked samples, 4000 by 236 GSVA score matrix was obtained. Figure 5c shows the heatmap of activate level for gene sets in different samples.
To identify the cluster information, three differential comparisons were performed using LIMMA, for instance, metastatic breast cancer samples vs. each masked cluster samples. Top 20 of positive and negative differential pathways from each comparison were selected for analysis (Supplementary Table S2). From the results (Figure 5d), we noticed functional clusters often represents multiple functions. We roughly group them into 5 signatures.
Cell cycle. All three clusters detected G2M checkpoint, E2F targets and MYC targets V1 upregulated. Those pathways are closely related to cell cycle process which is commonly active in biological samples [33,34,35,36].
Immune response. Immune response related pathways are mostly located in cluster 2 and 3 components. In this group we found interferon alpha response, phosphatidylinositol signaling system and PIK3, AKT, mTOR signaling which are actively regulated in immune activation and cell migration in the innate immune system [37,38]. Additionally, estrogen response has been proved with immunoenhancing effect on the immune system [39]. Above pathways together have been shown to regulate immune response by impairing negative selection of high affinity auto-reactive B cells, modulating B cell function, and leading to Th2 response [40].
Inflammatory/Cell differentiation/metastasis. This group has rather homogeneous pathways score pattern but very complicated signature. Cluster 1 and 3 detected both Hedgehog and Notch signaling pathways. Hedgehog is a signaling pathway that transmits information to embryonic cells required for proper cell differentiation. Notch signaling promotes proliferative signaling during neurogenesis, and its activity is inhibited by Numb to promote neural differentiation. They play a major role in the regulation of embryonic development [41,42,43]. Interestingly, cluster 1 and 3 also detected olfactory signaling and melanogenesis pathways, along with Hedgehog and Notch signaling pathways, are often found in melanoma tumor metastasis [44]. We also found several pathways related to specifical T cell response and immune cell trafficking in cluster 1 and 3. Antigen processing and presentation is a well-known pathway which can digest protein they encounter and display peptide fragment from them on their surface for another immune cell to recognize [45,46]. Cytosolic DNA sensing pathway are responsible for detecting foreign DNA from invading microbes or host cells and generating innate immune responses [47]. Besides those pattern recognition receptors, immune cells such as T cell receptor and NK cell mediated cytotoxicity signals are also activated which strongly implies this group is for inflammatory response.
Cellular metabolism. Cellular metabolism involves complex sequences of controlled biochemical reactions, better known as metabolic pathways. These processes allow organisms to grow and reproduce, maintain their structures, and respond to environmental changes. We found two important cell metabolism target files, lipid metabolism and cytochrome P450 (CYP450). CYP450 are usually membrane-bound and localized to the inner mitochondrial or endoplasmic reticular membrane [48]. Lipid metabolism are important sources of cellular energy, stored as triglycerides[49]. Both play critical roles in oxygenase activity [50].
Bladder function. Cluster 2 detected a few non cancer related pathways such as vascular smooth muscle contraction, tight junction and calcium signaling pathways [51,52]. Those pathways are highly correlated to muscle activities of bladder. We believe metastatic tissue site information are mainly stored in this cluster.
Above results show MetGen latent code components give great interpretability. Each functional code cluster captured multiple functional processes which are highly correlated to metastatic breast cancer. The generated samples reveal the characteristics of metastasis, target tissue sites and regular cancer related immune responses.
3. Method
3.1. Data Preprocessing
Both TCGA and MET500 has huge number of genes, most of those genes have very low expression and discriminative power, thus they induce noisy background which essentially hurt the model training. Also, two datasets have different labeling. Since the goal is to generate MET500 samples from TCGA samples, we need to match two datasets in genes and labels.
To unify TCGA and MET500 genes, we first filtered out genes in MET500 with mean and standard deviation of less than -5 and 1.5 respectively. 6032 genes were kept after filtering. Similarly, we use mean and standard deviation to filter TCGA data and 4096 genes were kept. We took union of two gene sets, then removed the genes which do not exist in both TCGA and MET500. Eventually, 7312 genes were kept for this study.
To unify TCGA and MET500 labels, we first combined similar cancer types in TCGA then renamed all the TCGA cancer label to the corresponding cancer label in MET500. Specifically, four primary cancer groups in TCGA known as [(COAD, READ), (KIRP, KIRC, KICH), (LUAD, LUSC), LIHC] were renamed as their corresponding metastatic labels in MET500 [COLO, KDNY, LUNG, HCC], respectively. After relabeling, TCGA and MET500 have in total 20 common cancer types. We pick the 6 top number common cancer types in MET500 as the total cancer types in this study since we want to have target information as much possible. Corresponding tissue types in both TCGA and MET500 dropped to 6 after cancer types filtering, we kept all of them as total tissue types in this study.
Training and testing data preparation. Training data has in total 6 cancer types and 6 tissue types in both TCGA samples and MET500 samples. After removing breast cancer in breast and lung cancer in lung from MET500 data, we obtained 219 samples in 19 metastatic subtypes such as BRCA in bladder, SARC in lung, etc. For each combination, we sampled pairs from TCGA cancer, normal tissue and MET500 samples. If TCGA cancer plus TCGA normal tissue match with MET500 sample, we call it positive pair, otherwise it’s called negative pair. For example, TCGA breast cancer, TCGA liver tissue and MET500 breast cancer in liver is a positive pair while TCGA breast cancer, TCGA lung tissue, and MET500 breast cancer in bladder are negative pairs, etc. Negative pairs are critical for contrastive learning, increasing number of negative pairs improves the downstream task performance[53]. We generated 1000 positive pairs and 3000 negative pairs for each combination in a total of 76,000 sample pairs and split them into training data and validation data. We also created another 3800 sample pairs, 200 pairs for each combination, as testing data which is held out during training.
3.2. MetVAE Model
In this section, we explain the variational autoencoder used in MET500 code extraction in detail. Unlike classic autoencoder, variational autoencoder does not just learn representative code but the prior distribution of data [13]. We modeled MET500 gene expression from a Gaussian distribution . Vanilla VAE encourages posterior distribution over the to be isotropic Gaussian thus the latent code could have disentangled features which is convenient for further interpretation work.
Our VAE network has a standard architecture that consists of an encoder of two layers, a loss function, and a decoder of two layers. The number of neurons per hidden layer in the encoder used was 1000 and 100 with a symmetric decoder. All neural networks use batch normalization layer. The activation function between two hidden layers is ReLU. We use a sigmoid activation in the decoder.
The goal of inference is to estimate the maximum likelihood of which is naturally defined by decoder. We cannot apply Bayes theorem directly because in general it is an intractable computation. However, we could use the variational inference technique to low-bound the likelihood which can be expressed as
Where is predefined to be Gaussian with diagonal covariance matrix. Mean and covariance are learned from the encoder network.
We use Adam optimizer to train the model with an initial learning rate of 0.0001 and a decay rate of 1e-6. The model is trained in batch size 32 and optimizes the objective function. When the loss is stable for more than 20 epochs, we stop the training since the model is converged. In our case, it usually takes around 200 epochs. After the model is well trained, we save code z of MET500 for further studies.
3.3. Contrastive Learning for MetGen
In this section we explain the MetGen network in greater details. The whole framework consists of three modules, TCGA encoder, CNN mixer and contrastive learner.
TCGA encoder. The performance of machine learning algorithms can be impacted dramatically by too many features, generally referred as ‘curse of dimensionality’. The reason for the curse of dimensionality is essentially caused by complication of large data space which contains noise and unnecessary information. When dealing with high dimensional data, it is often efficient to reduce the number of features by projecting the data to a lower dimensional space:
Where , are input TCGA samples, is the encoder, represents the parameters of the encoder.
To capture features of TCGA data, we adopted the architecture from published work [54] which is built by two CNN layers and one fully connected layer. Previous work used all 33 cancer types and normal tissue for training, since our data are relatively small, we reduced the number of parameters of the previous model to have smaller model space.
CNN mixer.CNN mixer is the model merging cancer code and tissue code to generate metastatic cancer code. It learns the mechanism of tissue environment activation for cancer invasion.
CNN mixer consists of two CNN layers and one fully connected layer. First, the module stacks the cancer code and tissue code to 2 × 512 matrix, then feed the matrix to first CNN layer. We used 64 kernels in 2 × 1 to learn the merging process. Since cancer code and tissue code are in same space, 2 × 1 kernel gives us better biological meaning which is helpful in interpretation. The second CNN layer and fully connected layer are used to project the output code to a dimension of 100 so that we can compare it with corresponding MET500 code.
Where f is the CNN mixer module, ω represents the parameters of CNN mixer.
Contrastive learner. Contrastive loss takes the output of a positive example and calculates its distance to an example in the same class and contrasts it with the distance of negative examples[10]. In our case, the network will calculate the Euclidian distance of the generated code and MET500 code. When the labels of two codes match, the Euclidian distance should be minimized to zero, otherwise, the distance would be pushed to a margin. Thus, our final loss function is:
Where is the Euclidian distance, is the label of sample pair, 1 and 0 for positive and negative respectively.
3.4. Standard DNN Classifiers
The classifier used in all the classification tasks adopted the same architecture. We construct a two layers MLP neural network which has 60 and 40 neurons in each layer. The activation function is chosen as ReLU. Then model feeds extracted low dimensional features to SoftMax classifier for prediction.
All the deep learning models are trained on Keras API with TensorFlow backend [55].
3.5. GSVA
Gene set variation analysis (GSVA) is a nonparametric unsupervised analysis method mainly used to evaluate the gene set enrichment of single samples [16]. The expression matrix of genes is transformed into the expression matrix of pathways in different samples to evaluate different pathways enriched in different samples. It stabilizes the gene expression signals in robust high-level functions. In this study, we perform GSVA using GSVA package in R software. KEGG and HALLMARK gene sets are downloaded from MSigDB collection [56].
3.6. Differential Analysis
The Bioconductor Linear Model for Microarray Analysis (LIMMA) package was used to calculate the differential pathway expression of each cancer sample in the present study. LIMMA remains highly recommended for such analyses since the pathway expressions from GSVA are continuous number which is more similar to microarray analysis [57].
4. Conclusions
We proposed an interpretable deep-learning framework inspired by contrastive learning for metastatic cancer sample generation using primary tumor and normal tissue samples. The pipeline consists of two model components, MetVAE and MetGen. We comprehensively investigated our models’ performance and interpretability using TCGA and MET500 data. We show that
- MetVAE can encode metastatic cancer and tissue site information faithfully into latent code. We investigated MetVAE for cancer and tissue type classification using MET500 data and our model gives good performance on both tasks.
- MetGen can generate metastatic cancer expressions from primary tumor and normal tissues. We generated 19 metastatic cancer types using TCGA data. Our generated samples reserved essential metastatic cancer information and achieved good performance in multiple classification tests.
- We demonstrated the interpretability of our models using metastatic prostate cancer and metastatic breast cancer in bladder. Highly relevant functions are learned from primary cancer and tissue sites which further affirmed the power of our model.
Inevitably, there are still many challenges to be addressed. Metastatic tumors are highly microenvironment dependent, right now our model only provide a general environment tissue site. For same reason, the model cannot deal with the scenario such as cancer cell travels from left breast to right breast either. Research into solutions to these challenges will be our future focus.
Supplementary Materials
The following supporting information can be downloaded at the website of this paper posted on Preprints.org. Supplementary Table S1 – metastatic prostate cancer pathways; Supplementary Table S2 - metastatic breast cancer in bladder functional cluster pathways.
Author Contributions
Conceptualization, Y.H. and Z.L.; methodology, Y.H., Y.-C.C. and Z.L.; formal analysis, Z.L.; writing—original draft preparation, Z.L.; writing—review and editing, Y.H., Y.C.; visualization, Z.L.; supervision, Y.H.; project administration, Y.H.; funding acquisition, Y.C. and Y.H. All authors have read and agreed to the published version of the manuscript.
Funding
This research was supported by Cancer Prevention and Research Institute of Texas (RP160732 and RP190346), and National Institutes of Health (K99CA248944 and R00CA248944).
Data Availability Statement
All data used in this study are publicly available on XenaHub; The code is available at: https://github.com/Fclef/MetGen.
References
- Seyfried, T.N.; Huysentruyt, L.C. On the Origin of Cancer Metastasis. Crit. Rev. Oncog. 2013, 18, 43–73. [Google Scholar] [CrossRef]
- Quail, D.F.; Joyce, J.A. Microenvironmental regulation of tumor progression and metastasis. Nat. Med. 2013, 19, 1423–1437. [Google Scholar] [CrossRef]
- Crea, F.; Clermont, P.L.; Parolia, A.; Wang, Y.; Helgason, C.D. The non-coding transcriptome as a dynamic regulator of cancer metastasis. Cancer Metastasis Rev. 2013, 33, 1–16. [Google Scholar] [CrossRef]
- Crnic, I.; Christofori, G. Novel technologies and recent advances in metastasis research. Int. J. Dev. Biol. 2004, 48, 573–581. [Google Scholar] [CrossRef]
- Welch, D.R. Microarrays bring new insights into understanding of breast cancer metastasis to bone. Breast Cancer Res. 2003, 6, 61–64. [Google Scholar] [CrossRef] [PubMed]
- Caswell-Jin, J.L.; Plevritis, S.K.; Tian, L.; Cadham, C.J.; Xu, C.; Stout, N.K.; Sledge, G.W.; Mandelblatt, J.S.; Kurian, A.W. Change in Survival in Metastatic Breast Cancer with Treatment Advances: Meta-Analysis and Systematic Review. JNCI Cancer Spectr. 2018, 2, pky062. [Google Scholar] [CrossRef]
- Weinstein, J.N.; et al. The cancer genome atlas pan-cancer analysis project. Nature genetics 2013, 45, 1113–1120. [Google Scholar] [CrossRef]
- Robinson, D.R.; Wu, Y.-M.; Lonigro, R.J.; Vats, P.; Cobain, E.; Everett, J.; Cao, X.; Rabban, E.; Kumar-Sinha, C.; Raymond, V.; et al. Integrative clinical genomics of metastatic cancer. Nature 2017, 548, 297–303. [Google Scholar] [CrossRef] [PubMed]
- Durgadevi, M. Generative Adversarial Network (GAN): a general review on different variants of GAN and applications. In Proceedings of the 2021 6th International Conference on Communication and Electronics Systems (ICCES), Coimbatre, India, 8–10 July 2021; pp. 1–8. [Google Scholar]
- Chicco, D. Siamese neural networks: An overview. Artificial Neural Networks 2021, 73–94. [Google Scholar]
- Kushwaha, V.; Nandi, G.C. Study of Prevention of Mode Collapse in Generative Adversarial Network (GAN). In Proceedings of the 2020 IEEE 4th Conference on Information & Communication Technology (CICT), Chennai, India, 3–5 December 2020; pp. 1–6. [Google Scholar]
- Higgins, I.; et al. beta-vae: Learning basic visual concepts with a constrained variational framework. In Proceedings of the International conference on learning representations; 2017. [Google Scholar]
- Kingma, D.P.; Welling, M. Auto-encoding variational bayes. arXiv 2013, arXiv:1312.6114. [Google Scholar]
- Van der Maaten, L.; Hinton, G. Visualizing data using t-SNE. Journal of machine learning research 2008, 9. [Google Scholar]
- Zhang, Z.; Hernandez, K.; Savage, J.; Li, S.; Miller, D.; Agrawal, S.; Ortuno, F.; Staudt, L.M.; Heath, A.; Grossman, R.L. Uniform genomic data analysis in the NCI Genomic Data Commons. Nat. Commun. 2021, 12, 1–11. [Google Scholar] [CrossRef]
- Hänzelmann, S.; Castelo, R.; Guinney, J. GSVA: gene set variation analysis for microarray and RNA-Seq data. BMC Bioinform. 2013, 14, 7. [Google Scholar] [CrossRef] [PubMed]
- Liberzon, A.; Birger, C.; Thorvaldsdóttir, H.; Ghandi, M.; Mesirov, J.P.; Tamayo, P. The Molecular Signatures Database Hallmark Gene Set Collection. Cell Syst. 2015, 1, 417–425. [Google Scholar] [CrossRef] [PubMed]
- Kanehisa, M.; Goto, S. KEGG: Kyoto Encyclopedia of Genes and Genomes. Nucleic Acids Res. 2000, 28, 27–30. [Google Scholar] [CrossRef] [PubMed]
- Alumkal, J.J.; Sun, D.; Lu, E.; Beer, T.M.; Thomas, G.V.; Latour, E.; Aggarwal, R.; Cetnar, J.; Ryan, C.J.; Tabatabaei, S.; et al. Transcriptional profiling identifies an androgen receptor activity-low, stemness program associated with enzalutamide resistance. Proc. Natl. Acad. Sci. 2020, 117, 12315–12323. [Google Scholar] [CrossRef] [PubMed]
- Formaggio, N.; Rubin, M.A.; Theurillat, J.-P. Loss and revival of androgen receptor signaling in advanced prostate cancer. Oncogene 2021, 40, 1205–1216. [Google Scholar] [CrossRef] [PubMed]
- Davies, A.; Nouruzi, S.; Ganguli, D.; Namekawa, T.; Thaper, D.; Linder, S.; Karaoğlanoğlu, F.; Omur, M.E.; Kim, S.; Kobelev, M.; et al. An androgen receptor switch underlies lineage infidelity in treatment-resistant prostate cancer. Nat. Cell Biol. 2021, 23, 1023–1034. [Google Scholar] [CrossRef] [PubMed]
- Yin, J.; Ren, W.; Huang, X.; Deng, J.; Li, T.; Yin, Y. Potential Mechanisms Connecting Purine Metabolism and Cancer Therapy. Front. Immunol. 2018, 9, 1697. [Google Scholar] [CrossRef]
- De Vitto, H.; et al. The intersection of purine and mitochondrial metabolism in cancer. Cells 2021, 10, 2603. [Google Scholar] [CrossRef]
- Ahmad, F.; Cherukuri, M.K.; Choyke, P.L. Metabolic reprogramming in prostate cancer. Br. J. Cancer 2021, 125, 1185–1196. [Google Scholar] [CrossRef] [PubMed]
- Revel, M.; et al. Complement system: promoter or suppressor of cancer progression? Antibodies 2020, 9, 57. [Google Scholar] [CrossRef] [PubMed]
- Stallone, G.; Netti, G.S.; Cormio, L.; Castellano, G.; Infante, B.; Pontrelli, P.; Divella, C.; Selvaggio, O.; Spadaccino, F.; Ranieri, E.; et al. Modulation of complement activation by pentraxin-3 in prostate cancer. Sci. Rep. 2020, 10, 1–11. [Google Scholar] [CrossRef] [PubMed]
- Zhang, Y.; Wang, X. Targeting the Wnt/β-catenin signaling pathway in cancer. J. Hematol. Oncol. 2020, 13, 1–16. [Google Scholar] [CrossRef] [PubMed]
- Wen, X.; Wu, Y.; Awadasseid, A.; Tanaka, Y.; Zhang, W. New Advances in Canonical Wnt/β-Catenin Signaling in Cancer. Cancer Manag. Res. 2020, 12, 6987–6998. [Google Scholar] [CrossRef] [PubMed]
- Brassart-Pasco, S.; Brézillon, S.; Brassart, B.; Ramont, L.; Oudart, J.-B.; Monboisse, J.C. Tumor Microenvironment: Extracellular Matrix Alterations Influence Tumor Progression. Front. Oncol. 2020, 10, 397. [Google Scholar] [CrossRef] [PubMed]
- Bao, Y.; Wang, L.; Shi, L.; Yun, F.; Liu, X.; Chen, Y.; Chen, C.; Ren, Y.; Jia, Y. Transcriptome profiling revealed multiple genes and ECM-receptor interaction pathways that may be associated with breast cancer. Cell. Mol. Biol. Lett. 2019, 24, 38. [Google Scholar] [CrossRef] [PubMed]
- Jing, Y.; Han, Z.; Zhang, S.; Liu, Y.; Wei, L. Epithelial-Mesenchymal Transition in tumor microenvironment. Cell Biosci. 2011, 1, 29–29. [Google Scholar] [CrossRef]
- Gao, D.; Mittal, V. Tumor microenvironment regulates epithelial–mesenchymal transitions in metastasis. Expert Rev. Anticancer. Ther. 2012, 12, 857–859. [Google Scholar] [CrossRef]
- Stark, G.R.; Taylor, W.R. Analyzing the G2/M checkpoint. Checkpoint Controls and Cancer: Volume 1: Reviews and Model Systems, 2004: p. 51-82.
- Eastman, A. Cell cycle checkpoints and their impact on anticancer therapeutic strategies. J. Cell. Biochem. 2003, 91, 223–231. [Google Scholar] [CrossRef]
- Ren, B.; Cam, H.; Takahashi, Y.; Volkert, T.; Terragni, J.; Young, R.A.; Dynlacht, B.D. E2F integrates cell cycle progression with DNA repair, replication, and G2/M checkpoints. Genes Dev. 2002, 16, 245–256. [Google Scholar] [CrossRef] [PubMed]
- Dang, C.V. c-Myc Target Genes Involved in Cell Growth, Apoptosis, and Metabolism. Mol. Cell. Biol. 1999, 19, 1–11. [Google Scholar] [CrossRef] [PubMed]
- Xie, S.; Chen, M.; Yan, B.; He, X.; Chen, X.; Li, D. Identification of a Role for the PI3K/AKT/mTOR Signaling Pathway in Innate Immune Cells. PLOS ONE 2014, 9, e94496. [Google Scholar] [CrossRef] [PubMed]
- Belardelli, F.; Ferrantini, M.; Proietti, E.; Kirkwood, J.M. Interferon-alpha in tumor immunity and immunotherapy. Cytokine Growth Factor Rev. 2002, 13, 119–134. [Google Scholar] [CrossRef] [PubMed]
- Cutolo, M.; et al. Estrogens, the immune response and autoimmunity. Clinical and experimental rheumatology 1995, 13, 217–226. [Google Scholar] [PubMed]
- Kovats, S. Estrogen receptors regulate innate immune cells and signaling pathways. Cell. Immunol. 2015, 294, 63–69. [Google Scholar] [CrossRef] [PubMed]
- Lin, G.L.; Hankenson, K.D. Integration of BMP, Wnt, and notch signaling pathways in osteoblast differentiation. J. Cell. Biochem. 2011, 112, 3491–3501. [Google Scholar] [CrossRef] [PubMed]
- Jia, Y.; Wang, Y.; Xie, J. The Hedgehog pathway: role in cell differentiation, polarity and proliferation. Arch. Toxicol. 2015, 89, 179–191. [Google Scholar] [CrossRef] [PubMed]
- Lawson, N.D.; Vogel, A.M.; Weinstein, B.M. sonic hedgehog and vascular endothelial growth factor Act Upstream of the Notch Pathway during Arterial Endothelial Differentiation. Dev. Cell 2002, 3, 127–136. [Google Scholar] [CrossRef]
- Zhang, H.; et al. The role of calcium signaling in melanoma. International journal of molecular sciences 2022, 23, 1010. [Google Scholar] [CrossRef]
- Jurewicz, M.M.; Stern, L.J. Class II MHC antigen processing in immune tolerance and inflammation. Immunogenetics 2018, 71, 171–187. [Google Scholar] [CrossRef] [PubMed]
- Alberts, B.; et al. T cells and MHC proteins, in Molecular Biology of the Cell, 4th ed.; Garland Science, 2002. [Google Scholar]
- Barber, G.N. Innate immune DNA sensing pathways: STING, AIMII and the regulation of interferon production and inflammatory responses. Curr. Opin. Immunol. 2011, 23, 10–20. [Google Scholar] [CrossRef] [PubMed]
- McDonnell, A.M.; Dang, C.H. Basic review of the cytochrome p450 system. Journal of the advanced practitioner in oncology 2013, 4, 263. [Google Scholar] [PubMed]
- Liu, K.; Czaja, M.J. Regulation of lipid stores and metabolism by lipophagy. Cell Death Differ. 2012, 20, 3–11. [Google Scholar] [CrossRef] [PubMed]
- Nelson, D.R. The Cytochrome P450 Homepage. Human genomics 2009, 4, 59–65. [Google Scholar] [CrossRef] [PubMed]
- Carattino, M.D.; Prakasam, H.S.; Ruiz, W.G.; Clayton, D.R.; McGuire, M.; Gallo, L.I.; Apodaca, G.; Lu, M.; Li, J.-R.; Alvarez-Lugo, L.; et al. Bladder filling and voiding affect umbrella cell tight junction organization and function. Am. J. Physiol. Physiol. 2013, 305, F1158–68. [Google Scholar] [CrossRef] [PubMed]
- Kuo, I.Y.; Ehrlich, B.E. Signaling in muscle contraction. Cold Spring Harbor perspectives in biology 2015, 7, a006023. [Google Scholar] [CrossRef] [PubMed]
- Chen, T.; et al. A Simple Framework for Contrastive Learning of Visual Representations. In Proceedings of the 37th International Conference on Machine Learning, D. Hal, III and S. Aarti, Editors. 2020, PMLR: Proceedings of Machine Learning Research. p. 1597--1607.
- Mostavi, M.; Chiu, Y.-C.; Huang, Y.; Chen, Y. Convolutional neural network models for cancer type prediction based on gene expression. BMC Med Genom. 2020, 13, 1–13. [Google Scholar] [CrossRef] [PubMed]
- Chollet, F., Keras: Deep Learning Library. 2015. URL https://github. com/fchollet/keras.
- Liberzon, A.; Subramanian, A.; Pinchback, R.; Thorvaldsdóttir, H.; Tamayo, P.; Mesirov, J.P. Molecular signatures database (MSigDB) 3.0. Bioinformatics 2011, 27, 1739–1740. [Google Scholar] [CrossRef]
- Ritchie, M.E.; Phipson, B.; Wu, D.; Hu, Y.; Law, C.W.; Shi, W.; Smyth, G.K. limma powers differential expression analyses for RNA-sequencing and microarray studies. Nucleic Acids Res. 2015, 43, e47. [Google Scholar] [CrossRef]
Figure 1.
MetGen overview. Overview of MetGen workflow. solid arrows indicate model training path while dash arrows indicate workflow path. a) MetVAE model training illustration b) MetGen model learns metastatic code using contrastive learning c) metastatic sample reconstruction using MetVAE decoder.
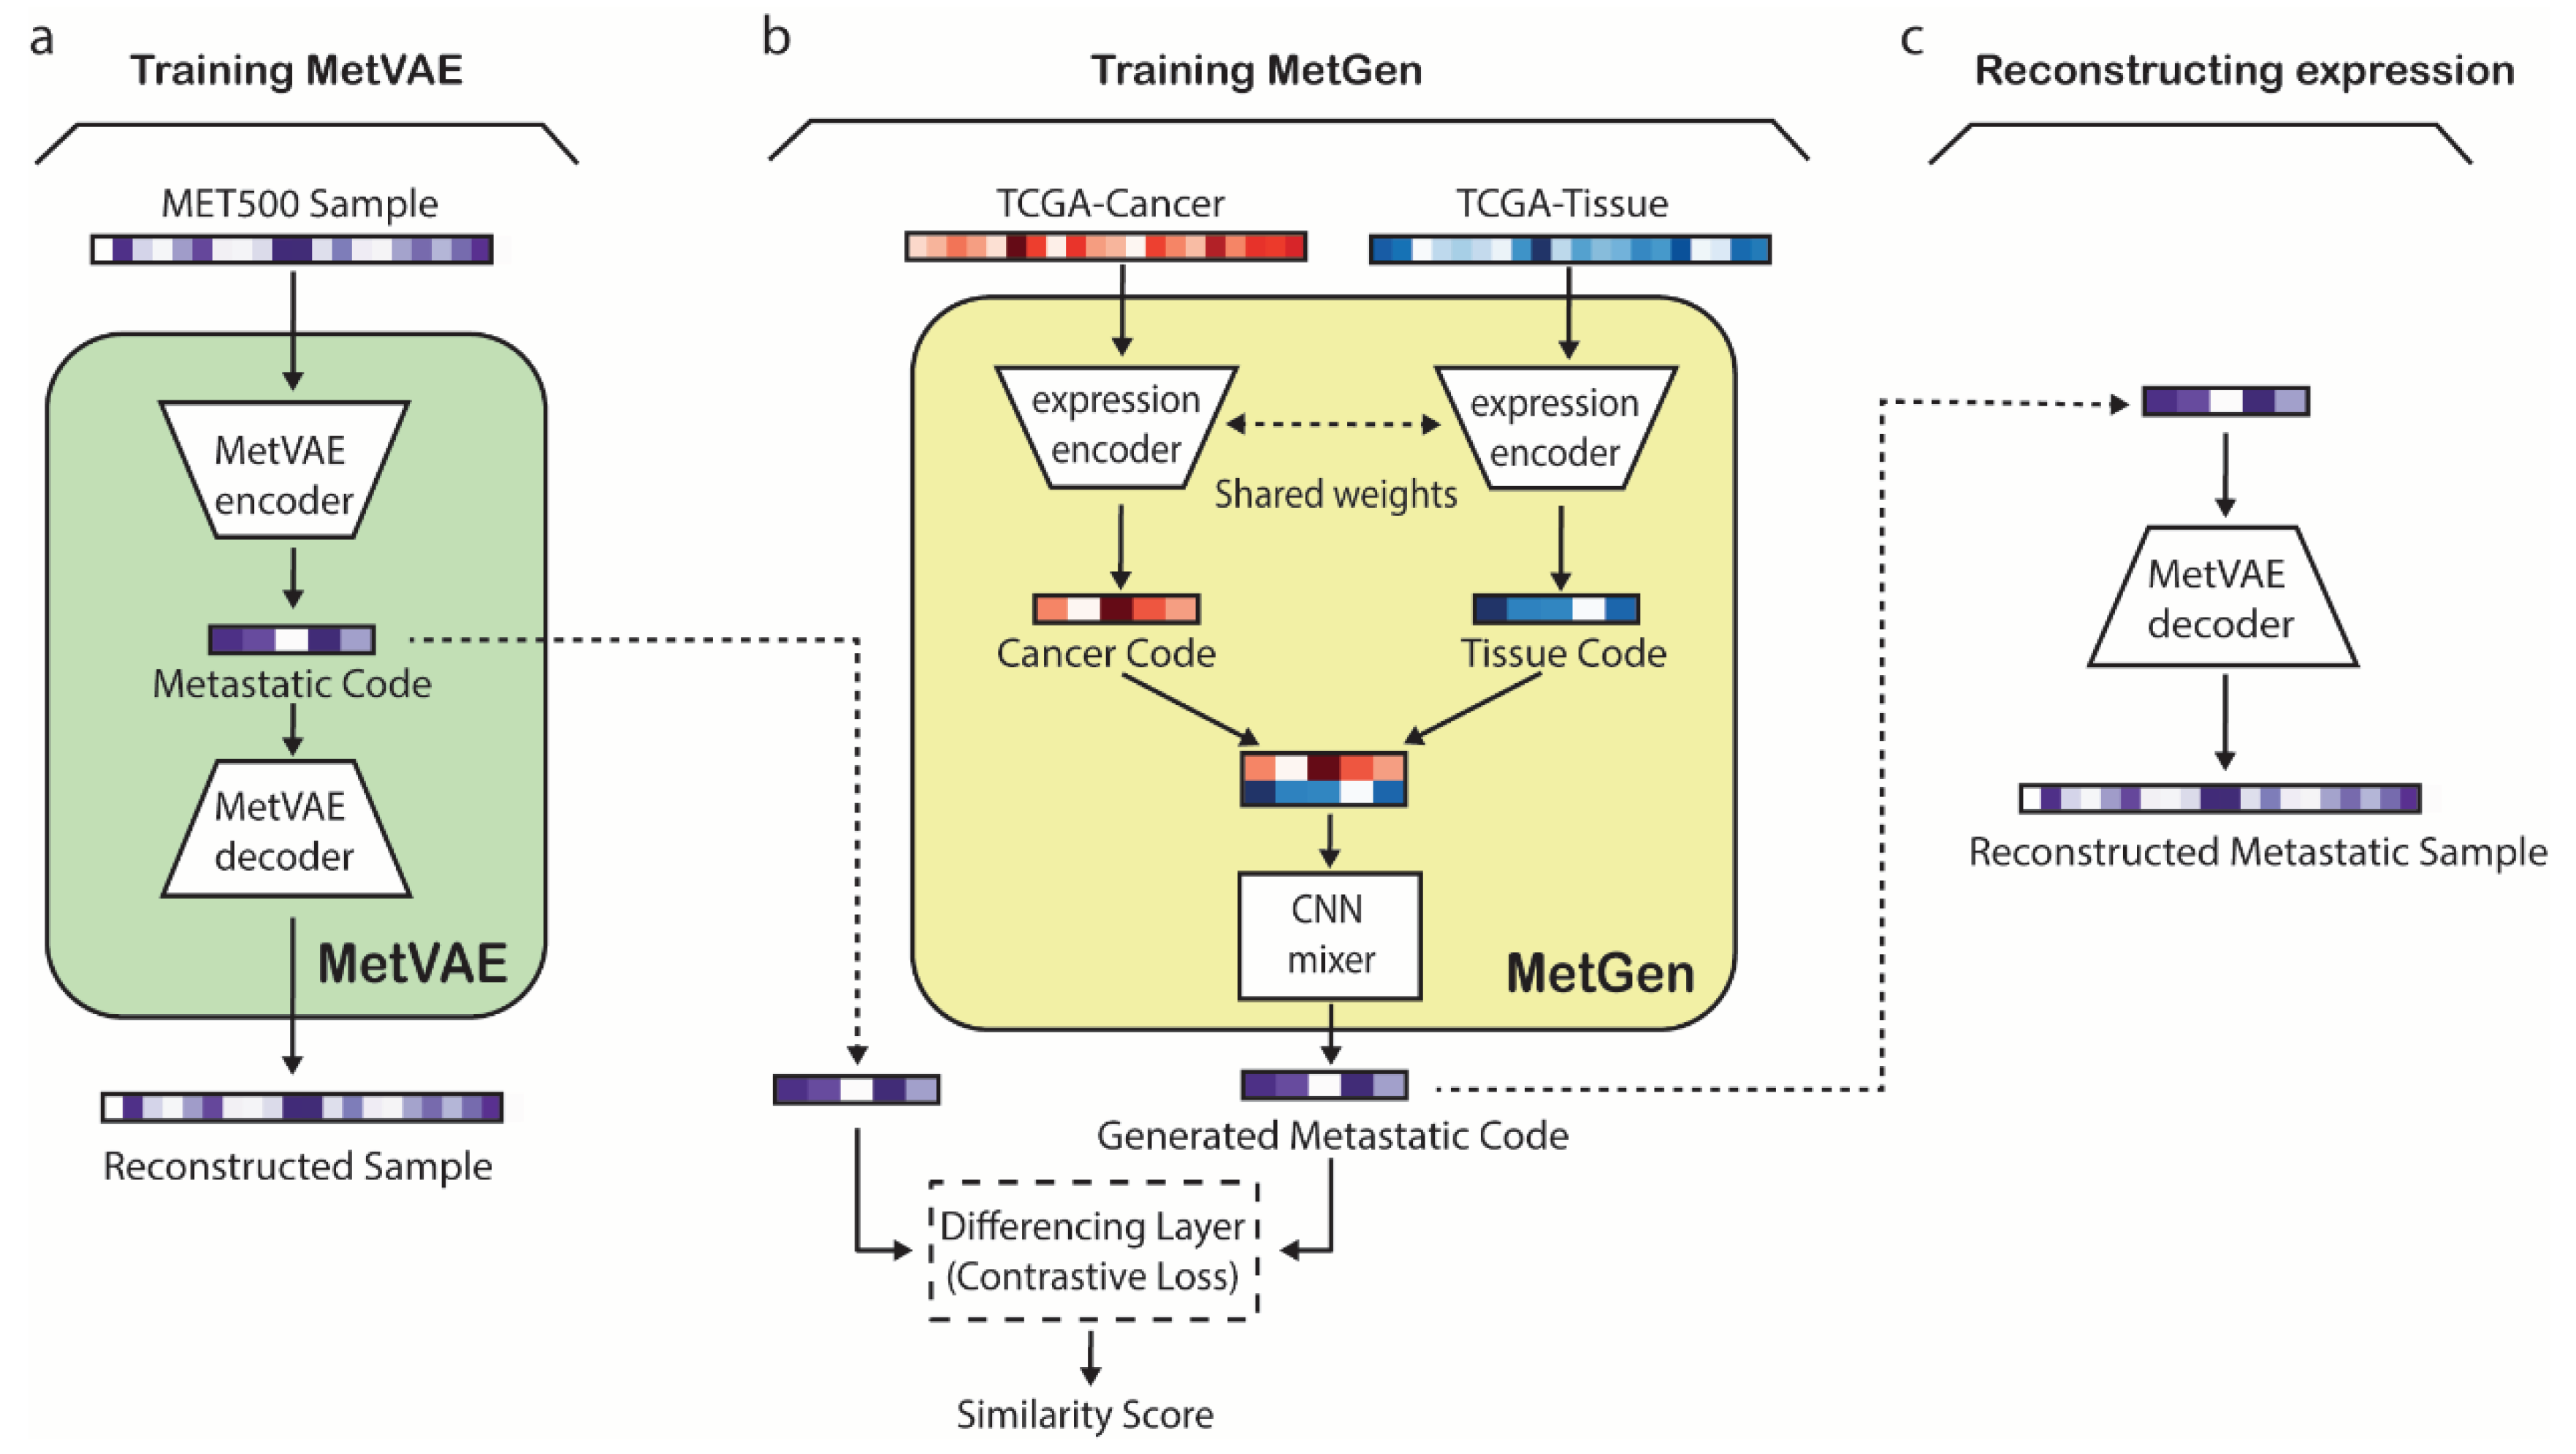
Figure 2.
MetVAE capture the cancer and tissue pattern of metastatic cancer. MetVAE learns cancer and tissue pattern. a, b) MET500 samples in expression space colored by cancer types and tissue sites c, d) MET500 samples in latent code space colored by cancer types and tissue sites.
Figure 2.
MetVAE capture the cancer and tissue pattern of metastatic cancer. MetVAE learns cancer and tissue pattern. a, b) MET500 samples in expression space colored by cancer types and tissue sites c, d) MET500 samples in latent code space colored by cancer types and tissue sites.
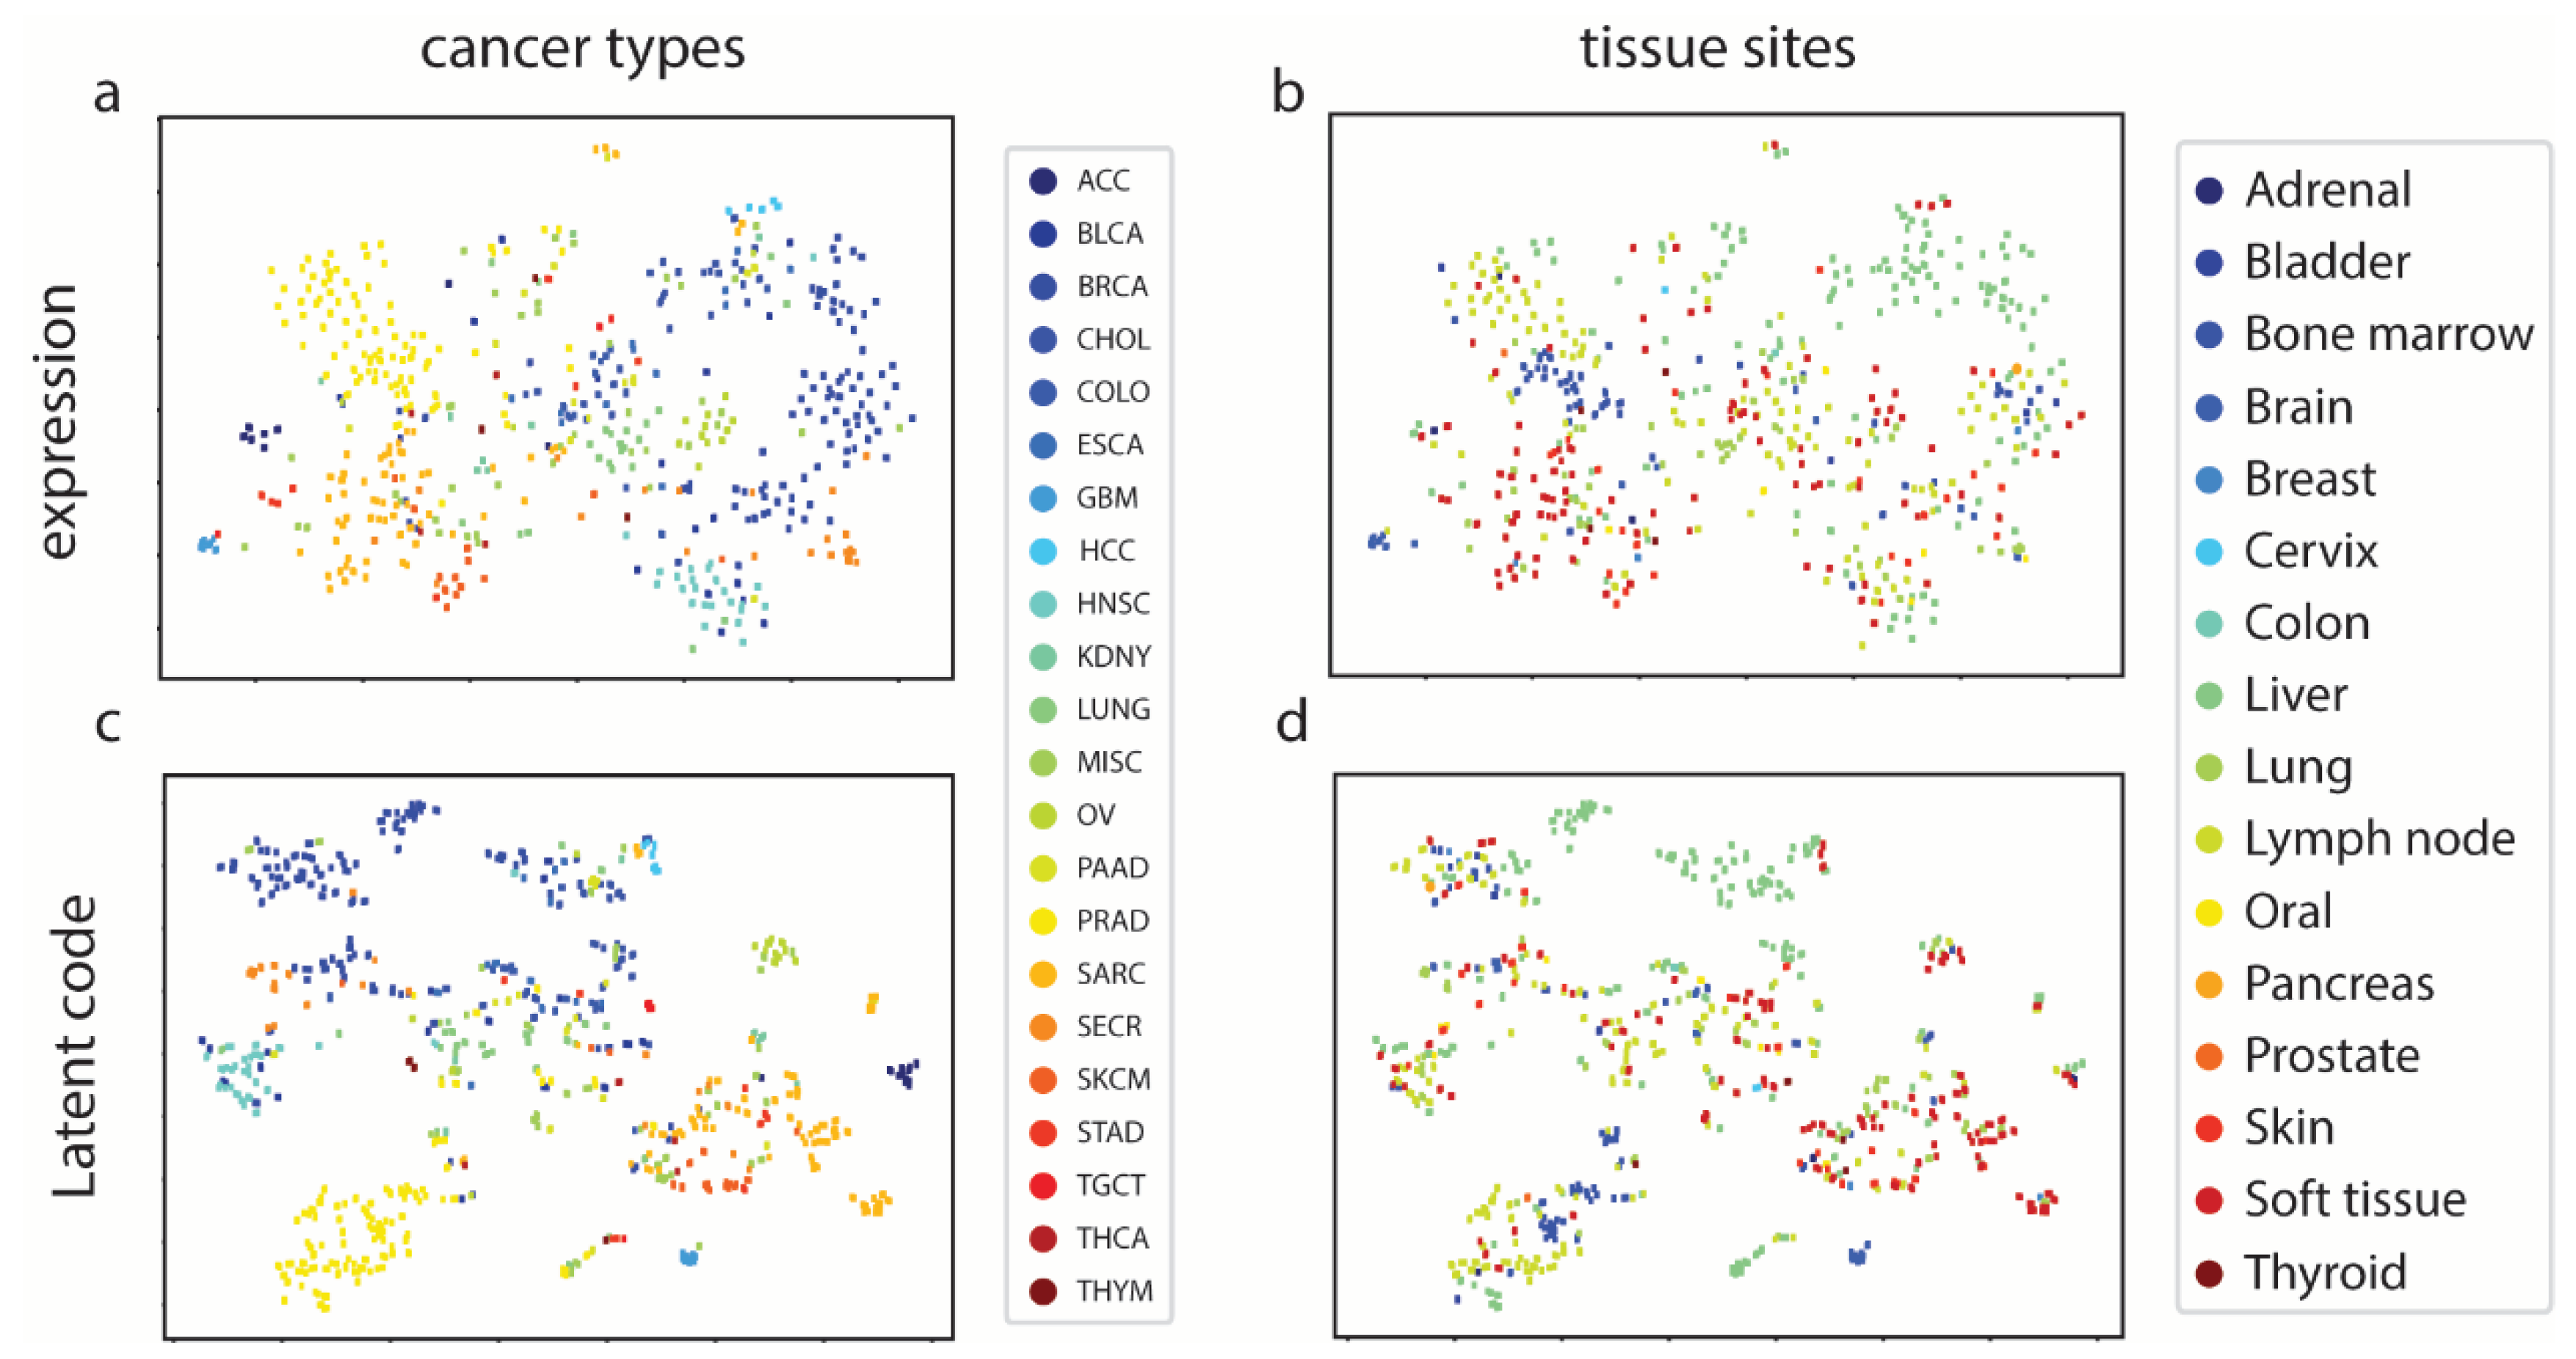
Figure 3.
MetVAE capture the cancer and tissue pattern of metastatic cancer. MetGen generates metastatic cancer samples. a) t-SNE plot of generated metastatic samples (grey) are MET500 samples (colored). Metastatic types of generated sample are marked in text. b) expression of generated BRCA in liver samples compare to true BRCA in liver, primary BRCA and normal liver tissue.
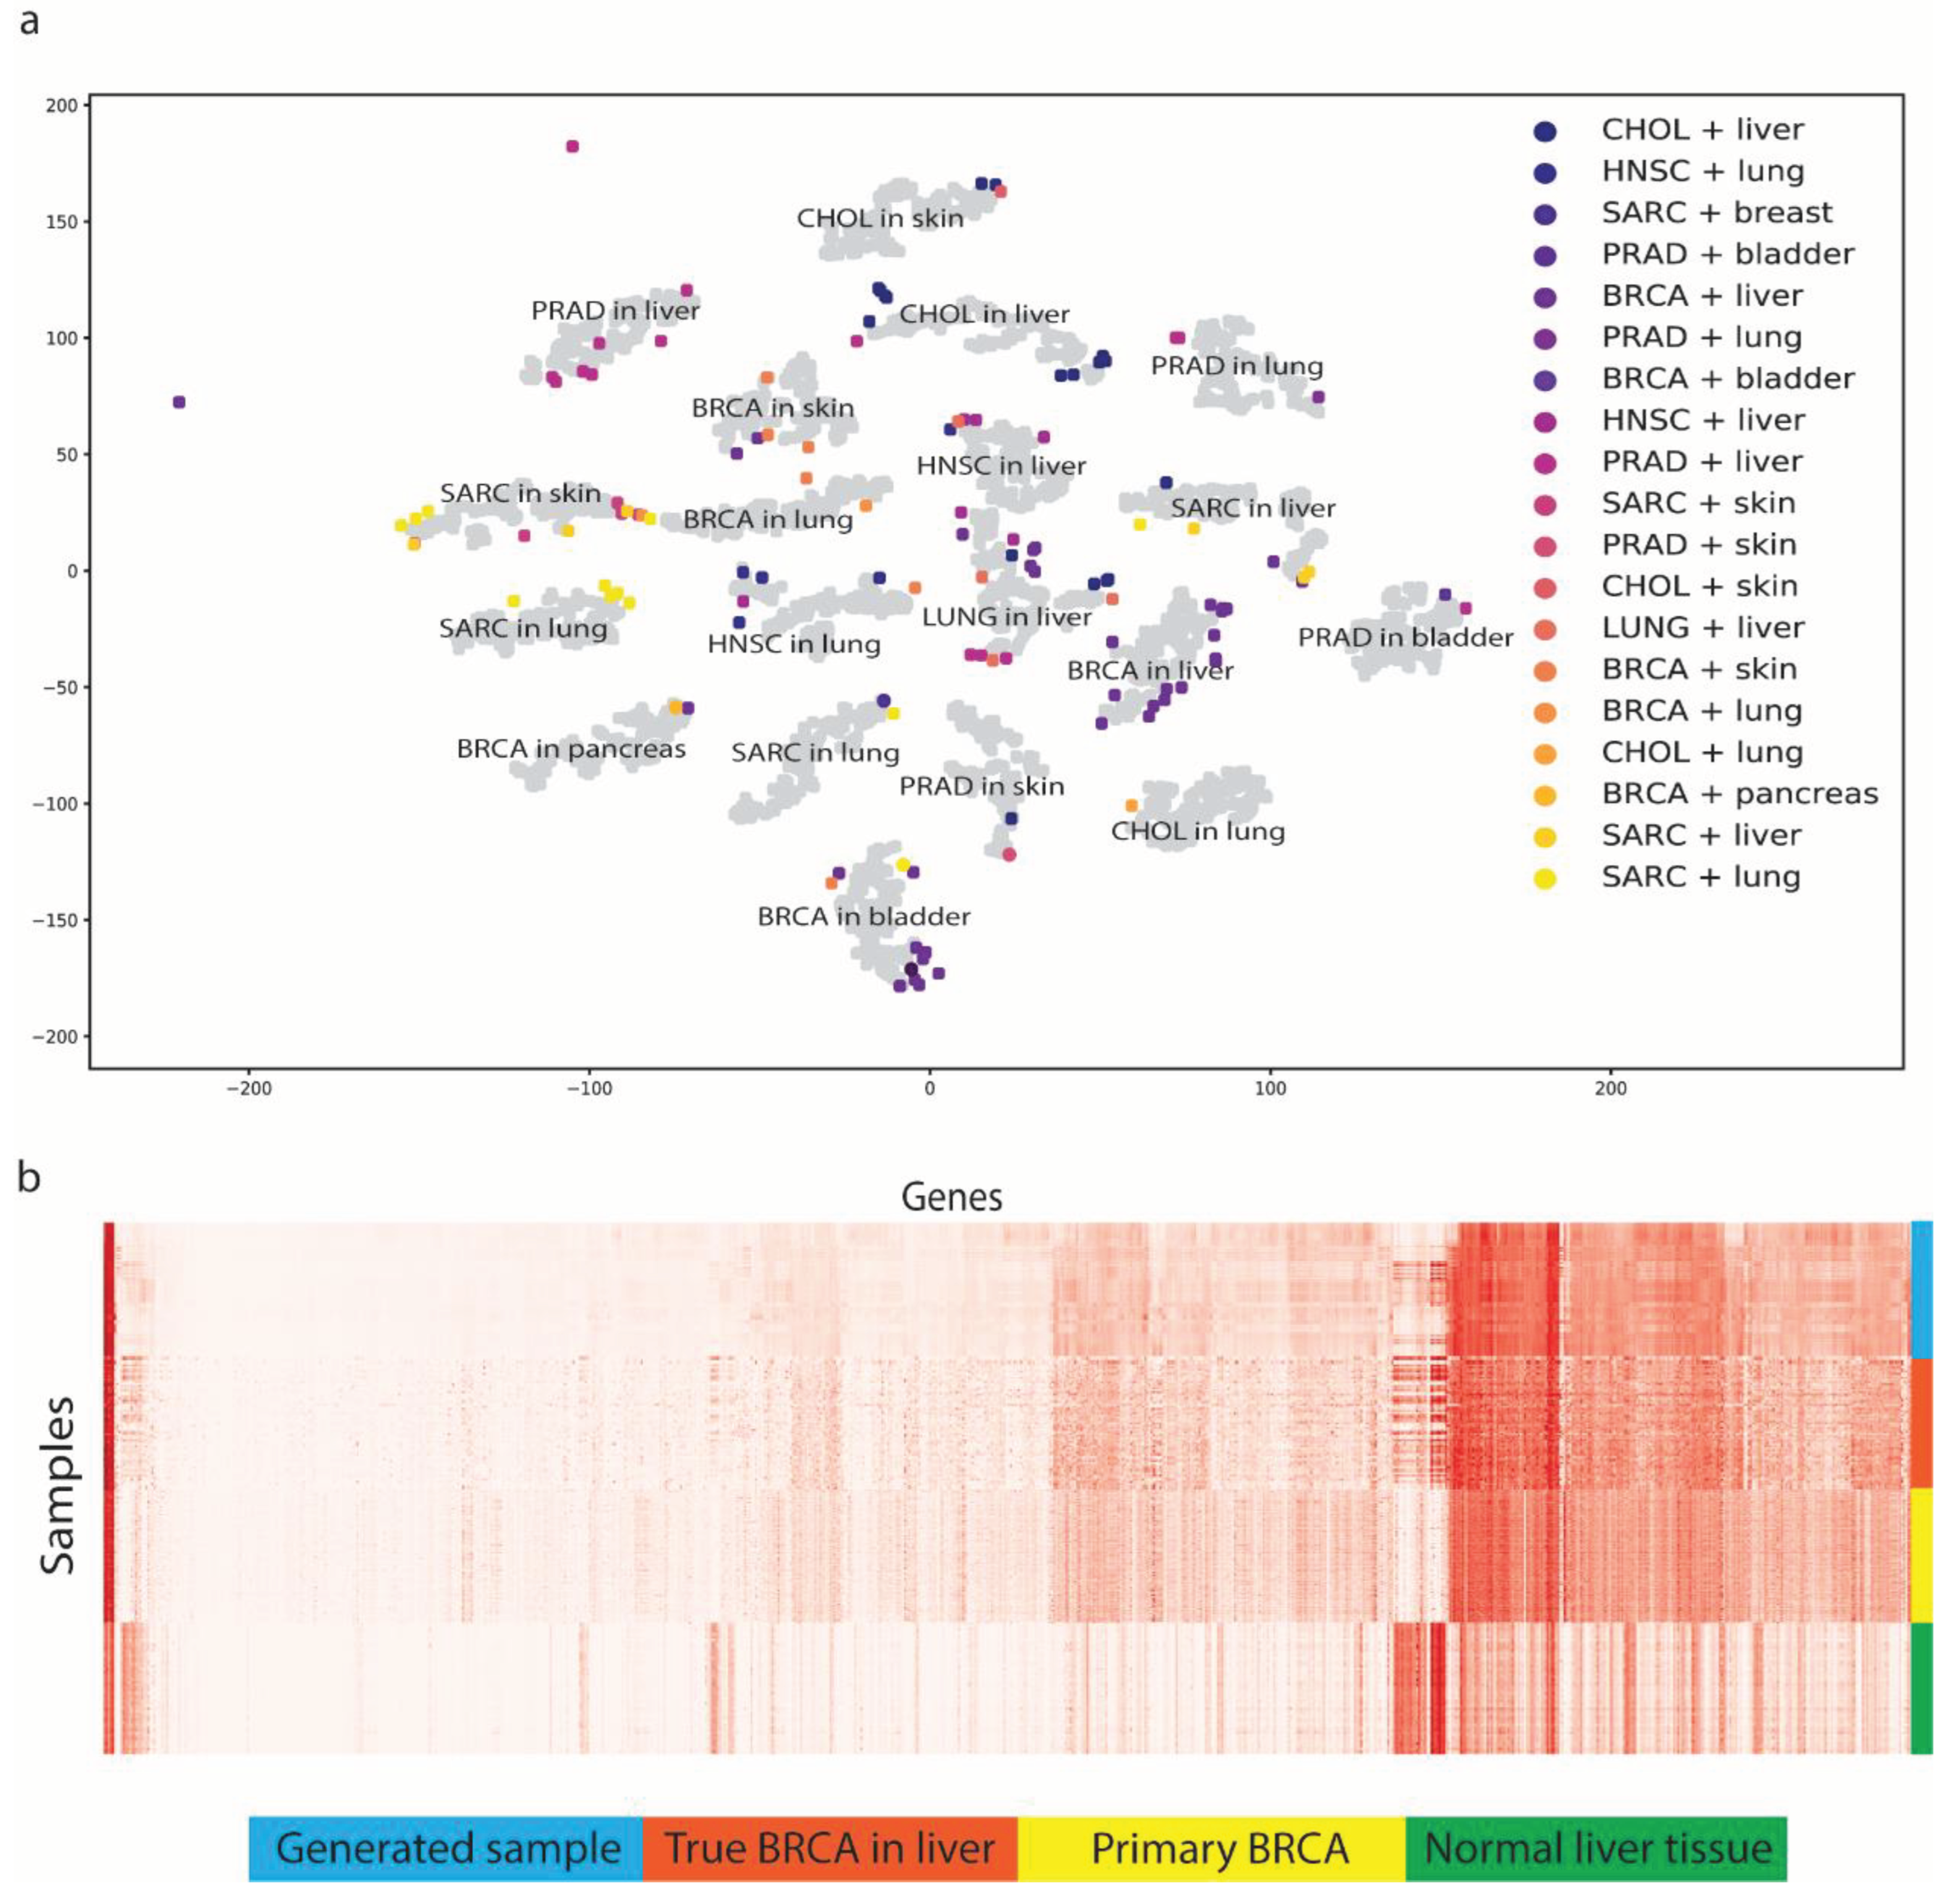
Figure 4.
MetGen model learns metastatic prostate cancer characteristics. MetGen model learns metastatic prostate cancer characteristics. a) workflow of study metastatic prostate cancer b) converting gene expression profiles to pathway expression, red color is original generated samples, green is masked samples c) metastatic cancer related differential pathways.
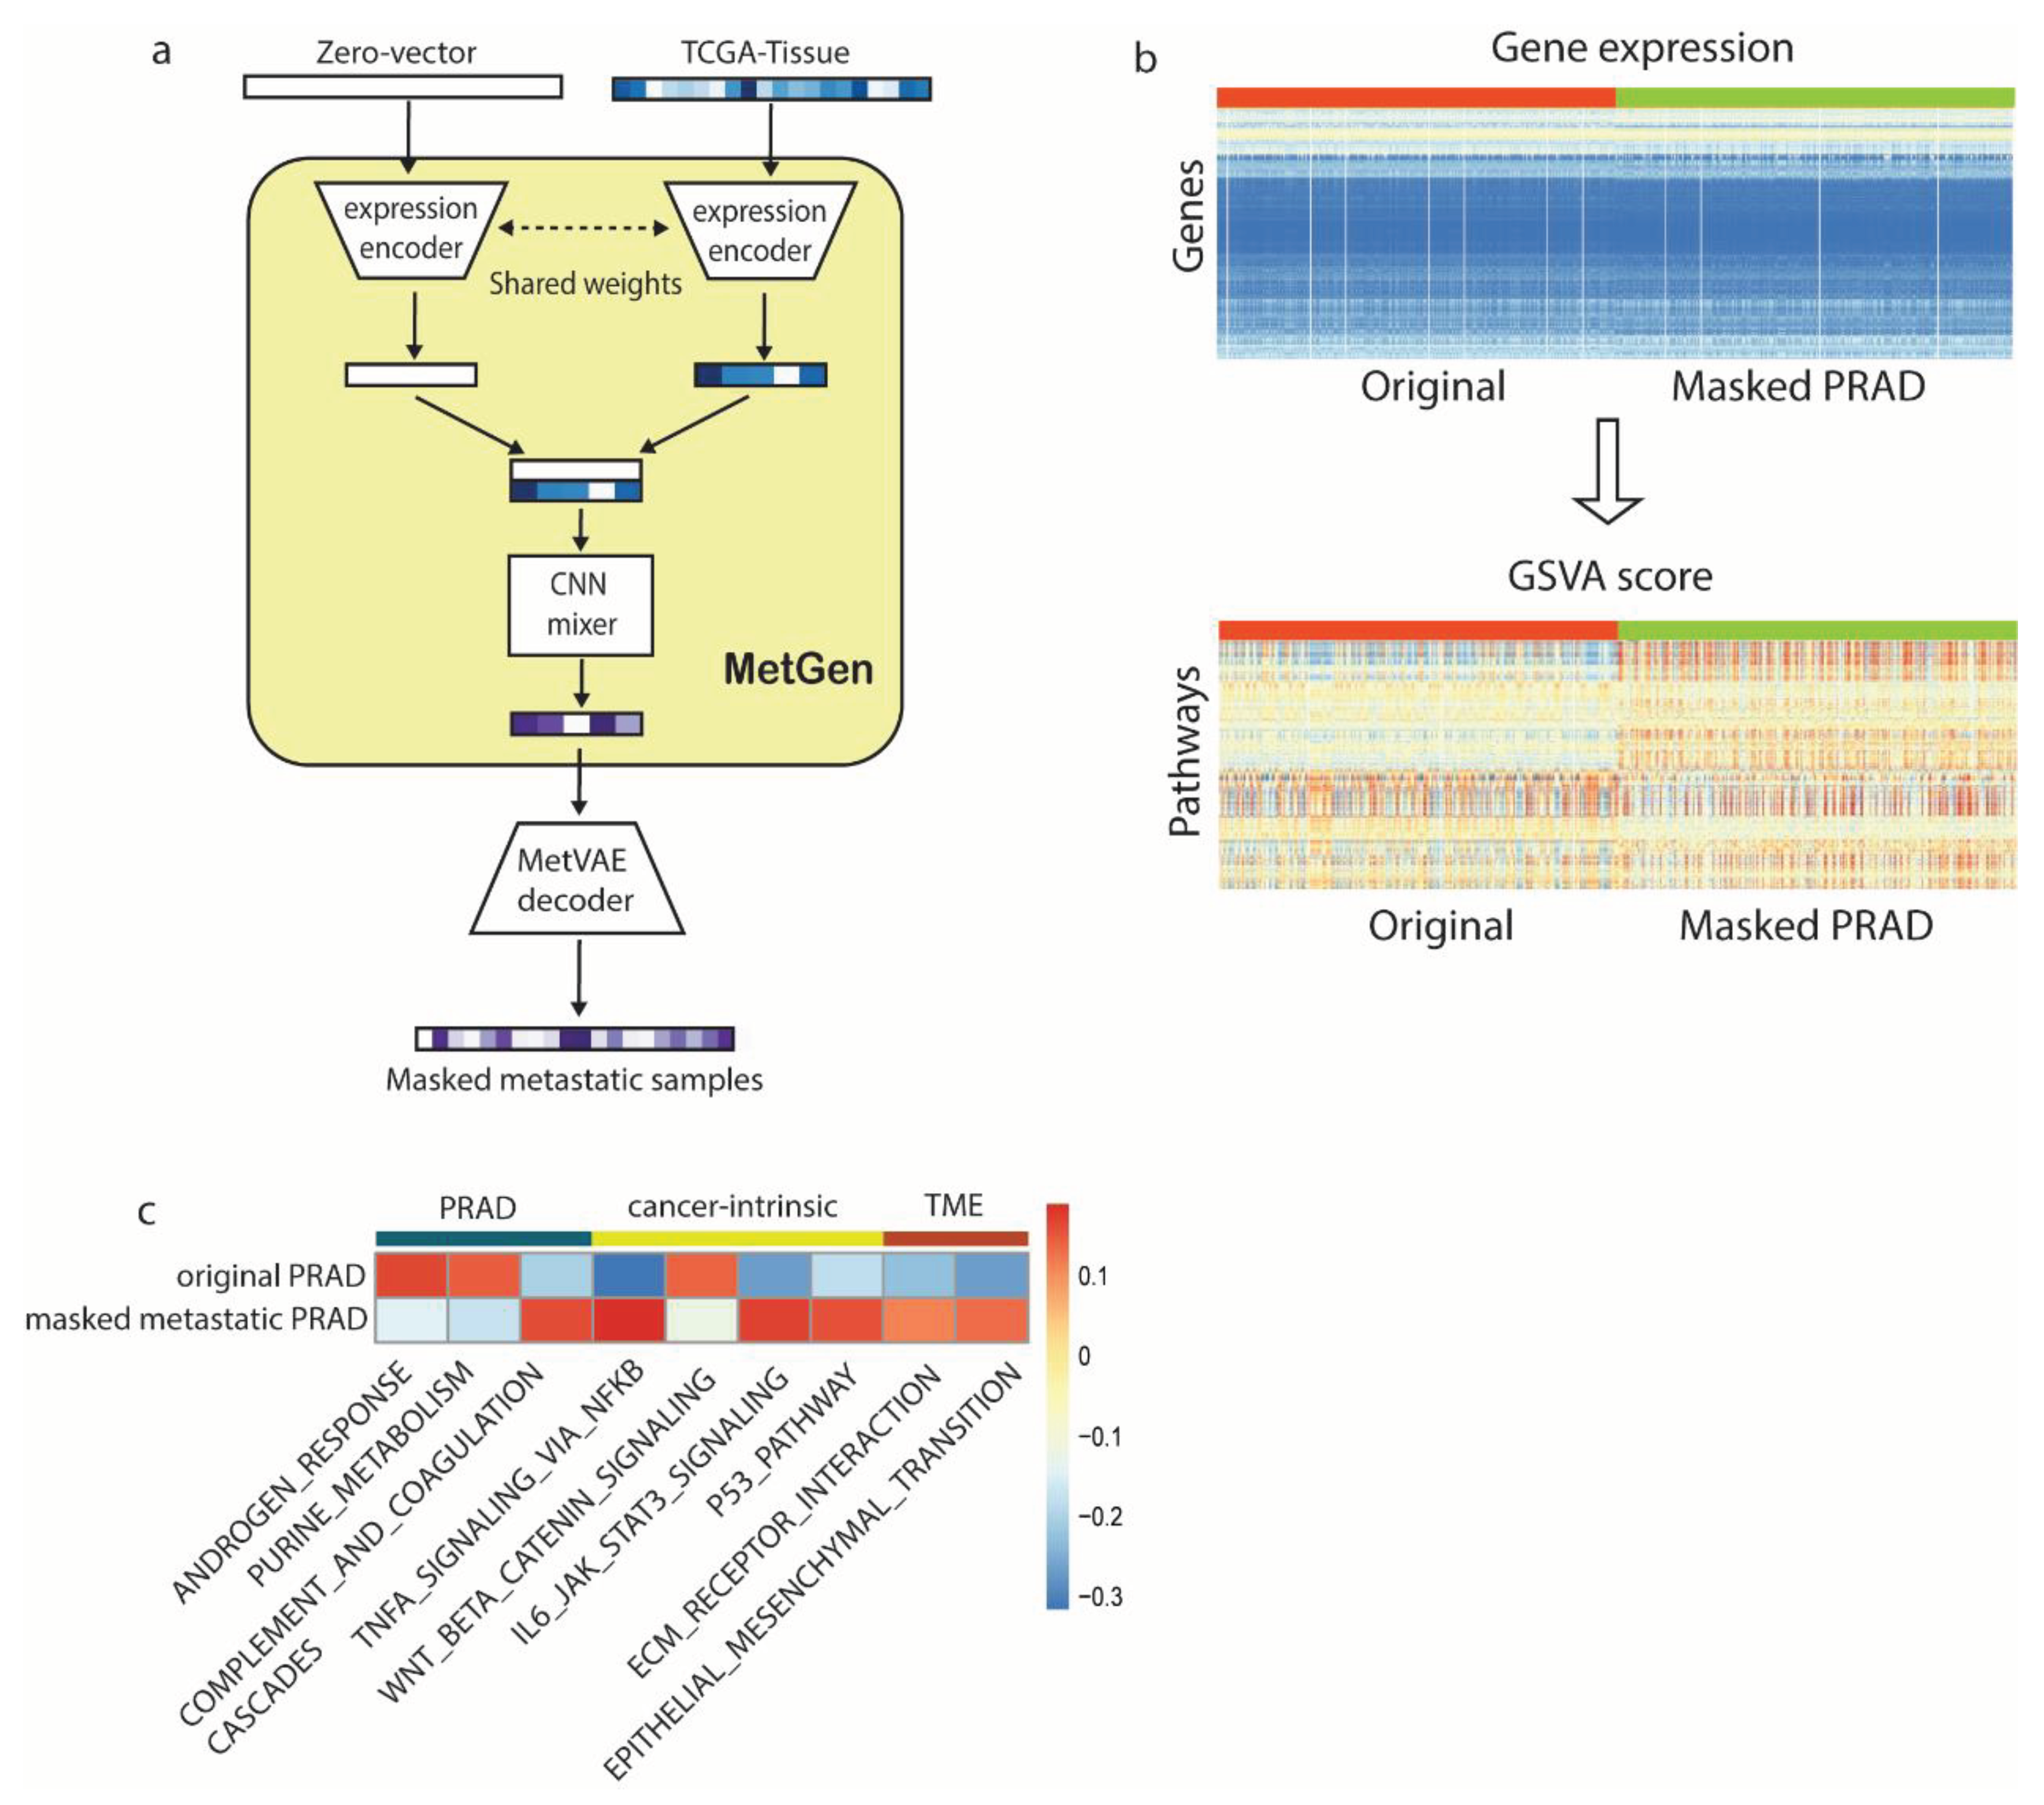
Figure 5.
MetGen learns functional components in metastatic breast cancer in bladder. MetGen learns functional components in metastatic breast cancer in bladder. a) hierarchical clustermap of generated metastatic breast cancer in bladder code. b) analysis workflow of functional components. c) heatmap of GSEA score for 4 groups samples d) selected differential pathways. Padj < 0.05 was used for significant cutoff. Top 10 up or down regulated pathways in fold change are selected for analysis.
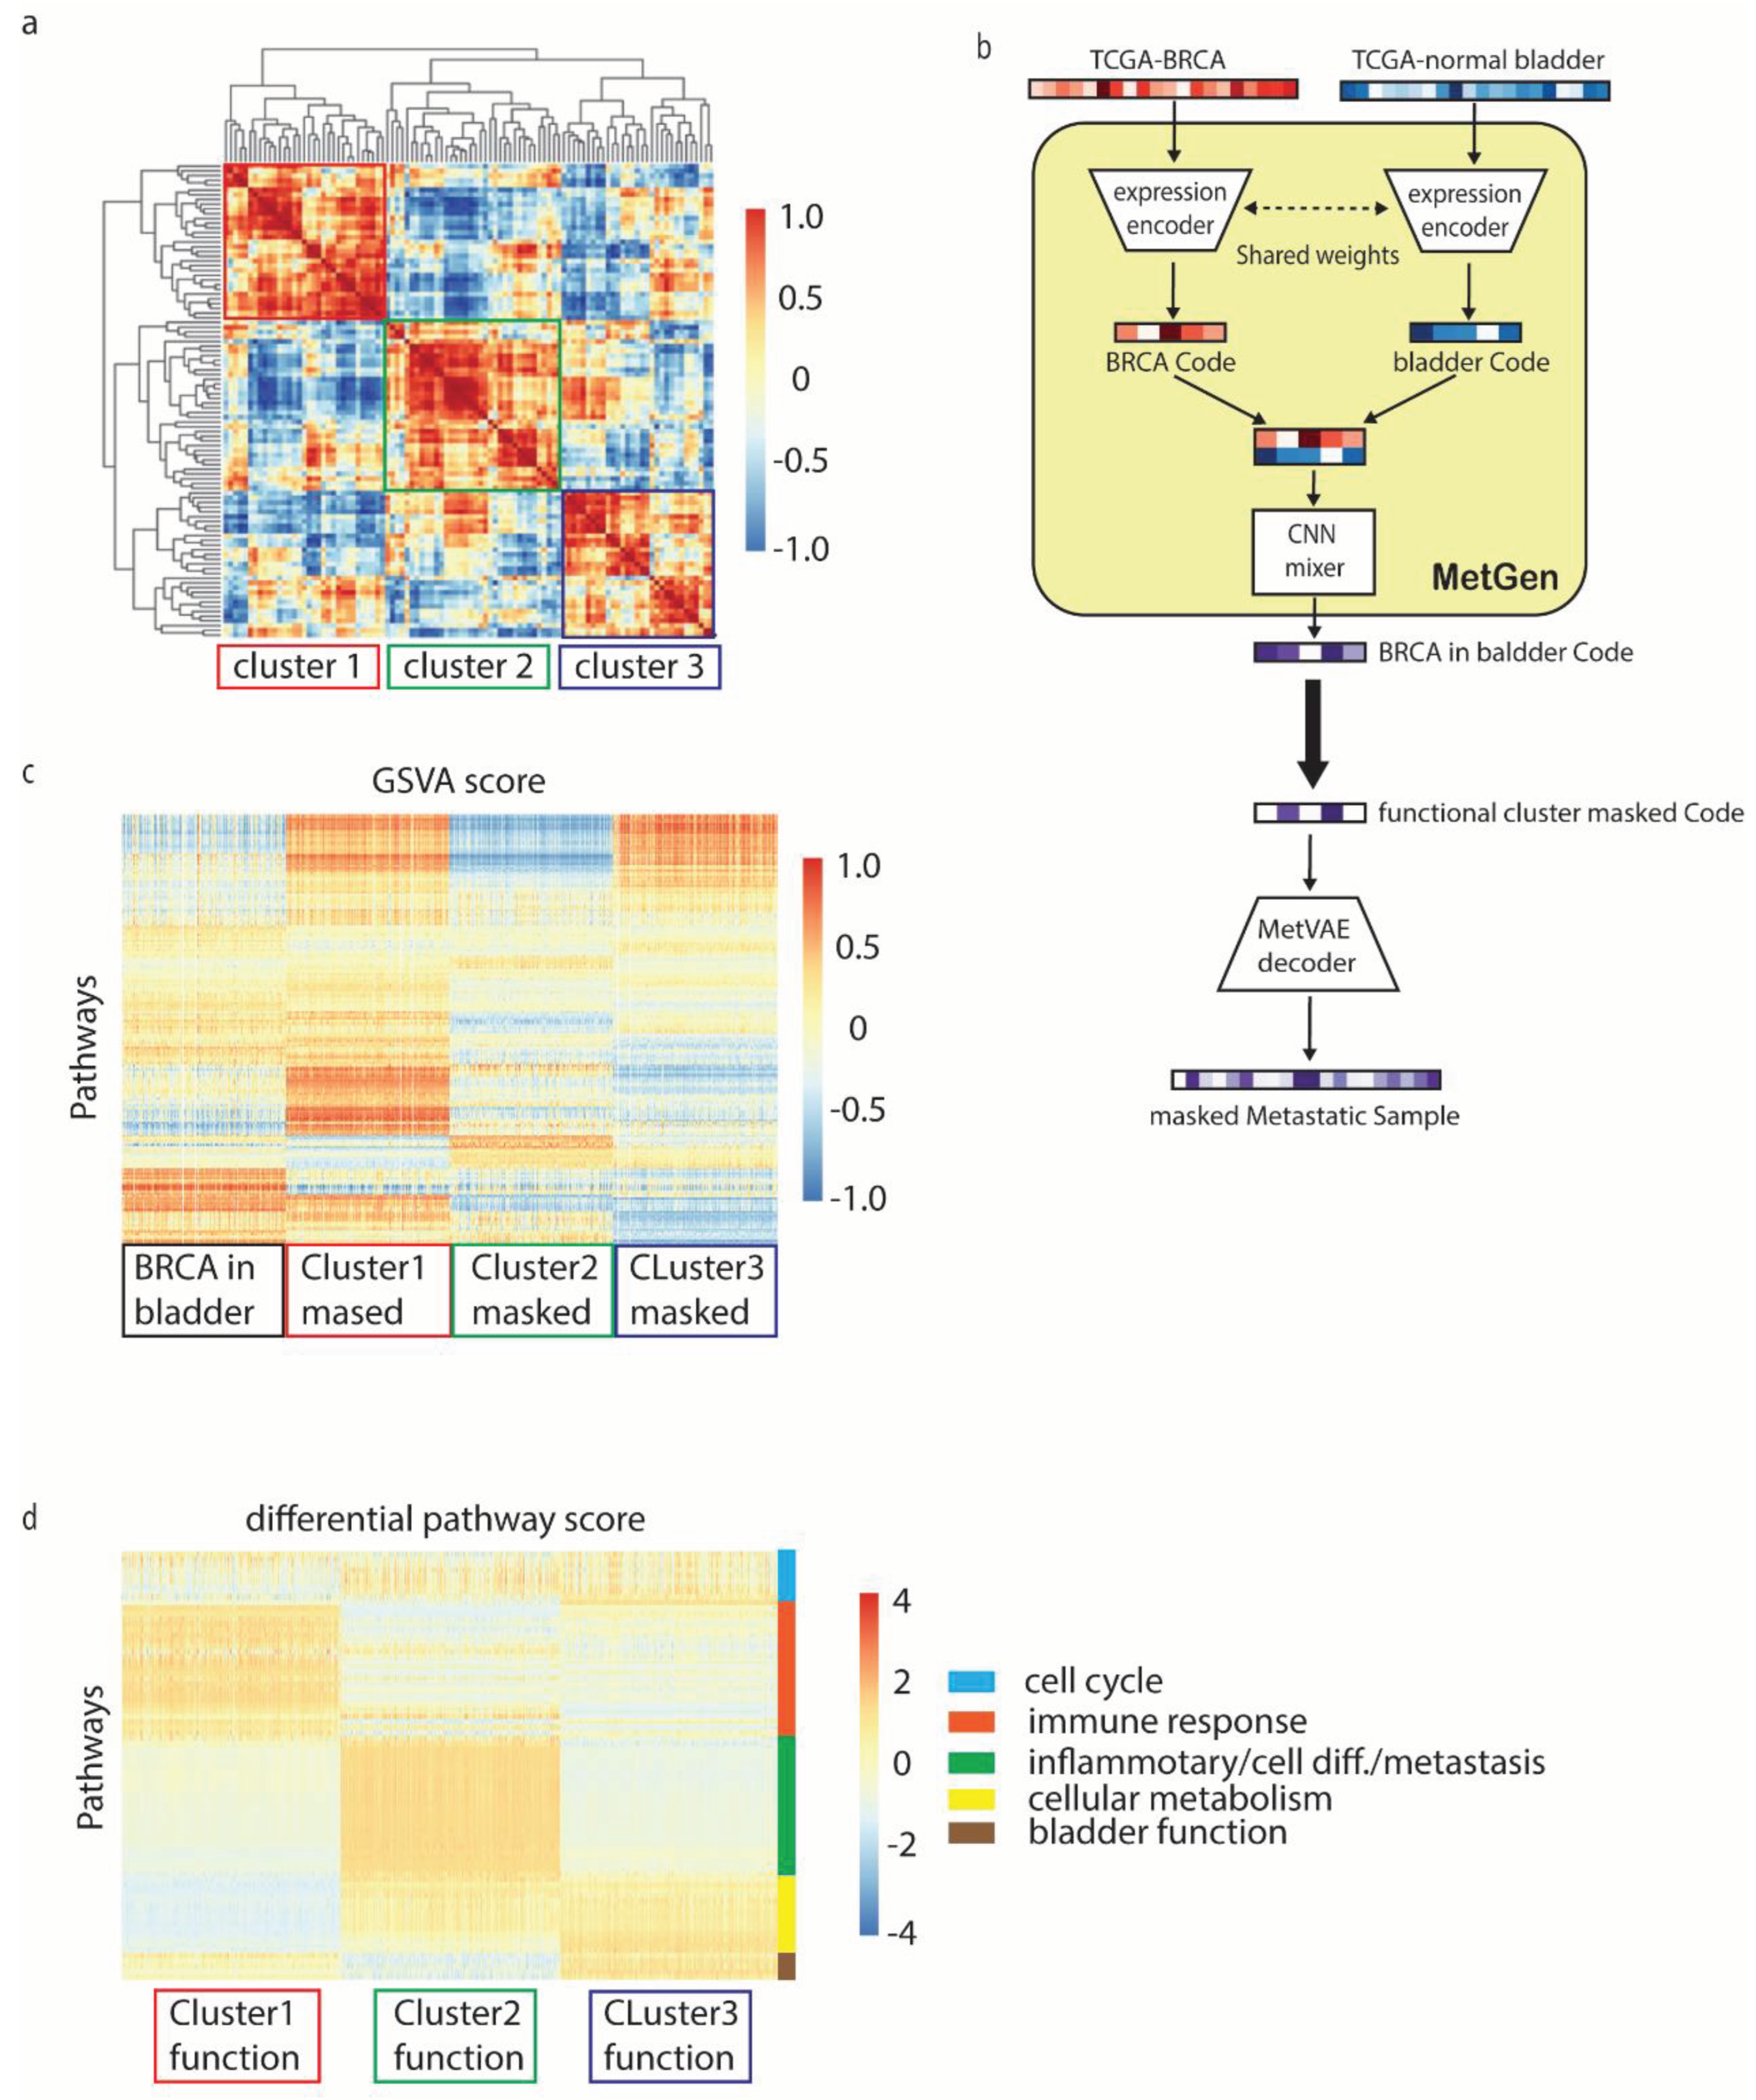

Table 1.
Data table.
| TCGA cancer type | Number of samples | TCGA normal tissue sites | Number of samples |
|---|---|---|---|
| BRCA | 159 | bladder | 8 |
| CHOL | 45 | breast | 5 |
| HNSC | 45 | liver | 243 |
| LUNG | 52 | lung | 75 |
| PRAD | 155 | pancreas | 1 |
| SARC | 100 | skin | 40 |
Disclaimer/Publisher’s Note: The statements, opinions and data contained in all publications are solely those of the individual author(s) and contributor(s) and not of MDPI and/or the editor(s). MDPI and/or the editor(s) disclaim responsibility for any injury to people or property resulting from any ideas, methods, instructions or products referred to in the content. |
© 2024 by the authors. Licensee MDPI, Basel, Switzerland. This article is an open access article distributed under the terms and conditions of the Creative Commons Attribution (CC BY) license (http://creativecommons.org/licenses/by/4.0/).
Copyright: This open access article is published under a Creative Commons CC BY 4.0 license, which permit the free download, distribution, and reuse, provided that the author and preprint are cited in any reuse.


