
Submitted:
04 April 2024
Posted:
04 April 2024
You are already at the latest version
Abstract
The number of diabetic patients worldwide is increasing rapidly. Prevention of diabetic reti-nopathy (DR), a leading cause of blindness, is a serious issue. We examined the effects of prophy-lactic pattern scanning laser retinal photocoagulation on DR development in 16 Spontaneously Diabetic Torii (SDT) fatty rats. Photocoagulation was applied to the right eyes of 8-week SDT fatty rats, and the left eyes served as the untreated controls. Electroretinography at 9 and 39 weeks of age and pathological examination of the retinal thickness and number of retinal folds, and immunohistochemistry of vascular endothelial growth factor and glial fibrillary acidic pro-tein at 24 and 40 weeks of age were performed bilaterally. No significant differences were seen between the left and right eyes in the apex latency and the amplitude of the oscillatory potential wave in the SDT fatty rats at 9 and 39 weeks of age and in the pathology and immunohistochem-istry in the SDT fatty rats at 24 and 40 weeks of age. Prophylactic pattern scanning retinal laser photocoagulation did not affect the development of DR in SDT fatty rats.
Keywords:
diabetes
; pattern scanning laser
; diabetic retinopathy
; Spontaneously Diabetic Torii fatty rats
; electroretinography
1. Introduction
Diabetes is a disease in which hyperglycemia is chronic due to decreased glucose tolerance as the result of insulin deficiency or reduced insulin action. It is a frightening disease that develops without any noticeable symptoms and results in three major complications: retinopathy, nephropathy, and neurologic disorders, and is accompanied by an increased risk of heart disease and stroke. The worldwide diabetic population continues to increase. The International Diabetes Federation estimated that about 537 million people had diabetes in 2021, and by 2030, 643 million people also will have diabetes [1].
Diabetic retinopathy (DR), a complication of diabetes, is caused by retinal vascular damage caused by chronic hyperglycemia, which gradually worsens and can eventually lead to blindness [2]. The prevalence rates of DR and proliferative DR, which is a severe retinopathy in diabetic patients, were 27% and 1.4%, respectively, worldwide [3]. The number of patient reports have indicated that the prevalence of DR exceeds 30% [4]. The number of patients with DR in 2020 was an estimated 103 million worldwide [5].
To elucidate the pathogenesis of diabetic ocular complications and develop treatments, a number of animal models of diabetes have been developed. In 1997, the Spontaneously Diabetic Torii (SDT) rat, which is characterized by severe diabetic ocular complications, was developed by a joint research committee including our institute and the Torii Pharmaceutical Research Institute [6]. We then developed a new animal model for obese type 2 diabetes, the SDT fatty rat, by introducing the leptin receptor mutation, an obesity gene of the Zucker fatty rats, into the genetic background of the SDT rats [7]. In addition to hyperglycemia, SDT fatty rats exhibit obesity due to overeating caused by loss of leptin activity, hyperlipidemia, hypertension, and insulin resistance. These characteristics make them a model animal for diabetes that mimics the diabetic patients seen in daily clinical practice. In male SDT fatty rats, hyperglycemia is observed from 5 weeks of age, at a level of about 600 mg/dl at 8 weeks of age, and 100% develop diabetes at 16 weeks of age [7,8]. In our previous study, DR developed in SDT fatty rats at 16 weeks of age, suggesting that DR develops earlier and is more severe in SDT fatty rats than in SDT rats [9]. When DR develops, retinal thickening and retinal folds appear, and electroretinography (ERG) shows prolongation of the apex latency and decreased amplitude of the oscillatory potential (OP) wave .
No treatment can completely cure DR, and it is important to prevent the progression of retinopathy. Of course, preventing development of diabetes itself is important through educational activities such as improving lifestyle habits, but if diabetes does develop, it is important to prevent the development of diabetes-associated diseases as much as possible. Prevention of DR is mainly limited to blood sugar control. Retinal photocoagulation, vitrectomy, and vitreous injection of vascular endothelial growth factor (VEGF) are the standard treatments according to the DR stage symptomatically. [10]
VEGF is involved in the onset and progression of DR. VEGF expression is caused by ischemia or hypoxia, but VEGF expression and increased vascular permeability occur even before obvious retinal vascular occlusion and ischemia [11]. The primary cause is thought to be advanced glycation end products (AGEs) that are the result of chronic hyperglycemia. The glucose load caused by chronic hyperglycemia leads to enhancement of the polyol metabolic pathway, which induces activation of protein kinase C (PKC), enhancement of the hexosamine biosynthetic pathway, and production of AGEs [12]. These cause retinal microangiopathy primally. AGEs induce pericytes to express the VEGF gene in their cells [11]. However, pigment epithelium-derived factor (PEDF), which has an antioxidant effect, suppresses AGEs and, as a result, suppresses induction of VEGF [11,13].
It takes about 13 years for DR to develop [14]. In the meantime, if there is a minimally invasive method to prevent DR, it would greatly contribute to a decrease in the number of patients with DR. According to the Early Treatment Diabetic Retinopathy Study, photocoagulation for DR is recommended for proliferative DR rather than simple DR, considering its disadvantages such as narrowing of the visual field, decreased dark adaptation, color blindness, and macular edema [15,16]. In contrast, the current study investigated the efficacy of prophylactic pattern scanning laser as a new treatment in the preliminary stage of DR. The features of the pattern scanning laser are high power and short pulse irradiation. Standard panretinal photocoagulation is painful and damages the inner retinal layer and choroid. A less invasive laser therefore was considered for prophylactic treatment. The pattern scanning laser has a short irradiation time of 10 to 30 msec, about 1/10th to 1/20th of conventional photocoagulation, and a higher power of 350 to 475 mW, about 3 to 4 times that of conventional photocoagulation. Therefore, it is possible to reduce patient pain and damage to the inner retinal layer and choroid [17,18,19]. It has been attracting attention mainly as a treatment for advanced DR. Although many reports of laser treatment for DR have been published [16,20,21], none has reported the effects and complications of prophylactic pattern scanning lasers in the pre-DR stages. We hypothesized that if retinal photocoagulation, which is already widely used in clinical practice, can be applied both to suppress the progression of DR and prevent its onset, it will become a new, simple, and safe method to prevent DR. Therefore, we evaluated the effect of prophylactic pattern scanning laser on developing DR in SDT fatty rats.
2. Materials and Methods
SDT fatty rats (obese type 2 diabetic model animals) were used in this study. All SDT fatty rats were diagnosed as diabetic if their non-fasting blood glucose level was 350 mg/dl or higher. All rats were fed a standard rat diet (CRF-1, Oriental Yeast, Inc., Tokyo, Japan). In addition, the breeding environment maintained the rat body temperature of the animals at about 37 degrees Celsius. This study is based on previous studies showing that SDT fatty rats develop hyperglycemia at 8 weeks of age but do not develop DR, such as retinal thickening, and develop DR at 16 weeks of age [9]. We used 16 SDT fatty rats. The animals were divided into groups, i.e., half were sacrificed at 24 weeks of age (24-week SDT fatty rats) and the other half at 40 weeks (40-week SDT fatty rats). All 8-week SDT fatty rats underwent pattern scanning retinal laser photocoagulation in the right eye under anesthesia by intraperitoneal injection of 50 mg/kg of three different anesthetic agents (medetomidine hydrochloride 0.375 mg/kg, midazolam 2 mg/kg, and butorphanol tartrate 2.5 mg/kg). The left eyes served as the untreated controls. Photocoagulation was performed using a Volk Quad Pediatric Laser Lens: 1.82x laser spot magnification (Volk, Optical Inc., Mentor, OH, USA) eyepiece with an irradiation power of 360 mW, irradiation time of 20 msec, and spot size of 200 μm (retinal spot size, 330 μm) using the Novus Spectra green laser photocoagulator (Lumenis Be Ltd., Yokneam Illit, Israel). The number of laser applications around the optic disc was about 300 shots, but the number of laser applications varied slightly according to individual animals and was the fewest at 240 shots. Electroretinography (ERG) was performed to evaluate the development of DR in the left eye and the inhibitory effect of laser photocoagulation on DR in the right eye in the SDT fatty rats. In our previous experiments, some SDT fatty rats died as a result of the three different anesthetic agents; to avoid stressing the rats due to repeated anesthesia administered during a short period of time, we performed ERG only in the 40-week SDT fatty rat group. Therefore, ERG was performed at 9 weeks of age immediately after laser photocoagulation (eight rats) and at 39 weeks of age before slaughter (four surviving rats). Full-field ERG responses were recorded using a Ganzfeld dome, an acquisition system, and light-emitting diode stimulators (PuREC, MAYO Corporation, Inazawa, Japan). In the current study, we measured the peak latency of the OP1 wave, because the frequency of prolongation of the vertex latency is especially pronounced in the OP1 wave in patients with diabetes [22]. The amplitude of the OP wave was defined as the sum of the OP1 to OP4 (ΣOPs) amplitudes.
At 24 and 40 weeks of age, the SDT fatty rats in each group were sacrificed under anesthesia and the eyes were enucleated for pathological examination. The animals were euthanized by intraperitoneal administration of pentobarbital 85 mg/kg and blood was removed from the aorta. When that was completed, the eyes were enucleated and fixed immediately in fixative solution (Super Fix, KY-500, Kurabo, Japan enucleated eyes), paraffin-embedded, and 4-μm sections were prepared from the paraffin blocks by microtome and stained with hematoxylin and eosin. The retinal thickness and number of retinal folds were measured in these specimens. The retinal thicknesses were measured at three different points (Figure 1A). A retinal fold was defined as deformed tissue that extended from the photoreceptor layer to the outer retinal granular layer. Immunohistochemical studies included immunostaining for VEGF and glial fibrillary acidic protein (GFAP). In DR, VEGF and GFAP increase in the ganglion cells. Immunostaining was performed using the conventional avidin-biotin horseradish peroxidase method, and AEC Substrate-Chromogen (DakoCytomation, Carpinteria, CA, USA) was used as a chromogenic substrate for peroxidase. The Hybrid Cell Count Module/BZ-H3C software (Keyence, Chicago, IL, USA) quantitatively analyzed each immunostained-positive area within 1,500 μm from the optic disc and calculated the area ratio. In this experiment, positive areas were color-coded in dark blue and negative areas in magenta, and the positive area ratio of immunostaining for each specimen was calculated. We checked the variance using the F test, and analyzed if the variances were equal using the Student's t-test and the Welch t-test if the variances were unequal. Microsoft® Excel analysis (Microsoft Corporation, Redmond, WA, USA) was used for statistical analysis. P < 0.05 was considered significant.
3. Results
The SDT fatty rats always have blood sugar levels that exceed 350 mg/dl, so the probability of sudden death increases as the animals age. At the beginning of the experiment, 16 SDT fatty rats were divided into two groups: 24-week SDT fatty rats and 40-week SDT fatty rats. Ultimately, the number of 24-week SDT fatty rats decreased to six, and the number of 40-week SDT fatty rats decreased to four. All SDT fatty rats underwent application of pattern scanning retinal laser photocoagulation in the right eye (treated eye), and the left eye was the untreated eye.
3.1. ERG
Figure 2A shows the ERG waveforms of the SDT fatty rat before and after the onset of retinopathy. The ERGs at the age of 9 weeks were obtained before the onset of retinopathy, and the ERGs at the age of 39 weeks were obtained after the onset of retinopathy. The peak latency of the OP wave is prolonged and the amplitude of the OP wave is reduced in the ERGs when DR develops.
At age 9 weeks immediately after laser photocoagulation, the apex latencies of the OP1 wave in the right eyes treated with photocoagulation and the untreated left eyes were 21.3 ± 1.08 ms in the treated eyes and 21.0 ± 1.54 ms in the untreated eyes, and the amplitudes of the ΣOPs waves were 401.1 ± 176.41 μv in the treated eyes and 413.5 ± 150.62 μv in the untreated eyes. At age 39 weeks before slaughter, the apex latencies of the OP1 wave in the treated eyes and untreated eyes were 22.9 ± 1.37 ms in the treated eyes and 22.9 ± 1.37 ms in the untreated eyes, and the amplitudes of the ΣOPs waves were 247.6±142.56 μv in the treated eyes and 284.2 ± 77.04 μv in the untreated eyes. In this experiment, the ERG waveforms showed that the amplitude of the ΣOPs waves decreased in the 39-week rats compared to the 9-week rats, although the prolongation of the peak latency of the OP wave was unclear. However, there were no significant differences between them (amplitude of the ΣOPs wave, p=0.0894; peak latency of the OP1, p=0.0617).
It was also clear from the ERG waveform that there were no significant differences in the peak latency of the OP1 and amplitude of the ΣOPs between the right eyes treated with photocoagulation and the untreated left eyes of the SDT fatty rats (amplitude of the ΣOPs wave, p=0.844 at 9 weeks, p=0.674 at 39 weeks; peak latency of the OP1, p=0.672 at 9 weeks, p=1 at 39 weeks) (Figure 2A, B, C).
3.2. Pathology
Thickened retinas and retinal folds are typical pathological changes in DR in SDT fatty rats [9]. The average retinal thicknesses in the 24-week SDT fatty rats and 40-week SDT fatty rats at 500, 1,000, and 1,500 μm from the optic disc are as follows.
In 24-week SDT fatty rats, at 500 μm, the mean retinal thicknesses were 165.67±7.82 μm in treated eyes and 166.67±32.53 μm in untreated eyes. At 1,000 μm, the mean retinal thicknesses were 149.33±25.82 μm in treated eyes and 155.67±35.50 μm in untreated eyes. At 1,500 μm, the mean retinal thicknesses were 147.5±44.85 μm in treated eyes and 145±28.42 μm in untreated eyes (Figure 1B).
In 40-week SDT fatty rats, at 500 μm, the mean retinal thicknesses were 181.25±31.85 μm in treated eyes and 194.5±30.49 μm in untreated eyes. At 1,000 μm, the mean retinal thicknesses were 155.25±32.43 μm in treated eyes and 158.5±33.01 μm in untreated eyes. At 1,500 μm, the mean retinal thicknesses were 147.75±43.5 μm in treated eyes and 138.5±20.5 μm in untreated eyes (Figure 1C).
No significant differences in the retinal thicknesses were seen between the laser-treated eyes and untreated eyes at either age (24-week SDT fatty rat retinal thickness 500 μm from the optic disc, p=0.944; 1,000 μm from the optic disc, p=0.731; and 1,500 μm from the optic disc, p=0.910; 40-week SDT fatty rat retinal thickness 500 μm from the optic disc, p=0.569; 1,000 μm from the optic disc, p=0.892; and 1,500 μm from the optic disc, p=0.713).
Regarding retinal folds, Figure 3A shows retinal folds, suggesting the development of DR in SDT fatty rats. Retinal folds were seen in all cases as evidence of DR. In 24-week SDT fatty rats, the mean numbers of retinal folds were 1.17 ± 1.94 in laser-treated eyes and 3.17 ± 3.43 in untreated eyes. In 40-week SDT fatty rats, the mean numbers of retinal folds were 3.5 ± 1.73 in treated eyes and 2.5 ± 1.29 in untreated eyes(Figure 3B).
No significant differences were seen in the numbers of retinal folds between the laser-treated and untreated eyes of the SDT fatty rats at either age (24-week SDT fatty rat number of retinal folds, p=0.242; 40-week SDT fatty rat number of retinal folds, p=0.390).
3.3. Immunohistochemistry
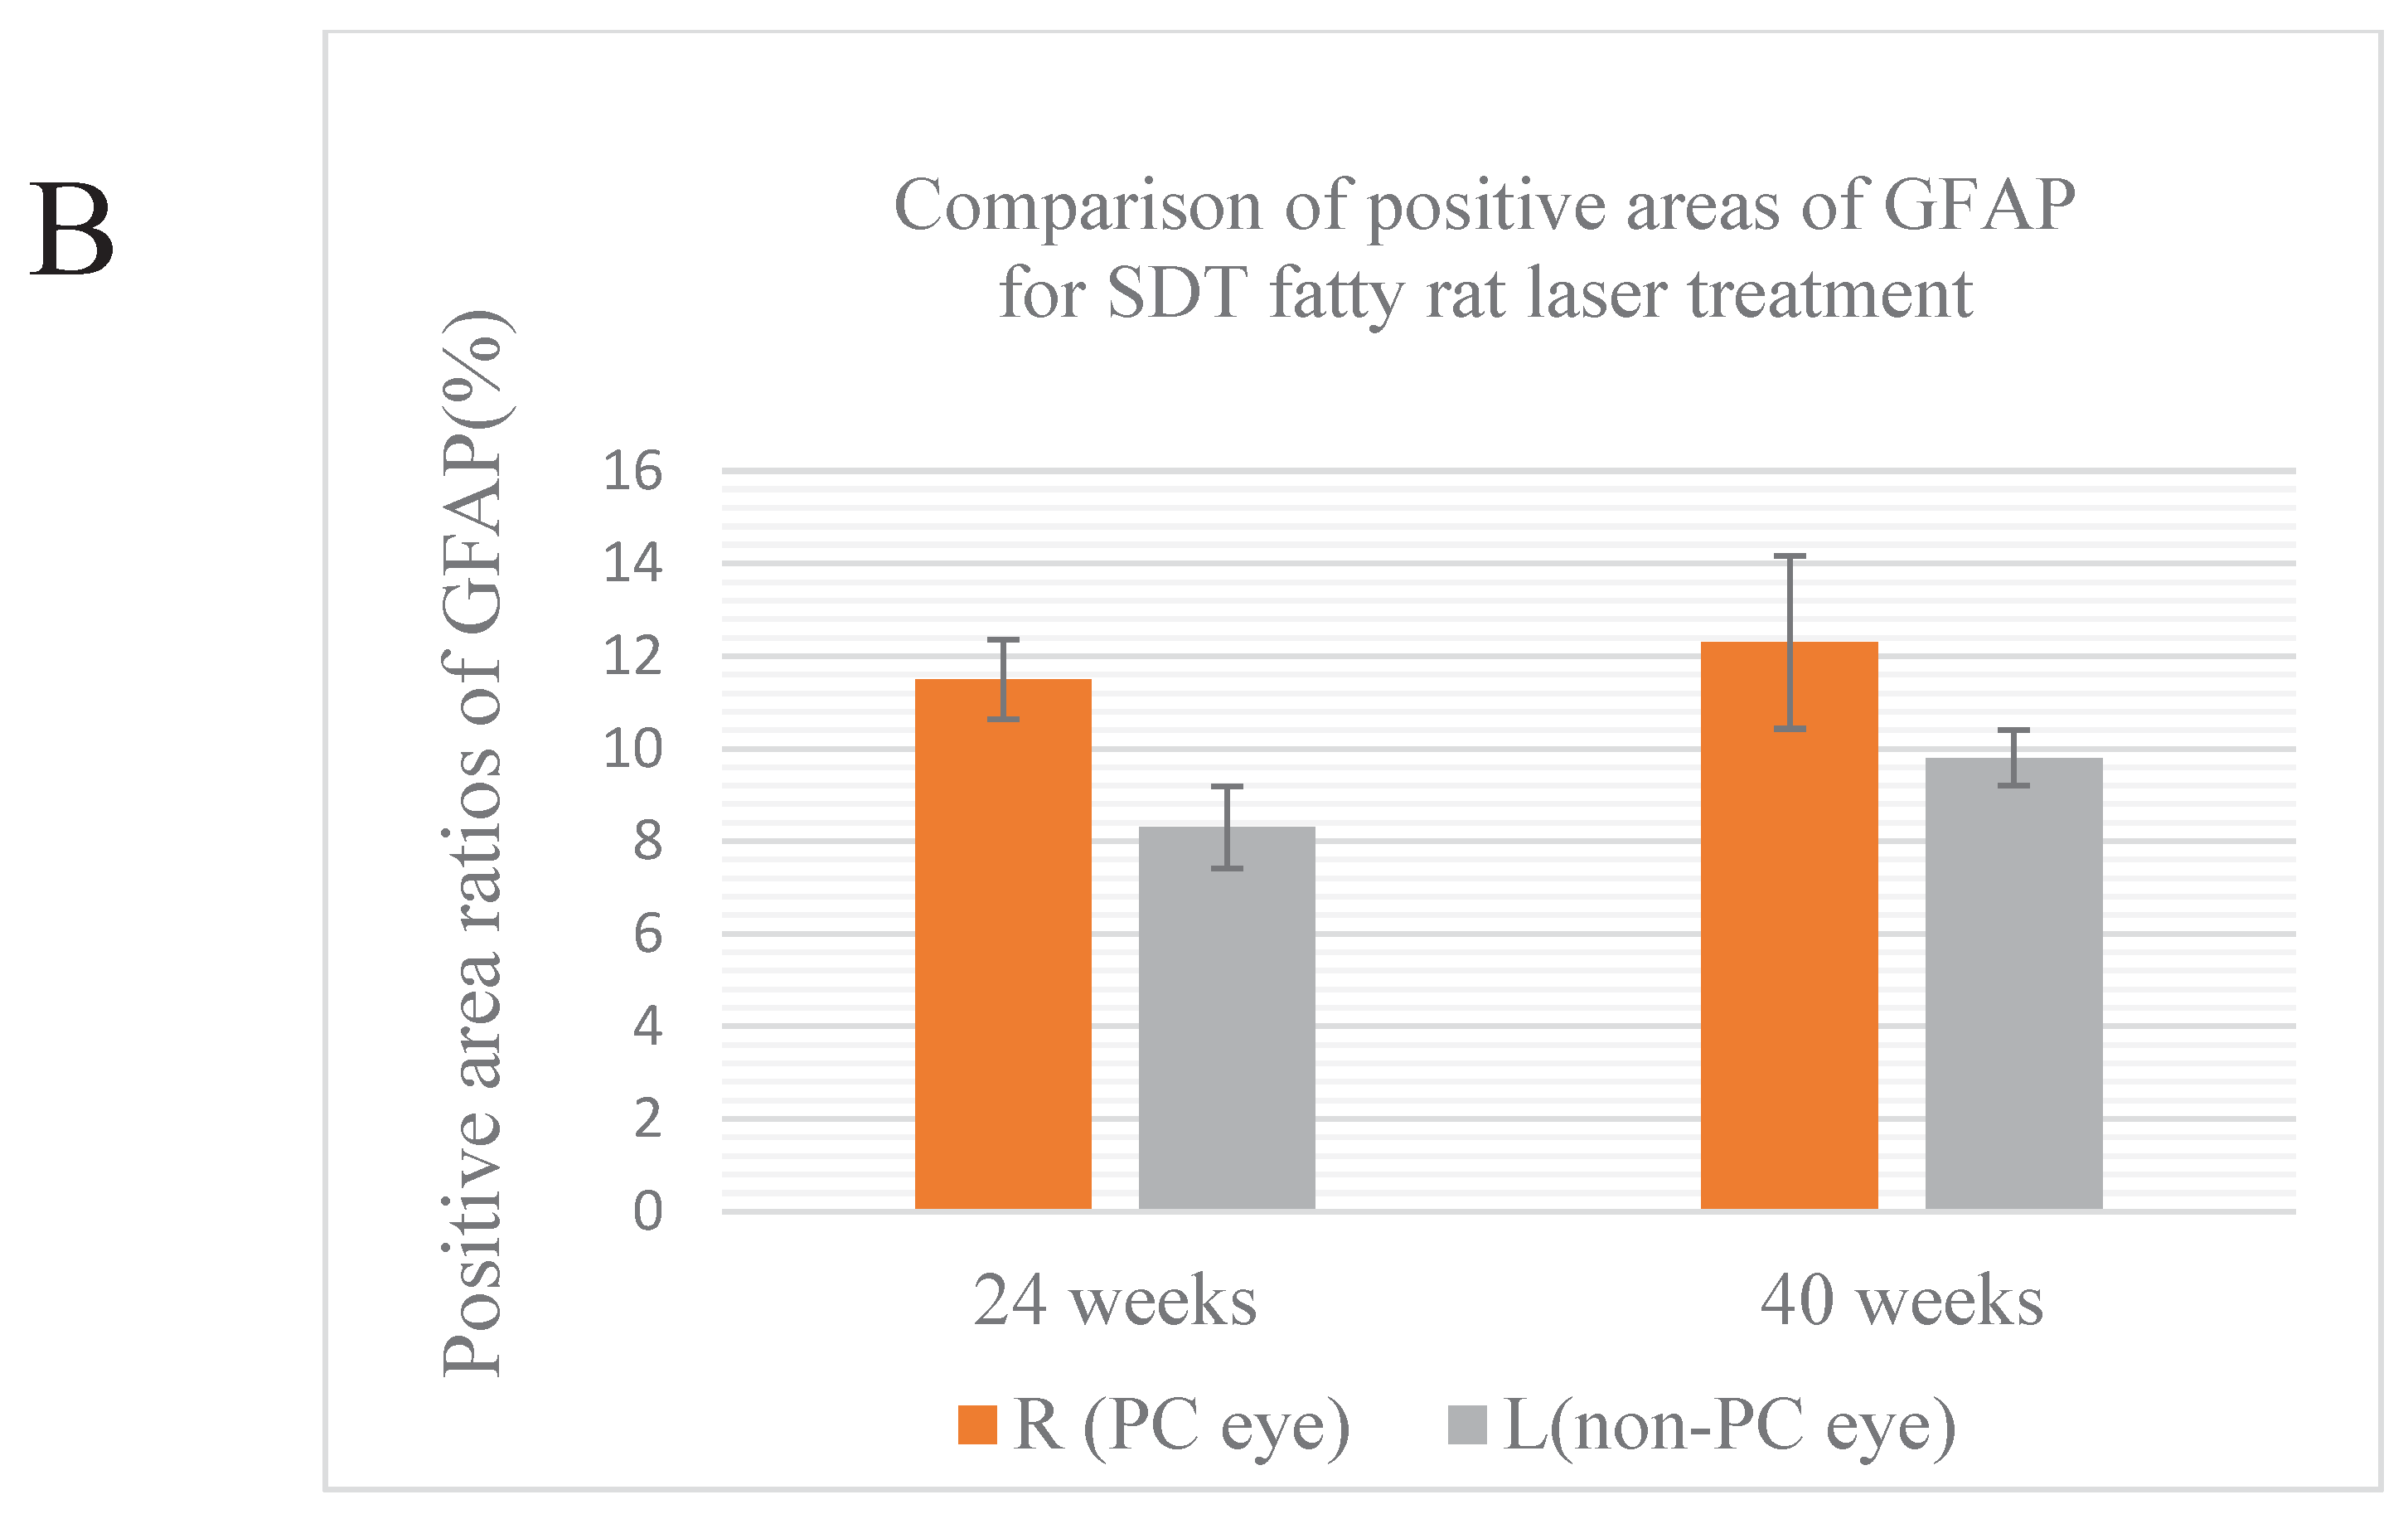
In DR, increased levels of VEGF and GFAP are seen in ganglion cells, so the percentage for the area positive for VEGF and GFAP immunostaining is higher in DR in SDT fatty rats [9]. If DR is suppressed, the positive area ratio of both VEGF and GFAP should be reduced. Figure 4A and Figure 5A, respectively, show immunostaining for VEGF and GFAP performed on the tissue sections for immunohistochemical studies compared to the original images.
The results of each average area ratio are shown below. In 24-week SDT fatty rats, the mean VEGF-positive area ratios were 14.4±4.87% in treated eyes and 11.5±2.53% in untreated eyes. In 40-week SDT fatty, the mean VEGF-positive area ratios were 12.4±1.99% in treated eyes and 17.7±5.87% in untreated eyes. (Figure 4B)
In 24-week SDT fatty rats, the mean GFAP positive area ratios were 11.5±1.93% in treated eyes and 9.0±6.0% in untreated eyes. In 40-week SDT fatty rats, the mean GFAP positive area ratios were 12.3±3.24% in laser-treated eyes and 9.8±4% in untreated eyes. (Figure 5B).
No significant differences in VEGF immunostaining were seen between the untreated eyes and treated eyes of SDT fatty rats at either age (24-week SDT fatty rat area positive for VEGF, p=0.264; 40-week SDT fatty rat were positive for VEGF, p=0.193). In addition, no significant differences in GFAP immunostaining were seen between the untreated eyes and treated eyes of SDT fatty rats at either age (24-week SDT fatty rat area positive for GFAP, p=0.078; 40-week SDT fatty rat area positive for GFAP, p=0.260)
4. Discussion
The SDT fatty rats used in this study were treated with laser at 8 weeks of age, the stage considered to be presymptomatic for retinopathy [7,8], so we believe that there were no avascular areas present at that time. The purpose of this study was to investigate whether retinopathy can be prevented by performing pattern scanning laser on the retina without avascular areas before the onset of retinopathy.
This study focused on the reduction in oxygen demand during retinal photocoagulation. Retinal photocoagulation is the first-line treatment to stop progression of retinopathy. Photocoagulation performed on ischemic retina causes degenerative necrosis of the photoreceptor cells and retinal pigment epithelial cells (RPE), which consume a large amount of oxygen. Ischemia is corrected by reducing the metabolic demand in the outer retinal layer and the associated reduction in oxygen consumption. Those maintain the oxygen tension in the inner retinal layer and the function and metabolism of glial cells and vascular endothelial cells. As a result, the production of angiogenesis-promoting factors such as VEGF is suppressed, which is thought to prevent development and regression of new blood vessels. In short, photocoagulation performed on ischemic retina suppresses progression of DR. The idea was to use this mechanism to prevent the onset of DR by performing photocoagulation before retinal ischemia has the opportunity to develop.
We also focused on the mechanism by which retinal photocoagulation suppresses VEGF production. The idea was that stimulation of RPE by retinal photocoagulation using a pattern scanning laser would promote PEDF secretion from the RPE, which would suppress VEGF production and prevent development of DR. Unfortunately, we did not find a preventative effect of prophylactic pattern scanning laser retinal photocoagulation on the development of DR in SDT fatty rats.
In this study, we set up the laser after several tests based on various studies [23,24]. A power of 360 mW, an irradiation time of 20 ms, and a spot size of 200 μm (retinal spot size, 330 μm) were used to create moderate scars, which match the settings of an actual clinical pattern scanning laser. Since rats do not have a macula, coagulation was performed circumferentially, leaving a space of one coagulation spot from around the optic disc. When the rats moved due to the decay of the anesthetic effect over time, the laser was stopped halfway. Therefore, as a result of this, some rats received fewer lasers than originally planned.
Adjusting the laser power and coagulation number had to be done carefully. If the laser output is too strong or the number of coagulation spots is too high, it would lead to complete necrosis of the RPE cells and production of PEDF expression; release might also decrease at the same time. However, if the laser output is too weak, it would not lead to a decrease in the amount of oxygen used by the RPE cells. In addition, the expression and the amount of PEDF released cannot be obtained sufficiently. When we tested the coagulation output at 400 and 450 mW, there was a tendency for over-coagulation, and at 280 to 300 mW, faint coagulation spots appeared; when we set the laser to 360 mW, the result was solid coagulation spots, which were confirmed in all rats. However, pathological examination showed no obvious retinal and choroidal damage due to laser treatment. The reason for this may be that, although appropriate coagulation spots were produced, the laser power was weak. In addition, since retinal analysis was performed at 24 weeks of age after waiting for the onset of DR, it is possible that the retinal scar improved due to the ability of SDT fatty rats to recover from retinal damage. In the future, it will be necessary to perform pathological analyzes at various ages of the animals and compare them.
Another consideration is that SDT fatty rats have such severe hyperglycemia during the early weeks of age that photocoagulation alone cannot completely stop retinopathy progression in SDT fatty rats. SDT fatty rats already had a blood sugar level in excess of 600 mg/dl at 8 weeks, but it was confirmed that they had not yet developed DR [7,8]. After that, the characteristics of DR, such as retinal thickening, gradually appear. It has been proven that normalization of oxygen partial pressure as the result of laser application greatly contributes to preventing exacerbation of DR, but the complex molecular mechanisms that occur in DR have not been fully elucidated. Including VEGF and AGEs mentioned previously, increases in the polyol pathway, protein kinase C, expression of growth factors such as insulin-like growth factor-1, haemodynamic changes, oxidative stress, activation of the renin-angiotensin-aldosterone system, and subclinical inflammation and capillary occlusion are involved in the onset and progression mechanism of DR [25]. There is a high possibility that various and complicated yet-to-be-defined mechanisms occur in SDT fatty rats whose high blood sugar continues for a long period of time, and normalization of oxygen partial pressure by only photocoagulation may not normalize the oxygen partial pressure and prevent progression of DR.
We used a pattern scanning laser, which is widely used in clinical practice, but subthreshold micropulse lasers are now being used for diseases such as intractable DR and are attracting attention [26]. Compared to pattern scanning lasers, subthreshold micropulse lasers have a shorter irradiation time and irradiate only the RPE with a low-energy laser that does not destroy and even can regenerate retinal tissue [27]. It is used for various diseases such as for diabetic macular edema, proliferative DR, central serous chorioretinopathy, macular edema secondary to branch retinal vein occlusion, and glaucoma. Considering the strong effect while minimizing intraretinal damage, it is possible that a stronger laser power than that used in this experiment could stimulate the RPE and lead to PEDF secretion.
In this study, we tried pattern scanning laser on SDT fatty rats and focused on both stabilizing the oxygen partial pressure in the inner retinal layer and promoting PEDF expression in the RPE, but did not obtain any results. PEDF is an important factor that suppresses VEGF. If retinal photocoagulation, which is already widely used in clinical practice, can be applied both to suppress progression of DR and prevent its onset, it will become a new, simple, and safe preventative method. Future experiments should quantify and investigate changes in PEDF after retinal photocoagulation with various types and powers using the enzyme-linked immunosorbent assay method.
5. Conclusions
Prophylactic pattern scanning laser retinal photocoagulation for DR in SDT fatty rats was unsuccessful. However, preventing DR is an urgent issue that needs to be addressed. We believe that further research is needed to discover simple and clinically applicable methods for preventing the onset of DR.
Author Contributions
Conceptualization, R.T. and Y.T. and A.K.; Methodology, R.T. and Y.T. and A.K.; Validation, R.T. and Y.T. and T.H.; Formal Analysis, R.T. and T.H.; Writing – Original Draft Preparation, R.T. and A.K.; Writing – Review & Editing, R.T. and A.K. and M.S-T. and T.S. and M.S. and Y.K.; Supervision, A.K.; Project Administration, T.K. and A.K.; Funding Acquisition, R.T. and A.K.
Funding
This research has received research grants from Novartis Pharma K.K.
Institutional Review Board Statement
The study was conducted according to the guidelines of the Declaration of Helsinki, and approved by Jichi Medical University (Jichi Medical University Animal Experiment Approval No. 17105-02 and date of approval 11/3/2019).
Informed Consent Statement
Not applicable.
Written Informed Consent
Not applicable.
Acknowledgments
We thank Ms. Tomie Sakamoto and Ms. Yoko Noguchi for their technical assistance in the present animal study.
Conflicts of Interest
Author R.T. has received research grants from Novartis Pharma K.K. The funders had no role in the design of the study; in the collection, analyses, or interpretation of data; in the writing of the manuscript; or in the decision to publish the results. M.S. and Y.K. are employees of CLEA Japan, Inc. T.S. is an employee of Japan Tobacco Inc. M.S., Y.K. and T.S. did not participate in protocol design or data analysis.
References
- International Diabetes Federation. IDF Diabetes Atlas, 10th ed.; International Diabetes Federation: Brussels, Belgium, 2021. [Google Scholar]
- Yau, J.W.; Rogers, S.L.; Kawasaki, R.; Lamoureux, E.L.; Kowalski, J.W.; Bek, T.; Chen, S.J.; Dekker, J.M.; Fletcher, A.; Grauslund, J.; et al. Global prevalence and major risk factors of diabetic retinopathy. Diabetes Care. 2012, 35, 556–564. [Google Scholar] [CrossRef] [PubMed]
- Thomas, R.L.; Halim, S.; Gurudas, S.; Sivaprasad, S.; Owens, D.R. IDF Diabetes Atlas: A Review of Studies Utilising Retinal Photography on the Global Prevalence of Diabetes Related Retinopathy between 2015 and 2018. Diabetes Res. Clin. Pract. 2019, 157, 107840. [Google Scholar] [CrossRef] [PubMed]
- Zegeye, A.F.; Temachu, Y.Z.; Mekonnen, C.K. Prevalence and Factors Associated with Diabetes Retinopathy among Type 2 Diabetic Patients at Northwest Amhara Comprehensive Specialized Hospitals, Northwest Ethiopia 2021. BMC Ophthalmol. 2023, 23, 9. [Google Scholar] [CrossRef] [PubMed]
- Teo, Z.L.; Tham, Y.C.; Yu, M.; Chee, M.L.; Rim, T.H.; Cheung, N.; Bikbov, M.M.; Wang, Y.X.; Tang, Y.; Lu, Y.; et al. Global Prevalence of Diabetic Retinopathy and Projection of Burden through 2045: Systematic Review and Meta-Analysis. Ophthalmology 2021, 128, 1580–1591. [Google Scholar] [CrossRef] [PubMed]
- Shinohara, M.; Masuyama, T.; Shoda, T.; Takahashi, T.; Katsuda, Y.; Komeda, K.; Kuroki, M.; Kakehashi, A.; Kanazawa, Y. A New Spontaneously Diabetic Non-Obese Torii Rat Strain with Severe Ocular Complications. Int. J. Exp. Diabetes Res. 2000, 1, 89–100. [Google Scholar] [CrossRef]
- Masuyama, T.; Katsuda, Y.; Shinohara, M. A Novel Model of Obesity-Related Diabetes: Introgression of the Lepr(fa) Allele of the Zucker Fatty Rat into Nonobese Spontaneously Diabetic Torii (SDT) Rats. Exp. Anim. 2005, 54, 13–20. [Google Scholar] [CrossRef] [PubMed]
- Matsui, K.; Ohta, T.; Oda, T.; Sasase, T.; Ueda, N.; Miyajima, K.; Masuyama, T.; Shinohara, M.; Matsushita, M. Diabetes-Associated Complications in Spontaneously Diabetic Torii fatty Rats. Exp. Anim. 2008, 57, 111–121. [Google Scholar] [CrossRef] [PubMed]
- Tanaka, Y.; Takagi, R.; Ohta, T.; Sasase, T.; Kobayashi, M.; Toyoda, F.; Shimmura, M.; Kinoshita, N.; Takano, H.; Kakehashi, A. Pathological Features of Diabetic Retinopathy in Spontaneously Diabetic Torii Fatty Rats. J. Diabetes Res. 2019, 2019, 8724818. [Google Scholar] [CrossRef] [PubMed]
- Fung, T.H.; Patel, B.; Wilmot, E.G.; Amoaku, W.M. Diabetic retinopathy for the non-ophthalmologist. J. Clin. Med. 2022, 22, 112–116. [Google Scholar] [CrossRef] [PubMed]
- Kitano, S. Advances in photocoagulation. J. Japan. Diab. Soc. 2005, 48, 725–728. [Google Scholar]
- Royle, P.; Mistry, H.; Auguste, P.; Shyangdan, D.; Freeman, K.; Lois, N.; Waugh, N. Pan-Retinal Photocoagulation and Other Forms of Laser Treatment and Drug Therapies for Non-Proliferative Diabetic Retinopathy: Systematic Review and Economic Evaluation. Health Technol. Assess 2015, 19, v–xxviii, 1–247. [Google Scholar] [CrossRef] [PubMed]
- Yamagishi, S.; Imaizumi, T. AGEs and Oxidative Stress. J. Japan. Diabetes Soc. 2005, 48, 407–409. [Google Scholar]
- David, J.B. Diabetic retinopathy: Evidence-based management; Springer: New York, USA, 2010. [Google Scholar]
- Yamagishi, S.; Inagaki, Y.; Amano, S.; Okamoto, T.; Takeuchi, M.; Makita, Z. Pigment Epithelium-Derived Factor Protects Cultured Retinal Pericytes from Advanced Glycation End Product-Induced Injury through its Antioxidative Properties. Biochem. Biophys. Res. Commun. 2002, 296, 877–882. [Google Scholar] [CrossRef] [PubMed]
- Porta, M.; Curletto, G.; Cipullo, D.; Rigault de la Longrais, R.; Trento, M.; Passera, P.; Taulaigo, A.V.; Di Miceli, S.; Cenci, A.; Dalmasso, P.; et al. Estimating the Delay between Onset and Diagnosis of Type 2 Diabetes from the Time Course of Retinopathy Prevalence. Diabetes Care 2014, 37, 1668–1674. [Google Scholar] [CrossRef] [PubMed]
- Everett, L.A.; Paulus, Y.M. Laser Therapy in the Treatment of Diabetic Retinopathy and Diabetic Macular Edema. Curr. Diab. Rep. 2021, 21, 35. [Google Scholar] [CrossRef] [PubMed]
- Evans, J.R.; Michelessi, M.; Virgili, G. Laser Photocoagulation for Proliferative Diabetic Retinopathy. Cochrane Database Syst. Rev. 2014, 2014, CD011234. [Google Scholar] [CrossRef] [PubMed]
- Muramoto, S. Kinetic Transmission Velocity in Diabetes Mellitus. J. Juzen Med. Soc. 1975, 84, 24–28. [Google Scholar]
- Hirano, T.; Akahane, K.; Toriyama, Y.; Iesato, Y.; Murata, T. Evaluation of Time-Dependent Morphologic Changes Caused by Photocoagulation with Pattern Scan Laser. J. Eye Sci. 2013, 30, 1435–1439. [Google Scholar]
- Ueno, T. Current Status of Laser Treatment in Ophthalmology. Rev. Laser Eng. 2011, 39, 85–89. [Google Scholar] [CrossRef]
- Okubo, A.; Morishita, S.; Kakurai, K.; Suzuki, H.; Satou, T.; Ishizaki, E.; Kida, T.; Ueki, M.; Ikeda, T. Comparison between Conventional Panretinal Photocoagulation and Pattern Scan Laser Photocoagulation for Treating Diabetic Retinopathy. J. Eye Sci. 2013, 30, 1457–1460. [Google Scholar]
- Chu, Y.; Alder, V.A.; Humphrey, M.F.; Constable, I.J. Localization of IgG in the Normal and Dystrophic Rat Retina after Laser Lesions. Aust. N. Z. J. Ophthalmol. 1999, 27, 117–125. [Google Scholar] [CrossRef] [PubMed]
- Richardson, P.R.; Boulton, M.E.; Duvall-Young, J.; McLeod, D. Immunocytochemical Study of Retinal Diode Laser Photocoagulation in the Rat. Br. J. Ophthalmol. 1996, 80, 1092–1098. [Google Scholar] [CrossRef] [PubMed]
- Joanna, M.T.; Kirti, K.; Mohit, C.; Eva, M.K.; Rakesh, C. Pathophysiology of Diabetic Retinopathy. ISRN Ophthalmol. 2013, 2013, 343560. [Google Scholar]
- Sabal, B.; Teper, S.; Wylegala, E. Subthreshold Micropulse Laser for Diabetic Macular Edema: A Review. J. Clin. Med. 2022, 12, 274. [Google Scholar] [CrossRef] [PubMed]
- Gawecki, M. Micropulse Laser Treatment of Retinal Diseases. J. Clin. Med. 2019, 8, 242. [Google Scholar] [CrossRef] [PubMed]
Figure 1.
(A) Retinal thicknesses are measured at distances of 500, 1,000, and 1,500 μm from the optic disc in each specimen. (B) Comparison of retinal thicknesses from the optic disc in treated and untreated 24-week SDT fatty rats. (C) Comparison of retinal thicknesses from the optic disc in treated and untreated 40-week SDT fatty rats. R, right; L, left; PC, photocoagulation.
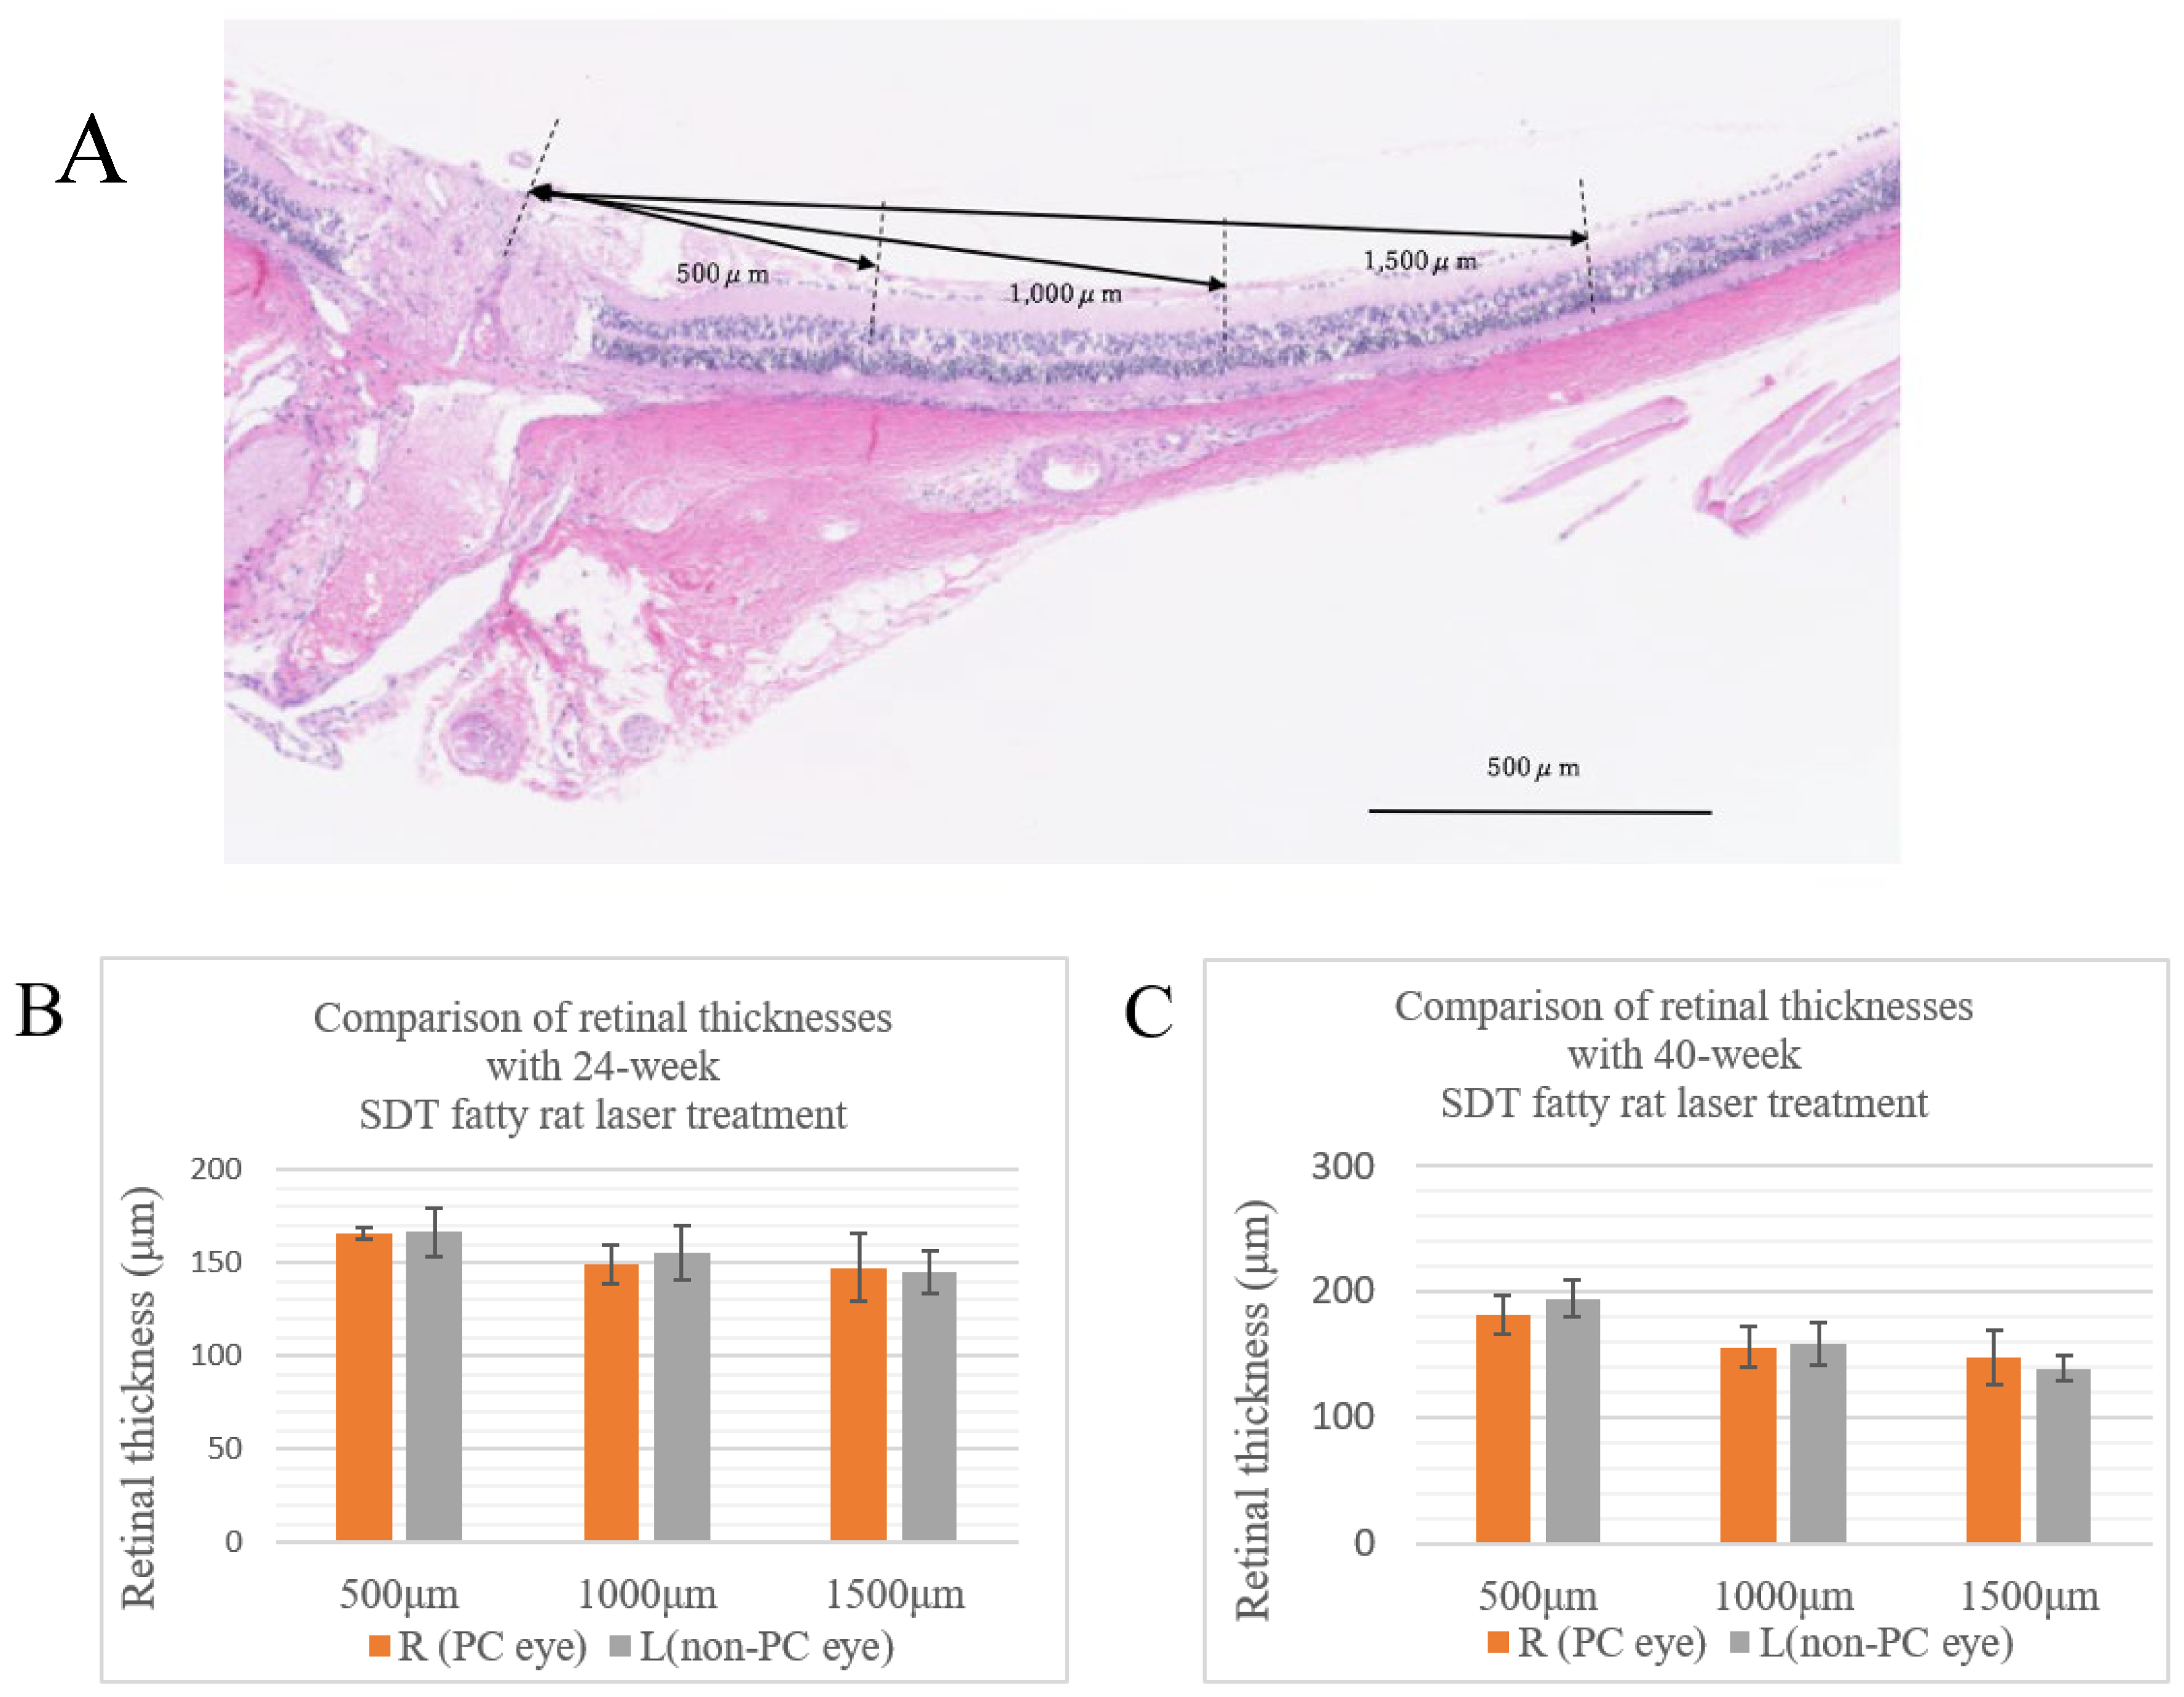
Figure 2.
(A) ERG waveforms of SDT fatty rats before and after laser application. (B) Comparison of the peak latency of the OP1 wave in treated and untreated SDT fatty rats. (C) Comparison of the amplitude of the OP waves in treated and untreated SDT fatty rats. R, right; L, left; PC, photocoagulation.
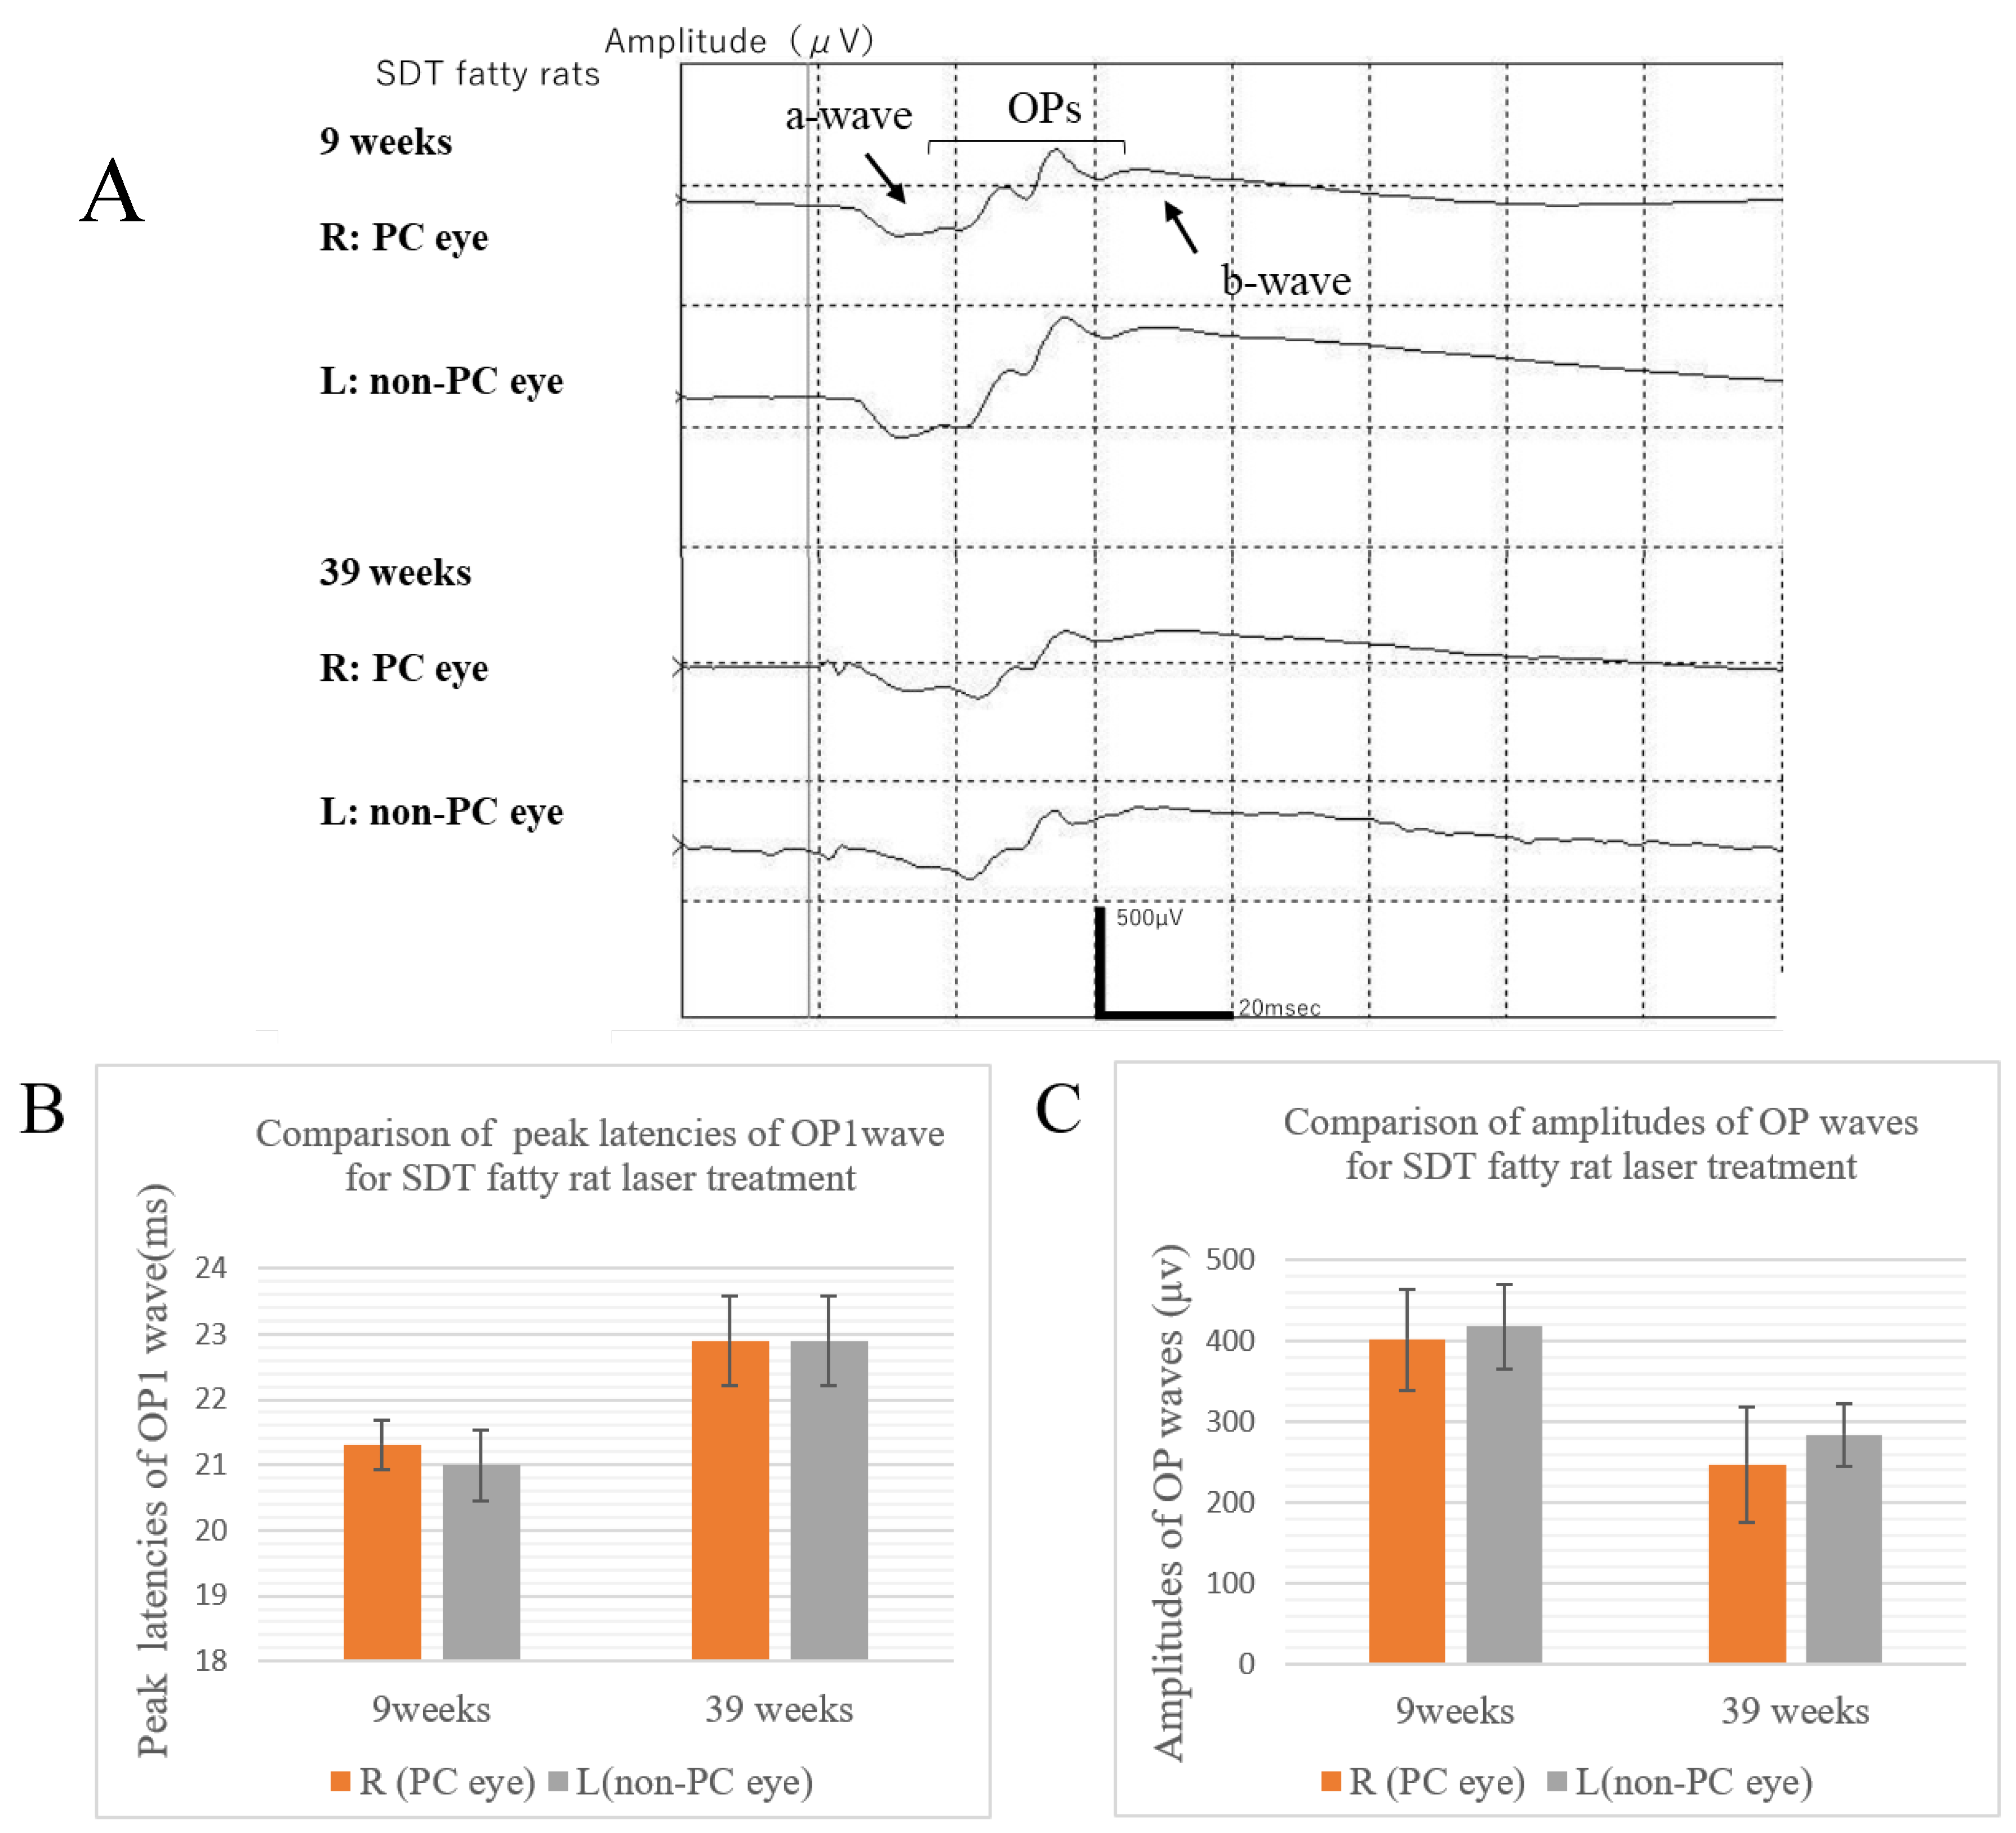
Figure 3.
(A) Retinal folds (arrows), defined as deformed tissue extending from the photoreceptor layer to the outer retinal granule layer, are counted from the optic disc out to 1,500 μm. (B) Comparison of the numbers of retinal folds in treated and untreated SDT fatty rats. R, right; L, left; PC, photocoagulation.
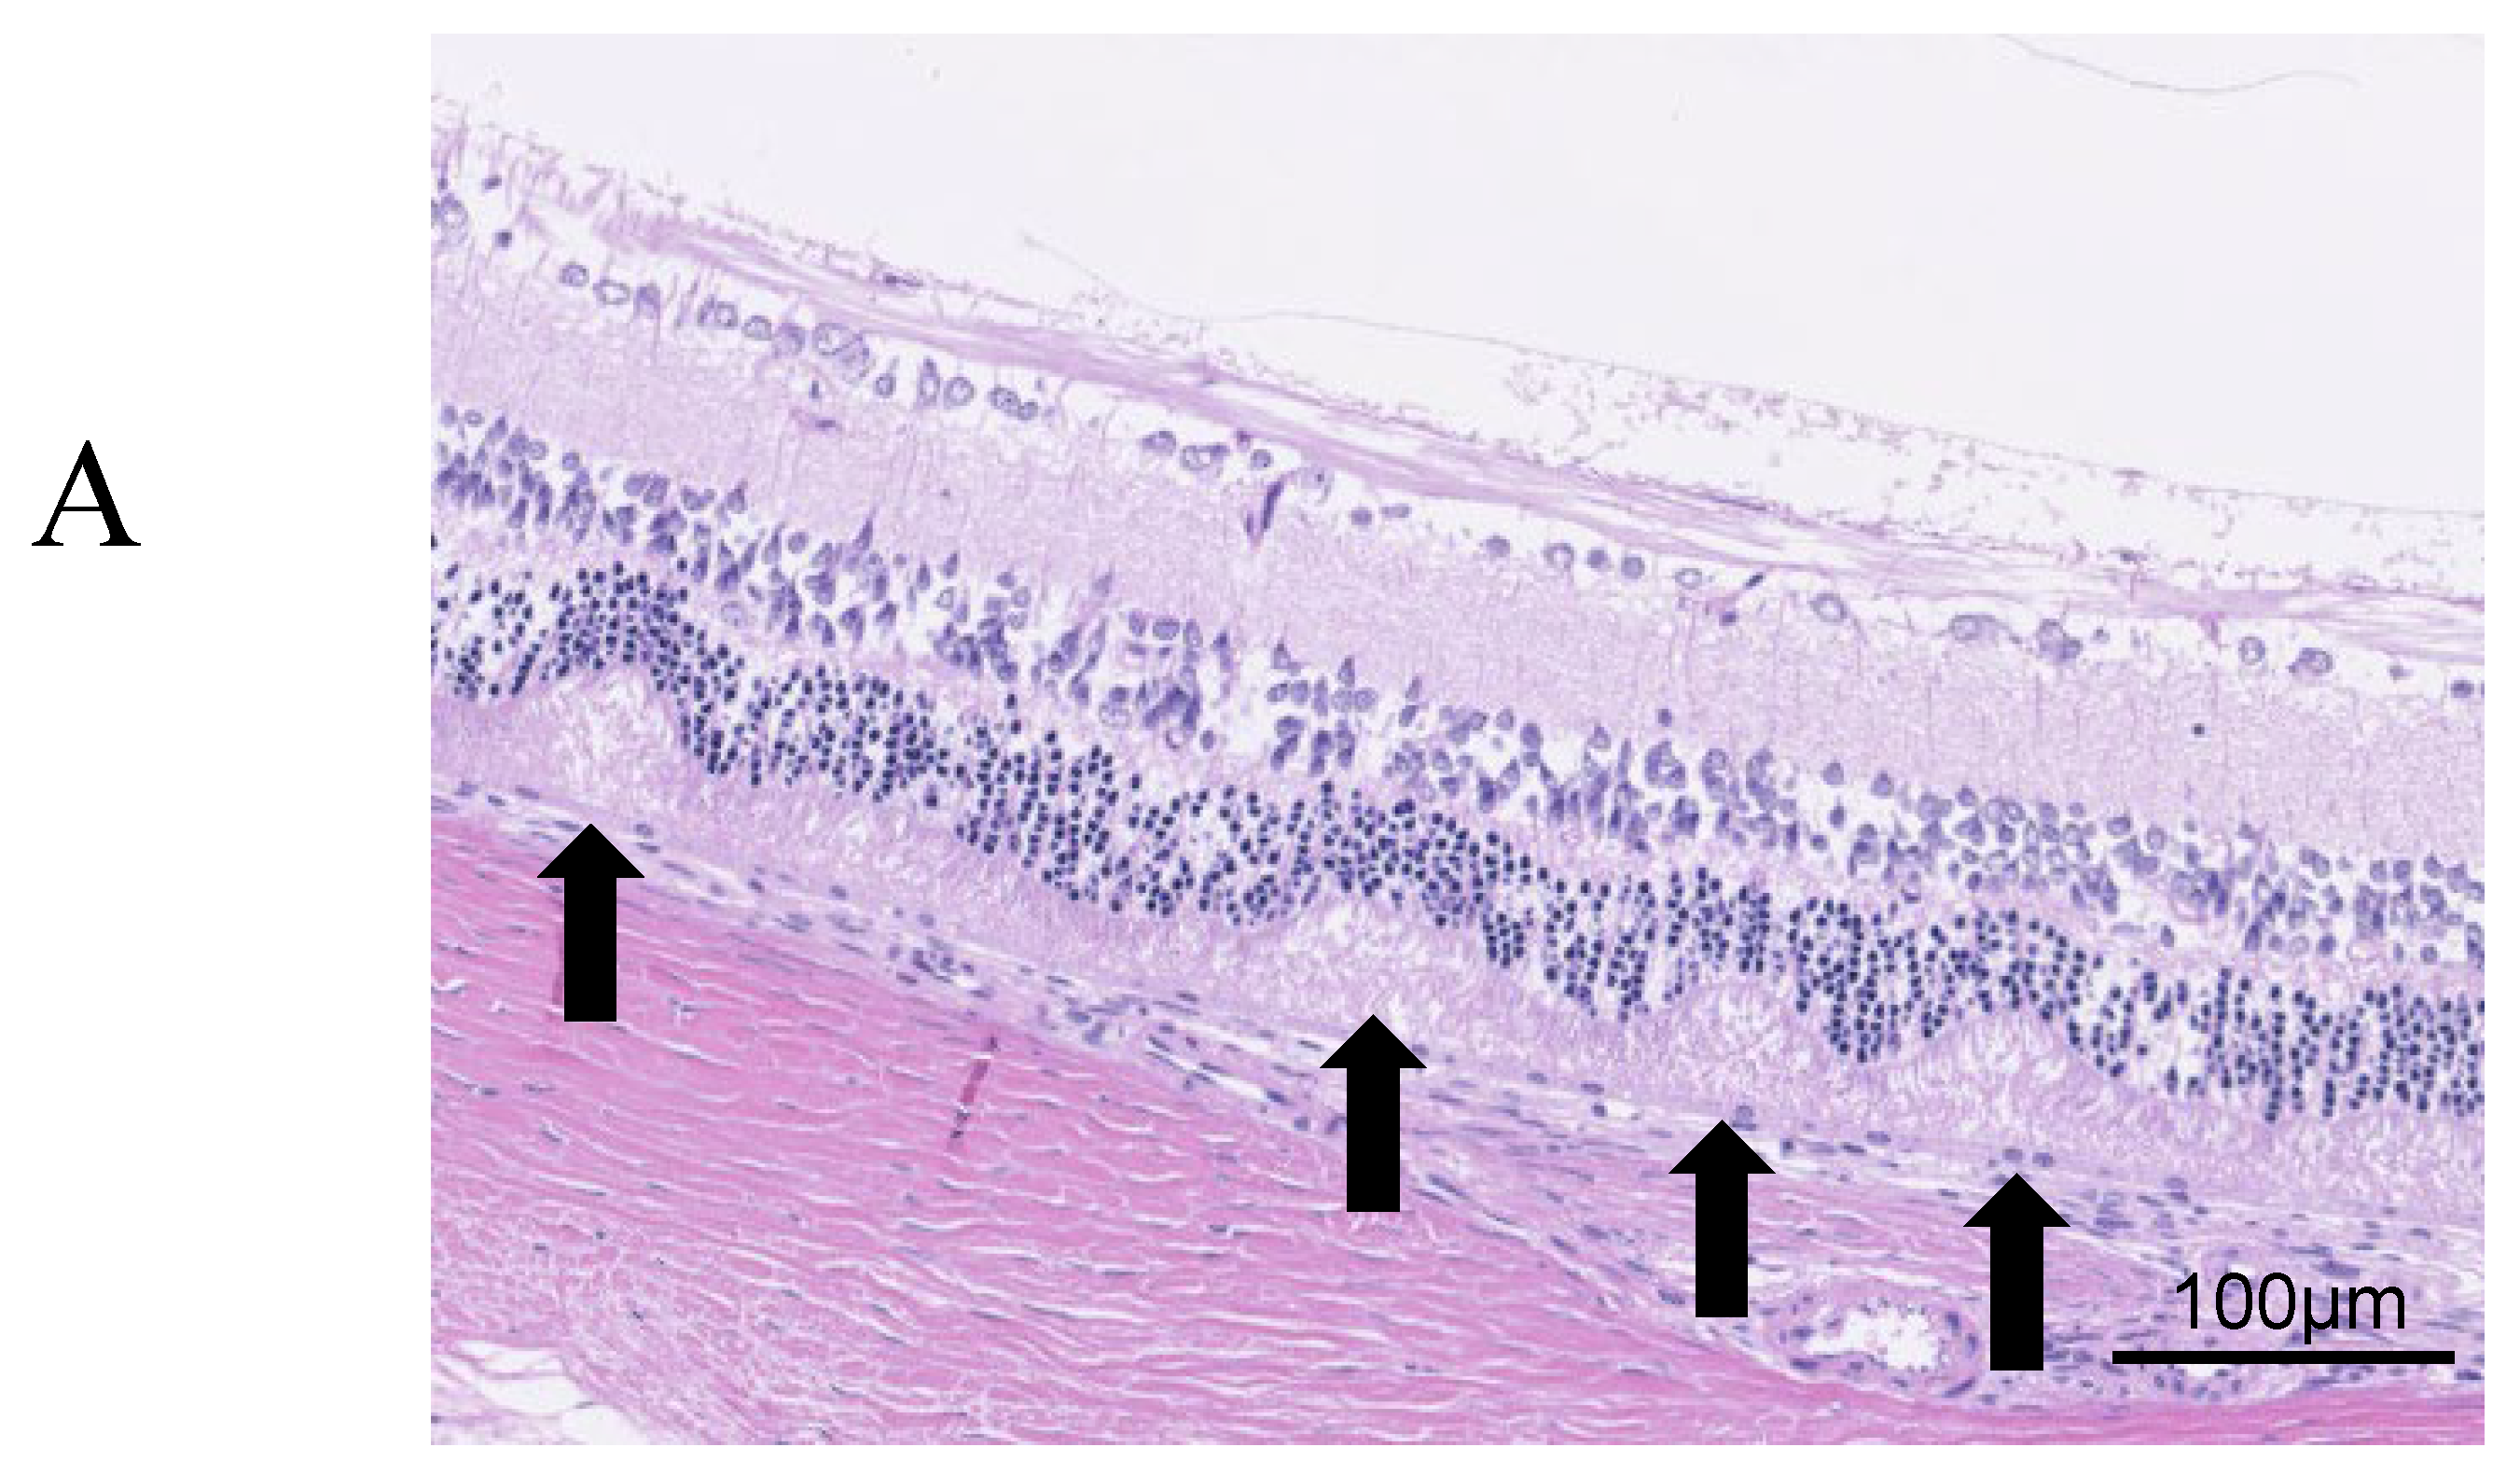
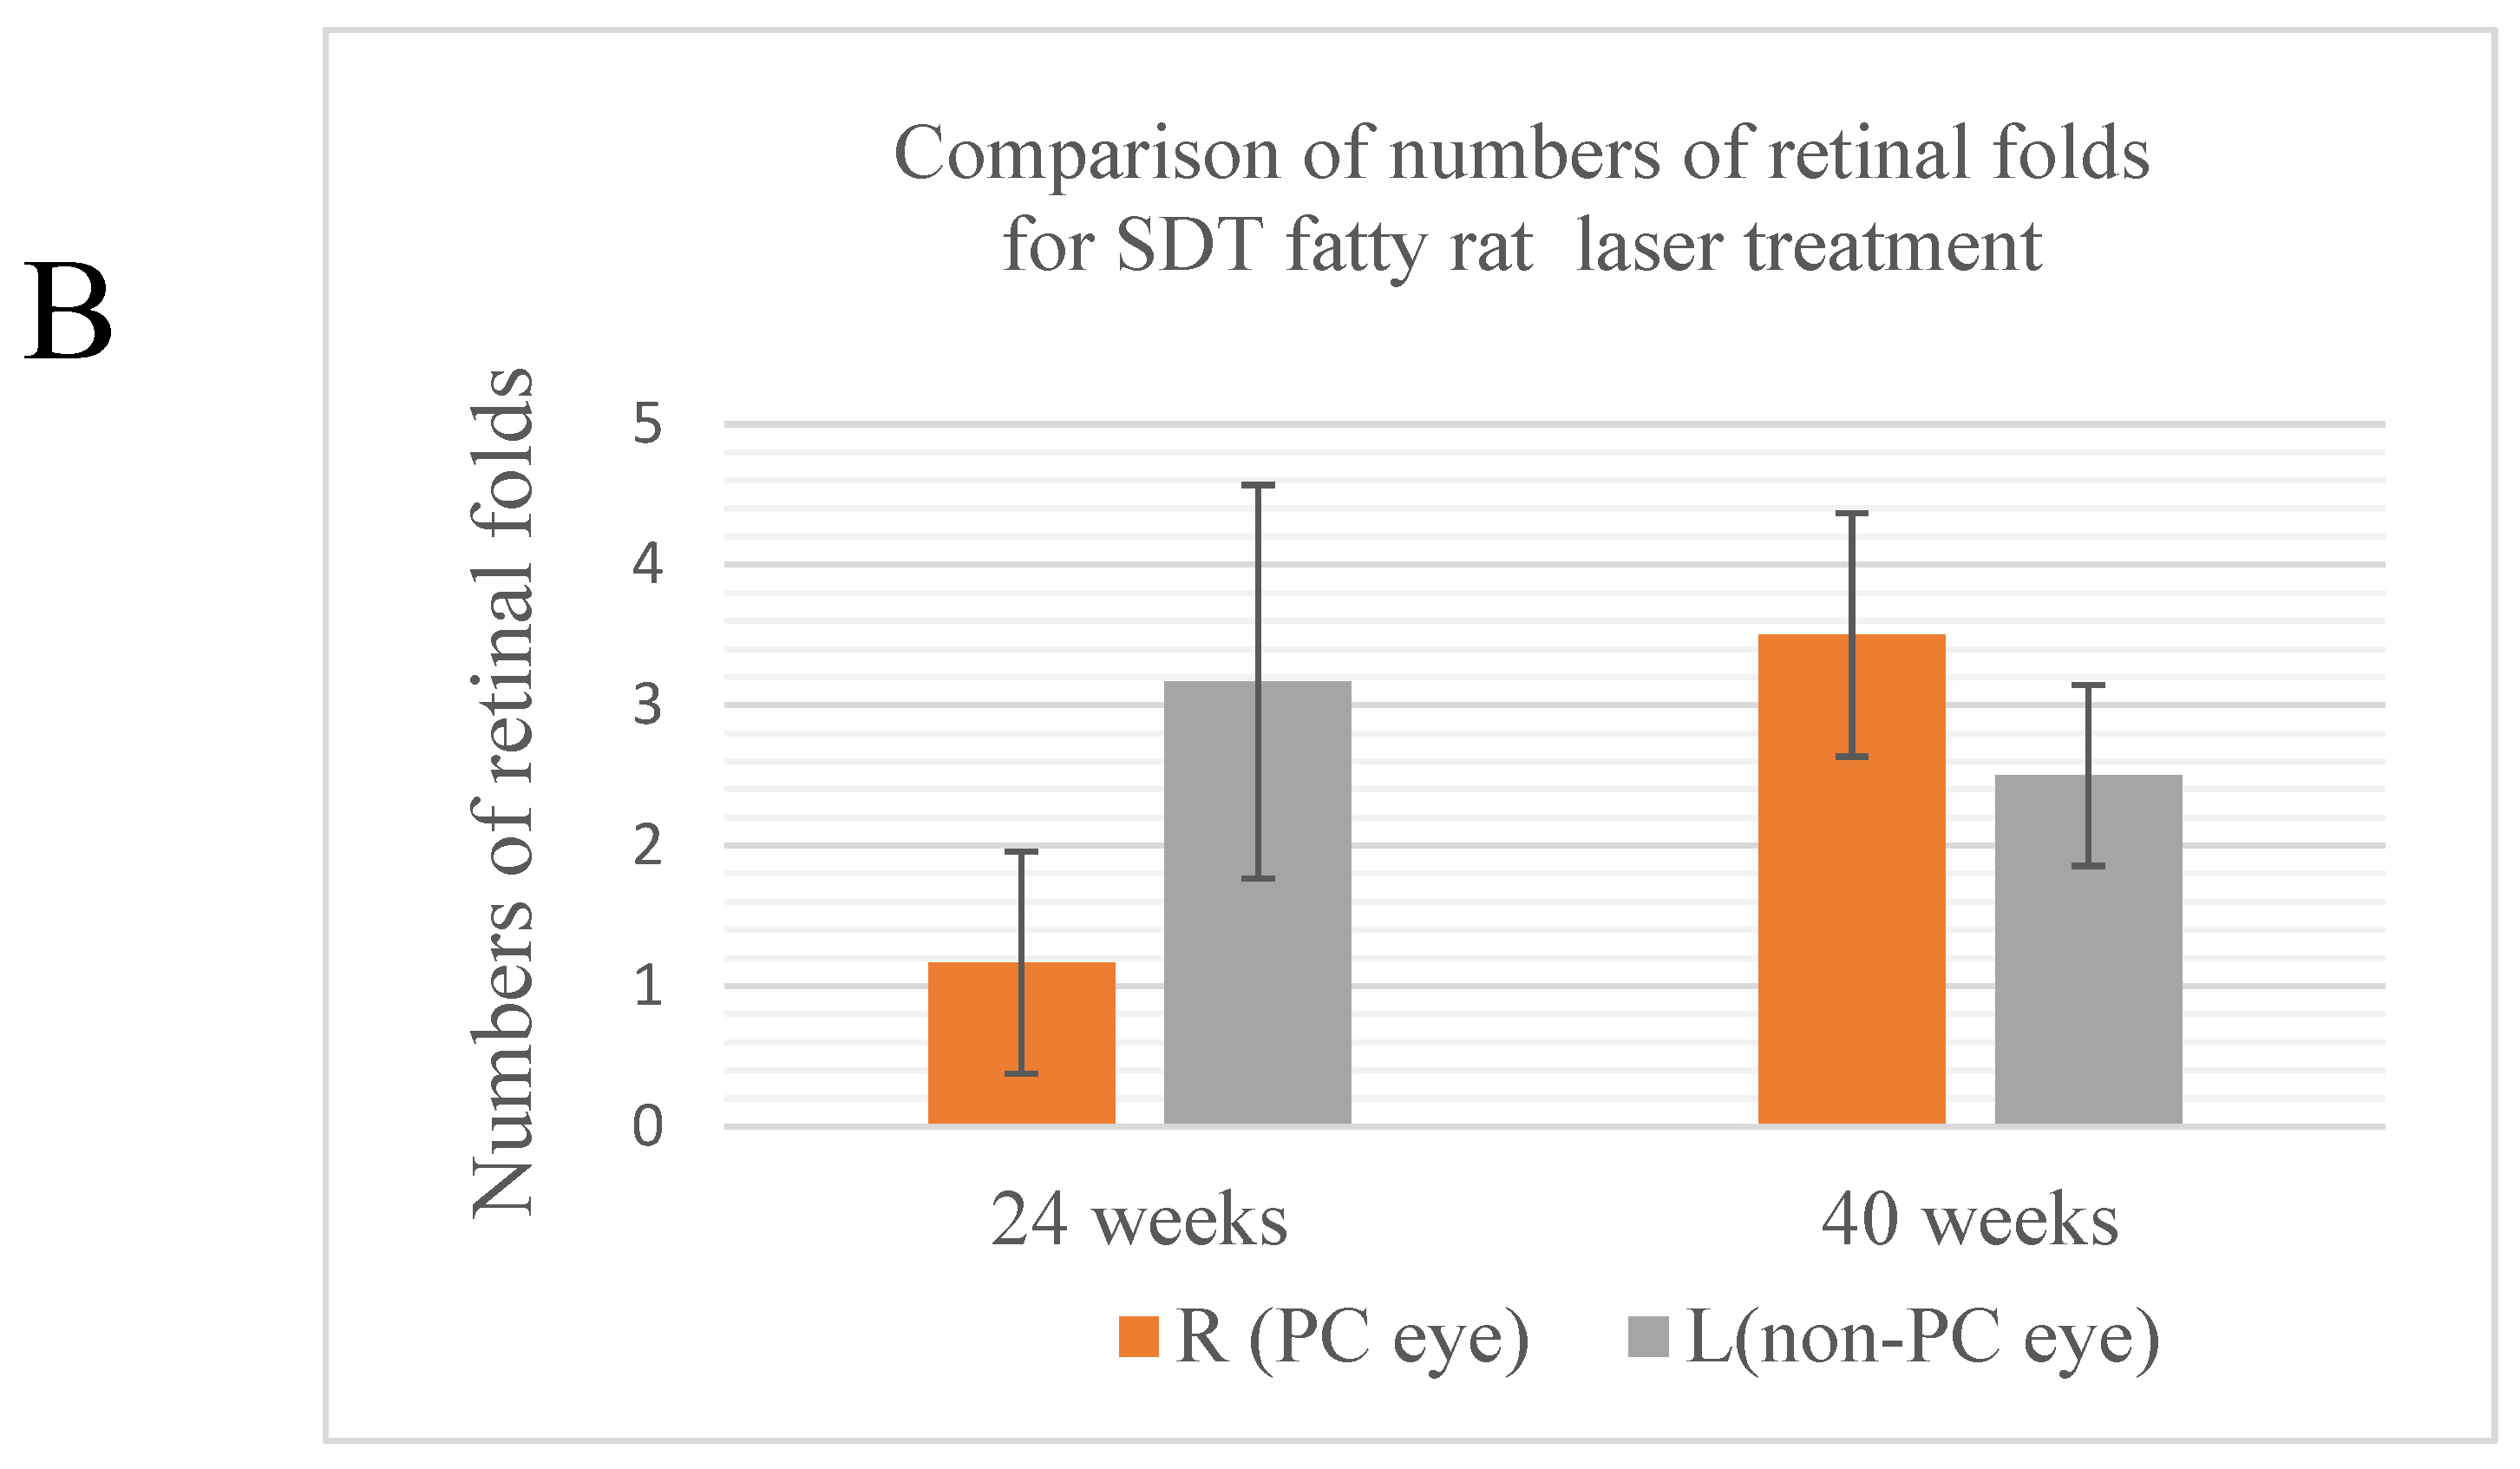
Figure 4.
(A) Quantitative analysis of VEGF-positive areas. The top is the original image, the bottom is the processed image. Positive areas were quantitatively analyzed and area ratios were calculated using Hybrid Cell Count Module/BZ-H3C software (Keyence, Chicago, IL, USA) within 1,500 μm from the optic disc. Blue indicates positive areas; magenta indicates negative areas. (B) Comparison of areas positive for VEGF in treated and untreated SDT fatty rats. R, right; L, left; PC, photocoagulation.
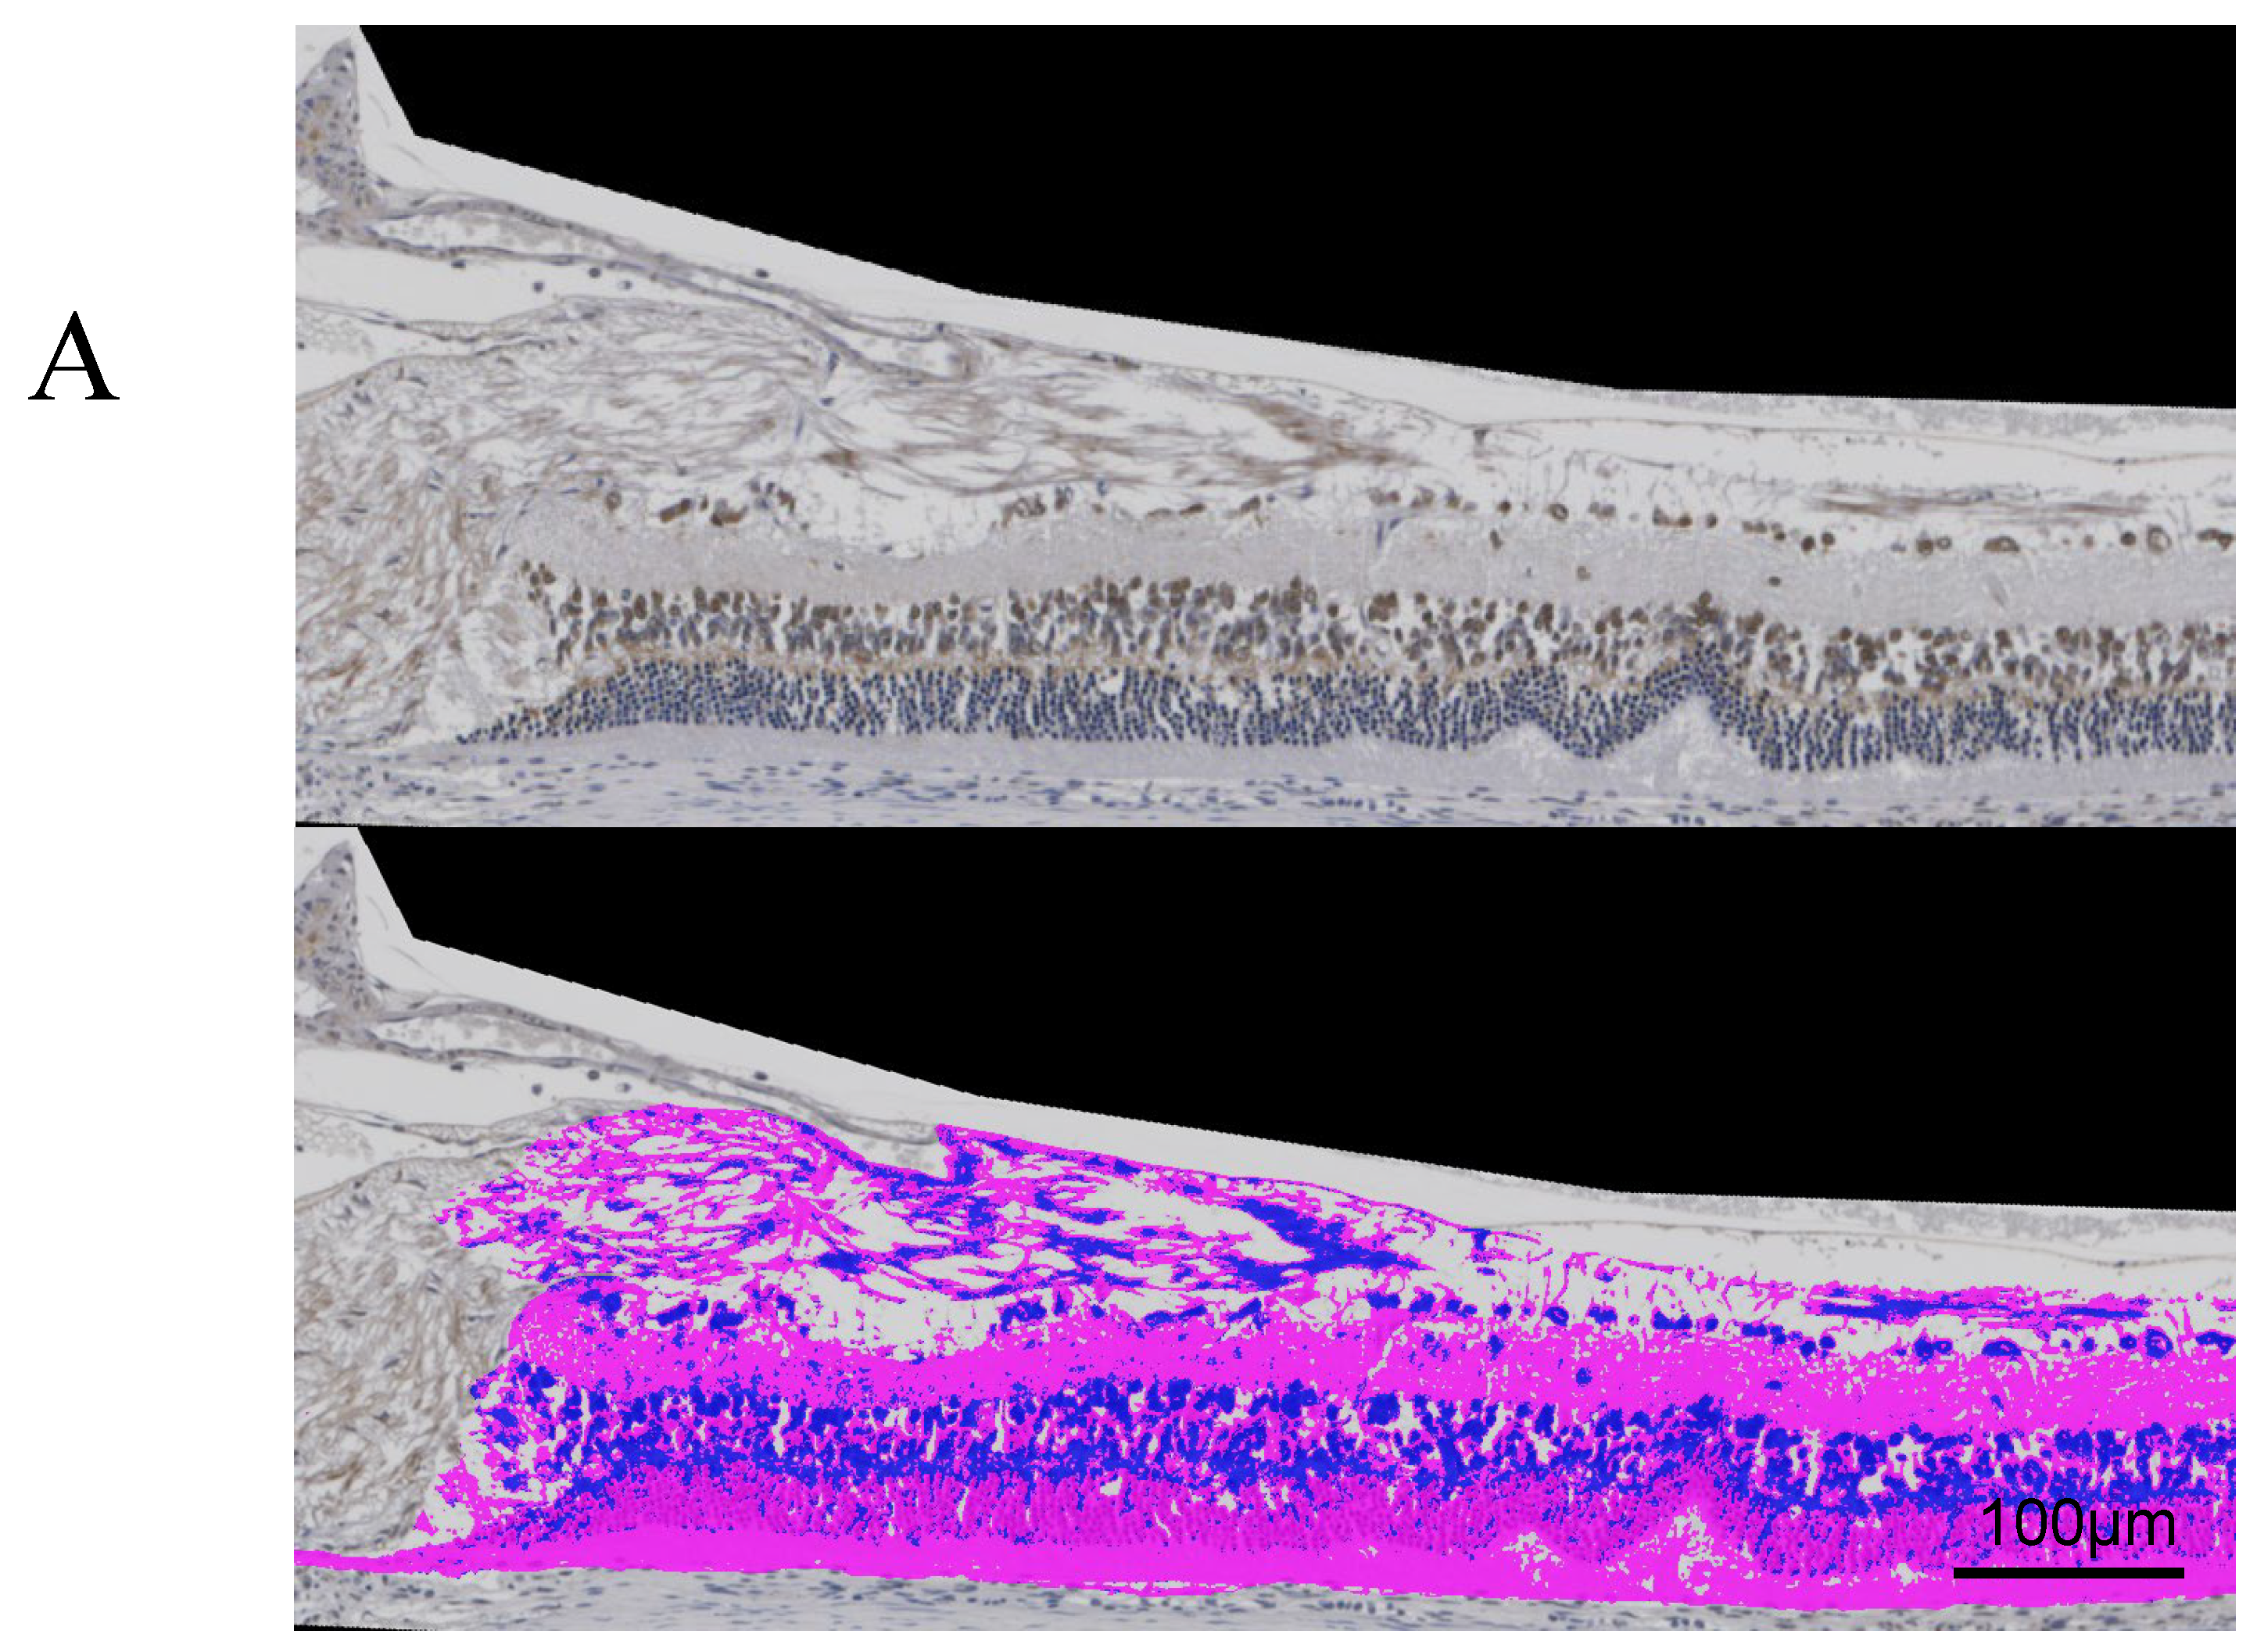
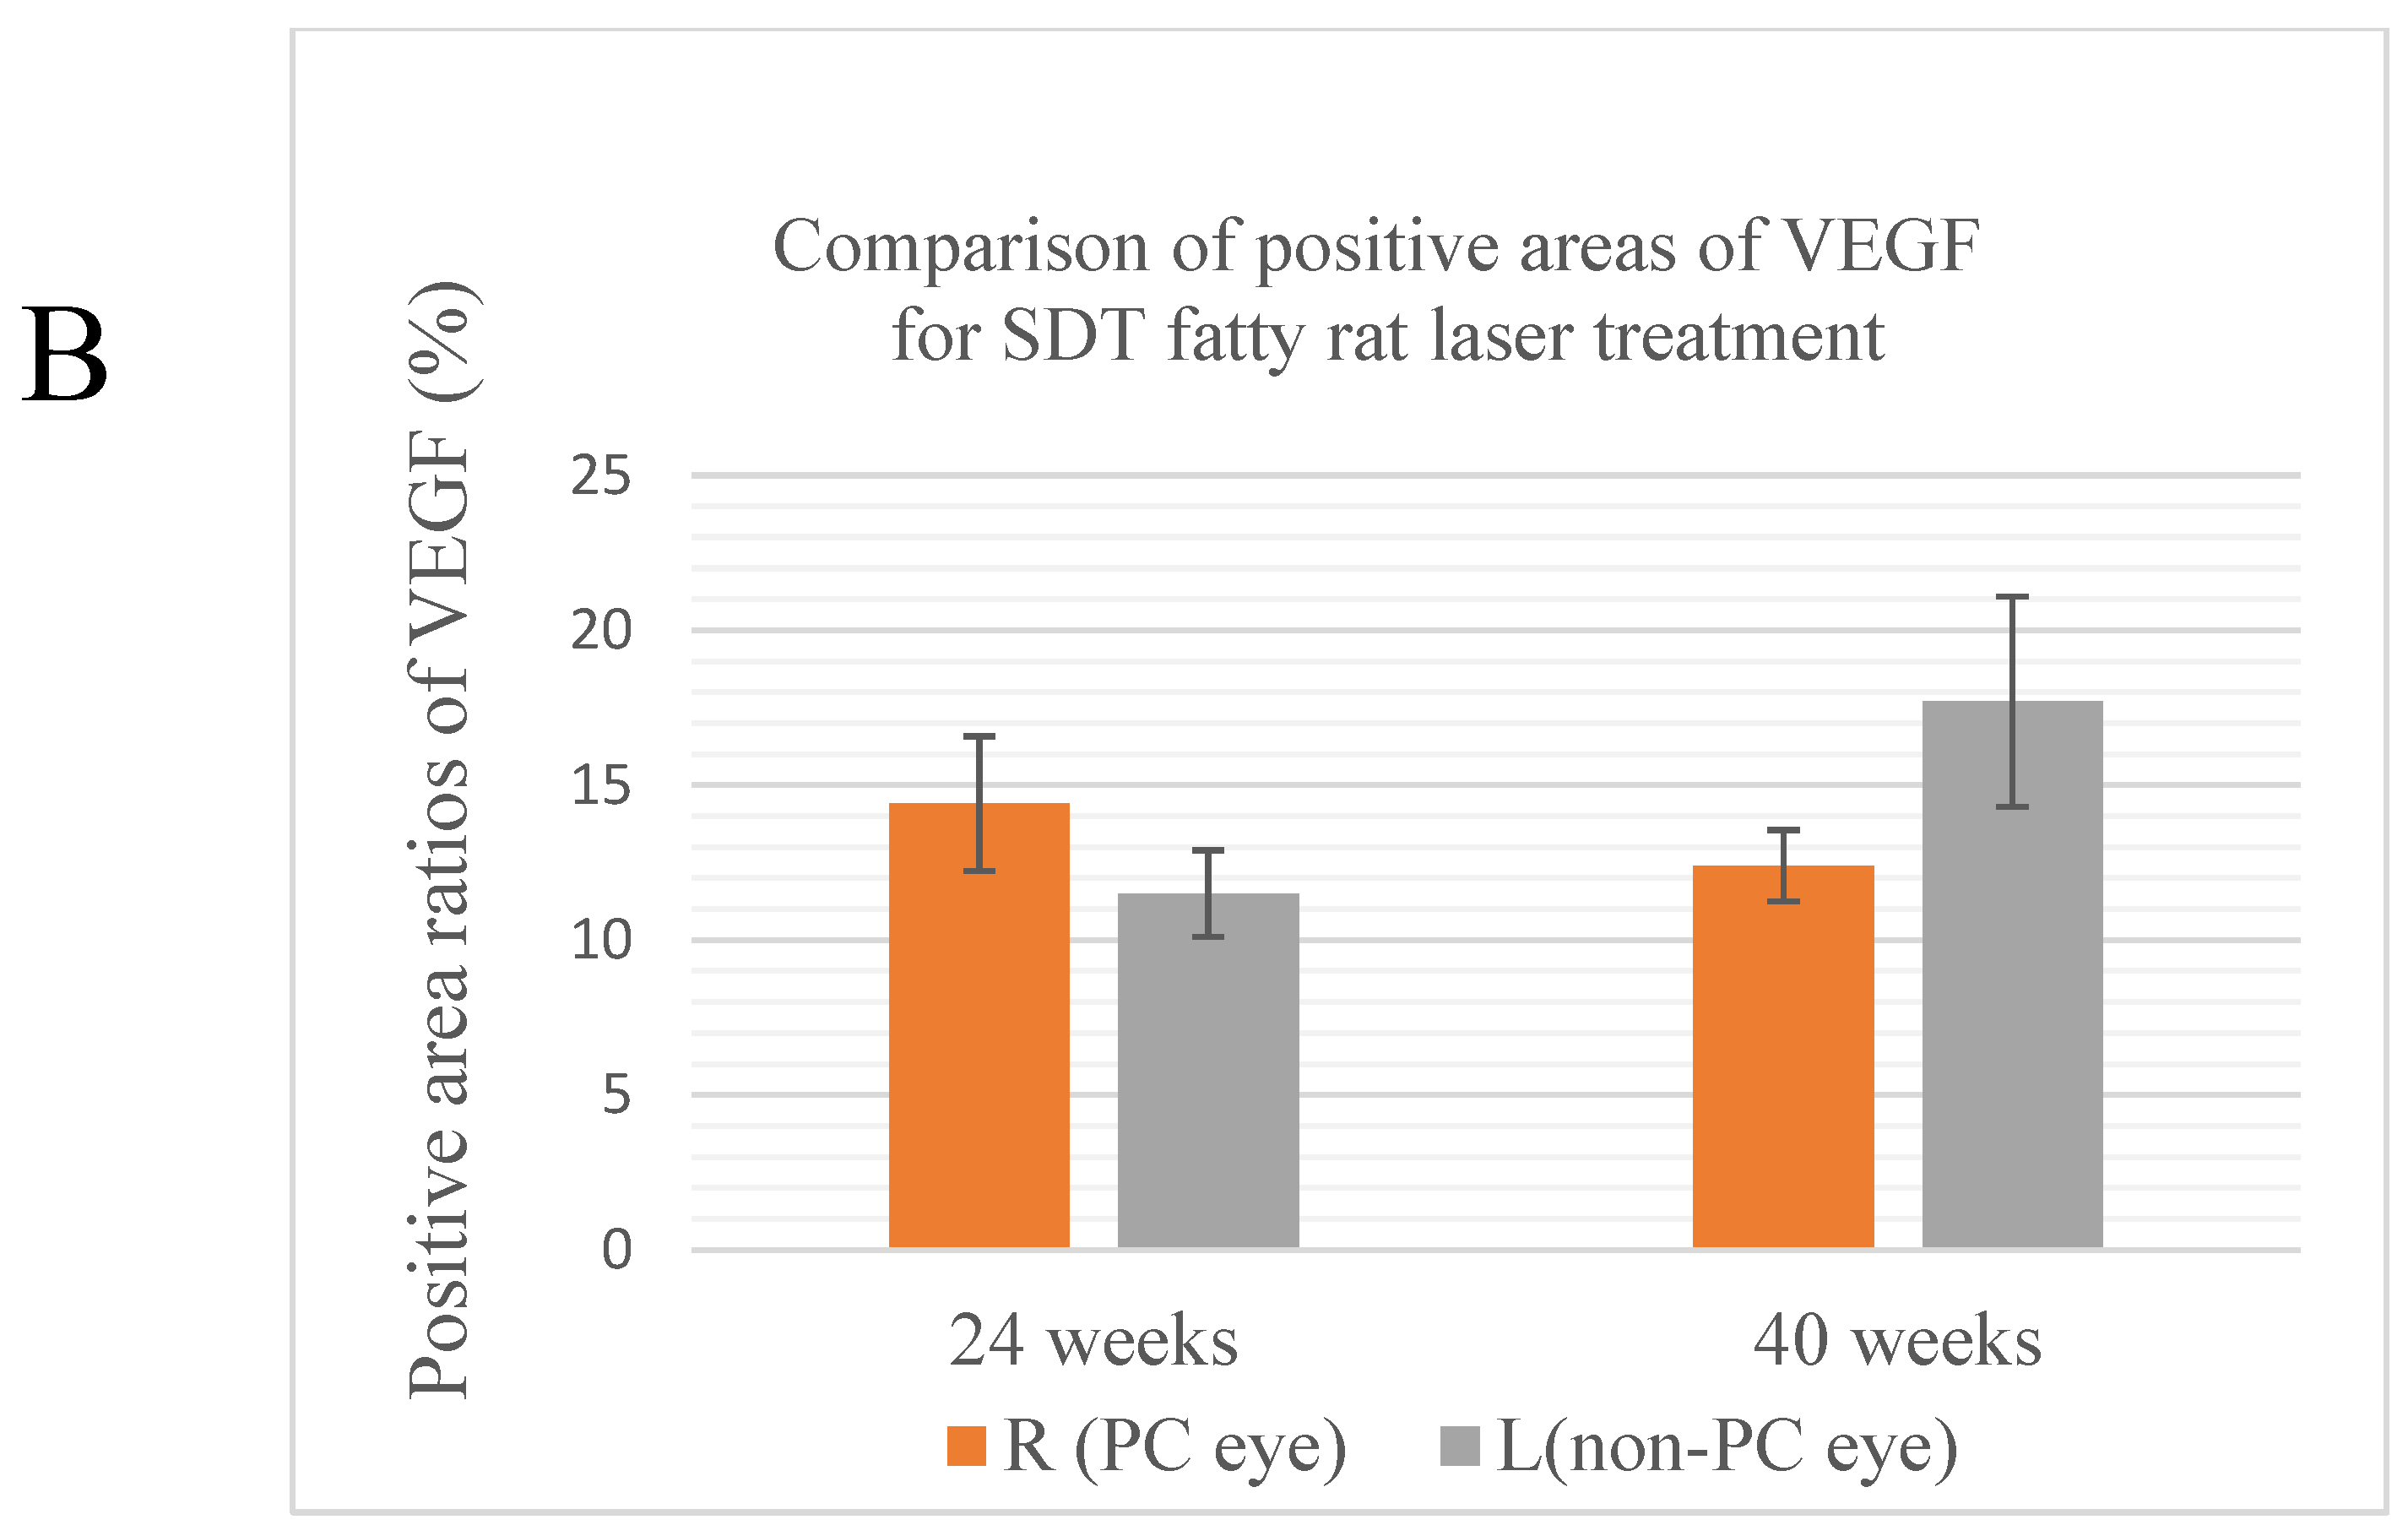
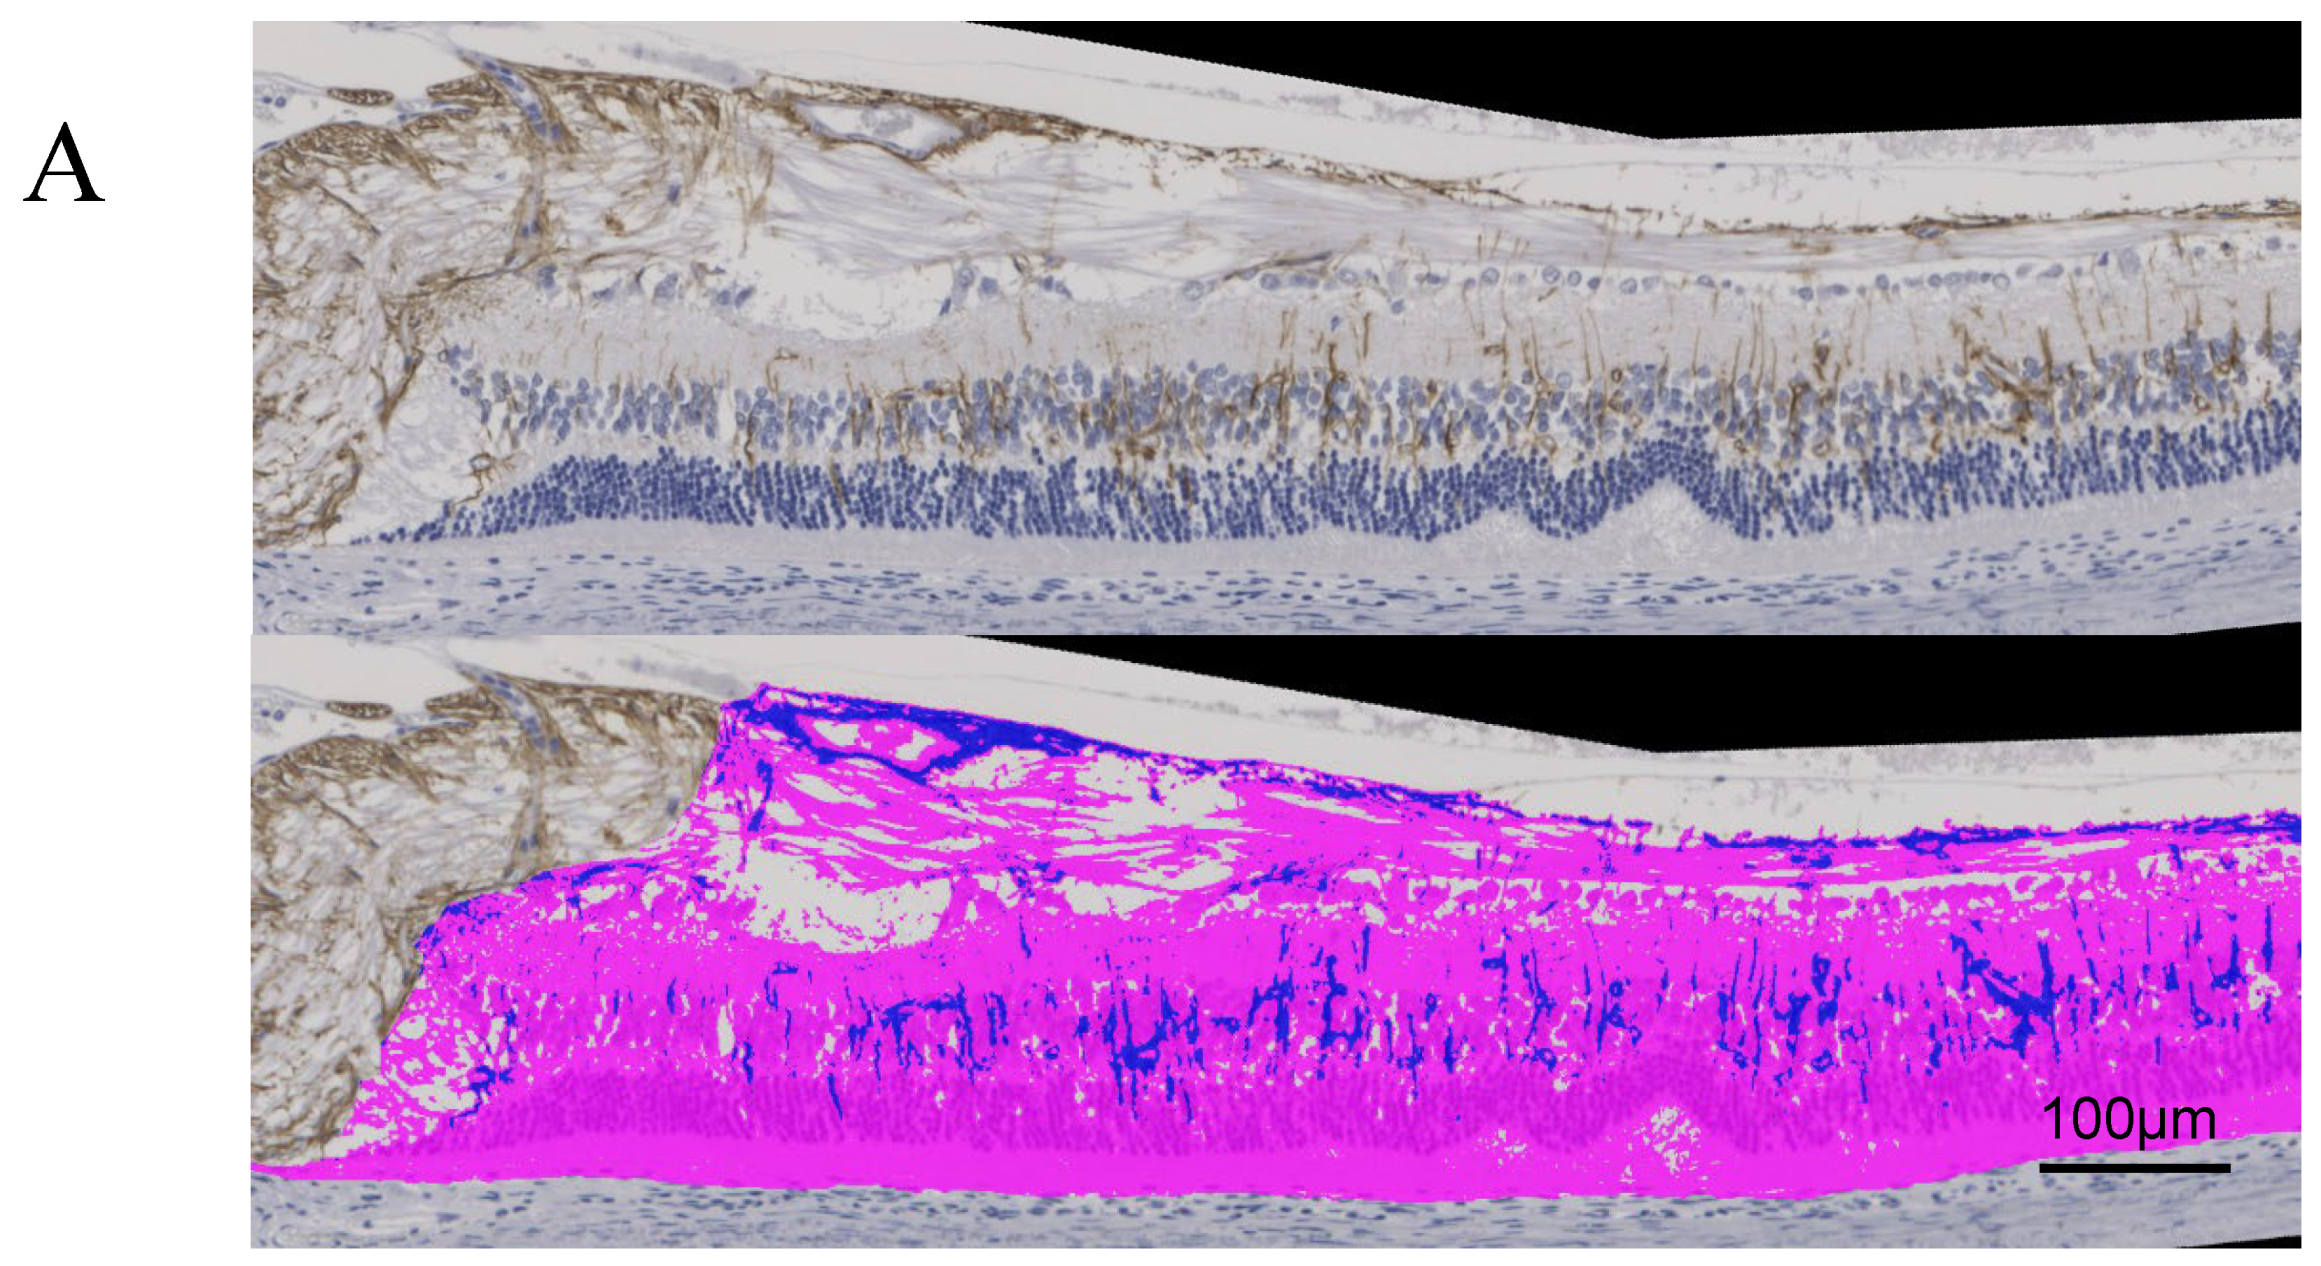
Figure 5.
(A) Quantitative analysis of GFAP-positive areas. The top is the original image, the bottom is the processed image. Positive areas were quantitatively analyzed and area ratios were calculated using Hybrid Cell Count Module/BZ-H3C software (Keyence, Chicago, IL, USA) within 1,500 μm from the optic disc. Blue indicates positive areas; magenta indicates negative areas. (B) Comparison of the areas positive for GFAP in treated and untreated SDT fatty rats. R, right; L, left; PC, photocoagulation.
Disclaimer/Publisher’s Note: The statements, opinions and data contained in all publications are solely those of the individual author(s) and contributor(s) and not of MDPI and/or the editor(s). MDPI and/or the editor(s) disclaim responsibility for any injury to people or property resulting from any ideas, methods, instructions or products referred to in the content. |
© 2024 by the authors. Licensee MDPI, Basel, Switzerland. This article is an open access article distributed under the terms and conditions of the Creative Commons Attribution (CC BY) license (http://creativecommons.org/licenses/by/4.0/).
Copyright: This open access article is published under a Creative Commons CC BY 4.0 license, which permit the free download, distribution, and reuse, provided that the author and preprint are cited in any reuse.


